Embed Size (px)
Citation preview

Social development and sub-national growth in developing countries
Eelke de Jong Jeroen Smits

Setup
Introduction
Previous studies on social development and growth
Hypotheses
Dataset. Countries . Districts
Results

Determinants of economic growth
• Many cross-country studies • Dependent variable: change in income per capita • Explanatory variables - Conditions at the beginning of the time period - Initial income per capita (convergence) -Economic and social indicators
- Developments over the period of some variables - Sample periods are 2 -3 decades
• Hardly any study focusing on economic growth at sub-national level: Lack of data

Social capital and economic growth
Trust high-trust lowers transaction costs . written contracts are less needed . government officials are more credible
Cohesion and lack of conflicts facilitate growth. reverse causality

Social capital: groups
• Groups can invoke cooperation and solidarity, so that collective action problems can be solved easily, however they can also facilitate rent seeking
• Bridging social capital / Putnam-esque groups- Enhance economic growth
• Bonding social capital / Olsonian groups - Hamper economic growth (rent seeking)

Some previous studies
• Putnam (1993) Italian regions
• Knack and Keefer (1997) - 29 countries World Values Survey for trust and civic
cooperation
• Beugelsdijk (2006) - Trust reflects the quality of institutions- Knack and Keefer’s result is driven by a too
heterogenous dataset- The effect of trust on growth is only significant for low
trust societies, which are often relatively poor countries.

Hypotheses Indices of Social Development
Our sample contains developing countries only
We expect a positive relation between development and
. trust
. intergroup cohesion
The relation between development and Clubs and associations is ambigious
bridging social capital (+)bonding social capital (-)

Data description
• Data are from the Database Developing World, a huge household-level database with data from household surveys on 20 million persons in 100+ developing countries
• A district database is created by aggregating data from the household level to the “district” level
• Data are included for 377 districts in 30 developing countries• For each district, data for two points in time are used to create a
district panel. Time points are on average 5-6 years apart. • Countries included are Armenia, Bangladesh, Bolivia, Ivory Coast,
Cambodia, Cameroon, Colombia, Dom. Republic, Egypt, Eritrea, Ethiopia, Ghana, Guinea, Guatemala, Haiti, Kenya, Madagascar, Malawi, Mali, Mozambique, Namibia, Niger, Nigeria, Rwanda, Senegal, Tanzania, Chad, Uganda, Zambia, Zimbabwe

Analyses
• Data are analyzed using two-level multilevel analysis• Levels included are district and national• The dependent variable is the change in district level of
development between T1 and T2• Major independent variables are three Indices of Social
Development: intergroup cohesion, interpersonal safety and trust, and clubs and associations, measured at T1
• Both direct effects of the indices and interaction effects among the indices and between the indices and control factors are tested (to gain insight into the context dependency of the effect)

Variables • Dependent variable is change in level of development at
district level, indicated by a wealth index based on household assets.
• Assets included are TV, fridge, car, electricity, running water, flush toilet.
• Wealth index is standardized across districts and years• The indices of social development are derived from ISD.• Indices are taken from an ISD year preceding T1 by no more
than three years or succeeding T1 by no more than one year.• If indices were lacking from that ISD year, indices from
another ISD year as close as possible to T1 were taken.

Control factors • Average years of education of adults (25-55) in district at T1
and change therein between T1 and T2.• Average occupational level in district and change therein
between T1 and T2.• Dependency ratio: Number of individuals aged 15-64 in
district divided by number of individuals under 15 and over 64 and change therein between T1 and T2.
• Average household size in district and change therein between T1 and T2.
• Urbanization of district (urban=1)
• Convergence is addressed by including wealth at T1

Table 1. Coefficients of multilevel regression model of economic growth at district level in 26 developing countries (baseline model without Indices of Social Development) Parameter Estimate Std. Error Sig. Intercept -0.801 0.104 0.000 District wealth T1 -0.199 0.027 0.000 District years of education T1 0.008 0.004 0.067 Change in years of education (T2-T1) 0.071 0.009 0.000 District occupational level T1 0.062 0.039 0.111 Change district occupational level T2-T1 0.328 0.040 0.000 Dependency ratio (active/non-active) T1 0.407 0.063 0.000 Change in dependency ratio (T2-T1) 0.383 0.080 0.000 Household size T1 0.026 0.006 0.000 Change in household size (T2-T1) 0.007 0.011 0.527 Urban area 0.048 0.025 0.058

Table 2. Separate and combined coefficients of Indices of Social Development added to baseline multilevel regression model of economic growth at district level Separate coefficients Estimate Std. Error Sig cohesion 0.387 0.082 0.000 trust 0.311 0.101 0.002 clubs -0.327 0.061 0.000
Combined coefficients Estimate Std. Error Sig cohesion 0.195 0.138 0.160 trust 0.743 0.183 0.000
clubs -0.215 0.159 0.189 trust 0.923 0.199 0.000
cohesion 0.329 0.138 0.018 clubs -0.253 0.151 0.108
cohesion 0.203 0.141 0.153 trust 0.840 0.203 0.000 clubs -0.232 0.156 0.148

Table 3. Combinations of Indices of Social Development plus interactions added to baseline multilevel regression model of economic growth at district level
Estimate Std. Error Sig
Cohesion 0.218 0.135 0.108 Trust 0.588 0.187 0.003 Cohesion*trust -0.025 0.012 0.037
Clubs -0.374 0.167 0.034 Trust 0.634 0.229 0.009 Clubs*trust -0.052 0.023 0.035
Cohesion 0.258 0.157 0.102 Clubs -0.187 0.165 0.268 Cohesion*clubs -0.023 0.019 0.233

Interactions with control factors (role of context)
• Positive effect of cohesion is stronger under more favorable circumstances (in areas that are more developed, urban, have higher levels of education and occupation and more favorable dependency ratios)
• Negative effect of clubs is stronger under more favorable circumstances (except interaction with dependency ratio, which is not significant)
• No significant interactions with trust: Effect of trust is significantly positive under all circumstances
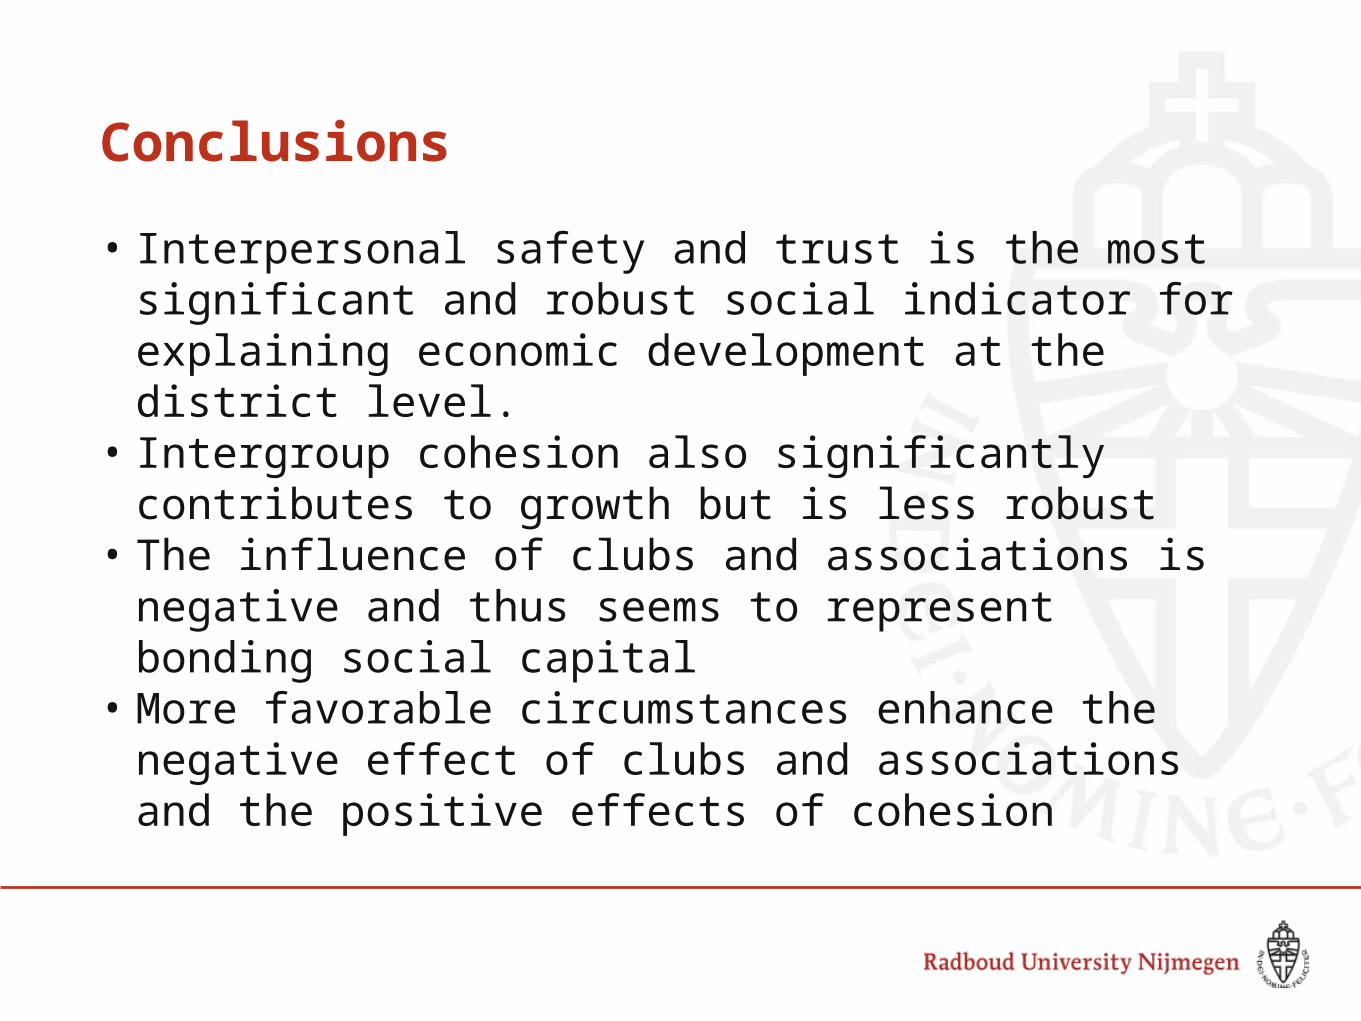
Conclusions
• Interpersonal safety and trust is the most significant and robust social indicator for explaining economic development at the district level.
• Intergroup cohesion also significantly contributes to growth but is less robust
• The influence of clubs and associations is negative and thus seems to represent bonding social capital
• More favorable circumstances enhance the negative effect of clubs and associations and the positive effects of cohesion