Embed Size (px)
DESCRIPTION
A statistical framework for measuring sustainable development - Relevance for SDGs and post-2015 design?. Rutger Hoekstra & Jan Pieter Smits Statistics Netherlands Chairs UNECE/Eurostat/OECD Task force for Measuring Sustainable Development. Introduction. - PowerPoint PPT Presentation
Citation preview
Rutger Hoekstra & Jan Pieter SmitsStatistics NetherlandsChairs UNECE/Eurostat/OECD Task force for Measuring Sustainable Development
A statistical framework for measuring sustainable development -
Relevance for SDGs and post-2015 design?
Introduction
– A statistical framework for measuring sustainable development….
– ….relevance for the SDGs/post-2015 design?
2
TFSD/CES Recommendations
– Joint UNECE/Eurostat/OECD work‐ 2005-2009 - Working Group for Statistics for Sustainable Development
(WGSSD)‐ 2009-2013 - Task Force for Measuring Sustainable Development (TFSD)
– TFSD membership‐ UNECE, Eurostat, OECD, Canada, France, Germany, Netherlands, New
Zealand, Norway, Switzerland, United Kingdom, United States, World Bank and European Commission
– Two consultations of countries/institutes– Endorsement Conference of European Statisticians (June 2013)
‐ 62 countries (56 UNECE countries and 6 OECD)‐ CES recommendations on measuring sustainable development
3
TFSD/CES Recommendations– Implementation
– Published in Spring 2014– Countries using the framework/pilot testing
‐ Australia, Italy, Kazakhstan, Mexico, Netherlands, Russia, Slovenia, Turkey and Ukraine
– Institutes using the framework‐ OECD (How’s Life? publication - Chapter on sustainability)‐ Friends of the Chair (FOC) on broader measures
4
TFSD/CES Recommendations – Main outcomes
‐ Statistical framework (“Here and now” vs. “Later” vs. “Elsewhere”) • Basis: Brundtland and Stiglitz-Sen-Fittoussi report• Includes insights from initiatives of United Nations, Eurostat /European
Commission, OECD, World bank, National measurement systems and latest academic work
‐ Policy relevant• 20 SD themes (Subjective well-being, Consumption and income,
Nutrition, Health, Labour, Education, Housing, Leisure, Physical safety, Land and ecosystems, Water, Air quality, Climate, Energy resources, Mineral resources, Trust, Institutions, Physical capital, Knowledge capital, Financial capital)
‐ Flexibility• Three indicator sets (90, 60 and 24 indicators) to cater to various
perspectives• Country differences in indicators• Linkable to company level frameworks -Global Reporting Initiative (GRI)
5
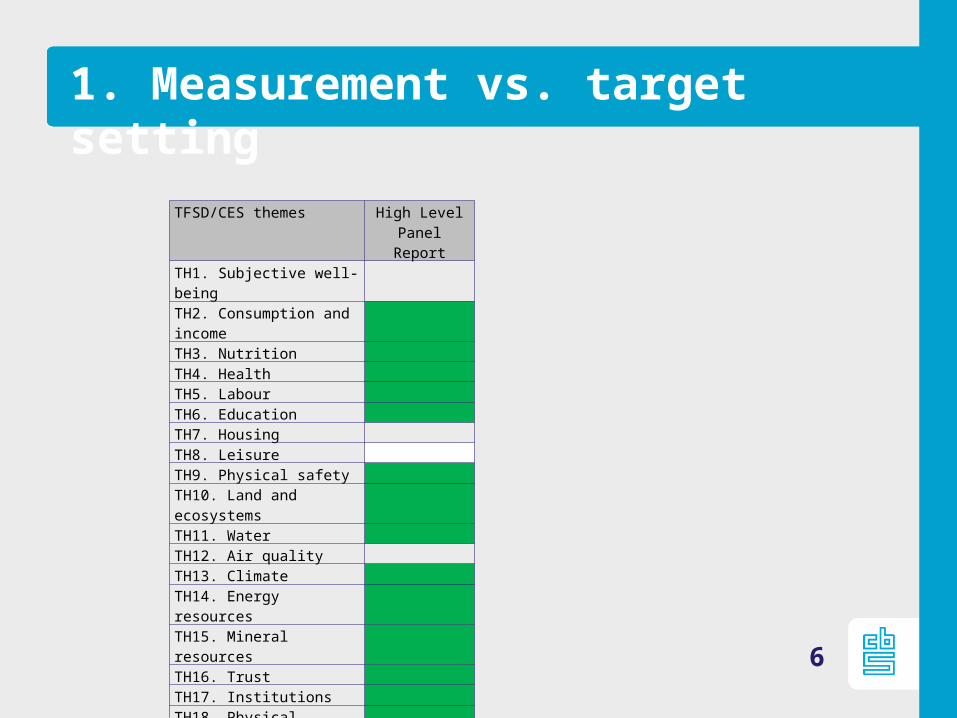
1. Measurement vs. target setting
6
TFSD/CES themes High Level Panel Report
TH1. Subjective well-being
TH2. Consumption and income TH3. Nutrition TH4. Health TH5. Labour TH6. Education TH7. Housing
TH8. Leisure TH9. Physical safety TH10. Land and ecosystems TH11. Water TH12. Air quality
TH13. Climate TH14. Energy resources TH15. Mineral resources TH16. Trust TH17. Institutions TH18. Physical capital TH19. Knowledge capital TH20. Financial capital
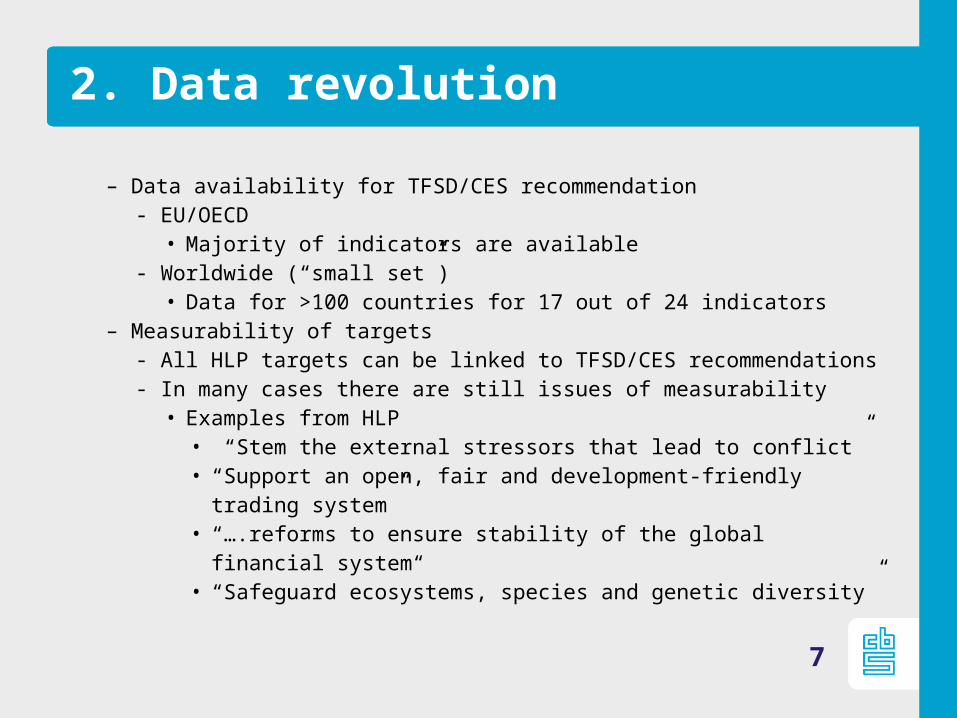
2. Data revolution
– Data availability for TFSD/CES recommendation‐ EU/OECD• Majority of indicators are available
‐ Worldwide (“small set”)• Data for >100 countries for 17 out of 24 indicators
– Measurability of targets‐ All HLP targets can be linked to TFSD/CES recommendations‐ In many cases there are still issues of measurability • Examples from HLP• “Stem the external stressors that lead to conflict”• “Support an open, fair and development-friendly trading
system”• “….reforms to ensure stability of the global financial
system“• “Safeguard ecosystems, species and genetic diversity”
7
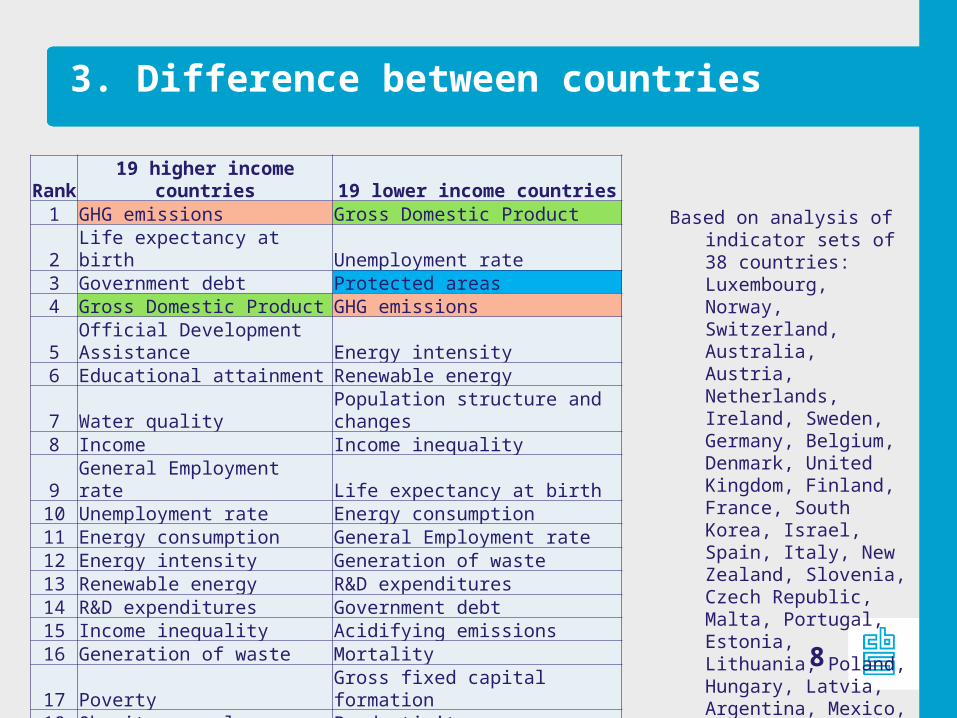
3. Difference between countries
8
Rank
19 higher income countries 19 lower income countries
1 GHG emissions Gross Domestic Product2 Life expectancy at birth Unemployment rate3 Government debt Protected areas 4 Gross Domestic Product GHG emissions
5Official Development Assistance Energy intensity
6 Educational attainment Renewable energy
7 Water quality Population structure and changes
8 Income Income inequality 9 General Employment rate Life expectancy at birth
10 Unemployment rate Energy consumption11 Energy consumption General Employment rate12 Energy intensity Generation of waste13 Renewable energy R&D expenditures14 R&D expenditures Government debt15 Income inequality Acidifying emissions16 Generation of waste Mortality17 Poverty Gross fixed capital formation18 Obesity prevalence Productivity19 Protected areas Water abstraction
20Gross fixed capital formation Drinking water
Based on analysis of indicator sets of 38 countries: Luxembourg, Norway, Switzerland, Australia, Austria, Netherlands, Ireland, Sweden, Germany, Belgium, Denmark, United Kingdom, Finland, France, South Korea, Israel, Spain, Italy, New Zealand, Slovenia, Czech Republic, Malta, Portugal, Estonia, Lithuania, Poland, Hungary, Latvia, Argentina, Mexico, Turkey, Bulgaria, Kazakhstan, Romania, Brazil, Montenegro, South Africa, Serbia, Vietnam and Morocco
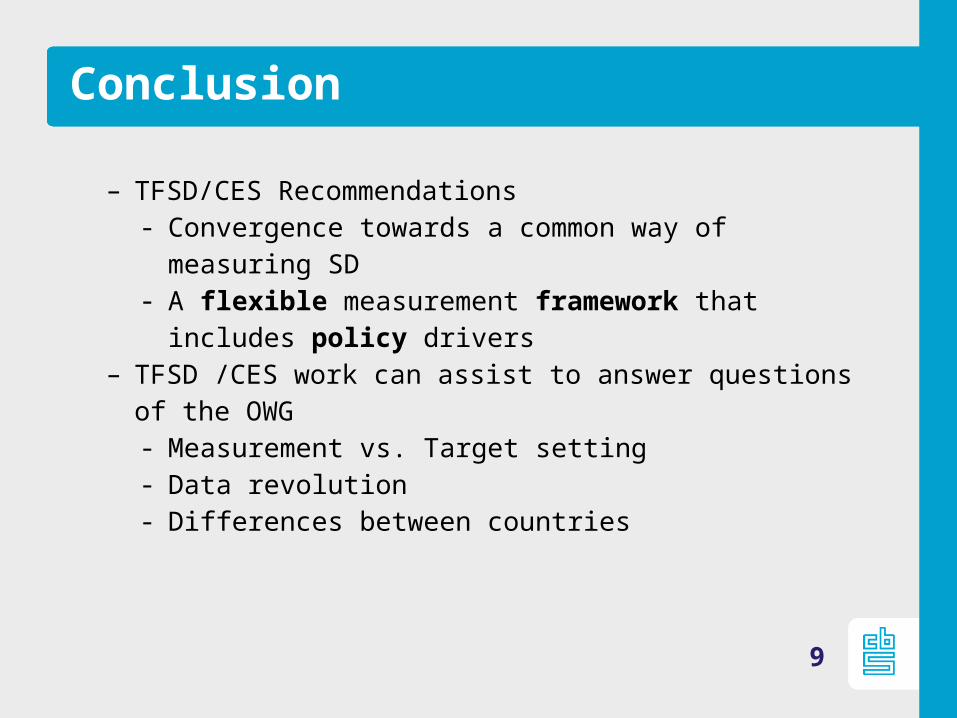
Conclusion
– TFSD/CES Recommendations‐ Convergence towards a common way of measuring
SD‐ A flexible measurement framework that includes
policy drivers– TFSD /CES work can assist to answer questions of the
OWG‐ Measurement vs. Target setting ‐ Data revolution‐ Differences between countries
9