Embed Size (px)
Citation preview

SOCIAL DETERMINANTS OF ORAL AND GENERAL HEALTH
Wael Sabbah, BDS, DDPH, MSc, PhD
Oregon Health & Science University, School of Dentistry
UCSF, School of Dentistry, San Francisco, April 2012

Outlines
• Oral health and general health: the common risk factors.
• The social determinants: evidence and characteristics (social gradient).
• Pathways for health inequalities: can we explain the social gradient?
• Can behavioral factors account for inequalities?
• The role of psychosocial factors?
• Contribution of health services
• Strategies and policies to address health inequalities.
2

Public health is a social issue.
“Interventions aimed at reducing disease and saving lives succeed only when they take the social determinants of health adequately into account.” (Lancet, 2005)
Dr Lee Jong-Wook(Director General, WHO)
3

“…oral health and general health should not be interpreted as separate entities”Surgeon General’s Report on Oral Health of America, 2000
4

• Direct links between oral health and general health:
1. Specific systemic conditions affect oral health
2. Oral conditions affect general health (inflammatory, nutritional pathways).
Or co-morbidity
5

• General susceptibility: Linked to the commonality of the social determinants.
• There are common, rather than specific, risk factors that affect a wide range of chronic conditions, including oral health.
6

Common Risk Factor
DietObesity
Diabetes
Cancers
Cardiovascular diseases
Dental caries
Periodontal diseases
Skin diseases
Tobacco
Alcohol
Hygiene
Sheiham and Watt 20007

The Determinants of the Common Risk Factors
• ‘Smoking, obesity and heavy drinking are causes of ill-health, but what are the causes of these behaviors?’ WHO CSDH,
Fair Society, Healthy Lives, Marmot (2010). • Choices pertaining to health-related
behaviors are situated within economic, historical, family, cultural and political contexts.
8

The Determinants of the Common Risk Factors
• Individual behaviors such as smoking, diet, alcohol, physical activities, general and oral hygiene, attendance for medical and dental screening and care are largely influenced by the social environments and conditions in which people live and their status.
9

The causes of the causes
Socio-environmental conditions
Economics
Employment
Status
Sex
Tobacco
Diet
Alcohol
Hygiene
Stress
Chronic diseases
Distal riskfactors
Distal riskfactors
Proximal modifiablerisk factors
Proximal modifiablerisk factors OutcomeOutcome
Geoffrey Rose
10

The Determinants of the Common Risk Factors
• Proximal risk factors explain a relatively small portion of the variance in socioeconomic differences in health, thus highlighting the importance of psychosocial, economic, political and environmental factors to health and disease. These factors are known as the social determinants of health.
11

Obesity
Cancers
Heart disease
Respiratory disease
Dental caries
Periodontal diseases
Trauma
Diet
Stress
Control
Hygiene
Risk Factors Diseases Risk Factors
Tobacco
Alcohol
Exercise
Injuries
Common Risk Factor Approach: Including Societal Risk
School
Policy
Workplace
Housing
Political environment
Physicalenvironment
Socialenvironment12

Socioeconomic inequalities in health
Rates of morbidity and mortality are successively lower at successively higher rungs on the social ladder. Those in the higher ranks are healthier than those immediately below them.
This phenomenon is also known as the social gradients.
Marmot , Wilkinson , 2006.
13

Life expectancy by social class
72
74
76
78
80
82
84
Social Class I Social Class II Social Class IIIN Social Class IIIM Social Class IV Social Class V
Lif
e ex
pec
tan
cy
Life expectancy by social class, England and Wales 1992-1996 (Marmot 2003)14

Self-rated health among USA adolescents
Starfield et al 2002 15

16

Life expectancy by neighbourhood income in urban Canada, 1971-2001
Statistics Canada17
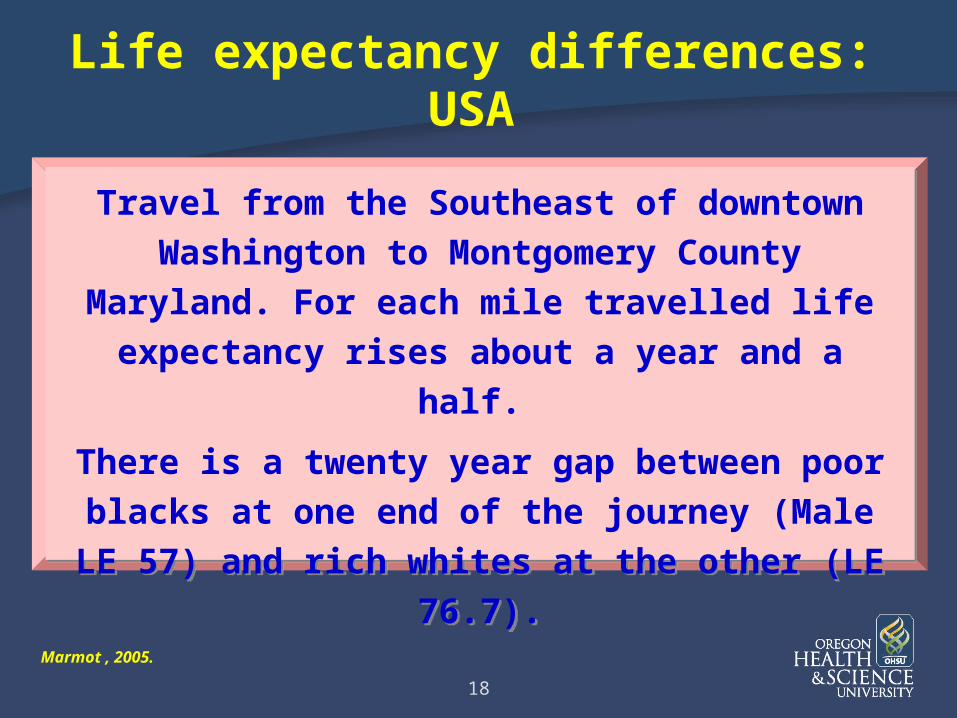
Life expectancy differences: USA
Travel from the Southeast of downtown
Washington to Montgomery County Maryland. For
each mile travelled life expectancy rises about a
year and a half.
There is a twenty year gap between poor blacks at
one end of the journey (Male LE 57) and rich whites
at the other (LE 76.7).
Travel from the Southeast of downtown
Washington to Montgomery County Maryland. For
each mile travelled life expectancy rises about a
year and a half.
There is a twenty year gap between poor blacks at
one end of the journey (Male LE 57) and rich whites
at the other (LE 76.7).
Marmot , 2005.
18

Life expectancy differences in London
Westminster
Waterloo
Southwark
London Bridge
BermondseyCanada
Water
CanaryWharf
NorthGreenwich
Canning Town
London Underground Jubilee Line
8 stations between Westminster and Canning Town on the Jubilee Line: nearly1 year of shorter lifespan per station (as one travels east)
River Thames
Male life expectancy69.0 (67.3-70.8)
Female life expectancy76.9 (75.3-78.5)
Male life expectancy76.2 (74.3-78.2)
Female life expectancy82.9 (80.5-85.3)
19

Oral health inequalities
Significant social class differences – Caries– Periodontal diseases– Oral cancers– Self reported oral health
status
Individual, area and population level
Certain ethnic minority groups and socially excluded groups
Close link with general health
Watt and Sheiham (1999)
20

Education gradients in perceived oral/general health, periodontal disease, and ischemic heart disease.
0
0.5
1
1.5
2
2.5
3
3.5
4
Perceived oralhealth
Perceivedgeneral health
Periodontitis Ischemic heartdisease
Od
ds
Rat
io Education>12 year
Education=12 years
Education<12years
Sabbah et al 2007 21

Social gradients in oral health
22

Social Gradients in Oral Health Many studies have shown a social gradient
in oral health Almost all have been carried out on adults1-
9
Only a couple on adolescents10-11
They have mostly used 1 or 2 socioeconomic position markers (not always the same)
1. Drury TF, Garcia I, Adesanya M (1999). Ann N Y Acad Sci; 896:322-324.2. Sanders AE, Slade GD, Turrell G, John SA, Marcenes W (2006). Community Dent Oral Epidemiol; 34: 310-319.3. Do LG, Roberts-Thomson KF (2007). Aust Dent J;52:249-251. 4. Morita I, Nakagaki H, Yoshii S et al. (2007) . Eur J Oral Sci; 115: 275-279.5. Sabbah W, Tsakos G, Chandola T, Sheiham A, Watt RG (2007). J Dent Res; 86: 992-996.6. Holst D (2008). Community Dent Oral Epidemiol; 36: 326-334.7. Sanders AE, Slade GD, John MT et al. (2009). J Epidemiol Community Health; 63: 569-574. 8. Tsakos G, Sheiham A, Iliffe S et al. (2009). Eur J Oral Sci; 117: 286-292.9. Finlayson TL, Williams DR, Siefert K, Jackson JS, Nowjack-Raymer R (2010). Am J Public Health; 100 (Suppl.1):S246-
S255.10. Thomson WM, Poulton R, Milne BJ, Caspi A, Broughton JR, Ayers KM (2004). Community Dent Oral Epidemiol; 32:345-
353.11. Lopez R, Fernandez O, Baelum V (2006). Community Dent Oral Epidemiol; 34: 184-196.
23
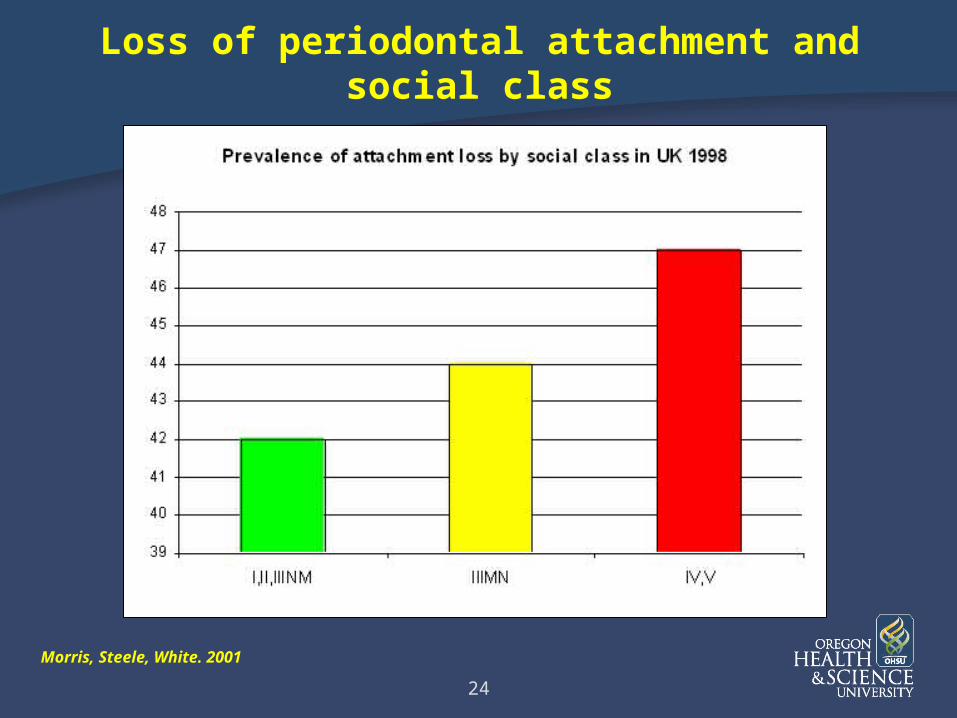
Morris, Steele, White. 2001
Loss of periodontal attachment and social class
24

Prevalence of oral morbidity according to relative social status and absolute material resource
Sanders et al. 200625

26

Income inequality and periodontal disease
Sabbah et al 2010 27

Social determinants of health
• What are the pathways?
28
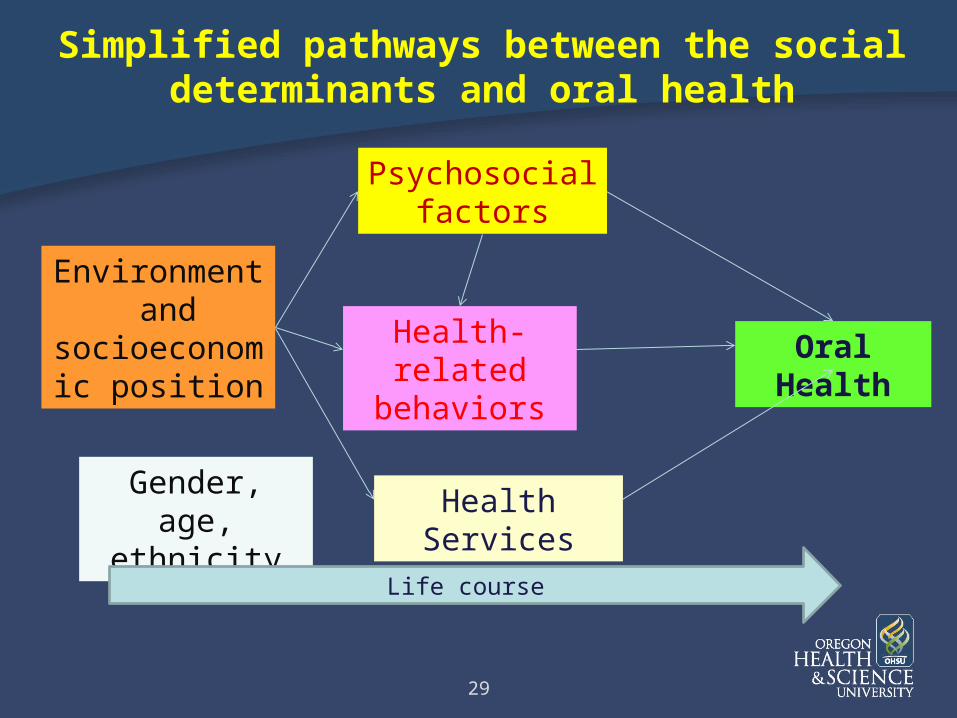
Environment and
socioeconomic position
Psychosocial factors
Health-related behaviors
Oral Health
Simplified pathways between the social determinants and oral health
Gender, age, ethnicity
Health Services
Life course
29
The role of health-related behaviors
Health behaviors are social grade specific.“Poor people behave poorly”
30

People who are in the lower social grades are more likely to engage in a wide range of risk related behaviors and less likely to be involved in health promoting ones.
Health behaviors are socially patterned
Lynch, Kaplan, Salonen Why do poor people behave poorly? Variation in adult health behaviours and psychosocial characteristics by stages of the socio-economic life course. Soc Sci Med 1997; 44: 809-819.
31
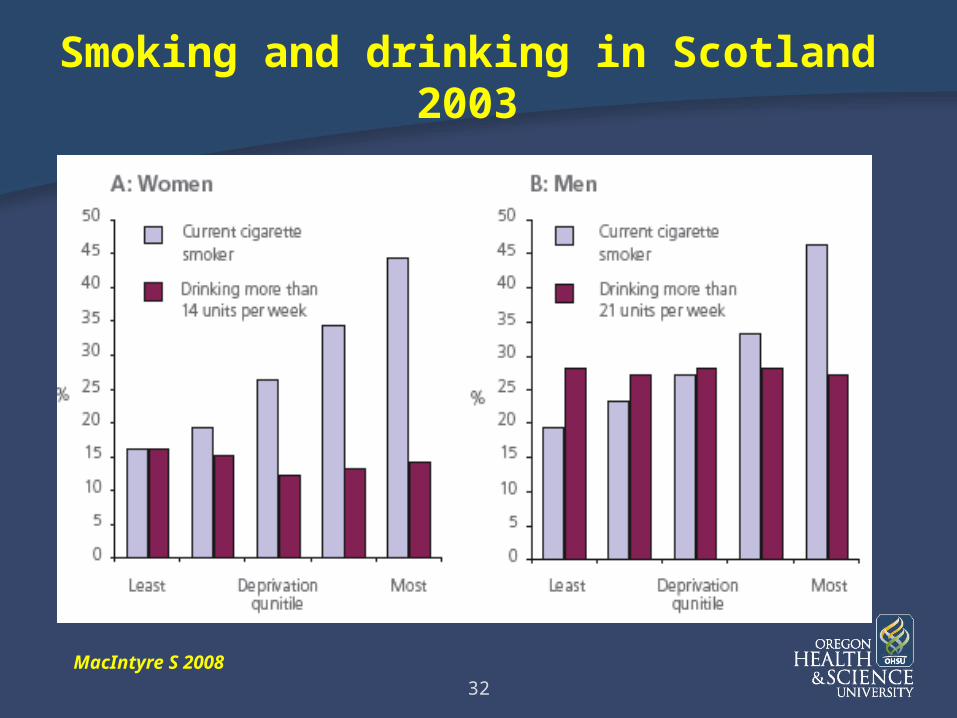
Smoking and drinking in Scotland 2003
MacIntyre S 2008
32

Health behaviors by education
The Norwegian Institute of Public Health33

Health Survey for England, 2001
Behavioral factors: diet
34

Probabilities of engaging in a cluster of health compromising behaviors
highest middle lowest highest 2nd highest 2nd lowest lowestEducation Income
0.9
0.95
1
1.05
1.1
1.15
1.2
1.25
1.3
1.35
1.4
Unpublished data (NHANES)35

0
0.5
1
1.5
2
2.5
Education = 12 yrs Education < 12 yrs
Od
ds rati
o fo
r p
erc
eiv
ed
po
or o
ral h
ealt
h
adjusted for confounders
adjusted also for behaviours
Do health behaviors “explain” health inequalities?
Sabbah, Tsakos, Sheiham, Watt (2009). Soc Sci Med; 68(2): 298-303.
US adults (NHANES III)
36

0
0.5
1
1.5
2
2.5
Education = 12 yrs Education <12 yrs
Co
un
t ra
tio
of to
oth
su
rface
loss
adjusted for confounders
adjusted also for behaviours
Sabbah, Tsakos, Sheiham, Watt (2009). Soc Sci Med; 68(2): 298-303.
US adults (NHANES III)
Do health behaviors “explain” health inequalities?
37

Evaluating the role of dental behavior in oral health inequalities
“To reduce social inequalities in adult oral health, efforts need to be directed to factors other than the dental behaviors of individuals…. Rather than focusing on individuals alone, the approach needs to achieve a better balance of targeting both individual level factors and also the social environments in which health behaviors of individuals are developed and sustained.”
Sanders, Spencer & Slade (2006)
38

Stress and the health
• Stress induced by SEP, work and living environment affects health.
• Stress affects health indirectly via health-related behaviors,
or directly through biological changes:When the external and internal stress challenges are chronic and frequently beyond the normal ranges of adaptive responses, “wear and tear” on regulatory systems occurs and allostatic load accumulates. (McEwen, 1998)
39
Stress and the health
Stressful situation which affect general health (cardiovascular disease) and oral health (periodontal disease):
Work related mental demand,
lack of control at work and/or at home,
unemployment,
negative life events,
low levels of marital quality(Marmot and Wilkinson, 2006; Seeman et al 2001; Sheiham and Nicolau, 2005).
40
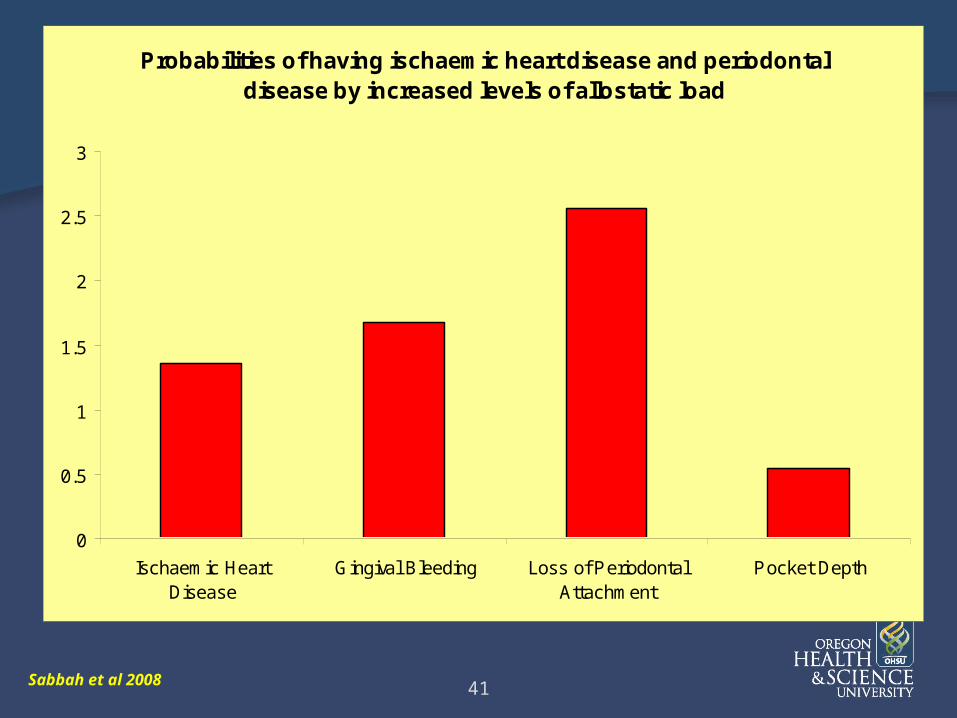
Probabilities of having ischaemic heart disease and periodontal disease by increased levels of allostatic load
0
0.5
1
1.5
2
2.5
3
Ischaemic HeartDisease
Gingival Bleeding Loss of PeriodontalAttachment
Pocket Depth
Sabbah et al 200841

Change in education gradients in ischaemic heart disease and periodontitis after adjusting for allostasis
0
0.5
1
1.5
2
2.5
education=12years education<12years education=12years education<12years
Ischaemic heart disease Periodontitis
Od
ds
Rat
io
unadjusted for allostasis
adjusted for allostasis
Sabbah et al 200842
Stress and Health-Related Behaviors
• Higher levels of biological markers of stress were associated with higher probabilities of engaging in a number of oral and general health-compromising behaviors after accounting for demographic and socioeconomic factors.
Sabbah 2011, unpublished data
43

0.98
1
1.02
1.04
1.06
1.08
1.1
1.12
1.14
1.16
1.18
1.2
Less f requent exercise Fattening food Fewer f ruits and vegerables
Adjusted odds for poor health-related behaviors for an extra marker of allostatic load
44
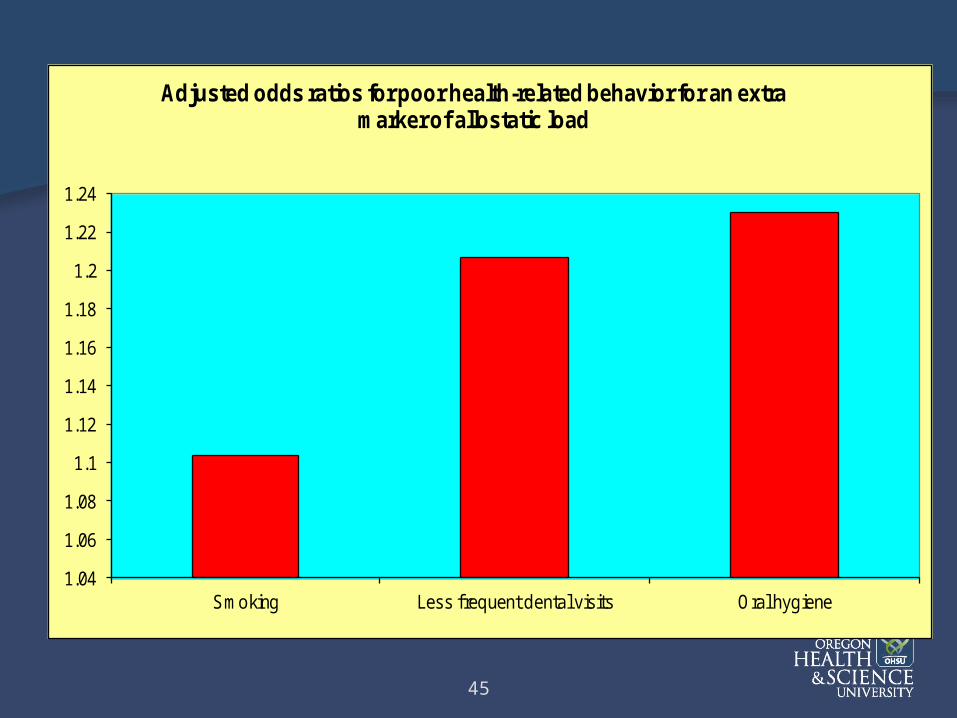
1.04
1.06
1.08
1.1
1.12
1.14
1.16
1.18
1.2
1.22
1.24
Smoking Less f requent dental visits Oral hygiene
Adjusted odds ratios for poor health-related behavior for an extra marker of allostatic load
45

Health Services
Recommendations for Actions for Universal Health Care (WHO Commission on Social Determinants of
Health, 2009).Universal coverage of quality services,
focusing on Primary Health Care.Tax/ insurance-based funding, ensuring
universal coverage regardless of ability to pay
46

47

48

0
5
10
15
20
25
30
35
40
45
Per
cen
t
Population health in England and US (Banks et al 2006)
England
US
49

Universal health coverage and health disparities (USA/ Canada)
Poorest Richest0
5
10
15
20
25
30
35
Self-rated general health (poor/fair) by household income
Canada
US
per
cen
tag
e
Poorest Richest0
5
10
15
20
25
Severe mobility limitation by household income
Canada
US
per
cen
tag
e
50

<1 year 1 to<3years 3years+/ never0
10
20
30
40
50
60
70
Dental Visits Canada and USA
Canada
US
Last dental visit
per
cen
tag
e
All Insured UninsuredCanada US
20
30
40
50
60
70
80
90
Percentage with regular medical doctor
per
cen
tag
e
Use of medical and dental care (USA/ Canada)
51
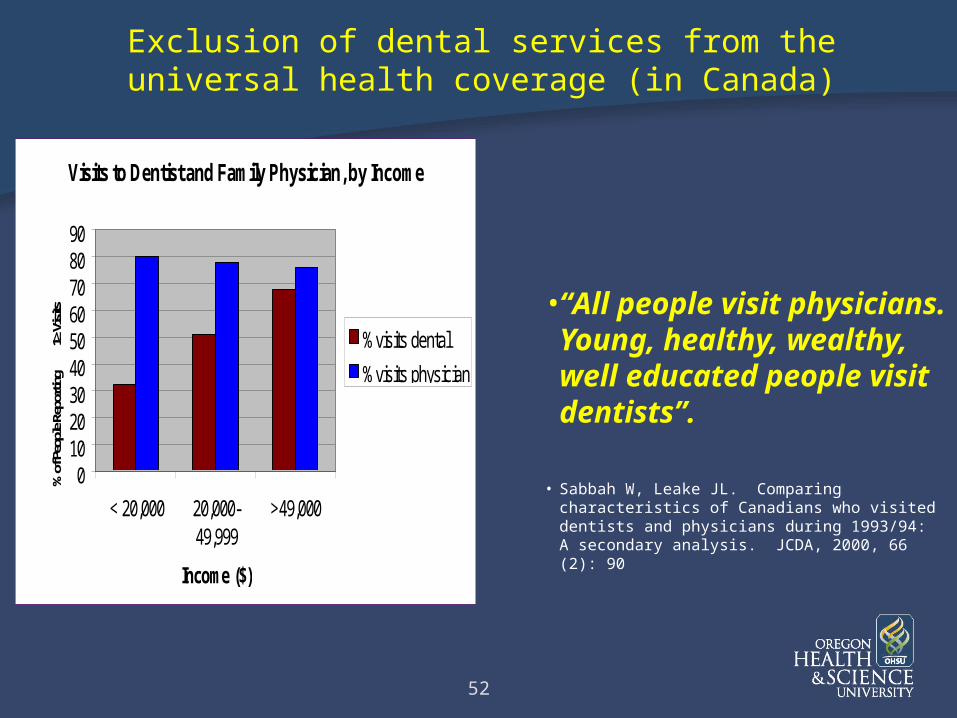
Exclusion of dental services from the universal health coverage (in Canada)
• “All people visit physicians. Young, healthy, wealthy, well educated people visit dentists”.
• Sabbah W, Leake JL. Comparing characteristics of Canadians who visited dentists and physicians during 1993/94: A secondary analysis. JCDA, 2000, 66 (2): 90
Visits to Dentist and Family Physician, by Income
0102030405060708090
< 20,000 20,000-49,999
>49,000
Income ($)
% o
f Peo
ple R
epor
ting
1≥ V
isits
%visits dental
%visits physician
52

Early life course
• Biological, behavioral and social hazards operate across the life course and influence the development of chronic diseases.
• Tracking the progress of general and oral conditions through the life course.
53

Priorities for research
• Social determinants of health.• Commonality of the social and behavioral
risk factors for oral and general health.• Associations between oral and general
health.
54
Priorities for research
• Oral and general health of ethnic minorities and indigenous populations.
• Inequality in the use of health services.• Life course approach to investigate the
progress of risk factors, and tracking of chronic conditions.
55

Fiscal Measures
National &/or local policy initiatives
Legislation/Regulation
Healthy Settings- HPS
Community Development
Training other professional groups
Media Campaigns
School dental health education
Chair side dental health education
Clinical Prevention
‘Upstream’
Healthy Public Policy
‘Downstream’
Health Education & Clinical Prevention
Upstream - downstream interventions
56

Policy implications
• Incorporate research findings on the social determinants in health promotion intervention.
• Research on oral health should be incorporated as appropriate into policies for the integrated prevention and treatment of acute and chronic diseases into health policies.
• We should explore how to combine forces and use our abilities to change environmental, cultural, and individual factors through joint effort.
57