Embed Size (px)
Citation preview

Social Class and Oral Health. A comparison between the 1988 and
1998 Adult Oral Health Surveys
Juan Gonzalez, Jimmy Steele,
Nairn Wilson, Nora Donaldson

Fewer teeth is associated with…
Poor dental attendance. (Sanders et al, 2006)
Low socio-economic group (Sakki et al, 1994)
Increasing age (Todd & Lader, 1991)
BACKGROUND

• Regular Dental Attendance may be a factor contributing to
the socio-economic gradient in oral health:
Regular dental attendance is more prevalent in high socio-economic groups and is associated with better oral health outcomes, after adjustment for socio-economic status (SES).
Barriers (i.e. attitudes and perceptions) Attitudes and perceptions include: anxiety, cost concerns,
value placed on restored teeth, and beliefs regarding the importance of regular dental attendance
Positive attitudes and perceptions (Barriers) about dental attendance are associated with better oral health and tend to be held by high-socio-economic groups.

How these factors inter-relate?
• Establishing the pathways between the various factors would improve the understanding of how…
- demographic factors,
- socio-economic status and - barriers to dental attendance
impact on Regular Dental Attendance and on the number of sound teeth (NST).

In the 1998 UK Adult Dental Health Survey (n=3800)
Using Structural Equation Modeling: (Donaldson et al, JDR, Jan 2008)
Found that the association between social class and the number of sound teeth (NST)
SOCIAL CLASS NST
Is partially explained by pathway:
Barriers REGULAR ATTENDANCE

1998 UK Adult Oral Health Survey

Aim of present study
• In this study we examine the data on N=2210 participants from the 1988 UK Adult
Oral Health Surveys to compare the effect of socio-economic status (SES) on oral health, between the two periods (1988 and 1998).
• Particular attention given to differences in the model structures (pathways) of that relationship.

Distribution of the number of sound teeth by decade of study.
NST ordinal with 3 categories
• 1998: Continuous Mean: 23.4 95% c.i. 23.1 to 23.6
1988 1998
NST N (%) N (%)
fewer than 10 366 (17%) 473 (7%)
between 10 and 19 806 (37%) 474 (17%)
more than 20 1,031 (46%) 2208 (77%)
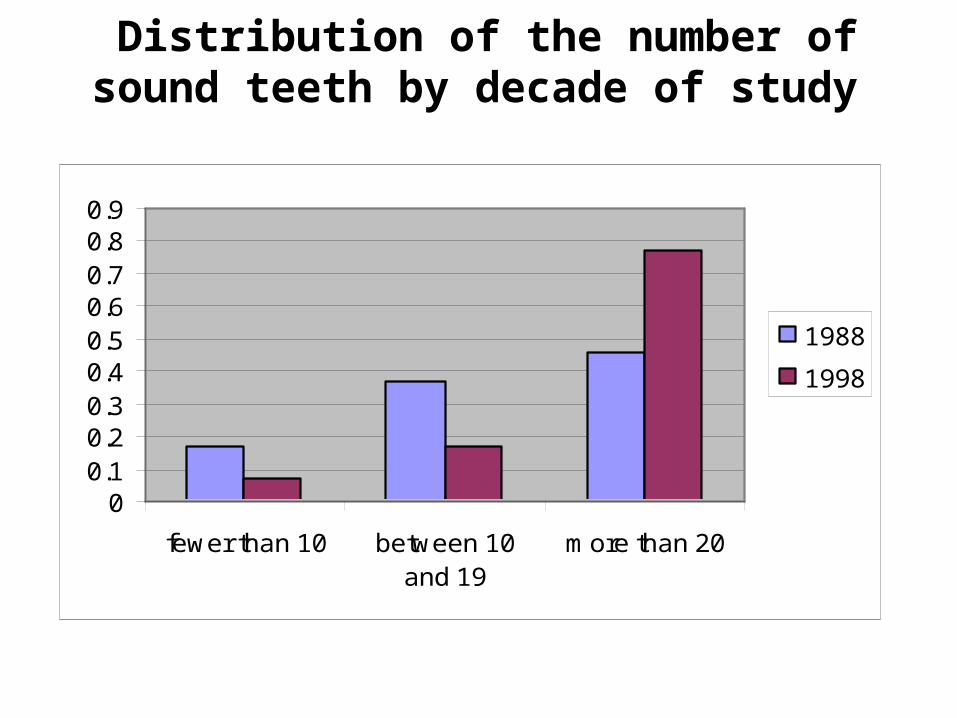
Distribution of the number of sound teeth by decade of study
00.10.20.30.40.50.60.70.80.9
fewer than 10 between 10and 19
more than 20
1988
1998

1988 1998 SexMale
Female
1080 (49%)1128 (51%)
1745 (46%)2072 (54%)
Social class
PoorMedium
High
440 (20%)1157 (54%)557 (26%)
473 (18%)1133 (42%)1089 (40%)
Age under 55
55+
1501 (68%)709 (32%)
2185 (76%)690 (24%)
Distribution of Factors for both surveys

1988 1998
Regularregular
occasionalWhen in trouble
965 (44%)255 (12%)959 (44%)
2400 (63%)408 (11%)
1003 (26%)
Importanceregular
occasionalTrouble
649 (17%)588 (16%)
2483 (67%)

1988 1998
Anxietyfeel like that
to some extentdon't feel like that
737 (34%)491 (23%)936 (43%)
865 (23%)936 (25%)
1949 (52%)
Fancyfeel like that
to some extentdon't feel like that
622 (29%)471 (22%)
1,043 (49%)
878 (27%)865 (27%)
1507 (46%)
Costfeel like that
to some extentdon't feel like that
360 (17%)406 (19%)
1,340 (64%)
1092 (35%)923 (30%)
1090 (35%)

Multiple Ordinal Regression for NST (1988)
OR 95% CI P –valueLower Upper
Social ClassMedium: Poor High: Poor
1.163.06
0.832.02
1.614.65
0.00010.40
0.0001
SexFemale: Male 0.83 0.63 1.09 0.18
Age55 over: Under 55 0.16 0.12 0.22 0.0001
RegularOccasional: RegularSeldom: Regular
0.670.35
0.430.26
1.060.47
0.00010.09
0.0001
AnxietyNot anxious: anxious 1.57 1.18 2.09 0.002

Structural Equation Modelling (SEM)
• Pathways between the various predictors are explored.
• Variables are analysed simultaneously in the sequence of their operating order, allowing the predictors to have both direct and indirect influences on the outcome.
• SEM allows latent variables to be modelled, which reduces the likelihood of regression dilution (Der, 2001; Garson, 2004).

Structural equation model (1988)

Common Features 1988/1998
• There is a significant direct pathway from Social Class to NST.
• There is a significant direct pathway from Regularity to NST.
• No direct pathway from Barriers to Social Class: Barriers mediates the effect of Social Class on NST.

The End
Thanks