Embed Size (px)
Citation preview

Social Capital Assessment +
Learning for Equity (SCALE) Measures
TECHNICAL
MANUAL

1 | S e a r c h I n s t i t u t e
Contents
Contents ........................................................................................................................................................................................ 1
Social Capital Assessment and Learning for Equity Project ................................................................................................ 3
Measure Development Process ................................................................................................................................................ 3
Literature Review ..................................................................................................................................................................... 3
Qualitative Data Collection .................................................................................................................................................. 4
Cognitive Interviews & Expert Reviews ................................................................................................................................ 4
Measure Administration .......................................................................................................................................................... 4
Sample Description ..................................................................................................................................................................... 5
Measures........................................................................................................................................................................................ 6
Response Scale ........................................................................................................................................................................ 6
Statistical Approach ................................................................................................................................................................ 6
Interpretation of Psychometric Properties of Measures ....................................................................................................... 7
Domain 1. Social Capital............................................................................................................................................................ 0
Social Capital ........................................................................................................................................................................... 0
Network Strength & Network Diversity ................................................................................................................................. 0
Domain 2. Mindsets and Skills for Social Capital Development ......................................................................................... 2
Catalysts to Mobilize Relationships and Resources ........................................................................................................... 2
Self-Initiated Social Capital .................................................................................................................................................... 3
Relationship-Building Skills ....................................................................................................................................................... 3
Networking Skills ....................................................................................................................................................................... 4
Personal Identity ....................................................................................................................................................................... 4
Racial and Ethnic Identity ...................................................................................................................................................... 5
Sense of Purpose ...................................................................................................................................................................... 5
Self-Efficacy in Reaching Life Goals ..................................................................................................................................... 6
Domain 3. Support for Social Capital Development ............................................................................................................ 7
Program Support for Social Capital Development ........................................................................................................... 7
Sense of Program Community .............................................................................................................................................. 8
Psychological Safety ............................................................................................................................................................... 9
Volunteer Support.................................................................................................................................................................. 10
Seeking Volunteer Support .................................................................................................................................................. 11
Sense of School/College Campus Community ............................................................................................................... 12
Seeking Professor/Teacher Support ................................................................................................................................... 13

2 | S e a r c h I n s t i t u t e
Domain 4. Program Outcomes ............................................................................................................................................... 14
Progress Towards Education or Career Goals .................................................................................................................. 14
Commitment to Paying-it-Forward ..................................................................................................................................... 15
Collective Efficacy to Change Systems ............................................................................................................................ 15
Occupational Identity .......................................................................................................................................................... 16
Job-Seeking Skills .................................................................................................................................................................... 17
Appendix A. The Developmental Relationships Framework ............................................................................................. 18
References .................................................................................................................................................................................. 19
3 | S e a r c h I n s t i t u t e
Social Capital Assessment and Learning for Equity Project The Social Capital Assessment and Learning for Equity Project (SCALE) - funded by the Bill & Melinda Gates
Foundation - was launched in January 2020 with the purpose of understanding how social capital and strong
peer-to-peer relationships help youth and young adults secure education and/or employment opportunities.
Social capital can be defined as the resources that arise from a web of relationships, which people can access
and mobilize to help them improve their lives and achieve their goals (Scales et al., 2020). Organizations have
the potential to promote social capital by connecting youth and young adults to both relationships and
resources. One mechanism for centering social capital development in a program’s work is to measure how
participants experience the relationship-building efforts within the program and to track the resources these
relationships facilitate access to. Thus, a key goal of this project was to develop and rigorously test a set of
social capital measures and related constructs for youth and young adults that were reliable, valid, and
theoretically sound.
This technical manual summarizes our social capital measures, using data collected in January - March 2021
from six partner organizations (i.e., Basta, Beyond 12, Braven, Climb Hire, COOP, and nXu). These measures are
organized around four domains: (a) social capital, (b) mindsets and skills for social capital development, (c)
support for social capital development, and (d) program outcomes.
Our hope is that programs, schools, and organizations use these measures to make programmatic changes
that improve the relationships being formed within and outside their program(s), while also ensuring all youth
and young adults are being equitably supported.
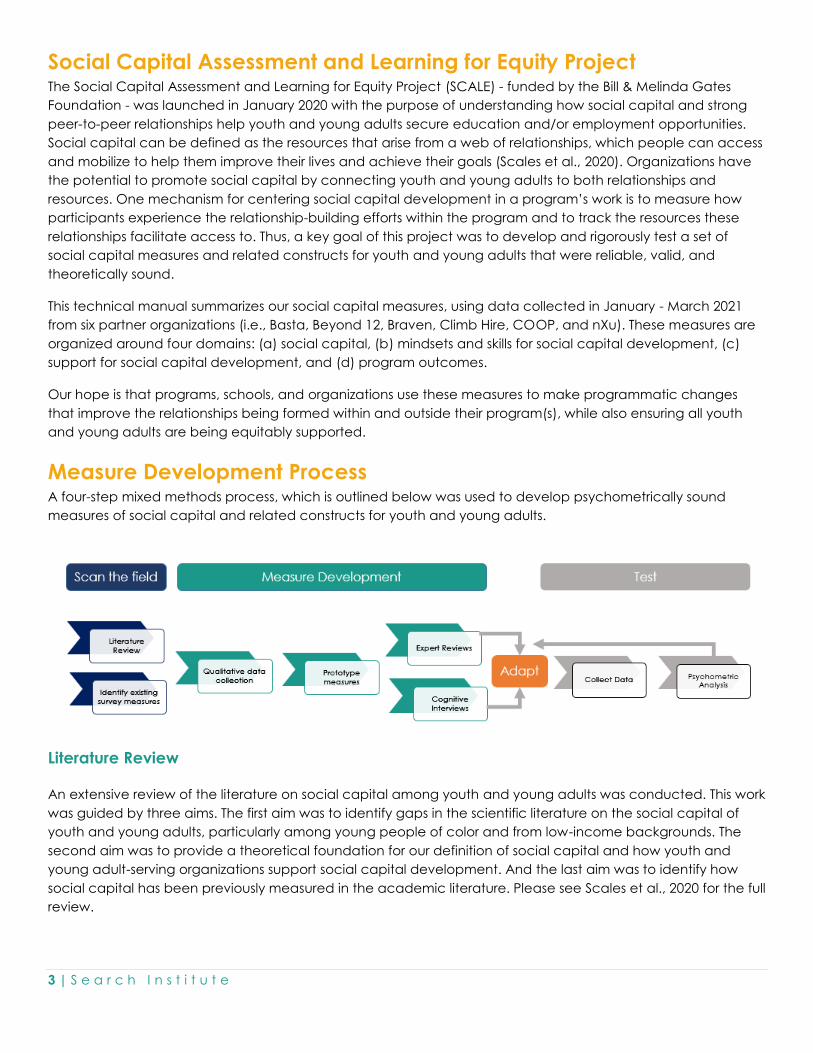
Measure Development Process A four-step mixed methods process, which is outlined below was used to develop psychometrically sound
measures of social capital and related constructs for youth and young adults.
Literature Review
An extensive review of the literature on social capital among youth and young adults was conducted. This work
was guided by three aims. The first aim was to identify gaps in the scientific literature on the social capital of
youth and young adults, particularly among young people of color and from low-income backgrounds. The
second aim was to provide a theoretical foundation for our definition of social capital and how youth and
young adult-serving organizations support social capital development. And the last aim was to identify how
social capital has been previously measured in the academic literature. Please see Scales et al., 2020 for the full
review.
4 | S e a r c h I n s t i t u t e
Qualitative Data Collection
We facilitated a number of focus groups to help determine the scope and specifications of social capital and
relevant outcome measures for the partnering youth and young adult-serving organizations. This included focus
groups with 74 individuals including 24 staff members, 33 current program participants, and 17 alumni from
partner organizations. The sample was evenly distributed across partner organizations. Our goal was to better
understand how youth and young adults experience relationships and social capital within the six partner
programs. The resulting qualitative data were analyzed for key themes, and used to directly inform measure
development. For a full description of research methodology and findings see Boat et al., 2020.
Cognitive Interviews & Expert Reviews
Prior to the pilot administration, the initial draft measures were subjected to several rounds of careful review to
test readability, interpretation, and contextual and cultural appropriateness. Vetting procedures included
expert reviews by staff from all six partner organizations, staff reviews from researchers at Search Institute (n = 7),
and reviews by researchers and program evaluators from other organizations and academic institutions (n = 4).
These reviews helped the measure development team sharpen the conceptual clarity and dimensionality of
each construct being measured, and helped evaluate from the partner program perspective, the utility of the
measures as an assessment of social capital and other related constructs.
Following expert reviews, survey items also were subjected to cognitive interviews with youth and young adults
from each of the partnering organizations (n = 7). The goal of these one-on-one interviews was to identify
whether survey items achieved our intended measurement purpose and, if not, where and how they could be
improved. A variety of cognitive probes were used to assess young people’s abilities to comprehend and
accurately respond to the items intended to assess social capital. The cognitive interviews helped our team
identify potential comprehension problems and were used to inform the revision and simplification of several
survey items.
Measure Administration
The developed measures were administered by each of the six partner organizations using standardized
administration procedures. Partners invited all current program participants to take the survey. The survey took
participants roughly 10-15 minutes to complete. It was made clear to participants that the survey was
anonymous and that the data would be analyzed by Search Institute. It was also made clear that participation
was completely voluntary and that choosing to not participate would in no way impact participants'
relationship with their program. All participants had the opportunity to enter into a $50 e-gift card raffle as a
thank you for their participation.

5 | S e a r c h I n s t i t u t e
Sample Description The social capital measures were administered to 994 youth and young adults that were current program
participants in one of the six partner organizations. Ninety-five percent of the 994 program participants were
aged between 13 and 52 (MAGE=20.76). Over half of the sample identified as female (69.7%). The three largest
self-identified racial and ethnicity groups were Hispanic/Latino(a) (33.4%), Black/African American (28.1%), and
Asian or Pacific Islander (19.2%). See Table 1 for more details.
Table 1. Demographic characteristics of young people who participated in the Social Capital
Assessment and Learning for Equity Pilot Survey
Sample Size % Sample Size %
Gender Edu. Attainment
Male 284 29.0 Some HS or currently in HS 48 4.9
Female 682 69.7
HS graduate / GED 45 4.6
Other 10 1.0 Some college or currently in
college
672 68.7
Self-described 3 0.3 VocTec or 2-year degree 11 1.1
Transgender 6 0.6
Bachelors or higher 202 20.7
F to M 0 0.0 Tenure in Program
M to F 1 20.0 0-3 months 169 17.3
Non-binary 4 80.0 4-12 months 525 53.6
Race More than a year 285 29.1
Asian or Pacific Islander 188 19.2 Program
Black, African American, or
African 275 28.1
Basta 110 11.1
Hispanic, Latin, or Spanish 327 33.4 Beyond 12 614 61.8
Native American or Alaska
Native 3 0.3
Braven 62 6.2
White 57 5.8 Climb Hire 71 7.1
Prefer to self-describe 12 1.2 COOP 93 9.4
Multiracial 116 11.9 nXu 44 4.4
Notes. Percentages in this table are valid percents; i.e., denominators used to calculate the percentages vary across items. One survey
was dropped because the individual did not provide consent to participate in the study; 75 additional surveys were dropped because
no data were provided after the consent item (i.e., no responses were provided for any of the survey items. The transgender category
item was only posed to respondents who indicated ‘yes’ to the transgender item. Numbers may not add up to 100% if there was missing
data.
6 | S e a r c h I n s t i t u t e
Measures A description of each of the social capital measures and how to administer them can be found in Search
Institute’s User Guide. The psychometric properties of the measures are presented across four domains: (1)
social capital; (2) mindsets and skills for social capital development; (3) support for social capital development,
and (4) program outcomes.
Response Scale
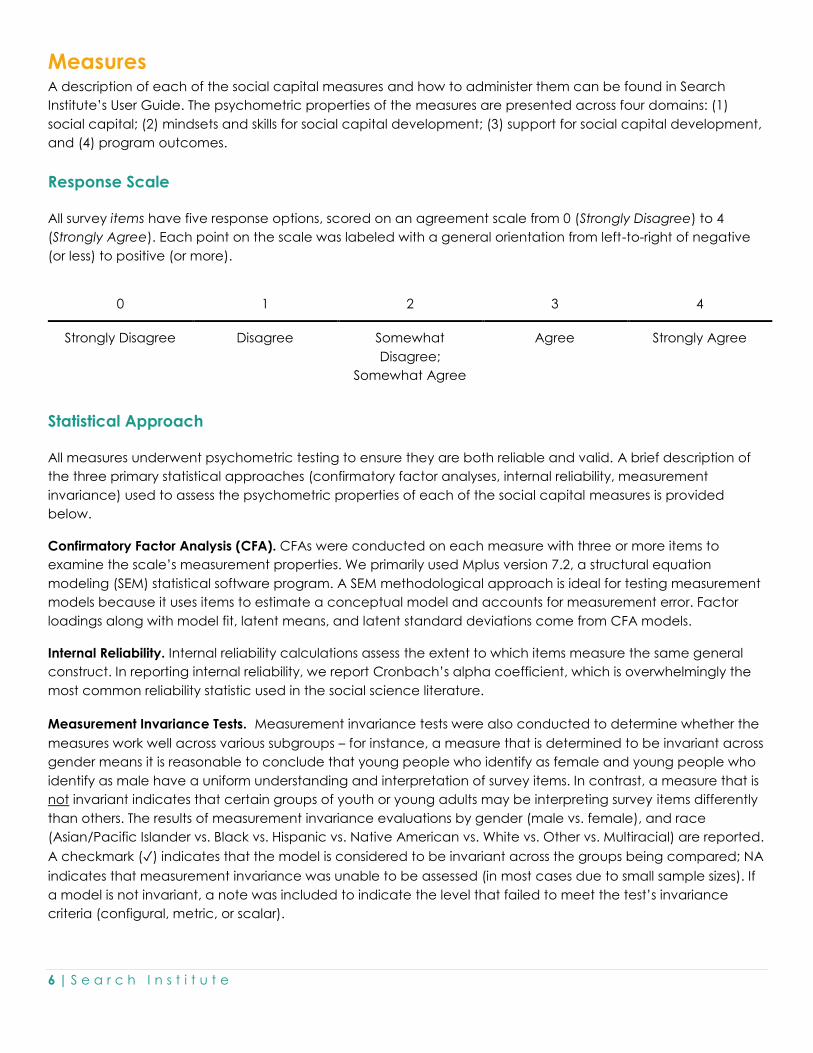
All survey items have five response options, scored on an agreement scale from 0 (Strongly Disagree) to 4
(Strongly Agree). Each point on the scale was labeled with a general orientation from left-to-right of negative
(or less) to positive (or more).
0 1 2 3 4
Strongly Disagree Disagree Somewhat
Disagree;
Somewhat Agree
Agree Strongly Agree
Statistical Approach
All measures underwent psychometric testing to ensure they are both reliable and valid. A brief description of
the three primary statistical approaches (confirmatory factor analyses, internal reliability, measurement
invariance) used to assess the psychometric properties of each of the social capital measures is provided
below.
Confirmatory Factor Analysis (CFA). CFAs were conducted on each measure with three or more items to
examine the scale’s measurement properties. We primarily used Mplus version 7.2, a structural equation
modeling (SEM) statistical software program. A SEM methodological approach is ideal for testing measurement
models because it uses items to estimate a conceptual model and accounts for measurement error. Factor
loadings along with model fit, latent means, and latent standard deviations come from CFA models.
Internal Reliability. Internal reliability calculations assess the extent to which items measure the same general
construct. In reporting internal reliability, we report Cronbach’s alpha coefficient, which is overwhelmingly the
most common reliability statistic used in the social science literature.
Measurement Invariance Tests. Measurement invariance tests were also conducted to determine whether the
measures work well across various subgroups – for instance, a measure that is determined to be invariant across
gender means it is reasonable to conclude that young people who identify as female and young people who
identify as male have a uniform understanding and interpretation of survey items. In contrast, a measure that is
not invariant indicates that certain groups of youth or young adults may be interpreting survey items differently
than others. The results of measurement invariance evaluations by gender (male vs. female), and race
(Asian/Pacific Islander vs. Black vs. Hispanic vs. Native American vs. White vs. Other vs. Multiracial) are reported.
A checkmark (✓) indicates that the model is considered to be invariant across the groups being compared; NA
indicates that measurement invariance was unable to be assessed (in most cases due to small sample sizes). If
a model is not invariant, a note was included to indicate the level that failed to meet the test’s invariance
criteria (configural, metric, or scalar).
7 | S e a r c h I n s t i t u t e
Interpretation of Psychometric Properties of Measures For each measure, we include a table that provides key descriptive and psychometric information. Below is a
brief overview on how to interpret each parameter.
Factor loadings. Factor loadings can be interpreted as a correlation between an item and the underlying
factor. We report standardized factor loadings, which range from 0 to 1. Higher loadings mean that the
variable is a stronger indicator of the construct. Generally, factor loadings of .4 and above are considered
acceptable.
Mean. A latent mean should be interpreted as the sample average. To calculate the latent means, we utilized
an effects coding procedure (Little, 2013). Effects coding is a method of scaling variables for model
identification that constrains the intercepts to sum to zero and sets the factor loadings to average 1. This
process allows the means of the latent constructs to be estimated.
Standard deviation. The standard deviation of the latent variable measures how concentrated
the data are around the mean. Larger standard deviations indicate that individual responses
vary more widely from the mean, and smaller standard deviations indicate that individual
responses are closely gathered around the mean.
Model fit. Every CFA model comes with a set of model fit indices, which provides an indication of how ‘good’
the overall construct is, based on the collected data. A summary of these fit indices can be found below:
χ² (Chi-square). Smaller values and non-significant p values (probability, an indicator of significance
level) indicate better fit. Non-significant p values are ideal, although uncommon with large sample sizes.
The model’s number of degrees of freedom (df) are reported in parentheses.
RMSEA (Root Mean Square Error of Approximation). Smaller values indicate better fit. Values lower than
or equal to .08 are acceptable; values lower than or equal to .05 are recommended.
CFI (Comparative Fit Index). Larger values indicate better fit – values of .90 or greater are
recommended.
TLI (Tucker Lewis Index). Larger values indicate better fit – values of .90 or greater are recommended.
SRMR (Standardized Root Mean Square Residual). Smaller values indicate better fit – values lower than or
equal to .05 are recommended.
Just-identified model. A just-identified model in SEM is a model where the number of free parameters
equals the number of known values, leaving zero degrees of freedom. Although model fit is perfect by
definition, the factor loadings can be interpreted as usual. All of our 3-item measures are just-identified,
thus no model fit indices are provided.
Overall fit assessment. Each of the model fit indices are based on unique sets of assumptions – therefore, each
index has different strengths and weaknesses. Consequently, any given CFA model’s fit cannot be properly
assessed by evaluating just one or two of the indices – overall fit assessment requires a holistic approach. Please
note that the determination of overall fit assessment entails some subjectivity: (1) it is sometimes the case that
some of a model’s indices fall very close to the rule-of-thumb thresholds; and (2) when comparing two or more
models, the models are often assessed on their fit relative to each other.
8 | S e a r c h I n s t i t u t e
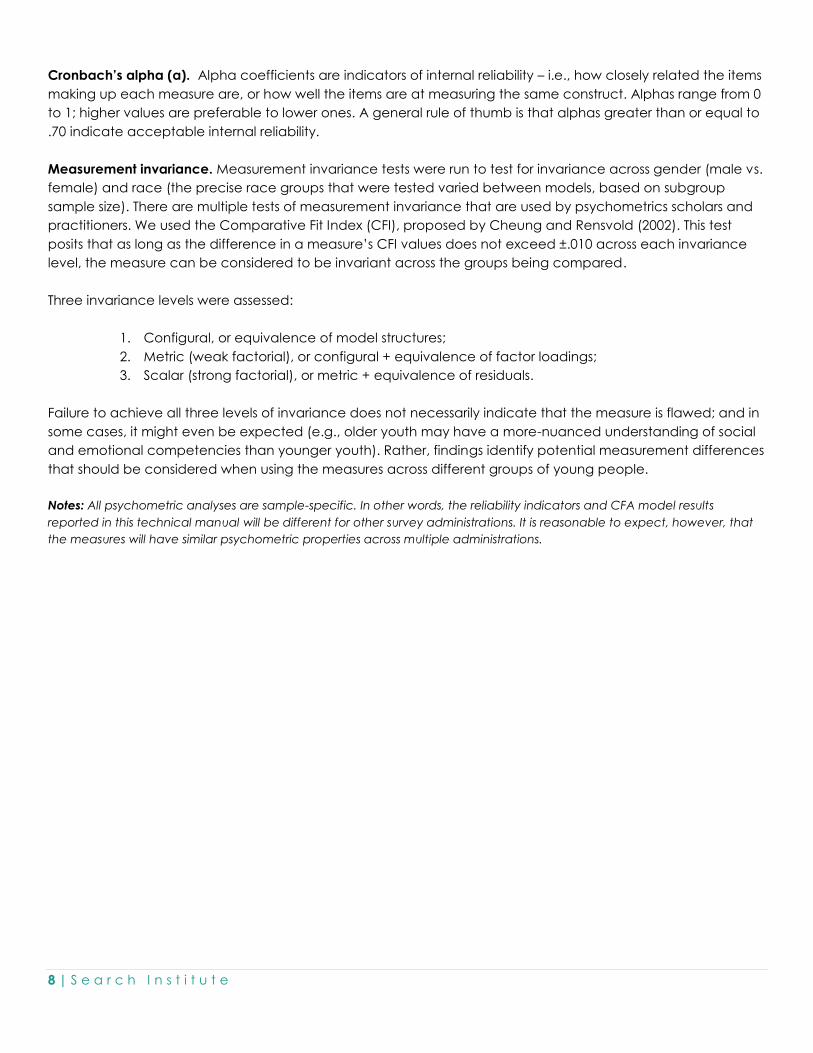
Cronbach’s alpha (α). Alpha coefficients are indicators of internal reliability – i.e., how closely related the items
making up each measure are, or how well the items are at measuring the same construct. Alphas range from 0
to 1; higher values are preferable to lower ones. A general rule of thumb is that alphas greater than or equal to
.70 indicate acceptable internal reliability.
Measurement invariance. Measurement invariance tests were run to test for invariance across gender (male vs.
female) and race (the precise race groups that were tested varied between models, based on subgroup
sample size). There are multiple tests of measurement invariance that are used by psychometrics scholars and
practitioners. We used the Comparative Fit Index (CFI), proposed by Cheung and Rensvold (2002). This test
posits that as long as the difference in a measure’s CFI values does not exceed ±.010 across each invariance
level, the measure can be considered to be invariant across the groups being compared.
Three invariance levels were assessed:
1. Configural, or equivalence of model structures;
2. Metric (weak factorial), or configural + equivalence of factor loadings;
3. Scalar (strong factorial), or metric + equivalence of residuals.
Failure to achieve all three levels of invariance does not necessarily indicate that the measure is flawed; and in
some cases, it might even be expected (e.g., older youth may have a more-nuanced understanding of social
and emotional competencies than younger youth). Rather, findings identify potential measurement differences
that should be considered when using the measures across different groups of young people.
Notes: All psychometric analyses are sample-specific. In other words, the reliability indicators and CFA model results
reported in this technical manual will be different for other survey administrations. It is reasonable to expect, however, that
the measures will have similar psychometric properties across multiple administrations.

Domain 1. Social Capital
Social Capital
Instructions: These questions ask about your relationships with people in your life. We are asking these
questions because we want to understand the different kinds of support you have from each of these
people.
How much do you disagree or agree with each statement?
Factor Loadings
With
Peers
With Near
Peers
With Teachers or
Professors
Elements of a Developmental Relationship
[RELATIONAL TARGET] show me that I matter to them .87 .74 .78
[RELATIONAL TARGET] challenge me to be my best .83 .76 .83
[RELATIONAL TARGET] listen to my ideas and take them seriously .79 .78 .81
[RELATIONAL TARGET] help me accomplish tasks .81 .83 .82
[RELATIONAL TARGET] introduce me to new experiences or
opportunities
.79 .78 .79
Resources Acquired From Relationships
[RELATIONAL TARGET] provide me with useful information for
pursuing my education or career goals
.84 .83 .87
[RELATIONAL TARGET] support me in developing or strengthening
the skills needed to pursue my education or career goals
.88 .83 .86
[RELATIONAL TARGET] connect me with other people who help
me pursue my education or career goals
.77 .78 .72
Alpha Coefficient .94 .93 .92
Mean 3.00 3.25 2.83
Standard Deviation .77 .66 .73
Measurement Invariance
Gender ✓ ✓ ✓
Race: Asian/Pacific Islander vs. Hispanic/Latino(a) vs. Other a ✓ ✓ ✓
Model fit indicesPEER χ²(df)=73.35*** (19); RMSEA=.10; CFI=.97; TLI=.96; SRMR=.03
Model fit indicesNEAR PEER χ²(df)=81.45*** (19); RMSEA=.08; CFI=.98; TLI=.96; SRMR=.03
Model fit indicesTCHR/PROF χ²(df)=173.24*** (19); RMSEA=.10; CFI=.96; TLI=.95; SRMR=.03
Notes. The latent correlation between the Developmental Relationships and Resources constructs are .949 for the Peers model, .922 for
the Near Peers model, and .913 for the Teachers or Professors model. It is also possible to measure developmental relationships and the
resources provided from these relationships separately.

1 | S e a r c h I n s t i t u t e
a Due to small sample sizes and/or model complexity, young people who identified as Black/African American/African, Native
American/Alaskan Native, White, or Multiracial were categorized as Other.

Network Strength & Network Diversity
Instructions: The next set of questions ask about your network. By network, we mean the people in your life
both within and outside of [Program/Organization Name] who can help you achieve your education or
career goals. Think about these people when you answer these questions.
How much do you disagree or agree with each statement?
Factor Loadings
Network
Diversity &
Strength
Network
Diversity
Network
Strength
Network Diversity
I have people in my network with different skills that will be useful to me as
I pursue my goals.
.68 .62
I have people in my network with many different careers or career
interests.
.73 .73
I have people in my network from many different cultures or racial/ethnic
backgrounds.
.70 .74
I have people in my network from many different economic
backgrounds.
.65 .68
Network Strength
I have people in my network that I can trust to help me pursue my
education or career goals.
.79 .79
I have people in my network that introduce me to others who can help
me reach my education or career goals.
.80 .79
I have people in my network who I am close to that help me pursue my
education or career goals.
.82 .82
I have people in my network who I am less close to but who are influential
in helping me reach my education or career goals.
.63 .63
I have people in my network who help me when they say they are going
to help me.
.71 .71
Alpha Coefficient .88 .78 .86
Mean 2.92 2.94 2.91
Standard Deviation .63 .71 .69
Measurement Invariance
Gender ✓ ✓ ✓
Race: Asian/Pacific Islander vs. Black/African American/African vs.
Hispanic/Latino(a) vs. Multiracial vs. Other a ✓ metric ✓

1 | S e a r c h I n s t i t u t e
Model fit indicesSTR+DIV χ²(df)=115.73*** (26); RMSEA=.07; CFI=.97; TLI=.96; SRMR=.03
Model fit indicesSTRENGTH χ²(df)=37.63*** (2); RMSEA=.15; CFI=.96; TLI=.88; SRMR=.03
Model fit indicesDIVERSITY χ²(df)=33.56*** (5); RMSEA=.08; CFI=.98; TLI=.97; SRMR=.02
Notes. This measure can be used as a two-factor measure, and also separately as independent measures. The latent correlation
between Network Diversity and Network Strength in the two-factor model is .77.
a Due to small sample sizes and/or model complexity, young people who identified as Native American/Alaskan Native or White were
categorized as Other.
2 | S e a r c h I n s t i t u t e
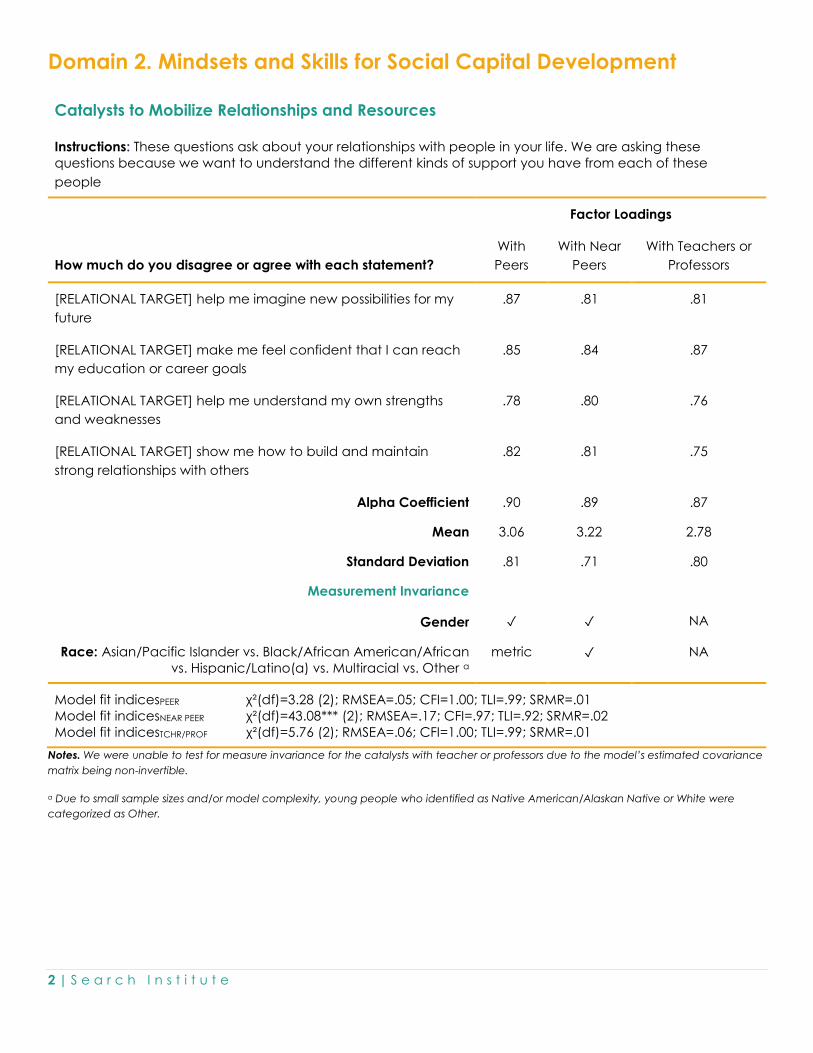
Domain 2. Mindsets and Skills for Social Capital Development
Catalysts to Mobilize Relationships and Resources
Instructions: These questions ask about your relationships with people in your life. We are asking these
questions because we want to understand the different kinds of support you have from each of these
people
How much do you disagree or agree with each statement?
Factor Loadings
With
Peers
With Near
Peers
With Teachers or
Professors
[RELATIONAL TARGET] help me imagine new possibilities for my
future
.87 .81 .81
[RELATIONAL TARGET] make me feel confident that I can reach
my education or career goals
.85 .84 .87
[RELATIONAL TARGET] help me understand my own strengths
and weaknesses
.78 .80 .76
[RELATIONAL TARGET] show me how to build and maintain
strong relationships with others
.82 .81 .75
Alpha Coefficient .90 .89 .87
Mean 3.06 3.22 2.78
Standard Deviation .81 .71 .80
Measurement Invariance
Gender ✓ ✓ NA
Race: Asian/Pacific Islander vs. Black/African American/African
vs. Hispanic/Latino(a) vs. Multiracial vs. Other a
metric ✓ NA
Model fit indicesPEER χ²(df)=3.28 (2); RMSEA=.05; CFI=1.00; TLI=.99; SRMR=.01
Model fit indicesNEAR PEER χ²(df)=43.08*** (2); RMSEA=.17; CFI=.97; TLI=.92; SRMR=.02
Model fit indicesTCHR/PROF χ²(df)=5.76 (2); RMSEA=.06; CFI=1.00; TLI=.99; SRMR=.01
Notes. We were unable to test for measure invariance for the catalysts with teacher or professors due to the model’s estimated covariance
matrix being non-invertible.
a Due to small sample sizes and/or model complexity, young people who identified as Native American/Alaskan Native or White were
categorized as Other.

3 | S e a r c h I n s t i t u t e
Self-Initiated Social Capital
How much do you disagree or agree with each statement? Factor Loading
When working towards my education or career goals, I ask for help when I need it. .66
I go out of my way to meet new people in order to reach my education or career goals. .82
I form strong relationships with people who are useful for helping me reach my education
or career goals.
.79
Alpha Coefficient .80
Mean 2.78
Standard Deviation .79
Notes. This model is just identified; thus no fit indices are reported. Measurement invariance cannot be tested for just-identified measures
because these measures have insufficient degrees of freedom to calculate model fit indices (which measurement invariance tests rely
on).
Relationship-Building Skills
How much do you disagree or agree with each statement? Factor Loading
I am good at building relationships with others. .78
I communicate well with others. .87
I work well with others in a group or team. .74
I know how to solve and manage conflicts with other people. .74
Alpha Coefficient .86
Mean 3.19
Standard Deviation .66
Measurement Invariance
Gender ✓
Race NA
Model fit indices χ²(df)=15.10*** (2); RMSEA=.20; CFI=.96; TLI=.87; SRMR=.04
Notes. There were insufficient subgroup sizes to test for race invariance.
4 | S e a r c h I n s t i t u t e
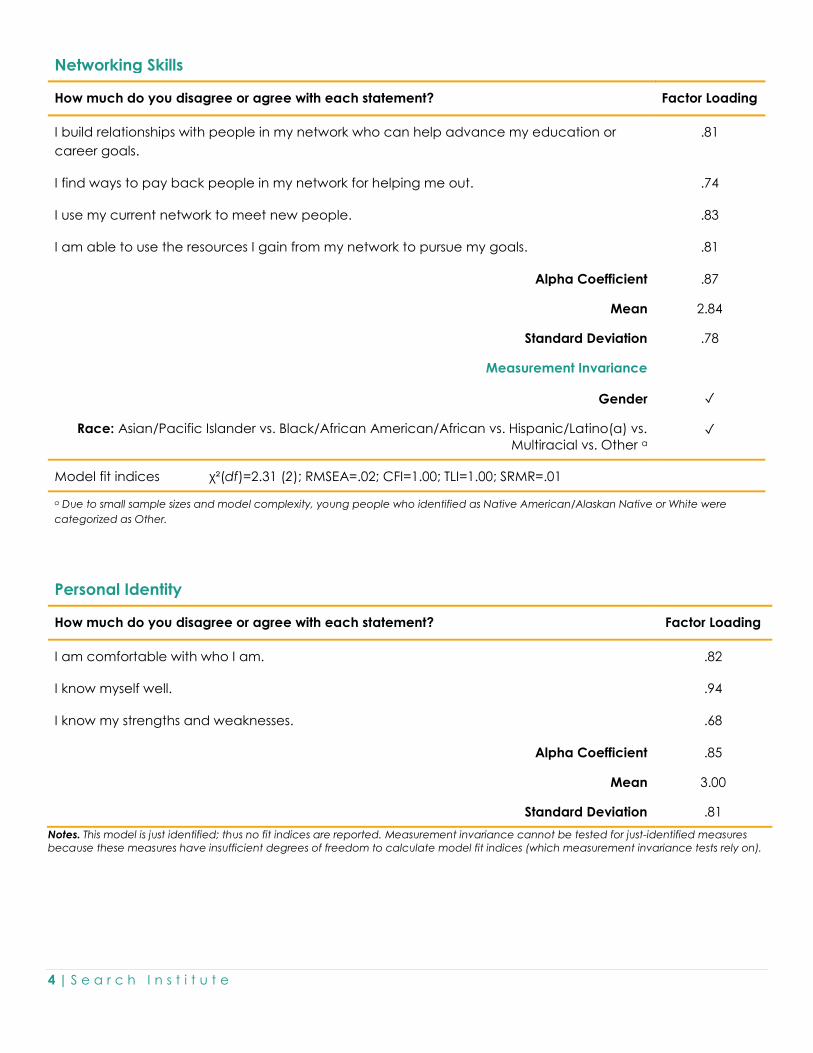
Networking Skills
How much do you disagree or agree with each statement? Factor Loading
I build relationships with people in my network who can help advance my education or
career goals.
.81
I find ways to pay back people in my network for helping me out. .74
I use my current network to meet new people. .83
I am able to use the resources I gain from my network to pursue my goals. .81
Alpha Coefficient .87
Mean 2.84
Standard Deviation .78
Measurement Invariance
Gender ✓
Race: Asian/Pacific Islander vs. Black/African American/African vs. Hispanic/Latino(a) vs.
Multiracial vs. Other a ✓
Model fit indices χ²(df)=2.31 (2); RMSEA=.02; CFI=1.00; TLI=1.00; SRMR=.01
a Due to small sample sizes and model complexity, young people who identified as Native American/Alaskan Native or White were
categorized as Other.
Personal Identity
How much do you disagree or agree with each statement? Factor Loading
I am comfortable with who I am. .82
I know myself well. .94
I know my strengths and weaknesses. .68
Alpha Coefficient .85
Mean 3.00
Standard Deviation .81
Notes. This model is just identified; thus no fit indices are reported. Measurement invariance cannot be tested for just-identified measures
because these measures have insufficient degrees of freedom to calculate model fit indices (which measurement invariance tests rely on).

5 | S e a r c h I n s t i t u t e
Racial and Ethnic Identity1
How much do you disagree or agree with each statement? Factor Loading
I have a clear sense of my racial/ethnic background and what it means for me. .67
My racial/ethnic background matters to me. .91
I think about how my racial/ethnic background affects my life. .75
My racial/ethnic background is an important part of who I am. .88
Alpha Coefficient .88
Mean 3.27
Standard Deviation .72
Measurement Invariance
Gender ✓
Race NA
Model fit indices χ²(df)=4.92 (2); RMSEA=.13; CFI=.99; TLI=.96; SRMR=.02
Notes. There are insufficient subgroup sizes to test for race invariance.
1 Some items adapted from Umaña-Taylor et al., 2004.
Sense of Purpose1
How much do you disagree or agree with each statement? Factor Loading
I put a lot of effort into making my goals a reality. .67
I understand what gives my life meaning. .76
It is important for me to make the world a better place in some way. .58
Alpha Coefficient .70
Mean 3.25
Standard Deviation .66
Notes. This model is just identified; thus no fit indices are reported. Measurement invariance cannot be tested for just-identified measures
because these measures have insufficient degrees of freedom to calculate model fit indices (which measurement invariance tests rely on).
1 Items adapted from Bronk et al., 2018.

6 | S e a r c h I n s t i t u t e
Self-Efficacy in Reaching Life Goals1
How much do you disagree or agree with each statement? Factor Loading
I can achieve the goals that I have set for myself. .83
I feel prepared to reach my goals. .73
I can succeed at tasks that I set my mind to. .90
I can successfully overcome many challenges. .85
Alpha Coefficient .89
Mean 3.15
Standard Deviation .69
Measurement Invariance
Gender ✓
Race: Asian/Pacific Islander vs. Black/African American/African vs. Hispanic/Latino(a) vs.
Multiracial vs. Other a ✓
Model fit indices χ²(df)=15.12*** (2); RMSEA=.11; CFI=.99; TLI=.97; SRMR=.02
a Due to small sample sizes and/or model complexity, young people who identified as Native American/Alaskan Native or White were
categorized as Other.
1 Some items adapted from Chen et al., 2001.
7 | S e a r c h I n s t i t u t e
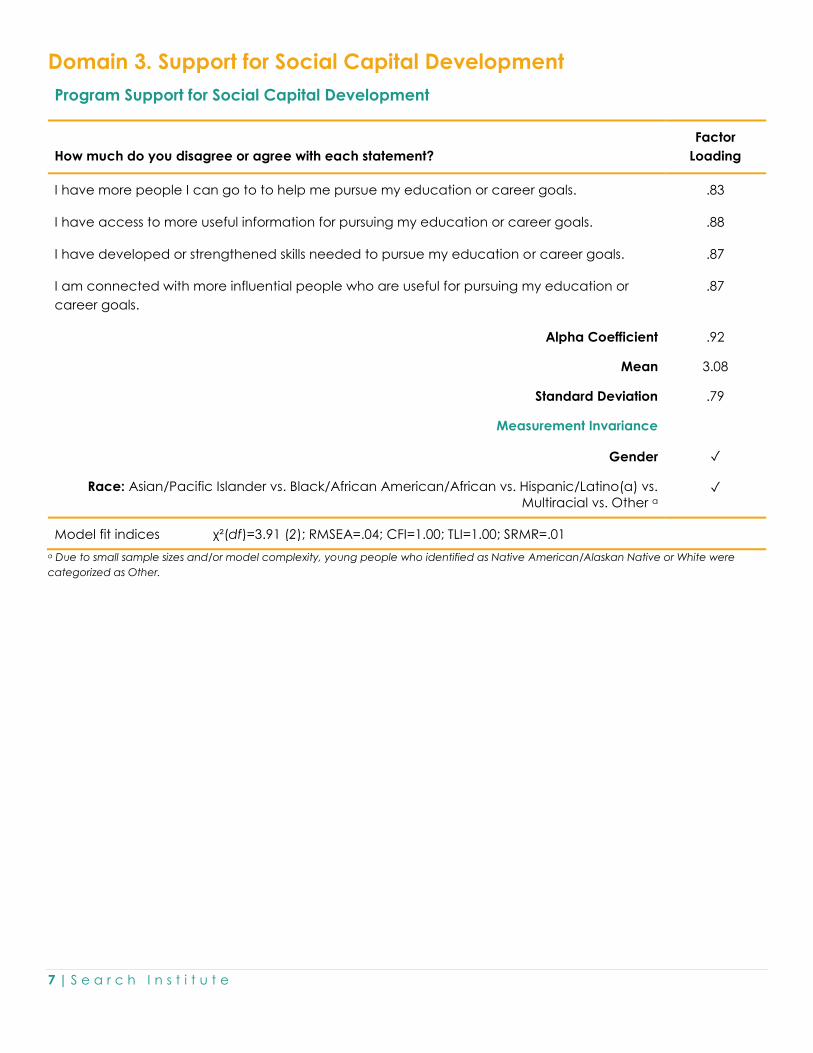
Domain 3. Support for Social Capital Development
Program Support for Social Capital Development
How much do you disagree or agree with each statement?
Factor
Loading
I have more people I can go to to help me pursue my education or career goals. .83
I have access to more useful information for pursuing my education or career goals. .88
I have developed or strengthened skills needed to pursue my education or career goals. .87
I am connected with more influential people who are useful for pursuing my education or
career goals.
.87
Alpha Coefficient .92
Mean 3.08
Standard Deviation .79
Measurement Invariance
Gender ✓
Race: Asian/Pacific Islander vs. Black/African American/African vs. Hispanic/Latino(a) vs.
Multiracial vs. Other a ✓
Model fit indices χ²(df)=3.91 (2); RMSEA=.04; CFI=1.00; TLI=1.00; SRMR=.01
a Due to small sample sizes and/or model complexity, young people who identified as Native American/Alaskan Native or White were
categorized as Other.

8 | S e a r c h I n s t i t u t e
Sense of Program Community
How much do you disagree or agree with each statement?
Factor
Loading
I feel a sense of community at [PROGRAM/ORGANIZATION NAME]. .94
I care about what happens at [PROGRAM/ORGANIZATION NAME]. .84
I reach out to my [PROGRAM/ORGANIZATION NAME] community for support. .73
I feel known and valued at [PROGRAM/ORGANIZATION NAME]. .84
Alpha Coefficient .89
Mean 3.38
Standard Deviation .71
Measurement Invariance
Gender NA
Race: Asian/Pacific Islander vs. Black/African American/African vs. Hispanic/Latino(a) vs. Other a metric
Model fit indices χ²(df)=7.93* (2); RMSEA=.13; CFI=.99; TLI=.96; SRMR=.02
Notes. We were unable to test for measurement invariance by gender because the model’s residual covariance matrix is not positive
definite.
a Due to small sample sizes and/or model complexity, young people who identified as Native American/Alaskan Native, White, or
Multiracial were categorized as Other.

9 | S e a r c h I n s t i t u t e
Psychological Safety
How much do you disagree or agree with each statement?
Factor
Loading
[PEOPLE IN PROGRAM/ORGANIZATION NAME] create a safe space for me to express who I am
and who I want to be.
.88
[PEOPLE IN PROGRAM/ORGANIZATION NAME] acknowledge and respect who I am and my
background.
.90
[PEOPLE IN PROGRAM/ORGANIZATION NAME] create a safe space to talk about inequities
and other systemic issues.
.89
[PEOPLE IN PROGRAM/ORGANIZATION NAME] believe I am capable of achieving my goals,
regardless of my background.
.89
Alpha Coefficient .94
Mean 3.50
Standard Deviation .59
Measurement Invariance
Gender ✓
Race: Asian/Pacific Islander vs. Black/African American/African vs. Hispanic/Latino(a) vs.
Other a ✓
Model fit indices χ²(df)=7.70* (2); RMSEA=.07; CFI=1.00; TLI=.99; SRMR=.01
a Due to small sample sizes and/or model complexity, young people who identified Native American/Alaskan Native, White, or Multiracial
were categorized as Other.
10 | S e a r c h I n s t i t u t e
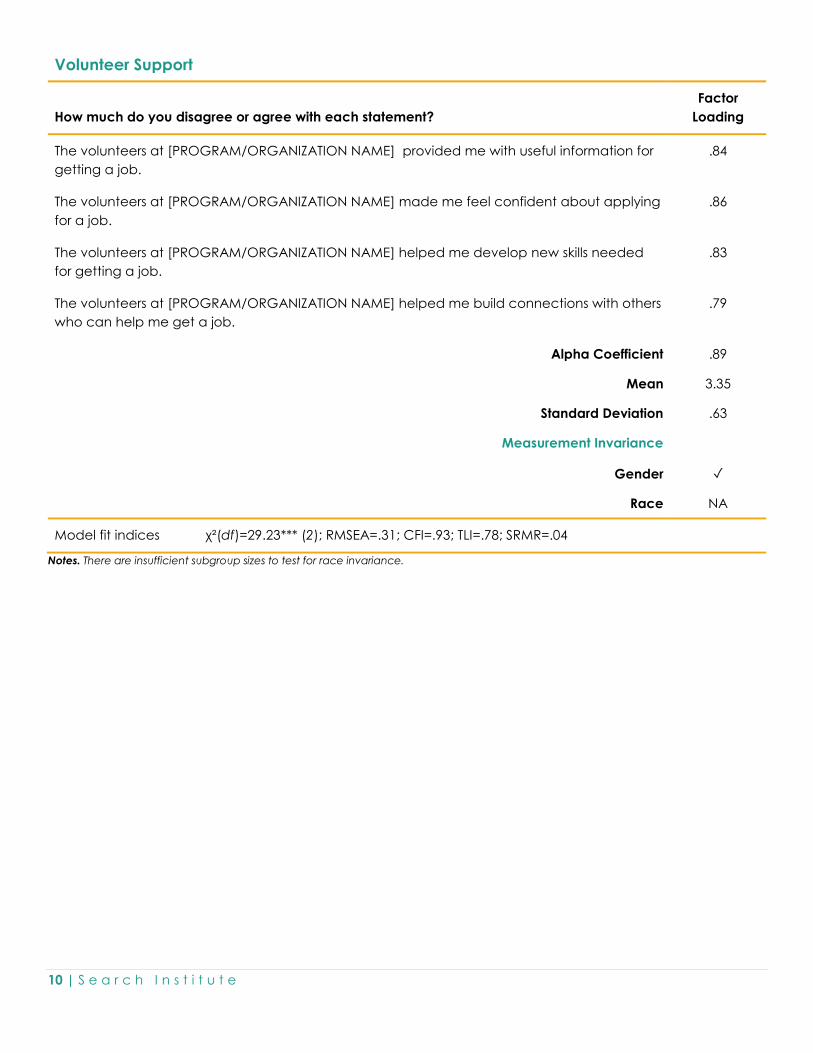
Volunteer Support
How much do you disagree or agree with each statement?
Factor
Loading
The volunteers at [PROGRAM/ORGANIZATION NAME] provided me with useful information for
getting a job.
.84
The volunteers at [PROGRAM/ORGANIZATION NAME] made me feel confident about applying
for a job.
.86
The volunteers at [PROGRAM/ORGANIZATION NAME] helped me develop new skills needed
for getting a job.
.83
The volunteers at [PROGRAM/ORGANIZATION NAME] helped me build connections with others
who can help me get a job.
.79
Alpha Coefficient .89
Mean 3.35
Standard Deviation .63
Measurement Invariance
Gender ✓
Race NA
Model fit indices χ²(df)=29.23*** (2); RMSEA=.31; CFI=.93; TLI=.78; SRMR=.04
Notes. There are insufficient subgroup sizes to test for race invariance.
11 | S e a r c h I n s t i t u t e
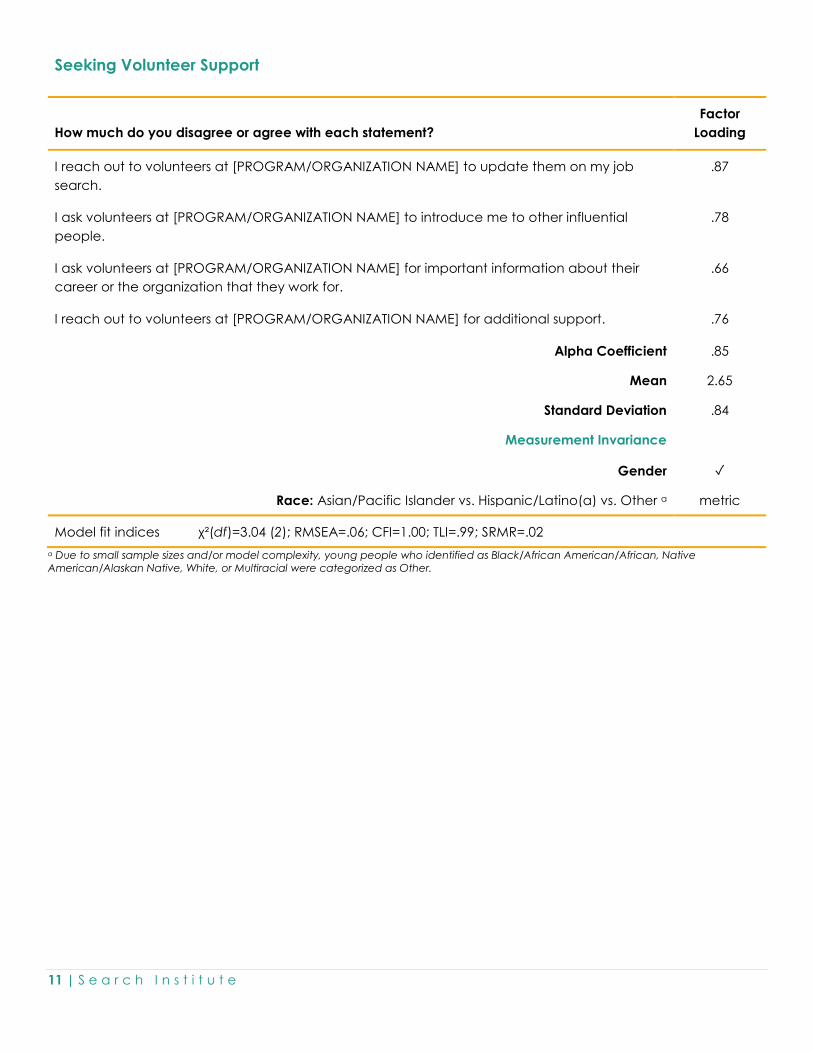
Seeking Volunteer Support
How much do you disagree or agree with each statement?
Factor
Loading
I reach out to volunteers at [PROGRAM/ORGANIZATION NAME] to update them on my job
search.
.87
I ask volunteers at [PROGRAM/ORGANIZATION NAME] to introduce me to other influential
people.
.78
I ask volunteers at [PROGRAM/ORGANIZATION NAME] for important information about their
career or the organization that they work for.
.66
I reach out to volunteers at [PROGRAM/ORGANIZATION NAME] for additional support. .76
Alpha Coefficient .85
Mean 2.65
Standard Deviation .84
Measurement Invariance
Gender ✓
Race: Asian/Pacific Islander vs. Hispanic/Latino(a) vs. Other a metric
Model fit indices χ²(df)=3.04 (2); RMSEA=.06; CFI=1.00; TLI=.99; SRMR=.02
a Due to small sample sizes and/or model complexity, young people who identified as Black/African American/African, Native
American/Alaskan Native, White, or Multiracial were categorized as Other.

12 | S e a r c h I n s t i t u t e
Sense of School/College Campus Community
How much do you disagree or agree with each statement? Factor Loading
I feel a sense of community at my [SCHOOL/COLLEGE CAMPUS]. .86
I care about what happens at my [SCHOOL/COLLEGE CAMPUS]. .74
I reach out to people at my [SCHOOL/COLLEGE CAMPUS] for support. .75
I feel known and valued at my [SCHOOL/COLLEGE CAMPUS]. .77
Alpha Coefficient .86
Mean 2.67
Standard Deviation .87
Measurement Invariance
Gender ✓
Race: Asian/Pacific Islander vs. Black/African American/African vs. Hispanic/Latino(a) vs.
Multiracial vs. Other a ✓
Model fit indices χ²(df)=11.22** (2); RMSEA=.11; CFI=.99; TLI=.96; SRMR=.02
a Due to small sample sizes and/or model complexity, young people who identified as Native American/Alaskan Native or White were
categorized as Other.

13 | S e a r c h I n s t i t u t e
Seeking Professor/Teacher Support
How much do you disagree or agree with each statement?
Factor
Loading
I ask [TEACHERS/PROFESSORS] to introduce me to others who can help me reach my
educational goals.
.74
I ask [TEACHERS/PROFESSORS] for information about school resources (e.g., advising, tutoring,
mental health services).
.85
I ask [TEACHERS/PROFESSORS] for guidance or advice on major life decisions. .83
I ask [TEACHERS/PROFESSORS] for additional educational support (e.g., homework, tutoring). .86
Alpha Coefficient .89
Mean 2.49
Standard Deviation .97
Measurement Invariance
Gender ✓
Race: Asian/Pacific Islander vs. Black/African American/African vs. Hispanic/Latino(a) vs.
Multiracial vs. Other a
metric
Model fit indices χ²(df)=14.84*** (2); RMSEA=.13; CFI=.99; TLI=.96; SRMR=.02
a Due to small sample sizes and/or model complexity, young people who identified as Native American/Alaskan Native or White were
categorized as Other.
14 | S e a r c h I n s t i t u t e
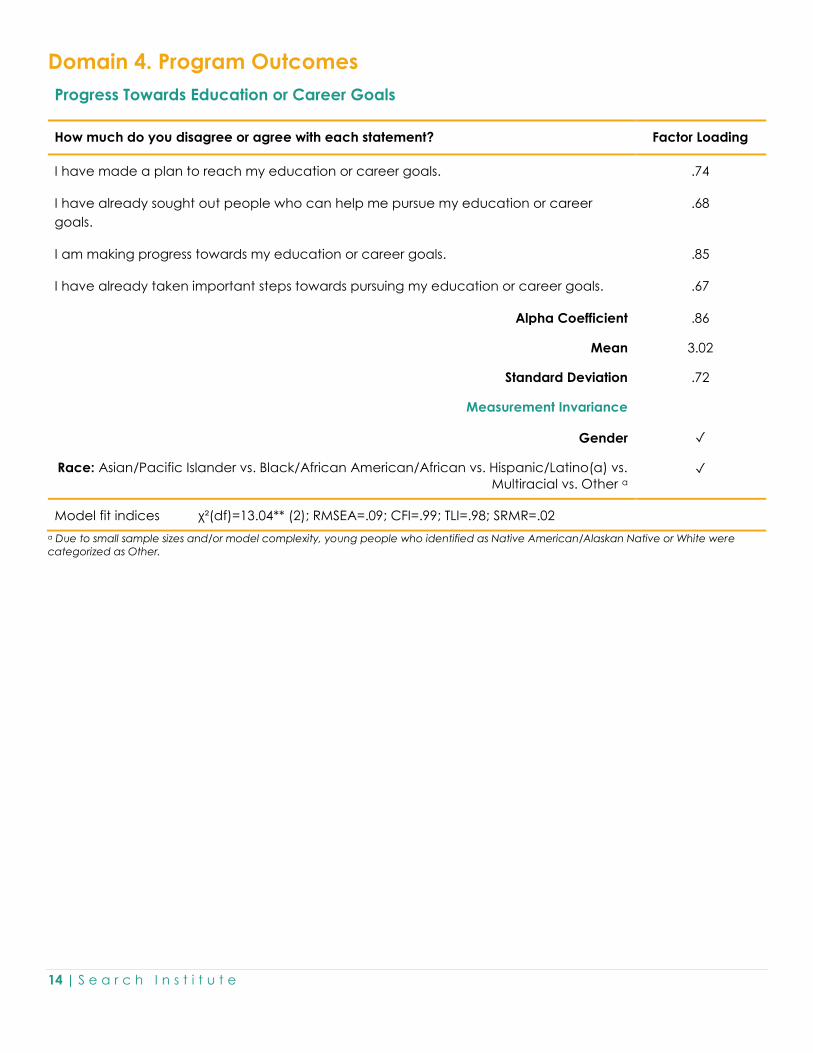
Domain 4. Program Outcomes
Progress Towards Education or Career Goals
How much do you disagree or agree with each statement? Factor Loading
I have made a plan to reach my education or career goals. .74
I have already sought out people who can help me pursue my education or career
goals.
.68
I am making progress towards my education or career goals. .85
I have already taken important steps towards pursuing my education or career goals. .67
Alpha Coefficient .86
Mean 3.02
Standard Deviation .72
Measurement Invariance
Gender ✓
Race: Asian/Pacific Islander vs. Black/African American/African vs. Hispanic/Latino(a) vs.
Multiracial vs. Other a ✓
Model fit indices χ²(df)=13.04** (2); RMSEA=.09; CFI=.99; TLI=.98; SRMR=.02
a Due to small sample sizes and/or model complexity, young people who identified as Native American/Alaskan Native or White were
categorized as Other.
15 | S e a r c h I n s t i t u t e
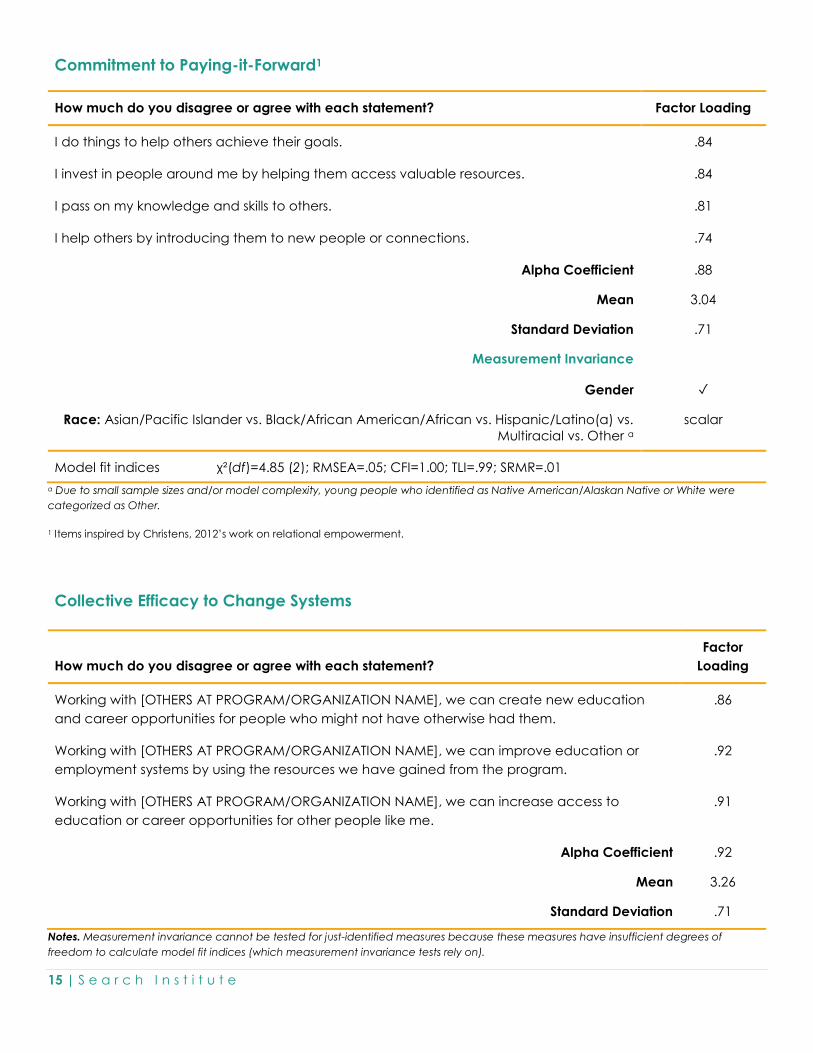
Commitment to Paying-it-Forward1
How much do you disagree or agree with each statement? Factor Loading
I do things to help others achieve their goals. .84
I invest in people around me by helping them access valuable resources. .84
I pass on my knowledge and skills to others. .81
I help others by introducing them to new people or connections. .74
Alpha Coefficient .88
Mean 3.04
Standard Deviation .71
Measurement Invariance
Gender ✓
Race: Asian/Pacific Islander vs. Black/African American/African vs. Hispanic/Latino(a) vs.
Multiracial vs. Other a
scalar
Model fit indices χ²(df)=4.85 (2); RMSEA=.05; CFI=1.00; TLI=.99; SRMR=.01
a Due to small sample sizes and/or model complexity, young people who identified as Native American/Alaskan Native or White were
categorized as Other.
1 Items inspired by Christens, 2012’s work on relational empowerment.
Collective Efficacy to Change Systems
How much do you disagree or agree with each statement?
Factor
Loading
Working with [OTHERS AT PROGRAM/ORGANIZATION NAME], we can create new education
and career opportunities for people who might not have otherwise had them.
.86
Working with [OTHERS AT PROGRAM/ORGANIZATION NAME], we can improve education or
employment systems by using the resources we have gained from the program.
.92
Working with [OTHERS AT PROGRAM/ORGANIZATION NAME], we can increase access to
education or career opportunities for other people like me.
.91
Alpha Coefficient .92
Mean 3.26
Standard Deviation .71
Notes. Measurement invariance cannot be tested for just-identified measures because these measures have insufficient degrees of
freedom to calculate model fit indices (which measurement invariance tests rely on).

16 | S e a r c h I n s t i t u t e
Occupational Identity
How much do you disagree or agree with each statement?
Factor
Loading
I have a clear sense about what careers I am interested in pursuing. .71
I see my current life experiences as useful to my future career. .70
I know what steps to take to reach my career goals. .81
People like me are successful in the careers that interest me. .59
Alpha Coefficient .80
Mean 3.00
Standard Deviation .67
Measurement Invariance
Gender ✓
Race: Asian/Pacific Islander vs. Black/African American/African vs. Hispanic/Latino(a) vs.
Other a
metric
Model fit indices χ²(df)=2.54 (2); RMSEA=.04; CFI=1.00; TLI=.99; SRMR=.02
a Due to small sample sizes and/or model complexity, young people who identified as Native American/Alaskan Native, White, or
Multiracial were categorized as Other.

17 | S e a r c h I n s t i t u t e
Job-Seeking Skills
How much do you disagree or agree with each statement?
Factor
Loading
I know how to find information about open job positions. .70
I know how to network. .71
I know how to prepare a job resume. .82
I know how to complete a job application. .71
I know how to get ready for a job interview (e.g., how to research the company, practice
interview questions).
.68
Alpha Coefficient .84
Mean 3.17
Standard Deviation .59
Measurement Invariance
Gender ✓
Race: Asian/Pacific Islander vs. Hispanic/Latino(a) vs. Other a scalar
Model fit indices χ²(df)=3.74 (5); RMSEA=.00; CFI=1.00; TLI=1.00; SRMR=.02
a Due to small sample sizes and/or model complexity, young people who identified as Black/African American/African, Native
American/Alaskan Native, White, or Multiracial were categorized as Other.
18 | S e a r c h I n s t i t u t e
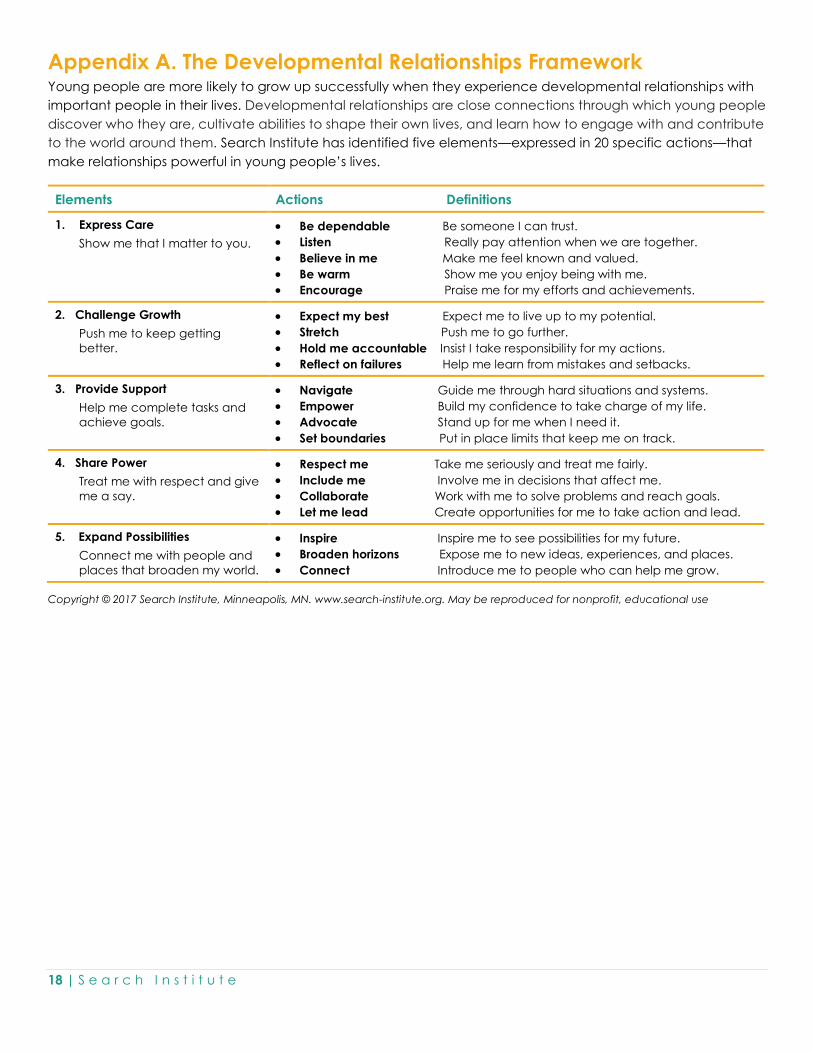
Appendix A. The Developmental Relationships Framework Young people are more likely to grow up successfully when they experience developmental relationships with
important people in their lives. Developmental relationships are close connections through which young people
discover who they are, cultivate abilities to shape their own lives, and learn how to engage with and contribute
to the world around them. Search Institute has identified five elements—expressed in 20 specific actions—that
make relationships powerful in young people’s lives.
Elements Actions Definitions
1. Express Care
Show me that I matter to you.
Be dependable Be someone I can trust.
Listen Really pay attention when we are together.
Believe in me Make me feel known and valued.
Be warm Show me you enjoy being with me.
Encourage Praise me for my efforts and achievements.
2. Challenge Growth
Push me to keep getting
better.
Expect my best Expect me to live up to my potential.
Stretch Push me to go further.
Hold me accountable Insist I take responsibility for my actions.
Reflect on failures Help me learn from mistakes and setbacks.
3. Provide Support
Help me complete tasks and
achieve goals.
Navigate Guide me through hard situations and systems.
Empower Build my confidence to take charge of my life.
Advocate Stand up for me when I need it.
Set boundaries Put in place limits that keep me on track.
4. Share Power
Treat me with respect and give
me a say.
Respect me Take me seriously and treat me fairly.
Include me Involve me in decisions that affect me.
Collaborate Work with me to solve problems and reach goals.
Let me lead Create opportunities for me to take action and lead.
5. Expand Possibilities
Connect me with people and
places that broaden my world.
Inspire Inspire me to see possibilities for my future.
Broaden horizons Expose me to new ideas, experiences, and places.
Connect Introduce me to people who can help me grow.
Copyright © 2017 Search Institute, Minneapolis, MN. www.search-institute.org. May be reproduced for nonprofit, educational use

19 | S e a r c h I n s t i t u t e
References
Boat, A., Sethi, J., Eisenberg, C., & Chamberlain, R. (2020). “It Was a Support Network System that Made Me
Believe in Myself”: Understanding Youth and Young Adults’ Experiences of Social Capital in Six
Innovative Programs. Minneapolis: Search Institute. Report for the Bill & Melinda Gates Foundation.
https://www.search-institute.org/wp-content/uploads/2020/12/SOCAP_Deliverable_121720.pdf
Bronk, K. C., Riches, B. R., & Mangan, S. A. (2018). Claremont Purpose Scale: A measure that assesses the three
dimensions of purpose among adolescents. Research in Human Development, 15 (2), 101-117.
https://doi.org/10.1080/15427609.2018.1441577
Chen, G., Gully, S. M., & Eden, D. (2001). Validation of a new general self-efficacy scale. Organizational
Research Methods, 4(1), 62-83. https://doi.org/10.1177%2F109442810141004
Cheung, G. W., & Rensvold, R. B. (2002). Evaluating goodness-of-fit indexes for testing measurement
invariance. Structural Equation Modeling, 9(2), 233-255. https://doi.org/10.1207/S15328007SEM0902_5
Christens, B. D. (2012). Toward relational empowerment. American Journal of Community Psychology, 50(1-2),
114-128. https://doi.org/10.1007/s10464-011-9483-5
Scales, P.C., Boat, A., & Pekel, K. (2020). Defining and Measuring Social Capital for Young People: A Practical
Review of the Literature on Resource-Full Relationships. Minneapolis: Search Institute. Report for the Bill &
Melinda Gates Foundation. https://www.search-institute.org/wp-content/uploads/2020/05/SOCAP-Lit-
Review.pdf
Umaña-Taylor, A. J., Yazedjian, A., & Bámaca-Gómez, M. (2004). Developing the ethnic identity scale using
Eriksonian and social identity perspectives. Identity: An International Journal of Theory and
Research, 4(1), 9-38. https://doi.org/10.1207/S1532706XID0401_2

20 | S e a r c h I n s t i t u t e
Copyright © 2021 Search Institute. All rights reserved.
Search Institute grants a non-exclusive, non-transferable creative commons license to use the measures in this
technical manual. Users may:
1. Share: Copy, distribute, and transmit the work for education or research purposes.
2. Adapt: Adapt the items to meet their study and program needs; however, doing so may impact the
measurement properties of the scales in heretofore unknown ways.
This permission is granted under the following terms:
1. Attribution: Users must properly attribute the work to the authors (and, where applicable, the original
developers of adopted items from other works).
2. Non Commercial: Users may not use this work for commercial purposes.
3. Share Alike: If users alter, transform, or build upon this work, they must distribute the resulting work under
the same or similar license to this one.
For additional permission questions, write to Permissions at Search Institute ([email protected])
Search Institute would like to thank the youth and young adults who participated in the SCALE Project, as well
as the six partner organizations: Basta, Beyond 12, Braven, Climb Hire, COOP, and nXu, who contributed to this
work.
Recommended Citation:
Search Institute (2021). Social capital assessment and learning for equity measures technical manual.
Minneapolis, MN: Search Institute.