Embed Size (px)
Citation preview

2017 Equity Capital Markets Review November 14, 2017
REUTERS / Firstname Lastname
REUTERS / David Mdzinarishvili

2017 Equity Capital Markets Review
2017 Equity Capital Markets Review
Matthew Toole is the Director of Deals Intelligence within Thomson Reuters Investing and Advisory Division and is
responsible for communicating broad M&A, capital markets, private equity and venture capital industry trends through
quarterly research reports and the financial media. Matthew’s research has been featured in various global financial
publications including The New York Times and the Financial Times and he has appeared on CNBC’s Worldwide
Exchange and Squawk Box and The Nightly Business Report.
Stephen Lacey is US Editor for International Financing Review, responsible for coordinating coverage of Americas
capital markets teams (fixed income, securitization, derivatives, equities) across real-time and print publications. Since
joining IFR in 2001, Mr. Lacey has specialized in coverage across the life-cycle of equity capital markets, from venture
capital/private equity to IPO, and onto public equity (primary/secondary stock sales, convertible bonds and M&A). He
previously headed up IPO coverage at Red Herring, a bi-weekly publication focused on the venture capital industry.
Anthony Hughes is Assistant Editor for International Financing Review with primary responsibility for overseeing
equity capital markets coverage, including publication of the IFR US ECM Briefing. In this capacity, Mr. Hughes
specializes in coverage of TMT, Industrials and Financials. He has had a long career in business journalism, starting in
Australia as Investment Editor of the Sydney Morning Herald as well author of a daily stock market column for the
Australian Financial Review. Prior to joining IFR in 2011, Mr. Hughes worked as AFR’s New York correspondent. He
has also co-authored two books on stock market investing in Australia. Anthony is a CFA charterholder.

2017 Equity Capital Markets Review
Global Investment Banking Overview
Led by a resurgence of M&A activity and IPO issuance, global investment banking fees are
projected to top $100 billion for the second time since our records began in 2000.
28%
28%
22%
22%
Investment BankingRevenue by Productsince 2013
Mergers & Acquisitions Debt Capital Markets
Equity Capital Markets Syndicated Loans
$0
$5
$10
$15
$20
$25
$30
$35
$40
$45
$50
$55
2013 2014 2015 2016 2017
Regional IB Revenues
Americas Europe Asia Pacific
$0
$5
$10
$15
$20
$25
$30
2013 2014 2015 2016 2017
M&A DCM ECM LOANS

2017 Equity Capital Markets Review
US Equity Capital Markets Fees up 39% compared to 2016 levels
$0
$2
$4
$6
$8
$10
$12
2000 2001 2002 2003 2004 2005 2006 2007 2008 2009 2010 2011 2012 2013 2014 2015 2016 2017
US Convertible Fees ($bil) US Follow-On Fees ($bil) US IPO Fees ($bil)

US listed Initial Public Offerings hit three-year high, raising $35.7 billion, up
85% from a year ago
0
50
100
150
200
250
300
$0
$10
$20
$30
$40
$50
$60
$70
$80
$90
$100
2003 2004 2005 2006 2007 2008 2009 2010 2011 2012 2013 2014 2015 2016 2017
US listed IPO Proceeds ($bil) Number of Offerings
2017 Equity Capital Markets Review
2017 Equity Capital Markets Review
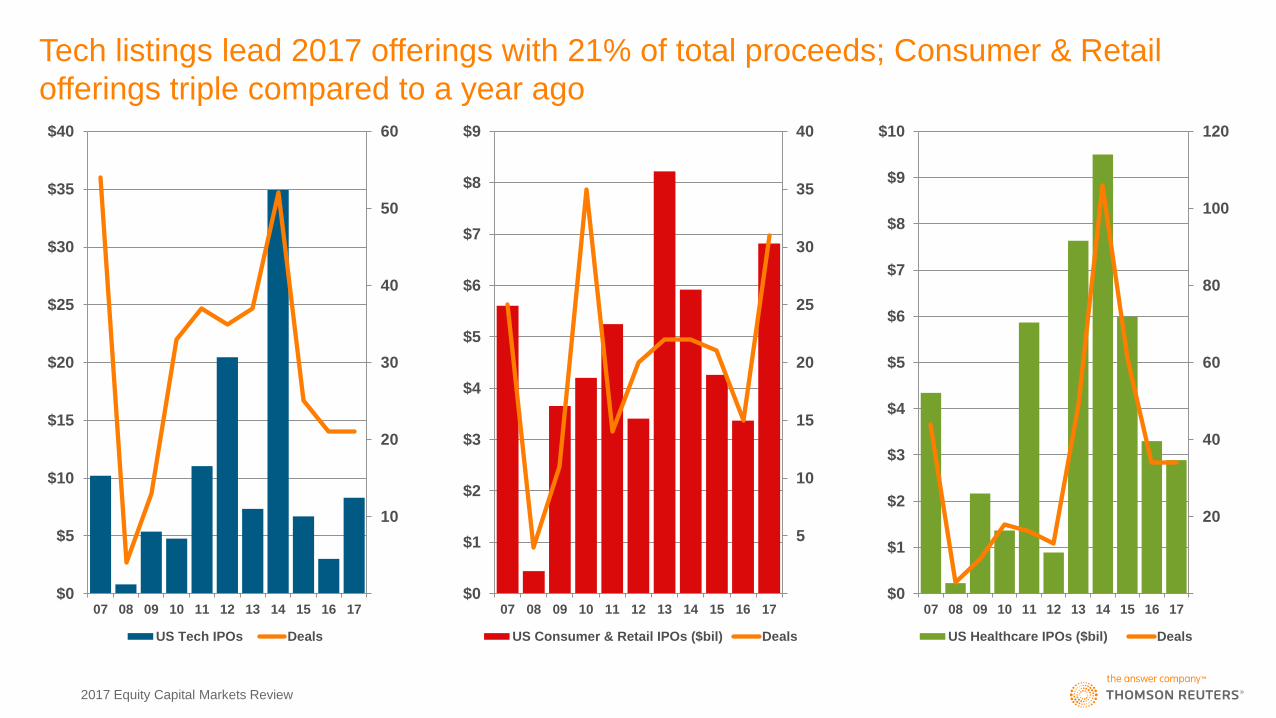
Tech listings lead 2017 offerings with 21% of total proceeds; Consumer & Retail
offerings triple compared to a year ago
10
20
30
40
50
60
07 08 09 10 11 12 13 14 15 16 17$0
$5
$10
$15
$20
$25
$30
$35
$40
US Tech IPOs Deals
5
10
15
20
25
30
35
40
$0
$1
$2
$3
$4
$5
$6
$7
$8
$9
07 08 09 10 11 12 13 14 15 16 17
US Consumer & Retail IPOs ($bil) Deals
20
40
60
80
100
120
$0
$1
$2
$3
$4
$5
$6
$7
$8
$9
$10
07 08 09 10 11 12 13 14 15 16 17
US Healthcare IPOs ($bil) Deals
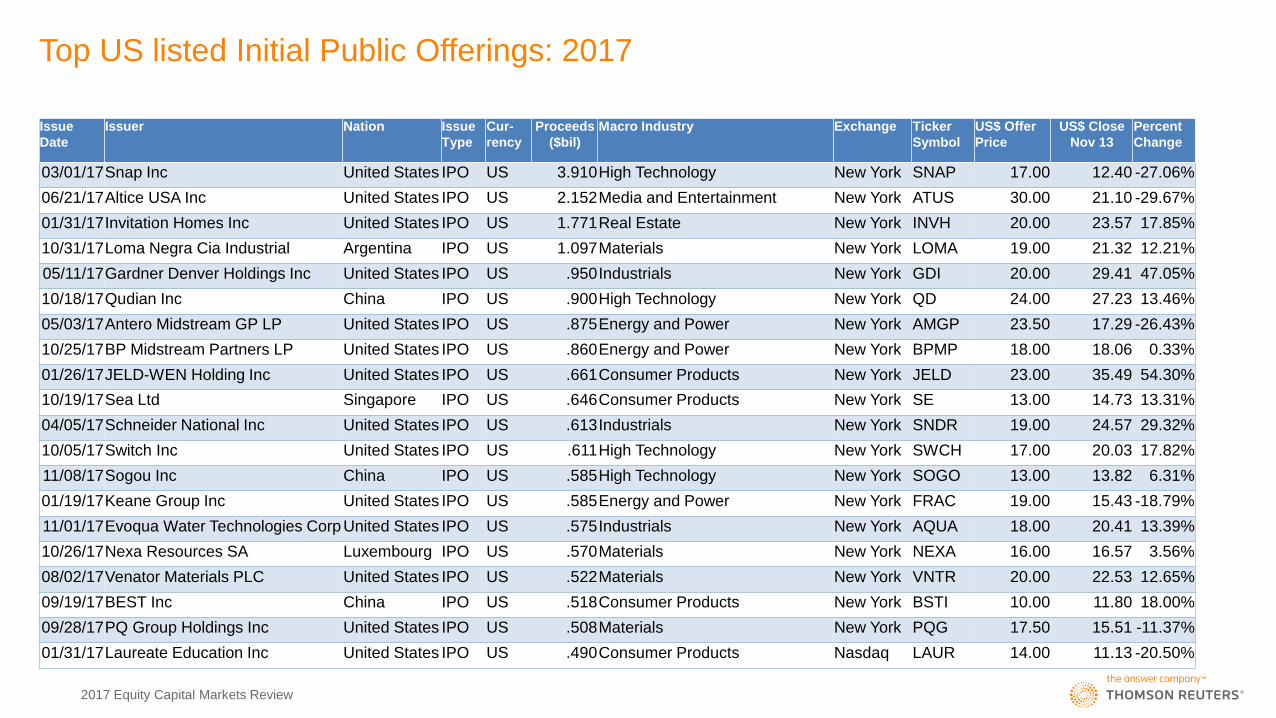
Top US listed Initial Public Offerings: 2017
2017 Equity Capital Markets Review
Issue
Date
Issuer Nation Issue
Type
Cur-
rency
Proceeds
($bil)
Macro Industry Exchange Ticker
Symbol
US$ Offer
Price
US$ Close
Nov 13
Percent
Change
03/01/17Snap Inc United States IPO US 3.910High Technology New York SNAP 17.00 12.40 -27.06%
06/21/17Altice USA Inc United States IPO US 2.152Media and Entertainment New York ATUS 30.00 21.10 -29.67%
01/31/17Invitation Homes Inc United States IPO US 1.771Real Estate New York INVH 20.00 23.57 17.85%
10/31/17Loma Negra Cia Industrial Argentina IPO US 1.097Materials New York LOMA 19.00 21.32 12.21%
05/11/17Gardner Denver Holdings Inc United States IPO US .950Industrials New York GDI 20.00 29.41 47.05%
10/18/17Qudian Inc China IPO US .900High Technology New York QD 24.00 27.23 13.46%
05/03/17Antero Midstream GP LP United States IPO US .875Energy and Power New York AMGP 23.50 17.29 -26.43%
10/25/17BP Midstream Partners LP United States IPO US .860Energy and Power New York BPMP 18.00 18.06 0.33%
01/26/17JELD-WEN Holding Inc United States IPO US .661Consumer Products New York JELD 23.00 35.49 54.30%
10/19/17Sea Ltd Singapore IPO US .646Consumer Products New York SE 13.00 14.73 13.31%
04/05/17Schneider National Inc United States IPO US .613Industrials New York SNDR 19.00 24.57 29.32%
10/05/17Switch Inc United States IPO US .611High Technology New York SWCH 17.00 20.03 17.82%
11/08/17Sogou Inc China IPO US .585High Technology New York SOGO 13.00 13.82 6.31%
01/19/17Keane Group Inc United States IPO US .585Energy and Power New York FRAC 19.00 15.43 -18.79%
11/01/17Evoqua Water Technologies CorpUnited States IPO US .575Industrials New York AQUA 18.00 20.41 13.39%
10/26/17Nexa Resources SA Luxembourg IPO US .570Materials New York NEXA 16.00 16.57 3.56%
08/02/17Venator Materials PLC United States IPO US .522Materials New York VNTR 20.00 22.53 12.65%
09/19/17BEST Inc China IPO US .518Consumer Products New York BSTI 10.00 11.80 18.00%
09/28/17PQ Group Holdings Inc United States IPO US .508Materials New York PQG 17.50 15.51 -11.37%
01/31/17Laureate Education Inc United States IPO US .490Consumer Products Nasdaq LAUR 14.00 11.13 -20.50%
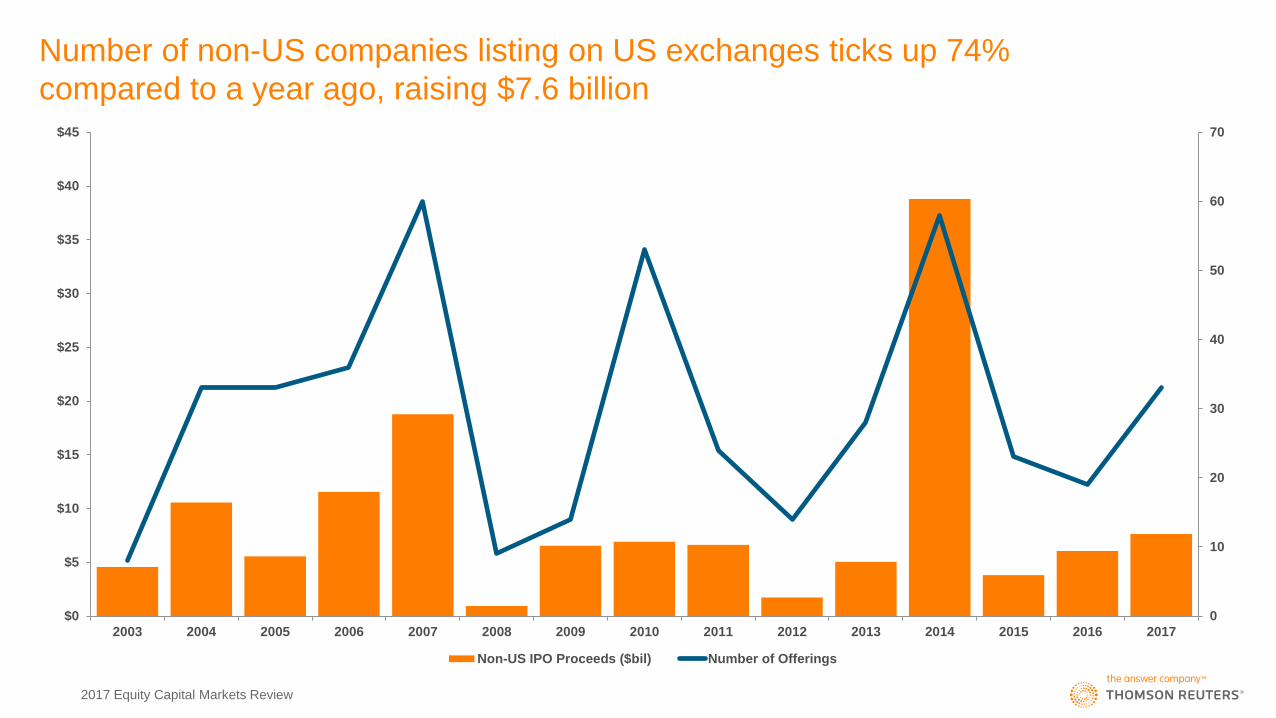
Number of non-US companies listing on US exchanges ticks up 74%
compared to a year ago, raising $7.6 billion
0
10
20
30
40
50
60
70
$0
$5
$10
$15
$20
$25
$30
$35
$40
$45
2003 2004 2005 2006 2007 2008 2009 2010 2011 2012 2013 2014 2015 2016 2017
Non-US IPO Proceeds ($bil) Number of Offerings
2017 Equity Capital Markets Review
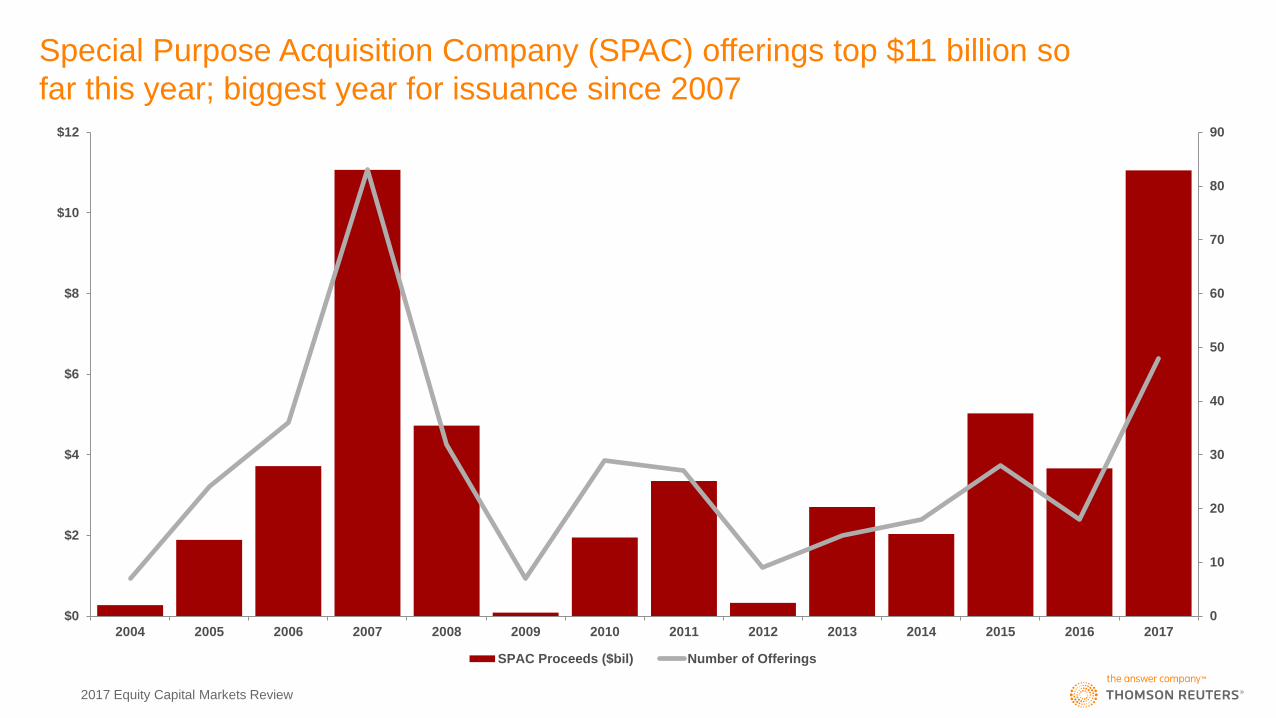
Special Purpose Acquisition Company (SPAC) offerings top $11 billion so
far this year; biggest year for issuance since 2007
0
10
20
30
40
50
60
70
80
90
$0
$2
$4
$6
$8
$10
$12
2004 2005 2006 2007 2008 2009 2010 2011 2012 2013 2014 2015 2016 2017
SPAC Proceeds ($bil) Number of Offerings
2017 Equity Capital Markets Review

US Block Trades account for two-thirds of follow-on activity this year, down from
52% during full year 2016, a year dominated by overnight energy trades
0%
10%
20%
30%
40%
50%
60%
$0
$50
$100
$150
$200
$250
2003 2004 2005 2006 2007 2008 2009 2010 2011 2012 2013 2014 2015 2016 2017
US Block Trades ($bil) Non-Block Trade Follow Ons ($bil) Block Trades a % of Total
2017 Equity Capital Markets Review
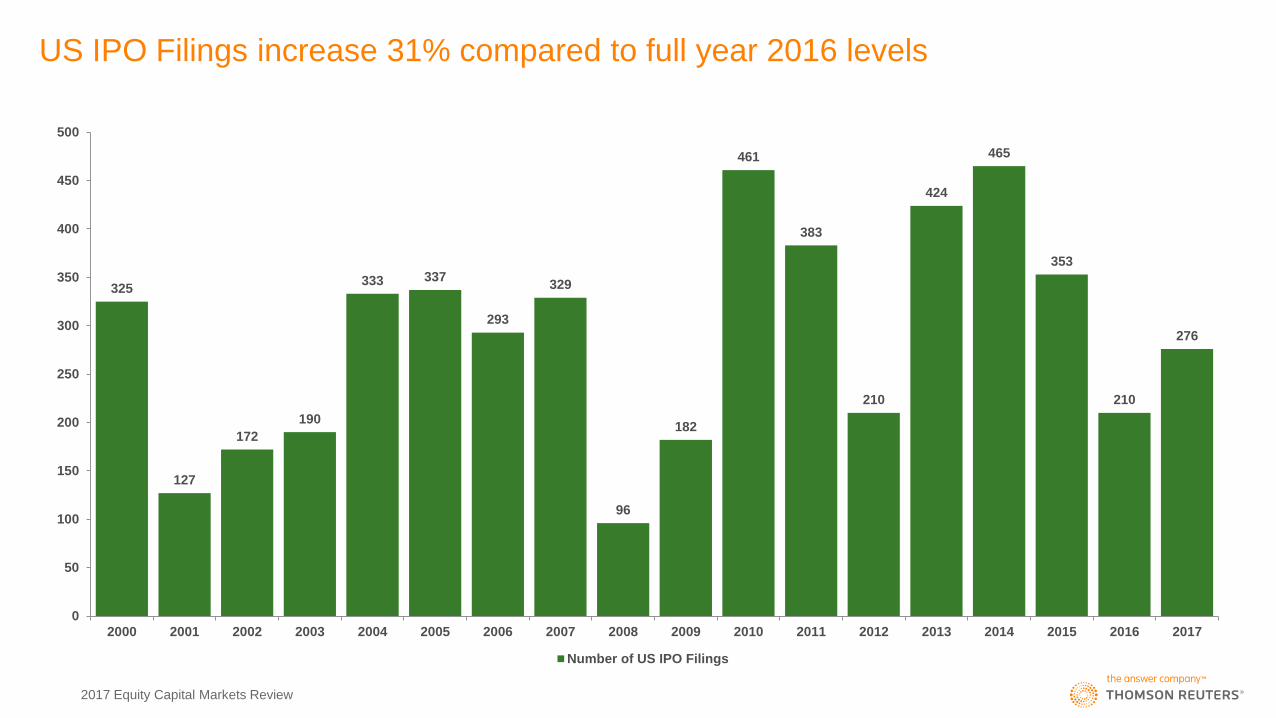
US IPO Filings increase 31% compared to full year 2016 levels
325
127
172
190
333 337
293
329
96
182
461
383
210
424
465
353
210
276
0
50
100
150
200
250
300
350
400
450
500
2000 2001 2002 2003 2004 2005 2006 2007 2008 2009 2010 2011 2012 2013 2014 2015 2016 2017
Number of US IPO Filings
2017 Equity Capital Markets Review

Over the past decade, the number of US listed IPOs average 142 offerings,
compared to 569 offerings in the 10 years from 1991-2000
0
100
200
300
400
500
600
700
800
900
1,000
$0
$20
$40
$60
$80
$100
$120
1990 1991 1992 1993 1994 1995 1996 1997 1998 1999 2000 2001 2002 2003 2004 2005 2006 2007 2008 2009 2010 2011 2012 2013 2014 2015 2016 2017
US listed IPO Proceeds ($bil) Number of Offerings
2017 Equity Capital Markets Review

The number of companies receiving venture capital investment in 2016
down 47% from 2000 high, Average time to exit at 7 years
2017 Equity Capital Markets Review
0
1,000
2,000
3,000
4,000
5,000
6,000
7,000
0.0
1.0
2.0
3.0
4.0
5.0
6.0
7.0
8.0
9.0
19
87
19
88
19
89
19
90
19
91
19
92
19
93
19
94
19
95
19
96
19
97
19
98
19
99
20
00
20
01
20
02
20
03
20
04
20
05
20
06
20
07
20
08
20
09
20
10
20
11
20
12
20
13
20
14
20
15
20
16
20
17
Average Time to Exit (Years) Number of Companies Receiving Venture Capital Investment
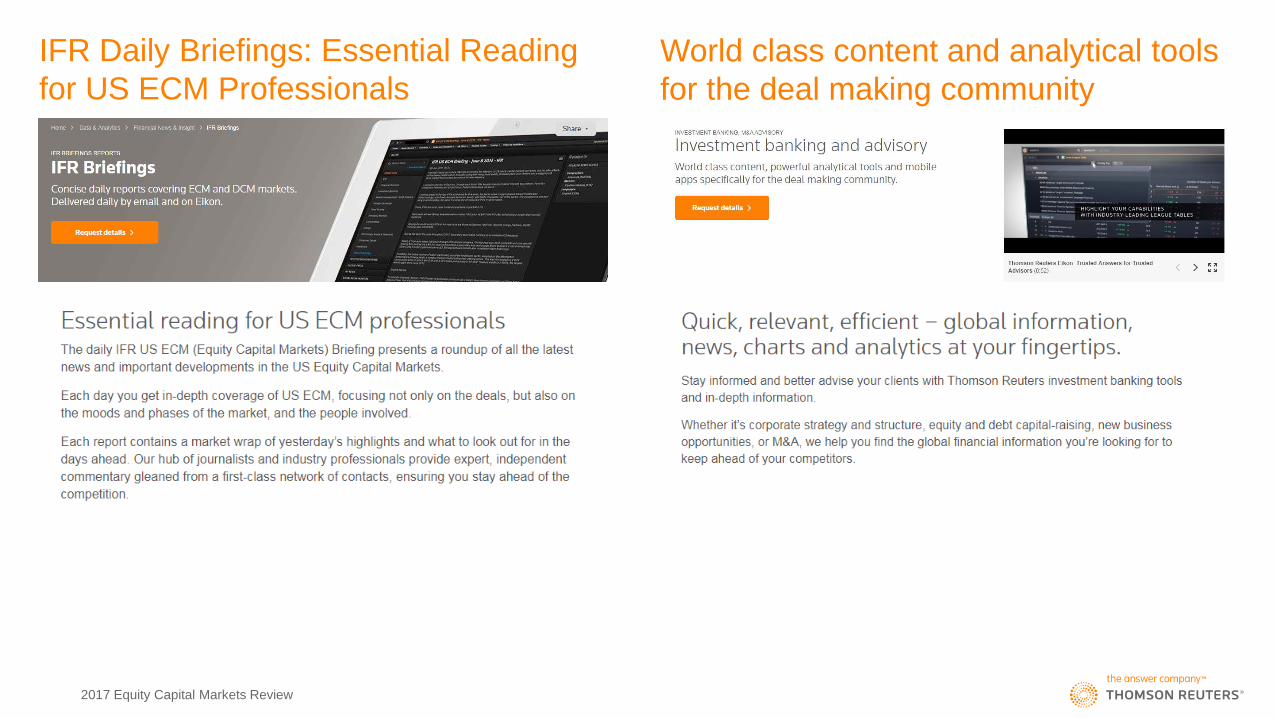
IFR Daily Briefings: Essential Reading
for US ECM Professionals
2017 Equity Capital Markets Review
World class content and analytical tools
for the deal making community