Embed Size (px)
Citation preview

Social and Economic Profile of Dublin 15
Conor Ryan, Research and Evaluation Officer, Blanchardstown Area Partnership
October 2012

20 THINGS YOU POSSIBLY DIDN’T KNOW ABOUT DUBLIN 15
101,032 persons live in
Dublin 15
3 of Irelands top 5
electoral divisions
youngest ages are in
Dublin 15.
26% of the overall
population is aged
below 15 years of age
57% of the population
is single
1,982 the numbers of
divorced persons in
Dublin 15
The average number of
persons living in each
household is 3.05
There are 1,273 families
with 6 or more persons
86% of households
have a personal
computer
There are more
caravans and mobile
homes (72) than bed
sits (32) in Dublin15
4,207 (12.2%) of
households have no
motor car
11,201 persons aged 5
and over walk to work,
school or college
39.8% of the
population aged 15
years and over whose
education has ceased
reported to have a 3rd
level qualification
43,535 persons are at
work, which represents
a 5% decline on the
equivalent employed in
2006
The labour market
participation rate in
Dublin 15 is 71.4%
Unemployment has
almost doubled, from its
2006 level of 9.7% to
18.4% today
There are now only 100
persons employed in
agriculture, forestry
and fishing compared
with 197 back in 2006
23.5% of the resident
population are non-
Irish nationals
9.5% of persons have a
disability
335 persons speak Irish
outside the education
system on a daily basis
73.2% of people
described themselves as
Roman Catholic. 6.2%
stated they had no
religion

CENSUS WORD CLOUD

Table of Contents
Acknowledgements 1
Background to the Blanchardstown Area Partnership 2
Chapter 1. A General Description of Dublin 15 4
Chapter 2. Statistical Highlights of the Report 7
Chapter 3. Areas of Relative Affluence and Deprivation 9
Chapter 4. Population growth 11 4.1 Population by sex and marital status
4.2 Age Structure of Population
4.3 Pre-School Population
4.4 Population 0-14 years
4.5 Population 65 years and over
4.6 Age dependency
4.7 Marital Status, Single people, Separated and Divorced
Chapter 5. Household Structure and Nature of Occupancy 17 5.1 Lone parents
Chapter 6. Education 20
Chapter 7. Social Class 22
Chapter 8. At work and unemployed 24 8.1 Labour Force Participation
8.2 Unemployment
8.3 Live Register
Chapter 9. Nationality and Ethnicity 28
Chapter 10. Disability and Carers 30
Chapter 11. Religion 31
Chapter 12. Ability to speak Irish and English 32
Chapter 13. Travel to work, school and college 32
Chapter 14. Other non-Census data sets 33
Appendices 34
Endnotes 68

List of figures
Figure 1 Population change in the catchment area of Blanchardstown Area Partnership
Figure 2 Populations of EDs
Figure 3 Population change in EDs
Figure 4 Gender profile of Dublin 15
Figure 5 Population by age and sex
Figure 6 Pre-school population
Figure 7 Percentage of population 0- 4 years
Figure 8 Population aged 0-14 years
Figure 9 Percentage of population aged 0-14 years
Figure 10 Population aged 65 and over
Figure 11 Percentage of population aged 65 years and over
Figure 12 Population by marital status
Figure 13 Type of occupancy 2011
Figure 14 Permanent private households by type of occupancy
Figure 15 Private households by type of accommodation
Figure 16 Number of lone parents all children <15 years of age
Figure 17 Percentage of lone parents all children <15 years of age
Figure 18 Educational attainment levels in Dublin 15
Figure 19 Percentage educational attainment levels
Figure 20 Percentage educational attainment in EDs
Figure 21 Speakers of foreign languages ability to speak English
Figure 22 Social class across Dublin 15
Figure 23 Percentage social class across Dublin 15
Figure 24 Social class in each ED
Figure 25 Total labour force constituents
Figure 26 Labour market participation rates
Figure 27 Total unemployed
Figure 28 Percentage of the workforce unemployed
Figure 29 Workers by industry
Figure 30 Usually resident population by nationality
Figure 31 Percentage of usually resident population by nationality
Figure 32 Usually resident population by ethnic or cultural background
Figure 33 Irish Travellers in Dublin 15
Figure 34 Population with a disability
Figure 35 Percentage of population with a disability
Figure 36 Population by religion
Figure 37 Speakers of foreign languages
Figure 38 Reported cases of homelessness
Figure 39 Total numbers of patients in treatment 2001-2006

Tables
Table 1 Areas of relative affluence and deprivation in BAPs catchment area
Table 2 Blanchardstown live register April 2012
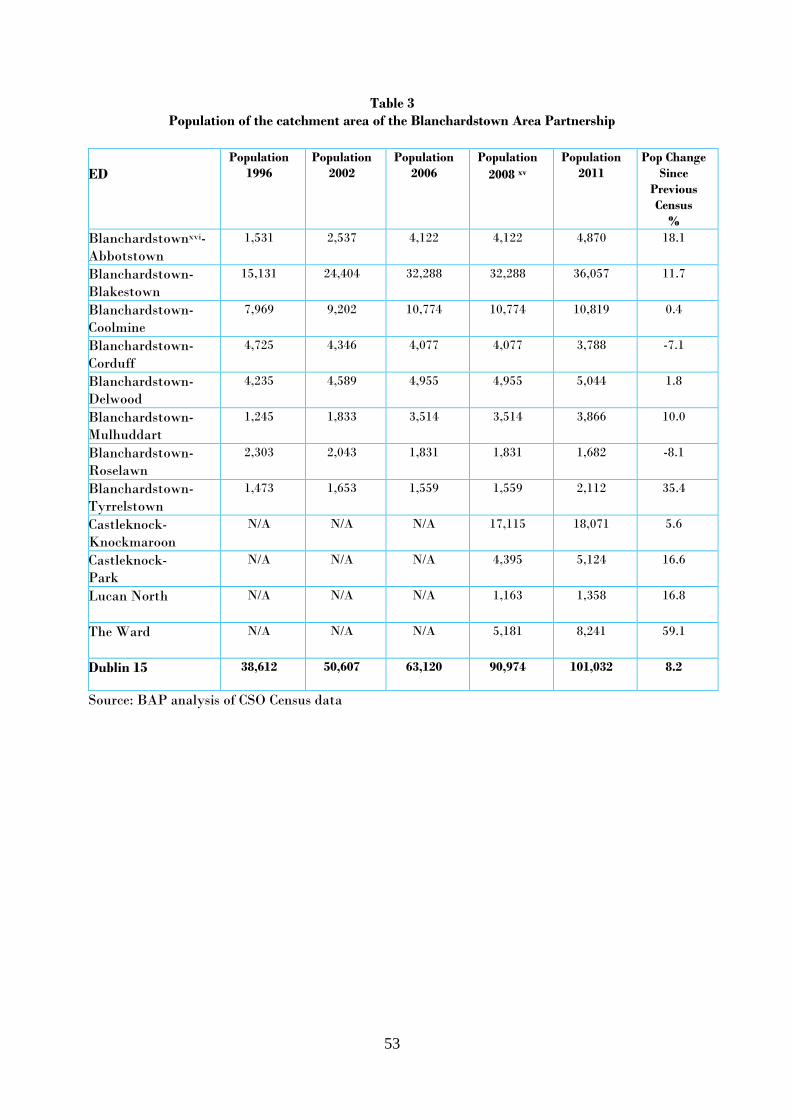
Table 3 Population of the catchment area of the Blanchardstown Area Partnership
Table 4 Gender Profile of Dublin 15
Table 5 Population aged 0-4 across Dublin 15
Table 6 Population aged 0-14 years of age
Table 7 Population aged 15-64 years of age
Table 8 Population aged 65 years and over
Table 9 Population aged dependency ratio
Table 10 Family units with children by type of family for children less than15 of age
Table 11 Lone parents for all children
Table 12 Educational attainment
Table 13 Education attainment %
Table 14 Usually resident population by nationality in Dublin 15
Table 15 Usually resident population of Irish and Foreign Nationals in Dublin 15
Table 16 Speaker of foreign languages by language spoken
Table 17 Speakers of foreign languages ability to speak English
Table 18 Irish Travellers
Table 19 Social class groupings
Table 20 Labour Force Participation Rates across Dublin 15
Table 21 Inter-censual changes in unemployment
Table 22 Labour force composition
Table 23 Blanchardstown Office Live Register
Table 24 Persons 15 + at work by industry
Table 25 Top 8 categories of employment by decline and increase in numbers employed
Table 26 Age categories of persons with a disability
Table 27 Carers aged 15 years and over classified by number of hours unpaid help per week
Table 28 Male carers aged 15 years and over classified by number of hours unpaid help per
week
Table 29 Female carers aged 15 years and over classified by number of hours unpaid help
per week
Table 30 % of People (15-64 years) reporting using an illegal drug
Table 31 Number of cases in treatment
Table 33 Reported cases of homelessness

Maps
Map 1 Ordnance Survey map of Dublin 15
Map 2 Relative affluence and deprivation of small areas in Dublin 15
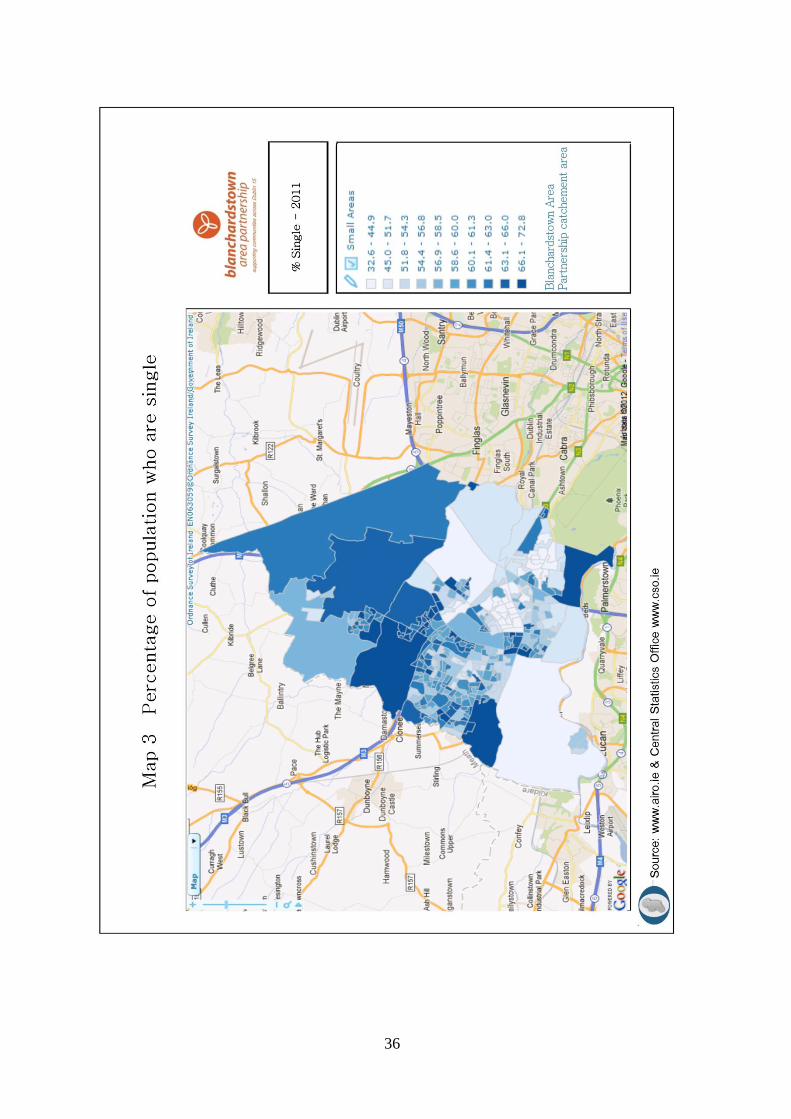
Map 3 Percentage of population who are single
Map 4 Percentage of population who are female
Map 5 Percentage of population 0- 14 years
Map 6 Percentage of population aged 65 years and older
Map 7 Percentage of households rent from the local authority
Map 8 Percentage of population with no formal education or primary education only as a
percent of population aged over 15 whose full-time education has ceased
Map 9 Percentage of population with a degree as a percent of population aged over 15
whose full-time education has ceased
Map 10 Social class 1 as a percent of total population
Map 11 Social class 7 as a percent of total population
Map 12 Unemployment rate 2011
Map 13 Percentage of population unable to work due to illness or disability
Map 14 Percentage of resident population who are non-Irish nationals
Map 15 Percentage of population who have a disability 65 years and over
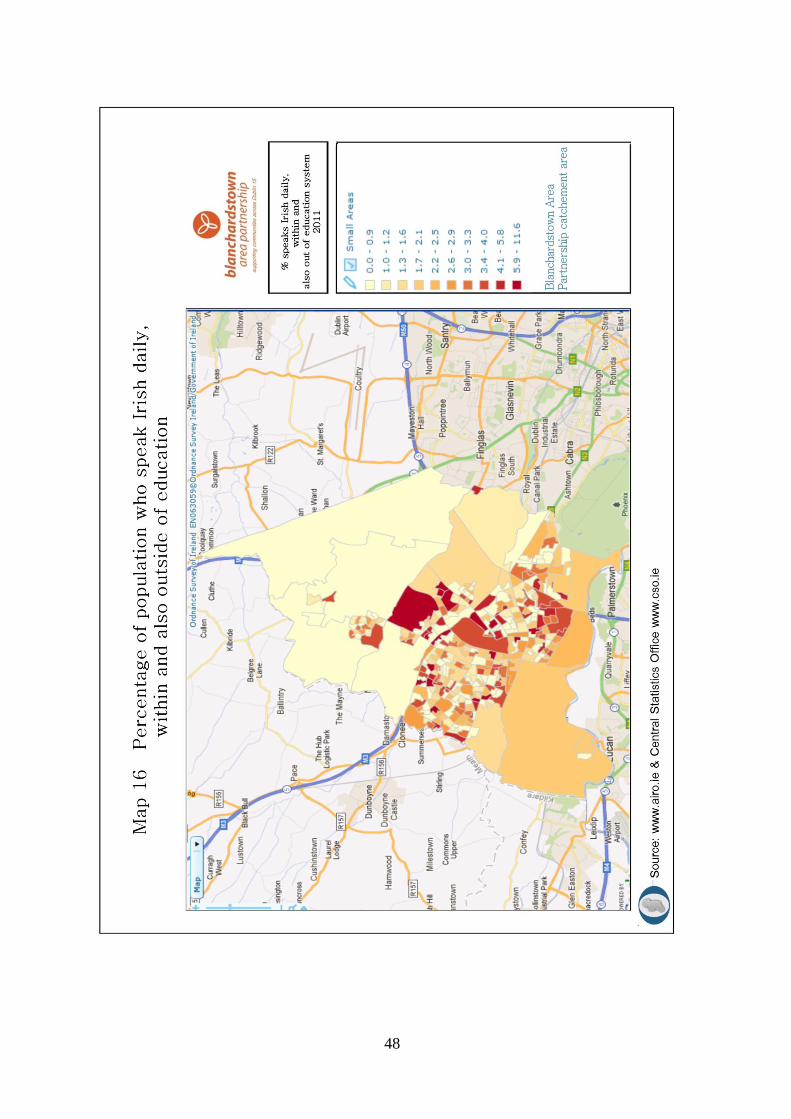
Map 16 Percentage of population who speak Irish daily, within and also outside of
education
Map 17 Percentage of people who travel to work, school or college by car
Map 18 Percentage of people who travel to work via train
Map 19 Lone parents for all children
Map 20 RAPID

Glossary
AIRO All- Island Research Observatory
BAP Blanchardstown Area Partnership
BLDTF Blanchardstown Local Drugs Task Force
CODAN County Dublin Area of Need
CSO Central Statistics Office
DART Dublin Aerial Rapid Transport
DECLG Department of Environment, Community and Local Government
ED Electoral Division
HPU Homeless Persons Unit
LCDP Local and Community Development Programme
LDC Local Development Company
LES Local Employment Service/ JOBLINK
NIRSA National Institute of Research and Spatial Analysis
OSI Ordnance Survey of Ireland
POBAL Formerly Area Development Management Ltd
RAPID Revitalising Areas by Planning Investment and Development
SAPS Small Area Population Statistics
TÚS A community work initiative

1
Acknowledgements
The All Island Research Observatory (AIRO) is the official mapping agent on behalf of the Central
Statistics Office for Census 2011 and is ‘a research unit and interactive spatial data portal based in
the National University of Ireland, Maynooth. Under the guidance of the National Institute for
Regional and Spatial Analysis (NIRSA) and the National Centre for Geo-computation (NCG),
AIRO has been funded by the Higher Education Authority under Cycle Four of the Programme for
Research in Third Level Institutions (PRTLI4). AIRO also acts as an integral resource for the Irish
Social Science Platform (ISSP)’.i
The Blanchardstown Area Partnership would like to thank AIRO and in particular Justin Glesson
and Aoife Dowling, for embedding the new 2011 Census data www.airo.ie/airo on the organisations
website. The intention of doing so is to facilitate individuals, community organisations and
statutory bodies to interact with Census data in a newly improved and dynamic way. Last year
over 11,000 hits were registered on BAPs website.
Blanchardstown Area Partnership would also like to thank Claire Moran, a participant on the TÚS
scheme ii for helping extract maps from instant atlas and cropping images on the front page.

2
Background to the Blanchardstown Area Partnership
Established in 1995, Blanchardstown Area Partnership (BAP) is the Local Development Company
for Dublin 15, and now provides access to the Local and Community Development Programme
(LCDP) and the Local Employment Service (LES/JOBLINK) to people who are at risk of social
exclusioniii and consistent and relative poverty.iv As such it is responsible for a range of
programmes to help meet the needs of individuals, families and communities in the area. The
LCDP has 4 Goals that are designed to counter disadvantage and to promote equality, social and
economic inclusion. The L&CDP is managed by POBAL (formerly ADM) on behalf of the
Department of Environment, Community and Local Government.
The original catchment area of the Blanchardstown Area Partnership from 1995-2007 was
Blanchardstown. This geographical area consists of eight Electoral Divisions (EDs), four of which-
Tyrrelstown, Mulhuddart, Corduff and Coolmine - were designated as disadvantaged (CODAN,
1994). As part of the Cohesion process completed in January 2008, a further four EDs are now part
of BAP’s enlarged catchment area, including The Ward, Lucan North, Castleknock-Park and
Castleknock-Knockmaroon (See map 1). As a result BAP now covers the whole of Dublin 15 and
some small pockets of Dublin 7 and 11. v
Vision, Mission and Values of Blanchardstown Area Partnership
Our Vision for Dublin 15 is that it will be a place where “every member of the community is valued;
where education and training are provided to meet the needs of each individual; where there is a
job for everyone who seeks employment and employment supports are available to those who
require them; people live in a safe and secure environment, and the diversity of the population is
accepted by all”.
Our pivotal role in bringing together stakeholders, identifying appropriate responses and piloting
new ideas and programmes will be to the fore in achieving the vision set out above. Our ability to
work in collaboration with all stakeholders is particularly important in the changing environment
and especially in the area of developing swift responses to changing needs.
Our Mission is “to bring people together to create a better place to live, work and grow”
This mission was created at the joint session of Board and staff in June 2007, and reflects the aim
that Dublin 15 will be a place in which everyone can progress at the most appropriate pace for
them. The inclusion of the words “to grow” reflect the strong emphasis on providing progression
routes into education and training for the most marginalised in society, for whom that first step is
vital.
We are fully committed to our role as the lead agency promoting social inclusion in Dublin 15. In
collaboration with key stakeholders, we are well placed to achieve this because of our existing
strong record of achievement in relation to the following areas:
Delivering innovative and effective responses to labour market exclusion
Co-ordinating social inclusion measures
Building sustainable communities
Positive engagement with community change

3
Blanchardstown Area Partnership is mandated by the government to support particular target
groups under the guidelines of LCDP.vi Data on certain target groups of this programme has
traditionally not been gathered though the national. Because of this, agency data takes on
additional importance in helping provide a greater insight into the challenges confronting all
agencies in tackling social exclusion. This report will not rely exclusively on Census data as it will
be supplemented by data sourced from local agencies, which operate exclusively within Dublin 15
or certain neighbourhoods of it e.g. Blanchardstown Local Drugs Task Force and the Health
Services Executive Homeless Persons Unit.
As a note of caution, relying solely on percentages can easily often lead to misinterpretation. In an
attempt to minimise this risk, Census data is presented in column figures (by whole numbers and
percentages) and displayed in tabular format in the appendices. These may be referenced alongside
the narrative to make fuller sense of Census data discussed in the body of the report. In addition a
sequence of maps that display data at a new level of geography (small areas) can also viewed in the
appendices. These maps have been released to BAP by the National Institute of Research and
Spatial Analysis (NIRSA) based at National University of Maynooth via the AIRO website.
NIRSA in collaboration with the Central Statistics Office have mapped the 2011 Census data. The
public may access instant atlas software from BAP’s website at www.bap.ie/airo to create and
download their own maps at this new level of Census geography alongside electoral divisions.

4
Chapter 1. A General Description of Dublin 15
Dublin 15 is geographically located approximately 10 kilometres north-west of Dublin City Centre
and consists of 12 electoral divisions (EDs).vii Over the past decade the area has served as a main
hub for Dublin’s enlarged population. According to the 2011 National Census there are 101,032
persons now living in Dublin 15.
The Dublin 15 postal district has expanded into townlands such as Parslickstown, Porters Gate,
Castaheany, Littlepace, Ongar, Waterville and Tyrrelstown Estate. (Please refer to the Ordnance
Survey map on page ) A list of all the estates and parishes that fall within Dublin 15 is presented
overleaf.
Dublin 15 is a very young, diverse and multi-ethnic suburb of Dublin as accentuated in the
statistical highlights section of this report. Within this geographical area however, there are
significant variations in educational attainment levels, social class, employment and housing
structure. The inclusion of colourful maps depicting Census data at small areas is intended to help
visually portray these factors.
In relation to public and civic amenities, the area can now boast the presence of:
The Civic Centre opened in 2001 consisting of a theatre (Draoicht) and a library
Connolly Memorial Hospital
The Institute of Technology Blanchardstown
The FAI Centre of Excellence
The National Aquatic Centre
Corduff’s new Sports Centre and new Fingal Resource Centres in Ongar, Scribblestown and
Tyrrelstown
Amongst the natural amenities the area has to offer are the
Millennium and Phoenix Parks
Tolka Valley Park and the Royal Canal

5
Parishes, large estates and landmarks that fall into 12 EDs of Dublin 15
Electoral Division Parishes and Estates
Abbotstown Millstead St Mary’s Park
Waterville St Joseph’s
River Road Dunsoghly
Woodpark Basket Square
Talbot Downs/Court Tory Square
Waterville Cappagh Hospital
Herbert Road Connolly Hospital
Marine Institute National Aquatic Centre
Blakestown Hartstown Castlewood Pinebrook
Huntstown Inglewood Hazelbury Green / Park
Rusheeney Little Pace Portersgate
Huntersrun Rosedale Clonsilla Village
Aldemere Westhaven Charnwood Ashfield
Portersgate Stonebridge Deerhaven Briarwood
Lohunda Park Manorfields Bramblefield Annely
St. Jospeh’s Hospital Castaheany Linnetfields Stralem
Ongar Park Ongar Village Delhurst Hansfield
Castlefield Woods/Park/Court Swallowbrook`
Coolmine Whitechapel/ Mountview Estate Summerfield
Whitestown/ Sheep more Estate Westland Village
Fortlawn Estate Aspen Wood
Blakestown Way Limelawn Park
Lohunda Downs Coolmine Cottages
Blanchardstown Town Centre Sorrel Park
Springlawn Verdemont
Broadway Road Porters Road
Orchard Grove
Corduff Corduff Sheephill
Edgewood Brookhaven
Ashling Heights
Delwood Delwood Estate St Mochtas
Glenville Estate Coolmine Close
The Courtyard Coolmine Green
Brompton Estate Coolmine Woods
Kirkpatrick Rockfield Estate
Mulhuddart Dromheath Estate Castlecurragh Heath
Warrenstown Castlecurragh Park
Blanchardstown Heath Mulhuddart Wood
Buzzardstown House Institute of Technology

6
Roselawn St Brigid’s Park St Brigid’s Cottages
Rushmore Clonsilla Close
Clonsilla Park Roselawn Close
Roselawn Drive Roselawn Park
Roselawn Court Roselawn Way
Tyrrelstown Wellview Estate Damastown Court
Parslickstown Estate
Castleknock ParkMorgan’s Place Asheigh Green/Grove
Hawthorn Lodge/ Lawn Beechpark Avenue/Lawn
Castleknock Park The Pines
Stockton Court/ Green/ Place / Park
Auburn Green / Close / Drive
Phoenix Drive / Avenue/
Deerpark Drive / Close/ Lawn
Chesterfield Corse/ Avenue/ View
Castleknock Annfield Drive/Court/Crescent
Knockmaroon Woodbrook Crescent / Court/ Square / Hall
Riverwood Place/ Heath
Fernleigh Grove/ Lawn/Drive Luttrell Park Warren Park
Luttrelstown Wood/Drive/Heath/ Park/ Dale/Chase
Bramley View / Park/ Way/ Crescent/Avenue
Carpenterstown Park / Green / Walk
Laverna Dale / Avenue/ Way/ Grove
Cherry Place / Drive/ Avenue/ Lawn
Maple Drive/ Close/ Lawn
Oaktree Grove/ Drive/ Green
Castleknock Drive/ Orange/ Vale/ Avenue/ Dale
Georgian Village Farmleigh Woods
College Wood / Grove Castleknock College
Park Avenue/ Park Drive/ Crescent
Lucan North Laraghcon Luttrelstown Golf Course
Westmanstown Golf Course Clonaboy House
The Ward Ballentree Bishop’s Orchard
Bealing Belgree
Mount Garrett Cruise Park
Tyrrelstown House Cappogue Cottages
St Philomena’s Hollystown Golf Course
Hollystown Park Redwood
The Oaks Cloghran House

7
Chapter 2. Statistical Highlights of the Report
Strong population growth continues
Census 2011 results show that Dublin 15’s population has continued to grow strongly since Census
2006, increasing by 10,058 persons to 101,032 persons. This represents an increase of 11.1% over
the 5 year inter-censul period, an annual increase of 2.2%. Ireland’s population increased by 8.2%
since 2006 in contrast.
Population by sex and marital status
There are 51,432 females and 49,600 males in Dublin 15. As a result there are 1,832 more females
resulting in an overall sex ratio of 0.964. Due to higher male birth rates there were more males
than females in the younger age groups. However, the reverse is the case at the upper end of the
population where there were a higher proportion of females because of lower mortality rates. 57%
of Dublin 15s population is single and there are 1,982 divorced persons.
Age structure and dependency
Three of Ireland’s top five youngest EDs are in Dublin 15- Blanchardstown-Mulhuddart, 26.6,
Blanchardstown Tyrrelstown 26.1 and The Ward 25.7 years. 26% of the overall population is aged
less than 15 years of age. Another distinguishing feature is the low proportion of retired persons
with just 4.8% of its population aged 65 and over. This is considerably less than the national
average of 11.7%. Dublin 15’s overall age dependent population rose from 27.4% five years ago to
30.9% in 2011.
Housing and family structure
The trend emerging in Dublin 15 over the past five years is a continuance towards smaller
households, a further decline in the proportion of traditional nuclear families, an increase in female
and male single parent households and increasing numbers of single persons sharing a dwelling.
Household occupancy rates fell marginally from 3.1 per household in 2006 to 3.05 in 2011. Lone
parents for all children < 15 years of age now also account for 22.6% of all households.
Educational attainment
There has been an improvement in educational attainment amongst adults in Dublin 15 over the
past 5 years for some levels of education. The percentage of the overall population for instance
who reported to have no formal or primary education fell to 9.4%. The percentage of Dublin 15
overall population who have a reported third level qualification fell from 42.3% to 39.8%. The
later finding may be an indicator of selective emigration or the ‘brain drain’ effect.
Social class composition
According to the 2011 Census, 38.1 % of the population in Dublin 15 was higher and lower
professionals or social classes 1 and 2, in comparison to 34.6% for Ireland. 13.7% of Dublin 15s was
categorised as skilled manual or social class 4 and 18.1% in social class 7. The later is unclassified
and includes those who have never been in paid employment or who live in households where the
head has never been in paid employment.

8
Labour market characteristics
Since 2006 the total number of people at work in Dublin 15 decreased by 5% to 43,535. The largest
percentage decline (66.7%) occurred in the building and construction sector. Due to a fall in the
number of persons at work, the labour market participation rate fell from a peak of 73.3% in 2006
to 71.4% in 2011. The level of unemployment across Dublin 15 based on the principal economic
status almost doubled from 9.7% to 18.4% of the labour force in 2011 slightly higher than the
Dublin rate of 17.4%. The average level of unemployment levels rate for Dublin 15 disguises the far
higher rates of unemployment that prevail in several neighbourhoods such as Tyrrelstown 43.7%
and Corduff 29.3%. The unemployment rate in Ireland also increased sharply from 8.5% to 19%.
Nationality and ethnic mix
Non-Irish nationals in Dublin 15 now account for 23.5% of all residents, which is almost double the
State average of 12%. Citizens from ‘rest of the world’ (9,393), ‘other EU 27’ (5,678) and Poland
(4,448) represented the largest numbers of foreign nationals resident in Blanchardstown. The
Census also enumerated 658 Irish Travellers living within Dublin 15. The age profile of the
Traveller community in Blanchardstown differs markedly from that of the general population.
Disability
According to the 2011 Census, 9.5% of Dublin 15’s population has a disability compared with 13%
of the national population. The actual number of persons with a disability recorded was 9,544, up
from 5,485 persons in 2006. Roselawn ED has the highest percentage of persons with a disability
(15.5%) whereas The Ward recorded the lowest (6.3%).
Religion
73.2% of people in Dublin 15 described themselves as Roman Catholic, 18.4% stated other
religion, 6.2% stated they had no religion and 2.2% not stated.
Travel to work, school or college
The most common means of transport by which persons age 5 and over travel to work, school or
college is by driving a car (40.7%). A further 13.5% do so as a passenger in a motor car. 16.8%
walk, and 6.1% take the train, DART or the Luas.
Language Skills
36.2% of people (34,161) in Dublin 15 speak Irish. The ED, where people had the highest
proficiency of Irish was Castleknock Park (50.3%). The actual numbers of persons in Dublin 15
who speak the language daily outside of the educational system was 335. For the first time in a
national Census, speakers of foreign languages ability to speak English was asked of household
respondents. According to the results 4,397 persons in Dublin 15 claim to speak English ‘not well’
or ‘not at all well’.

9
Chapter 3. Areas of Relative Affluence and Deprivation
Inequality and disadvantage remains a feature of life in Ireland today. Haase and Pratschke
developed an index that provides a single measurement of the relative affluence and deprivation for
an area. The deprivation scores range from -50 to 50 with -50 being extremely deprived and 50
being extremely affluent. The score for the 12 electoral divisions, which are D15 was … and for
2011 stood at . (DATA NOT YET RELEASED)
Demographic Profile is measured using 5 indicators:
the percentage increase in population over the previous five years
the percentage of population aged under 15 or over 64 years of age
the percentage of population with a primary school education only
the percentage of population with a third level education
the percentage of households with children aged under 15 years and headed by a single
parent
the mean number of persons per room
Social Class Composition is measured using 5 indicators:
the percentage of population with primary school education only
the percentage of population with a third level education
the percentage of households headed by professionals or managerial and technical
employees, including farmers with 100 acres or more
the percentage of households headed by semi-skills or unskilled manual workers, including
farmers with less than 30 acres
the mean number of persons per room
Labour Market Situation is measured using four indicators:
the percentage of households headed by semi-skilled or unskilled manual workers, including
farmers with less than 30 acres
the percentage of households with children aged under 15 years and headed by a single
parent
the male unemployment rate
the female unemployment rate

10
Table 1
Areas of Relative Affluence and Deprivation 2006-2011
ED 2011 2006 Change in
Absolute Index
Score
2006-2011
Relative
Deprivation
Rank
Blanchardstown-
Abbotstown
5.39 1.63 3.76 N/A
Blanchardstown-
Blakestown
2.65 7.72 -5.07 N/A
Blanchardstown-
Coolmine
-3.88 -6.12 2.24 N/A
Blanchardstown-
Corduff
-10.94 -9.25 -1.69 N/A
Blanchardstown-
Delwood
6.38 9.45 3.07 N/A
Blanchardstown-
Mulhuddart
-3.63 -3.82 .19 N/A
Blanchardstown-
Roselawn
2.61 10.07 -7.46 N/A
Blanchardstown-
Tyrrelstown
-13.61 -19.83 6.22 N/A
Castleknock-
Knockmaroon
12.28 19.30 -7.02 N/A
Castleknock Park 17.27 21.17 -3.9 N/A
Lucan North 14.96 25.04 -10.08 N/A
The Ward 7.68 12.4 -4.72 N/A
Dublin 15 ? ? ?
Based on this index, Tyrrelstown experienced a deprivation score within the classification of
“Disadvantaged” while Coolmine, Corduff and Mulhuddart are classified as “Marginally Below
Average”. Where large spatial concentrations of deprivation exist they have been designated by
government as RAPID areas, in Dublin 15 there include all or part off the above EDs (See map 20
appendix).viii Abbotstown, Blakestown and Delwood are now categorised as “Marginally Above
Average”. Roselawn and Castleknock Knockmaroon are categorised as “Affluent” while Lucan
North and Castleknock Park are categorised as “Very Affluent”.

11
Chapter 4. Population growth
Changes in the national population are influenced by four factors- births, deaths, immigration and
emigration. The natural increase consists of births less deaths. Census 2011 results show that
Dublin 15’s population has continued to grow strongly since Census 2006, increasing by 10,058
persons to 101,032 persons. This represents an increase of 11.1% over the 5 year inter-censul period,
an annual increase of 2.2% (See table 3). The Ward recorded the fastest growth of all the EDs of
59.1%, while Blakestown’s population increased by 3,769 persons the largest in whole numbers. In
contrast the population of two EDs actually fell, Roselawn by 8.1% and Corduff 7.1% respectively.

12
4.1 Population by sex and marital status
When discussing the principal demographic changes of Dublin 15 it is essential to examine the age
structure of the population. According to the Central Statistics Office, ‘up to the mid-1980’s the
trend was for more women than men in the State... Since the mid-1980s the overall trend has
reversed with a tendency for there to be slightly more females’ (2012, Profile 2,p9). In Ireland
today however, there is now a slightly higher proportion of females than males reversing the
situation.
In Dublin 15 there are similarly more females (1,832) than males resulting in an overall male /
female sex ratio of 0.964. Due to higher male birth rates there were more males than females in the
younger age groups. However, the reverse is the case at the upper end of the population where
there were a higher proportion of females because of lower mortality rates. (See population
pyramid).
4.2 Age Structure of Population
A remarkable feature about Dublin 15 is its high youth population with an average age of 30.9
years. Three of Ireland’s top five electoral divisions-youngest ages are in BAP’s catchment area
Blanchardstown-Mulhuddart, 26.6, Blanchardstown Tyrrelstown 26.1 and The Ward 25.7 years.
The average age of Fingal is 32.8 while the State's average age is 36.1, as per Census 2011 results.

13
4.3 Pre-School Population (0-4year olds)
The proportion of overall population in the 0-4 year’s age cohort was 10.5% (see table 5). An
additional 1,317 pre-school children are now part of a family compared with 2006. This increase in
the pre-school population will place additional pressures on the local community and private
childcare crèches. The Ward experienced the largest single increase in 0-4 year olds (+571) and
now has the highest percentage (15.9%) of pre-school children. Roselawn on the other hand has the
lowest percentage (3%). Blakestown contains the highest numbers but this is to be expected given
that it is the most populous ED in Dublin 15 and indeed the Republic of Ireland.
14
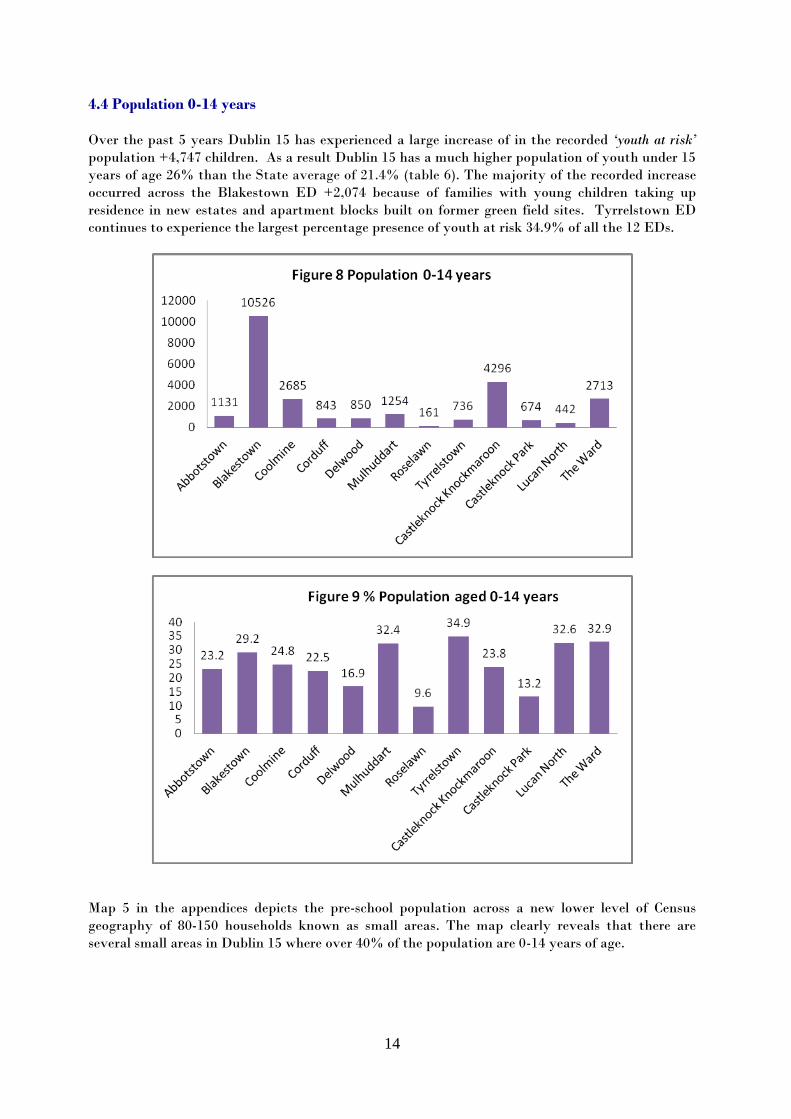
4.4 Population 0-14 years
Over the past 5 years Dublin 15 has experienced a large increase of in the recorded ‘youth at risk’
population +4,747 children. As a result Dublin 15 has a much higher population of youth under 15
years of age 26% than the State average of 21.4% (table 6). The majority of the recorded increase
occurred across the Blakestown ED +2,074 because of families with young children taking up
residence in new estates and apartment blocks built on former green field sites. Tyrrelstown ED
continues to experience the largest percentage presence of youth at risk 34.9% of all the 12 EDs.
Map 5 in the appendices depicts the pre-school population across a new lower level of Census
geography of 80-150 households known as small areas. The map clearly reveals that there are
several small areas in Dublin 15 where over 40% of the population are 0-14 years of age.

15
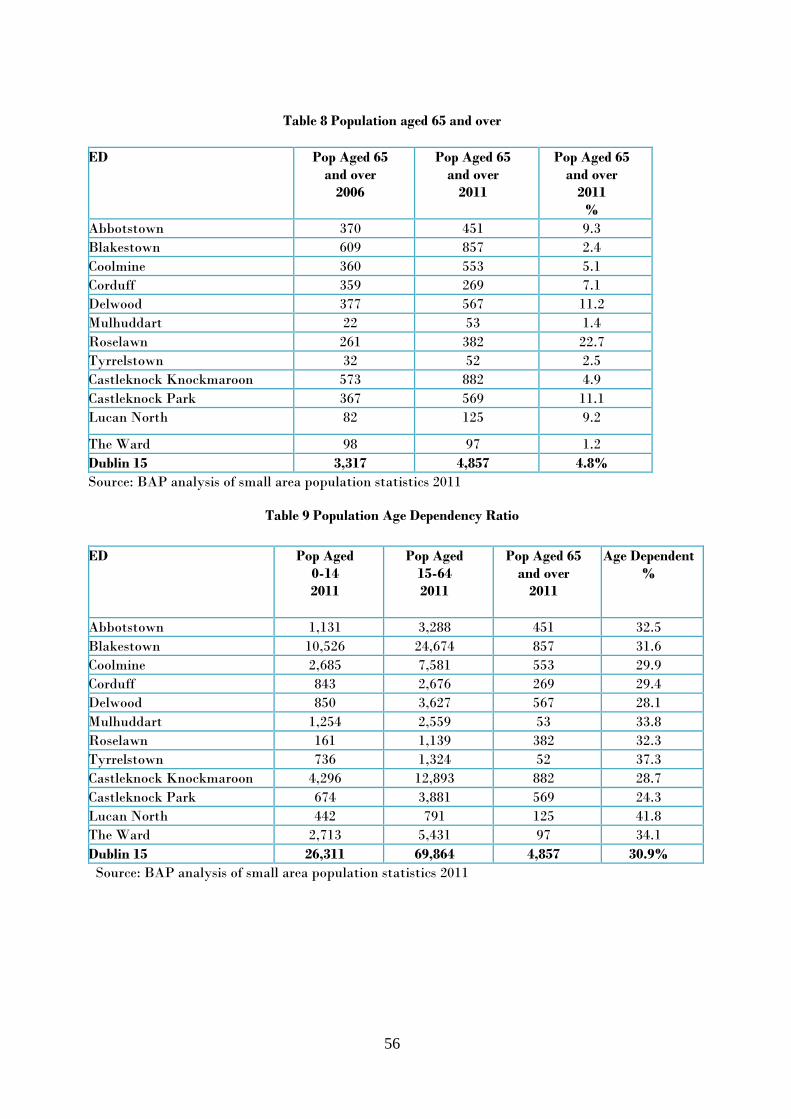
4.5 Population 65 years and over
A distinguishing aspect of Dublin 15’s demographics is also the low proportion of persons aged 65
and over. 4.8% of its population are aged 65 and over, which is considerably less than the national
average of 11.7%. Roselawn ED has the highest percentage of residents aged 65 and over (22.7%)
whereas The Ward has the lowest at just 1.2%. Blakestown ED (+248) experienced the single
largest increase of people entering general retirement age from the 2006 Census (See table 8). Map 6
on the other hand captures this demographic feature across the small areas, which shows very
clearly that are some estates where a higher concentration of older persons live.

16
4.6 Age Dependency
The percentage age dependency in a population can be used as a comparative indicator of the
proportion of the population which those employed or potentially economically employed have to
support. The dependency ratio therefore refers to the proportion of dependents who are either
under 15 and over 65 years of age. Dublin 15’s age dependent population rose from 27.4% five
years ago to 30.9% in 2011, slightly lower than the national figure of 33%. The age dependency
ratios were highest in Lucan North 41.8% and the disadvantaged ED of Tyrrelstown 37.3% (See
table ).
4.7 Marital Status, Single people, Separated and divorced
Regarding marital status 57% of Dublin 15’s population are single (See map 3), 37% are married
and 2% are widowed. There are 1,982 divorced persons.

17
Chapter 5. Household Structure and Nature of Occupancy
The trends emerging over the past five years in Dublin 15 are a continuance towards smaller
households, a further decline in the proportion of traditional nuclear families, an increase in female
and male single parent households and increasing numbers of single persons sharing a dwelling.
Household occupancy rates fell marginally from 3.1 per household in 2006 to 3.05 in 2011.
Owner occupied dwellings with mortgage (47.2%) continue to be the most prevalent occupancy
status as demonstrated in figure 13 followed closely by persons who rent from a private landlord
(43.2%) whereas only 6.1% are rented from the local authority. The highest concentrations of local
authority housing are found in Tyrrelstown ED (53%).
There have also been some significant changes occurring in terms of the ‘mix’ of private households
built by property developers and housing associations in Blanchardstown. Developers are
increasingly moving away from building semi-detached housing stock to higher density units. Even
though the vast majority of private households (81.4%) continue to be of a traditional Irish style
residential house and bungalow, the past decade has witnessed a large increase in the provision of
18
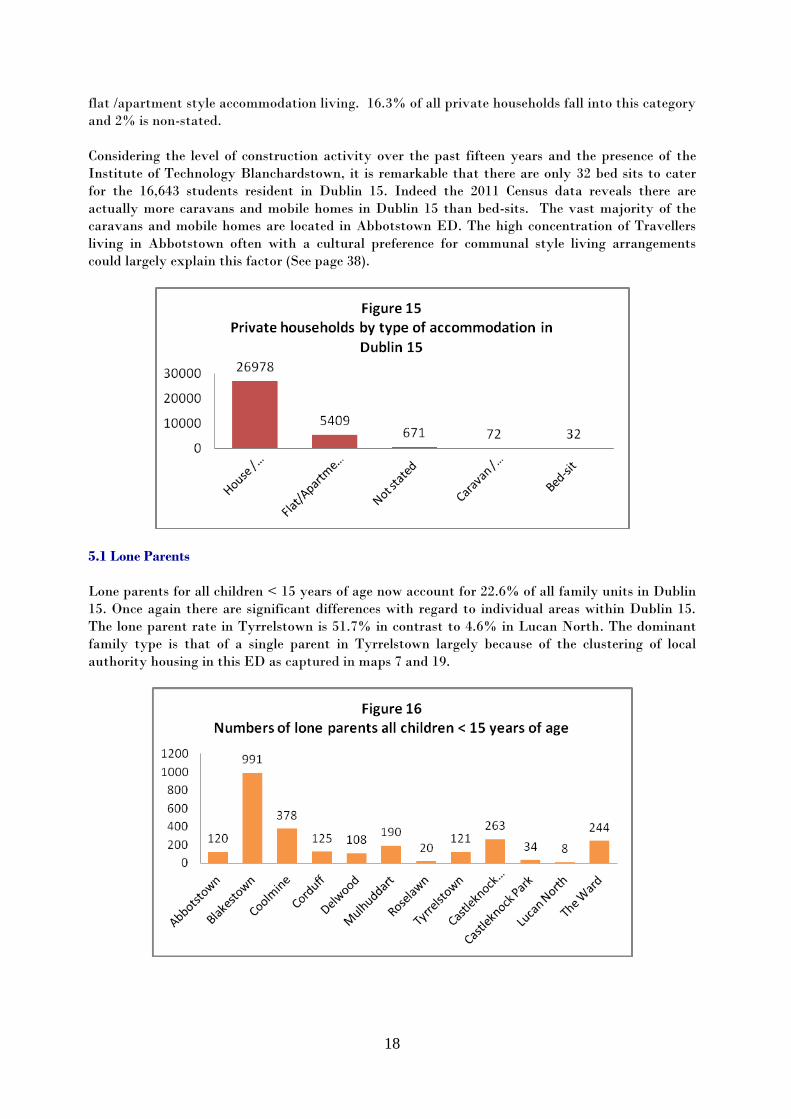
flat /apartment style accommodation living. 16.3% of all private households fall into this category
and 2% is non-stated.
Considering the level of construction activity over the past fifteen years and the presence of the
Institute of Technology Blanchardstown, it is remarkable that there are only 32 bed sits to cater
for the 16,643 students resident in Dublin 15. Indeed the 2011 Census data reveals there are
actually more caravans and mobile homes in Dublin 15 than bed-sits. The vast majority of the
caravans and mobile homes are located in Abbotstown ED. The high concentration of Travellers
living in Abbotstown often with a cultural preference for communal style living arrangements
could largely explain this factor (See page 38).
5.1 Lone Parents
Lone parents for all children < 15 years of age now account for 22.6% of all family units in Dublin
15. Once again there are significant differences with regard to individual areas within Dublin 15.
The lone parent rate in Tyrrelstown is 51.7% in contrast to 4.6% in Lucan North. The dominant
family type is that of a single parent in Tyrrelstown largely because of the clustering of local
authority housing in this ED as captured in maps 7 and 19.

19
Lone parents are not a homogeneous group but include many different types of family involving
unmarried, separated or widowed parents (male and female) bringing up children alone. Research
suggests lone parent households on average have a higher than average risk of poverty, and single
mothers have the lowest incomes (Millar, 1992; Nolan and Callan, 1994), and that there is a
tendency for early school leaving and a concentration of low educational qualifications exists
among young single mothers (National Economic and Social Forum, 1997). Unfortunately in many
of the EDs where there are large concentrations of single parents the local service provision is poor,
which only further isolates lone parents residing there. The lack of affordable childcare can result
in lone parents finding it more difficult to access employment, training, and personal development
programmes thereby marginalising them even further.

20
Chapter 6. Education
Formal education is provided in primary and secondary schools and the Institute of Technology
Blanchardstown in Dublin 15. County Dublin Vocational Education Committee also provides a
range of courses through local community centres. Students living in Dublin 15 are also accessing
third level educational opportunities elsewhere at NUI Maynooth, Dublin City University and
University College Dublin and Post Leaving Certificate courses in Dunboyne and the Liberties.
The proportion of the population aged over 15 and whose education has ceased who reported to
have no formal or primary education fell from 10.2% to 9.4% in 2011. This is lower than the
Dublin equivalent of 14.1% or the national figure of 16%. There are wide variations nonetheless in
the spatial distribution of educational attainment across Dublin 15. For instance 24.4% of adults
in Corduff have no formal or primary education only compared with just 3.7% in Lucan North (See
table 13).
The percentage of Dublin 15s overall population who reported to have a third level qualification
fell from 42.3% to 39.8%. Although there was a decline it is still the case that a greater percentage
of adults in Dublin 15 still have a third level qualification than their counterparts in Dublin or in
the State. Within the catchment area of BAP, residents in Castleknock Park had the highest level
of education 60%, in contrast to Tyrrelstown where 12.7% reported a third level qualification.
The 2011 Census reveals that an individual’s probability of experiencing unemployment is
considerably reduced the higher the level of education attained. The progression from primary
education through the education cycle including third level results in a pattern of decreasing risk of
unemployment for men and women. The risk of unemployment is significantly higher for a person
with only a primary education than for someone who had completed a third level course.
Figure 20 overleaf captures the percentage of adults 15 and over by their highest levels of
education for each of the 12 EDs. Alternatively one can view this data across in map 9 for small
areas.

21
22
Chapter 7. Social Class
The Central Statistics Office classifies the population according to ten socio-economic groups. The
socio-economic groups of all persons aged 15 years and over who are at work is determined on the
basis of their occupation and additionally in some cases by their employment status. Retired and
unemployed persons aged 15 years and over are classified according to their former employment
status and occupation. Persons engaged in home duties or at school/ college are classified according
to the socio-economic groups of the person they were deemed to be dependent upon.
A. Employers and Managers,
B. Higher Professional,
C. Lower Professional,
D. Non-Manual, Manual Skilled,
E. Semi-Skilled,
F. Unskilled,
G. Own account workers,
H. Farmers,
I. Agricultural Workers,
J. All Others Gainfully Occupied and unknown
However, the entire population is also classified by the Central Statistics Office into the following
seven social class groups, which are defined on the basis of occupation.ix
Social Class 1 Professional Workers
Social Class 2 Managerial and Technical
Social Class 3 Non-manual Social Class 4 Skilled manual
Social Class 5 Semi-skilled
Social Class 6 Unskilled
Social Class 7 All others gainfully occupied and unknown
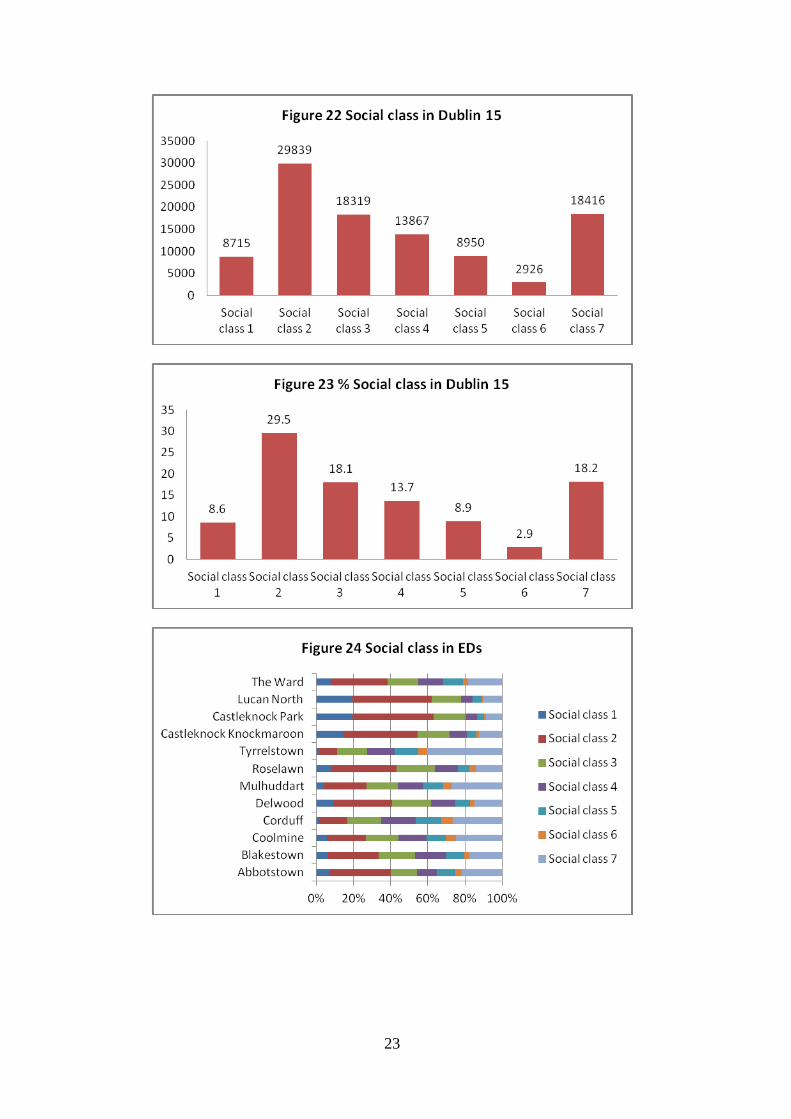
The analysis of the 2011 Census show that 38.1% of the population in Dublin 15 was in social
classes 1 and 2, in comparison to 34.6% for Ireland. 13.7% of Dublin 15s were categorised as skilled
manual or social class 4 and 18.1% in social class 7. The spatial distribution of social class as with
many Census variables varies considerably across Dublin 15. Social classes 1 and 2 are more highly
concentrated in the EDs of Dublin such as Lucan North and Castleknock Knockmaroon.
In contrast persons in social class 6 (unskilled) and 7 (never been in paid employment) are more
highly concentrated in Corduff, Coolmine and Tyrrelstown EDs, which is of greater significance for
the remit of Blanchardstown Area Partnership. Interestingly, there are some small areas in more
affluent areas of Dublin 15 where there are unusually high percentages of the population falling
into social class 7 (See map in the appendices). This is possibly due to the high numbers of foreign
nationals in receipt of private rent supplement who have never been in paid employment.
23

24
Chapter 8. At work and unemployed
The labour force consists of persons who are at work, unemployed and those who are seeking work
for the first time aged 15 years and over. Those who are considered to be outside of the labour force
mainly include retired persons, students and people who are looking after the home/family. In
2011 the total labour force of Dublin 15 was 53,394, of whom 81.7% were classified as ‘at work’.
30,154 persons aged 15 and over were not in the labour force with 6,236 persons classified as
‘engaged in home duties’ and 16,643 as ‘students’. The increase in the numbers of students over the
five year inter-censul period is particularly noteworthy. 9,525 more persons are now engaged in a
post leaving cert course or attending a third level faculty compared to five years ago.
8.1 Labour Force Participation
Since 2006 the total number of people at work in Dublin 15 decreased by 5% to 43,535. Due to a
decline in the numbers of persons at work, the labour market participation rate fell to 71.4% in
2011 from a peak of 73.3% in 2006. The largest percentage decline (66.7%) occurred in the building
and construction sector. The Ward had the highest labour market participation rates (82%) and
Roselawn registered the lowest (54.3%).

25
When the cumulative labour market participation data is disaggregated across gender lines it
reveals a higher percentage of men (78.6%) than women (64.6%) participating in the labour force.
The divergence in participation rates is partially because more women (5,891) are categorised as
‘looking after home/ family’ compared with men (345). Women are also more likely to be
categorised as ‘unable to work due to permanent sickness or disability’ (1,431) than men (896).
8.2 Unemployment
Unemployment is measured either via the Quarterly National Household Survey using the
International Labour Office (ILO) methodology or by the Principal Economic Status (PES)
methodology, which is applied during each census every five years.x Both approaches have their
relative merits. For the purposes of making international comparisons labour force aggregates are
now analysed using the ILO method as it is generally considered more robust. The ILO approach is
based on a sample household survey covering around 45,000 households in Ireland by a team of
specially trained interviewers. No data relating to Dublin 15 is available via the latter approach.
In order to determine the local aggregate unemployment levels one must analyse the PES data,
which surveys all households in the State.
The unemployment rate based on the PES method is 18.4% in Dublin 15. This is higher than the
Dublin rate of 17.4% but lower than the national average of 19%. Unemployment has therefore
almost doubled from 9.7% of the labour force in 2006 (see table 22). The average level of
unemployment levels rate for Dublin 15 nevertheless disguises the significantly higher rates that
prevail in several neighbourhoods such as Tyrrelstown 43.7% and Corduff 29.3%. From a longer-
term policy integration perspective it is important to point out that unemployment levels
nationally are higher among than foreign nationals (22.4%) than Irish persons (18.5%). However,
among foreign nationals unemployment levels vary significantly.
As was previously referenced the numbers of students increased enormously since 2006.
Unemployment would undoubtedly be higher had individuals not chosen to extend the duration of
their studies, returned to third level education or entered tertiary education for the first time. The
increase of persons from 18-24 age cohorts in population may also have impacted on the recorded
increase in students registering for third level education.

26
When the 2011 PES Census data is disaggregated along gender lines it also reveals that
unemployment is higher among men (20.2%) than women (16.2%). There are several reasons why
more men than women are likely to be unemployed. Educational attainment and age are
contributory factors towards a person’s chances of experiencing unemployment. Duggan (1999,
p43) outlines that the labour market has operated to ‘remove from the employed labour force
specific categories of workers. These categories have predominantly been adult and older male
workers from predominantly manual occupational background’.
8.3 Live Register
Aside from the increase in unemployment is the expansion of the numbers and percentage of ‘long-
term unemployed’ persons signing on the Live Registerxi across Dublin 15. There is also a
significant gender factor because the Live Register for April 2012 reveals that 71% of all persons
‘signing on’ one year or longer in Dublin 15 are men. The 2011 Census enriches this analysis as it
demonstrates that 3,627 persons in the building and construction sector locally have lost their jobs
since 2006. A further 2,902 are no longer employed in the commerce and trade sector (see table )
Table 2 Blanchardstown Office Live Register
0-1 Year 1-< 2 years 2-< 3 years 3+ years Total
Males 2,898 771 792 1,046 5,507
Females 1,925 412 285 363 2,985
Total 4,823 1,183 1,077 1,409 8,492
Source: BAP analysis of CSO live register April 2012
Across Dublin 15 the age band with highest frequency of persons ‘signing on’ is 25-34 years of age.
Once again the data reveals that is it younger men who have fared worst in the current economic
recession. An OECDxii paper points out that ‘young people are in a particularly challenging
position in relation to work opportunities and conditions at work. Delay in funding initial
employment and long spells of unemployment often have long-term negative repercussions on
career prospects, lifetime income, health prospects and social mobility’.
27

28
Chapter 9. Nationality and Ethnicity
The aim of this section is to examine the usual residence of people, nationality and ethnicity of
persons enumerated in Dublin 15 on Census night. It will also examine migration to the area.
The analysis of 2011 Census data illustrates that non-Irish nationals now account for 23.5%
(23,183)xiii of all residents in Dublin 15. This is almost double the State average of 12%. Citizens
from ‘rest of the world’ (9,393), ‘other EU 27’ (5,678) and Poland 4,448 represented the largest
numbers of non-Irish nationals resident (figure 30). Abbotstown ED contains the highest absolute
percentage (40%) of non-Irish nationals, whereas Roselawn recorded the lowest at 6.8%. However,
the highest numbers of non-Irish nationals are resident in Blakestown ED 8,833 (table 15). Map 14
shows that in some small areas of Dublin 15 there are now more non-Irish nationals, resident than
Irish nationals.
A specific question on ethnic or cultural background was included for the first time on the 2006
Census form and so an inter-censual comparison can be carried out. Significant growth occurred
within most of the non-Irish ethnic groups. Between 2006 and 2011 the category ‘Other White’ rose
by 59.7% from 10,049 to 16,049 persons. This was primarily due to immigration from Eastern
European countries such as Poland and Lithuania. An additional 2,267 Asian or Asian Irish and
1,466 Black or Black Irish are now also residing in 2011 compared with 2006.
Travellers
The 2011 census also enumerated 658 Irish Travellers living in Dublin 15. The highest numbers of
Travellers reside in Abbotstown ED (226) and Blakestown (166) respectively (table 18). The
number of Travellers in Ireland increased by 32% from 22,435 to 29,573. The age profile of the
Traveller community differs markedly from that of the general population. Irish Travellers are
generally much younger than the general population. There were 41% more children in the 0-4 age
cohorts than in 2006. The tendency of Irish Travellers to marry younger is evident in the fact that
only 32% of Travellers aged between 25 and 34 were single compared with over two thirds of the
general population in the same age range (2012, Part 1, p39).

29

30
Chapter 10. Disability and Carers
The aim of this section is to examine the number of people with a disability and the age profile of
people with a disability along with the inter-censual changes that occurred. According to the
results of the 2011 Census 9,544 persons representing 9.5% of the population in Dublin 15 had a
long lasting illness or disability in comparison to 4,059 in 2006. This is lower than the national
average of 13%.
Given the very young age profile of Dublin 15 one would expect the area to have a lower overall
percentage because the prevalence of disability increases with age. For instance 4.8% of persons
aged below 15 had a disability whereas 37.2% of persons aged 65 and over did (See table 26). Once
more there are significant variances in the terms of the distribution of disability within Dublin 15.
Roselawn ED has the highest percentage of persons with a disability (15.5%) whereas The Ward
recorded the lowest (6.3%).
In terms of social exclusion, illness/disability is a major factor. Results from the EU-Survey of
Income and Living Conditions undertaken by the CSO provides data on poverty rates for persons
with a disability, and indicates that 8.5% of persons age 16 and over and with a ‘chronic illness or
health problem’ experienced consistent poverty - twice the rate of those in the same age category
(4.1%) and not so affected. The survey also shows that those individuals who are not at work due
to an illness/disability have a consistent poverty rate of 15.8% and an ‘at risk of poverty rate’ of
37%. This contrasts with rates of 1.3% and 6.7% for individuals in employment. Thus individuals
with an illness or disability are much more likely to be in consistent poverty.
In April 2011, 1,472 persons were in receipt of disability benefit, 683 invalidity payments and 1,406
in receipt of disability allowance in Dublin 15.xiv The recent value for money review of the
disability allowance scheme notes that ‘the prevalence of multiple disabilities within the population
in receipt of disability allowance…undermines the importance of ensuring early intervention on the
part of activation services’ In this regard the ongoing focus of the current system of incapacity, as
opposed to capacity, does not serve the best interests of our customers (2010, p116/117).

31
The 2011 Census also recorded the number of carers and the number of hours of unpaid care they
provide for a family member or a friend with a disability, long term illness or health related
problem. Tables 27/28/29 summarise the hours of care provided by carers and shows that 62% of all
carers are female in Dublin 15. Women are also more likely to care for longer hours than men.
Chapter 11. Religion
73.2% of people in Dublin 15 described themselves as Roman Catholic, 18.4% other stated
religion, 6.2% stated they had no religion and 2.2% not stated.

32
Section 12. Ability to speak Irish and English
36.2% of people (34,161) in Dublin 15 speak Irish. The ED, where people had the highest
proficiency of Irish was Castleknock Park (50.3%). The actual numbers of persons in Dublin 15
who speak the language daily outside of the educational system was 335, which capture more
definitively the health of the first language of the State. Map 16 portrays the percentage of persons
in the small areas who speak Irish daily outside of the educational system.
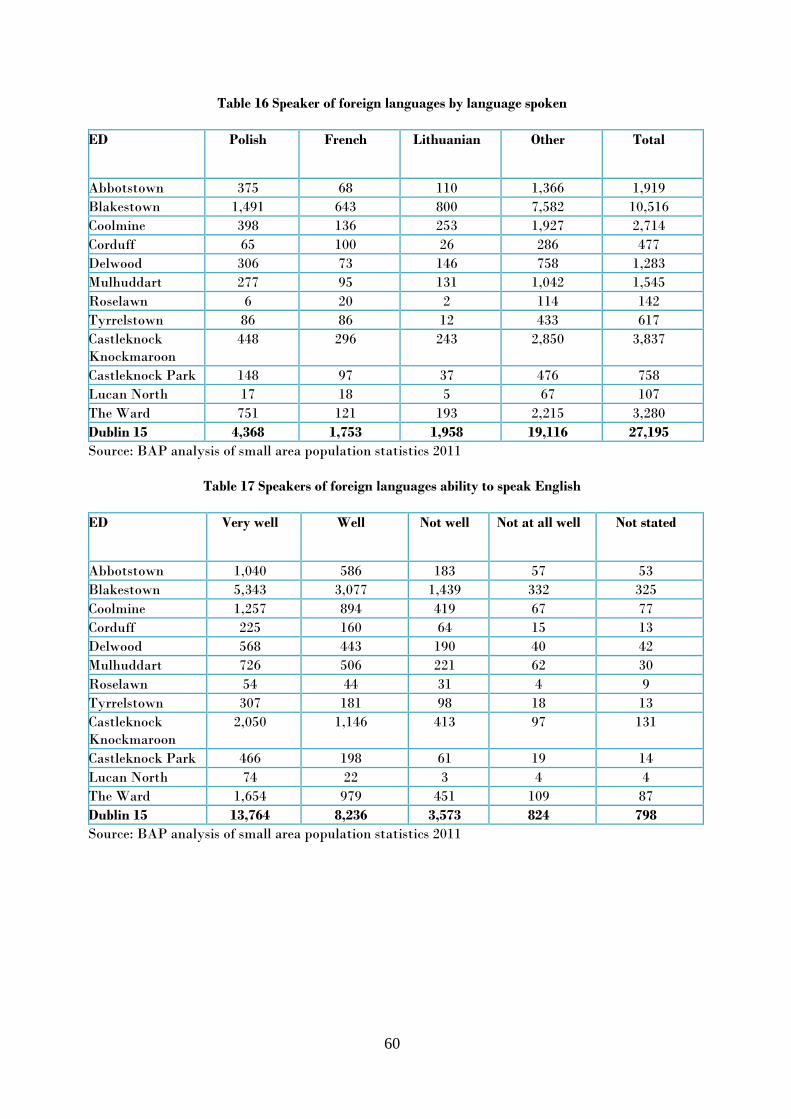
For the first time ever in national Census, speakers of foreign languages ability to speak English in
households were included as a distinct question. 824 persons indicated that they either could not
speak English ‘not at all well’ and an additional 3,573 stated they did not spoke English ‘not well’.
(See figure 21)
Section 13. Travel to work, school and college
The most common means of transport by which persons age 5 and over travel to work, school or
college is by driving a car (40.7%). A further 13.5% do so as a passenger in a car. 16.8% walk, and
6.1% take the train, DART or Luas. In terms of the hour of the day in which persons leave their
accommodation 21.9% do so from 8.01-8.30am. 8.3% depart after 9.30am and 6% from 6.30-7am.
Maps 17 and 18 shows very clearly the distinction in terms of the mode of public transport how
people commute to work, school or college. A far higher percentage of persons living in Castleknock
Knockmaroon and suburbs such as Clonsilla for instance take the train to work or college whereas
persons in Corduff, Mulhuddart and Tyrrelstown are more likely to take the bus.
33
Section 14 Other non-Census data
It was outlined in the background section that data provided by statutory and local agencies would
also be presented in this report. This is because the Census data nationally does not capture data
relating to drug mis-use, crime or incidents of homelessness at a local area.
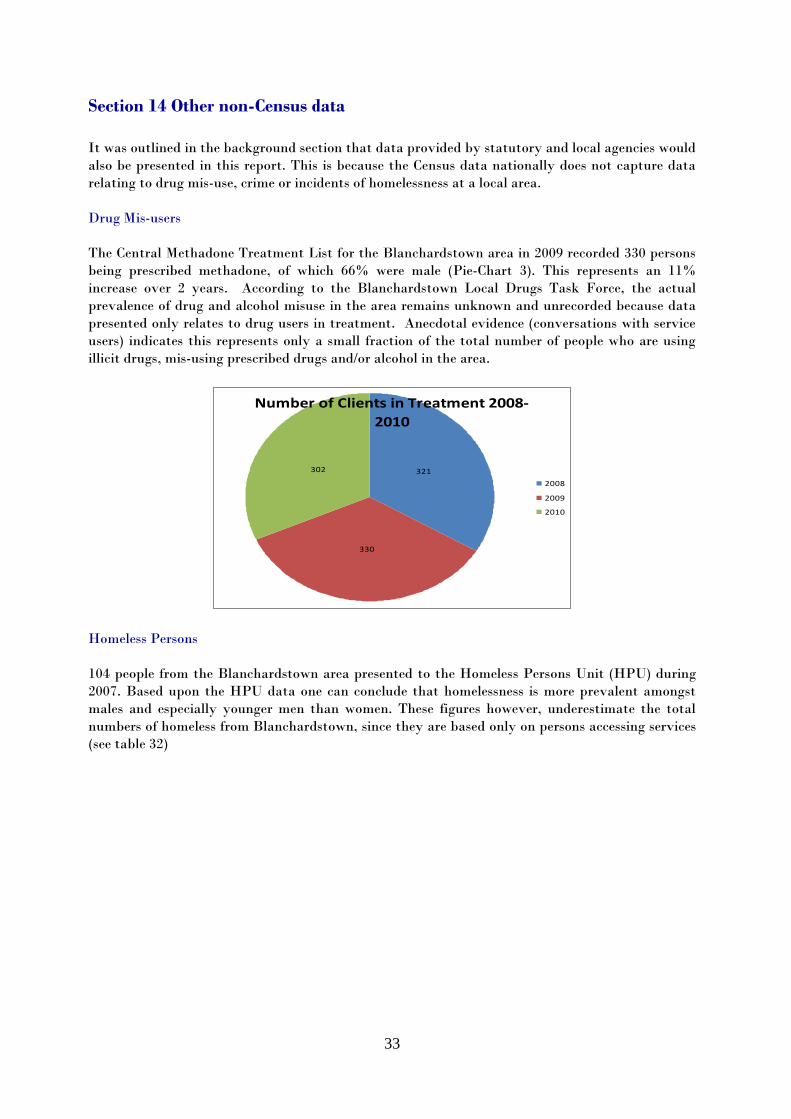
Drug Mis-users
The Central Methadone Treatment List for the Blanchardstown area in 2009 recorded 330 persons
being prescribed methadone, of which 66% were male (Pie-Chart 3). This represents an 11%
increase over 2 years. According to the Blanchardstown Local Drugs Task Force, the actual
prevalence of drug and alcohol misuse in the area remains unknown and unrecorded because data
presented only relates to drug users in treatment. Anecdotal evidence (conversations with service
users) indicates this represents only a small fraction of the total number of people who are using
illicit drugs, mis-using prescribed drugs and/or alcohol in the area.
Number of Clients in Treatment 2008-
2010
321
330
302
2008
2009
2010
Homeless Persons
104 people from the Blanchardstown area presented to the Homeless Persons Unit (HPU) during
2007. Based upon the HPU data one can conclude that homelessness is more prevalent amongst
males and especially younger men than women. These figures however, underestimate the total
numbers of homeless from Blanchardstown, since they are based only on persons accessing services
(see table 32)

34
Appendices

35
36

37

38

39

40

41

42

43

44

45

46

47
48

49

50

51

52
53
Table 3
Population of the catchment area of the Blanchardstown Area Partnership
ED
Population
1996
Population
2002
Population
2006
Population
2008 xv
Population
2011
Pop Change
Since
Previous
Census
%
Blanchardstownxvi-
Abbotstown
1,531 2,537 4,122 4,122 4,870 18.1
Blanchardstown-
Blakestown
15,131 24,404 32,288 32,288 36,057 11.7
Blanchardstown-
Coolmine
7,969 9,202 10,774 10,774 10,819 0.4
Blanchardstown-
Corduff
4,725 4,346 4,077 4,077 3,788 -7.1
Blanchardstown-
Delwood
4,235 4,589 4,955 4,955 5,044 1.8
Blanchardstown-
Mulhuddart
1,245 1,833 3,514 3,514 3,866 10.0
Blanchardstown-
Roselawn
2,303 2,043 1,831 1,831 1,682 -8.1
Blanchardstown-
Tyrrelstown
1,473 1,653 1,559 1,559 2,112 35.4
Castleknock-
Knockmaroon
N/A N/A N/A 17,115 18,071 5.6
Castleknock-
Park
N/A N/A N/A 4,395 5,124 16.6
Lucan North
N/A N/A N/A 1,163 1,358 16.8
The Ward
N/A N/A N/A 5,181 8,241 59.1
Dublin 15 38,612 50,607 63,120 90,974 101,032
8.2
Source: BAP analysis of CSO Census data

54
Table 4 Gender Profile of Dublin 15
ED Male Female Total
Abbotstown 2,359 2,511 4,870
Blakestown 17,730 18,327 36057
Coolmine 5,405 5,414 10,819
Corduff 1,803 1,985 3788
Delwood 2,505 2,539 5,044
Mulhuddart 1,856 2,010 3,866
Roselawn 809 873 1,682
Tyrrelstown 984 1,128 2,112
Castleknock Knockmaroon 8,788 9,283 18,071
Castleknock Park 2,559 2,565 5,124
Lucan North 648 710 1,358
The Ward 4,154 4,087 8,241
Dublin 15 49,600 51,432 101,032
Source: BAP analysis of CSO Census 2011
Table 5 Population aged 0-3 across Dublin 15
ED Population
Aged 0-3
2011
Population
Aged 0-3
2011
%
Abbotstown 558 11.5
Blakestown 4,386 12.2
Coolmine 974 9
Corduff 244 6.4
Delwood 392 7.8
Mulhuddart 491 12.7
Roselawn 50 3
Tyrrelstown 208 9.9
Castleknock Knockmaroon 1,614 8.9
Castleknock-Park 259 5.1
Lucan North 190 14
The Ward 1,308 15.9
Dublin 15 10,674 10.6%
Source: BAP analysis of CSO Census 2011

55
Table 6 Population aged 0-14
ED Pop Aged
0-14
2006
Pop Aged
0-14
2011
Pop Aged
0-14
2011
%
Abbotstown 827 1,131 23.2
Blakestown 8,452 10,526 29.2
Coolmine 2,602 2,685 24.8
Corduff 1,152 843 22.5
Delwood 716 850 16.9
Mulhuddart 816 1,254 32.4
Roselawn 205 161 9.6
Tyrrelstown 606 736 34.9
Castleknock Knockmaroon 3,886 4,296 23.8
Castleknock Park 685 674 13.2
Lucan North 335 442 32.6
The Ward 1,282 2,713 32.9
Dublin 15 21,564 26,311 26.0%
Source: BAP analysis of small area population statistics 2011
Table 7 Population aged 15-64
ED Pop Aged
15-64
2006
Pop Aged
15-64
2011
Pop Aged
15-64
2011
%
Abbotstown 2,925 3,288 67.5
Blakestown 23,007 24,674 68.4
Coolmine 7,812 7,581 70.1
Corduff 3,488 2,676 70.6
Delwood 3,862 3,627 71.9
Mulhuddart 1,947 2,559 66.2
Roselawn 1,365 1,139 67.7
Tyrrelstown 921 1,324 62.7
Castleknock Knockmaroon 12,656 12,893 71.3
Castleknock Park 3,343 3,881 75.7
Lucan North 746 791 58.3
The Ward 3,801 5,431 65.9
Dublin 15 65,873 69,864 69.2%
Source: BAP analysis of small area population statistics 2011
56
Table 8 Population aged 65 and over
ED Pop Aged 65
and over
2006
Pop Aged 65
and over
2011
Pop Aged 65
and over
2011
%
Abbotstown 370 451 9.3
Blakestown 609 857 2.4
Coolmine 360 553 5.1
Corduff 359 269 7.1
Delwood 377 567 11.2
Mulhuddart 22 53 1.4
Roselawn 261 382 22.7
Tyrrelstown 32 52 2.5
Castleknock Knockmaroon 573 882 4.9
Castleknock Park 367 569 11.1
Lucan North 82 125 9.2
The Ward 98 97 1.2
Dublin 15 3,317 4,857 4.8%
Source: BAP analysis of small area population statistics 2011
Table 9 Population Age Dependency Ratio
ED Pop Aged
0-14
2011
Pop Aged
15-64
2011
Pop Aged 65
and over
2011
Age Dependent
%
Abbotstown 1,131 3,288 451 32.5
Blakestown 10,526 24,674 857 31.6
Coolmine 2,685 7,581 553 29.9
Corduff 843 2,676 269 29.4
Delwood 850 3,627 567 28.1
Mulhuddart 1,254 2,559 53 33.8
Roselawn 161 1,139 382 32.3
Tyrrelstown 736 1,324 52 37.3
Castleknock Knockmaroon 4,296 12,893 882 28.7
Castleknock Park 674 3,881 569 24.3
Lucan North 442 791 125 41.8
The Ward 2,713 5,431 97 34.1
Dublin 15 26,311 69,864 4,857 30.9%
Source: BAP analysis of small area population statistics 2011

57
Table 10 Family Units with children by type of family for children less than15 of age
ED Total Family
Units With
Children,
All Children
Lone Parent
All Children
Lone Parent,
All Children
< 15
years
2011
% of Lone Parent
Families
All Children < 15
years of age
2011
Abbotstown 592 178 120 20.4
Blakestown 5,622 1,687 991 21.2
Coolmine 1,469 814 378 34.1
Corduff 483 325 125 45.8
Delwood 689 235 108 26.0
Mulhuddart 514 317 190 34.1
Roselawn 213 79 20 28.6
Tyrrelstown 208 258 121 51.7
Castleknock
Knockmaroon
2,841 583 263 14.3
Castleknock Park 726 148 34 11.8
Lucan North 236 28 8 4.6
The Ward 1,239 336 244 19.4
Dublin 15 14,832 4,988 2,602 22.6
Source: BAP analysis of small area population statistics 2011
Table 11 Lone parents for all children < 15 years of age
ED Lone Parent,
All Children <
15 years
2006
Lone Parent,
All Children <
15 years
2011
Change
Lone Parent All
Children < 15
years of age
% of Lone Parent
Families
All Children < 15
years of age
Abbotstown 131 120 -11 20.4
Blakestown 887 991 104 21.2
Coolmine 371 378 7 34.1
Corduff 193 125 -68 45.8
Delwood 78 108 30 26.0
Mulhuddart 128 190 62 34.1
Roselawn 21 20 -1 28.6
Tyrrelstown 115 121 6 51.7
Castleknock
Knockmaroon
237 263 26 14.3
Castleknock Park 30 34 4 11.8
Lucan North 11 8 -3 4.6
The Ward 120 244 124 19.4
Dublin 15 2,322 2,602 280 22.6
Source: BAP analysis of small area population statistics 2011

58
Table 12 Educational Attainment
ED Pop
Education
Ceased
Not
Stated
Pop
Education
Ceased (Excl
Not Stated)
Pop No
formal or
primary
education
only
Pop lower
secondary
education
Pop
upper
secondar
y
education
Pop
technical
or
vocationa
l
education
Pop 3rd level
education
Abbotstown 2,944 266 2,678 302 252 476 354 1,294
Blakestown 20,321 995 19,326 1,784 2,924 4,494 3,432 6,692
Coolmine 6,313 484 5,829 963 1,164 1,294 900 1,508
Corduff 2,396 179 2,217 542 550 479 340 306
Delwood 3,442 160 3,282 298 373 716 474 1,421
Mulhuddart 1,907 128 1,779 198 300 440 342 499
Roselawn 1,302 88 1,214 142 203 316 148 405
Tyrrelstown 940 102 838 142 245 201 144 106
Castleknock
Knockmaroon
10,970 371 10,599 502 931 2,103 1,244 5,819
Castleknock
Park
3,607 93 3,514 136 243 698 328 2,109
Lucan North 805 76 729 27 69 121 87 425
The Ward 4,303 278 4,025 202 422 893 790 1,718
Dublin 15 59,250 3,220 56,030 5,238 7,676 12,231 8,583 22,302
Table 13 Educational Attainment %
ED Pop No formal
or primary
education
only
%
Pop lower
secondary
education
%
Pop upper
secondary
education
%
Pop technical
or vocational
education
%
Pop 3rd level
education
%
Abbotstown 11.3 9.4 17.8 13.2 48.3
Blakestown 9.2 15.1 23.3 17.8 34.6
Coolmine 16.5 20.0 22.2 15.4 25.9
Corduff 24.4 24.8 22.4 15.3 13.8
Delwood 9.1 11.4 21.8 14.4 43.3
Mulhuddart 11.1 16.9 24.7 19.2 28.1
Roselawn 11.7 16.7 26.0 12.2 33.4
Tyrrelstown 17.0 29.2 24.0 17.2 12.7
Castleknock
Knockmaroon
4.7 8.8 19.9 11.7 54.9
Castleknock Park 3.9 6.9 19.9 9.3 60.0
Lucan North 3.7 9.5 16.6 11.9 58.3
The Ward 5.0 10.5 22.9 19.6 42.7
Dublin 15 9.4 13.7 21.8 15.3 39.8
Source: BAP analysis of small area population statistics 2011

59
Table 14 Usually resident population by nationality in Dublin 15
ED Irish UK Poland Lith’an Other EU
27
Rest of
World
Not
stated
Total
Abbotstown 2,822 86 389 123 419 870 55 4,764
Blakestown 26,473 452 1,497 910 2,244 3,730 584 35,890
Coolmine 8,214 132 410 305 521 870 264 10,716
Corduff 3,334 38 63 32 98 114 99 3,778
Delwood 3,759 45 312 173 297 367 50 5,003
Mulhuddart 2,564 42 263 134 254 514 75 3,846
Roselawn 1,542 13 6 5 48 41 8 1,663
Tyrrelstown 1,645 18 84 12 64 237 39 2,099
Castleknock
Knockmaroon
14,541 267 484 276 930 1,220 170 17,888
Castleknock
Park
4,301 63 151 48 222 189 21 4,995
Lucan North 1,233 47 14 8 11 25 12 1,350
The Ward 5,043 133 775 212 660 1,216 128 8,167
Dublin 15 75,471 1,336 4,448 2,238 5,768 9,393 1,505 100,159
Source: BAP analysis of small area population statistics 2011
Table 15 Usually resident population of Irish and Foreign Nationals in Dublin 15
ED Irish Irish
%
Foreign Nationals Foreign
Nationals
%
Abbotstown 2,822 60% 1,887 40%
Blakestown 26,473 75% 8,833 25%
Coolmine 8,214 78.6% 2,238 21.4%
Corduff 3,334 90.6% 345 9.4%
Delwood 3,759 75.9% 1,194 24.1%
Mulhuddart 2,564 68% 1,207 32%
Roselawn 1,542 93.2% 113 6.8%
Tyrrelstown 1,645 79.9% 415 20.1%
Castleknock
Knockmaroon
14,541 82.1% 3,177 17.9%
Castleknock Park 4,301 86.5% 673 13.5%
Lucan North 1,233 92.2% 105 7.8%
The Ward 5,043 62.7% 2,996 37.3%
Dublin 15 75,471 76.5% 23,183 23.5%
Source: BAP analysis of small area population statistics 2011
60
Table 16 Speaker of foreign languages by language spoken
ED Polish French Lithuanian Other Total
Abbotstown 375 68 110 1,366 1,919
Blakestown 1,491 643 800 7,582 10,516
Coolmine 398 136 253 1,927 2,714
Corduff 65 100 26 286 477
Delwood 306 73 146 758 1,283
Mulhuddart 277 95 131 1,042 1,545
Roselawn 6 20 2 114 142
Tyrrelstown 86 86 12 433 617
Castleknock
Knockmaroon
448 296 243 2,850 3,837
Castleknock Park 148 97 37 476 758
Lucan North 17 18 5 67 107
The Ward 751 121 193 2,215 3,280
Dublin 15 4,368 1,753 1,958 19,116 27,195
Source: BAP analysis of small area population statistics 2011
Table 17 Speakers of foreign languages ability to speak English
ED Very well Well Not well Not at all well Not stated
Abbotstown 1,040 586 183 57 53
Blakestown 5,343 3,077 1,439 332 325
Coolmine 1,257 894 419 67 77
Corduff 225 160 64 15 13
Delwood 568 443 190 40 42
Mulhuddart 726 506 221 62 30
Roselawn 54 44 31 4 9
Tyrrelstown 307 181 98 18 13
Castleknock
Knockmaroon
2,050 1,146 413 97 131
Castleknock Park 466 198 61 19 14
Lucan North 74 22 3 4 4
The Ward 1,654 979 451 109 87
Dublin 15 13,764 8,236 3,573 824 798
Source: BAP analysis of small area population statistics 2011

61
Table 18 Irish Travellers
ED Census
2006
Census
2011
Change
+/-
Abbotstown 305 226 -79
Blakestown 31 166 135
Coolmine 55 58 3
Corduff 11 15 4
Delwood 0 0 0
Mulhuddart 12 32 20
Roselawn 0 0 0
Tyrrelstown 53 45 -8
Castleknock Knockmaroon 30 25 -5
Castleknock-Park 41 21 -20
Lucan North 0 0 0
The Ward 107 70 -37
Dublin 15 645 658 13
Source: BAP analysis of small area population statistics 2011
Table 19 Social Class Groupings, 2011
ED Professional
workers
Social
Class 1
Managerial
& technical
Social Class 2
Non-
manual
Social
Class 3
Skilled
manual
Social
Class 4
Semi
skilled
Social
Class 5
Unskilled
Social
Class 6
All others
gainfully
occupied
and
unknown
Social
Class 7
Abbotstown 352 1,597 697 507 498 164 1,055
Blakestown 2,312 9,808 7,070 6,084 3,458 948 6,377
Coolmine 631 2,254 1,884 1,640 1,144 584 2,682
Corduff 62 565 702 704 515 239 1,001
Delwood 468 1,592 1,054 668 390 129 743
Mulhuddart 157 684 702 563 450 181 1,129
Roselawn 135 593 348 205 107 57 237
Tyrrelstown 26 212 338 314 266 102 854
Castleknock
Knockmaroon
2,674 7,190 3,076 1,679 966 240 2,246
Castleknock
Park
990 2,247 878 319 198 51 441
Lucan North 266 577 216 83 69 11 136
The Ward 642 2,520 1,354 1,101 889 220 1,515
Dublin 15 8,715 29,839 18,319 13,867 8,950 2,926 18,416
8.6% 29.5% 18.1% 13.7% 8.9% 2.9% 18.2%
Source: BAP analysis of small area population statistics 2011

62
Table 20 Labour Force Participation Rates across Dublin 15
ED At Work
2011
Labour Force
Participation Rate
2011
%
Abbotstown 2,225 72.3
Blakestown 15,472 74.8
Coolmine 4,076 68.1
Corduff 1,357 65.2
Delwood 2,346 66.2
Mulhuddart 1,416 74.9
Roselawn 713 54.3
Tyrrelstown 498 64.2
Castleknock Knockmaroon 8,444 69.8
Castleknock Park 2,666 65.4
Lucan North 541 63.5
The Ward 3,781 82.0
Dublin 15 43,535 71.4%
Source: BAP analysis of small area population statistics 2011
Table 21
2006-2011 Inter-censual changes in unemployment Dublin 15
ED Total
unemployedxvii
2006
Total
unemployed
2011
Change
unemployment
%
+/-
Change
unemployment
2006-2011
+/-
Abbotstown 320 479 50% 159
Blakestown 1,616 3,615 123.7% 1,999
Coolmine 979 1,463 49.4% 484
Corduff 369 562 52.3% 193
Delwood 183 432 136.2% 249
Mulhuddart 252 540 114.3% 288
Roselawn 49 113 130% 64
Tyrrelstown 146 386 164.5% 240
Castleknock
Knockmaroon
593 1,164 96.3% 571
Castleknock Park 95 244 157% 149
Lucan North 15 41 266.6% 26
The Ward 312 751 140.7% 439
Dublin 15 4,929 9,790 4,861
Source: BAP analysis of small area population statistics 2011

63
Table 22 Labour Force Composition
Total Unemployed
ED Total
Labour
Force
At Work Looking
for 1st
Regular
Job
Unemployed
having lost
or given up
job
Student
On
Home
Duties
Retired Unable to
Work due
to
Permanen
t Sickness
or
Disability
Other Unemplo
yment
Rate
%
2011
Unemplo
yment
Rate
%
2006
Abbotstown 2,704 2,225 62 417 235 287 385 118 10 17.7 13.1
Blakestown 19,087 15,472 325 3,290 2,547 2,116 864 867 50 18.9 8.8
Coolmine 5,539 4,076 177 1,286 900 765 506 402 22 23.7 16.9
Corduff 1,919 1,357 35 527 326 263 280 151 6 29.3 14.48
Delwood 2,778 2,346 53 379 382 353 572 99 10 15.6 6.4
Mulhuddart 1,956 1,416 56 484 258 236 44 113 5 27.6 17.0
Roselawn 826 713 10 103 147 139 353 49 7 13.7 5.0
Tyrrelstown 884 498 47 339 220 125 55 81 11 43.7 26.0
Castleknock
Knockmaroo
n
9,608 8,444 153 1,011 1,783 1,104 975 282 23 12.1 6.2
Castleknock
Park
2,910 2,666 34 210 577 358 548 52 5 8.4 4.2
North Lucan 581 541 4 37 100 106 112 15 1 7.0 2.5
The Ward 4,532 3,781 76 675 410 384 94 98 10 16.6 9.5
Dublin 15 53,324 43,534 1,032 8,758 16,643 6,236 4,788 2,327 160 18.4% 9.7%
Source: BAP analysis of small area population statistics 2011
Table 23 Blanchardstown Office Live Register
0-1 Year 1-< 2 years 2-< 3 years 3+ years Total
Males 2,898 771 792 1,046 5,507
Females 1,925 412 285 363 2,985
Total 4,823 1,183 1,077 1,409 8,492
Source: BAP analysis of CSO live register April 2012
Not everyone living in Dublin 15 ‘signs on’ at the Blanchardstown DSP Office. Some individuals
sign on at the Navan Road in Dublin 7.

64
Table 24 Persons 15 + at work by industry 2011
ED Agricultur
e, forestry
and
fishing
Building
&
Constructi
on
Manufactu
ring
industries
Commer
ce &
Trade
Transport
and
Communic
ation
Public
administr
ation
Profession
al services
Other
Abbotstown 4 59 206 592 336 93 668 267
Blakestown 26 745 1,408 4,452 2,022 1,231 3,401 2,187
Coolmine 7 173 347 1,070 488 283 981 727
Corduff 2 61 81 345 170 91 334 273
Delwood 3 91 158 746 279 211 563 295
Mulhuddart 2 61 97 362 200 88 332 274
Roselawn 2 29 47 175 60 75 208 117
Tyrrelstown 0 10 26 127 60 11 120 144
Castleknock
Knockmaroon
16 313 687 2,713 942 702 2,056 1,015
Castleknock
Park
6 87 168 947 295 214 683 265
Lucan North 6 29 67 177 62 41 114 45
The Ward 26 151 386 1,056 604 184 781 593
Dublin 15 100 1,809 3,678 12,762 5,518 3,224 10,241 6,202
Source: BAP analysis of small area population statistics 2011
Table 25 Top 8 categories of employment by decline and increase in numbers employed
Industries 2006 2011 Change %
decline growth
Agriculture, forestry and
fishing
197 100 -97 -50.7
Building & Construction 5,436 1,809 -3,627 -66.7
Manufacturing industries 3,904 3,678 -226 -5.8
Commerce & Trade 15,664 12,762 -2902 -18.5
Transport and
Communication
3,362 5,518 2,156 64.1
Public administration 3,057 3,224 167 5.5
Professional services 7,150 10,241 3,091 43.2
Other 7,067 6,202 -865 -12.2
Total 45,837 43,535 2,302 -5.0%
Source: BAP analysis of CSO Census 2011

65
Table 26 Age Categories of Persons with a Disability, 2011
ED Total
Persons
with a
Disability
Persons
with a
Disability
aged
1-14
Persons
with a
Disability
aged
15-24
Persons
with a
Disability
aged
25-44
Persons
with a
Disability
aged
45-64
Persons
with a
Disability
aged
65+
Population
with a
Disability
%
Abbotstown 636 26 30 141 113 326 13.0
Blakestown 3,159 487 284 1,022 968 398 8.8
Coolmine 1,282 177 117 335 462 191 11.9
Corduff 563 62 39 129 237 96 14.9
Delwood 452 27 35 127 129 134 9.0
Mulhuddart 388 60 34 162 109 23 10.0
Roselawn 261 13 17 32 88 111 15.5*
Tyrrelstown 288 61 30 90 78 29 13.6
Castleknock
Knockmaroon
1,441 185 147 353 505 251 8.0
Castleknock Park 398 26 39 90 116 127 7.8
Lucan North 160 19 8 18 22 93 11.8
The Ward 516 111 49 247 82 27 6.3*
Dublin 15 9,544 1,254 829 2,746 2,909 1,806 9.5
4.8% 37.2%
Source: BAP analysis of small area population statistics 2011
Table 27 Carers aged 15 years and over classified by number of hours unpaid help per week
Total
Carers
1-14 15-28 29-42 43+ Not stated
Male 1,179 563 164 70 205 177
Female 1,923 864 320 113 389 237
Total 3,102 1,727 484 183 594 414
Table 28 Male carers aged 15 years and over classified by number of hours unpaid help per week
ED 1-14 15-28 29-42 43+ Not stated Total
Abbotstown 25 3 2 8 6 44
Blakestown 163 61 29 68 56 377
Coolmine 60 21 6 34 23 144
Corduff 24 9 3 10 10 56
Delwood 32 6 4 14 12 68
Mulhuddart 20 5 0 9 13 47
Roselawn 26 10 2 8 3 49
Tyrrelstown 7 5 2 9 6 29
Castleknock
Knockmaroon
118 28 17 32 28 223
Castleknock Park 34 8 2 8 7 59
Lucan North 45 5 2 4 13 69
The Ward 9 3 1 1 0 14
Dublin 15 563 164 70 205 177 1,179

66
Table 29 Female carers aged 15 years and over classified by number of hours unpaid help per week
ED 1-14 15-28 29-42 43+ Not stated Total
Abbotstown 29 14 2 16 6 67
Blakestown 268 106 37 127 56 594
Coolmine 93 43 16 57 37 246
Corduff 43 23 6 20 10 102
Delwood 48 17 8 22 13 108
Mulhuddart 29 16 2 12 15 74
Roselawn 25 12 7 14 7 65
Tyrrelstown 15 6 0 8 12 41
Castleknock
Knockmaroon
169 51 23 73 41 357
Castleknock Park 76 21 7 22 17 143
Lucan North 15 4 0 0 3 22
The Ward 54 7 5 18 20 104
Dublin 15 864 320 113 359 237 1,923
Table 30 % of People (15-64 years) reporting using an illegal drug
Illegal Drug
Use xviii
2002/3 2010/2011
Lifetime 18.5% 27.2%
Last Year 5.6% 7.0%
Last Month 3.0% 3.2%
Source: National Advisory Committee on Drugs
Table 31 Number of cases in treatment
2005 2010 Increase/decrease % increase/decrease
12,101 16,429 +4328 +36%
Source: Bellerose, D., Carew, A.M., and Lyons, S. (2011). Trends in treated problem drug use in
Ireland 2005 to 2010. Health Research Board. Dublin.
Table 32 Reported Cases of Homelessness
Total No of
Homeless
Persons
Single
male
Single female Couple One parent
family
Abbotstown 13 9 2 2 0
Blakestown 27 23 0 0 0
Coolmine 28 14 3 0 4
Corduff 4 3 1 0 0
Delwood 6 2 0 0 2
Mulhuddart 6 4 2 0 0
Tyrrelstown 20 6 1 1 2
Blanchardstown 104 61 9 1 8
Source: BAP analysis of Homeless Persons Unit data, 2007

67
References
Bellerose, D., Carew, A.M., and Lyons, S. (2011). Trends in treated problem drug use in Ireland 2005
to 2010. Health Research Board. Dublin.
Central Statistics Office (2008) Survey on Income and Living Condition (SILC) in Ireland 2007.
Central Statistics Office (2012a)This is Ireland, Highlights from Census 2011, Population,
Nationality, Households and Diversity, Part 1, Government Publications Office
Central Statistics Office (2012b)This is Ireland, Highlights from Census 2011, Labour Force,
Education, Commuting and Health, Part 2, Government Publications Office
Central Statistics Office (2012c)Profile 2, Older and Younger, An Age Profile of Ireland, Government
Publications Office
Central Statistics Office (2012d) Profile 3, At Work, Employment, occupations, and industry in
Ireland, Government Publications Office
Central Statistics Office (2012e)Profile 4, The Roof over our Heads, Housing in Ireland, Government
Publications Office
Central Statistics Office (2012f),Profile 5, Households and Families, Living arrangements in Ireland,
Government Publications Office
Central Statistics Office (2012g) A special Census report , Homeless persons in Ireland, Government
Publications Office
Central Statistics Office (2012h) Profile 6, Migration and Diversity, Government Publications Office
Connellan, S. (2000) Combating Prejudice Against The Unemployed A Study of Long-term
Unemployed People and Employers in Blanchardstown, Blanchardstown Area Partnership
Garvey, D (1988) ’What is the best measure of employment and unemployment in Ireland’,
Journal of the Statistical and Social Inquiry Society of Ireland, No. 25(5) pp.185-236.
Government of Ireland. (2010) Value for Money Review of Disability Allowance Scheme,
Department of Social Protection
Haase, T. and McKeown, K. (2003) Developing Disadvantaged areas through Area-Based
Initiatives, Dublin: Area Development Management Ltd
Haase, T. and Pratschke, J. (2005) New Measures of Deprivation for the Republic of Ireland,
Dublin
Nolan, B. and Callan, T. (eds. ) (1994), Poverty and Policy in Ireland, Gill and Macmillan, Dublin
OECD (2010) Rising Youth Unemployment During the Crisis: How to Prevent Negative Long-
Term Consequences on a Generation, OECD
Ryan, C. (2010a) Socio-Economic Profile Blakestown Parish, Blanchardstown Area Partnership
68
Ryan, C. (2010b) Socio-Economic Profile Corduff Parish, Blanchardstown Area Partnership
Ryan, C. (2010c) http://www.bap.ie/dloads/Corduff_Socio_Econ_Profile_2010.pdf Socio-Economic
Profile Huntstown / Hartstown Parish, Blanchardstown Area Partnership, Blanchardstown Area
Partnership
Ryan, C. (2010e) Socio-Economic Profile Mountview Parish, Blanchardstown Area Partnership
Ryan, C. (2010f) Socio-Economic Profile Mulhuddart Parish, Blanchardstown Area Partnership
Ryan, C. (2009) Socio-Economic Profile of Dublin 15, Blanchardstown Area Partnership
Ryan, C. (2008) Socio Economic Profile of Blanchardstown, Blanchardstown Area Partnership
Smith, J (2008) A Study of the Daily Demands on Community Childcare Services in County
Fingal, Blanchardstown Area Partnership
Williams, B. & Shiels, P. (2005) Socio & Economic Study of the Greater Blanchardstown Area,
Blanchardstown Chamber of Commerce

69
ENDNOTES i Website 14/9/2012 ii TÚS is a community work placement initiative implemented by BAP in conjunction with the
Department of Social Protection. The aims of TÚS are to provide a 12 month work opportunity for
persons in receipt of jobseekers allowance and to provide certain services of benefits to
communities. iii Social exclusion is defined as cumulative marginalisation: from production (employment), from
consumption (income poverty), from social networks (community, family and neighbours), from
decision-making and from an adequate quality of life. iv Eurostat’s definition of poverty risk refers to individuals living a households were the equivilised
income is below the threshold of 60% of the national equivilised median income. v For the purposes of this report Dublin 15 is defined as consisting of the following Electoral
Divisions. Blanchardstown-Abbotstown, Blanchardstown-Blakestown, Blanchardstown Coolmine,
Blanchardstown- Corduff, Blanchardstown-Delwood, Blanchardstown-Mulhuddart,
Blanchardstown-Roselawn, Blanchardstown-Tyrrelstown, Castleknock-Knockmaroon,
Castleknock-Park, Lucan North, The Ward. vi Long-term unemployed, single parents, refugees, asylum seekers, drug mis-users, ex-offenders,
Travellers, older persons, people with disabilities, homeless persons, young people at risk, the
underemployed, low income families. vii An ED is one the smallest unit of measurement used by the Central Statistics Office to obtain
Small Area Population Statistics for each Census. The boundaries of EDs are fixed and therefore
allow inter-Censual comparability of data for these areas. EDs generally do not correspond with
what the local community identify in common currency e.g. the Parish of Blakestown is
geographically spread across Coolmine and Blakestown EDs. viii The RAPID Programme aims to ensure priority attention is given to tacking the spatial
concentration of poverty and social exclusion within the 51 designated RAPID areas. ix The occupations included in each of these groups have been selected in such a way as to bring
together, as far as possible, people with similar levels of occupational skills. In determining social
class no account is taken of the differences between individuals on the basis of other characteristics
such as education. The social class of family dependents is derived from the social class of the
parent having the highest social class. x For a more detailed insight around how unemployed in measured please refer to Garvey, D (1988)
’What is the best measure of employment and unemployment in Ireland’, Journal of the Statistical
and Social Inquiry Society of Ireland, No.25(5) pp.185-236. xi The Live Register is not designed to measure unemployment. It includes part time workers
(those who work up to three days a week), seasonal and casual workers entitled to Jobseekers
Benefit or Allowance.
xii OECD (2010), Rising youth unemployment during crisis: How to prevent negative long-term
consequences for generation? OECD Social, Employment and Migrant Papers, NO. 106.

70
xiii Excluding ‘non stated’. xiv Source: Department of Social Protection April/ May 2011. xv The Board of Blanchardstown Area Partnership agreed to the proposal by the Department of
Community, Rural and Gaeltacht Affairs to extend the organisations boundaries under the
Cohesion process with effect from 1st January 2008. As a consequence, the Partnership now has
responsibility to provide services to communities across the wider Dublin 15 area.
xvi The Central Statistics Offices definition of Blanchardstown is the first 8 electoral divisions listed
in alphabetical order.
xvii First time job seeker and those unemployed as a result of having lost or given up a job.
xviii
Includes amphetamines, cannabis, cocaine powder, crack, ecstasy, heroin, LSD, magic
mushrooms, poppers, solvents