Embed Size (px)
Citation preview

Social and Economic Networks
Instructor: Sergio Currarini
PhD Economics - Fall 2012
Instructor: Sergio Currarini () Social and Economic Networks PhD Economics - Fall 2012 1 / 102

Introduction
Networks relevant for a wide range of social and economic settings:
Information transmission about job opportunitiestrade of goods and servicesprovision of informal insurance in developing countriesspread of diseasespeer effects in risky behaviorvoting behaviorcriminal activityeducational attainmentlikelihood to succeed professionally
Study of networks aims at understanding
1 which network structures are likely to emerge in a society
2 how social network structures affect behavior
Instructor: Sergio Currarini () Social and Economic Networks PhD Economics - Fall 2012 2 / 102

Medici
Guadagni
Strozzi
Salvia3
Pazzi
Albizzi
Bischeri
Tornabuon
Ridolfi
Barbaduori
Acciaiuol
Figure: Florentinian marriages XV cent., US Highschool friendships, Facebooksmiling network
Instructor: Sergio Currarini () Social and Economic Networks PhD Economics - Fall 2012 3 / 102

Figure: Obesity and smoking networks
Instructor: Sergio Currarini () Social and Economic Networks PhD Economics - Fall 2012 4 / 102

Defining Graphs and Networks
The set N = {1, ..., n} is the set of nodes (also, vertices, individuals,agents, players) involved in network relationships. Depending on theapplication, nodes may be individual people, firms, countries, etc.
Networks mostly modeled as undirected graphs: A collection ofnodes, which are either connected or not to each other (i.e., it cannotbe that one node is related to a second without the second beingrelated to the first).
Suitable description for partnerships, friendships, alliances andacquaintances
In a directed network a node may be connected to a second withoutthe second being connected to the first
Suitable description for citation networks, web pages linking to others
Instructor: Sergio Currarini () Social and Economic Networks PhD Economics - Fall 2012 5 / 102

Formal Definitions of Graphs
A graph (N, g) consists of a set of nodes N = {1, ..., n} and areal-valued n× n matrix g (adjacency matrix), where gij representsthe (possibly weighted and/or directed) relationship between i and j .Entries in most applications either 0 or 1 (unweighted graph).A network is directed if it is possible that gij 6= gji . A network isundirected if gij = gji for all nodes i and j .Example: N = {1, 2, 3} with
g =
0 1 01 0 10 1 0
2
1 3 6 4
5 7
2 1 3 4
Figure:
Instructor: Sergio Currarini () Social and Economic Networks PhD Economics - Fall 2012 6 / 102

An Alternative Representation
Alternatively, list all links in the graph. For above example, writeg = {{1, 2}, {2, 3}} or g = {12, 23}.
ij then has the meaning that i and j are connected under network g ,i.e. ij ∈ g (which is equivalent to writing gij = 1)
g ′ ⊂ g indicates that {ij : ij ∈ g ′} ⊂ {ij : ij ∈ g}
Let g + ij represent the network obtained by adding the link ij to thenetwork g , and g − ij the network obtained by deleting the link ijfrom the network g
Let G (N) be the set of all undirected and unweighted networks on N.
Instructor: Sergio Currarini () Social and Economic Networks PhD Economics - Fall 2012 7 / 102

Paths and Cycles
A path in an (undirected) network g ∈ G (N) between i and j is asequence of links i1i2, i2i3, ..., iK−1iK such that ik ik+1 ∈ g for eachk ∈ {1, ..., K − 1}, with i1 = i and iK = j , and such that each nodein the sequence i1, ..., iK is distinct.
A walk in a network g ∈ G (N) between i and j is a sequence of linksi1i2, i2i3, ..., iK−1iK such that ik ik+1 ∈ g for each k ∈ {1, ..., K − 1},with i1 = i and iK = j .⇒ Note, a walk may come back to a given node more than once,whereas a path is a walk that never hits the same node twice.
A cycle is a walk i1i2, i2i3, ..., iK−1iK that starts and ends at the samenode and such that all other nodes are distinct.
A geodesic between nodes i and j is a shortest path between thesenodes.
Instructor: Sergio Currarini () Social and Economic Networks PhD Economics - Fall 2012 8 / 102

Components and Connected Subgraphs
A network (N, g) is connected if for each i ∈ N and j ∈ N thereexists a path in (N, g) between i and j .A component of a network (N, g) is a nonempty subnetwork (N ′, g ′)such that ∅ 6= N ′ ⊂ N, g ′ ⊂ g ,
(N ′, g ′) is connected, andif i ∈ N ′ and ij ∈ g , then j ∈ N ′ and ij ∈ g ′.
That is, components of a network are the distinct maximal connectedsubgraphs of a network.
An example with four components:
Figure:
The set of components of a network (N, g) is denoted C (N, g). Thecomponent containing a specific node i is denoted by Ci (N, g).
Instructor: Sergio Currarini () Social and Economic Networks PhD Economics - Fall 2012 9 / 102

Trees, Stars, Circles and Complete Networks
A tree is a connected network that has no cycles.A star is a network such that there exists some node i such that everylink in the network involves node i (i is referred to as the center ofthe star).A complete network is on in which all possible links are presentA circle is a network that has a single cycle and is such that eachnode in the network has exactly two neighbors.
Complete Network
Star Network
Circle Network
Line Network
Figure:
Instructor: Sergio Currarini () Social and Economic Networks PhD Economics - Fall 2012 10 / 102

Neighborhood
The neighborhood of a node i is the set of nodes that i is linked to.
Ni (g) = {j : gij = 1}.
Given some set of nodes S , the neighborhood of S is the union of theneighborhoods of its members
NS (g) = ∪i∈SNi (g) = {j : ∃i ∈ S , gij = 1}.
Second degree neighbors (nodes that can be reached by walks oflength no more than 2), or two − neighborhood of a node i can bewritten as
N2i (g) = Ni (g) ∪ (∪j∈Ni (g )Nj (g)).
Inductively, all nodes that can be reached from i by walks of lengthno more than k make up the k − neighborhood of i , defined by
Nki (g) = Ni (g) ∪ (∪j∈Ni(g )
Nk−1j (g))
Instructor: Sergio Currarini () Social and Economic Networks PhD Economics - Fall 2012 11 / 102

Describing NetworksDegree Distributions
The degree of a node is its number of links in the network.
di (g) = #{j : gij = 1} = #Ni (g)
The density of a network is the average degree divided by n− 1.The degree distribution of a network is a description of the relativefrequencies of nodes that have different degrees.
P(d) is the fraction of nodes that have degree d under degreedistribution P.
In a regular of degree k we have P(k) = 1 and P(k ′) = 0 for allk ′ 6= k . Example with k = 2:
Figure:
Instructor: Sergio Currarini () Social and Economic Networks PhD Economics - Fall 2012 12 / 102

Describing NetworksDiameter and Average Path Length
The distance between two nodes is the length of (number of links) inthe shortest path or geodesic between them.
The diameter of a network is the largest distance between two nodesin the network.
Average path length (taken over geodesics)
Instructor: Sergio Currarini () Social and Economic Networks PhD Economics - Fall 2012 13 / 102

Cliquishness, Cohesiveness, and Clustering
Social networks tend to be tightly clustered. Variety of concepts forcohesiveness of a network
A clique is a maximal completely connected subnetwork of a givennetwork. If some set of nodes S ⊂ N are such that g |S is thecomplete network on the nodes S , and for any i ∈ N\S |S∪{i} is notcomplete, then the nodes S are said to form a clique. (Cliques arerequired to contain at least three nodes)
Instructor: Sergio Currarini () Social and Economic Networks PhD Economics - Fall 2012 14 / 102

Measuring Transitive Triplets (Clustering)
Overall Clustering : Look at all situations in which two links emanatefrom the same node (e.g., ij and ik both involve node i) and ask howoften jk is then also in the network. That is, if i has links with both jand k , how likely on average is it that j and k are also connected inthe network
Cl(g) = ∑i #{jk∈g |k 6=j ,j∈Ni (g ),k∈Ni (g )}∑i #{jk |k 6=j ,j∈Ni (g ),k∈Ni (g )} =
∑i ;j 6=i ;k 6=j ;k 6=i gijgikgjk∑i ;j 6=i ;k 6=j ;k 6=i gijgik
Individual Clustering: Computation on a node-by-node basis. Look atall pairs of nodes that are linked to i and then consider how many ofthem are linked to one another. Individual clustering for a node igiven by
Cli (g) =#{jk∈g |k 6=j ,j∈Ni (g ),k∈Ni (g )}#{jk |k 6=j ,j∈Ni (g ),k∈Ni (g )} =
∑j 6=i ;k 6=j ;k 6=i gijgikgjk∑j 6=i ;k 6=j ;k 6=i gijgik
Average Clustering:
ClAvg (g) = ∑i Cli (g)/n
Instructor: Sergio Currarini () Social and Economic Networks PhD Economics - Fall 2012 15 / 102

Centrality
So far, most measures discussed concerned with macro properties ofthe network. Centrality concerned with a node’s position in thenetwork.
Four main groups:
degree: how connected a node iscloseness: how easily a node can reach other nodesbetweenness: how important a node is in terms of connecting othernodesneighbors’ characteristics: how important, central or influential a node’sneighbors are
Instructor: Sergio Currarini () Social and Economic Networks PhD Economics - Fall 2012 16 / 102

Degree, Closeness and Decay Centrality
The degree centrality of a node is given by
di (g )(n−1)
Closeness Centrality : Inverse of the average distance between i andany node j
(n−1)∑j 6=i n(i ,j)
,
where n(i , j) is the number of links in the shortest path between iand j .
Decay Centrality : Consider a decay parameter δ, where 1 > δ > 0and then consider the proximity between a given node and every othernode weighted by the decay
∑j 6=i δn(i ,j)
Instructor: Sergio Currarini () Social and Economic Networks PhD Economics - Fall 2012 17 / 102

Betweenness Centrality
A measure of centrality based on how well a node is situated in termsof the paths that it lies on.
Let Pi (kj) denote the number of geodesics between k and j that i lieson, and let P(kj) be the total number of geodesics between k and j .
Averaging across all pairs of nodes, the betweenness centrality of anode i is given by
∑k 6=j :i /∈{k,j}Pi (kj)/P(kj)(n−1)(n−2)/2 .
Instructor: Sergio Currarini () Social and Economic Networks PhD Economics - Fall 2012 18 / 102

Katz-Prestige
A node’s importance determined by how important its neighbors are.Relevant, for example, for citation rankings or Google page rankings.
Measures become self-referential. That is, the centrality of a nodedepends on how central its neighbors are, which depends on thecentrality of their neighbors, etc.
Katz Prestige, denoted as PKi (g), is the sum of the prestige of i ′s
neighbors divided by their respective degrees
PKi (g) = ∑j 6=i gij
Pkj (g )
dj (g )
Instructor: Sergio Currarini () Social and Economic Networks PhD Economics - Fall 2012 19 / 102

Katz-Prestige
Let gij = gij/dj (g) be the normalized adjacency matrix g so that thesum across any (nonzero) column is normalized to 1. We can thenrewrite
PK (g) = gPK (g)
To calculate the Katz prestige therefore reduces to find the uniteigenvector of g
In undirected networks a solution is simply the degree.
Instructor: Sergio Currarini () Social and Economic Networks PhD Economics - Fall 2012 20 / 102

Eigenvector Centrality
A way to avoid the reduction of Katz prestige measures to degreecentrality is to not normalize the network g .
Let C e(g) denote the eigenvector centrality associated with anetwork g . The centrality of a node is proportional to the sum of thecentrality of its neighbors
λC ei (g) = ∑j gijC
ej (g).
In Matrix notation
λC e(g) = gC e(g),
where λ is a proportionality factor. Thus, C e(g) is an eigenvector of g ,and λ is its corresponding eigenvalue. It is convention to use eigenvectorassociated with largest eigenvalue.
Instructor: Sergio Currarini () Social and Economic Networks PhD Economics - Fall 2012 21 / 102

Katz-centrality: preliminaries
The k-power of the adjacency matrix counts the k-order paths in thenetwork:
g =
0 1 1 01 0 0 11 0 0 10 1 1 0
;g2 =
2 0 0 20 2 2 00 2 2 02 0 0 2
; ...
Multiplying gk by the unit vector yields a vector in which the ith entryyields the total number of walks of length k emanating from i
g2 · 1 =
2 0 0 20 2 2 00 2 2 02 0 0 2
· 1 =
4444
.
Instructor: Sergio Currarini () Social and Economic Networks PhD Economics - Fall 2012 22 / 102

Katz-centrality
Power or prestige of a node simply a weighted sum of the walks thatemanate from it. A walk of length 1 is worth a, a walk of length 2 isworth a2, etc., for some parameter 0 < a < 1.
The vector of the prestige of nodes can be written as
PK2(g , a) = ag 1 + a2g21 + a3g31...
Rewrite as
PK2(g , a) = (1 + ag + a2g2...)ag 1.
For small enough a > 0 this is finite and can be written as
PK2(g , a) = (II − ag)−1ag 1
Instructor: Sergio Currarini () Social and Economic Networks PhD Economics - Fall 2012 23 / 102
Bonacich Centrality
Bonacich centrality is a direct extension of Katz prestige 2 andexpressed by
CeB(g , a, b) = (I − bg)−1ag 1,
where a > 0 and b > 0 are scalars, and b is sufficiently small so that theexpression is well defined.
CeB(g , a, b) = (1 + bg + b2g2...)ag 1 = (ag 1 + bg · ag 1 + b2g2 · ag 1...).
Start with base values of adi (g) for each node, and then evaluatewalks of length k to other nodes by a factor of bk times the basevalue of the end node. So, b captures how the value of beingconnected to another node decays with distance, while a captures thebase value on each node.
For b = a, Katz prestige 2 and Bonacich centrality coincide.
Instructor: Sergio Currarini () Social and Economic Networks PhD Economics - Fall 2012 24 / 102

Comparison of Centrality Measures
7
5
6
2
3
1
4
1,2,6 and 7 3 and 5 4Closeness (average distance) .4 .55 .6
Decay(δ = .50) 1.5 2.0 2.0Decay(δ = .75) 3.1 3.7 3.8Decay(δ = .25) .59 .84 0.75
Betweenness .0 .53 .60Eigenvector Centrality .47 .63 .54Katz-Prestige, a = 1/3 3.1 4.3 3.5
Bonacich Centrality, a = 1, b = 1/3 9.4 13 11
Instructor: Sergio Currarini () Social and Economic Networks PhD Economics - Fall 2012 25 / 102

Some Empirics and Stylized Facts
Small Worlds embody the idea that large networks tend to have smalldiameters and small average path length.
Experiment by Milgram: People had to route a letter to another personwho was not directly known to them. Letters were distributed tosubjects in Kansas and Nebraska, who were told the name, profession,and some approximate residential details about a ”target” person wholived in Massachusetts. Subjects were asked to pass the letter on tosomeone they knew and would be likely to know the target or to beable to pass it on to someone else who did, etc., with the objective ofgetting the letter to the target. About one quarter of the lettersreached their target, the median number of steps was 5 and themaximum 12.Small worlds found in many other contexts, such as actors starring in amovie together, coauthorship in scientific journals in various fieldsAdamic analyzes a sample of 157,127 web sites. There existed a pathstarting at one page and ending at another in 85.4% of the cases, withan average minimum path length of 3.1.
Instructor: Sergio Currarini () Social and Economic Networks PhD Economics - Fall 2012 26 / 102

Clustering
High clustering coefficients relative to what one would find if linkswere determined by an independent random process.
Newman reports clustering coefficients of 0.496 for computer science,0.45 in physics; Grossman 0.15 in mathematics. For physics network,a corresponding random network (with same average degree) wouldlead an expected clustering coefficient of 0.00018. Papers publishedin economics journals, with a clustering coefficient of 0.193, whereasa purely random network yields an expected clustering coefficient of0.000026 (10 000 times smaller than in the observed network).Similar results for movie actors and for web pages.
Instructor: Sergio Currarini () Social and Economic Networks PhD Economics - Fall 2012 27 / 102

Degree Distributions
Average degree varies across networks, but how about the distributionof degrees?
Scale free (power law) distributions not only frequently observed innetwork applications (e.g., see Goyal and van der Leij,Moraga-Gonzalez for economics coauthorship), but in many othercontexts: word usage (Estoup and Zipf), plant classifications (Willisand Yule), city size (Auerbach and Zipf) and article citations (Price).A word of caution: Many networks exhibit fat-tails (i.e., there are morenodes with relatively high and low degrees than what one would find iflinks were formed independently), but hard to find networks following astrict power law and often better fit by other distributions
Instructor: Sergio Currarini () Social and Economic Networks PhD Economics - Fall 2012 28 / 102

Correlations, Assortativity
Positive Assortativity : Relatively high-degree nodes have a tendencyto be connected to other high-degree nodes. Frequently found insocial networks.
Negative Assortativity : Frequently found in technological andbiological networks.
Individual Clustering : Rate of clustering among higher-degree nodesdecreases with degree: neighbors of a higher-degree node are lesslikely to be linked to one another compared to the neighbors of alower degree node.
Instructor: Sergio Currarini () Social and Economic Networks PhD Economics - Fall 2012 29 / 102

Some Further Observations I
Homophily : People are more prone to maintain relationships withpeople who are similar to themselves (age, race, gender, religion orprofession). Opportunity vs. Choice and group composition.The Strength of Weak Ties : Granovetter recorded not only whetherpeople used social contacts in employment searches, but also thestrength of the social relationships as measured by frequency ofinteraction. Surprisingly high proportion of jobs were obtainedthrough weak ties (defined by amount of time invested, emotionalintensity, intimacy and reciprocal services). Intuition: Individualsinvolved in a weak tie are less likely to have overlap in theirneighborhoods than individuals involved in a strong tie.Structural Holes : Refers to the absence of connections betweengroups (Burt). Individuals who fill structural holes, by offeringconnections between otherwise separated or sparsely interconnectedgroups, end up with power and control over the flow of informationand favors between groups. Managers filling structural holes withbenefits in form of bonuses and promotions.
Instructor: Sergio Currarini () Social and Economic Networks PhD Economics - Fall 2012 30 / 102

Some Further Observations II
Social Capital : Refers to a number of different concepts related tohow social relationships lead to individual or aggregate benefits in asociety. For example, Coleman emphasizes the role of closure, roughlycorresponding to high clustering, in the enforcement of social norms.Closure allows agents to coordinate their sanctioning of individualswho deviate from a social norm and can therefore help to enforceprescribed behavior; reputational concerns.
Diffusion : Social networks as conduits of information. Implicationsnot only for employment, but also about what movies they see, whichproducts they purchase, which technology they adopt, whether theyprotest, etc.
Instructor: Sergio Currarini () Social and Economic Networks PhD Economics - Fall 2012 31 / 102

Network Formation: Random ModelsErdos-Reny Model
Erdos-Reny: each link forms with independent probability p.
Poisson process with probability p and n(n− 1)/2 experiments.
Degree distribution (probability that a given node has degree k):
P(k) =
(n− 1
k
)pk(1− p)(n−1−k)
when n large approximated by Poisson distribution:
P(k) =(np)kenp
k !
Clustering: independence implies that given ij and ik the probabilityof jk is p. If pn constant, clustering tends to zero as n grows.
Instructor: Sergio Currarini () Social and Economic Networks PhD Economics - Fall 2012 32 / 102

Phase transitions in Erdos-Reny model:
threshold 1n2
: first links emerge;
threshold n−23 : probability 1 of one component with at least 3 nodes;
threshold 1n : cycles and a giant component with a nontrivial fraction
of nodes;
threshold log (n)n : one component.
Instructor: Sergio Currarini () Social and Economic Networks PhD Economics - Fall 2012 33 / 102

Random Models of Network FormationWatts-Strogatz Rewiring Model
Erdos-Reny do not generate high clustering and small diameter.
Watts and Strogatz show that these two features are notincompatible, and can be induced by a small number of rewired linksstarting from a regular network with high clustering.
Start from circle network with each agent connected with m nearestneighbors. We have high clustering but high diameter for large n.
Randomly select a link ij , delete it and connect i to a randomlyselected node outside i ’s neighborhood. Repeat the process.
They show that expected diameter becomes substantially small beforeexpected overall clustering is substantially reduced.
Instructor: Sergio Currarini () Social and Economic Networks PhD Economics - Fall 2012 34 / 102

Random Models of Network FormationGrowing Networks and Preferential Attachment
Erdos-Reny predict a Poisson degree distribution for large n - notconsistent with stylized facts.
Real life networks tend to display fatter tails: more ”little connected”and ”very connected” nodes.
Growing networks: dynamic process with increasing n.
Basic model: each newborn node forms m links picking randomlyamong older nodes.
The expected rate of change in node i ’s degree is:
ddi (t)
dt=
m
t
Trajectory of degree is given by:
di (t) = m + m · log(t
i).
Instructor: Sergio Currarini () Social and Economic Networks PhD Economics - Fall 2012 35 / 102

Find degree distribution: look for node i(d) with degree d at time t:
di(d)(t) = d .
All older nodes have higher degree:
Ft(d) = 1− i(d)
t.
For the present case:
d = m + mlog(t
i(d))
so that:d −m
m= log
(t
i(d)
)and (
t
i(d)
)= e
d−mm →
(i(d)
t
)= e−
d−mm
So the fraction of nodes with more than d is;
Ft(d) = 1− e−d−mm
.Instructor: Sergio Currarini () Social and Economic Networks PhD Economics - Fall 2012 36 / 102

Preferential attachment: newborn nodes forms m links with oldernodes with probability that is proportional with relative degree.
ddi (t)
dt= m
di
∑tj=1 dj (t)
= mdi
2mt=
di
2t.
Solution of differential equation:
di (t) = m( t
i
) 12
.
Let i(d) have degree d at t:
d = m
(t
i(d)
) 12
→ i(d)
t=
m2
d2.
We obtain:Ft(d) = 1−m2d−2
andft(d) = 2m2d−3
.Instructor: Sergio Currarini () Social and Economic Networks PhD Economics - Fall 2012 37 / 102

Special case of scale − free distribution P(d):
P(d) = cd−γ
with c = 2m2 and γ = −3.Relative probabilities of degrees of a fixed relative ratio are the sameindependent of the scale of those degrees
P(2)
P(1)=
2m22−3
2m21−3=
2m220−3
2m210−3=
P(20)
P(10).
Scale free distributions have ”fat tails” compared to Poissondistribution.
0 10 20 30 40 50
0.05
0.10
0.15
0.20
30 35 40 45 50
0.001
0.002
0.003
0.004
0.005
Figure: Average degree = 18, m = 3Instructor: Sergio Currarini () Social and Economic Networks PhD Economics - Fall 2012 38 / 102

Random-Search ModelsJackson-Rogers (AER 2007)
Pure preferential attachment predicts scale free distribution but noclustering.
Look at class of models that predict both scale free and clustering
Growing network: at each t a new node is born
Newborn forms m links with older nodes
Of these, mr are formed uniformly at random
Call the mr nodes found randomly ”parents”
Then the newborn searches ms nodes at random among the neighborsof the mr parents.
Search meetings are found through friends of friends.
Instructor: Sergio Currarini () Social and Economic Networks PhD Economics - Fall 2012 39 / 102

Find the expected change in in-degree of node i < t at time t:
ddi (t) =mr
t+ ms
mrdi (t)
t
1
mmr
where
mrdi (t)t is probability of i ’s in-neighbor being found;
1mmr
is probability that i is chosen among all nodes that are neighborsof t’s parents.
This reduces to (setting mrms
= r):
ddi (t) =mr
t+
msdi (t)
mt=
rm
(1 + r)t+
di
(1 + r)t
Solution is:c(1 + r)
11+r t
11+r − rm
Set initial condition d(i) = 0 to get:
d(t) = rm(t
i)
11+r − rm
Instructor: Sergio Currarini () Social and Economic Networks PhD Economics - Fall 2012 40 / 102

We can again obtain degree distribution:
Find i(d) : d = rm( ti(d)
)1
1+r − rm
Obtain: i(d)t = rm
d+rm
So F (d) = 1− rmd+rm
and degree distribution is given by:
P(d) =rm
(d + rm)2
A lower bound on clustering is given by:
1
(r + 1)m
Same model also exhibits assortativity and small diameter.
Instructor: Sergio Currarini () Social and Economic Networks PhD Economics - Fall 2012 41 / 102

Strategic Network Formation
Different from random-network models, explicit modeling of costs andbenefits that arise from various networks.
trading relationshipspolitical alliancesinformation sharingRD collaborationsemployer-employee relationshipsmarriagesprofessional collaborationsfriendship...
Predictions about which networks form, but also measures aboutwhich networks are ”best” from a society’s point of view. Tensionbetween individual incentives and societal welfare.
Instructor: Sergio Currarini () Social and Economic Networks PhD Economics - Fall 2012 42 / 102

Distance Based Utility
Generalization of symmetric connections model. Players obtain utilityfrom their direct connections and also from indirect connections, andutility deteriorates with the distance between individuals.
Let b : {1, ..., n− 1} → R denote the net benefit a player receivesfrom (indirect) connections as a function of the distance between theplayers. The distance-based utility model is one in which a player’sutility can be written as
ui (g) = ∑j 6=i :j∈Nn−1(g )
b(lij (g))− di (g)c
where lij (g) is the shortest path between i and j .
Let b(k) > b(k + 1) > 0 for any k and c ≥ 0.
Special case: Symmetric connections model, in which the benefits falloff exponentially with distance, so that b(k) = δk .
Instructor: Sergio Currarini () Social and Economic Networks PhD Economics - Fall 2012 43 / 102

The Coauthor Model
Negative Externalities due to links, i.e., an individual prefers that hisor her neighbors have fewer connections rather than more.Competition with other indirect connections for access to theindividual’s neighbors.
i ’s payoffs are given by
ui (g) = ∑j :ij∈g
(1
di (g )+ 1
dj (g )+ 1
di (g )dj (g )
)for di (g) > 0, and ui (g) = 1 if di (g) = 0. Note, there are no directlymodeled cost to links. Costs are implicit in the diluted synergy whenefforts are spread among more authors.
Instructor: Sergio Currarini () Social and Economic Networks PhD Economics - Fall 2012 44 / 102

More in General...
Model net payoffs or utility that each agent receives as a function ofthe network.
Payoff or utility function ui : G (N)→ R, where ui (g) measures thebenefit that i receives if network g is in place.
The utility function captures all benefits net of costs that a givenplayer experiences as a function of the network.
When studying network formation, it is critical that players are awareof changes in their own utility as they add or delete links, adding linksthat increase their payoffs and deleting those that decrease payoffs.
Issues in modeling network formation?
What technology of link formation? Does formation of a link requiremutual consent? What about severance of a link?Simultaneous or sequential formation?Possibility of coordination in forming and severing?How many of my links can I revise at a time?
Instructor: Sergio Currarini () Social and Economic Networks PhD Economics - Fall 2012 45 / 102

Problems with Nash Equilibrium
Consider two individuals and a choice whether to form a link or not.
Model link formation as announcement game: Players(simultaneously) announce whether to form a link or not. If bothannounce that they wish to form a link, it is formed. The link is notformed otherwise.
Assume the link is beneficial to both.
There is a Nash equilibrium where both players do not announce thelink. However, one would expect that in a social setting players areable to form the link if it is in their mutual interest.
Pairwise Stability captures the idea that two individuals should beable to coordinate on forming a link when it is in their mutual interestin a very simple way.
Instructor: Sergio Currarini () Social and Economic Networks PhD Economics - Fall 2012 46 / 102

Pairwise Stability
A network g is pairwise stable if
1 for all ij ∈ g , ui (g) ≥ ui (g − ij) and uj (g) ≥ uj (g − ij), and2 for all ij /∈ g , if ui (g + ij) > ui (g) then uj (g + ij) < uj (g).
A network is pairwise stable if no player wants to sever a link and notwo players want to add a link.
Pairwise stability is a weak notion: It only considers deviations on asingle link at a time.
May be too weak of a concept, as it could well be that
a player may not want to delete a single link, but finds it profitable todelete several links (and the network could still be pairwise stable);a player may not want to either delete or form a single link, but maywish to rearrange links;groups of players may find it profitable to coordinate and form links.
→ in these settings pairwise stability serves as a necessary, not a sufficientcondition for a network to be stable.
Instructor: Sergio Currarini () Social and Economic Networks PhD Economics - Fall 2012 47 / 102

Efficiency
Efficiency : A network g is efficient relative to a profile of utilityfunctions (u1, ..., un) if ∑i ui (g) ≥ ∑i ui (g ′) for all g ′ ∈ G (N).
Pareto Efficiency : A network g is Pareto efficient relative to(u1, ..., un) if there does not exist any g ′ ∈ G such thatui (g ′) ≥ ui (g) for all i , with strict inequality for some i .
A network Pareto dominates another if it leads to a weakly higherpayoff for all individuals and a strictly higher payoff for at least one.A network is then Pareto efficient if it is not Pareto dominated by anyother network.
Pareto domination indicates unanimity in the ordering between twonetworks.
However, a unanimous ordering can be quite rare and often large setof Pareto efficient networks → may therefore not be sufficientlydiscriminating.
Instructor: Sergio Currarini () Social and Economic Networks PhD Economics - Fall 2012 48 / 102

Pairwise Stability in the Symmetric Connections Model I
1 A pairwise stable network has at most one (nonempty) component.
2 For c < δ− δ2, the unique pairwise stable network is the completenetwork.
3 For δ− δ2 < c < δ, a star encompassing all players is pairwise stable,but for some n and parameter values in this range it is not the uniquepairwise stable network.
4 For δ < c , in any pairwise stable network each node has either nolinks or else at least two links.
Instructor: Sergio Currarini () Social and Economic Networks PhD Economics - Fall 2012 49 / 102

Pairwise Stability in the Symmetric Connections Model II
1) A pairwise stable network has at most one (nonempty) component.
Proof. Proof by contradiction. Assume, to the contrary, that there existtwo (nonempty) components and the network is pairwise stable.Consider a node i in one component and j connected to k in anothercomponent. The utility to i from linking to k is at least as large as themarginal utility to j from linking to k plus the value of an indirectconnection to j . Thus, the utility to i from linking to k is at leastuj (g)− uj (g − jk) + δ2. This is larger than the marginal value of the linkjk to j which has to be nonnegative since j does not wish to delete thelink jk given the pairwise stability of the network. By a similar argument,k sees an increase in payoffs by adding the link ik. This, however,contradicts pairwise stability.
Instructor: Sergio Currarini () Social and Economic Networks PhD Economics - Fall 2012 50 / 102

Pairwise Stability in the Symmetric Connections Model III
2) For c < δ− δ2, the unique pairwise stable network is the completenetwork.
Proof. Again by contradiction. Assume a network that is not complete.
The change in payoff from adding a link ij to any network g whichdoes not contain ij to player i is at least δ− δ2 − c > 0. Theconclusion then follows directly from pairwise stability.
Note, node i obtains δ− δ2 − c from linking to j and vice versa.Node k obtains δ− δ3 − c from linking to l , etc.
Instructor: Sergio Currarini () Social and Economic Networks PhD Economics - Fall 2012 51 / 102

Pairwise Stability in the Symmetric Connections Model IV
3) For δ− δ2 < c < δ, a star encompassing all players is pairwisestable, but for some n and parameter values in this range it is not theunique pairwise stable network.
Proof.
From c < δ we know that no player wants to delete any link in a star.From δ− δ2 < c we know know that no two peripheral players wishto add a link to a star network. Thus, the star is pairwise stable
The second part of the statement is shown by example. A four personcircle is pairwise stable with parameter range δ− δ2 < c < δ− δ3.
Instructor: Sergio Currarini () Social and Economic Networks PhD Economics - Fall 2012 52 / 102

Pairwise Stability in the Symmetric Connections Model I
4) For δ < c , in any pairwise stable network each node has either nolinks or else at least two links.
When c > δ, it follows that if ij ∈ g and di (g) = 1, thenui (g − ij)− ui (g) = c − δ > 0, and so g cannot be pairwise stable.Thus, no node has degree 1 in a pairwise stable network (each nodehaving at least two links is, of course, is not sufficient for pairwisestability).
Instructor: Sergio Currarini () Social and Economic Networks PhD Economics - Fall 2012 53 / 102
Efficiency I
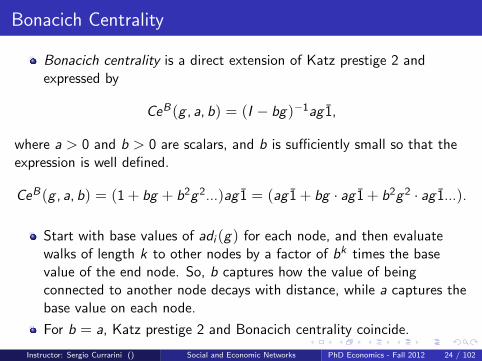
The unique efficient network structure in the distance-based utilitymodel is
1 the complete network if δ2 < δ− c ,
2 a star encompassing all nodes if δ− δ2 < c < δ + (n−2)2 δ2, and
3 the empty network if δ + (n−2)2 δ2 < c .
Instructor: Sergio Currarini () Social and Economic Networks PhD Economics - Fall 2012 54 / 102

Efficiency II
The unique efficient network structure in the distance-based utilitymodel is
1) the complete network if c < δ− δ2,
Proof. Note first that adding a link ij cannot decrease the utility ofany k /∈ {i , j} (distances cannot increase due to ij) and so if theutility to i and j increases as the result of adding a link, then totalutility increases. It is sufficient to show that adding any link benefitsthe two nodes involved in the link, regardless of the starting network.Note that adding a link ij cannot increase distances between themand any other nodes, and it decreases the distance between i and j .Thus, adding a link between i and j increases each of their utilities byat least δ− c − δ2, which is greater than 0 under 1).
Instructor: Sergio Currarini () Social and Economic Networks PhD Economics - Fall 2012 55 / 102

Efficiency III
2) a star encompassing all nodes if δ− δ2 < c < δ + (n−2)2 δ2
Proof. Note that connecting any k nodes involves at least k − 1 links. Astar network involves exactly k − 1 links. A star network with k − 1 linksleads to a total utility of
2(k − 1)(δ− c) + (k − 1)(k − 2)δ2.
To see this, note that in a star there are two types of nodes, the centerand the spokes. Payoffs for the center of a star with k nodes are given by(k − 1)(δ− c). For a spoke payoffs are (δ− c) + (k − 2)δ2. There arek − 1 spokes and payoffs therefore sum to the above expression.
Instructor: Sergio Currarini () Social and Economic Networks PhD Economics - Fall 2012 56 / 102

Efficiency III
Proof (continued). Note next that if a component has k nodes andm ≥ k − 1 links, then the value of the direct connections due to the linksis 2m(δ− c). This leaves k(k−1)
2 −m pairs of players who are at adistance of at least 2 from each other. The value of each such indirectconnection is at most δ2. Therefore, the overall value of a component withis m ≥ k − 1 is at most
2m(δ− c) + (k(k − 1)− 2m)δ2.
The difference between the expression of a star with k − 1 links and acomponent with m ≥ k − 1 links is given by
2(m− (k − 1))(δ2 − (δ− c)).
Instructor: Sergio Currarini () Social and Economic Networks PhD Economics - Fall 2012 57 / 102

Efficiency IV
Proof (continued). The difference between the first and the second aboveexpression is given by
2(m− (k − 1))(δ2 − (δ− c)).
Since δ2 > δ− c , this is greater than 0 when m > k − 1. Therefore, thevalue can only equal the value of the star when m = k − 1.Consider now networks with k − 1 links. Any network other than a starwith k − 1 links connecting k nodes leads to a total utility that is
2(k − 1)(δ− c) + X
where X < (k − 1)(k − 2)δ2. To see this, a network that is not a star andhas only k − 1 links among k nodes, then some of the nodes are at adistance of more than 2, and at most k − 1 pairs of nodes are directlyconnected. Thus if one chooses to involve k nodes and have exactly k − 1links, then a star is the most efficient architecture. Thus, whenδ2 > δ− c , efficient networks must involve some combinations of starsand disconnected nodes.
Instructor: Sergio Currarini () Social and Economic Networks PhD Economics - Fall 2012 58 / 102

Efficiency V
Proof (continued). Show next that if two stars (with k1 ≥ 1 and k2 ≥ 2nodes, respectively) yield nonnegative utility, then a single star amongk1 + k2 nodes leads to strictly higher total utility. Note that total utilityfrom a star with k1 + k2 nodes is
(k1 + k2 − 1)[2(δ− c) + (k1 + k2 − 2)δ2],
which is larger than
(k1 − 1)[2(δ− c) + (k1 − 2)δ2]+(k2 − 1)[2(δ− c) + (k2 − 2)δ2]
when both terms in this latter expression are nonnegative. Thus, ifδ2 > δ− c , then the efficient network is either a star involving all nodes orthe empty network.
The condition differentiating 2) and 3) is obtained by calculatingwhether the value of a star involving all n players is positive ornegative (i.e., setting k = n)
Instructor: Sergio Currarini () Social and Economic Networks PhD Economics - Fall 2012 59 / 102

Summary for the Proof of Efficiency
1 Derive the payoffs of a star consisting of k nodes (and k − 1 links)2 Derive the payoffs of a component of k nodes with m ≥ k − 1 links3 Substract 2) from 1) and note that the obtained expression is always
positive when m > k − 1 (for parameter range δ2 > δ− c). We nowknow that any configuration connecting k nodes with more thank − 1 links is not efficient.
4 Consider configurations connecting k nodes with k − 1 links, whichare not stars (a line, for example). Note that in any suchconfiguration, some nodes must be at a distance of more than 2.Therefore, a star is efficient when linking k nodes with k − 1 links. →The efficient network involves some combinations of stars anddisconnected nodes
5 Show that if two stars yield nonnegative utility, a single starencompassing all nodes of the two stars yields strictly larger payoffs.Therefore, if δ2 > δ− c , then the efficient network is either a starinvolving all nodes or the empty network (Set k = n to obtain therelevant bound).
Instructor: Sergio Currarini () Social and Economic Networks PhD Economics - Fall 2012 60 / 102
Stability and Efficiency in Co-author Model
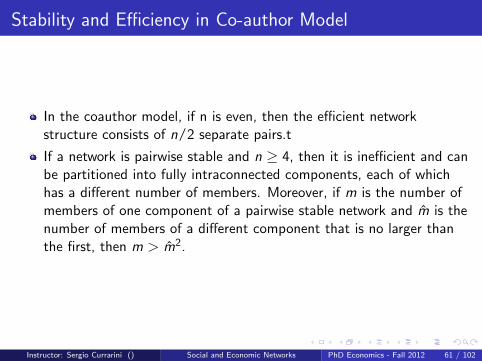
In the coauthor model, if n is even, then the efficient networkstructure consists of n/2 separate pairs.t
If a network is pairwise stable and n ≥ 4, then it is inefficient and canbe partitioned into fully intraconnected components, each of whichhas a different number of members. Moreover, if m is the number ofmembers of one component of a pairwise stable network and m is thenumber of members of a different component that is no larger thanthe first, then m > m2.
Instructor: Sergio Currarini () Social and Economic Networks PhD Economics - Fall 2012 61 / 102

Summary for the Proof of Pairwise Stability
1 Obtain a condition such that i finds it profitable to link with j .
2 Show that if di (g) = dj (g), then ij ∈ g . That is, agents with thesame degree are connected in a pairwise stable network (and, in fact,from the proof it is also clear that agents with a higher degree willfind it profitable to link to nodes with lower degree).
3 Show that if dh(g) ≤ max{dk(g) | ik ∈ g}, then i benefits from alink to h. Combining this with the previous step, we know that theset of agents can be partitioned into fully intraconnected components,each of which has a different number of members.
4 Obtain a condition for a node with lower degree not wanting to linkto a node with higher degree. Relative group size is increasing at leastquadratically.
Instructor: Sergio Currarini () Social and Economic Networks PhD Economics - Fall 2012 62 / 102
Pairwise Nash Stability
Pairwise stability overcomes the described difficulties with Nashequilibria of the link-announcement game, but restricts attention tochanges of only one link at time.
A network is pairwise Nash stable if it is both Nash stable andpairwise stable.
Instructor: Sergio Currarini () Social and Economic Networks PhD Economics - Fall 2012 63 / 102

Strong Stability
Allows for more than two players to coordinate their link formationdecisions
A network g ′ ∈ G is obtainable from g ∈ G through deviations byS ⊂ N if
1 ij ∈ g ′ and ij /∈ g implies {i , j} ⊂ S , and2 ij ∈ g and ij /∈ g ′ implies {i , j} ∩ S 6= ∅.
The above definition identifies changes in a network that can be madeby a coalition S without the consent of any players outside of S .
A network g is strongly stable with respect to a profile of utilityfunctions u = (u1, ..., u2) if for any S ⊂ N, g ′ that is obtainable fromg through deviations by S , and i ∈ S such that ui (g ′) > ui (g), thereexists j ∈ S such that uj (g ′) < uj (g).
Strongly stable networks are a subset of pairwise stable networks (andin fact a subset of the pairwise Nash stable networks).
Strongly stable networks often fail to exist.
Instructor: Sergio Currarini () Social and Economic Networks PhD Economics - Fall 2012 64 / 102

Sufficient Conditions for the Existence of PWS I
Absence of improving cycles related to the existence of an (ordinal)potential function.
Let us say that two networks are adjacent if they differ by only onelink
An ordinal potential function for a society N with payoff functionsu = (u1, ..., un) is a function f : G (N)→ R such that g ′ defeats g ifand only if f (g ′) > f (g) and g ′ and g are adjacent.
For a society N, the payoff functions u = (u1, ..., un) exhibit noindifference if for any two adjacent networks, one defeats the other.
Instructor: Sergio Currarini () Social and Economic Networks PhD Economics - Fall 2012 65 / 102

Sufficient Conditions for the Existence of PWS II
If a society (N, u) has an ordinal potential function, then there are noimproving cycles. Conversely, if a society is such that payoffs exhibitno indifference, then there are no improving cycles only if there existsa potential function.
Proof. (Second part). Assume that there are no improving cycles andpayoffs exhibit no indifference. Define f (g) to be the number of networksg ′ such that there exists an improving path from g ′ to g . We need toshow that f (g) is an ordinal potential function. Consider two adjacentnetworks g and g ′. If g defeats g ′, then every network that has animproving path leading to g ′ also has an improving path leading to g .Moreover, g ′ has an improving path leading to g , but the converse is nottrue, as otherwise there would be an improving cycle. Therefore,f (g) > f (g ′). Conversely, if f (g) > f (g ′) and g ′ defeated g , then wereach a contradiction by a similar argument. Thus f (g) > f (g ′) impliesthat g ′ does not defeat g , which by the no-indifference condition impliesthat g defeats g ′. Therefore, f is an ordinal potential function.
Instructor: Sergio Currarini () Social and Economic Networks PhD Economics - Fall 2012 66 / 102

Sufficient Conditions for the Existence of PNS
For a sufficient condition for existence of pairwise Nash stabilityadjust definitions accordingly. That is, the networks g 6= g ′ areweakly adjacent if either g ′ is either obtained from g by the additionof a single link or obtained by the deletion of some set of links suchthat there is some agent involved in all of the deleted links. Redefinedefeats, improving path, and improving cycle , ordinal potentialfunction accordingly. Above argument goes through.
Instructor: Sergio Currarini () Social and Economic Networks PhD Economics - Fall 2012 67 / 102

Directed Networks
Links can be formed unilaterally and Nash equilibrium becomes anappropriate modeling tool in a network formation game.
Whether the network should be conceived as directed or undirectedwill depend on the application. Examples for directed networks:Article citations, web page links.
Payoffs are again a function of the formed network, where g isdirected and ui (g) represents the utility of player i under network g .
Each player lists the set of directed links he wishes to extend. Thenetwork formed consists of the union of listed links
A network g ′ is obtainable from a network g by player i if g ′kj 6= gkjimplies that k = i .
A directed network g is (directed) Nash stable if ui (g) ≥ ui (g ′) foreach i and all networks g ′ that are obtainable from network g byplayer i .
Instructor: Sergio Currarini () Social and Economic Networks PhD Economics - Fall 2012 68 / 102

Two-Way Flow and Distance Based Utility
Two way flow allows for benefits of a link to be bilateral (while cost isborne by the agent who forms the link).
Given a directed network g , let g denote the undirected networkobtained by allowing an (undirected) link to be present where there isa directed link present in g , i.e. g = max(gij , gji ).
Let b : {1, ..., n− 1} −→ R denote the net benefit a player receivesfrom indirect connections as a function of the distance betweenagents. Distance based utility can be written as
ui (g) = ∑j 6=i :j∈Nn−1(g )
b(lij (g))− di (g)c ,
where lij (g) is the shortest path length between i and j in the undirectednetwork obtained from g and di (g) is i ′s out−degree. Letb(k) > b(k + 1) > 0 for any k and c ≥ 0.
Instructor: Sergio Currarini () Social and Economic Networks PhD Economics - Fall 2012 69 / 102

Efficiency
A directed network g is a directed star if the associated undirectednetwork g is a star, and if gij = 1, then gji = 0 (so that links betweentwo players only go in one direction).
The efficient networks in the directed version of the symmetricconnections model
1 consist of one directed link between each pair of players ifc < 2(δ− δ2),
2 are directed stars encompassing all nodes if2(δ− δ2) < c < 2δ + (n− 2)δ2, and
3 consists of the empty network if 2δ + (n− 2)δ2 < c .
Instructor: Sergio Currarini () Social and Economic Networks PhD Economics - Fall 2012 70 / 102

Nash Stable Networks
Similar results as in the undirected model with pairwise stability:
1 If c < δ− δ2, then the directed Nash stable networks are those thathave one directed link between each pair of players.
2 If δ− δ2 < c < δ, then any directed star encompassing all nodes isdirected Nash stable, and for some parameters there are other directedNash stable networks.
3 If δ < c < δ + (n−2)2 δ2, then peripherally sponsored stars are Nash
stable and so are other networks (e.g., the empty network).
4 If δ + (n−2)2 δ2 < c , then only the empty network is directed Nash
stable.
Main difference in the case of peripherally sponsored stars. Hub bearsno cost with directed links, but inefficiencies still arise as not allexternalities internalised.
Instructor: Sergio Currarini () Social and Economic Networks PhD Economics - Fall 2012 71 / 102

One Way Flow I
Benchmark case: Consider a one-way flow directed version of thesymmetric connections model with δ = 1.
Let Ri (g) denote the number of other players who can be reachedfrom i by a directed path in g . Then i ′s payoff is
ui (g) = Ri (g)− cdi (g),
where di (g) is i ′s out-degree.
A network is an n−player wheel if it consists of n directed links andhas a single directed cycle that involves n players.
A directed Nash stable network is strictly Nash stable if any changein the directed links from some player leads to a strictly lower payofffor that player.
Instructor: Sergio Currarini () Social and Economic Networks PhD Economics - Fall 2012 72 / 102

One Way Flow II
Proposition: The unique efficient network structure in a one-way flowmodel in which there is no decay and payoffs are as above are:
for c < n− 1, an n−player wheel andfor c > n− 1 the empty network.
Proposition: The (only) strictly Nash stable networks are
for c < 1, n−player wheelsfor 1 < c < n− 1, n−player wheels and empty networks andfor c > n− 1, the empty network.
Instructor: Sergio Currarini () Social and Economic Networks PhD Economics - Fall 2012 73 / 102

Efficiency I
The unique efficient network structure in a one-way flow model inwhich there is no decay and payoffs are as above is an n−player wheelif c < n− 1 and an empty network if c > n− 1.
Proof. First, show that a k−player wheel is the unique total-payoffmaximizing network among those that are nonempty, involve at least klinks, and for which exactly k players have a link in or out. The cost is atleast kc for any such network, which is the cost of a wheel. To have atleast as high a payoff as a wheel, it must be that Ri (g) = k − 1. Thus,there is a directed cycle containing all k players. If the network is not awheel, and it contains a directed cycle with k players, it has more than klinks, and so leads to a lower payoff than the k-player wheel. Thus the onlypossibilities besides wheels for efficient networks are the empty networkand networks that involve k players but have fewer than k links. In thelatter case, it must have k − 1 links to include k players in a component.
Instructor: Sergio Currarini () Social and Economic Networks PhD Economics - Fall 2012 74 / 102

Efficiency II
Proof (continued). In a component with k players and k − 1 links, theremust be a player i who has at least one link in but no links out, andanother player j who has at least one link out but no links in. Given that itis efficient for j to link to some k (and since j has no links in, only jbenefits from that link), adding a link from i to j would increase payoffs byeven more than the link from j to k does on the margin (sinceRi (g + ij)− Ri (g) ≥ 1 + Rj (g)− Rj (g − jk), which follows since ireaches j and Ri (g) = 0), which is a contradiction.Therefore, different wheels (and combinations of wheels) and the emptynetwork are the only possible efficient networks. The remainder of theclaim is straightforward, noting that if the value of a wheel with less thann players is positive, then the value of a wheel involving all players yields ahigher per capita payoff. The condition for the empty network is derivedform comparing the payoffs of an empty network to the wheel.
Instructor: Sergio Currarini () Social and Economic Networks PhD Economics - Fall 2012 75 / 102

Strictly Nash Stable Networks I
If c > n− 1, it follows directly that the only (strict) Nash network isthe empty network, since a link can lead to a marginal payoff of atmost n− 1− c.
If 1 < c < n− 1, the empty network is still a strict Nash equilibrium,as each link that a player adds changes that player’s payoff by1− c < 0.
If c < 1, it is clear that the empty network is not Nash stable. Theproof is completed by showing that when c < n− 1, any nonemptystrictly Nash stable network must be a wheel involving all players, asit is clear that such a network is strictly Nash stable.
Instructor: Sergio Currarini () Social and Economic Networks PhD Economics - Fall 2012 76 / 102

Strictly Nash Stable Networks II
Let c < 1 and consider a nonempty strictly Nash stable network.First, note that all players have an out-degree of at least 1. Supposenot. There is at least one player j who strictly benefits from a link jk,since the network is nonempty. By duplicating that link, a player iwith no outlinks would also strictly benefit, which contradictsequilibrium.
Instructor: Sergio Currarini () Social and Economic Networks PhD Economics - Fall 2012 77 / 102

Strictly Nash Stable Networks III
Next, note that each player must have at most one link coming in.Suppose to the contrary that players i and j both have links to playerk . By deleting the link to k and adding a link to j (or keeping the linkto j if i already has one), i ′s payoff cannot decrease, as there is still apath to k (and hence to all other players reached through k), and ihas not increased the number of links. Thus i benefits (at least)weakly from the change, and so the network cannot have been astrictly Nash stable network, which is a contradiction.
We have a network such that every player has at least one link outand at most one link in, and hence every player has one link in andone link out. This network must be a wheel including all players.
Instructor: Sergio Currarini () Social and Economic Networks PhD Economics - Fall 2012 78 / 102

A General Tension Between Efficiency and Stability
Let v(g define an aggregate value for g
Let u(v , g) define the allocation of v(g) across N.
We say that u(v , g) is component balanced if each component h of ggets its worth in u(v , g)
Theorem
(Jackson and Wolinsky 1996) Then there exists v such that for allcomponent balanced and symmetric u(v , g) no efficient network ispairwise stable.
Proof by example with n = 3:
v(12, 3) = v(13, 2) = v(23, 1) = 1
v(12, 23, 13) = 1
v(12, 23) = V (13, 12) = v(13, 23) = 1 + ε
Instructor: Sergio Currarini () Social and Economic Networks PhD Economics - Fall 2012 79 / 102

Constraints coming from component balancedness:
u1(12, 3) + u2(12, 3) = 1
u3(12, 3) = 0
u1(12, 3) + u2(12, 3) + u3(12, 3) = 1 + ε
Constraints coming from component symmetry:
u1(12, 3) = u2(12, 3)
u1(12, 23) = u3(12, 23)
Look at efficient network (12, 3): stability requires:
u1(12, 3) ≥ 12
u1(12, 3) ≥ 12
For ε < 16
Instructor: Sergio Currarini () Social and Economic Networks PhD Economics - Fall 2012 80 / 102

Reconciling Stability and Efficiency: Bargaining
Instructor: Sergio Currarini () Social and Economic Networks PhD Economics - Fall 2012 81 / 102

The Law of the Few
Instructor: Sergio Currarini () Social and Economic Networks PhD Economics - Fall 2012 82 / 102

Strategic Information Transmission in Networks
Instructor: Sergio Currarini () Social and Economic Networks PhD Economics - Fall 2012 83 / 102

Games on Networks
We will now assume that the network structure is fixed and want tounderstand how the structure of social networks influences behavior.
Peers exert a lot of influence on human behavior. Examples include:
Product choiceCriminal activityEducational attainmentProfessional choice
Two main scenarios:
Strategic complementarities: Players’ incentives to take a given actionincrease as more neighbors take that action. Choosing compatibletechnologies, pursuing education.Strategic substitutes: Players’ incentives to take a given actiondecrease as more neighbors take that action. Players may ”free ride”on the actions of their neighbors, such as when gathering informationand providing certain services.
Instructor: Sergio Currarini () Social and Economic Networks PhD Economics - Fall 2012 84 / 102

Graphical Games
Individual decisions often depend on the relative proportions ofneighbors taking actions, as in deciding whether to buy a product,change technologies, learn a language, smoke, engage in criminalbehavior, etc.
Potentially multiple equilibrium points: some people may be willing toadopt a new technology only if others do, and so it would be possiblefor nobody to adopt it, or for some fraction to adopt it.
Graphical Games: There is a set of N of players, with cardinality n,who are connected by a network (N, g). Each player i ∈ N takes anaction in {0, 1}. The payoff of player i when the profile of actions isx = (x1, x2, ...xn) is given by
ui (xi , xNi (g )),
where xNi (g ) is the profile of actions taken by the neighbors of i in thenetwork g .
Instructor: Sergio Currarini () Social and Economic Networks PhD Economics - Fall 2012 85 / 102

Remark
In a graphical game, player’s payoffs depend on the actions taken bytheir neighbors in the network. Nevertheless, a player’s behavior isrelated to that of indirect neighbors, since a player’s neighbors’behavior is influenced by their neighbors, and so forth, and inequilibrium conditions tie together all the behaviors in the network.
We can define the network to include links to all of the players thataffect a given player’s payoff. As an extreme case, if a player caresabout everyone’s behavior, we have the complete network, which is astandard game wit n players.
Instructor: Sergio Currarini () Social and Economic Networks PhD Economics - Fall 2012 86 / 102

Example: Threshold Game of Complements
Benefit from taking action 1 compared to action 0 (weakly) increaseswith the number of neighbors who choose action 1, so that
ui (1, xNi (g )) ≥ ui (0, xNi (g )) if and only if ∑j∈Ni (g )
xj ≥ ti ,
where ti is a threshold. If more than ti neighbors choose action 1, thenplayer i should choose 1 (and action 0 for fewer than ti neighbors).
Assume a cost to action 1 (e.g., investing in a new technology orproduct) and that the benefit of that action increases as moreneighbors undertake the action:
ui (1, xNi (g )) = ai ( ∑j∈Ni (g )
xj )− c ,
ui (0, xNi (g )) = 0,
for some ai > 0 and ci > 0. The threshold is such that if at least ti =ciai
neighbors choose action 1, then it is better for player i to choose 1, and 0otherwise.Instructor: Sergio Currarini () Social and Economic Networks PhD Economics - Fall 2012 87 / 102

Example: A ”Best-Shot” Public Goods Game
Opposite incentive structure. For example, if a player or any of theplayer’s neighbors take action 1, then the player obtains a benefit of 1(e.g., buying a product that is easily lent from one player to theother). Taking action 1 is costly, and a player would prefer that aneighbor take the action; but taking the action and paying the cost isbetter than having nobody take the action, where
ui (1, xNi (g )) = 1− c > 0
xj = 1, j ∈ Ni (g)⇒ ui (0, xNi (g )) = 1
xj = 0, ∀j ∈ Ni (g)⇒ ui (0, xNi (g )) = 0
Instructor: Sergio Currarini () Social and Economic Networks PhD Economics - Fall 2012 88 / 102

Equilibrium
In a graphical game, a pure strategy Nash equilibrium is a profile ofstrategies x = (x1, ..., xn) such that
Body Mathxi = 1⇒ ui (1, xNi (g )) ≥ ui (0, xNi (g ))
xi = 0⇒ ui (0, xNi (g )) ≥ ui (1, xNi (g ))
Instructor: Sergio Currarini () Social and Economic Networks PhD Economics - Fall 2012 89 / 102

Semi-Anonymous Graphical Games
In many situations a player’s choice is influenced mainly by therelative popularity of a given action among his or her neighbors and isnot dependent on the specific identities of the neighbors who take theaction.
These games are not quite anonymous: in a graphical game a playercares only about a subset of the other players’ actions.
But it is anonymous in the way that a player is influenced by his orher neighbors.
The player cares only about how many of the neighbors take action 0versus 1, but not precisely which of the neighbors take action 1 versusaction 0.Players have similar payoff functions: Differences between players arisefrom the network structure and not from some other innatecharacteristic. A player’s utility function depends on his degree and noton his label.
Instructor: Sergio Currarini () Social and Economic Networks PhD Economics - Fall 2012 90 / 102

Payoffs
Formally, a semi-anonymous graphical game is a graphical game suchthat the payoff to player i with a degree di who chooses action xi isdescribed by a function udi (xi , m), where m is the number of playersin Ni (g) taking action 1.
The payoff function is dependent on
the player’s degreethe player’s own action, andthe number of neighbors who take each action.
As the function depends on both the degree di and the number ofneighbors choosing action 1, m, we could equivalently have defined itto be a function of the degree and the fraction of players takingaction 1.
The ”Best Shot” Public Goods Game is a semi-anonymous graphicalgame. The threshold game is a semi-anonymous game when eachplayer’s threshold depends only on his or her degree (i.e., samethresholds for same degrees).
Instructor: Sergio Currarini () Social and Economic Networks PhD Economics - Fall 2012 91 / 102

Example: Local Public Goods Game
Generalize the best-shot public goods game to setting in which havingmultiple players take action 1 is better than having just one playertake the action.
Payoffs are given by
udi (xi , m) = f (xi + λm)− cxi ,
where f is a concave increasing function, and λ > 0 and c > 0 are scalars.
The case where λ = 1, f (k) = 1 for all k ≥ 1, and f (0) = 0corresponds to the best-shot public goods graphical game.
Instructor: Sergio Currarini () Social and Economic Networks PhD Economics - Fall 2012 92 / 102

Complements and Substitutes
In many applications incentives of a player to take an action eitherincrease or decrease as other players take the action.A semi-anonymous graphical game exhibits strategic complements ifit satisfies the property of increasing differences; that is, for all d andm ≥ m′ :
ud (1, m)− ud (0, m) ≥ ud (1, m′)− ud (0, m′).
A semi-anonymous graphical game exhibits strategic substitutes if itsatisfies the property of decreasing differences; that is, for all d andm ≥ m′ :
ud (1, m)− ud (0, m) ≤ ud (1, m′)− ud (0, m′).
These notions are said to apply strictly if the inequalities above arestrict when m > m′.Note that the marginal benefit of taking action 1 is weakly increasing(decreasing) in m for strategic complements (strategic substitutes).
Instructor: Sergio Currarini () Social and Economic Networks PhD Economics - Fall 2012 93 / 102

Equilibria and Thresholds
In semi-anonymous graphical games behavior of a given individual canbe succinctly captured by a threshold:
For strategic complements, there is a threshold t(d) such that if morethan t(d) neighbors choose action 1, then the player prefers action 1,while if fewer than t(d) neighbors choose 1, then the player prefers 0.(Agents may be indifferent at the threshold).
For strategic substitutes, there also is a threshold, but the bestresponses are reversed.
Instructor: Sergio Currarini () Social and Economic Networks PhD Economics - Fall 2012 94 / 102

Proposition: Consider a semi-anonymous graphical game of strategiccomplements on a network (N, g) such that the threshold for takingaction 1 is non-increasing as a function of degree, so that t(d + 1) ≤ t(d)for each d . If we add links to the network to obtain a network g ′ (so thatg ⊂ g ′), then for any pure strategy equilibrium x under g , there exists anequilibrium x ′ under g ′ such that all players play at least as high an actionunder x ′ as under x .
In games of complements in which the threshold for taking action 1 isnonincreasing in degree, adding links will lead to (weakly) higheractions, as players will have more neighbors taking action 1.
→ Denser networks lead to higher numbers of players choosing 1.
Instructor: Sergio Currarini () Social and Economic Networks PhD Economics - Fall 2012 95 / 102

Behavior as the Network is Varied - Substitutes
Proposition: Consider a best-shot game on a network (N, g) and anypure strategy equilibrium x of g + ij . Either x is also an equilibrium of g ,or there exists an equilibrium under g in which a strict superset of playerschoose 1.
Although a particular equilibrium might not be an equilibrium when alink is added, any new equilibrium in the network with a new link hasa subset of players who take action 1 compared to some equilibriumof the old network. (In the above previous example, the graph in thebottom is also an equilibrium without the added link being present).
Therefore, there is a sense in which adding links implies fewer playersproviding the public good (i.e., adding links decreases actions iftracking how all equilibria change).
Instructor: Sergio Currarini () Social and Economic Networks PhD Economics - Fall 2012 96 / 102

Limited Information: Network Games
Agents may only know general features of the network
Own degreeNeighbours characteristics (but not neighbors’ degree)Degree distribution of the network
Game of incomplete information (look for Bayesian equilibrium)
Game is symmetric (among neighbors): role of the network is weaker(equivalent to drawing your opponents from a given distribution)
Get rid of multiplicities of equilibria, which are recurrent in graphicalgames.
Instructor: Sergio Currarini () Social and Economic Networks PhD Economics - Fall 2012 97 / 102

Quadratic Payoffs and Strategic Complementarities
Again assume that actions are continuously adjustable, but there arestrategic complementarities between players’ actions (e.g., crimenetworks).
Each player chooses an intensity with which he undertakes an activity.Let xi ∈ R+ indicate that intensity, so that higher xi corresponds togreater action. A player i ’s payoff is described by
ui (xi , x−i ) = aixi − bi2 x2
i + ∑j 6=i wijxixj ,
where ai ≥ 0 and bi ≥ 0 are scalars, and wij is the weight that player iplaces on j ′s action.
If wij > 0, then i and j ′s activities are strategic complements, whilethey are strategic substitutes if wij < 0.
Instructor: Sergio Currarini () Social and Economic Networks PhD Economics - Fall 2012 98 / 102

Best Responses
The payoff-maximizing action for player i is found by setting thederivative of the payoff ui (xi , x−i ) with respect to the action level xiequal to 0, which yields
xi =aibi+ ∑
j 6=i
wij
bixj .
Let gij = wij/bi (and set gii = 0). We can think of g as a weightedand directed network. This variable captures the relative dependenceof i ′s choice of action on j ′s choice. The vector of actions that satisfyabove equation is described by
x = α + gx ,
where x is the n× 1 vector of xi and α is the n× 1 vector of ai/bi . Ifai = 0 for each i , then we can write x = gx , so that x is a unit right handeigenvector of g . Otherwise,
x = (II − g)−1α.
Instructor: Sergio Currarini () Social and Economic Networks PhD Economics - Fall 2012 99 / 102
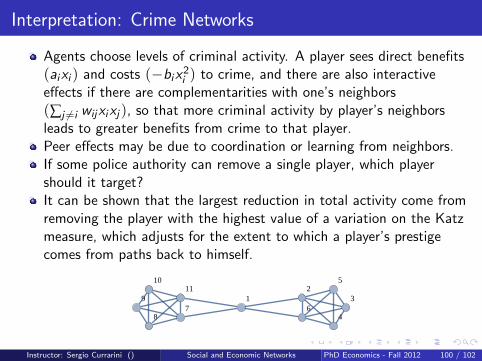
Interpretation: Crime Networks
Agents choose levels of criminal activity. A player sees direct benefits(aixi ) and costs (−bix
2i ) to crime, and there are also interactive
effects if there are complementarities with one’s neighbors(∑j 6=i wijxixj ), so that more criminal activity by player’s neighborsleads to greater benefits from crime to that player.Peer effects may be due to coordination or learning from neighbors.If some police authority can remove a single player, which playershould it target?It can be shown that the largest reduction in total activity come fromremoving the player with the highest value of a variation on the Katzmeasure, which adjusts for the extent to which a player’s prestigecomes from paths back to himself.
12
3
4
5
678
9
1011
Instructor: Sergio Currarini () Social and Economic Networks PhD Economics - Fall 2012 100 / 102

Network as Internal Organization of Groups
Instructor: Sergio Currarini () Social and Economic Networks PhD Economics - Fall 2012 101 / 102

Homophily and Segregation in Social Networks
Instructor: Sergio Currarini () Social and Economic Networks PhD Economics - Fall 2012 102 / 102


![PowerPoint Presentation · UNIVE I . hh.se HALMSTAD UNIVE I . hh.se HALMSTAD UNIVE I . hh.se HALMSTAD UNIVE I . Title: PowerPoint Presentation Author: Per-Ola Ulvenblad [peul] Created](https://img.pdfslide.us/doc/110x75/602fc2f942f8f67fe866b18d/powerpoint-presentation-unive-i-hhse-halmstad-unive-i-hhse-halmstad-unive.jpg)