Embed Size (px)
Citation preview
Social and Economic Impacts of TUUNGANE I | Mock Report 2011 1
Social and Economic Impacts of TUUNGANE I:
Mock Report
Macartan Humphreys1
Columbia University
Raul Sanchez de la Sierra
Columbia University
Peter van der Windt
Columbia University
Abstract
This is a mock report: it provides the structure of basic analysis of survey-based and behavioral measures for
assessing the impacts of the impact of TUUNGANE I, a major UK government funded Community Driven
Reconstruction Program implemented by IRC and CARE in Eastern DRC. We provide tests of the effects of
TUUNGANE on governance outcomes, social cohesion and welfare using a structure consistent with very
preliminary data presently being collected in the field. We emphasize that this data is a non-representative sample
of the ultimate data and that it has been scrambled for the purpose of the drafting of this mock report.
1 We have many many people to thank for their input into this document and design. At IRC thanks head of research Jeannie Annan and her predecessor Jodi Nelson, Research and Evaluation Advisor Tom Shaw and Charles Lor before him. Project directors have also provided tremendous insight; we thank Jana Frey, Sophie Dieselhorst, and Liz McBride especially. TUUNGANE area coordinators, evaluation, and project staff have also been very generous. We thank especially Deogracias Mulewa and Jean Paul Zibika. Our warm appreciation too to Professor Chimanuka Bantuzeko and Gabriel Kalaba who are leading data collection efforts in the field. Lots of support has also come from Columbia, we thank Caroline Peters for a million things, Eric Mvukiyehe for piloting many survey questions at baseline, Simon Collard-Wexler for piloting key endline questions, and Grant Gordon for piloting the behavioural measures (and a lot more besides). We thank members of CAPERS as well as participants at the Bukavu 2010 summer workshop and the CSDS social cohesion workshop. Other colleagues we thank for generous advice are Don Green, Kosuke Imai, Jake Bowers, Chris Udry, Chris Blattman. We acknowledge financial support for Columbia’s role from 3IE, and DFID for funding for the implementation of the evaluation.

Social and Economic Impacts of TUUNGANE I | Mock Report 2011 2
CONTENTS
1 Introduction .................................................................................................................................. 6
1.1 RAPID Measurement Strategy ..................................................................................................... 7
1.2 Note on Interpretation of Mock Report results .......................................................................... 8
2 Results I: Governance .................................................................................................................... 8
2.1 Participation ................................................................................................................................ 8
2.1.1 RAPID meeting turnout ....................................................................................................... 9
2.1.2 Discussion Dynamics ......................................................................................................... 10
2.1.3 Are committee and projects selected by a lottery or an election? ................................... 10
2.1.4 Who decides? .................................................................................................................... 11
2.1.5 Who contributes? Participation in Public Good Provision ................................................ 12
2.1.6 Rights and Obligations in regards to Decision-Making ..................................................... 12
2.2 Accountability ............................................................................................................................ 14
2.2.1 Presence of Accountability Mechanisms .......................................................................... 14
2.2.2 Complaints ......................................................................................................................... 15
2.3 Efficiency ................................................................................................................................... 17
2.3.1 Quality of Accounting ........................................................................................................ 17
2.3.2 Speed of Information Transmission .................................................................................. 17
2.3.3 Seeking Support from External Actors .............................................................................. 19
2.4 Transparency ............................................................................................................................. 20
2.4.1 Knowledge about RAPID ................................................................................................... 20
2.4.2 Willingness and Ability to seek information ..................................................................... 21
2.5 Capture of Outcomes/Equity .................................................................................................... 21
2.5.1 RAPID: Financial Irregularities (From Audit) ...................................................................... 21
2.5.2 RAPID: Number of Beneficiaries ........................................................................................ 22
2.5.3 RAPID: Inequality of the distribution of Benefits .............................................................. 23
2.5.4 RAPID: Dominance of Chief’s Preferences over other villagers’ preferences (Power) ..... 23
3 Results II: Social Cohesion ........................................................................................................... 25
3.1.1 RAPID: Distribution of benefits across social categories ................................................... 25
3.1.2 Trust: Willingness to lend money to other village members ............................................ 26
3.1.3 Presence of Cleavages in the Village ................................................................................. 26
3.1.4 Inter-Village Cooperation ................................................................................................. 26
4 Results III: Welfare ...................................................................................................................... 28
4.1 Income ....................................................................................................................................... 28
4.2 Productivity ............................................................................................................................... 28
4.3 Assets ........................................................................................................................................ 30
4.3.1 Household Assets .............................................................................................................. 30
4.3.2 Quality of housing ............................................................................................................. 31
4.4 Outcomes .................................................................................................................................. 31

Social and Economic Impacts of TUUNGANE I | Mock Report 2011 3
4.4.1 School attendance ............................................................................................................. 31
4.4.2 Sickness ............................................................................................................................. 31
4.4.3 Rate of Accessing Services ................................................................................................. 32
5 Conclusions ................................................................................................................................. 34

Social and Economic Impacts of TUUNGANE I | Mock Report 2011 4
Tables
Table 1: Primary Hypotheses ...................................................................................................................... 6
Table 2: The RAPID process ......................................................................................................................... 7
Table 3: Attendance† .................................................................................................................................. 9
Table 4: Interventions† ............................................................................................................................. 10
Table 5: Selection Mechanisms ................................................................................................................. 11
Table 6: Influence of TUUNGANE on Selection Mechanisms .................................................................... 11
Table 7: Male Dominance in Committees ................................................................................................. 11
Table 8: TUUNGANE Effect on Committee Composition .......................................................................... 12
Table 9: TUUNGANE Effect on Public Good Provision .............................................................................. 12
Table 10: Rights to Participate .................................................................................................................. 13
Table 11: Free to Participate ..................................................................................................................... 13
Table 12: Duties to Participate .................................................................................................................. 14
Table 13: Presence of Accountability Mechanisms ................................................................................... 15
Table 14: Complaints (Privately expressed) .............................................................................................. 16
Table 15: Influence of TUUNGANE on Citizen Complaints Regarding RAPID ............................................ 16
Table 16: Existence and Quality of Accounting ......................................................................................... 17
Table 17: Level of Health Knowledge ........................................................................................................ 19
Table 18: Seeking Support from External Actors ...................................................................................... 19
Table 19: Knowledge of Project Amount .................................................................................................. 20
Table 20: Willingness to Seek Information ............................................................................................... 21
Table 21: Traceability of money ................................................................................................................ 22
Table 22: Proportion of respondents who received transfers from RAPID .............................................. 23
Table 23: Mean deviation of benefits distributed .................................................................................... 23
Table 24: TUUNGANE effect on Chief dominance† ................................................................................... 24
Table 25: Distribution of Benefits ............................................................................................................. 25
Table 26: Distribution of Benefits to Migrants .......................................................................................... 25
Table 27: Trust ........................................................................................................................................... 26
Table 28: Presence of Cleavages ............................................................................................................... 26
Table 29: Inter-village Cooperation........................................................................................................... 27
Table 30: Household income ..................................................................................................................... 28
Table 31: Respondent productivity ........................................................................................................... 29
Table 32: Household agricultural production ........................................................................................... 30
Table 33: Household Assets ...................................................................................................................... 30
Table 34: Wall Quality ............................................................................................................................... 31
Table 35: Days of attendance at school (last 2 weeks) ............................................................................. 31
Table 36: Sickness during last two weeks ................................................................................................. 32
Table 37: Rate of Accessing Services ......................................................................................................... 32
Table 38: Summary Table .......................................................................................................................... 34

Social and Economic Impacts of TUUNGANE I | Mock Report 2011 5
Figures
Figure 1: Distribution of Number of Meeting Attendees across all Villages ............................................... 9
Figure 2: Meeting Attendees as a Function of Village Size ......................................................................... 9
Figure 3: Health Information ..................................................................................................................... 18
Figure 4: Health Knowledge ...................................................................................................................... 18
Figure 5: Villager Knowledge of Project Funds ......................................................................................... 20
Figure 6: Amount Not Verifiable ............................................................................................................... 22
Figure 7: Household Income in the Last two Weeks ($) ........................................................................... 28
Figure 8: Productivity ................................................................................................................................ 29
Figure 9: Rate of Access to Services .......................................................................................................... 33

Social and Economic Impacts of TUUNGANE I | Mock Report 2011 6
1 Introduction We describe mock results from an evaluation of the impacts of a major post conflict development program in East
Congo, TUUNGANE. TUUNGANE is a Community Driven Reconstruction intervention, funded by the UK
government and implemented by the International Rescue Committee (IRC) and CARE between 2007 and 2011.
The program is designed both to support economic recovery and to improve the quality of governance and social
cohesion. This research is designed to measure whether these objectives are in fact met.
In order to measure the effectiveness of TUUNGANE, our research uses a method of randomized intervention
which allows us to observe a set of control communities that are similar (in expectation) to the TUUNGANE
communities in every respect except for the presence of the program. In all 280 communities have been assigned to
treatment conditions through public lotteries. Among a subsample of those selected, a random set of communities
implement a variation of the program in which community development committees are required to have gender
parity. Outcome measures include both survey-based measures and behavioral measures.
The primary hypotheses of our study in the areas of governance, cohesion, and welfare are shown in Table 1.
These hypotheses were formed jointly by the research team and IRC in 2007 and are contained in the Tuungane
Impact Evaluation Framework2. A broader set of secondary hypotheses relating to variations in implementation,
heterogeneous effects, contextual factors, unintended consequences, behavioral outcomes, and measurement
strategies are described in the document TUUNGANE I: Outcomes and Data Sources (“ODS”).
Table 1: Primary Hypotheses
# Category Hypothesis Table(s)
H1 Cohesion Individuals in TUUNGANE communities will exhibit higher levels of acceptance of others into their communities.
Table 23, Table 25, Table 26
H2 Cohesion Individuals in TUUNGANE communities will exhibit higher levels of trust in other members of their communities.
Table 27
H3 Cohesion /Participation
TUUNGANE communities will be more willing to contribute time and effort individually to collective goods.
Table 9
H4 Cohesion TUUNGANE target communities will be more likely to work together to solve local development problems.
Table 28
H5 Accountability Communities will be more proactive in seeking support from local government and NGOs for community initiatives and the private sector.
Table 18
H6 Cohesion Villages in TUUNGANE communities will have a greater propensity to work collectively with other villages to address development challenges.
Table 29
H7 Participation Individuals in TUUNGANE communities will report a greater sense of a right to take part in local decisions.
Table 4,
H8 Participation Individuals in TUUNGANE communities will report a greater sense of obligation to take part in local decisions.
Table 12
H9 Transparency Individuals in TUUNGANE communities will report greater knowledge about local decision-making processes and outcomes
Table 17, Table 19, Table 20
H10 Accountability Individuals in TUUNGANE communities will report an increased willingness to hold traditional and political leaders accountable.
Table 13, Table 14, Table 15
H11 Participation Individuals in TUUNGANE communities are more likely to believe that local leaders should be elected rather than selected through an alternative mechanism.
Table 5, Table 6
H12 Welfare Access to community utilities and infrastructure, including those not directly supported by TUUNGANE, will be greater in TUUNGANE communities. [As evidenced by improved health and education indicators]
Table 35, Table 36, Table 37
H13 Welfare Household Income and asset holdings will be greater in TUUNGANE communities.
Table 30, Table 33, Table 34
H14 Welfare Households will allocate a greater share of their time to productive activities in TUUNGANE communities.
Table 31, Table 32
H15 Welfare Time devoted to productive activities not directly associated with TUUNGANE projects will increase.
Table 31, Table 32
Note: Primary hypotheses from the 2007 design document. For further hypotheses see Outcomes and Data Sources (2011).
2 http://www.columbia.edu/~mh2245/DRC/DRC_DESIGN.pdf

Social and Economic Impacts of TUUNGANE I | Mock Report 2011 7
In this report we provide mock results on key measures to test these primary hypotheses as well as a set of related
behavioral hypotheses that capture further dimensions of the quality of local governance. We organize our
presentation by theme rather than by hypothesis number, first examining impacts on five dimensions of governance,
(Section 2) then examining impacts on social cohesion (Section 3) and on welfare (Section 4).
1.1 RAPID Measurement Strategy
As with other evaluations, the reliability of the lessons learned from this evaluation depends not just on the
identification strategy (here, randomization) but also on the quality of outcome measures. Since community driven
reconstruction (CDR) programs seek to affect social outcomes they confront particular measurement challenges. In
particular it can often be difficult to determine from responses to survey questions alone whether there have been
real changes in attitudes and behavior. Recent evaluations of CDR programs have thus found the use of behavioral
measures to be a stronger and less ambiguous method of measurement than relying solely on survey measures.
Table 2: The RAPID process
Description Duration Lead Features
A Team A schedules
VILLAGE meeting
2 days
Project
Team
The project team has an initial visit with the chief to ask that he
convene a public meeting at which a minimum share of the village
population is required to attend.
VILLAGE meeting
and Project
Description Forms
Project
Team
The RAPID project is described to the village. Measures of the quality
of participation are taken at these meetings. The village is asked to
take steps towards determining how to use of project funding.
B Collection of Forms Brief visit Project
Team
Measures of the village’s decisions regarding how to use funding and
who is entrusted to manage it are collected.
C Disbursement of
Funds by IRC Brief visit
IRC/
CARE
Funds are disbursed. Measures of accountability, transparency, and
capture are taken with respect to the way that funds are received and
how they are subsequently reported.
• Auditing procedures are confirmed, with 50% of villages told that the audit is certain and 50% that is simply possible. Broad results from audits are reported at village meetings.
• The amount provided to villages will be $1000, $100 more than the minimum guaranteed. This difference provides a means of measuring the extent to which financial information is communicated in communities beyond what is stipulated by the project structures.
D Auditing
2 days
Audit
Team
Auditing is undertaken to examine capture, efficiency, transparency,
and steps towards accountability that are taken.
Follow-up Surveys Survey
Team
Measures are included in the final survey and a supplementary survey
to determine the transparency of the process, the quality of
participation in village decision-making, and the efficiency and equity
of outcomes.
Given the importance and scale of the current evaluation we seek strong outcome measures. In particular we seek
measures that record behavioral change in terms of outcomes of direct interest to policy formulation. The key
features of our strategy are as follows:
• 560 villages (half of which have participated in TUUNGANE and half of which have not) are participating in
a new unconditional cash transfer program (RAPID: Recherche-Action sur les Projets d’Impact pour le
Développement) in which they determine how to make use of $1000 of unconditional project funding.

Social and Economic Impacts of TUUNGANE I | Mock Report 2011 8
• Detailed measurement strategies will be employed to assess the extent to which funds are used in a more
accountable and transparent manner in TUUNGANE treatment relative to control areas.
The RAPID project involves four steps spread out over the course of two to three months. The key features of these
steps are described in Table 2.
1.2 Note on Interpretation of Mock Report results
The results presented in this report provide the simple comparisons of outcomes in treatment and control
communities.3 Because of the random assignment to treatment this comparison gives unbiased estimates of the
causal effect of the program on outcomes of interest.
The results presented in the present report are however preliminary in a number of ways. First the data is at present
extremely limited in quantity. Data is gleaned from the initial stages of data collection in two out of the 4 provinces
slated for evaluation and represent between about 2% and 15% of the data on various measures. Second, since the
order of implementation is not random, this data cannot be considered a representative sample of the ultimate
dataset. Third, the data used here is only partially cleaned as cleaning operations are most efficiently done in large
batches.
With such a small and unrepresentative dataset any results reported here, positive or negative, should be treated
with great caution. Focus at this stage should be on the form of hypothesis testing being employed and not on any
particular results.
Moreover it should be noted that the kinds of results that can be reported for small samples is different for what can
be reported for large samples. For example our scope to disaggregate data (for example by area, by gender, by
background characteristics) is very weak, as is our ability to make use of baseline data.
Finally for the mock report, the data used is not only of limited quantity, unrepresentative, and not fully cleaned, it
has also been “scrambled”: in particular we deliberately employ a false indicator of whether a village took part
in TUUNGANE or not.4 This helps in maintaining the present focus on design rather than on results. Discussion of
mock results are grayed out in the present text.
2 Results I: Governance We examine five dimensions of governance: participation, accountability, efficiency, transparency, and capture.
2.1 Participation
We define participation as the extent to which villagers are willing and able to be part of public decision
making. The behavioral data collection is designed to provide multiple natural points to measure the quality of
participation in public decision making, both in terms of who takes part and how they take part.
3 As per the analysis plan these will be weighted by inverse propensity weights and sampling weights in future iterations. The analysis plan also provides a specification with controls which is expected to provide more precise estimates as well as two robustness checks. 4 All hypotheses examined here were developed ex ante (in 2007) and specified without reference to evidence on treatment
effects. In all but three cases, tables were developed by the research team without accessing actual data on treatment and data has not been accessed by the researchers at the time of circulation of this mock report. The exceptions are indicated here and in the Outcomes and Data Sources document with a dagger marking†.

Social and Economic Impacts of TUUNGANE I | Mock Report 2011 9
2.1.1 RAPID meeting turnout
One of the first measures of participation collected during the behavioral exercise is the number of people that
attend the initial meeting to learn about the RAPID project. Given the opportunity costs of participating in a meeting
of this form (no compensation was provided), we interpret attendance to indicate interest in civic participation (either
on the part of the villager or on the part of the chief or other mobilizers).
Figure 1 provides a histogram of the overall attendance levels. On average approximately 150 adults participated in
these first meetings (from villages with an average of 550 adult members) with attendance close to linear in
population size (see Figure 2). In general attendance rates were higher among men than among women
(approximately 56% of attendees were male). Table 3 provides the effect of participation in TUUNGANE on
attendance.
Table 3: Attendance†
Women Men All Average Adult Attendance 56 76 134 TUUNGANE effect on attendance 0.48 1.52 1.21
(se) (6.20) (3.39) (3.14)
N (number of villages) 129 129 129 Note: Based on questions AM 16 and AM 17.
Figure 1: Distribution of Number of Meeting Attendees across all Villages
Note: Histogram shows the number of people attending Step A meetings in RAPID areas. Based on measures AM16 and AM17.
Figure 2: Meeting Attendees as a Function of Village Size
Note: Scatter plot of attendance against population size. The upper (green) line shows the estimated village size, the
lower (red) line marks the 25% threshold for attendance. Points between these lines correspond to villages that
exceeded the 25% threshold. Points below are places that fell short. Based on measures AM16 and AM17.
0.0
02
.00
4.0
06
.00
8D
en
sity
0 100 200 300 400MEETING A TOTAL PARTICIPATION
01
00
20
030
040
050
0
0 500 1000 1500 2000Step A VIllage Size estimate

Social and Economic Impacts of TUUNGANE I | Mock Report 2011 10
2.1.2 Discussion Dynamics
A straightforward but difficult to assess measure of participation is the extent to which individuals take part in public
deliberations. To capture this feature we directly observed community discussion during the initial RAPID meeting
to assess how many and which citizens were active in the conversation. The first meeting provided the opportunity
for communities to learn more about the RAPID project and discuss what they would like to do with RAPID funding.
Although the presence of the research team made this an inherently atypical village gathering, the meeting
nevertheless provided an occasion for would-be participants to engage early and substantively in the RAPID
process.
As can be seen in Table 4, discussion interventions were dominated by men and by elders. Men accounted for 76%
of interventions5 (but 56% of the participants) and elders accounted for 67% of interventions (but just 54% of
participants). Chiefs intervened more than typical participants on average but still accounted for only 4% of
interventions.
The effect of TUUNGANE on these outcomes is mixed. While the total number of interventions and the number of
male interventions is lower in TUUNGANE areas, the number of female interventions is higher.
Table 4: Interventions†
Number of
interventions
Number of male
interventions
Number of female
interventions
Proportion of interventions that are male
Proportion of interventions by the elderly
Proportion of interventions by the Chief
Average 15 11 4 76% 67% 4%
TUUNGANE
effect -0.02 -0.36 0.35 -0.04 0.01 0.01
(se) (1.11) (0.90) (0.50) (0.03) (0.01) (0.01)
N 130 130 130 130 130 130 Note: Based on AD1.
2.1.3 Are committee and projects selected by a lottery or an election?
Examination of behavior in the RAPID project allows us to assess the extent to which participation in TUUNGANE
leads to greater adoption of participatory processes in the planning of public projects. Communities were required to
select both a committee structure and a project as part of the terms of receiving RAPID funds, although there was
no stipulation regarding how either of these was to be chosen.
We gathered information on how the committees were formed from multiple sources (citizens, committee members,
RAPID project staff). Below we report the summary judgment of our enumeration team after leading two
simultaneous focus groups, one with members of the committee and a second with ordinary villagers during step B
of the RAPID process. This determination classifies the process as being either electoral, through lottery, by
consensus, imposed by the chief or elders, other or unknown. Our interest is in the use of elections and other
participatory processes.
Overall approximately 58% of committees and 38% of projects were coded as selected though election. Areas that
selected committees using electoral approaches also selected projects in this way almost two thirds of the time.
Groups that did not select committees democratically generally also did not use elections when selecting projects.
5 An intervention is a distinct statement, question, or argument made by an individual during a meeting. Interventions may vary considerably in length.
Social and Economic Impacts of TUUNGANE I | Mock Report 2011 11
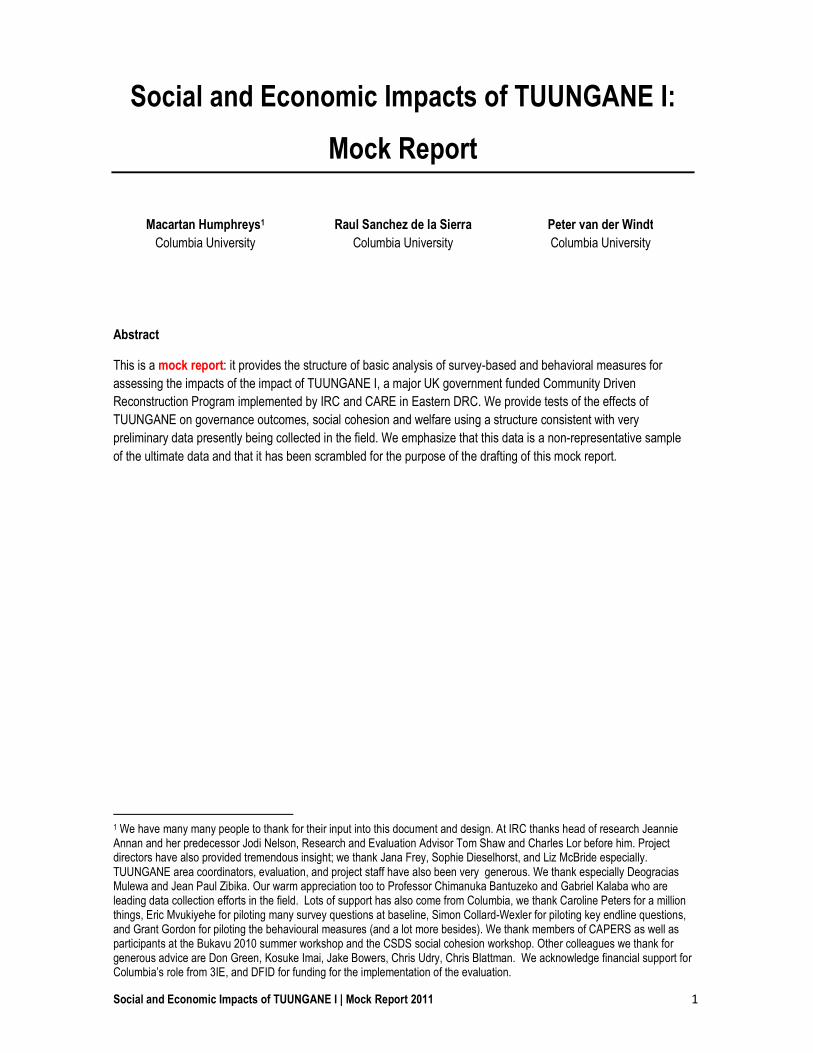
Table 5: Selection Mechanisms
Project selected by election? No Yes Total Committee selected by election?
No 49 2 51 Yes 28 45 73
Total 77 47 124 Note: Based on measures B 32 and B33.
Table 6: Influence of TUUNGANE on Selection Mechanisms
Committee Project
Selected by elections
Selected by elections or lottery or consensus
Selected by elections
Selected by elections or lottery or consensus
Average 58% 81% 38% 77%
TUUNGANE effect -0.15* -0.01 -0.05 0.01 (se) (0.09) (0.07) (0.09) (0.08) N 124 124 124 124
Note: Table 6 shows the prevalence of different types of selection procedures as well the effects of TUUNGANE on
the choice of selection mechanism. Based on data from B32 and B33.
We see that most areas use election processes of some form and in the vast majority of cases some form of
participatory approach is used.
2.1.4 Who decides?
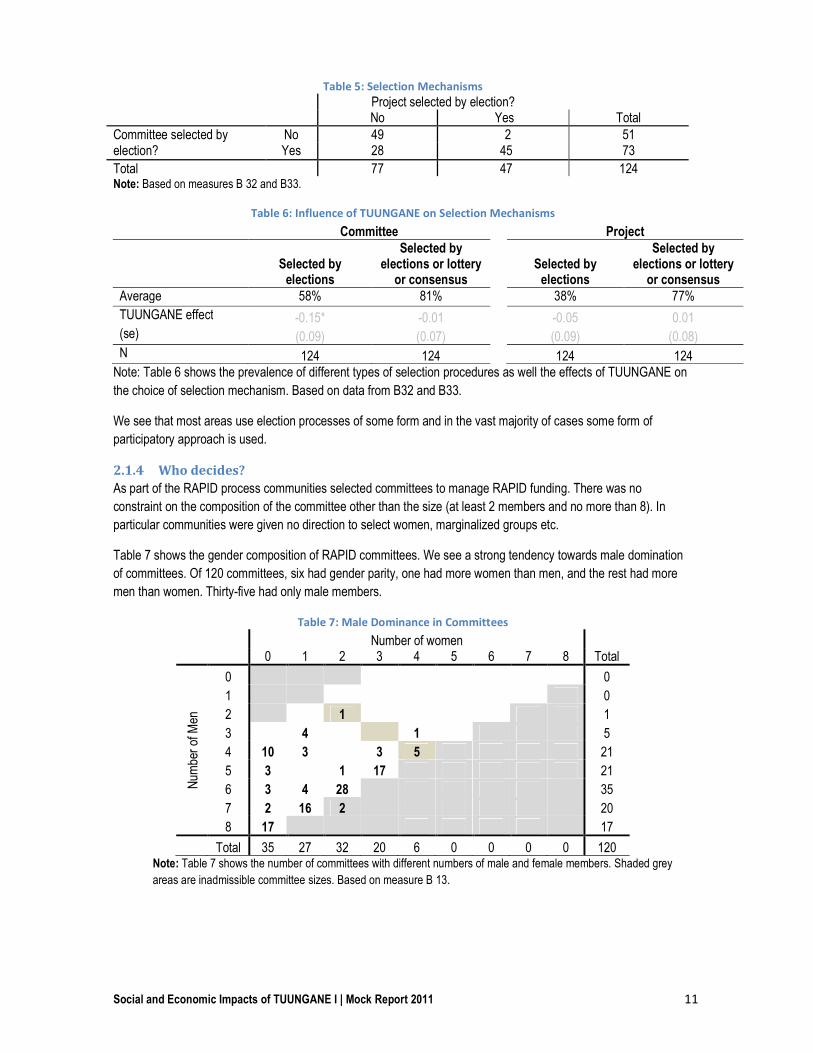
As part of the RAPID process communities selected committees to manage RAPID funding. There was no
constraint on the composition of the committee other than the size (at least 2 members and no more than 8). In
particular communities were given no direction to select women, marginalized groups etc.
Table 7 shows the gender composition of RAPID committees. We see a strong tendency towards male domination
of committees. Of 120 committees, six had gender parity, one had more women than men, and the rest had more
men than women. Thirty-five had only male members.
Table 7: Male Dominance in Committees
Number of women
0 1 2 3 4 5 6 7 8 Total
Num
ber
of M
en
0
0
1
0
2
1
1
3
4
1 5
4 10 3
3 5 21
5 3
1 17 21
6 3 4 28
35
7 2 16 2
20
8 17
17
Total 35 27 32 20 6 0 0 0 0 120 Note: Table 7 shows the number of committees with different numbers of male and female members. Shaded grey
areas are inadmissible committee sizes. Based on measure B 13.

Social and Economic Impacts of TUUNGANE I | Mock Report 2011 12
From Table 8 we see that while TUUNGANE has a positive effect on the number of women included in the
committee, the proportion of women and the size of committees is actually smaller in TUUNGANE communities than
in non-TUUNGANE communities.
Table 8: TUUNGANE Effect on Committee Composition
Number of men
Number of women
Total size
Share women
TUUNGANE effect -0.2 0.11 -0.09 -0.03 (se) (0.22) (0.26) (0.26) (0.03) N 120 120 120 120 Note: Based on measure B 13.
2.1.5 Who contributes? Participation in Public Good Provision
To assess household contributions to community projects, we ask respondents to recall recent collective action
efforts in regards to public goods projects such as school rehabilitations, road clearing, organizing security patrols,
or enhancing agricultural productivity. In each case we ask households whether they have taken part by contributing
time or labor to these initiatives. The results are given in Table 9. The first row describes the share reporting that
these activities have taken place, the second reports the share saying that they have participated in such a project,
and the final rows report the TUUNGANE treatment effect on participation.
A typical village reports between one and two of the project types existing. The most common of these are road
repairs and well projects, and the least common are security patrols and health centers. Conditional upon the
respondent reporting that the project exists, reported participation rates are high; unconditionally however (as
reported in Table 9) these rates are low.
Table 9 also shows the treatment effects. We see…
Table 9: TUUNGANE Effect on Public Good Provision
School Clinic Repairing
Road Widening
Road Well Patrol Agricultural Productivity Church Total
Share saying project
exists 0.17 0.07 0.20 0.22 0.23 0.06 0.13 0.10 1.2
Share of households
contributing 0.13 0.04 0.16 0.14 0.13 0.03 0.07 0.09 0.80
TUUNGANE effect -0.01 -0.06 0.06 -0.04 0.02 -0.06 -0.01 -0.08 -0.16
(se) (0.08) (0.04) (0.08) (0.08) (0.08) (0.04) (0.07) (0.06) (0.30)
N 65 65 65 65 65 65 65 65 65
Note: Based on measure Q 48.
2.1.6 Rights and Obligations in regards to Decision-Making
The results in Table 4 indicated the extent to which individuals take part in local decision making. To assess
whether they feel broader rights to play a role in public decision making we asked them to tell us what they thought
were the chief obligations of political leaders. Our interest is in assessing the extent to which respondents see
government as having obligations that reflect citizens’ rights to participate.
Table 10 provides the main results. We see that … Moreover overall in TUUNGANE areas respondents are X
percentage points more likely to suggest a right to participation than other responses, compared to Y percentage
points in control areas. This different is / is not significant at…

Social and Economic Impacts of TUUNGANE I | Mock Report 2011 13
Table 10: Rights to Participate
SUPPORT CITIZENS’ PARTICIPTION OTHER ACTIVITIES
Accept Elections
React to citizen
complaints
React to citizen
Suggestions
Consult populations
Avoid corruptio
n
Awareness raising
Distribute benefits
Total:
Average 0.07 0.48 0.43 0.12 0.12 0.23 0.63
TUUNGANE effect: 0.10* 0.11 -0.12 0.06 -0.01 0.09 -0.1
(SE) (0.05) (0.17) (0.17) (0.09) (0.08) (0.11) (0.14)
N 72 72 73 72 73 73 72
Female:
Average 0.05 0.56 0.46 0.05 0.08 0.23 0.62
TUUNGANE effect: 0.07 -0.05 -0.46** -0.07 -0.17 0.04 0.02
(SE) (0.05) (0.19) (0.17) (0.11) (0.16) (0.18) (0.25)
N 39 39 39 39 39 39 39
Male:
Average 0.04 0.32 0.36 0.15 0.14 0.18 0.59
TUUNGANE effect: 0.06 0.08 0.14 0.25** 0.24** 0.14 -0.23
(SE) (0.06) (0.19) (0.21) (0.10) (0.11) (0.14) (0.24)
N 28 28 28 27 28 28 27
Note: Clustered at the village level. Female and Male observations do not add up to the total number of observations because
of several observations missing gender information. Source: DML Q78
A second measure of rights is derived by asking respondents simply if they felt that in general they were free to
express their opinion in the village. As for all step D questions there are few responses as yet; the responses
presently available suggest that expressed freedom is very weak. TUUNGANE has a positive/negative effect on…
Table 11: Free to Participate
Share saying they are free to participate in decision making
Average 0.16 TUUNGANE effect 0.1 (se) (0.1) N 17
Note: Standard errors clustered at the village level. Based on DML Q41BIS
Do citizens feel an obligation to take part? We address this question on normative positions using survey data. We
ask respondents in an open manner what they feel are the main responsibilities of citizens. We then code their
responses into a set of seven categories. These are then classified as actions that are meant to influence
government and actions that are meant to support government. Our interest is whether the effects of TUUNGANE
are stronger in the first set of categories (influence) categories and whether individuals in TUUNGANE programs are
more likely to respond with an influence response than with a support response.

Social and Economic Impacts of TUUNGANE I | Mock Report 2011 14
Table 12: Duties to Participate
RESPONSIBILITY TO INFLUENCE GOVERNMENT …TO SUPPORT GOVERNMENT
Participate
in Elections
Complain when things are not
going well
Make Suggestions
to the government
Take part in meetings
Obey Pay taxes
Give material support to government projects
Total:
Average .24 .17 .15 .15 .69 .51 .28 TUUNGANE effect: -0.12 0.04 0.02 0.15 0.30** 0.17 0.14 (SE) (0.10) (0.09) (0.10) (0.09) (0.11) (0.11) (0.16) N 72 72 72 72 73 73 72
Female:
Average .13 .15 .21 .15 .61 .53 .28 TUUNGANE effect: -0.04 0 0.08 0.23 0.23 0.12 0.08 (SE) (0.12) (0.13) (0.15) (0.14) (0.17) (0.17) (0.20) N 39 39 39 39 39 39 39
Male:
Average .32 .14 .71 .11 .79 .43 .29 TUUNGANE effect: -0.33 0 -0.1 -0.05 0.48** 0.19 0.19 (SE) (0.24) (0.17) (0.16) (0.16) (0.17) (0.23) (0.20) N 28 28 28 28 28 28 28 Note: Clustered at the village level. Female and Male observations do not add up to the Total number of observations because
of several observations missing gender information. Based on measure Q77.
From Table 12 we see that … Moreover overall in TUUNGANE areas respondents are X percentage points more
likely to provide an influence response than a support response, compared to Y percentage points in control areas.
This different is / is not significant at…
2.2 Accountability
We define accountability as the willingness and ability of community members to sanction leaders for poor
performance and the willingness of leaders to respond to citizen requests. We gather measures from multiple
sources during and following the implementation of project RAPID to determine whether communities put in place
and/or make use of any mechanisms of accountability to oversee the RAPID process.
2.2.1 Presence of Accountability Mechanisms
We examine the presence of accountability mechanisms that the village puts in place to oversee the use of
TUUNGANE funding as a measure of a culture of accountability in villages. At no point during the RAPID process
do we encourage or suggest to communities that they ought to put such measures in place. To find out whether they
did implement such mechanisms out of their own volition, we gather measures from three separate sources (1) from
a focus group meeting with RAPID committee representatives (for these results an item is marked if any one
member reports it) (2) from a simultaneous interview with two RAPID committee members and (3) a random sample
of 10 villager respondents.
Three different measures are created:
1. Whether an external accountability measure (such as a distinct committee) has been put into place 2. Whether the committee has been required to report its actions to the community as a whole

Social and Economic Impacts of TUUNGANE I | Mock Report 2011 15
3. Whether no mechanism has been put in place or the committee has been tasked with overseeing itself
Table 13 provides a summary of results. In most cases villages reported no oversight mechanisms of any form.
Each data source generally corroborated the numbers reported by the other two, with the community respondents
more likely to say that their community as a whole was holding the RAPID project committee responsible.
Table 13: Presence of Accountability Mechanisms
Focus Group with RAPID
Committee Member Interview with two RAPID
Committee Members Interview with Random
Villagers
External Community None External Community None External Community None
Average 0% 14% 86% 11% 6% 89% 8% 27% 66%
TUUNGANE effect 0 -0.67 0 -0.15 -0.08 0.02 0.07 0.03 0.07 (se) (0.56) (2.33) (2.16) (0.12) (0.09) (0.20) (0.08) (0.17) (0.10)
N 7 7 7 18 18 18 62 62 62 Note: RAPID Committee Member Interview and the Village Survey estimates have been clustered at the village level. Based on
measure QR 15, DA 19.
Table 13 also assess whether TUUNGANE is associated with a greater or weaker propensity to put accountability
mechanisms into place. We see here that the results are mixed. While the RAPID Committee Members (Focus
Group and Interview) in TUUNGANE areas seem to indicate that fewer external or community-based accounted
measures have been put in place, randomly selected villagers indicate that TUUNGANE areas have more of these.
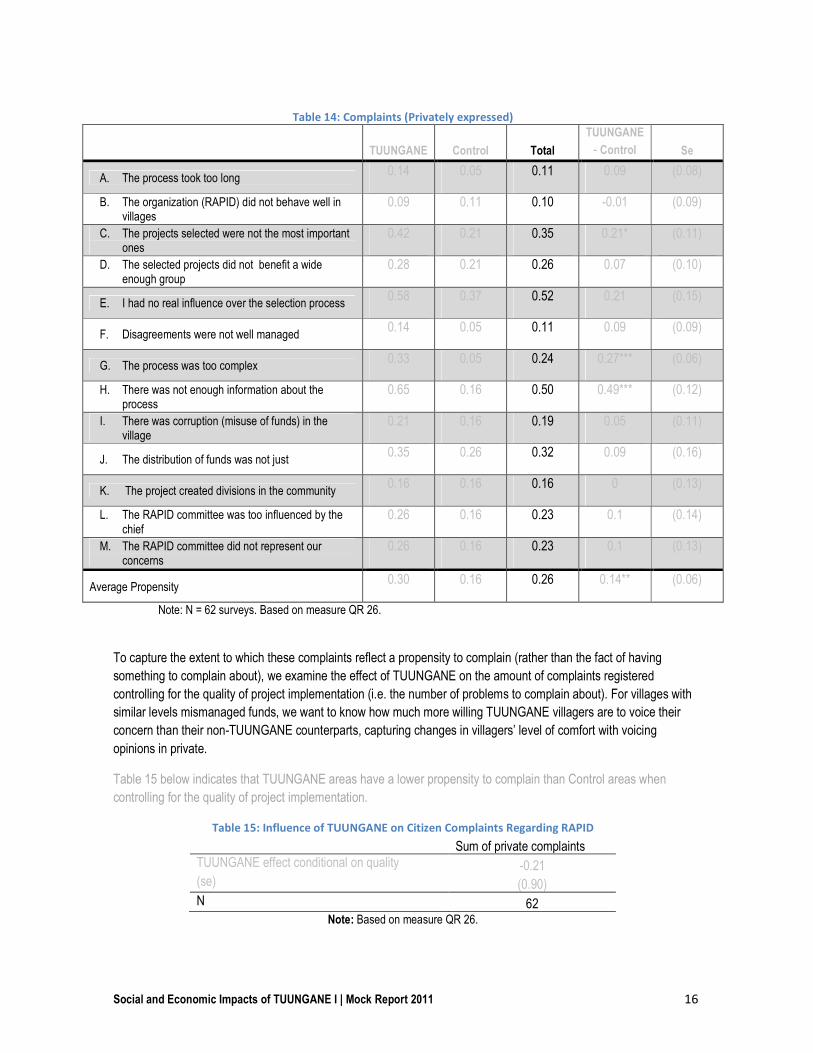
2.2.2 Complaints
We also examine the culture of complaints within the village. To measure each respondent’s propensity to complain,
we asked them to indicate whether or not they agreed with the thirteen statements listed below. Aggregating this
data at the village level, we create an index of the average propensity of villagers within a particular village to issue
complaints regarding problems they indicated as relevant.
We expected that individuals in TUUNGANE communities will display an increased willingness to hold traditional
and political leaders accountable as measured by their propensity to issue complaints (conditional on the
implementation of the project).
Table 14 reports the results. The most common complaints are with respect to participation and capture, with about
half of the respondents claiming to have had no real influence on the process or having too little information about
the process. About a third complained about the distributive decisions made by the chief and project committees in
regards to project funds. In all, these results suggest a relatively vibrant overall propensity to complain.
Social and Economic Impacts of TUUNGANE I | Mock Report 2011 16
Table 14: Complaints (Privately expressed)
TUUNGANE Control Total
TUUNGANE
- Control Se
A. The process took too long 0.14 0.05 0.11 0.09 (0.08)
B. The organization (RAPID) did not behave well in villages
0.09 0.11 0.10 -0.01 (0.09)
C. The projects selected were not the most important ones
0.42 0.21 0.35 0.21* (0.11)
D. The selected projects did not benefit a wide enough group
0.28 0.21 0.26 0.07 (0.10)
E. I had no real influence over the selection process 0.58 0.37 0.52 0.21 (0.15)
F. Disagreements were not well managed 0.14 0.05 0.11 0.09 (0.09)
G. The process was too complex 0.33 0.05 0.24 0.27*** (0.06)
H. There was not enough information about the process
0.65 0.16 0.50 0.49*** (0.12)
I. There was corruption (misuse of funds) in the village
0.21 0.16 0.19 0.05 (0.11)
J. The distribution of funds was not just 0.35 0.26 0.32 0.09 (0.16)
K. The project created divisions in the community 0.16 0.16 0.16 0 (0.13)
L. The RAPID committee was too influenced by the chief
0.26 0.16 0.23 0.1 (0.14)
M. The RAPID committee did not represent our concerns
0.26 0.16 0.23 0.1 (0.13)
Average Propensity 0.30 0.16 0.26 0.14** (0.06)
Note: N = 62 surveys. Based on measure QR 26.
To capture the extent to which these complaints reflect a propensity to complain (rather than the fact of having
something to complain about), we examine the effect of TUUNGANE on the amount of complaints registered
controlling for the quality of project implementation (i.e. the number of problems to complain about). For villages with
similar levels mismanaged funds, we want to know how much more willing TUUNGANE villagers are to voice their
concern than their non-TUUNGANE counterparts, capturing changes in villagers’ level of comfort with voicing
opinions in private.
Table 15 below indicates that TUUNGANE areas have a lower propensity to complain than Control areas when
controlling for the quality of project implementation.
Table 15: Influence of TUUNGANE on Citizen Complaints Regarding RAPID
Sum of private complaints TUUNGANE effect conditional on quality -0.21 (se) (0.90) N 62
Note: Based on measure QR 26.

Social and Economic Impacts of TUUNGANE I | Mock Report 2011 17
2.3 Efficiency
We define efficiency to be the extent to which implementation makes good use of resources available. We
hypothesize that, in general, projects will be implemented more efficiently in TUUNGANE areas.
2.3.1 Quality of Accounting
Our first set of measures of efficiency is the existence and quality of accounting for grant fund expenditures by the
RAPID Committee. The Committee is given an Accounting Form during the transfer of project funds (step C) on
which the Committee is expected to indicate the total amount made available for the project (out of the $1000) and
to keep track of expenditures made. The presence of this form at the end of the project (when the research team
visits in step D) is an indicator of efficient project implementation.
An additional measure is the amount of money that the Committee has not accounted for. We measure this by
taking the amount of money that the committee indicates it made available for the project (out of the $1000) minus
the amount of money that has been accounted for. For the latter we use the amounts indicated for by the Committee
and the amount indicated by calculations of the research team. A positive amount therefore indicates the amount of
money that the Committee did not account for.
A final measure is the amount of money that has been justified (i.e. can be reconciled with receipts). We measure
this by the share of amounts justified over the amount of money that the committee indicates it made available for
the project (out of the $1000). We separate between receipts and credible receipts to obtain an additional measure
of credible justification.
Table 16 reports the overall patterns as well as the estimated effects of participation in TUUNGANE on the quality of
accounting. Overall, RAPID Committees in 86% of the villages had the Accounting Form. A large amount of RAPID
project funds is not accounted for. Both the calculations of the RAPID Committee and the Evaluation Team indicate
that on average around $250 of the money made available for by the RAPID Committee (of the $1000) is not
accounted for.
Table 16: Existence and Quality of Accounting
Proportion of villages with accounting form present
Funds not accounted for as calculated by the Evaluation Team
Funds not accounted for as calculated by the RAPID Committee
Proportion of money justified
Proportion of money credibly justified
Average .86 226.72 264.08 .77 .48
TUUNGANE
effect -0.17 238.27 205.9 -0.25 -0.5
(se) (0.44) (402.08) (438.91) (0.45) (0.42)
N 7 7 6 6 6
Note: Based on measures DA27, DA28, DA31, DA32, DA33, DA 34.
Looking at the effect of TUUNGANE treatment, we see an overall negative impact of TUUNGANE on the quality of
village accounting. We find that RAPID Committees in TUUNGANE areas are less likely to have the Accounting
Form present. In addition, in TUUNGANE areas – measured by both RAPID Committee and Evaluation Team
calculations – there is more money not accounted compared to non-TUUNGANE areas. Finally, as given in the final
two columns, a larger share of the RAPID project funds goes unjustified for in TUUNGANE areas.
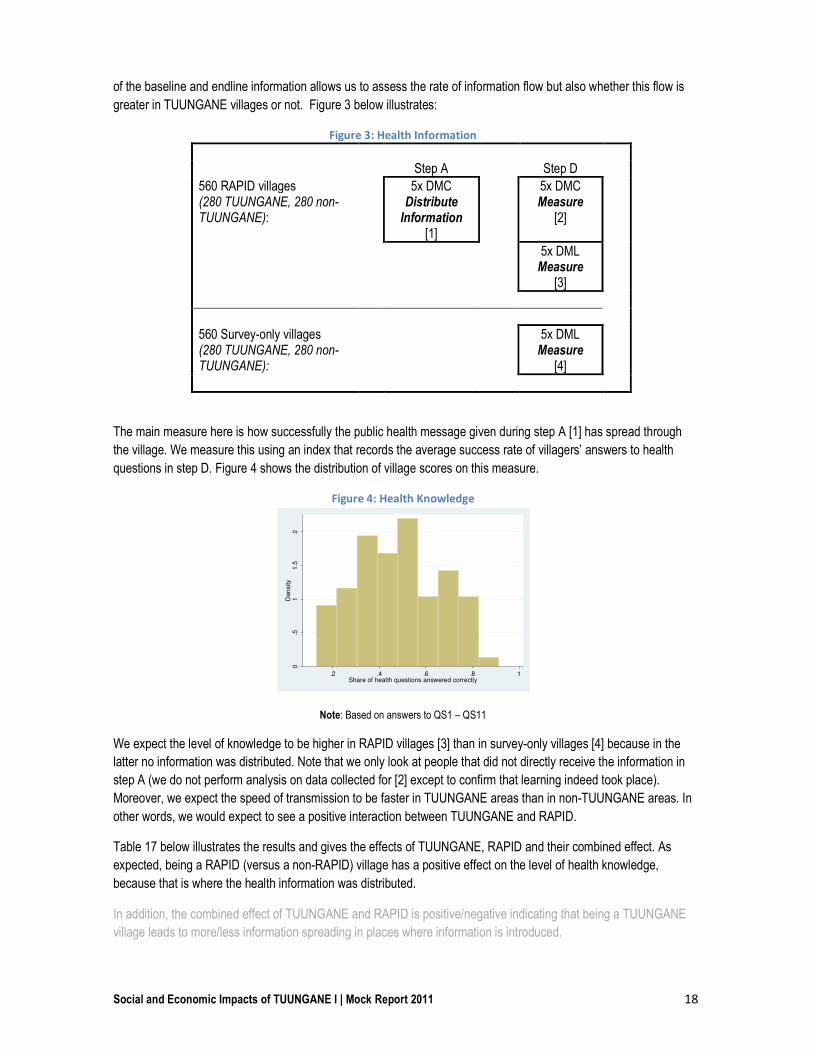
2.3.2 Speed of Information Transmission
A second behavioral measure of the extent to which the community can function efficiently outside of the RAPID
process is generated by examining the ease of information transmission within villages. We use a behavioral
approach to assess this feature. In half the communities a random sample of five villagers (“DMC villagers”) is
provided with public health information on malaria and diarrhea during Step A. In Step D a fresh random sample of
five villagers in all areas are asked several questions to see whether they know this health information. Comparison
Social and Economic Impacts of TUUNGANE I | Mock Report 2011 18
of the baseline and endline information allows us to assess the rate of information flow but also whether this flow is
greater in TUUNGANE villages or not. Figure 3 below illustrates:
Figure 3: Health Information
Step A Step D
560 RAPID villages (280 TUUNGANE, 280 non-TUUNGANE):
5x DMC Distribute
Information [1]
5x DMC Measure
[2]
5x DML Measure
[3]
560 Survey-only villages (280 TUUNGANE, 280 non-TUUNGANE):
5x DML Measure
[4]
The main measure here is how successfully the public health message given during step A [1] has spread through
the village. We measure this using an index that records the average success rate of villagers’ answers to health
questions in step D. Figure 4 shows the distribution of village scores on this measure.
Figure 4: Health Knowledge
Note: Based on answers to QS1 – QS11
We expect the level of knowledge to be higher in RAPID villages [3] than in survey-only villages [4] because in the
latter no information was distributed. Note that we only look at people that did not directly receive the information in
step A (we do not perform analysis on data collected for [2] except to confirm that learning indeed took place).
Moreover, we expect the speed of transmission to be faster in TUUNGANE areas than in non-TUUNGANE areas. In
other words, we would expect to see a positive interaction between TUUNGANE and RAPID.
Table 17 below illustrates the results and gives the effects of TUUNGANE, RAPID and their combined effect. As
expected, being a RAPID (versus a non-RAPID) village has a positive effect on the level of health knowledge,
because that is where the health information was distributed.
In addition, the combined effect of TUUNGANE and RAPID is positive/negative indicating that being a TUUNGANE
village leads to more/less information spreading in places where information is introduced.
0.5
11
.52
Den
sity
.2 .4 .6 .8 1Share of health questions answered correctly

Social and Economic Impacts of TUUNGANE I | Mock Report 2011 19
Table 17: Level of Health Knowledge
Sum score: Level of health knowledge
TUUNGANE effect on health knowledge (se) 0.2
(0.79)
RAPID effect on health knowledge (se) 0.14** (0.05)
Combined TUUNGANE and RAPID effect on
health knowledge (se)
0.04***
(0.01)
N 58 Note: Standard Errors clustered at the village level. Based on answers to QS1 – QS11
2.3.3 Seeking Support from External Actors
Are TUUNGANE communities more proactive in seeking external support? To address this question we ask
whether in the previous six months communities contacted either government or NGOs to lobby for interventions in
their areas. Such lobbying behavior reflects a number of features, most importantly their ability to organize
(efficiency) and their sense of a right to demand action on their behalf.
The results are given in Table 18. From preliminary data only negligible amounts of lobbying are seen with respect
to government for health interventions; moderate levels are seen with respect to education. Lobbying NGOs
however appears the dominant form of lobbying.
The table also suggests that participation in TUUNGANE does not alter the tendency to engage in lobbying activities
of this form.
Table 18: Seeking Support from External Actors
Government for Health
Government for Education
Government for Other NGO
Average 0.027 0.12 0.008 0.23 TUUNGANE effect -0.03 0.01 0.09 0.06 (se) (0.08) (0.08) (0.07) (0.11) N 60 60 60 61
Note: Clustered at the village level. Based on measures Q65, Q66, Q67, Q68.

Social and Economic Impacts of TUUNGANE I | Mock Report 2011 20
2.4 Transparency
2.4.1 Knowledge about RAPID
To measure transparency we examine the extent to which basic information (beyond what we make known to
villages) on RAPID project finances is known in villages. As part of the RAPID process, the enumerators tell
communities that (at least) $900 will be made available through the RAPID project. In fact, a total $1000 is
transferred to the project committee in every RAPID village. One of our primary measures of transparency then is
whether villagers know about the full amount received and not simply the amount that was communicated to them
by the RAPID enumerators in the initial village meeting.
As seen in Figure 5, villagers most commonly reported $900 as the total amount of project funds available to the
community, reflecting the amount that was told to the population by the RAPID team. Only a small share (15%) said
$1000. Most other respondents did not venture to guess the final amount at all (captured in the zero column of
Figure 5). This suggests very little information flow overall.
Figure 5: Villager Knowledge of Project Funds
Note: Based on measure QR 2.
To assess the effects of TUUNGANE we created a first measure of whether a villager’s response was correct and a
second measure of how far the individuals guess was from $1000. These measures are recorded at the individual
level and treatment effects are estimated with clustering at the village level.
Table 19: Knowledge of Project Amount
Correct Estimates? Distance from $1000?
Overall Average 15% 217.49 TUUNGANE effect on likelihood of correctly guessing project amount -0.007 -0.71
(se) (.07) (113.40)
N 62 466 Note: Based on measure QR 2.
6 This does not include villagers who did not venture to guess final amount of project funds (i.e. those who responded “I don’t know.”
0.0
02
.004
.006
.008
.01
De
nsity
0 200 400 600 800 1000Citizen estimate of project size

Social and Economic Impacts of TUUNGANE I | Mock Report 2011 21
The results suggests that villagers in TUUNGANE areas are less likely to estimate the 1000$ correctly, although this
is an effect of less than 1 percent (0.7%). However, although TUUNGANE villagers are less likely to be correct in
their estimate, they are on average closer to the correct 1000$ amount than villagers in not-TUUNGANE areas.
2.4.2 Willingness and Ability to seek information
If taking part in the TUUNGANE intervention has made communities more transparent, then it is likely that valuable
information about public resources has become more accessible. We measure this by the willingness, as well as the
ability of randomly selected villagers to obtain relevant information about the management of public resources for
which they are beneficiaries. Villagers are presented with the opportunity to seek information about the revenues of
the last period for either the main school attended by this village or the main health center (the precise units are
identified by our teams at each site). They are offered $1 as compensation for attempting to retrieve the information
and an additional dollar upon success. Our enumerators check the veracity of the information and condition the
second payment on accuracy.
Our first interest is in the willingness of the villagers to participate in this exercise. However if they are not willing, we
record the reason for their refusal. If they are willing we record whether they returned with the information and
whether the information was accurate.
So far we only have data in from 11 respondents on this measure. Of these only 1 has agreed to participate. The
ten that refused gave various reasons. Two said that it would not be appropriate to seek the information. Five said
they did not have the time. One said that their husband would not let them do it. The sample size is small still but
this suggests broad challenges to accessing basic financial information.
Table 20 indicates that the estimated effect of TUUNGANE on willingness to participate is positive. In other words,
villagers in TUUNGANE areas are more willing and/or able to obtain relevant information.
Table 20: Willingness to Seek Information
Willingness to Participate Average 0.09
TUUNGANE effect 0.09 (se) (0.16) N 11
Note: Based on measure QI 3.
2.5 Capture of Outcomes/Equity
The final measure of governance we explore is the extent to which the outcome of collective decision making is
subject to capture. While most of our measures of governance focus on processes, the capture measures focus
directly on behavioral outcomes.
2.5.1 RAPID: Financial Irregularities (From Audit)
Our most important measure of capture is the amount of the $1000 grant that our auditors are unable to account for
during their two day community audit. The auditors were trained to rule out as many strategies as possible that
committees can use to divert funds. They operate using a checklist of 32 possible strategies that the committees
can use, including exchange rate manipulations, quantity manipulations, quality manipulations and quality over
reporting. Auditors are asked to verify prices in the market whenever possible (constrained by time, they can in last
resort obtain information from prices by women in the village) and they use group discussions to assess the actual
price to minimize the risk of over-reporting at any step. In addition, they interview a random sample of beneficiaries
and evaluate how much was transferred to them, obtaining proofs when possible. This also provides us an estimate
of how many “ghost” beneficiaries were added to the list.

Social and Economic Impacts of TUUNGANE I | Mock Report 2011 22
To date we have very few (7) units with data on this measure. Figure 6 shows this distribution of the measure. On
average $160 of the $1000 could not be verified by our teams.
Figure 6: Amount Not Verifiable
Note: Based on measure DA 109.
Table 21: Traceability of money
Amount not traceable TUUNGANE effect 143.49 (se) (-112.96) N 7
Note: Based on measure DA 109.
As seen in Table 21 we find no evidence for an effect of TUUNGANE on capture of project funds.
2.5.2 RAPID: Number of Beneficiaries
A second measure of capture is the extent to which benefits are distributed broadly or narrowly in villages. Table 22
shows the average number of household beneficiaries per project. We restrict the analysis here to villages in which
at least one respondent is recipient of private transfer to eliminate villages with projects that do not involve cash
transfers.
While on average 70% of the households in the villages with projects of private distribution claim to have received
private transfers from the RAPID project, households in TUUNGANE areas where the villages chose to have
distribution RAPID projects are 42% less likely to have received private transfers, given a same project amount of
$1000. In other words, our most direct estimate of the number of beneficiaries (taken directly from potential
beneficiaries) indicates that the distribution of benefits from equal sized projects ($1000) is, on average, more
concentrated around a fewer number of individuals in TUUNGANE villages.
We would interpret this as a result against the hypothesis of Capture, suggesting that benefits from public
development projects are more concentrated in the hands of few in TUUNGANE villages than in non TUUNGANE
villages.
0.0
02
.00
4.0
06
.00
8D
en
sity
0 100 200 300 400Amount not verifiable
Social and Economic Impacts of TUUNGANE I | Mock Report 2011 23
Table 22: Proportion of respondents who received transfers from RAPID
Percent of Village
Households Benefiting
Average 70%
Min 25% Max 100% TUUNGANE effect -42** (se) (15) N 8
Note: Based on measure QR 3.
2.5.3 RAPID: Inequality of the distribution of Benefits
What of the overall inequality of distributions, conditional on receipt of some benefits? Given the small sample size,
we focus attention on the dispersion of the benefits. This is best captured by a Gini coefficient, but for interpretation
purposes we will focus on a simple standard deviation.
Table 23 provides the TUUNGANE effect on the mean distance from the mean transfer offered by RAPID. In
particular, it indicates that the mean dispersion in TUUNGANE communities is $3.24 higher than in non-
TUUNGANE communities, suggesting a higher spread, and hence inequality in the distribution of benefits from
RAPID.
Table 23: Mean deviation of benefits distributed
Benefits spread
TUUNGANE effect 3.24
(se) 3.54
N 11
Note: Based on measure QR 3.
2.5.4 RAPID: Dominance of Chief’s Preferences over other villagers’ preferences (Power)
A fundamental measure of capture is the extent to which actual decisions reflect the preferences of different sorts of
villagers. We focus on the dominance of the preferences of the Chief over preferences of a random sample of
villagers. Hence, we produce a measure of power by comparing the stated preferred project realization by the Chief
in a private meeting during our first visit and the actual project realization and comparing the predictive power of the
chiefs preferences to those of the population.
To operationalize the measure, we provide a 0-1 score to each individual, whereby if his ex-ante preferences
coincide with the actual project realization he gets a score of 1, and 0 otherwise. The interpretation in the analysis
will be the probability to successfully have his preferences represented in the project realization. The hypothesis that
TUUNGANE villages will exhibit lower levels of capture of outcomes by the Chief conditional on the villagers should
result in TUUNGANE having a negative effect on the ability of the Chief’s ex ante preferences to “predict” the project
realization over and above the preferences of ordinary citizens.
Table 24 presents first the mean of the binary variable for all villagers, which should be interpreted as the proportion
of villagers (including the chief) for whom the project realization coincides with their stated preferences. The two
columns indicate that we collect the individuals’ preferences at two stages before observing the outcome: before
and after the village meeting, that takes place on the second day of the first visit. We include both points of time is
because these represent very different quantities. During the village discussion, villagers interact and there is
substantive deliberation that may potentially produce agreement. Not taking into account the preferences after the
village meeting risks confounding influence of the chief over power, since the Chief could have greater knowledge of
the village needs and convince the villagers during the meeting.

Social and Economic Impacts of TUUNGANE I | Mock Report 2011 24
While the mean reported in Table 24 includes all villagers interviewed for that question (chief included), the
TUUNGANE effect must be interpreted as the effect of TUUNGANE on the extent to which the Chief preferences
are reflected in the actual project realization at the margin (hence, on top of what the preferences of randomly
selected villagers are reflected in project choice). On average, the preferences of 16% of individuals interviewed
before the group meeting “predicted” the final project choice, increasing to 29% following the group meeting.
Table 24: TUUNGANE effect on Chief dominance†
Relative to Pre Group Meeting
Citizen Preferences Relative to Post Group Meeting
Citizen Preferences
Average 0.16 0.29 TUUNGANE effect -0.11 0.07 (se) (-0.07) (-0.07) N 758 1464
Note: Based on data from AC-17 † (AV-14-bis,B-23).

Social and Economic Impacts of TUUNGANE I | Mock Report 2011 25
3 Results II: Social Cohesion
3.1.1 RAPID: Distribution of benefits across social categories
To test the hypothesis that TUUNGANE improves social cohesion we look at the access of identifiable categories to
benefits available to the communities. Participation in the RAPID process provides a unique opportunity to detect
changes in the access of target social categories to the benefits of the program. This is particularly straightforward
to measure when communities choose to use the RAPID funds for direct distribution of small assets or consumption
goods. Since we collect socio-economic data of a random sample of respondents in RAPID villages (10 per village)
as well as their benefits from the RAPID project, we can measure the impact of TUUNGANE on cohesion by the
difference in per capita amounts received by marginalized social categories (relative to the average amount
received in the village) in TUUNGANE against non-TUUNGANE communities. The difference will be interpreted as
the average treatment effect on the access of those categories to benefits of public projects in their respective
communities.
Table 25 displays the average level of private transfer for the set of 30 respondents for whom we presently have this
data. The average transfer is of $5.50 per household and ranges from $0 to $45.7
Table 25: Distribution of Benefits
Private Benefits
Mean $5.5
Standard Deviation (6.7)
Max 45
Min 0
N 30 Note: Average benefits reported received by respondents
(household) Based on measure QR 3.
Table 26 restricts attention to the migration status of respondents. In particular, it provides the estimated
TUUNGANE effect on the per capita benefit earned by a villager who is not born in the village. Its interpretation is
the number of additional dollars that migrants receive as direct transfers from the RAPID project if they happen to be
in TUUNGANE communities.8
Table 26 presents a coefficient of 0.85, suggesting that migrants in TUUNGANE communities would earn 0.85 more
dollars on average as direct transfer from RAPID than in non- TUUNGANE communities.
Table 26: Distribution of Benefits to Migrants
Migrants
TUUNGANE effect 0.85
(se) 0.1
N 22
Note: Based on measure QR 3, SP 1.
7 Note: In Table 25, we restrict attention to villages where at least one person out of our random sample received anything. This prevents us from considering villages with no clear distribution projects as having a perfectly equal distribution. With large samples, we may be losing villages where, by chance, none of the 10 respondents received anything while in fact they had a distribution project 8 A more precise test would to restrict attention to migrants that arrived before the launch of the TUUNGANE program, since we cannot rule out the possibility that TUUNGANE attracted new migrants of a different type, or changing the patterns of integration of new migrants, while not improving the access to benefits of the rest of migrants. Low sample size prevents us from conducting this analysis in the current report.

Social and Economic Impacts of TUUNGANE I | Mock Report 2011 26
Restricting the analysis to pre-determined categories is only half the story, however. We will incorporate responses
from the survey about which of these categories are most salient at the village level (hence self-reported by the
respondents and also subject to biases) into later analysis and target more accurately relevant categories.
3.1.2 Trust: Willingness to lend money to other village members
The survey also provides multiple measures of Social Cohesion. As a measure of trust, respondents are asked to
report whether (and to what extent) there is a person from a given category that they would be willing to lend money
to go to market. Average responses range from 0.39 for non coethnics from other villages to .94 for individuals of
the same family - clearly in line with what is expected.
The quantity of interest is the effect of TUUNGANE on the probability that a randomly selected villager responds yes
to any of the questions across categories. Results reported in Table 27 indicate that TUUNGANE had a mixed
effect. While TUUNGANE had a positive effect of thrust in fellow villagers, co-ethnics, ex-combatants and non-co-
ethnics, it had a negative effect on thrust in family members and other people from other villages.
Table 27: Trust
Family Member
From this Village
From another village
Co-ethnic from another village
Non co-ethnic from other village
Ex-combatant
Overall Average 0.94 0.85 0.58 0.62 0.39 0.49 TUUNGANE effect -0.02 0.1 -0.09 0.12 0 0.28*** (se) (0.07) (0.11) (0.09) (0.13) (0.1) (0.08) N 66 66 66 66 66 66
Note: Based on measure Q 43.
3.1.3 Presence of Cleavages in the Village
Divisions can occur along many lines. The endline survey asks respondents to report on the kinds of divisions that
exist in their villages as well as the effects of TUUNGANE on the prevalence of these divisions. Results in Table
28 suggest a general willingness to report on multiple type of division (note that the possible lines of division were
not read out to respondents for this question). Gender, generational, and religious divisions are the least reported
and the most prominent reports are of class, intra-elite and native/migrant, divisions.
Table 28: Presence of Cleavages
Rich-
Poor
Male-
Female
Young-
Old
Natives-
Migrants Religion
Ethnic
groups
Different
Elites Other Total None
Overall Average .18 .06 .08 .19 .08 .12 .18 .17 1.06 .26
TUUNGANE effect 0.01 0.04 0.07 -0.28** 0.01 -0.04 -0.06 -0.02 -0.27 0.01
(se) (0.10) (0.05) (0.06) (0.11) (0.06) (0.09) (0.10) (0.08) (0.34) (0.12)
N 66 66 66 66 66 66 66 66 66 66
Note: Clustered at the village level. Based on DML Q38.
Table 28 also suggests that in TUUNGANE areas…
3.1.4 Inter-Village Cooperation
So far our focus has been on within-village cohesion. But as part of TUUNGANE villages also work together within
CDVs and within CDCs. Possibly then TUUNGANE may also promote cohesion at broader levels. To assess
between village cohesion we asked individual respondents to do a thought experiment. We asked them to imagine
that an NGO could choose whether to invest $800 in a project their own community or to invest $500 in their own
community plus $500 in a randomly sampled village in their chiefdom (we indicated for each respondent a set of
particular villages). Our interest is in the extent to which individuals are willing to support actions that have broader
benefits to the wider community even at a cost to their own village. Table 29 provides responses. On average 53%

Social and Economic Impacts of TUUNGANE I | Mock Report 2011 27
of men reported a willingness to share the projects between villages with women about twice as likely as men to
share.
Villages in TUUNGANE communities are more/less likely to…
Table 29: Inter-village Cooperation
Total Willingness of Men
Willingness of Women
Overall Average .53 .35 .69 TUUNGANE effect 0 0.07 -0.06 (se) (0.15) (0.20) (0.23) N 57 26 29
Note: Clustered at the village level. Question SP14.

Social and Economic Impacts of TUUNGANE I | Mock Report 2011 28
4 Results III: Welfare We hypothesize that participation in TUUNGANE will improve economic productivity, augment household assets
and improve access to services. We assess these claims here by examining the amount of time devoted to
productive activities, assessing the household assets of random samples of villagers, including the quality of their
homes, and estimating welfare outcomes including the incidence of sickness (which would be reduced if
TUUNGANE resulted in better welfare outcomes overall and better health facilities in particular) and school
attendance (which would be increased if participation in TUUNGANE improved either access to education or
positively altered household decision making with respect to education.).
4.1 Income
The first measure of welfare we report is the household’s reported income generation over the previous two
weeks.
Figure 7: Household Income in the Last two Weeks ($)
Note: Full sample (n=119) including 7 outliers Note: Less than $100 (n=112). Both figures based on
measure QE 9.
Table 30 indicates that an average household generated around $30 in the two weeks before the survey took place
in that household. The table also indicates the impact of TUUNGANE. Household in TUUNGANE areas generate
less income than non-TUUNGANE areas.
Table 30: Household income
Reported Household income (over 2 weeks) (in US$)
Overall Average 30.72 TUUNGANE effect
-2.11 (se) (13.82) N 119
Note: Data has been clustered at the village level.
Based on measure QE 9.
4.2 Productivity
A second measure of welfare is a person’s level of productivity. We measure this by the total amount of hours a
person spent over the last seven days on activities that generated income for the household.
0.0
05
.01
.01
5D
ensity
0 200 400 600HOUSEHOLD_INCOME
0.0
2.0
4.0
6D
en
sity
0 20 40 60 80HOUSEHOLD_INCOME
Social and Economic Impacts of TUUNGANE I | Mock Report 2011 29
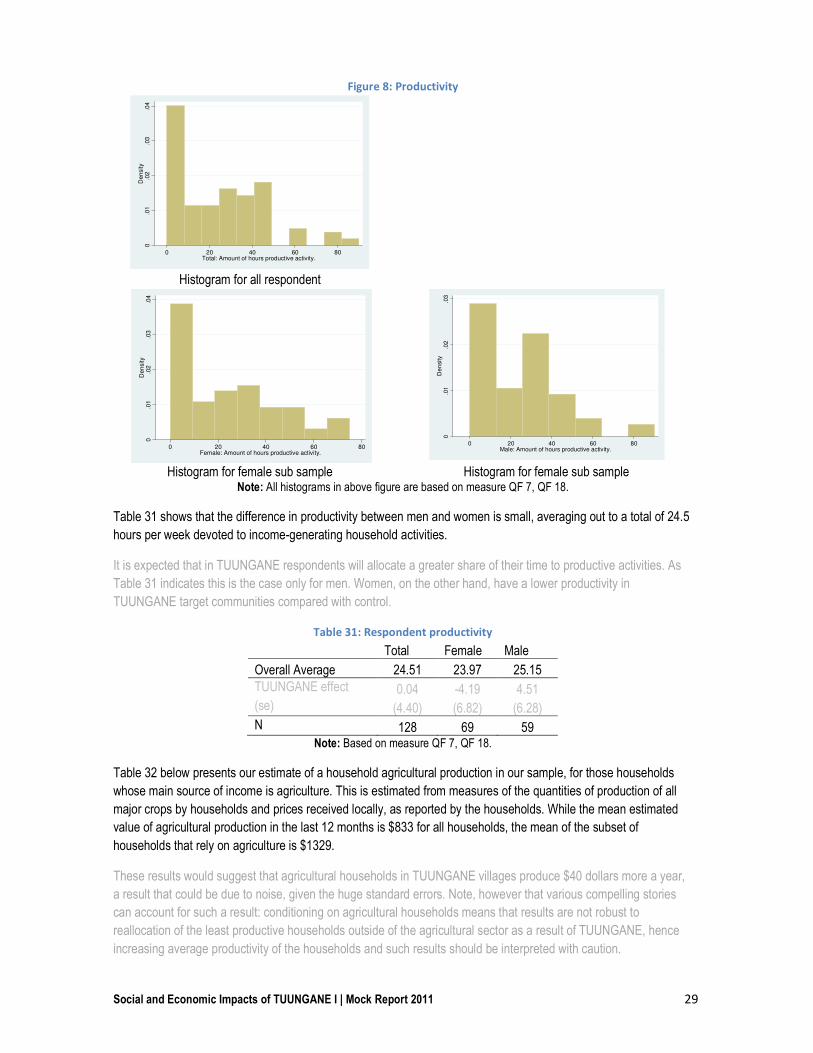
Figure 8: Productivity
Histogram for all respondent
Histogram for female sub sample Histogram for female sub sample
Note: All histograms in above figure are based on measure QF 7, QF 18.
Table 31 shows that the difference in productivity between men and women is small, averaging out to a total of 24.5
hours per week devoted to income-generating household activities.
It is expected that in TUUNGANE respondents will allocate a greater share of their time to productive activities. As
Table 31 indicates this is the case only for men. Women, on the other hand, have a lower productivity in
TUUNGANE target communities compared with control.
Table 31: Respondent productivity
Total Female Male
Overall Average 24.51 23.97 25.15 TUUNGANE effect 0.04 -4.19 4.51 (se) (4.40) (6.82) (6.28) N 128 69 59
Note: Based on measure QF 7, QF 18.
Table 32 below presents our estimate of a household agricultural production in our sample, for those households
whose main source of income is agriculture. This is estimated from measures of the quantities of production of all
major crops by households and prices received locally, as reported by the households. While the mean estimated
value of agricultural production in the last 12 months is $833 for all households, the mean of the subset of
households that rely on agriculture is $1329.
These results would suggest that agricultural households in TUUNGANE villages produce $40 dollars more a year,
a result that could be due to noise, given the huge standard errors. Note, however that various compelling stories
can account for such a result: conditioning on agricultural households means that results are not robust to
reallocation of the least productive households outside of the agricultural sector as a result of TUUNGANE, hence
increasing average productivity of the households and such results should be interpreted with caution.
0.0
1.0
2.0
3.0
4D
ensity
0 20 40 60 80Total: Amount of hours productive activity.
0.0
1.0
2.0
3.0
4D
en
sity
0 20 40 60 80Female: Amount of hours productive activity.
0.0
1.0
2.0
3D
en
sity
0 20 40 60 80Male: Amount of hours productive activity.

Social and Economic Impacts of TUUNGANE I | Mock Report 2011 30
Table 32: Household agricultural production
Household Production
Average $1329 TUUNGANE effect 40.37 (se) (810.65) N 6
Note: Based on measure CH 18, CH 20.
4.3 Assets
4.3.1 Household Assets
To assess asset holdings we ask each respondent about a range of items which the family may own, including
livestock, household furnishings, and equipment and technology. These measures correlate highly and the
Cronbach’s alpha score – a coefficient of reliability – for these items is over 0.7 suggesting that they jointly reflect an
underlying attribute (wealth) reasonably well.
Table 33: Household Assets
Type of Household Assets: Treatment Control All Difference
(se) of the
difference N
Assets (Total) 0.16 -0.29 0.00 0.45 (0.44) 119
A Goats or sheep 1.38 0.55 1.10 0.83 (1.04) 127
B Poultry 4.58 3.90 4.35 0.67 (1.31) 127
C Cattle 0.28 0.02 0.20 0.26 (0.17) 127
D Pigs 0.53 0.10 0.39 0.43 (0.34) 127
E Houses 1.89 1.21 1.67 0.68** (0.29) 127
F Rooms 3.53 2.49 3.18 1.04** (0.43) 128
G Tins/flasks 4.05 5.12 4.41 -1.07 (0.72) 128
H Chairs 2.38 3.51 2.77 -1.13** (0.57) 125
I Beds 1.19 0.63 1.00 0.56* (0.31) 127
J Foam mattress 1.20 0.84 1.08 0.37 (0.27) 127
K Straw mattress 2.18 0.74 1.69 1.43* (0.74) 127
L Bucket 1.75 3.12 2.21 -1.37** (0.57) 127
M Basins 1.93 1.83 1.90 0.1 (0.28) 126
N Petrol lamps (or equivalent) 0.82 0.72 0.79 0.1 (0.18) 127
O Radios 0.95 0.72 0.87 0.23 (0.18) 127
P Bikes 0.68 0.86 0.74 -0.18 (0.15) 126
Q Machetes 4.10 4.43 4.21 -0.33 (0.49) 126
R Pans 5.38 6.45 5.75 -1.08* (0.64) 122
S Dressers 0.33 0.29 0.32 0.05 (0.13) 126
T Canoes/Boats 0.10 0.00 0.06 0.1 (0.07) 127
U Cell phones 0.83 0.51 0.72 0.32* (0.19) 126
Note: Based on measure QE1.
In the analysis in Table 33 we show the effect of TUUNGANE on ownership of each of these items as well as on an
index of asset holdings formed using principal components analysis. Based on responses to measure QE 1.
The results in Table 33 suggest that TUUNGANE had a mixed result as some asset holdings are higher and others
lower in TUUNGANE relative to comparison areas.

Social and Economic Impacts of TUUNGANE I | Mock Report 2011 31
4.3.2 Quality of housing
The quality of respondents’ walls serves as another indicator for household wealth. We record whether walls are
made of 1. Mud, 2. Plastic, 3. Non-baked bricks, 4. Bamboo, 5. Stone, 6. Semi-durables, 7. Baked bricks, 8.
Concrete, 9. Metal, or 10. Cardboard. Multiple responses are possible for any given household. Approximately 26%
of respondents have homes made of mud; the most common material is non-baked bricks, which are used in 56%
of homes. Much smaller shares use baked brick (13%) or other higher quality material. We construct a measure to
indicate a high quality wall to be a wall made out of baked bricks (7), concrete (8), or metal (10).
Table 34 shows the effect of TUUNGANE on the quality of walls. We find that TUUNGANE had a negative impact
on the quality of walls.
Table 34: Wall Quality
High Quality Wall
Effect of TUUNGANE on wall quality -0.07
(se) (0.07)
N 127 Note: Based on measure QE 10.
4.4 Outcomes
4.4.1 School attendance
An important indicator of welfare is access to community utilities and infrastructure, including those not directly
supported by the TUUNGANE program. As a measure of effects on access to education we take the number of
days of school attendance in the last two weeks (excluding Saturday) for children less than eighteen years old. We
construct this measure for boys, girls and both combined.
Table 35 indicates that TUUNGANE has a mixed impact on school attendance of children below the age of 18.
While the overall effect is negative, this seems to be driven by the strong negative effect of TUUNGANE on the
attendance rates of boys. Girls in TUUNGANE areas, compared to non-TUUNGANE areas are more likely to attend
school.
Table 35: Days of attendance at school (last 2 weeks)
Total Girls Boys
Overall Average 2.87 2.35 3.39
TUUNGANE effect on attendance -0.2 0.19 -0.62
(se) (0.82) (1.10) (1.21)
N 154 75 79 Note: Based on measure QF 7, QF 14.
4.4.2 Sickness
Another measure of welfare is access to community utilities and infrastructure, including those not directly supported
by TUUNGANE. An indicator for this is the level of sickness in a household. We measure this by obtaining
information about different types of sickness that took place over the last two weeks for children younger than 7
years old. These are: 1. Fever, 2. Cough, 3. Cough plus sweat and faster breathing, 4. Diarrhea, and 5. Diarrhea
plus blood. A final measure is whether in the previous two week the person in the household was seriously ill,
defined as being unable to go to work on to school.
Overall the incidence of sickness within a household over the previous two weeks for children aged 7 or younger is
high. As Table 36 indicates, one in three of these children have had a cough or a fever over the last two weeks. One
in five household members was reported as seriously ill making it impossible for them to work or to go to school.

Social and Economic Impacts of TUUNGANE I | Mock Report 2011 32
Table 36 indicates that TUUNGANE had an overall positive impact on the incidence of sickness with all measures
positive except “cough”.
Table 36: Sickness during last two weeks
Children All
Fever Cough Cough plus sweat
and faster breathing Diarrhea Diarrhea
plus blood Seriously ill (cannot go work or go to school)
Overall Average .36 .29 .13 .12 .03 .21 TUUNGANE effect 0.07 -0.01 0.01 0.05 0.03* 0.03
(se) (0.06) (0.09) (0.06) (0.06) (0.02) (0.04)
N 199 199 198 196 194 716
Note: Data is clustered at the village level. Based on measures QF 20, QF 21.
4.4.3 Rate of Accessing Services
A final welfare measure we examine is the rate at which a household accesses services such as schools, hospitals,
bridges, etc.
Table 37 shows average access to these services, ranging from access of on average once per day (wells) to less
than once per month (government services). These average numbers mask the variation between respondents
which, as seen from Figure 9 can be considerable. While on average children attend primary school 14 days per
month, this figure comes from near full-time attendance for one group of children of households and nearly complete
absence for another group.9 Respondents report using maternity clinics for on average one visit per maternity.
Table 37 also shows the effects of TUUNGANE on access to services. It shows that…
Table 37: Rate of Accessing Services
Wells (per
month)
Primary school
(per month)
Secondary school
(per month)
Health center (per
month)
Maternity clinic (per maternity) Road
Bridge (per
month)
Irrigation (per
month)
Meeting center (per
month)
Church (per
month)
Government services
(per month) Overall Average 29.96 14.2 8.18 2.68 1 11.53 4.79 11.16 2.52 6.26 .70 TUUNGANE Effect:
0.08 0.74 4.43 -0.5 -0.14 -12.64 -2.29 4.79 0.41 -4.36 -0.13
(SE) (13.56) (2.84) (5.40) (1.65) (0.70) (7.60) (2.04) (6.72) (1.60) (2.41) (0.55)
N 25 25 22 28 28 28 28 25 27 27 27
Note: Standard errors are clustered at the village level. Data drawn from responses to DML Q 63.
9 Later analysis will condition on households with children of school going age.

Social and Economic Impacts of TUUNGANE I | Mock Report 2011 33
Figure 9: Rate of Access to Services
Use of wells (per month) Use of primary school (days per month) Use of secondary school (days per month)
Use of health center (per month) Use of maternity clinic (per maternity) Use of bridge (days per month)
Use of irrigation (days per month) Use of meeting room (days per month) Use of church (days per month)
Use of government document services (days per month)
Note: Based on responses to measure Q63.
0.0
1.0
2.0
3D
en
sity
0 20 40 60 80 100Use well times per month
0.0
2.0
4.0
6.0
8D
en
sity
0 5 10 15 20 25Use prim school days/month
0.0
5.1
.15
Den
sity
0 5 10 15 20 25Use sec school days/month
0.0
5.1
.15
.2D
en
sity
0 10 20 30Use health center times per months
0.2
.4.6
Den
sity
0 2 4 6 8 10Use maternity times per maternity
0.0
5.1
.15
Den
sity
0 10 20 30Use bridge days/month
0.0
5.1
.15
.2D
en
sity
0 10 20 30Use irrigation days/month
0.1
.2.3
.4.5
Den
sity
0 2 4 6 8 10Use meeting room days/month
0.0
5.1
.15
.2D
en
sity
0 10 20 30Use church days/month
0.0
5.1
.15
.2.2
5D
en
sity
0 5 10 15 20 25Use government doc days/month

Social and Economic Impacts of TUUNGANE I | Mock Report 2011 34
5 Conclusions A summary of results is provided in Table 38. We see overall evidence that TUUNGANE was successful at reducing
capture, weak evidence that it improved participation cohesion and little or no evidence for positive effects on other
dimensions of governance or on welfare.
Table 38: Summary Table
Item # Measure Support for hypothesis?
Participation Attendance at meetings (Table 3) ���� ���� ����
Women’s Attendance (Table 3) ���� ���� ����
Men’s attendance (Table 3) ���� ���� ����
Number of interventions in group discussions (Table 4) ���� ���� ����
…by men (Table 4) ���� ���� ����
…by women (Table 4) ���� ���� ����
Dominance of men in discussions (Table 3) ���� ���� ����
Dominance of elders in discussions (Table 3) ���� ���� ����
Dominance of chiefs in discussions (Table 3) ���� ���� ����
RAPID Committee selected through participatory approach (Table 5) ���� ���� ����
RAPID Project selected through participatory approach (Table 5) ���� ���� ����
Share of RAPID committees that are women (Table 8) ���� ���� ����
Public Goods Provision in Village (Table 9) ���� ���� ����
Rights of Participation (Table 10) ���� ���� ����
Freedom to Participate (Table 11) ���� ���� ����
Obligations for Participation (Table 12) ���� ���� ����
Accountability Presence of Specific External Accountability Mechanism (Table 13) ���� ���� ����
Presence of Community Accountability Mechanism (Table 13) ���� ���� ����
Presence of No Accountability Mechanism (Table 13) ���� ���� ����
Willingness to complain (conditional on project quality) (Table 15) ���� ���� ����
Influence on complaints on project implementation (Table 15) ���� ���� ����
Efficiency Proportion of villages with Accounting Form present (Table 16) ���� ���� ����
Funds not accounted for as calculated by the Evaluation Team (Table 16) ���� ���� ����
Funds not accounted for as calculated by the RAPID Committee (Table 16) ���� ���� ����
Proportion of money justified (Table 16) ���� ���� ����
Proportion of money credibly justified (Table 16) ���� ���� ����
Efficiency of Information Flow (health message) (Table 17) ���� ���� ����
Village support sought from external actors (Table 18) ���� ���� ����
Transparency Correct Knowledge of Project Amount (Table 19) ���� ���� ����
Distance of Estimate to Project Amount (Table 19) ���� ���� ����
Willingness to Seek Information (Table 20) ���� ���� ����
Capture Financial Irregularities (Table 21) ���� ���� ����
Number of beneficiaries (Table 22) ���� ���� ����
Inequality of the distribution of benefits (Table 23) ���� ���� ����
Dominance of chief’s preferences (Table 24) ���� ���� ����
Cohesion Distributions to migrants (Table 26) ���� ���� ����
Trust in others (Table 27) ���� ���� ����
Presence of Social Cleavages in the Village (Table 28) ���� ���� ����
Inter-village Sharing (Table 29) � � �
Welfare Household Income (Table 30) ���� ���� ����
Productivity (Table 31) ���� ���� ����
Household Assets (Table 33) ���� ���� ����
Quality of housing (Table 34) ���� ���� ����
School Attendance (Table 35) ���� ���� ����
Sickness (Table 36) ���� ���� ����
Frequency of Use of Village Services (Table 37) ���� ���� ����
Note: A hypotheses receives one star if the estimated effect goes in the expected direction, two if it is also
statistically significant at the 95% level (one tailed test), and three if it is significant at the 99% level (one tailed test).


![WBJEE MOCK TEST PAPER POWERED BY … · wbjee mock test paper –powered by wbjee mock test paper [ pathfinder ] wbjee mock test – 2 [mathematics-2]](https://img.pdfslide.us/doc/110x75/5f5911bc7de6a572a9381525/wbjee-mock-test-paper-powered-by-wbjee-mock-test-paper-apowered-by-wbjee-mock.jpg)