Embed Size (px)
Citation preview
Proceedin
gs
Pla
nt
Bre
ed
ing
In
Po
st
Ge
no
mic
s E
ra
Plant Breeding In Post Genomics Era
Proceedings of
Second National Plant Breeding CongressMarch 1-3, 2006
Jointly organized by Jointly organized by
Indian Society of Plant Breeders Indian Society of Plant Breeders &&
Tamil Nadu Agricultural University Tamil Nadu Agricultural University Coimbatore 641 003, India Coimbatore 641 003, India
Plant Breeding in Post Genomics Era
Plant Breeding in Post Genomics Era
Proceedings of the
Second National Plant Breeding Congress
March 1-3, 2006Coimbatore, INDIA
Jointly organized by
Indian Society of Plant Breeders &
Tamil Nadu Agricultural UniversityCoimbatore 641 003, India
The organizers and publishers take no responsibility of the contentsof papers presented and included in this publication
Publication No. 2
Published by theIndian Society of Plant BreedersCoimbatore 641 003
Editorial Committee
Convenor
Members
Dr. T.S. Raveendran
Dr. S.R. Sree RangasamyDr. M. KadambavanasundaramDr. N. NadarajanDr. P. Vindhiya varmanDr. P.SumathiDr. J.R.Kannan BapuDr. S.Ganesh RamDr. M.KumarDr. K.K.Vinod
Printed atM/s. Laser Park, Coimbatore
Foreword
iii
Agricultural research has made great strides in terms of innovations and development ofviable, applicable and relevant technologies. These technological advancements were responsiblefor increasing productivity and production and made India an exporting country from the statusof importing country. Nevertheless, we cannot be complacent and have to constantly work forenhancing the production to feed the population which increase every day. The estimatedrequirement of food grains for 2020 AD it is 300 million tonnes and by 2050 AD is 400 milliontonnes as against the present production of 210 million tonnes with the rider of shrinking land andwater resources.
Among all the technologies responsible for overall agricultural production, improvedvarieties acclaim top most importance as they have a direct bearing on the production. From asimple procedure of mass selection during early 20th century, the crop improvement technologieshave very steadily and rapidly evolved to the present stage of molecular breeding through theuntiring efforts of Geneticists and Plant Breeders. During this transformation, a large volume ofscientific data would also be generated, which on interpretation, provide the younger generationprecise guidelines and directions on how to proceed the programmes in future. Such informationsare constantly and periodically discussed in many scientific fora by scientists involved in cropimprovement.
The Indian Society of Plant Breeders a Forum registered under Societies Act, is strivinghard for the scientific upliftment in the field of Plant Breeding and Genetics by organizing suchCongresses, special lectures for the benefit of students and scientists and supporting meritoriousstudents through fellowship programme and providing travel grant for attending seminars etc.This is the Second National Plant Breeding Congress organized by the Society to document theresearch findings and information generated after 1998, when it conducted the First NationalPlant Breeding Congress. Classifying the 305 papers contributed for the seminar, under siximportant titles such as, crop biodiversity, quantitative genetics, ploidy variations, hybrid breeding,in vitro breeding tools and genomics. The editors have chosen invited papers and presentationsto cover the entire gamut of crop improvement and presented in a lucid form and assimilation ofscientists particularly the younger group. I hope the reader will make the best of the informationavailable in this book.
I congratulate the editorial committee for bringing out this informative and useful publicationfor the benefit of researchers and students.
Coimbatore Prof. C. Ramasamy Vice-Chancellor

iv
PREFACE
The science of plant breeding has great antiquity and is the most useful branch of scienceto the mankind. Though it was a simple procedure of selection of desirable plants for furtherperpetuation and utility to human community, the recent plant breeding procedures are technologicallyhighly advanced and packed up with strong genetic base. Thus today, the methods are complicatedbut very efficient and precise to yield the desired results. The scientists engaged in crop improvementactivities should also keep themselves abreast of the latest developments in Genetics, Cytogenetics,Genomics, Plant Breeding and Biotechnology. Besides, they should also listen to the socio-economicpreferences and adjust to the IPR system.
The Indian Society of Plant Breeders was started at the Tamil Nadu Agricultural Universityduring 1998 with a view to promote the interest of Plant breeders and to provide a common platformfor exchange, discuss and disseminate the latest knowledge and developments to the end-users.The society organized the First National Plant Breeding Congress in July 1998 with the primaryobjective of taking stock of the developments made during 20th century and to programme the cropimprovement technologies during 21st century.
Now, this second congress was organized jointly with the Tamil Nadu Agricultural University,Coimbatore to consolidate the research information generated during the last eight years in thefield of crop diversity, heterosis breeding, ploidy breeding, biometrical and quantitative genetics andbiotechnological approaches. There was overwhelming response from the scientists and morethan 300 papers were received. The editorial committee carefully selected 46 articles including 11invited papers for oral presentation and allotted 259 for poster presentations. There were 311registered participants including scientists from SAUs, CSIR, ICAR and GOI institutes, Internationalinstitutes and postgraduate and research scholars. A few represented private institutions too.There was also a special panel discussion on IPR issues which was valued by the participants.
The Editorial Committee deem it a honour to publish all the oral presentation papers in thisproceedings, the abstracts being printed and distributed to the participants on the inauguration dayof the congress. The proceedings also contains the recommendations of the six technical sessionsfor easy follow up of the future program.
The Editorial committee thank all the participants for their cooperation in sending the papers,revising them in the light of editors comments and sending back in time. The committee also thankthe President, Secretary and Organizing Secretary of the Congress for their help. The committeealso acknowledges the cooperation of the press M/s. Laser Park, Coimbatore in bringing out thispublication in a nice way. The committee believes that this book will be very much useful to all thescientists engaged in crop improvement programmes including students and research scholars.
Coimbatore Editorial Committee09.02.07
v
INDIAN SOCIETY OF PLANT BREEDERS
The commencement of crop breeding research work in Tamil Nadu dates back to 1870 when
an exotic cotton variety was introduced in India from Mauritius. The first breeding station in Tamil
Nadu was established in 1901 at Kovilpatti to take up breeding work in cotton and millets.
Subsequently breeding stations for sugarcane (1912), paddy (1913), cotton (1922), millets (1923),
oilseeds (1930) and pulses (1943) were established. A separate department for forage crops was
started in 1976. During this period, the importance of crop breeding which formed the backbone
activity of all the agricultural research stations and the institutes was well recognized. However,
subsequently there was a change in this trend and the plant breeding science, started to lose its
prime importance. Therefore, the plant breeders felt that a common forum, which can rejuvenate
the interests of the breeders and revitalise the activities would be necessary.
With the above idea in view, it was decided by a group of breeders headed by Dr. M. Rangaswamy,
Director, School of Genetics (presently known as Centre for Plant Breeding and Genetics), Tamil
Nadu Agricultural University, Coimbatore to start a forum for the plant breeders for encouraging
the plant breeders serving in various capacities in different public and private sector institutions
with the following objectives.
1. To promote brotherhood and progress among plant breeders
2. To encourage scientific and technological research on various aspects of plant breeding.
3. To provide a medium for the exchange, discussion and dissemination of current development
in the field of plant breeding to its members.
4. To promote the general advancement of plant breeding science, to create a common platform
to bring together and facilitate the exchange of Information and provide opportunities for its members
to establish a firm link between the plant breeders in India and abroad.
5. To promote the profession of plant breeding and increase professional competence in
developing improved varieties and hybrids in different crops.
6. Establishing a literature communication service to plant breeders.
vi
The plant breeders’ forum was inaugurated on February 26, 1995 by Dr. M.S. Swaminathan
and the forum was registered as per S. No. 191 of 1995 on 6.11.1995. A total of 110 breeders from
Tamil Nadu Agricultural University, Sugarcane Breeding Institute, Central Institute for Cotton
Research (Regional Station), Forest Research Institute, Coimbatore scientists from private
Companies and institutions and retired plant breeders joined the forum. Dr. J. Thuljaram Rao,
Retired Director, Sugarcane Breeding Institute, Coimbatore delivered the keynote address.
To extend the services of the forum from state level to national level, the members felt the need
of changing its nomenclature as Indian Society of Plant Breeders (ISPB) and the society was
reregistered as a national body.
Now the society is having 200 members including 140 life members and 3 foreign scientists.
The society is actively involved in organizing seminars, special lectures for the benefit of students
and scientists, supporting meritorious students through fellowship programme and providing travel
grant for attending seminars etc. The society is looking for the enrollment of scientists involved in
crop improvement for strengthening its existence and activities in the years to come.
PresidentIndian Society for Plant BreedersTNAU, Coimbatore – 3.
vii
SECOND NATIONAL PLANT BREEDING CONGRESS -PLANT BREEDING IN POST GENOMICS ERA
CONTENTSI. Inaugural address
II. Presidential address
III. Keynote address
IV. Valedictory address
Technical Session I - Evaluation and utilization of crop biodiversity
Advances in breeding of vegetablesPeter, K.V. and K.R.M. Swamy
Advances in spices breedingPeter, K.V. and K. Nirmal Babu
Enhancing utilization of plant genetic resources in crop improvementUpadhyaya, H.D. and C.L.L. Gowda
Rice biodiversity and its utilizationSubramanian, M. and S. Tirumeni
Genetic diversity of Robusta - Arabica hybrids of coffee and utilization inbreedingSanta Ram, A., D. Ganesh, N. Sandhyarani, S.R. Mythrasree, C. Murugan,R.K. Sabir, K.P. Dinesh, A. Manoharan, M.K. Mishra and Jayarama
Evaluation and utilization of biodiversity in cassava (Manihot esculenta Crantz)SanthaV. Pillai, R.R. Nair, M.S. Palaniswami, C.S. Ravindran, S.N. Moorthy, V. Raviand S. Sree Lekha
Agro-morphological characterization and evaluation of rice germplasm formajor biotic stress toleranceSubba Rao. L.V., T. Ram, N. Shobha Rani, V. Ravindra Babu, I.C.Pasalu, C.S.Reddy, A.S. Ram Prasad, B.C. Viraktmath and S.V. Subbaiah
Characterization of cotton (Gossypium hirsutum L.) genotypes and evaluationof genetic divergencePreetha-, S. and T.S. Raveendran
1.
2.
3.
4.
5.
6.
7.
8.
viii
Interfamily variation and family selection in intervarietal crosses in sugarcaneunder excess water stress conditionGovindaraj, P.
Developing high yielding rice varieties for Kerala a new approachChandrasekharan, P.
9.
10.
Technical Session II - Quantitative genetics and analysis of genotype x environmentinteraction
Technical Session III - Utilization of ploidy breeding in crop improvement
8.
Quantitative genetics - Where are we today?Arunachalam, V.
Variability and association analysis for floral traits of coconut genotypesAugustine Jerard, B., V. Niral, V. Arunachalam and P.M. Kumaran
Breeding for improved yield and yellow mosaic virus disease resistance inblack gram (Vigna mungo (L.) Hepper)Murugan, E. and N. Nadarajan
Complex inheritance in rice variety MR 1523 of resistance to gall midgebiotypesSuneetha, K., J.S. Bentur, K. Hima Bindu, P. Vijaya Lakshmi, C. Cheeralu,P.Ram Mohan Rao
Leaf trichome density – an indicator of jassid tolerance in cottonKannan, S., R. Ravikesavan and M. Kumar
Variability for yield and quality attributes in interspecific progenies ofSaccharum sp.Nagarajan, R., S. Alarmelu and R.M. Shanthi
Genetic studies on plant, maturity and physiological characters of maize(Zea mays L.) under rainfed and irrigated conditionsSubba Rao, M. and R.D. Singh
Genetic analysis of leaf anatomical characters associated with jassidresistance in cotton (Gossypium spp.)Shimna Bhaskaran, R. Ravikesavan and T.S. Raveendran
1.
2.
3.
4.
5.
6.
7.
Pre-breeding through ploidy manipulation to exploit alien genetic variabilityAmala J. Prabhakaran
Wheat polyploids as a model system for crop improvement ]Dalmir Singh and P.K.P. Meena
1.
2.
ix
Role of polyploidy in cottonKhadi, B.M. and Vinita P. Gotmare
Cryptic genomic exchange between cultivated safflower (Carthamustinctorius L.) and wild species, C. glaucus M. Bieb. Subsp anatolicus (Bioss.)Anjani, K. and M. Pallavi
Morphological, biochemical and molecular characterization of ploidy variantsin coffee for genetic improvementMishra, M.K., M. Violet D’Souza, N. Sandhyarani, S.B. Hareesh, Anil Kumar,S. R. Mythrasree, R.K. Sabir, A. SantaRam and Jayarama
Cytological studies on sugarcane intergeneric hybridsBabu, C., K.Koodalingam, U.S. Natarajan, R.M. Shanthi and S. Thangasamy
Cytological observations in colchicine induced hexaploids and their triploidsof cross between Gossypium hirsutum [2n=4x=52, (AD1)] and Gossypiumraimondii [2n = 2x = 26, D5]Saravanan, N.A., T.S. Raveendran and M. Kumar
Studies on the effect of preconditioning of pollen and dynamics of pollentube growth in Gossypium sp.Gunasekaran, M. and T.S. Raveendran
Cytological analysis Vigna radiate x V. umbellata L. HybridsPandian, M., B. Subbalakshmi, AR. Muthiah and M. Kumar
3.
4.
5.
6.
7.
8.
9.
Technical Session IV - Hybrid breeding in crops
Transgenic hybrid cotton technology and some genetic observationsNarayanan, S.S.
Expression of Brix in tomato intervarietal hybridsPanagiotis A. Michalakopoulos and S.R. Sree Rangasamy
Development of male lines resistant to Fusarium wilt in castor (Ricinuscommunis L)Lavanya, C.and Raoof, M.A.
Development of superior inbreds and selection of efficient restorers fordiverse CMS sources in sunflowerRanganatha, A.R.G., V. Vijay, C. Lavanya and K. Rukminidevi
1.
2.
3.
4.
x
Restorer identification for CMS line IR 66707 A with O. perennis cytoplasmBanumathy, S., K. Thiyagarajan and K. Siddeswaran
Evaluation of isonuclear alloplasmic hybrids in chilli (Capsicum annuum L)Nanda, C., A. Mohan Rao, S. Ramesh and R.S. Kulkarni
Combining ability studies for quality traits in Indian mustardMahak Singh and R.K.Dixit
5.
6.
7.
Technical Session V - In vitro breeding tools in genetic enhancement of crops
Combined expression of chitinase and â-1,3-glucanase generates highlevels of sheath blight resistance in homozygous transgenic rice linesSridevi, G., C. Parameswari, N. Sabapathy and K. Veluthambi
Transformation of three antioxidant genes from a highly salt tolerant graymangrove, Aveicennia marina Forsk. (vierh.) in Indica rice Ajay Parida, S.R. Prashanth, M.N. Jithesh and K.R. Sivaprakash
In vitro genetic transformation for the Helicoverpa resistance using Cry 1A(B) in pigeonpea (Cajanus cajan L cv Maroti)Sandhyarani, N., Mukund Shiragur. Sumangala Bhat andM.S.Kuruvinshetti
Direct organogenesis and somatic embryogenesis in pigeonpea (Cajanuscajan L. Millsp.)Josnamol Kurian, K. Ramakrishnan, R. Gnanam and A. Manickam
Somatic embryogenesis and plant regeneration from immatureinflorescence and leaf explants of sorghum cultivarsKumaravadivel, N., M.Umadevi and Susan Eapen
Engineering sheath rot resistance in riceRajesh, T., K. Kalpana, S. Maruthasalam, K. Poovannan, R. Samiyappan,D. Sudhakar and P. Balasubramanian
1.
2.
3.
4.
5.
6.
Technical Session VI - Contributions of genomic tools in crop improvement
Molecular breeding for brown planthopper (BPH) and blast resistance inriceKshirod K. Jena and David J. Mackill
Quantitative trait loci, DNA markers and candidate genesWhat do we do with these? –Shashidhar, H.E.
1.
2.
xi
3.
4.
5.
6.
7.
8.
9.
Microsatellite and isozyme based genetic diversity measures for decidingproductive cross combinations in sugarcane improvementHemaprabha, G., U.S. Natarajan, N. Balasundaram and N.K. Singh
Sequence characterized amplified region (SCAR) marker for theidentification of cytoplasmic genic male sterile (CGMS) lines in pigeonpea(Cajanus cajan (L.) Millsp.)Souframanien, J., A. Joshi Saha, J.G. Manjaya and T. Gopalakrishna
Molecular tagging of fertility restorer gene in cottonAmudha, J., G.Balasubramani, Suman.B.Singh, P.Singh and B.M.Khadi
Assessment of genetic diversity and interrelationship among wild mulberry(Morus laevigata and M. serrata) collections of India through DNA markeranalysisGirish Naik , M. V., B. Mathi Thumilan, Bhaskar Roy and S. B. Dandin
Use of SSR markers for the identification of interspecific and intergenerichybrids of SaccharumVijayan Nair, N., A. Selvi, S. Suresh Ramraj and K. Sundaravel Pandian
QTL pyramiding for rice root morphological traits and its effect on grainyield, roots and plant characters under submerged, aerobic and droughtsituationsShailaja Hittalmani, Grace Arul Selvi and Pavana J. Hiremath
Tracing quantitative trait loci – the best and rest with reference to brownplant hopper resistance and nitrogen uptake in riceMaheswaran, M., S. Geethanjali, K.K. Vinod, P. Meenakshisundaram, T.Elaiyabharathi, P. Kadirvel, S. Senthilvel, P. Govindaraj, S. Arumugachamy,P. Shanmugasundaram, P. Malarvizhi and K. Gunathilagaraj
Sessionwise recommendations
xii

xiii
INAUGURAL ADDRESS
Dr. C. Ramasamy.
Vice Chancellor, Tamil Nadu Agricultural University, Coimbatore
The world population is expanding rapidly and may reach 7.75 billion by 2020 and 10 billion
by 2050 from the current population of about 6.5 billion. In India, the population may increase from
the current 1.025 billion to 1.334 billion by the year 2020. Currently 800 million people are chronically
malnourished and 2 billion people lack physical and economic access to sufficient food to meet
their dietary needs. Limited availability of additional aerable land and water resources, and the
declining trend in crop yields globally make food security a major challenge in the 21st century. To
meet the demand of increasing population, India’s food grain production must be increased from
200 m.t. in 2000 to about 300 m.t. by the year 2020. According to the projections, to achieve these
targets, food grain production must increase at the rate of 5 m.t. per year over the next two
decades to meet food demand of the growing world population.
Agricultural production in India has made great strides during the post independent period.
The food grain production has increased from 50 m.tonnes in 1950 to 220 m.tonnes during 2004-
05. This was primarily due to the advent of high yielding varieties by various crop breeding strategies.
Crop improvement is the introduction and adaptation of genetically improved crop varieties giving
higher yields than the local varieties used by farmers. The discovery and successful transfer of
dwarfing genes from Norin 10 in wheat and Dee gee woo gen in rice had opened a new chapter
in the history of global agriculture. The new varieties supported by other inputs had resulted in a
multifold increase in food grain production and saved millions of lives from starvation, providing
sustainability to national food security.
The crop breeding work in Tamil Nadu commenced as early as in 1870 by way of introduction
of a foreign cotton variety from Mauritius. With the appointment of a separate economic botanist,
in 1898, the crop breeding work was initiated in sugarcane. The first crop breeding station was
established in the year 1901 at Kovilpatti for cotton and millets followed by a research station for
paddy, sugarcane and groundnut at Palur in 1905. By establishment of full fledged breeding stations
at Coimbatore in 1912 for sugarcane, 1912 for paddy, 1922 for cotton, 1923 for millets, 1930 for
oilseeds, 1943 for pulses, 1976 for forage crops, the crop breeding work was intensified.
xiv
Simultaneously, crop breeding stations were started for these crops in other centres of this state
also. At present, there are 31 research stations which are actively engaged in crop breeding work
for evolution of crop varieties and hybrids and for maintaining crop genetic resources. Concerted
efforts by TNAU scientists through research programmes resulted in the release of 262 crop
varieties in agriculture, 155 in horticulture, 9 varieties in mushroom and two tree species.
o I am pleased to recollect the works rendered by our earlier breeders and genetists like Sir.
T.S. Venkatraman (1912), famous Sugarcane Breeder who developed sugarcane varieties
incorporating with biotic and abiotic stress and high biomass production gene complexes.
Revolutionary changes in sugarcane cultivation and sugar industry with vastly improved
yield and quality under nobilization programme by crossing among tropical S. officinarum,
sub-tropical S.barberi and the wild S.spontaneum
Dr. K.Ramaiah
o Started scientific career in 1914 in the Paddy Breeding Station, Coimbatore
o PBS is the oldest rice research station in India
o He was the founder Director of the CRRI, Cuttack
o In 1949, he led the International Rice Commission of the FAO
o Initiated the indica-japonica hybridization program in 1952
o First and the only Rajya Sabha M.P. among Agricultural Scientists
Dr. G.N. Rangaswamy Ayyangar
o A great doyan among millet researchers
o Millet Breeding Station started in 1923
o Set strong foundation to millet breeding in India
o Made land mark contributions in genetics and improvement of Sorghum and minor millets,
particularly little and Italian Millets
Dr. V.S. Raman’s contribution to cytogenetics, Dr. Appadurai’s contribution to biometrics,
Prof. A. Subramanian’s role in green revolution are note worthy.
Tamil Nadu Agricultural University is the pioneer in release of first rice hybrid in India, in
the identification of CGMS system in pearl millet and sesamum, in development of GMS based
hybrids in Pigeon pea and leader in the development of photoinsensitive lab lab varieties. It is our
pride to mention the contribution of GEB 24 and TKM 6 rice varieties as a donor of genes to many
international rice varieties. SPV 462 (CO 26) Sorghum and PT 732A, the indigenous Bellary
xv
cytoplasm in Pearl Millet are important contributions from Millets. Cotton variety MCU 5 conforming
to high fibre qualities required by mills is the only variety that can spin to 60s counts. TMV 2 and
TMV 7 groundnut varieties highly demanded by groundnut growers even after so many decades
of release are land marks in Plant Breeding. I am happy that the Plant Breeders of this prestigious
institution have started a National Society called Indian Society of Plant Breeders in 1995 to
promote the science of Plant Breeding and the society is effectively functioning by organizing
special lectures honoring eminent Plant Breeders etc. It has organized First National Plant Breeding
Congress during 1998.
The growth rate of agricultural productivity is in declining trend and we need to intensify
our efforts to enhance the rate of genetic upgradation in crops. We will have to look for newer
genes, methodologies to transfer them at a much faster rate so that the variety developed with the
required new trait in the already well adapted background can be transferred to the field without
much loss of precious time.
Biotechnology offers several advantages over classical breeding, in terms of precision,
technology, gestation period, and gene transfer for specific traits even from the unrelated organisms.
The conventional approach of breeding crops by itself may not be able to deliver the goods in the
required time frame given the magnitude and urgency to feed the growing millions. In the context
of a holistic agricultural development and ensuring household food security, role of biotechnology
is going to be essentially much more important and vital than ever before. The conventional breeding
methods will have to be complemented by an array of biotechnological tools and in a variety of
ways such as tissue culture, DNA fingerprinting, molecular breeding, genomics, diagnostics,
development of transgenics etc. Bioprospecting will have to essentially lay the foundation for
effective mining and transfer of genes for specific traits.
The first transgenic plants engineered for insect resistance in cotton, corn and soybean
were released for commercial cultivation in 1996. In less than a decade (1996 to 2004), area under
biotech crops has increased more than 47 times globally, from 1.7 million hectares in 1996 to 81.0
million hectares in 17 countries in 2004.
Application of biotechnology in crop improvement programmes has started giving dividends.
The area under Bt cotton has increased tremendously. Bt cotton and Bt corn are the important
transgenic crops now under cultivation in India. Another exciting development in Biotechnology is
the GM rice called ‘golden rice’, which is genetically engineered to produce beta-carotene, a
xvi
substance which the body can convert to Vitamin A. The new rice could prove effective to overcome
vitamin A deficiency, a condition which afflicts millions of people in developing countries, especially
children and pregnant women. This rice is a product of genes transferred from a bacterium and a
flower plant (daffodil).
Tissue culture is yet another area with lot of scope for commercial exploitation. TNAU
has developed protocols for successful dihaploid production in rice and micropropogation of banana,
neem, jamun, pomegranate, rose, paulownia, orchid, Sthalavrisksha (trees) etc. which could be
commercially exploited to benefit the community.
While pursuing for higher productivity levels, we need to redesign the crop and to add
value to the farm produce so as to make agriculture more rewarding to farmers. Also, the formation
of harmful substances such as aflatoxin in groundnuts, neurotoxins in khesari dal, and cyanide in
tapioca, besides several undesirable elements in chickpea, sweet pea, and potato, can be prevented
by the use of modern biotechnological methods. There is no end to innovating the transformations
in our future crop varieties/hybrids but it is important to look for our own indigenous gene constructs
and promoters so as to be self-dependent and cost-effective in the wake of strong global IPR
regimes. Incidentally, the onus lies on the public sector institutions, which undertake most of the
transgenic research in India.
Often referred to as “Gene Revolution or Biorevolution”, biotechnology - if judiciously
harnessed, blended with traditional and conventional technologies and supported by policies - can
lead to an ever-green revolution synergizing the sustainable pace of growth and development. The
uncommon opportunities provided by fast developments in functional genomics, proteomics and
DNA microchips must be brought to developing countries for progress in scientific research and
development.
It is high time to come up with the strategies for protecting our own varieties with new era
of WTO and TRIPS. New varieties offered farmers a far higher yield and profit than traditional
varieties. Naturally, the seeds of these varieties were in high demand. Seed saving and sharing by
farmers met most of the demand, while the public and private seed supply systems met the rest.
There was no demand for ownership on plant varieties during the days of the Green Revolution,
when the seeds of many high yielding varieties evolved by scientists were in high demand.
For agricultural sector, it was a kind of anathema, mainly because the Indian Patent Act
xvii
1970 clearly prohibited patenting of methods of agriculture and horticulture. However, intellectual
property protection has received enormous attention since 1986 when it was included in the Uruguay
Round of Talks and particularly when Dunkel’s Proposal relating to GATT was published in 1991.
TRIPS Provisions Relating to Agricultural Sector
The provisions of the TRIPS Agreement have widened the scope of protection of intellectual
property rights relating to agriculture through plant variety protection. A reference to Article 27 of
the TRIPS will show that all inventions regardless of the field of technology are eligible for protection.
Member countries will have to provide a legal framework for the protection of inventions relating
to plant varieties.
Indian Patent Act (1970) does not permit the patenting of plant varieties and animal breeds
which are existing in nature. To protect the rights of the breeders and farmers, Govt. of India has
enacted the Plant Varieties Protection and Farmers Rights (PVPFR ACT, 2001). Under the
PPV&FR Act, Plant Breeders Right on a plant variety is established by registration of the variety.
The PBR holder can be one person, a group or community or an institution. By registering a
variety, the person or the institution becomes its PBR holder. The PBR holder alone has the
exclusive right to produce, sell, market or distribute the seeds or planting material of that variety.
Sensitizing agricultural scientists in IPR related issues will enhance the inventive capability
of the agricultural research system, induce investment in agricultural research, strengthen domestic
agricultural industries and generate confidence among domestic trade associations in our country.
IPRs and Outlook for Scientific Research in Agriculture
Out of the eight IPRs of the TRIPs Agreement, patents and plant variety protection will
produce a marked change in the outlook for scientific research in agriculture. With a legal system
in place for the protection of plant varieties, the scientists will try to come up with research and
inventions of commercial value. Research especially in agriculture will not be carried out for the
name sake of research. Agricultural scientists will endeavor to come up with inventions which can
prove to be a commercial success. The provision for the protection of new plant varieties will have
all pervasive effect in various fields of agriculture.
In India, agricultural scientists have a unique orientation. Generally they develop varieties
as they have to develop varieties for resource poor farmers. They do not visualize or anticipate
any monetary reward to them forthcoming from their research. The protection available to them
xviii
with Plant Breeders’ Rights will induce them to develop varieties which may command premium
price in the market. In other words, the provision for the protection of new varieties in India will
prove to be a great motivating force for the scientific community in agriculture. It will change their
outlook for research. They should try to ensure before launching a research project that the products
of their inventions are in demand in the market.
IPRs and Inventive Capability of State Agricultural Universities
Achieving self-sufficiency in food has been the cherished policy objective of our planners.
As a result, a. reasonable infrastructure for agricultural research has come up. This infrastructure
strives for developing varieties which can contribute to food production. However, the State
Agricultural Universities and ICAR institutes may have to be necessarily active and vibrant. With
a legal system of protection of inventions in place, the SAUs will be induced to prioritize research
from the standpoint of the commercial value of the research.
The SAUs will also be induced to catalogue indigenous germplasm and develop an inventory
of the plant genetic resources. The inventories will enhance the bargaining power of our country.
Our agricultural research system will thus experience many changes leading to their
enhanced inventive capabilities. Our agricultural scientists may modify their approach from
quantitative gains in crop yields to qualitative attributes of the crop products. They may gear up
their research system to meet the quality requirements of the consumers, having high willingness
to pay for the quality of the product.
IPRs and Investment in Agriculture
With increased inventive capability of SAUs and assured protection of new varieties and
agricultural inventions, the level of investment in agriculture may increase. Assured protection of
IPRs may induce the private sector to take up the protected varieties for commercial production.
The domestic seed industry in India may expand and flourish. However, the prospects of enhanced
investment in agricultural sector through IPRs will depend upon the configuration of the private
sector, the level of involvement of public sector in agriculture and the size of the market of the new
products.
IPRs and Regulations of Access to Biological Resources
The Biological Diversity Act (BOA) 2002 envisages regulation of access to biological
resources. The biological resources have been defined as resources which include plants, animals,
xix
micro-organisms or plant thereof (excluding value added product) with actual or potential use but
do not include human genetic material. Section ‘6’ of the BDA-2002 stipulates that application for
IPRs cannot be made without the prior approval of the National Biodiversity Authority (NBA) if
the research is based on the use of biological material from India. The NBA may dispose such
application for permission in 90 days and impose benefit sharing. All the IPR granting authorities
will endorse a copy of the sanction issued by them in relevant cases to NBA. Thus IPRs will be
used to regulate access to biological resources of India which is a very important for the economy
of India.
It would thus appear that new developments relating to IPRs in India have wide ranging
implication for various sections in Indian economy. They will have implication for change in the
outlook of scientists in agriculture, inventive capability of SAUs, investment in agriculture, trade
association, growth of domestic industries, and regulation of access to biological resources.
It is appropriate and worthy to take stock of the results achieved in each of the research
area so far document and discuss them and based on the outcome, plan for the future. If we
consider the plant breeding research early part of the 20th century was devoted to gaining basic
information, cytogenetical and biometrical investigations during middle part, heterotic exploitation
and germplasm conservation and utilization took place while during the current phase the beginning
of biotechnological research, molecular biology and genetic transformation started. Now it is the
blend of conventional and biotechnological investigations. It is therefore appropriate that the Congress
will be useful to consolidate the research findings and plan for Plant Breeding activities in the 21st
century so that the food and clothing needs of the growing population can be readily met without
any shortage. I am happy to inaugurate the congress and wish that fruitful results should come out
from the deliberations and the results should be transformed into action.
xx
PRESIDENTIAL ADDRESS
Dr. K.V. Peter,Vice Chancellor, Kerala Agricultural University, Thrissur, Kerala
India was rich in biodiversity and home to a large numbers of medicinal plants. Indians had
adopted agriculture as early as 2000 B.C., and the wisdom of plant breeders was “tremendous”,
having accumulated over a period of 4000 years. Despite adequate food stocks in the country, a
large section of the people did not have the purchasing power to buy what they needed for adequate
nutrition.
Biotechnology is one of the answers, at least regarding micro propagation in cardamom,
vanilla and pepper, where there have been success stories.
In 2006, the food production of crops such as rice, wheat, barley and millets was about
208 million tonnes. However, by nutritional standards, the country needs 260 million tonnes. India
was likely to import rice. However, this was an unwise step, for Mahatma Gandhi himself had
cautioned against it, saying that import of agriculture amounted to import of unemployment.
Planners and administrators had predicted that by 2015, India would require 400 million
tones of food grain for its population of 120 crores.
Plant breeders would face marketing challenges to sustain “production by the masses
rather than mass production”
xxi
KEY-NOTE ADDRESS
Dr. S. Prakash Tiwari,
Director, National Academy of Agricultural Research Management (ICAR), Hyderabad
It is my pleasure and privilege to be here at the TNAU, which lies in one of the most
progressive states of India, i.e. Tamil Nadu, and is a leading agro-technology provider of India. Its
graduates are recognized throughout the world. The University, since its genesis as an Agricultural
School at Saidapet, Chennai, and its subsequent relocation at Coimbatore during 1906, has already
completed its 100 years with laudable achievements.
The science and practice of crop improvement has made great strides in the recent past.
Truly, it is a post genomic era for plant breeding. I am happy to note that keeping in line with the
great tradition of the TNAU, the Indian Society of Plant Breeders, Coimbatore has very timely
organized this Second National Plant Breeding Congress on “Plant Breeding in Post Genomic
Era”.
The future of agriculture essentially lies in the new science-led agricultural growth towards
farm prosperity. The whole biological world now belongs to a single gene pool. Gene of any
organism can be transferred to any other organism. We can have designer plants. Crop improvement
will benefit in an overall manner but mainly through the use of hybrid technology (used earlier as
well) and agricultural applications of biotechnology, both being not mutually exclusive.
The new tools of science, however, need deft handling in the interest of human welfare at
large. The technologies have to be robust, farm-worthy, eco-friendly and to be made available to
farmers at affordable cost in a scale-neutral manner. The farmers’ interests have to be protected.
Farmers’ rights are primary rights and those should not be construed as secondary or concomitant
benefits and privileges only.
In the new era of the advent of GMOs / transgenics, bio safety of endemic variability
riches such as that of Western Ghats are to be preserved. Our bio resources should be utilized on
sustainable basis with equitable benefit sharing. We shall not replicate anything similar to what
happened to maize land races in Mexico. Regulatory and operational bio safety regulations should
be rigorously followed. There is a need for construction of an Integrated Database on Bio safety
and use of GMOs in India.
xxii
Any organism, including crop plants, can now be examined in terms of its whole hereditary
organization through study of expression and interaction of genes – a field that is broadly referred
to as ‘genomics’. The genomics of Arabidopsis thaliana and rice has already provided a wealth
of information. India has contributed in this endeavor as one of the global partners in the International
Rice Genome Sequencing Project. The focus of genetic research has now shifted from high-
throughput sequencing to elucidation of gene function i.e. from structural to functional genomics.
There could be myriad positive implications of genomics with respect to food, nutrition and
environmental security of the nation.
The science of genomics offers tremendous opportunities for the humanity in the field of
medicine, agriculture and industry alike. Novel genes and DNA markers linked to agriculturally
important traits are being identified and these can be used for rapid variety improvement in a more
precise and targeted manner using markers assisted selection (MAS). Genetically modified improved
plant varieties or transgenics can be produced. Also, plants can be engineered to produce novel
products including vaccines and nutraceuticals. Plants, thus, serve as bio-factories.
The major challenge for decoding genomes of crop plants is their enormous size. For
example, the size of maize genome is 6 times and that of wheat is 40 times bigger than the rice
genome. Hence, so far sequencing of only two genomes of higher plant namely Arabidopsis (125
Mb) and rice (400 Mb) have been completed. International efforts are underway for the sequencing
of banana, tomato, cotton and maize genomes and the gene-rich regions of wheat.
Still bigger challenge is to understand the functions (functional genomics, proteomics) of
each and every new gene. For example, scientists have predicted nearly 62,000 genes in rice.
Each of these genes will also have several alternative forms (alleles) and their structure and
function needs to be deciphered by allele mining.
We shall start with developing mapping populations such as RILs, NILs etc. and undertake
molecular characterization and systematic phenotyping. Eventually, QTL analysis, fine mapping
and reducing the number of candidate genes would enable gene identification and validation.
The old paradigm of looking for the phenotype is giving way to the new paradigm of
looking for the genes. In India, several genes such as Am A1 and OXDC have been isolated,xxiii
sequenced and used for transformation. Successful isolation of protease inhibitor and lectin genes
and promoter sequences from indigenous legumes have been obtained. These genes are being
mobilized in different crop species for developing transgenic crop plants.
Genomic synteny and comparative genomics can help in gene discovery for desirable
traits. Map-based cloning and allele mining is gaining importance (e.g. Rice blast resistance Pi-kh
gene). Continuous gene and allele mining is needed for eventual gene deployment by (i) transgenics
development, (ii) marker assisted selection, and (iii) gene pyramiding for (a) durable resistance for
biotic stress and/or, (b) multiple stress tolerance. Thus, the research has to traverse the journey
from gene discovery to trait synthesis for crop improvement.
Innovative and Strategic Research in crop improvement is called for towards novel methods
of gene transfer, marker-free selection of transformants, super promoters, tissue-specific expression
and more insecticidal toxins.High power computing and a range of DNA analysis and data base
management software along with the Internet revolution have played a crucial role in the wide
spread genomic research. It has enabled scientists to work from anywhere in the world.
Bioinformatics through orthologs identification and display, auto-pipeline and availability of gene
expression data centralized to enable comparative analysis data mining would greatly help in plant
breeding efforts. Gene Bank EST resources for crop plants are rapidly growing day by day.
Use of the new tools of science is also enormous in biodiversity management viz. molecular
characterization for biodiversity assessment, for IPR protection, for bio resource utilization, for
building up core collections etc. Gene detection technologies can also help in minimising adventitious
presence of transgenes in germplasm collections and farmers’/traditional varieties and land races.
We are in the new IPR-regime as well. We have to stake the claims of national sovereignty on our
germplasm and varieties. A single biotech-generated product may have several IP-protections.
Holder of one of them can block the commercialization of the product. This calls for partnership
among public and private sectors to overcome IPR-encumbrances.
The country is well-poised to benefit from the new approaches in crop improvement. The
conventional plant breeding efforts should, however, have a desirable confluence with
biotechnological applications and these two should not be taken as mutually exclusive approaches.
xxiv
VALEDICTORY ADDRESS
V. Santhanam, FAO Expert
President, Indian Society of Plant Breeders, Dr. T.S. Raveendran, President of this Session
Dr. N.M. Ramaswamy, my esteemed colleagues, Dr. S.S. Narayanan, Secretary of ISPB Dr. N.
Sivasamy, and distinguished participants of the Second National Plant Breeding Congress, I deem
it honour and privilege to have this opportunity to address the galaxy of plant breeders and
biotechnologists in the broader sense who have gathered at the Second National Plant Breeding
Congress.
Thanks to the dynamic efforts of the President, Dr. T.S. Raveendran, and all his colleagues
of the organizing committee. I understand that you had a very hectic schedule during the last 3
days with comprehensive presentations and discussion on the widest range of topics covering the
entire gamut of technological tools now available with the plant breeders before arriving at this
closing session. Dr. Narayanan had very ably summarized the recommendations followed by the
presidential address by Dr. Ramasamy and very critical review of the entire congress presented
by Dr. Raveendran. I do not think therefore, that I should deliver a formal valedictory address
which will add only to your fatigue at the end of the day. It is a very happy coincidence that this
campus is in its centenary year, the function for an agricultural institute being laid for this very
building in the year 1906. The institution which has grown around this main clock tower building in
which we are meeting today during last 100 years, provides testimony to the vibrant growth of
agricultural education, research and extension in this part of the country which have gained national
and international recognition. The crop improvement and breeding sections established at the
Coimbatore campus as a part of Agricultural College and Research Institute during early decades
of 20th century have rendered yeoman service to the cause of agriculture and increasing crop
production and quality.
It may be pertinent to recall the names of the some of the early pioneers in plant breeding
who built up the high traditions for the vibrant plant breeding programmes which are actively being
continued by the present generation scientists in this campus and its regional stations. I see many
known faces and distinguished scientists among the audience and it may be difficult for me to list
out all of them. Among the older pioneers who are not here the names of Dr. K. Ramaiah, the
eminent Rice breeder, who recognized the importance of rice quality with yield in varietalxxv
improvement, Dr. B.W.X. Ponniah, in millet breeding, Rao Baghadur Dr. Ramanatha Iyer and
Prof. Balasubramanian in cotton breeding come to my mind. Some of the early pioneers or stalwarts
like Dr. P. Madhava Menon in the millet breeding station in the early 1950’s who was the first
breeder to exploit hybrid vigour in the pearl millet improvement and Dr. P.V. Marappan, the former
Director of School of Genetics, a predecessor to Dr. Raveendran, was responsible for milestone
development of cotton variety MCU 5, the best ever hirsutum cotton released in India through
introgressive hybridization.
The world’s worst recorded food disaster happened in the year 1943 in Bengal of British
India when an estimated 4 million people died of hunger. In a recent meeting held at CIRCOT,
Bombay in December 2005, Mr. R.M. Lala, Chairman, Centre for Advancement of Philanthropy
and also a trustee of MSSRF introduced Dr. Swaminathan, the main speaker at the function with
the information that the Bengal catatrosphy in the year 1943 ignited a spark in young Swaminthan
to choose an agriculture based career for himself. He joined Agricultural College, Coimbatore in
the year 1944 and graduated in 1947. The latest history is too well known to be repeated to this
august audience. The average Indian who was leading dependent life on food grain shipment in
mid 1950’s literally had a slip to mouth to existence, now proudly holds his head high in the international
scenario due to Green Revolution. Food production has increased from 50 mt. in 1950 to over 200
mt. estimated for the current year with enough stock to feed over 1 billion people. It is the miracle
of application of science and technology complimented with administrative support and political
will. Dr. M.S. Swaminathan, as you all know, is now spreading a movement for an ‘evergreen
revolution’ to sustain the development.
I started my professional career in the Cotton Breeding Station of this Institute in mid 1947
and I may therefore take the liberty of a couple of minutes saying specifically on the cotton
breeding and varietal improvement scenario. The Indian cotton crop is the most diverse in the
world in terms of botany and fibre quality range. A major landmark in the history of cotton breeding
in India is the exploitation of hybrid technology with the release of the intra hirsutum hybrid in
Gujarat by Dr. C.T. Patel in 1970 and the extension to commercial cultivation of first generation
hybrid cottons. Subsequently a large number of hybrids both of intra and interspecific nature like
Varalaxmi and DCH 32 from Karnataka and TCHB 213 from this Institute have all been extended
in large scale cultivation. Currently, nearly 50% total cotton area is estimated to be covered byxxvi
hybrids developed by the public sector as well as the dynamic private sector research and hybrid
seed production contributing to over 50% of total cotton output in the country. Another significant
milestone in the cotton breeding programme is the recent utilization of transgenic technology utilizing
the Bt gene conferring resistance to Helicoverpa bollworms. I am sure this subject would have
been dealt at length by my esteemed colleague Dr. S.S. Narayanan yesterday. To say, during the
year 2005-2006, the transgenic Bt hybrid cotton is estimated to have covered about 18% of National
cotton area and contribute about 25% of production.
Genes for jeans is the slogan with target genes in mind. Insecticidal and herbicidal resistance,
drought tolerance, seed oil and protein improvement, fibre modification and inducing male sterility
are other avenues in biotechnological research. The phenomenal increase in cotton production to
about 240 lakh bales of cotton lint in the current year 2005-2006 as against 26 lakh bales only in
1947 – 48 at the time of independence may well be considered a “white revolution” comparable to
the praiseworthy green revolution in food crops. To commemorate this achievement, I may venture
to suggest that the Indian Society of Plant Breeders consider their motto of ‘breed and feed’ to be
amended as ‘breed, seed and feed’ the Nation. Perhaps seed alone in the broader sense includes
agro industry also apart from alleviating hunger of billion mouths. Before I conclude, I wish to
close with relevance to plant breeders.
Dr. Norman Ernest Borlaug, the Nobel Laureate who is mainly responsible for high yielding
varieties of Mexican dwarf wheat which seeded the green revolution in many parts of the world
apart from India during 1970’s used to observe in mock seriousness. I quote “An ideal crop variety
is an elusive to secure as an ideal wife”. If the breeders were to wait to release an ideal variety
combining in one cultivar of all desirable traits, he will retire from service, as a frustrated person
without releasing any variety. Similarly the gentleman waiting for an ideal wife will remain unmarried
for life.
I would like to thank once again the Society and Organizing Committee for giving me this
valuable opportunity to meet you all in this afternoon. I wish to congratulate one and all of you for
the significant contributions made by you to breed and feed.
May I close and wish you all good future.
Thank you.
xxvii
TECHNICAL SESSION I
EVALUATION AND UTILIZATION OF CROPBIODIVERSITY
ADVANCES IN BREEDING OF VEGETABLESPeter, K.V1. and K.R.M. Swamy2
ABSTRACTVegetable crops are important sources of carbohydrates, vitamins, minerals and proteins.
India is credited as the second largest producer of vegetables in the world next only toChina. Because of varied agro-climatic conditions in India, a large number of vegetablecrops are grown here and a great deal of research work conducted in the disciplines ofvegetable breeding, production technology, plant protection, seed production and post-harvest technology.
Advantages of vegetables are as follows:- Nutritional security.- Production of more biomass.- Reduction in malnutrition.- Digestible protein.- Economical to grow.- Well fitting in farming systems.- Suitable for mixed, companion and inter- cropping.- Maximum output and more income / unit area.- Suitable for small farmers.- Source of supplementary income.- Intensive employment.- Higher income.- Export potential.
Quantity of vegetables produced / capita inIndia is much lower than what is recommendedby dieticians. In India, per capita availability isaround 135 g against minimum requirement ofabout 300 g for a balanced diet. World’s percapita availability is 160 g/day as against 236 g/capita/day in developed countries. In general,average/ capita / day availability of vegetablesin South Asian region is only 96 g which is higherthan only South-East Asia (63 g), sub-SaharanAfrica and Latin America. In a few developedand developing countries, per capita /dayconsumption of vegetables is very high, e.g., Italy(593 g), Japan (523 g), USA (469 g), Canada(428 g), Australia (346 g), China (195 g),Philippines (167 g) and Thailand (163 g). India
has to go a long way for boosting vegetableproduction to meet minimum need for nutritionalsecurity of population. Scope for horizontalexpansion of area under vegetable crops ismuch limited due to lack of suitable land andthus option is for vertical increase by enhancingproductivity.
Estimated area under vegetables in India is8.0 million ha and production is 95 million tonneswith productivity of 13- 15 tonnes/ha. By 2020,area should be 12.5 million ha and productionshould be 200-250 million tonnes withproductivity of 20 tonnes/ha.
History of vegetable breeding in IndiaVegetable research in India is of recent
origin. Major milestones of vegetable research
* 1940 – Successful attempt of seedproduction of temperate vegetables atQuetta (now in Pakistan).
* 1947 – Sanctioning of nucleus ‘PlantIntroduction Scheme’ at Indian agriculturalResearch Institute, New Delhi.
* Simultaneous start of ad-hoc schemes byIndian Council of Agricultural Research indifferent states like Punjab, Uttar Pradesh,West Bengal, Maharashtra HimachalPradesh, Jammu and Kashmir and Tamil
* 1949– Establishment of Vegetable BreedingStation at Katrain in Kullu Valley,Himachal
1. Kerala Agricultural University, Thrissur, Kerala.2. Division of Vegetable Crops, Indian Institute of Horticultural Research, Bangalore
1
Pradesh for production of seeds of temperate vegetables.
* 1955 – Transfer of Vegetable BreedingStation, Katrain to Indian AgriculturalResearch Institute, New Delhi to undertakeresearch on temperate vegetable crops,standardization of seed productiontechnology and to produce seeds ofimproved varieties of temp erate vegetablecrops.
* 1956 – Creation of Division of Horticultureat Indian Agricultural Research Institute,New Delhi
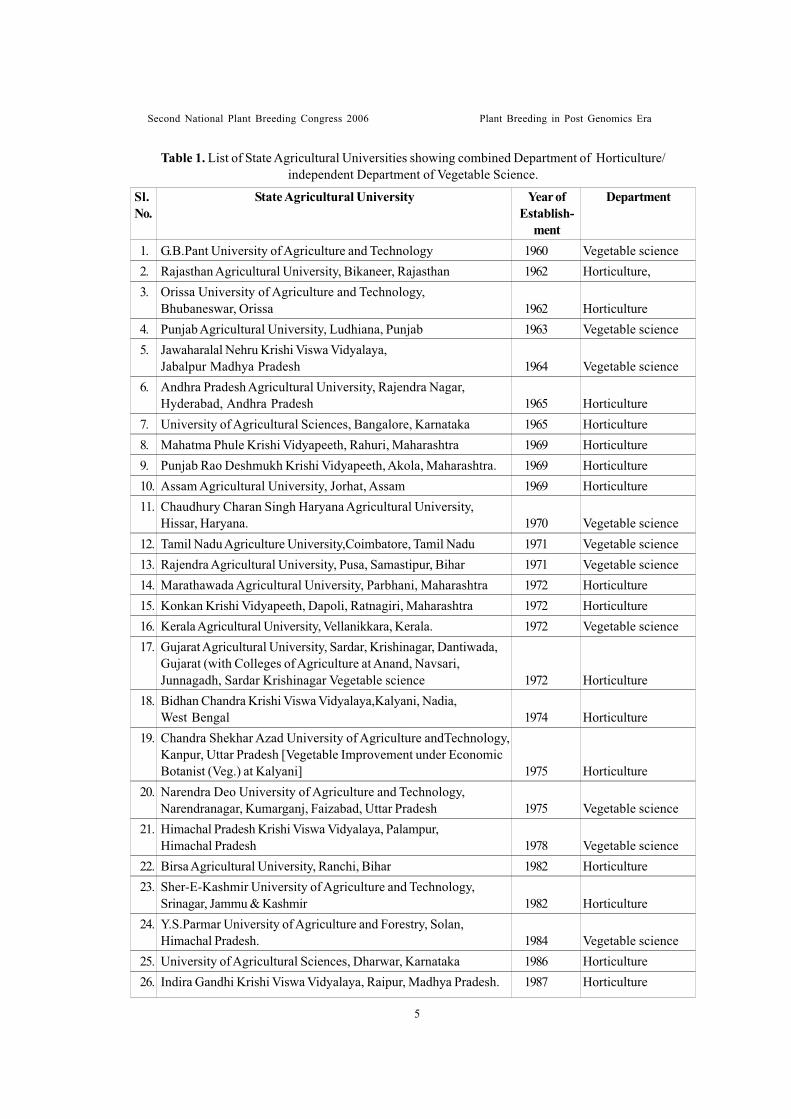
* 1960 – Establishment of State AgriculturalUniversities (SAUs): The G.B.PantUniversity of Agriculture and Technology,formerly known as Uttar PradeshAgricultural University (UPAU), Pantnagarwas the first agricultural university to beestablished on land grant pattern in 1960.State agricultural universities establishmenton the pattern of land grant colleges/universities of United States of Americahad full-fledged and separate Departmentsof Horticulture and/or Vegetable Sciencestarted from 1960 onwards. Thesedevelopments gave thrust to vegetableresearch. Twenty six state agriculturaluniversities plus one central university onagriculture as given in Table-1 are nowengaged in the conduct of research onvegetable improvement. In the past,vegetable improvement programmes were located in combined Departments ofHorticulture. Lately, there has been a shifttowards creation of separate andindependent Departments of VegetableScience after bifurcation/trifurcation ofexisting Departments of Horticulture tocarry out vegetable breeding and productionwork more efficiently.
Besides these 26 State AgriculturalUniversities conducting researches on
vegetable improvement, a CentralUniversity on Agriculture with headquartersat Imphal, Manipur came into existence in1993.This University has various collegesincluding a College of Horticulture with aseparate Department of Vegetable Science.
* 1968 - Establishment of Indian Institute ofHorticultural Research (IIHR), Bangalorewith a strong focus on vegetableimprovement among other things.
* 1970 – Initiation of All India Co-ordinatedVegetable Improvement Project (AICRIP)with headquarters at Indian AgriculturalResearch Institute, New Delhi headed by aProject Co-ordinator.
* 1984–Recommendation of Quin quennialReview Team (QRT) of the Indian Councilof Agricultural Research to upgrade the AllIndia Co-ordinated Vegetable ImprovementProject to the level of Project Directorateof Vegetable Research (PDVR).
* 1987 – Start of Project Directorate ofVegetable Research during the Seventh FiveYear Plan by upgrading erstwhile All IndiaCo-ordinated Vegetable ImprovementProject, with head quarters at IARI, NewDelhi.
* 1992 – Shifting of headquarters of PDVRfrom New Delhi to Varanasi.
* 1994- Initiation of All India Co-ordinatedNadu
Research Project under National SeedProject (NSP) for production of breederseed of vegetable crops with a financialoutlay of Rs.303.59 lakhs for 3 years spreadover various centers engaged in vegetableresearch.
* 1995 – Initiation of ICAR research networkon promotion of hybrid research invegetable crops (ad-hoc project) for 3 yearswith total cost of Rs.330.38 lakhs spreadover different vegetable research centers/
Second National Plant Breeding Congress 2006 Plant Breeding in Post Genomics Era
2
Second National Plant Breeding Congress 2006 Plant Breeding in Post Genomics Era
testing. At present, around 30 % of area undervegetable crops is covered by improvedvarieties. Non-availability of seeds of improvedvarieties is one of the major productionconstraints in India.
Resistant varietiesVegetable crops are highly susceptible to a
number of diseases. Breeding for diseaseresistance is given due importance to developvarieties against important diseases. Over 80disease-resistant varieties/hybrids aredeveloped in 13 vegetable crops (Table-11).Breeding methods depend on source ofresistance and its inheritance. For simplyinherited resistance, back-cross method ofbreeding is commonly employed to transferresistance from donor parent to commercialvariety. In certain cases, simple selection,pedigree methods and combination of back-cross and pedigree method are employed inbreeding. In polygenic control of resistance,mass selection, recurrent selection, controlledmatings (among resistant progeny) in F2 andsucceeding generations and other breedingmethods involving gene pyramiding areemployed. Biotechnological approaches likeembryo rescue and protoplast fusion techniquesneed to be employed to overcome interspecificand even inter-generic barriers as shown bythe crosses: (S.melongena x S.sisymbrifolium,S. gilo x S.integrifolium), (L.esculentum xL.peruvianum), (C.annum x C.baccatum var.pendulum), (Sinapis alba x Brassicaoleracea var. botrytis), etc. Specificprogrammes need to be taken to integrateresistance breeding with heterosis breeding todevelop promising disease-resistant hybrids.Parents resistant to indigenous pathogens orraces of pathogens should be developed fortheir subsequent utilization to develop resistanthybrids. In India, resistance to diseases formsa significant objective in vegetable breedingprogrammes. Several resistant varieties weredeveloped by simple selection and incorporation
State Agricultural Universities. The PDVR was later upgraded as an
Institute, Indian Institute of VegetableResearch (IIVR).
All India Co-ordinated Research Project onVegetable Crops (AICRP-VC) has itsheadquarters at IIVR, Varanasi, and itincludes seven main centers, 18 sub-centers,19 voluntary centers and 34 private seedcompanies for conducting experiments/trialson vegetable crops.
Achievements in breeding of vegetablesSignificant achievements were made in
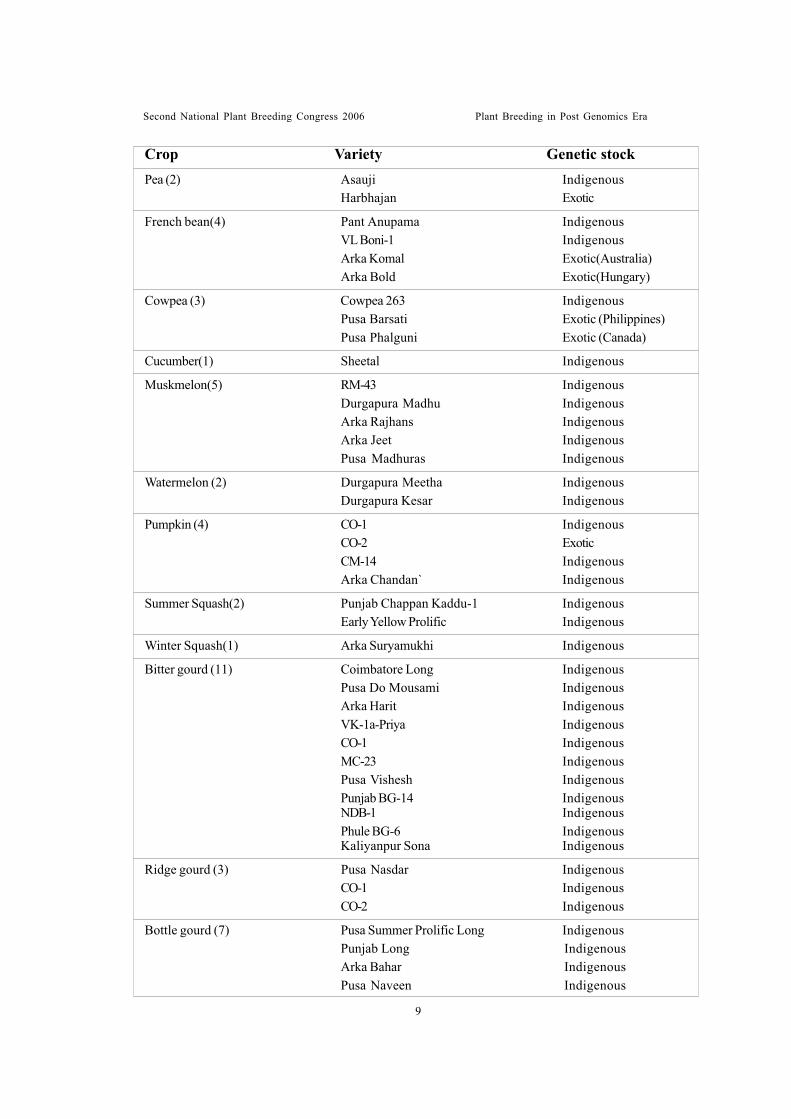
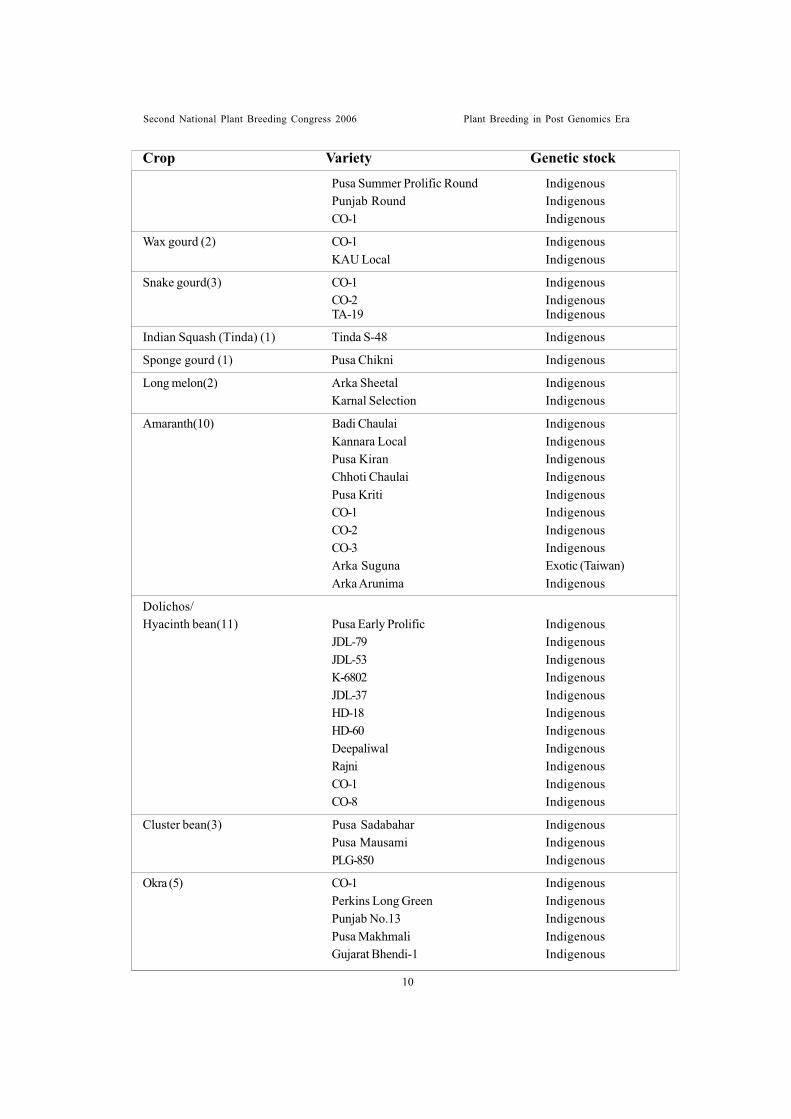
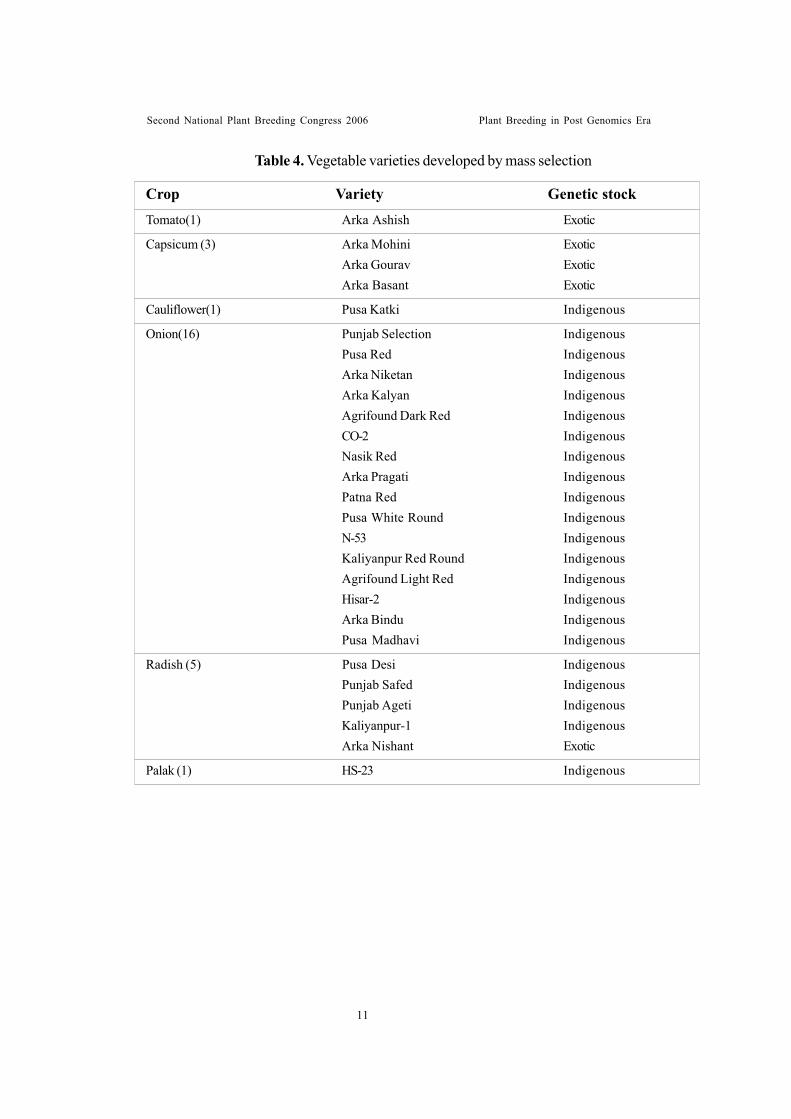
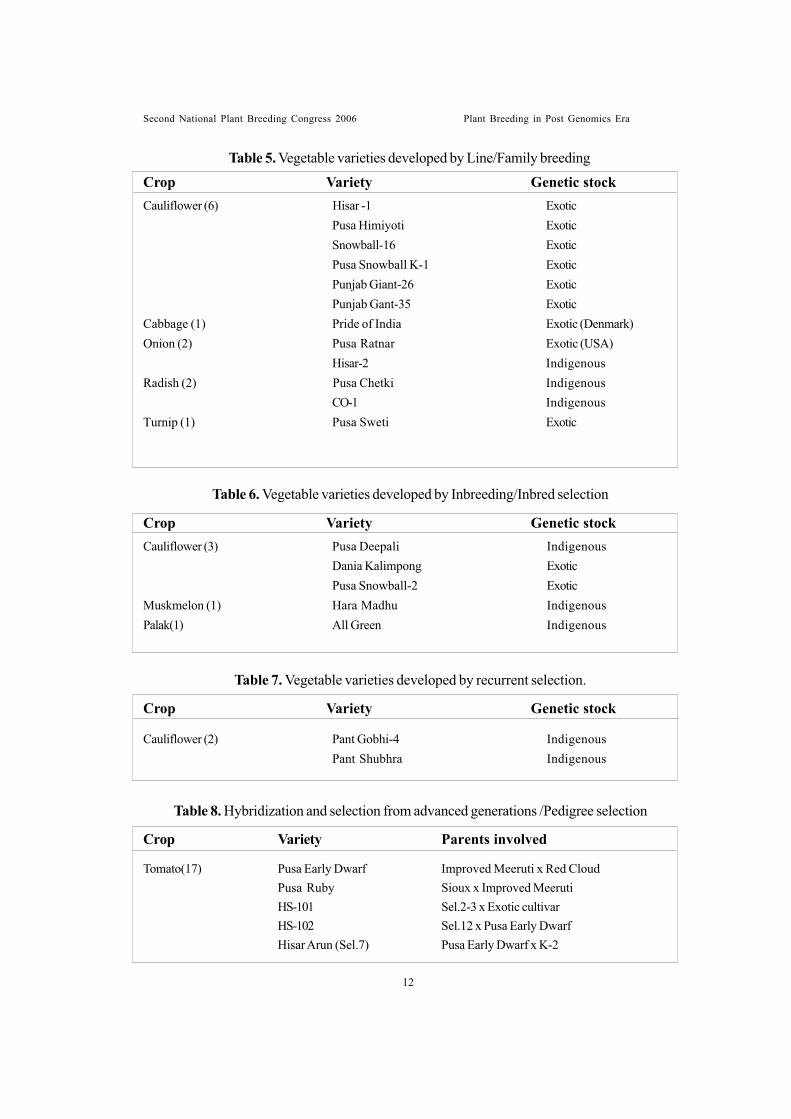
breeding of vegetable crops in India since 1950’sby adopting different methods of breeding suchas plant introduction, plant selection (individualplant selection, pure line selection, massselection, line breeding, family breeding, selfingand massing, recurrent selection), hybridizationand selection, back-cross method of breeding,mutation breeding, synthetic varieties, heterosisbreeding etc. depending upon crops involved.
Development of improved and highyielding varieties
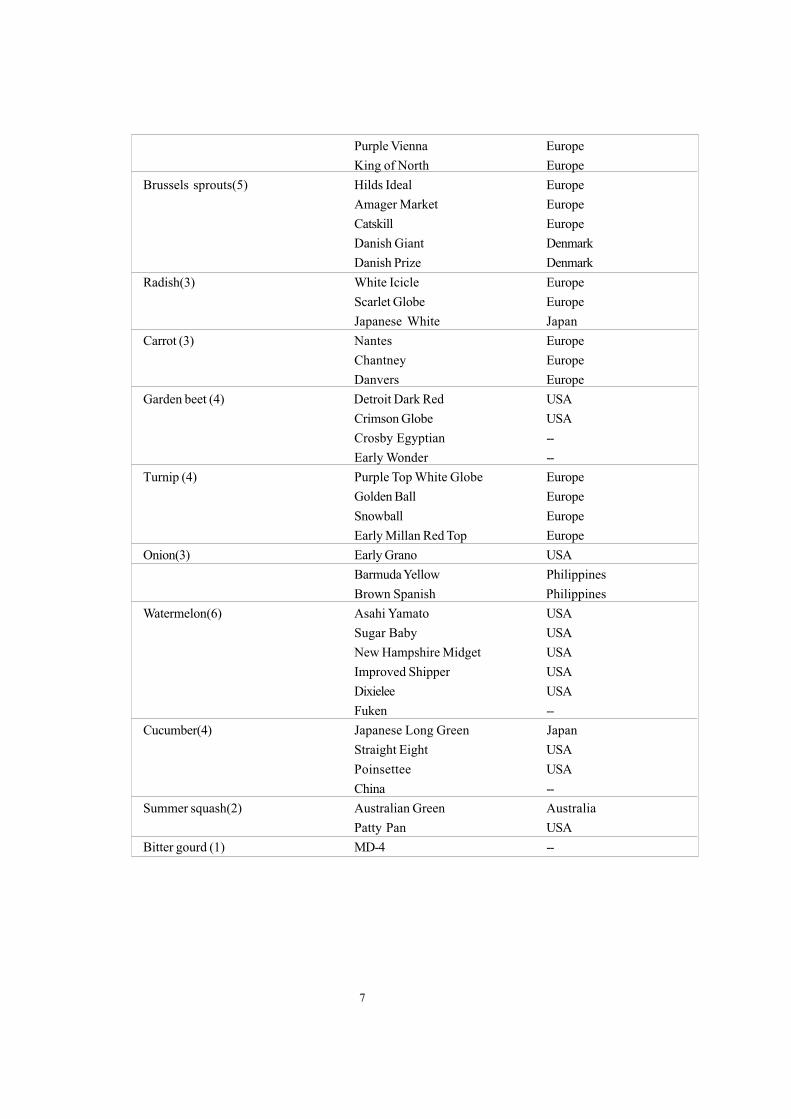
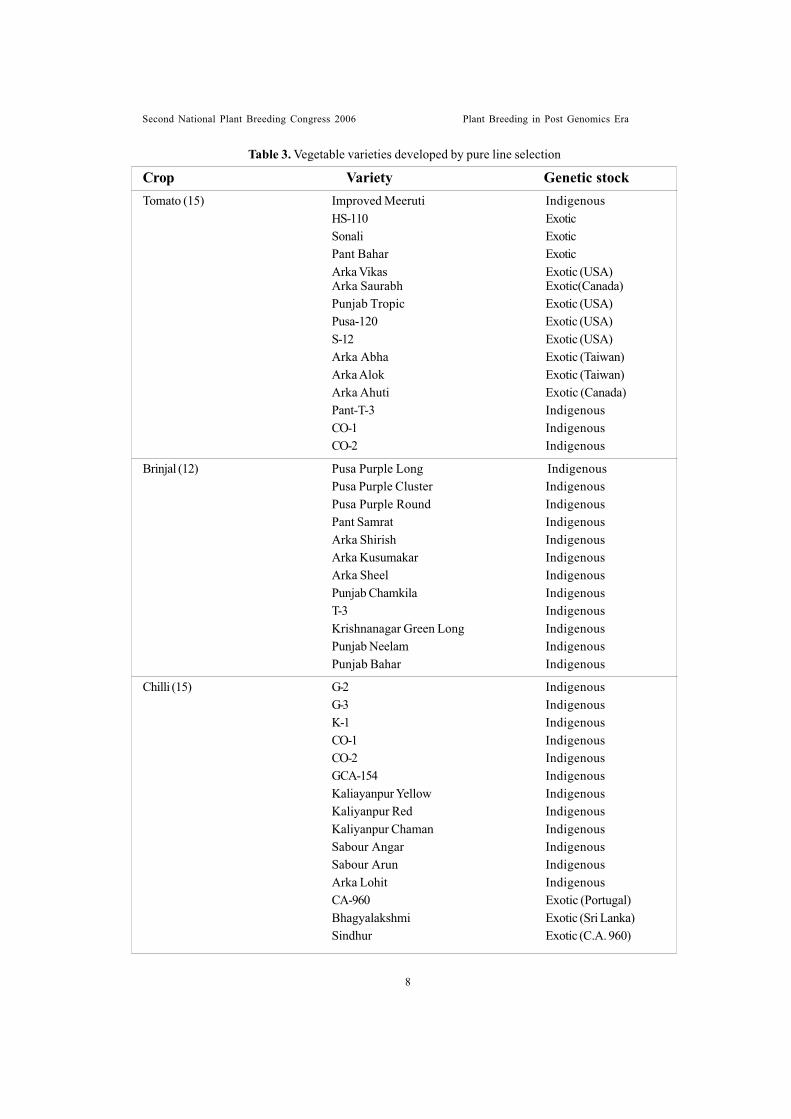
Tremendous progress was made in thedevelopment of improved and high yieldingvarieties of different vegetable crops. Over 400varieties of different vegetable crops comprisingsolanaceous fruits, cole crops, bulb crops, peasand beans, cucurbits, root crops, leaf vegetablesand others developed/identified by differentICAR institutes and agricultural universities byadopting breeding methods like introduction andacclimatization (Table-2), pure line selection(Table-3), mass selection (Table-4), line/ familybreeding (Table-5), inbreeding/ inbred selection(Table-6), recurrent selection, hybridization andselection/ pedigree selection (Table 7–8),synthetic varieties development (Table 9),mutation breeding (Table 10), and back crossmethod of breeding (Table 11) are recommendedfor cultivation in various agro-climatic conditionsbased on multilocation and multidisciplinary
3
Second National Plant Breeding Congress 2006 Plant Breeding in Post Genomics Era
of resistance from donor parents. Interspecifichybridizations are successfully accomplished todevelop resistant varieties. Yellow vein mosaicvirus resistant varieties of okra (Arka Abhay,Arka Anamika etc.,) were developed employingresistant wild species Albemoschus manihotssp. manihot and ssp. tetraphyllus. Two leafcurl resistant tomato varieties, Hisar Anmol andHisar Gaurav were developed by transferringresistance from Lycopersicon hirsutumf.glabratum. Resistant varieties so far developedin India are presented in Table-11. Resistancein breeding should be viewed as a continuousprocess. Due attention must be paid to developnew varieties with higher level of resistancecoupled with high quality attributes. In vegetablecrops, resistant varieties would be of little useunless it possesses good horticultural characters.Resistance breeding must be integral part of anybreeding programme.
Hybrid varietiesICAR Research Institutes and Agricultural
Universities contributed considerably to developF1 hybrids. At present, over 80 F1 hybridcultivars of 16 vegetable crops were developedby public sector organizations Table 12. Privateseed companies did commendable work inpopularizing hybrid varieties in India. Over 200F1 hybrids in 15 vegetable crops are being soldby seed companies in India (Table 13). Atpresent, there is competition among the privateseed companies (both national and multi-national)in the present liberalization of seed policy. Mostof hybrids released at national level weredeveloped by public sector but their popularityamong farmers is rather poor due to very weakseed production and marketing infrastructuresat Government level. Private sectorestablishments are rather prompt and wellplanned in seed distribution. For this reason, mostof the hybrids grown in India are of private sector
origin.Development of hybrid cultivars in various
vegetable crops is receiving due and increasingattention by the All India Co-ordinatedVegetable Improvement Project.
Importance being given to heterosis breedingin vegetable crops in India by Indian Council ofAgricultural Research can be recognized fromthe fact that ICAR sanctioned a special ad-hoc research project on promotion of hybridresearch in vegetable crops for a period of 3years (1995-96 to 1997-98) with a total cost ofRs.330.38 lakhs. Vegetable crops included inthis programme were tomato, chilli, capsicum,okra, onion, cucumber, bitter gourd, cabbageand brinjal.
Future Thrusts * Emphasis needs to be given to introduce
germplasm resistant to iotic and abioticstresses, hybrids and varieties with highexport potential (Table 14).
* Development of highly stable resistantcultivars of okra to yellow vein mosaic viruswhich normally results in breakdown,besides resistance to other diseases, insectsand nematodes.
* Varieties suitable for processing purposes. * Varieties suitable for export purposes. * Okra seed contains good amount of oil (18-
20%) and crude protein (20- 23%) whichneeds commercial exploi tation.
* Being sensitive to day length, ability toflowerthroughout the year, especially intropics and sub-tropical regions, needsexploitation.
* Short duration cultivars with branchinghabits, early flowering, more nodes, lessinter-nodal distance need to be bred.
4
Second National Plant Breeding Congress 2006 Plant Breeding in Post Genomics Era
5
Table 1. List of State Agricultural Universities showing combined Department of Horticulture/independent Department of Vegetable Science.
1. G.B.Pant University of Agriculture and Technology 1960 Vegetable science2. Rajasthan Agricultural University, Bikaneer, Rajasthan 1962 Horticulture,3. Orissa University of Agriculture and Technology,
Bhubaneswar, Orissa 1962 Horticulture4. Punjab Agricultural University, Ludhiana, Punjab 1963 Vegetable science5. Jawaharalal Nehru Krishi Viswa Vidyalaya,
Jabalpur Madhya Pradesh 1964 Vegetable science6. Andhra Pradesh Agricultural University, Rajendra Nagar,
Hyderabad, Andhra Pradesh 1965 Horticulture7. University of Agricultural Sciences, Bangalore, Karnataka 1965 Horticulture8. Mahatma Phule Krishi Vidyapeeth, Rahuri, Maharashtra 1969 Horticulture9. Punjab Rao Deshmukh Krishi Vidyapeeth, Akola, Maharashtra. 1969 Horticulture10. Assam Agricultural University, Jorhat, Assam 1969 Horticulture11. Chaudhury Charan Singh Haryana Agricultural University,
Hissar, Haryana. 1970 Vegetable science12. Tamil Nadu Agriculture University,Coimbatore, Tamil Nadu 1971 Vegetable science13. Rajendra Agricultural University, Pusa, Samastipur, Bihar 1971 Vegetable science14. Marathawada Agricultural University, Parbhani, Maharashtra 1972 Horticulture15. Konkan Krishi Vidyapeeth, Dapoli, Ratnagiri, Maharashtra 1972 Horticulture16. Kerala Agricultural University, Vellanikkara, Kerala. 1972 Vegetable science17. Gujarat Agricultural University, Sardar, Krishinagar, Dantiwada,
Gujarat (with Colleges of Agriculture at Anand, Navsari,Junnagadh, Sardar Krishinagar Vegetable science 1972 Horticulture
18. Bidhan Chandra Krishi Viswa Vidyalaya,Kalyani, Nadia,West Bengal 1974 Horticulture
19. Chandra Shekhar Azad University of Agriculture andTechnology,Kanpur, Uttar Pradesh [Vegetable Improvement under EconomicBotanist (Veg.) at Kalyani] 1975 Horticulture
20. Narendra Deo University of Agriculture and Technology,Narendranagar, Kumarganj, Faizabad, Uttar Pradesh 1975 Vegetable science
21. Himachal Pradesh Krishi Viswa Vidyalaya, Palampur,Himachal Pradesh 1978 Vegetable science
22. Birsa Agricultural University, Ranchi, Bihar 1982 Horticulture23. Sher-E-Kashmir University of Agriculture and Technology,
Srinagar, Jammu & Kashmir 1982 Horticulture24. Y.S.Parmar University of Agriculture and Forestry, Solan,
Himachal Pradesh. 1984 Vegetable science25. University of Agricultural Sciences, Dharwar, Karnataka 1986 Horticulture26. Indira Gandhi Krishi Viswa Vidyalaya, Raipur, Madhya Pradesh. 1987 Horticulture
State Agricultural UniversitySl.No.
Year ofEstablish-
ment
Department
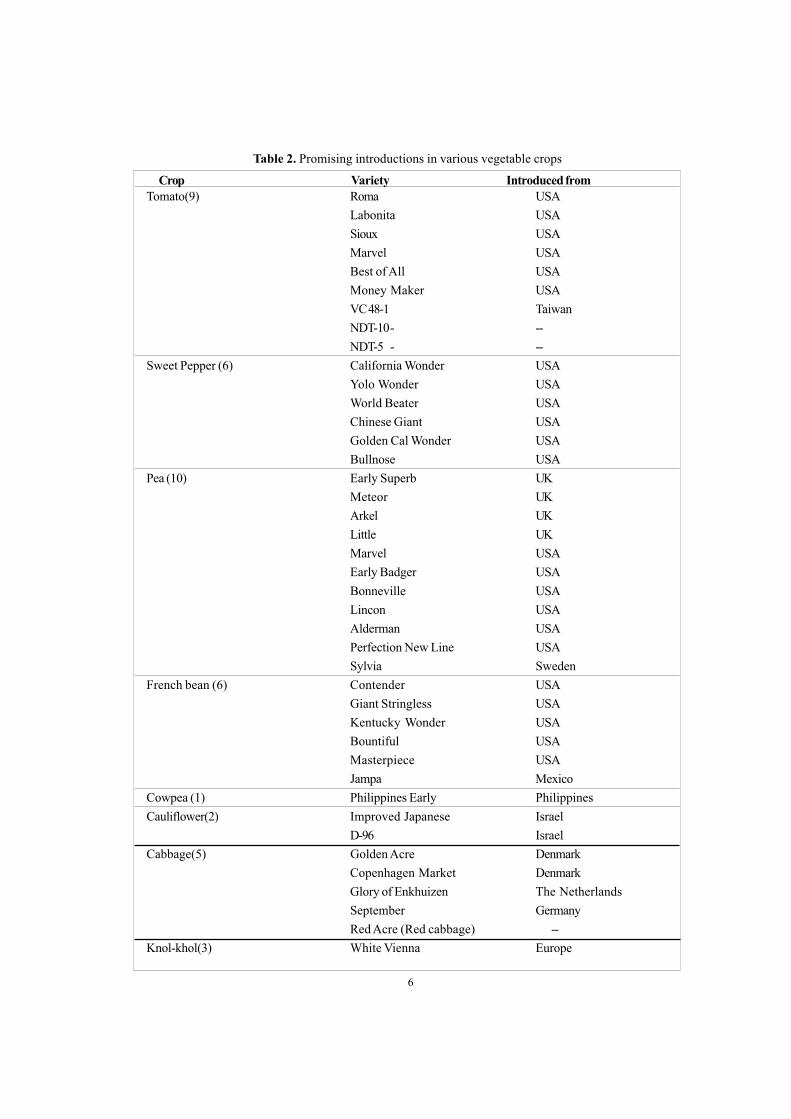
Table 2. Promising introductions in various vegetable crops
Tomato(9) Roma USALabonita USASioux USAMarvel USABest of All USAMoney Maker USAVC 48-1 TaiwanNDT-10- --NDT-5 - --
Sweet Pepper (6) California Wonder USAYolo Wonder USAWorld Beater USAChinese Giant USAGolden Cal Wonder USABullnose USA
Pea (10) Early Superb UKMeteor UKArkel UKLittle UKMarvel USAEarly Badger USABonneville USALincon USAAlderman USAPerfection New Line USASylvia Sweden
French bean (6) Contender USAGiant Stringless USAKentucky Wonder USABountiful USAMasterpiece USAJampa Mexico
Cowpea (1) Philippines Early PhilippinesCauliflower(2) Improved Japanese Israel
D-96 IsraelCabbage(5) Golden Acre Denmark
Copenhagen Market DenmarkGlory of Enkhuizen The NetherlandsSeptember GermanyRed Acre (Red cabbage) --
Knol-khol(3) White Vienna Europe
Crop Variety Introduced from
6
7
Purple Vienna EuropeKing of North Europe
Brussels sprouts(5) Hilds Ideal EuropeAmager Market EuropeCatskill EuropeDanish Giant DenmarkDanish Prize Denmark
Radish(3) White Icicle EuropeScarlet Globe EuropeJapanese White Japan
Carrot (3) Nantes EuropeChantney EuropeDanvers Europe
Garden beet (4) Detroit Dark Red USACrimson Globe USACrosby Egyptian --Early Wonder --
Turnip (4) Purple Top White Globe EuropeGolden Ball EuropeSnowball EuropeEarly Millan Red Top Europe
Onion(3) Early Grano USABarmuda Yellow PhilippinesBrown Spanish Philippines
Watermelon(6) Asahi Yamato USASugar Baby USANew Hampshire Midget USAImproved Shipper USADixielee USAFuken --
Cucumber(4) Japanese Long Green JapanStraight Eight USAPoinsettee USAChina --
Summer squash(2) Australian Green AustraliaPatty Pan USA
Bitter gourd (1) MD-4 --
Second National Plant Breeding Congress 2006 Plant Breeding in Post Genomics Era
8
Table 3. Vegetable varieties developed by pure line selection
Tomato (15) Improved Meeruti IndigenousHS-110 ExoticSonali ExoticPant Bahar ExoticArka Vikas Exotic (USA)Arka Saurabh Exotic(Canada)Punjab Tropic Exotic (USA)Pusa-120 Exotic (USA)S-12 Exotic (USA)Arka Abha Exotic (Taiwan)Arka Alok Exotic (Taiwan)Arka Ahuti Exotic (Canada)Pant-T-3 IndigenousCO-1 IndigenousCO-2 Indigenous
Brinjal (12) Pusa Purple Long IndigenousPusa Purple Cluster IndigenousPusa Purple Round IndigenousPant Samrat IndigenousArka Shirish IndigenousArka Kusumakar IndigenousArka Sheel IndigenousPunjab Chamkila IndigenousT-3 IndigenousKrishnanagar Green Long IndigenousPunjab Neelam IndigenousPunjab Bahar Indigenous
Chilli (15) G-2 IndigenousG-3 IndigenousK-1 IndigenousCO-1 IndigenousCO-2 IndigenousGCA-154 IndigenousKaliayanpur Yellow IndigenousKaliyanpur Red IndigenousKaliyanpur Chaman IndigenousSabour Angar IndigenousSabour Arun IndigenousArka Lohit IndigenousCA-960 Exotic (Portugal)Bhagyalakshmi Exotic (Sri Lanka)Sindhur Exotic (C.A. 960)
Crop Variety Genetic stock
Second National Plant Breeding Congress 2006 Plant Breeding in Post Genomics Era
9
Pea (2) Asauji IndigenousHarbhajan Exotic
French bean(4) Pant Anupama IndigenousVL Boni-1 IndigenousArka Komal Exotic(Australia)Arka Bold Exotic(Hungary)
Cowpea (3) Cowpea 263 IndigenousPusa Barsati Exotic (Philippines)Pusa Phalguni Exotic (Canada)
Cucumber(1) Sheetal Indigenous
Muskmelon(5) RM-43 IndigenousDurgapura Madhu IndigenousArka Rajhans IndigenousArka Jeet IndigenousPusa Madhuras Indigenous
Watermelon (2) Durgapura Meetha IndigenousDurgapura Kesar Indigenous
Pumpkin (4) CO-1 IndigenousCO-2 ExoticCM-14 IndigenousArka Chandan` Indigenous
Summer Squash(2) Punjab Chappan Kaddu-1 IndigenousEarly Yellow Prolific Indigenous
Winter Squash(1) Arka Suryamukhi Indigenous
Bitter gourd (11) Coimbatore Long IndigenousPusa Do Mousami IndigenousArka Harit IndigenousVK-1a-Priya IndigenousCO-1 IndigenousMC-23 IndigenousPusa Vishesh IndigenousPunjab BG-14 IndigenousNDB-1 IndigenousPhule BG-6 IndigenousKaliyanpur Sona Indigenous
Ridge gourd (3) Pusa Nasdar IndigenousCO-1 IndigenousCO-2 Indigenous
Bottle gourd (7) Pusa Summer Prolific Long IndigenousPunjab Long IndigenousArka Bahar IndigenousPusa Naveen Indigenous
Crop Variety Genetic stock
Second National Plant Breeding Congress 2006 Plant Breeding in Post Genomics Era
Pusa Summer Prolific Round IndigenousPunjab Round IndigenousCO-1 Indigenous
Wax gourd (2) CO-1 IndigenousKAU Local Indigenous
Snake gourd(3) CO-1 IndigenousCO-2 IndigenousTA-19 Indigenous
Indian Squash (Tinda) (1) Tinda S-48 Indigenous
Sponge gourd (1) Pusa Chikni Indigenous
Long melon(2) Arka Sheetal IndigenousKarnal Selection Indigenous
Amaranth(10) Badi Chaulai IndigenousKannara Local IndigenousPusa Kiran IndigenousChhoti Chaulai IndigenousPusa Kriti IndigenousCO-1 IndigenousCO-2 IndigenousCO-3 IndigenousArka Suguna Exotic (Taiwan)Arka Arunima Indigenous
Dolichos/Hyacinth bean(11) Pusa Early Prolific Indigenous
JDL-79 IndigenousJDL-53 IndigenousK-6802 IndigenousJDL-37 IndigenousHD-18 IndigenousHD-60 IndigenousDeepaliwal IndigenousRajni IndigenousCO-1 IndigenousCO-8 Indigenous
Cluster bean(3) Pusa Sadabahar IndigenousPusa Mausami IndigenousPLG-850 Indigenous
Okra (5) CO-1 IndigenousPerkins Long Green IndigenousPunjab No.13 IndigenousPusa Makhmali IndigenousGujarat Bhendi-1 Indigenous
Crop Variety Genetic stock
10
Second National Plant Breeding Congress 2006 Plant Breeding in Post Genomics Era
11
Table 4. Vegetable varieties developed by mass selection
Crop Variety Genetic stockTomato(1) Arka Ashish Exotic
Capsicum (3) Arka Mohini ExoticArka Gourav ExoticArka Basant Exotic
Cauliflower(1) Pusa Katki Indigenous
Onion(16) Punjab Selection IndigenousPusa Red IndigenousArka Niketan IndigenousArka Kalyan IndigenousAgrifound Dark Red IndigenousCO-2 IndigenousNasik Red IndigenousArka Pragati IndigenousPatna Red IndigenousPusa White Round IndigenousN-53 IndigenousKaliyanpur Red Round IndigenousAgrifound Light Red IndigenousHisar-2 IndigenousArka Bindu IndigenousPusa Madhavi Indigenous
Radish (5) Pusa Desi IndigenousPunjab Safed IndigenousPunjab Ageti IndigenousKaliyanpur-1 IndigenousArka Nishant Exotic
Palak (1) HS-23 Indigenous
Second National Plant Breeding Congress 2006 Plant Breeding in Post Genomics Era
Cauliflower (3) Pusa Deepali IndigenousDania Kalimpong ExoticPusa Snowball-2 Exotic
Muskmelon (1) Hara Madhu IndigenousPalak(1) All Green Indigenous
Cauliflower (6) Hisar -1 ExoticPusa Himiyoti ExoticSnowball-16 ExoticPusa Snowball K-1 ExoticPunjab Giant-26 ExoticPunjab Gant-35 Exotic
Cabbage (1) Pride of India Exotic (Denmark)Onion (2) Pusa Ratnar Exotic (USA)
Hisar-2 IndigenousRadish (2) Pusa Chetki Indigenous
CO-1 IndigenousTurnip (1) Pusa Sweti Exotic
Table 5. Vegetable varieties developed by Line/Family breeding
Crop Variety Genetic stock
Table 6. Vegetable varieties developed by Inbreeding/Inbred selection
Table 7. Vegetable varieties developed by recurrent selection.
Cauliflower (2) Pant Gobhi-4 IndigenousPant Shubhra Indigenous
Crop Variety Genetic stock
Crop Variety Genetic stock
Tomato(17) Pusa Early Dwarf Improved Meeruti x Red CloudPusa Ruby Sioux x Improved MeerutiHS-101 Sel.2-3 x Exotic cultivarHS-102 Sel.12 x Pusa Early DwarfHisar Arun (Sel.7) Pusa Early Dwarf x K-2
Table 8. Hybridization and selection from advanced generations /Pedigree selection
Crop Variety Parents involved
12
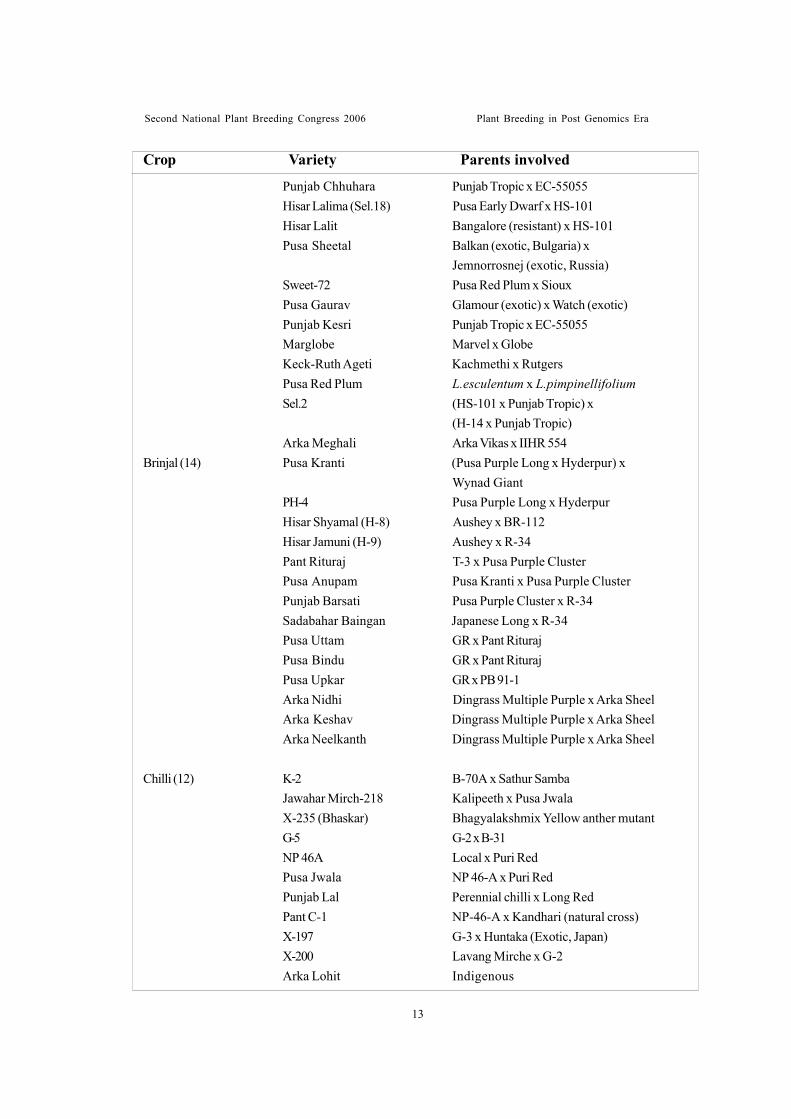
Second National Plant Breeding Congress 2006 Plant Breeding in Post Genomics Era
13
Punjab Chhuhara Punjab Tropic x EC-55055Hisar Lalima (Sel.18) Pusa Early Dwarf x HS-101Hisar Lalit Bangalore (resistant) x HS-101Pusa Sheetal Balkan (exotic, Bulgaria) x
Jemnorrosnej (exotic, Russia)Sweet-72 Pusa Red Plum x SiouxPusa Gaurav Glamour (exotic) x Watch (exotic)Punjab Kesri Punjab Tropic x EC-55055Marglobe Marvel x GlobeKeck-Ruth Ageti Kachmethi x RutgersPusa Red Plum L.esculentum x L.pimpinellifoliumSel.2 (HS-101 x Punjab Tropic) x
(H-14 x Punjab Tropic)Arka Meghali Arka Vikas x IIHR 554
Brinjal (14) Pusa Kranti (Pusa Purple Long x Hyderpur) xWynad Giant
PH-4 Pusa Purple Long x HyderpurHisar Shyamal (H-8) Aushey x BR-112Hisar Jamuni (H-9) Aushey x R-34Pant Rituraj T-3 x Pusa Purple ClusterPusa Anupam Pusa Kranti x Pusa Purple ClusterPunjab Barsati Pusa Purple Cluster x R-34Sadabahar Baingan Japanese Long x R-34Pusa Uttam GR x Pant RiturajPusa Bindu GR x Pant RiturajPusa Upkar GR x PB 91-1Arka Nidhi Dingrass Multiple Purple x Arka SheelArka Keshav Dingrass Multiple Purple x Arka SheelArka Neelkanth Dingrass Multiple Purple x Arka Sheel
Chilli (12) K-2 B-70A x Sathur SambaJawahar Mirch-218 Kalipeeth x Pusa JwalaX-235 (Bhaskar) Bhagyalakshmix Yellow anther mutantG-5 G-2 x B-31NP 46A Local x Puri RedPusa Jwala NP 46-A x Puri RedPunjab Lal Perennial chilli x Long RedPant C-1 NP-46-A x Kandhari (natural cross)X-197 G-3 x Huntaka (Exotic, Japan)X-200 Lavang Mirche x G-2Arka Lohit Indigenous
Crop Variety Parents involved
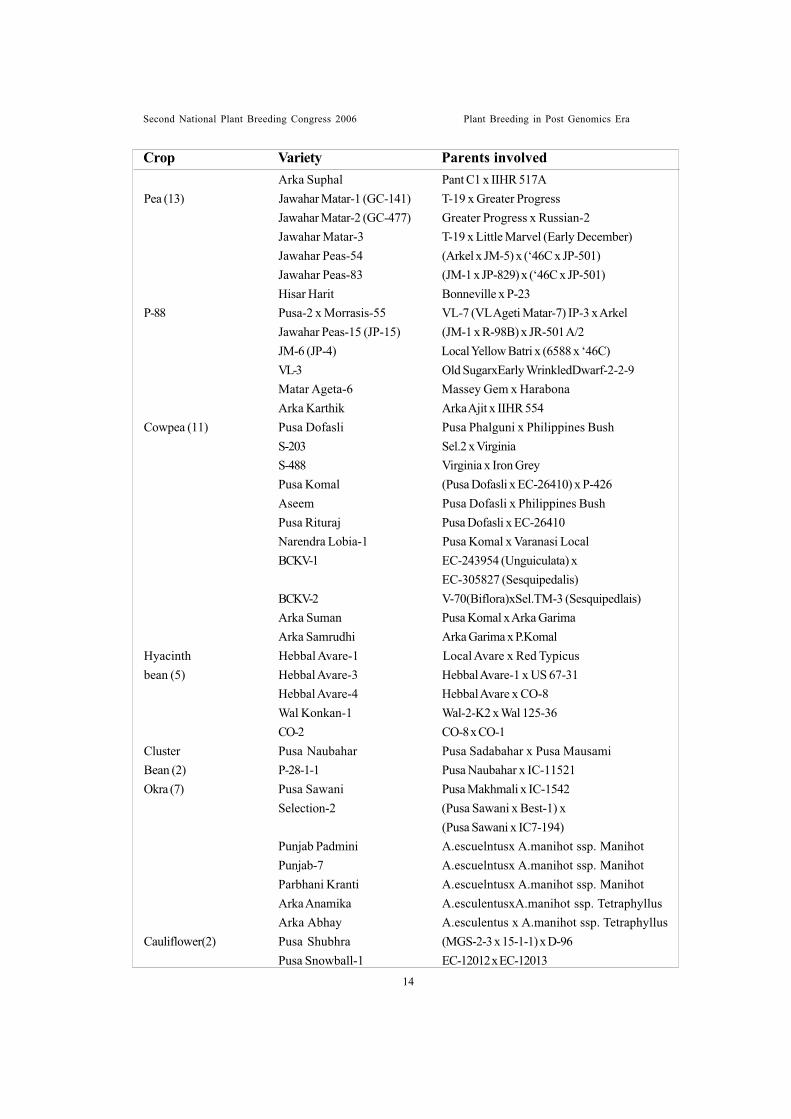
Second National Plant Breeding Congress 2006 Plant Breeding in Post Genomics Era
Arka Suphal Pant C1 x IIHR 517APea (13) Jawahar Matar-1 (GC-141) T-19 x Greater Progress
Jawahar Matar-2 (GC-477) Greater Progress x Russian-2Jawahar Matar-3 T-19 x Little Marvel (Early December)Jawahar Peas-54 (Arkel x JM-5) x (‘46C x JP-501)Jawahar Peas-83 (JM-1 x JP-829) x (‘46C x JP-501)Hisar Harit Bonneville x P-23
P-88 Pusa-2 x Morrasis-55 VL-7 (VL Ageti Matar-7) IP-3 x ArkelJawahar Peas-15 (JP-15) (JM-1 x R-98B) x JR-501 A/2JM-6 (JP-4) Local Yellow Batri x (6588 x ‘46C)VL-3 Old SugarxEarly WrinkledDwarf-2-2-9Matar Ageta-6 Massey Gem x HarabonaArka Karthik Arka Ajit x IIHR 554
Cowpea (11) Pusa Dofasli Pusa Phalguni x Philippines BushS-203 Sel.2 x VirginiaS-488 Virginia x Iron GreyPusa Komal (Pusa Dofasli x EC-26410) x P-426Aseem Pusa Dofasli x Philippines BushPusa Rituraj Pusa Dofasli x EC-26410Narendra Lobia-1 Pusa Komal x Varanasi LocalBCKV-1 EC-243954 (Unguiculata) x
EC-305827 (Sesquipedalis)BCKV-2 V-70(Biflora)xSel.TM-3 (Sesquipedlais)Arka Suman Pusa Komal x Arka GarimaArka Samrudhi Arka Garima x P.Komal
Hyacinth Hebbal Avare-1 Local Avare x Red Typicusbean (5) Hebbal Avare-3 Hebbal Avare-1 x US 67-31
Hebbal Avare-4 Hebbal Avare x CO-8Wal Konkan-1 Wal-2-K2 x Wal 125-36CO-2 CO-8 x CO-1
Cluster Pusa Naubahar Pusa Sadabahar x Pusa MausamiBean (2) P-28-1-1 Pusa Naubahar x IC-11521Okra (7) Pusa Sawani Pusa Makhmali x IC-1542
Selection-2 (Pusa Sawani x Best-1) x(Pusa Sawani x IC7-194)
Punjab Padmini A.escuelntusx A.manihot ssp. ManihotPunjab-7 A.escuelntusx A.manihot ssp. ManihotParbhani Kranti A.escuelntusx A.manihot ssp. ManihotArka Anamika A.esculentusxA.manihot ssp. TetraphyllusArka Abhay A.esculentus x A.manihot ssp. Tetraphyllus
Cauliflower(2) Pusa Shubhra (MGS-2-3 x 15-1-1) x D-96Pusa Snowball-1 EC-12012 x EC-12013
Crop Variety Parents involved
14
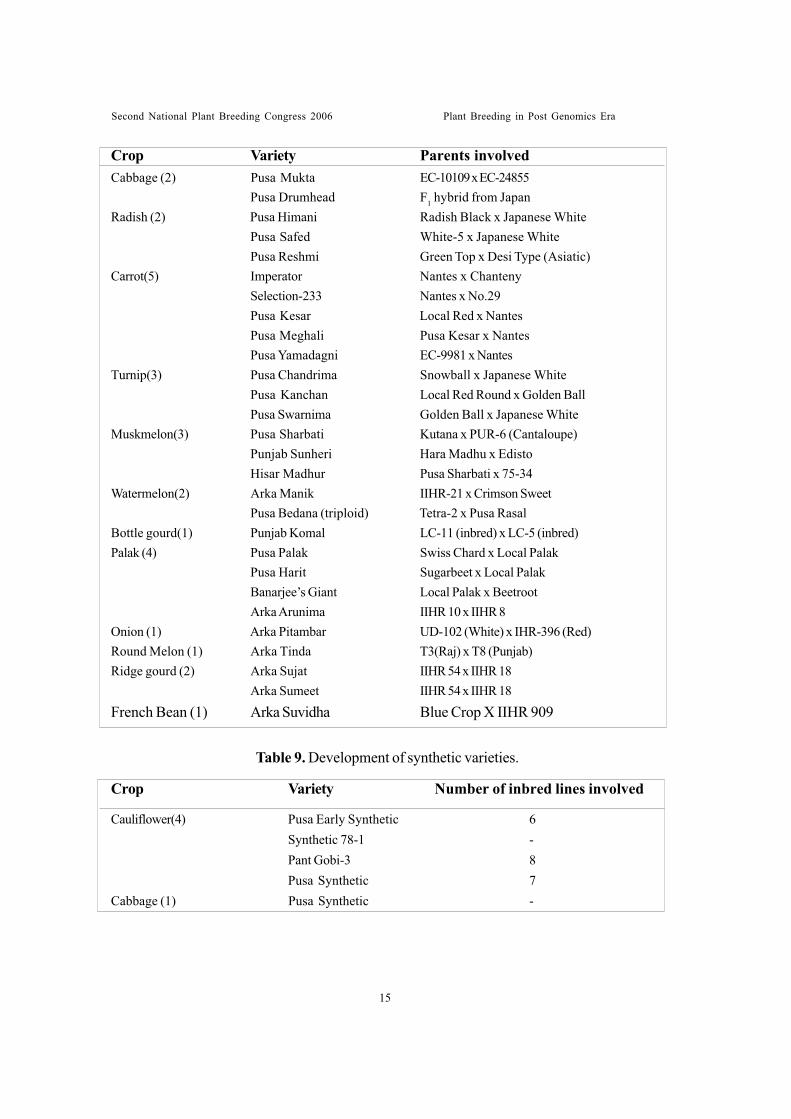
Second National Plant Breeding Congress 2006 Plant Breeding in Post Genomics Era
15
Cabbage (2) Pusa Mukta EC-10109 x EC-24855Pusa Drumhead F1 hybrid from Japan
Radish (2) Pusa Himani Radish Black x Japanese WhitePusa Safed White-5 x Japanese WhitePusa Reshmi Green Top x Desi Type (Asiatic)
Carrot(5) Imperator Nantes x ChantenySelection-233 Nantes x No.29Pusa Kesar Local Red x NantesPusa Meghali Pusa Kesar x NantesPusa Yamadagni EC-9981 x Nantes
Turnip(3) Pusa Chandrima Snowball x Japanese WhitePusa Kanchan Local Red Round x Golden BallPusa Swarnima Golden Ball x Japanese White
Muskmelon(3) Pusa Sharbati Kutana x PUR-6 (Cantaloupe)Punjab Sunheri Hara Madhu x EdistoHisar Madhur Pusa Sharbati x 75-34
Watermelon(2) Arka Manik IIHR-21 x Crimson SweetPusa Bedana (triploid) Tetra-2 x Pusa Rasal
Bottle gourd(1) Punjab Komal LC-11 (inbred) x LC-5 (inbred)Palak (4) Pusa Palak Swiss Chard x Local Palak
Pusa Harit Sugarbeet x Local PalakBanarjee’s Giant Local Palak x BeetrootArka Arunima IIHR 10 x IIHR 8
Onion (1) Arka Pitambar UD-102 (White) x IHR-396 (Red)Round Melon (1) Arka Tinda T3(Raj) x T8 (Punjab)Ridge gourd (2) Arka Sujat IIHR 54 x IIHR 18
Arka Sumeet IIHR 54 x IIHR 18
French Bean (1) Arka Suvidha Blue Crop X IIHR 909
Crop Variety Parents involved
Table 9. Development of synthetic varieties.
Crop Variety Number of inbred lines involved
Cauliflower(4) Pusa Early Synthetic 6Synthetic 78-1 -Pant Gobi-3 8Pusa Synthetic 7
Cabbage (1) Pusa Synthetic -
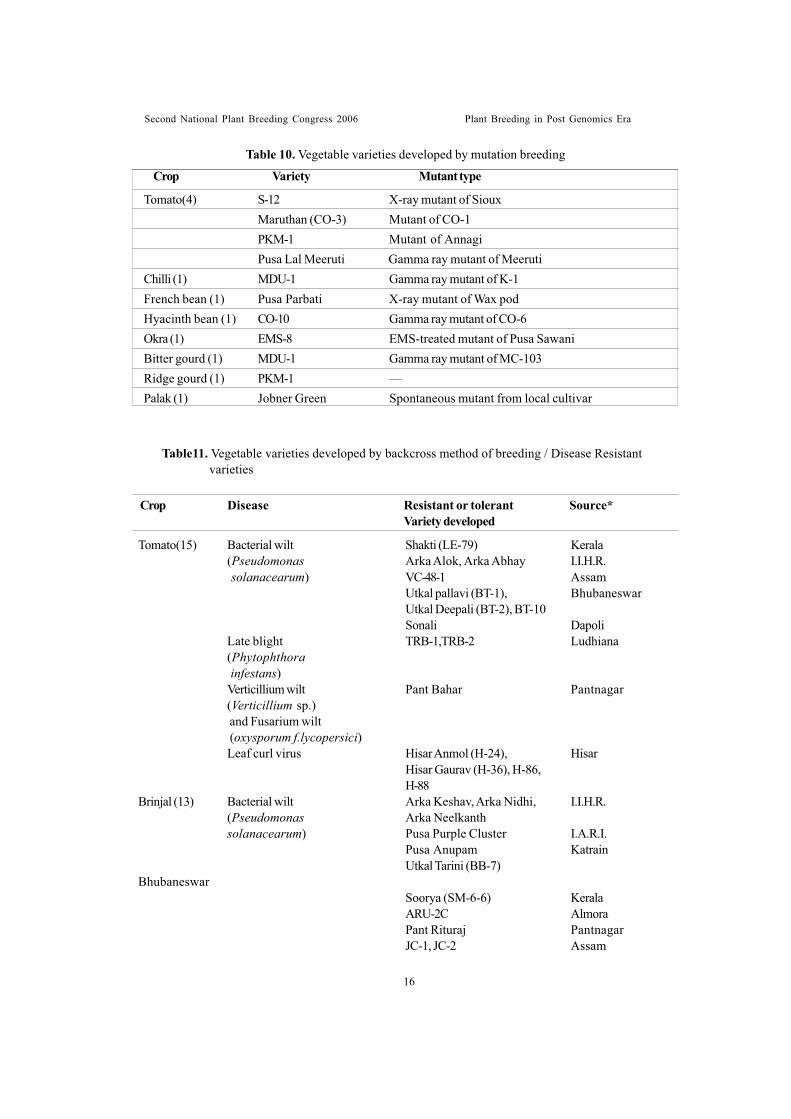
Second National Plant Breeding Congress 2006 Plant Breeding in Post Genomics Era
Table 10. Vegetable varieties developed by mutation breeding
Tomato(15) Bacterial wilt Shakti (LE-79) Kerala(Pseudomonas Arka Alok, Arka Abhay I.I.H.R.solanacearum) VC-48-1 Assam
Utkal pallavi (BT-1), BhubaneswarUtkal Deepali (BT-2), BT-10Sonali Dapoli
Late blight TRB-1,TRB-2 Ludhiana(Phytophthora infestans)Verticillium wilt Pant Bahar Pantnagar(Verticillium sp.) and Fusarium wilt (oxysporum f.lycopersici)Leaf curl virus Hisar Anmol (H-24), Hisar
Hisar Gaurav (H-36), H-86,H-88
Brinjal (13) Bacterial wilt Arka Keshav, Arka Nidhi, I.I.H.R.(Pseudomonas Arka Neelkanthsolanacearum) Pusa Purple Cluster I.A.R.I.
Pusa Anupam KatrainUtkal Tarini (BB-7)
BhubaneswarSoorya (SM-6-6) KeralaARU-2C AlmoraPant Rituraj PantnagarJC-1, JC-2 Assam
Table11. Vegetable varieties developed by backcross method of breeding / Disease Resistantvarieties
Crop Disease Resistant or tolerant Source*Variety developed
Tomato(4) S-12 X-ray mutant of SiouxMaruthan (CO-3) Mutant of CO-1PKM-1 Mutant of AnnagiPusa Lal Meeruti Gamma ray mutant of Meeruti
Chilli (1) MDU-1 Gamma ray mutant of K-1French bean (1) Pusa Parbati X-ray mutant of Wax podHyacinth bean (1) CO-10 Gamma ray mutant of CO-6Okra (1) EMS-8 EMS-treated mutant of Pusa SawaniBitter gourd (1) MDU-1 Gamma ray mutant of MC-103Ridge gourd (1) PKM-1 —Palak (1) Jobner Green Spontaneous mutant from local cultivar
VarietyCrop Mutant type
16
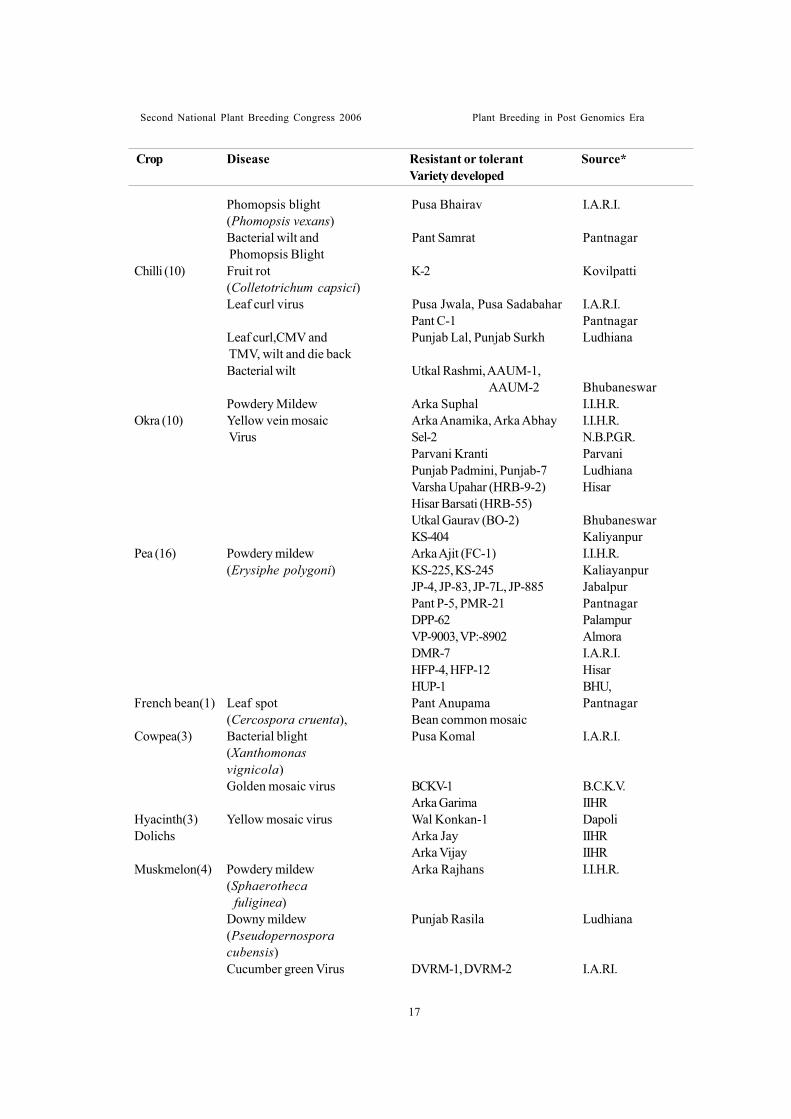
Second National Plant Breeding Congress 2006 Plant Breeding in Post Genomics Era
17
Crop Disease Resistant or tolerant Source*Variety developed
Phomopsis blight Pusa Bhairav I.A.R.I.(Phomopsis vexans)Bacterial wilt and Pant Samrat Pantnagar Phomopsis Blight
Chilli (10) Fruit rot K-2 Kovilpatti(Colletotrichum capsici)Leaf curl virus Pusa Jwala, Pusa Sadabahar I.A.R.I.
Pant C-1 PantnagarLeaf curl,CMV and Punjab Lal, Punjab Surkh Ludhiana TMV, wilt and die backBacterial wilt Utkal Rashmi, AAUM-1,
AAUM-2 BhubaneswarPowdery Mildew Arka Suphal I.I.H.R.
Okra (10) Yellow vein mosaic Arka Anamika, Arka Abhay I.I.H.R. Virus Sel-2 N.B.P.G.R.
Parvani Kranti ParvaniPunjab Padmini, Punjab-7 LudhianaVarsha Upahar (HRB-9-2) HisarHisar Barsati (HRB-55)Utkal Gaurav (BO-2) BhubaneswarKS-404 Kaliyanpur
Pea (16) Powdery mildew Arka Ajit (FC-1) I.I.H.R.(Erysiphe polygoni) KS-225, KS-245 Kaliayanpur
JP-4, JP-83, JP-7L, JP-885 JabalpurPant P-5, PMR-21 PantnagarDPP-62 PalampurVP-9003, VP:-8902 AlmoraDMR-7 I.A.R.I.HFP-4, HFP-12 HisarHUP-1 BHU,
French bean(1) Leaf spot Pant Anupama Pantnagar(Cercospora cruenta), Bean common mosaic
Cowpea(3) Bacterial blight Pusa Komal I.A.R.I.(Xanthomonasvignicola)Golden mosaic virus BCKV-1 B.C.K.V.
Arka Garima IIHRHyacinth(3) Yellow mosaic virus Wal Konkan-1 DapoliDolichs Arka Jay IIHR
Arka Vijay IIHRMuskmelon(4) Powdery mildew Arka Rajhans I.I.H.R.
(Sphaerotheca fuliginea)Downy mildew Punjab Rasila Ludhiana(Pseudopernosporacubensis)Cucumber green Virus DVRM-1, DVRM-2 I.A.RI.
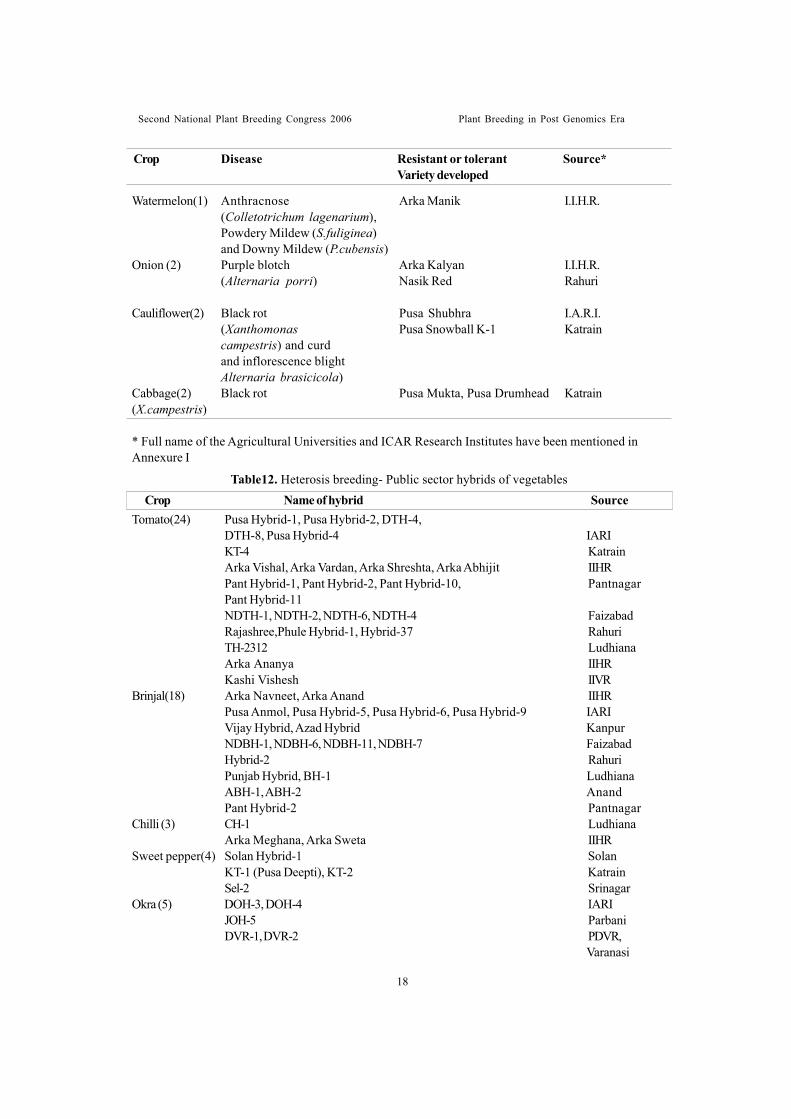
Second National Plant Breeding Congress 2006 Plant Breeding in Post Genomics Era
Crop Disease Resistant or tolerant Source*Variety developed
Watermelon(1) Anthracnose Arka Manik I.I.H.R.(Colletotrichum lagenarium),Powdery Mildew (S.fuliginea)and Downy Mildew (P.cubensis)
Onion (2) Purple blotch Arka Kalyan I.I.H.R.(Alternaria porri) Nasik Red Rahuri
Cauliflower(2) Black rot Pusa Shubhra I.A.R.I.(Xanthomonas Pusa Snowball K-1 Katraincampestris) and curdand inflorescence blightAlternaria brasicicola)
Cabbage(2) Black rot Pusa Mukta, Pusa Drumhead Katrain(X.campestris)
* Full name of the Agricultural Universities and ICAR Research Institutes have been mentioned inAnnexure I
Tomato(24) Pusa Hybrid-1, Pusa Hybrid-2, DTH-4,DTH-8, Pusa Hybrid-4 IARIKT-4 KatrainArka Vishal, Arka Vardan, Arka Shreshta, Arka Abhijit IIHRPant Hybrid-1, Pant Hybrid-2, Pant Hybrid-10, PantnagarPant Hybrid-11NDTH-1, NDTH-2, NDTH-6, NDTH-4 FaizabadRajashree,Phule Hybrid-1, Hybrid-37 RahuriTH-2312 LudhianaArka Ananya IIHRKashi Vishesh IIVR
Brinjal(18) Arka Navneet, Arka Anand IIHRPusa Anmol, Pusa Hybrid-5, Pusa Hybrid-6, Pusa Hybrid-9 IARIVijay Hybrid, Azad Hybrid KanpurNDBH-1, NDBH-6, NDBH-11, NDBH-7 FaizabadHybrid-2 RahuriPunjab Hybrid, BH-1 LudhianaABH-1, ABH-2 AnandPant Hybrid-2 Pantnagar
Chilli (3) CH-1 LudhianaArka Meghana, Arka Sweta IIHR
Sweet pepper(4) Solan Hybrid-1 SolanKT-1 (Pusa Deepti), KT-2 KatrainSel-2 Srinagar
Okra (5) DOH-3, DOH-4 IARIJOH-5 ParbaniDVR-1, DVR-2 PDVR,
Varanasi
Table12. Heterosis breeding- Public sector hybrids of vegetablesSourceName of hybridCrop
18
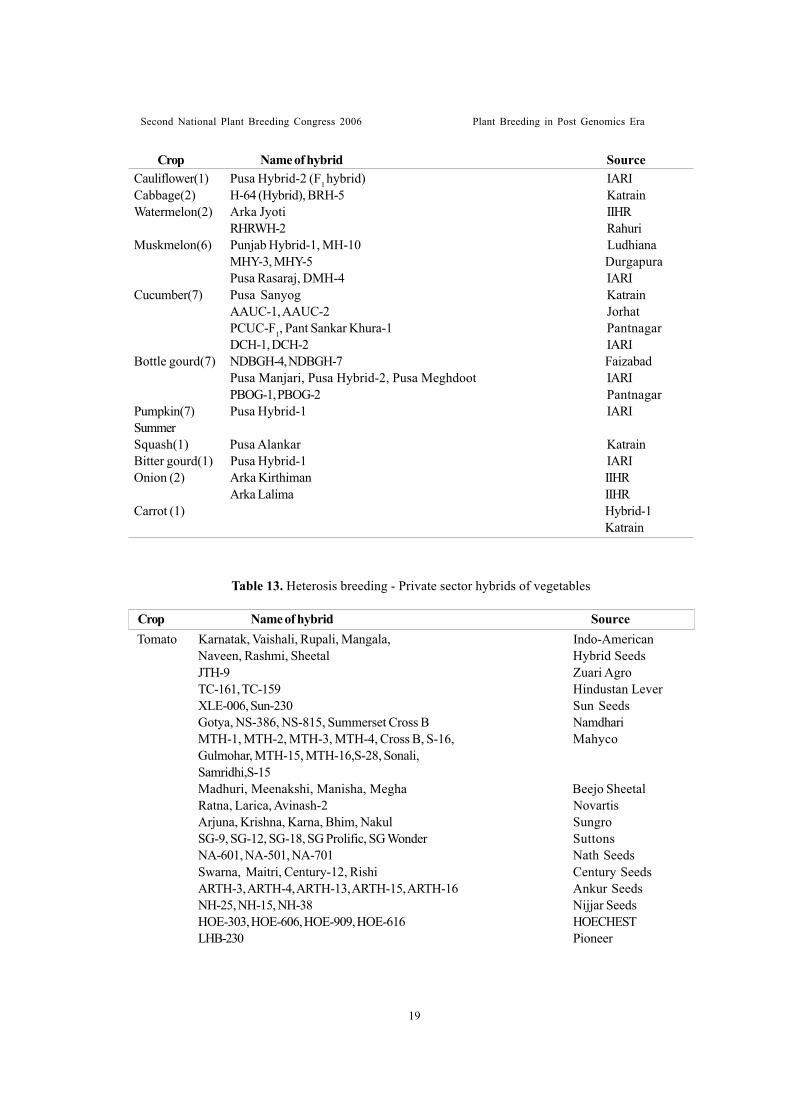
Second National Plant Breeding Congress 2006 Plant Breeding in Post Genomics Era
Cauliflower(1) Pusa Hybrid-2 (F1 hybrid) IARICabbage(2) H-64 (Hybrid), BRH-5 KatrainWatermelon(2) Arka Jyoti IIHR
RHRWH-2 RahuriMuskmelon(6) Punjab Hybrid-1, MH-10 Ludhiana
MHY-3, MHY-5 DurgapuraPusa Rasaraj, DMH-4 IARI
Cucumber(7) Pusa Sanyog KatrainAAUC-1, AAUC-2 JorhatPCUC-F1, Pant Sankar Khura-1 PantnagarDCH-1, DCH-2 IARI
Bottle gourd(7) NDBGH-4, NDBGH-7 FaizabadPusa Manjari, Pusa Hybrid-2, Pusa Meghdoot IARIPBOG-1, PBOG-2 Pantnagar
Pumpkin(7) Pusa Hybrid-1 IARISummerSquash(1) Pusa Alankar KatrainBitter gourd(1) Pusa Hybrid-1 IARIOnion (2) Arka Kirthiman IIHR
Arka Lalima IIHRCarrot (1) Hybrid-1
Katrain
Tomato Karnatak, Vaishali, Rupali, Mangala, Indo-AmericanNaveen, Rashmi, Sheetal Hybrid SeedsJTH-9 Zuari AgroTC-161, TC-159 Hindustan LeverXLE-006, Sun-230 Sun SeedsGotya, NS-386, NS-815, Summerset Cross B NamdhariMTH-1, MTH-2, MTH-3, MTH-4, Cross B, S-16, MahycoGulmohar, MTH-15, MTH-16,S-28, Sonali,Samridhi,S-15Madhuri, Meenakshi, Manisha, Megha Beejo SheetalRatna, Larica, Avinash-2 NovartisArjuna, Krishna, Karna, Bhim, Nakul SungroSG-9, SG-12, SG-18, SG Prolific, SG Wonder SuttonsNA-601, NA-501, NA-701 Nath SeedsSwarna, Maitri, Century-12, Rishi Century SeedsARTH-3, ARTH-4, ARTH-13, ARTH-15, ARTH-16 Ankur SeedsNH-25, NH-15, NH-38 Nijjar SeedsHOE-303, HOE-606, HOE-909, HOE-616 HOECHESTLHB-230 Pioneer
Table 13. Heterosis breeding - Private sector hybrids of vegetables
SourceName of hybridCrop
SourceName of hybridCrop
19
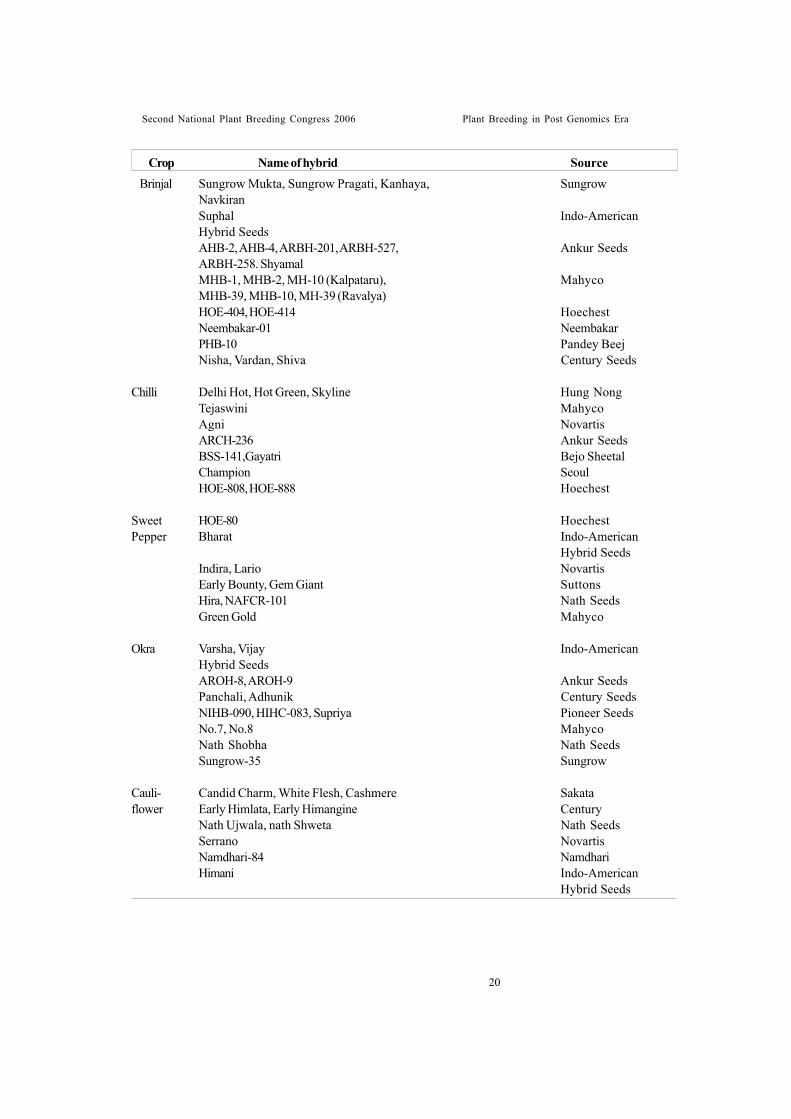
Second National Plant Breeding Congress 2006 Plant Breeding in Post Genomics Era
Brinjal Sungrow Mukta, Sungrow Pragati, Kanhaya, SungrowNavkiranSuphal Indo-AmericanHybrid SeedsAHB-2, AHB-4, ARBH-201, ARBH-527, Ankur SeedsARBH-258. ShyamalMHB-1, MHB-2, MH-10 (Kalpataru), MahycoMHB-39, MHB-10, MH-39 (Ravalya)HOE-404, HOE-414 HoechestNeembakar-01 NeembakarPHB-10 Pandey BeejNisha, Vardan, Shiva Century Seeds
Chilli Delhi Hot, Hot Green, Skyline Hung NongTejaswini MahycoAgni NovartisARCH-236 Ankur SeedsBSS-141,Gayatri Bejo SheetalChampion SeoulHOE-808, HOE-888 Hoechest
Sweet HOE-80 HoechestPepper Bharat Indo-American
Hybrid SeedsIndira, Lario NovartisEarly Bounty, Gem Giant SuttonsHira, NAFCR-101 Nath SeedsGreen Gold Mahyco
Okra Varsha, Vijay Indo-AmericanHybrid SeedsAROH-8, AROH-9 Ankur SeedsPanchali, Adhunik Century SeedsNIHB-090, HIHC-083, Supriya Pioneer SeedsNo.7, No.8 MahycoNath Shobha Nath SeedsSungrow-35 Sungrow
Cauli- Candid Charm, White Flesh, Cashmere Sakataflower Early Himlata, Early Himangine Century
Nath Ujwala, nath Shweta Nath SeedsSerrano NovartisNamdhari-84 NamdhariHimani Indo-American
Hybrid Seeds
SourceName of hybridCrop
20

Second National Plant Breeding Congress 2006 Plant Breeding in Post Genomics Era
21
Cabbage Nath-401, Nath-501 Nath SeedsQuesto NovartisSri Ganesh Gol, Hari Rani, Cabbage No.8 MahycoVishesh, Uttam, Uttara Hidnsutan LeverGreen Express SuttonsBajrang, Suvarna, Sudha, BSS-44, BSS-32 Beejo SheetalGloria, Runa, Rotan DaehanfeldtRare Ball KanekoGreen Boy, Green Express, Stone Head, SakataHerculis RegaliaKK Cross, OS Cross, Resistalke, Green Cornet, TakliGreen Challenger Hung Nong
Water-melon Madhur, Milan, Mohini Indo-American
Hybrid SeedsMHW-4, MHW-5, MHW-6, MHW-11 MahycoCharlie Sheetal HybridSeedsNath-101, Nath-102, Nath-202 Nath SeedsNS-246, NS-295 NamdhariSuruchi ProAgroCentury No.2 Century
Musk-melon MHC-5, MHC-6, MHC-2 Mahyco
Shweta Sheetal HybridSeedsSwarna, Sona Indo-American
Hybrid SeedsAbhijit, NS-7455 Namdhari SeedsMadhubala Century
Cucumber Priya Indo-American Hybrid SeedsMalini Seminis (Syngenta)Rajdhani Golden SeedsNS-404 NamdhariUS-6125 Senp WorldTripti NunhemsAman ProAgro
Bottlegourd Gutka,Harit Century
Varad Mahyco
SourceName of hybridCrop
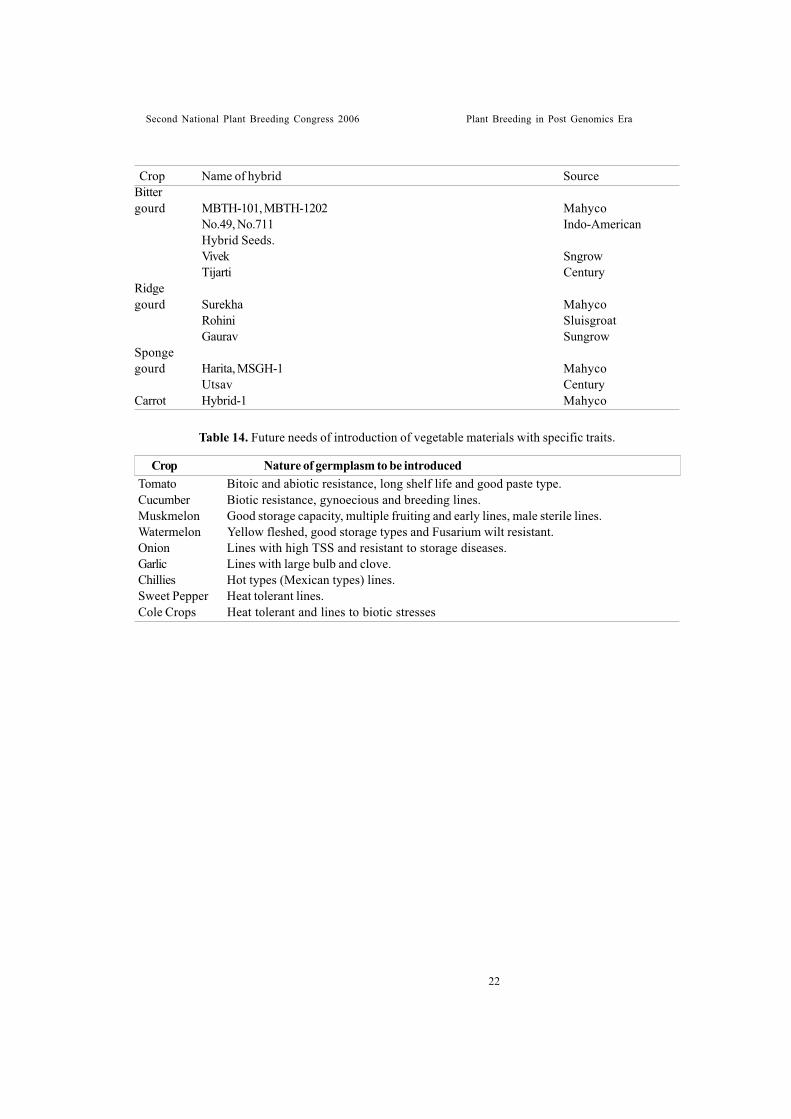
Second National Plant Breeding Congress 2006 Plant Breeding in Post Genomics Era
Crop Name of hybrid SourceBittergourd MBTH-101, MBTH-1202 Mahyco
No.49, No.711 Indo-AmericanHybrid Seeds.Vivek SngrowTijarti Century
Ridgegourd Surekha Mahyco
Rohini SluisgroatGaurav Sungrow
Spongegourd Harita, MSGH-1 Mahyco
Utsav CenturyCarrot Hybrid-1 Mahyco
Tomato Bitoic and abiotic resistance, long shelf life and good paste type.Cucumber Biotic resistance, gynoecious and breeding lines.Muskmelon Good storage capacity, multiple fruiting and early lines, male sterile lines.Watermelon Yellow fleshed, good storage types and Fusarium wilt resistant.Onion Lines with high TSS and resistant to storage diseases.Garlic Lines with large bulb and clove.Chillies Hot types (Mexican types) lines.Sweet Pepper Heat tolerant lines.Cole Crops Heat tolerant and lines to biotic stresses
Table 14. Future needs of introduction of vegetable materials with specific traits.
Nature of germplasm to be introducedCrop
22
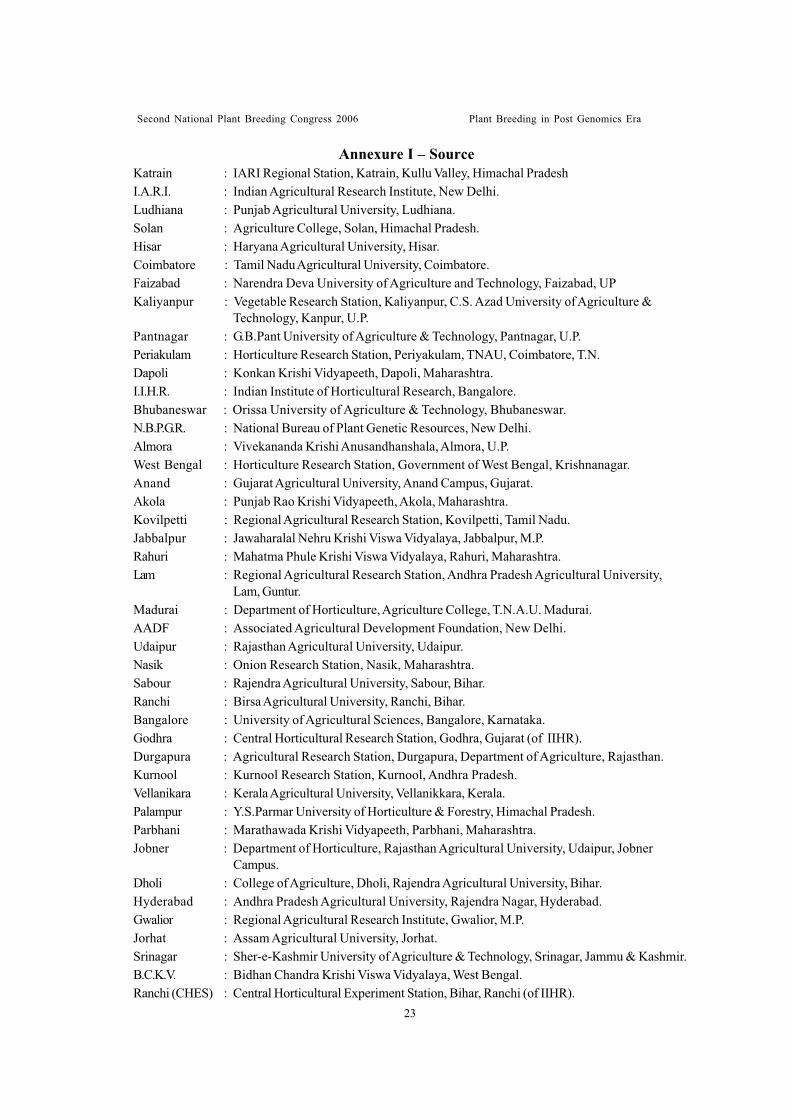
Second National Plant Breeding Congress 2006 Plant Breeding in Post Genomics Era
23
Annexure I – SourceKatrain : IARI Regional Station, Katrain, Kullu Valley, Himachal PradeshI.A.R.I. : Indian Agricultural Research Institute, New Delhi.Ludhiana : Punjab Agricultural University, Ludhiana.Solan : Agriculture College, Solan, Himachal Pradesh.Hisar : Haryana Agricultural University, Hisar.Coimbatore : Tamil Nadu Agricultural University, Coimbatore.Faizabad : Narendra Deva University of Agriculture and Technology, Faizabad, UPKaliyanpur : Vegetable Research Station, Kaliyanpur, C.S. Azad University of Agriculture &
Technology, Kanpur, U.P.Pantnagar : G.B.Pant University of Agriculture & Technology, Pantnagar, U.P.Periakulam : Horticulture Research Station, Periyakulam, TNAU, Coimbatore, T.N.Dapoli : Konkan Krishi Vidyapeeth, Dapoli, Maharashtra.I.I.H.R. : Indian Institute of Horticultural Research, Bangalore.Bhubaneswar : Orissa University of Agriculture & Technology, Bhubaneswar.N.B.P.G.R. : National Bureau of Plant Genetic Resources, New Delhi.Almora : Vivekananda Krishi Anusandhanshala, Almora, U.P.West Bengal : Horticulture Research Station, Government of West Bengal, Krishnanagar.Anand : Gujarat Agricultural University, Anand Campus, Gujarat.Akola : Punjab Rao Krishi Vidyapeeth, Akola, Maharashtra.Kovilpetti : Regional Agricultural Research Station, Kovilpetti, Tamil Nadu.Jabbalpur : Jawaharalal Nehru Krishi Viswa Vidyalaya, Jabbalpur, M.P.Rahuri : Mahatma Phule Krishi Viswa Vidyalaya, Rahuri, Maharashtra.Lam : Regional Agricultural Research Station, Andhra Pradesh Agricultural University,
Lam, Guntur.Madurai : Department of Horticulture, Agriculture College, T.N.A.U. Madurai.AADF : Associated Agricultural Development Foundation, New Delhi.Udaipur : Rajasthan Agricultural University, Udaipur.Nasik : Onion Research Station, Nasik, Maharashtra.Sabour : Rajendra Agricultural University, Sabour, Bihar.Ranchi : Birsa Agricultural University, Ranchi, Bihar.Bangalore : University of Agricultural Sciences, Bangalore, Karnataka.Godhra : Central Horticultural Research Station, Godhra, Gujarat (of IIHR).Durgapura : Agricultural Research Station, Durgapura, Department of Agriculture, Rajasthan.Kurnool : Kurnool Research Station, Kurnool, Andhra Pradesh.Vellanikara : Kerala Agricultural University, Vellanikkara, Kerala.Palampur : Y.S.Parmar University of Horticulture & Forestry, Himachal Pradesh.Parbhani : Marathawada Krishi Vidyapeeth, Parbhani, Maharashtra.Jobner : Department of Horticulture, Rajasthan Agricultural University, Udaipur, Jobner
Campus.Dholi : College of Agriculture, Dholi, Rajendra Agricultural University, Bihar.Hyderabad : Andhra Pradesh Agricultural University, Rajendra Nagar, Hyderabad.Gwalior : Regional Agricultural Research Institute, Gwalior, M.P.Jorhat : Assam Agricultural University, Jorhat.Srinagar : Sher-e-Kashmir University of Agriculture & Technology, Srinagar, Jammu & Kashmir.B.C.K.V. : Bidhan Chandra Krishi Viswa Vidyalaya, West Bengal.Ranchi (CHES) : Central Horticultural Experiment Station, Bihar, Ranchi (of IIHR).
ADVANCES IN SPICES BREEDINGPeter, K.V.1 and K. Nirmal Babu2
Spices are defined as natural plant or vegetableproducts or mixtures thereof, which are used forimparting flavour, aroma, pungency and forseasoning the food. The International StandardsOrganization (ISO) listed about 112 plant speciesas spices but only 53 spices are included in spicesAct, Govt. of India. Of these, only 12 arecommercially important and are grown at largescale in one or the other states and play a majorrole in the economy. India is considered as themagic land of spices and is the native home ofblack pepper, cardamom, tamarind, curry leafand to certain extent ginger, turmeric, garciniaand cinnamon where the good variability exists.From the Indian sub-continent, these spicesspread over to most of the tropical part of thecountries, around the world, and many of thesecountries eventually became competitors forIndia in production and trade of spices. Otherseed spices like coriander, fennel, fenugreek,paprika and cumin were introduced from othercountries. Spices are generally tropical, someespecially herbal spices are of temperate andseed spices are sub tropical or arid in distribution.They are cultivated in many countries in widevariety of geographical regions. Each countryhas its own traditional cultivars/ races/ types ofthe different spices.
India is blessed with varied agro-climatic andagro-ecological approaches that enable us togrow a large number of spices in one or the other.In fact, there is no state in India that does notgrow spices and in turn play an important rolefor the lives of the people and for their owneconomic sustainability. The research anddevelopment programmes initiated by IndianCouncil of Agricultural Research and variousState Agricultural Universities and Departmentsduring last few decades led to the assemblage
of a large collection of germplasm anddevelopment of over 200 improved cultivars ofvarious spices including the seed and treespices.
Conservation of genetic resources
Conservation of genetic resources isextremely important in the context of rapid geneerosion that is taking place due to a variety ofabiotic, biotic, social, political and economicfactors. The loss of land races and traditionalvarieties is rapid in certain crops such as blackpepper due to devastating diseases, spread ofimproved cultivars, deforestation etc. At theIndian Institute of Spices Research (IISR),National Conservatories have been establishedfor all major spices. Germplasm collections arealso being maintained at the All India Co-ordinated Research project on Spices(AICRPS) Centers (Table 1). The NationalBureau of Plant Genetic Resources (NBPGR)also maintains germplasm collections of variousspices at its regional stations. However, due tothe specific agro-climatic requirements of mostspices and their vegetatively propagated naturethe conservation is mainly at Indian Institute ofSpices Research (IISR). The germplasm ofspices is conserved in clonal field repositoriesand also in in vitro gene banks in vegetativelypropagated crop species and seed gene banksin paprika, seed and herbal spices as a safeadditive (Krishnamoorthy and Rema, 1994,Madhusoodanan et al., 1994a, Mohanty andPanda 1994, Rao and Rao, 1994, Ravindran andBabu, 1994, Nirmal Babu et al. 1999, Ravindranet al., 2000, Sasikumar et al., 1992).
Cultivars and land racesBlack pepper: Over 100 cultivars exist in
1. Kerala Agricultural University, Thrissur, Kerala.2. Indian Institute of Spices Research, Kozhikode.
Second National Plant Breeding Congress 2006 Plant Breeding in Post Genomics Era
24
black pepper. They might have had their originfrom wild forms by domestication and selection(Ravindran et al., 2000). Considerable variabilityexists among cultivars with regard tomorphology, yield and quality. CultivarKarimunda is the most popular and it givesconsistent yields under varying agro-climaticconditions. Others like Aimpirian, Kottanadan,Neelamundi, Balankotta, Chumala, Narayakodi,Kalluvally, Kuthiravally, Malligesara andThommankodi are popular in certain locations.The hybrid Panniyur – 1 is also as popular asKarimunda. Cultivar Kuching is most popularvariety in Malaysia. Kottanadan, Kumbhakodiand Aimpirian are cultivars with high oleoresinand essential and hence give high quality pepper(Ravindran and Babu, 1994). There is very littlevariability in pepper germplasm for resistanceto biotic and abiotic stresses. Recently a fewtolerant lines were identified at IISR.
Cardamom : Based on the adaptability, natureof the panicle, shape and size of fruits three typesof cultivated cardamom -Malabar, Mysore andVazhukka - have been identified. Good variabilityexists in cardamom with regard to qualitycharacters such as essential oil content and thequantity of 1,8-cineole and alpha-terperyl acetatein essential oil (Zachariah et al., 1998). Variationshave also been reported in important characterslike branching of inflorescence, fruit (capsule)size, shape, leaf and plant pubescence, retentionof green colour etc. (Madhusoodanan et al.,1994b).
Ginger: There is no natural seed set in gingerwhich resulted in limited variability with regardto certain characters. This also hampers theconventional breeding programmes. However,many commercial cultivars of ginger are known.They are generally named after the localities fromwhere they are cultivated or collected. Maran,Himachal, Nadia, Rio-de-Janeiro, Jamaica,China, Waynad local, Kuruppampady and Bhaiseare some of the local popular cultivars (Mohantyand Panda, 1994). There is good variation for
crude fibre contents and dry recovery with inthe germplasm which determines the suitabilityof each cultivar for dry ginger making. CultivarsAssam and Thodupuzha have high dryrecovery. Exotic cultivar Jamaica has very lowfibre content making it highly suitable for makingginger powder. High variation was alsoobserved for oleoresin and essential oil contentswhich contribute to the quality of the spice.Indian ginger is known for its quality and flavour.The variability in ginger germplasm against thedreaded rhizome rot and bacterial wilt is verynarrow. No genotype is either tolerant orresistant to these diseases.
Turmeric: There are many popular turmericcultivars, which are specific to each region ofcultivation. Duggirala, Armoor, Sugandham,Nandyal, Alleppey, Rajapuri, GLpuram,Bhavanisagar, Gorakhpur, Jobedi etc, are someof the popular local cultivars which areessentially named after the places where theyare grown extensively. The cultivars aregrouped into short duration ‘kasturi’ types,medium duration’ kesari’ types and longduration types (Rama Rao and Rao, 1994).Cultivars Armor, Tekurpet, and Mydukur arelong duration crops, Kothapeta is mediumduration crop while Kasturi is short durationcrop. Turmeric sets seed only in certainlocations and IISR has developed over 100 seedgenerated lines. In India, over 22 high yieldingvarieties have been released for cultivation.There is reasonable variation with regard toreaction to pests and diseases. CultivarsMannuthy local and Kuchipudi are tolerant toshoot borer. Cultivars Mannuthy local,Tekurpeta and Kodur are tolerant to leaf spotwhile Mannuthy local, Glpuram-2, KasturiTanuku and Armoor are tolerant to leaf blotch.Suguna and Sudarshana were reported to befield tolerant to rhizome rot. Dry recovery,curcumin and oleoresin contents determine thequality of turmeric and high variability wasobserved in turmeric germplasm with respect
Second National Plant Breeding Congress 2006 Plant Breeding in Post Genomics Era
25
to these characters (Khader et al., 1994).Tree spices: Cinnamon (Cinnamomum verum
Brecht. & Presl.), Nutmeg (Myristica fragransHoutt.), Clove (Syzygium aromaticum (L.) Merr.et Perry) Tamarind (Tamarindus indica L.) andCurry leaf (Murraya koenigii (L.) Sprengel)are tree spices of importance.
Cinnamon is the earliest known spice and isnative to Sri Lanka. The quality of cinnamondepends on the appearance, content and aromacharacter of volatile oil for which there issignificant variability in the cultivars(Krishnamoorthy and Rema, 1994).
Nutmeg is a dioecious tree native to Moluccasand was introduced to India. Nutmeg producestwo separate spices, the nutmeg and the mace.As it is an obligatory cross-pollinated tree (beingdioecious), considerable variation is observedwith respect to growth and vigour, sexexpression, size and shape of nutmeg andquantity of mace. Myristicin is the most importantcomponent of nutmeg. High variability wasobserved in the chemical and aroma quality within nutmeg populations. Seed fat ranged from 10-48 per cent, oleoresin from 2-14 per cent andessential oil from 1.4-3.4 per cent (Gopalam andSayed, 1987).
Clove also is native to Moluccas and wasintroduced to India. In India the genetc variabilityfor clove is very narrow because of it’s selfpollinating nature. A few variants identified areZanzibar clove with more anthocianin, king clovewith extra bold flower bud and dwarf clove withshort and spreading growth habit(Krishnamoorthy and Rema, 1994).
Though India is the native home of tamarindnot much work was done in this crop except afew dwarf and sweet types were selected fromgermplasm. A few selections from curry leafwere also identified and released as varieties withhigh oil and flavour.
Seed and herbal spices: Coriander(Coriandrum sativum L.), Cumin (Cuminum
cyminum L.), Fennel (Foeniculum vulgareMiller) and Fenugreek (Trigonella foenum-graecum L.) are the seed spices of relevancein India. None of these are native to India. YetCoriander, Fennel and Fenugreek are cultivatedover wide variety of agro climatic regions inthe country. A reasonable amount of geneticdiversity is available in India. Except fenugreek,all the seed spices are cross pollinated andhence the traditional varieties of these cropsexist in the form of complex gene mixtures.Good range of variability exists for importantcharacters such as days for flowering, plantheight, branches per plant, yield per plant, daysto maturity etc (Sarma, 1994). But variabilityfor resistance to pests and diseases is limited.
Breeding and development of varietiesIn the effort to raise production and
productivity of spices, primary importance wasgiven for evolving high yielding varieties withgood quality attributes. Evaluation and selectionwithin the germplasm has led to the isolation ofmany elite varieties. Most of these varietieswere evolved by clonal selections fromgermplasm, while a few are from seedlingselection and very few are due to recombinationbreeding (Edison et al., 1991, Ravindran andJohny, 2000). The varieties released so far invarious spices, their pedigree, the centersresponsible for developing the variety, areas ofadoption and important agronomic charactersare given in Table 2.
Black pepper: Black pepper has goodvariability for various agronomic and qualityattributes but variability is limited or resistanceto biotic and abiotic stresses. Hence pepperbreeding was essentially dependent on clonalselections, selections from germplasm andselections from open pollinated progenies ofpopular cultivars. But presently, mostimprovement programmes are based on intercultivar hybridization and recombinationbreeding to develop varieties resistant to bioticand abiotic stresses. So far, 12 black pepper
Second National Plant Breeding Congress 2006 Plant Breeding in Post Genomics Era
26
varieties were released for cultivation in India.Of these, only two are hybrids while others areof clonal selections from germplasm or from openpollinated progenies. PLD 2 is a high qualityvariety suitable for industrial extraction of oilsand oleoresins while Pournami is tolerant to rootknot nematode. Panniyur 1 has bold berries whilePanniyur 5 is suitable for mixed cropping.Malaysia and Indonesia have researchprogrammes on black pepper.
Malaysia has developed two importantvarieties. The variety Semongok Perak wasdeveloped by clonal selection and SemongokEmas by hybridization followed by back crossing.The latter is highly tolerant to Phytophthora footrot disease. In Indonesia, two selections – Natar1 and Natar 2 have been evolved. In Madagascarselections Sel IV.1, Sel IV.2 have been developedfrom cultivars introduced from Indonesia(Ravindran et al., 2000).
Cardamom: Cardamom breeding depend onselections from germplasm and from openpollinated progenies of popular cultivars. Ninehigh yielding varieties of cardamom werereleased for cultivation while one more line NKE–12, a katte virus tolerant line is in the finalprocess of release. RR1 is a variety tolerant torhizome rot disease of cardamom while ICRI 4is relatively field tolerant. PV 1 has long andbold capsules while CCS 1 was highly suitablefor high density planting because of its compactplant type. Hybridization between NKE, RR,extra bold and Multibranch types are in progressto pyramid these characters into single varieties.
Ginger and Turmeric: Five ginger and eighteenturmeric varieties were released so far forcultivation. In ginger variety IISR Varada haslow fibre while Suruchi has bold and attractiverhizomes. Surabhi is an induced mutant suitablefor both rainfed as well as irrigated conditions.Himgiri is suitable for green ginger and reportedto have tolerance to rhizome rot. In turmeric mostof the varieties are clonal selections fromgermplasm except Prabha and Prathibha which
were the first ever varieties developed fromseedling progenies. They are also rich incurcumin content. Varieties Suguna andSudarshana are short duration varieties withfield tolerance to rhizome rot. In turmeric, wehave varieties suitable for every turmericgrowing state. Mutant and polyploid lines werealso developed and are in various stages ofevaluation.
Tree spicesIn cinnamon, priority is given to develop lines
with high cinnamaldehyde. The varietiesNavashree and Nithyashree have highcinnamaldehyde (Krishnamoorthy and Rema,1994, Krishnamoorthy et al., 1996). So far, fivehigh yielding varieties of cinnamon, two highquality and high yielding nutmegs selected fromgermplasm were recommended for release. Incurry leaf, only one high yielding high essentialoil variety with good flavour, named Suvasiniwas released for cultivation.
Seed and herbal spices: Among seed spices,powdery mildew and Fusarium wilt in coriander,Fusarium wilt and Alternaria blight in cumin,powdery mildew and sugary disease in fenneland powdery mildew and wood rot in fenugreekare the major production constraints. So far, 18coriander, 5 cumin, 6 fennel and 4 fenugreekvarieties were released for cultivation. Thoughmost of the released varieties are high yielders,only few of them have shown partial fieldtolerance to these diseases and resistantvarieties are not available. Only Gujarat cumin3 was reported to be resistant to wilt(Vedamuthu et al., 1994). Fennel variety PF-35 is moderately tolerant to leaf spot, leaf blightand sugary disease. Fenugreek variety Lamselection-1 has field tolerance to major pestsand diseases. Coriander varieties Co 2, Co 3and Hissar Anand are dual purpose varietieswhile Sadhana and Swathi are tolerant to whitefly.
Most of the earlier work on spices
Second National Plant Breeding Congress 2006 Plant Breeding in Post Genomics Era
27
improvement concentrated mainly on developinghigh yielding lines alone. Some of themincidentally have high quality and goodadaptability. Lesser importance was given toother characters like high quality and diseasesand pest resistance, though they were not lostfrom the programme. Only in seed spices, massor pureline selection and in some case recurrentselection methods were adopted. Occasionally,mutation breeding was used in ginger, turmericand cumin which resulted in development of newvarieties. Recently, more emphasis is being givento convergent breeding programmes of variousspice crops to develop high quality lines andresistant lines to biotic and abiotic stresses, inaddition to higher yield. For example, high priorityis now given to develop varieties tolerant/resistant to Phytophthora foot rot. A largenumber of inter cultivar hybrids, open pollinatedseedling progenies and accessions in germplasmare being evaluated for this purpose. A few inter-cultivar hybrids in black pepper, inter varietalhybrids and natural katte escapes in cardamomhave been developed. Seedling progenies inturmeric are highly promising and are inadvanced stages of evaluation. Promising andhigh yielding black pepper genotypes suitable formixed cropping system in coffee and teaplantations which can give good yields at lowshade and high elevations (3,000 ft MSL) are inadvanced stages of evaluation (Madhusoodananet al., 1994b, Ravindran and Babu, 1994,Ravindran et al., 2000).
Biotechnological approaches for spicescrop conservation and improvement
The past few years have witnessed a dramaticincrease in our ability to manipulate and studytissues and has resulted in commercialpropagation of many crop species, developmentof new varieties and new breeding lines viasomaclonal variation, anther culture andprotoplast fusion. Production of secondarymetabolites, flavour and colouring componentsthrough bioreactor technology, recombinant
DNA technology and use of transgenics withincreased production levels have greatsignificance in spices (Nirmal Babu et al2005).
Micro rhizomes: Rhizome formation in vitro,was reported in long term cultures of ginger,turmeric and Kaempheria. In vitro formedrhizomes are important source of disease-freeplanting material ideally suited for germplasmexchange, transportation and conservationsimilar to that of microtubers of potato.
In vitro conservation of germplasm: Storageof germplasm in seed banks is not ideal in manyspices as most of them are vegetativelypropagated and seeds are recalcitrant andheterozygous. Hence, storage of germplasm invitro is a safe alternative. Conservation ofpepper, cardamom, seed and herbal spices,vanilla and ginger germplasm in in vitro genebank by slow growth and throughcryopreservation was reported. Conservationof genetic resources in invitro gene banks isnow an established convention and two genebanks for conservation of spices germplasmfunctions at IISR and National Bureau of PlantGenetic Resources.
Somaclonal variation and in vitroselection for tolerance to diseases
Somaclonal variation is an important sourceof variability in crops like ginger, turmeric andvanilla where the native variability is very lowand seed set is either absent or difficult.Attempts on induction of variability onsomaclones for important agronomic charactersand tolerance to diseases through both in vitroand in vivo selection were reported in blackpepper, cardamom, ginger and galangal.Variants with high curcumin content wereisolated from tissue cultured plantlets.
Genetic transformationRecent advances made in developing
techniques for transfer of foreign DNA into plantcells have aroused much interest in the
Second National Plant Breeding Congress 2006 Plant Breeding in Post Genomics Era
28
possibility of utilizing recombinant DNAtechnology in crop improvement. Reports areavailable on Agrobacterium mediated genetransfer system in black pepper, bell pepper anddirect gene transfer by particle bombardment inginger and cardamom.
Production of secondary metabolitesBiotechnology can be utilized to exploit the
potential of spices for bioproduction of usefulplant metabolites. Plant cells cultured in vitroproduce wide range of primary and secondarymetabolites of economic value. This techniqueis all the more relevant in recent years due tothe ruthless exploitation of plants in the fieldleading to reduced availability.
Trials are in progress for production of primaryand secondary metabolites and flavour andcolouring compounds like capsaicin andbiotransformation of ferulic acid vanillamine tocapsacin and vanillin in immobilised cell culturesof Capsicum frutescen and in vitro synthesis ofcrocin, picrocrocin and safranel from saffronstigma and colour components from cells derivedfrom pistils. Production of essential oils from cellcultures and accumulation of essential oils byAgrobacterium tumefaciens transformed shootcultures of Pimpinella anisum was also reported.Regulation of the shikimate pathway insuspension culture cells of parsley and productionof anethole from cell cultures of Foeniculumvulgare, production of monoterpene bytransformed shoot cultures of Mentha ,biosynthesis of sesquturpenic phytoalexincapsidol in elicited root cultures of chilli,production of rosmarinic acid in suspensioncultures of Salvia officinali, production of phenolicflavour compounds using cultured cells andtissues of vanilla, in vitro production ofpetroselinic acid from cell suspension culturesof coriander are also available. Though thefeasibility of in vitro production of spice principleshas been demonstrated, methodology for scalingup and reproducibility need to be developedbefore it can reach commercial levels.
GenomicsIn recent times there is increased emphasis
in molecular markers for characterization of thegenotypes, genetic fingerprinting, inidentification and cloning of important genes,marker assisted selection and in understandingof inter relationships at molecular level.Molecular markers were used for cropprofiling, molecular taxonomy, identification ofduplicates, hybrids, estimation of genetic fidelityof micropropagated and in vitro conservedplants in pepper, ginger, turmeric vanillacardamom, tree spices etc. Mapping populationwas also developed for construction ofmolecular map and to tag important genes inblack pepper (Nirmal Babu et al 2005).Studiesare also in progress for tagging important genesfor useful agronomic traits and QTLs formarker aided selection in black pepper andcardamom.
Comparative genomics has already mademuch headway in US for solanaceous crops towhich capsicum belongs (Tanksley et al 1988,Livingstone et al 1999). Similarly Global MusaGenome Consortium involving 27 institutions in18 countries was in operation to elucidate musagenome architecture. The Musa GenomeResources Centre (MGRC) was established atthe Laboratory of Molecular Cytogenetics andCytometry of the Institute of ExperimentalBotany (IEB), Olomouc, Czech Republic in2003. The information generated helps in betterunderstanding of other related sub families likeZingiberaceae to which important spices likecardamom, ginger and turmeric belongs.
REFERENCESEdison, S., Johny, A.K., Nirmal Babu, K. and
Ramadasan, A. (1991) Spices Varieties. ACompendium of morphological andagronomic characters of improved varietiesof spices in India. National ResearchCentre for Spices (ICAR), Kerala, 63 p.
Gopalan, A. and Sayed A.A.M (1987)
Second National Plant Breeding Congress 2006 Plant Breeding in Post Genomics Era
29
Evaluating chemical and aroma quality ofnutmeg accessions, Myristica fragrans L,Indian Spices 14: 9-11.
Khader, M.A., Vedamuthu, P. G. B. andBalashanmugam, P. V. (1994) Improvementof Turmeric. In Advances in Horticulture,Plantation Crops and Spices. K L Chadhaand P Rethinam (eds.) Malhotra PublishingHouse, New Delhi, Vol. 9. p. 315- 332.
Krishnamoorthy, B. and Rema, J. (1994) GeneticResourses of Tree Spices.In Advances inHorticulture, Plantation Crops and Spices.K L Chadha and PRethinam (eds.) MalhotraPublishing House, New Delhi, p. 169 -192.
Krishnamoorthy, B., Rema, J., Zachariah, T.J.,Abraham, J. and Gopalam, A. (1996)Navashree and Nithyashree – two new highyielding and high quality cinnamon(Cinnamomum verum Bercht & Presl.)selections, J. Spices and Aromatic Crops,5 : 28 –33.
Livingstone, K.D., Lackney, V.K., Blauth, J.R.,van Wijk, R. and Jahn, M.K. 1999. Genoomemapping in Capsicum and the evolution ofgenome structure in the Solanaceae.Genetics. 152 : 1183-1202.
Madhusoodanan, K. J., Kuruvilla, K.M. andPriyadarshan, P.M. (1994a) GeneticResourses of Cardamom. Advances inHorticulture, Vol. 9. Plantation Crops andSpices. In. K L Chadha and P Rethinam(eds.) Malhotra Publishing House, NewDelhi, p. 121 - 130.
Madhusoodanan, K. J., Kuruvilla, K .M. andPriyadarshan, P. M. (1994b) Improvementof Cardamom. Advances in Horticulture,Vol. 9. Plantation Crops and Spices. In. K LChadha and P Rethinam (eds.) MalhotraPublishing House, New Delhi, p. 307-314.
Mohanty, D. C. and Panda, B. S. (1994) GeneticResourses of Ginger. Advances inHorticulture, Vol. 9. In. K L Chadha and PRethinam (eds.)Plantation Crops and Spices.
Malhotra Publishing House, New Delhi, p.150 -168.
Nirmal Babu, K., Geetha, S. P., Minoo, D.,Ravindran, P. N. and Peter, K. V. (1999)In vitro conservation of germplasm. pp:106-129, In. Biotechnology and itsapplication in Horticulture. In S P Ghosh(ed) Narosa Publishing House, New Delhi.
Nirmal Babu, K., Sasikumar, B., Ratnambal,M. J., Johnson George, K. and Ravindran,P. N. (1993) Genetic variability in turmeric(Curcuma longa L.) Indian J. Genetics.53: 91-93.
Nirmal Babu, K., Minoo, D., Geetha, S.P.,Ravindran, P.N. and Peter, K.V. (2005)Advances in Biotechnology of Spices andHerbs. Ind. J.Bot.Res. 1: 155-214.
Rao, M. R. and Rao, D. V .R. (1994) GeneticResourses of Turmeric. Advances inHorticulture, Vol. 9. Plantation Crops andSpices. In. K L Chadha and P Rethinam(eds.) Malhotra Publishing House, NewDelhi, p. 131 – 150.
Rattan, R. S. (1994) Improvement of Ginger,Advances in Horticulture, Vol.9. PlantationCrops and Spices. In. KL Chadha and PRethinam (eds.)Malhotra Publishing House,New Delhi, p.333– 344.
Ravindran, P.N. and Nirmal Babu, K. (1988)Black pepper cultivars suitable for variousregions. Indian Cocoa, Arecanut &Spices J. 11 : 110-112
Ravindran, P. N. and Nirmal Babu, K. (1994)Genetic resources of Black pepper. In.Advances in Horticulture, Vol. 9. PlantationCrops and Spices. K L Chadha and PRethinam (eds.). Malhotra PublishingHouse, New Delhi, p. 99-120
Ravindran, P. N., Nirmal Babu, K., Sasikumar,B. and Krishnamoorthy, K. S. (2000)Botany and crop improvement of blackpepper, pp. 23-142, In. Black pepper, Piper
Second National Plant Breeding Congress 2006 Plant Breeding in Post Genomics Era
30
nigrum. P N Ravindran (ed.).HarwoodAcademic Publishers, Amsterdam, TheNetherlands.
Ravindran, P.N. and Johny, A.K. (2000) Highyielding varieties in Spices, Indian Spices37: 17-19.
Ravindran, P.N., Sasikumar, B., Johnson George,K., Ratnambal, M. J., Nirmal Babu, K.,Zachariah, T.J. and Ramakrishnan Nair, R.(1994). Genetic resources of ginger and itsconservation in India. Plant Geneticresources News letter, (IPGRI) 98: 1-4.
Sarma, Y.R., Ramana, K.V., Devasahayam, S.and Rema, J. (eds) (2001) The Saga of SpiceResearch – A voyage through history ofspice research at Indian Institute of SpicesResearch. Indian Institute of SpicesResearch, Calicut, Kerala.
Sasikumar, B., Nirmal Babu, K., Jose Abraham.and Ravindran, P. N. (1992) Variability,correlation and path analysis of gingergermplasm. Indian J. Genetics, 52 : 428-431.
Sharma ,A. K. (1994) Genetic Resourses of SeedSpices. Advances in Horticulture, Vol. 9.Plantation Crops and Spices. In. K L Chadhaand P Rethinam (eds.) Malhotra PublishingHouse, New Delhi, p. 193 - 208.
Sukumara Pillay, V., Ibrahim. K. K. andSasikumaran, S. (1994) Improvement of
Black pepper. Advances in Horticulture,Vol. 9. Plantation Crops and Spices. In. KL Chadha and P Rethinam (eds.). MalhotraPublishing House, New Delhi, p. 293-206.
Tanksley, S.D., Bernatzky, R., Lapitan, N.L.and Prince, J.P. 1988. Conservation of generepertoire but not gene order in pepper andtomato. Proc. Natl. Sci. USA. 85 : 6419-6423.
Vedamuthu , P. G. B., Khader, M. A .and Rajan,F. S. (1994) Improvement of Seed SpicesAdvances in Horticulture, Vol. 9. PlantationCrops and Spices. In. K L Chadha and PRethinam (eds.) Malhotra PublishingHouse, New Delhi, p. 345 – 374.
Zacharia, T. J., Mulge, R. and Venugopal, M.N. (1998) Quality of cardamom fromdifferent accessions. In. Developments inPlantation Crops Research, Mathew N Mand Jacob C K (Eds.). Allied publishers,India. pp. 337-340
Second National Plant Breeding Congress 2006 Plant Breeding in Post Genomics Era
31
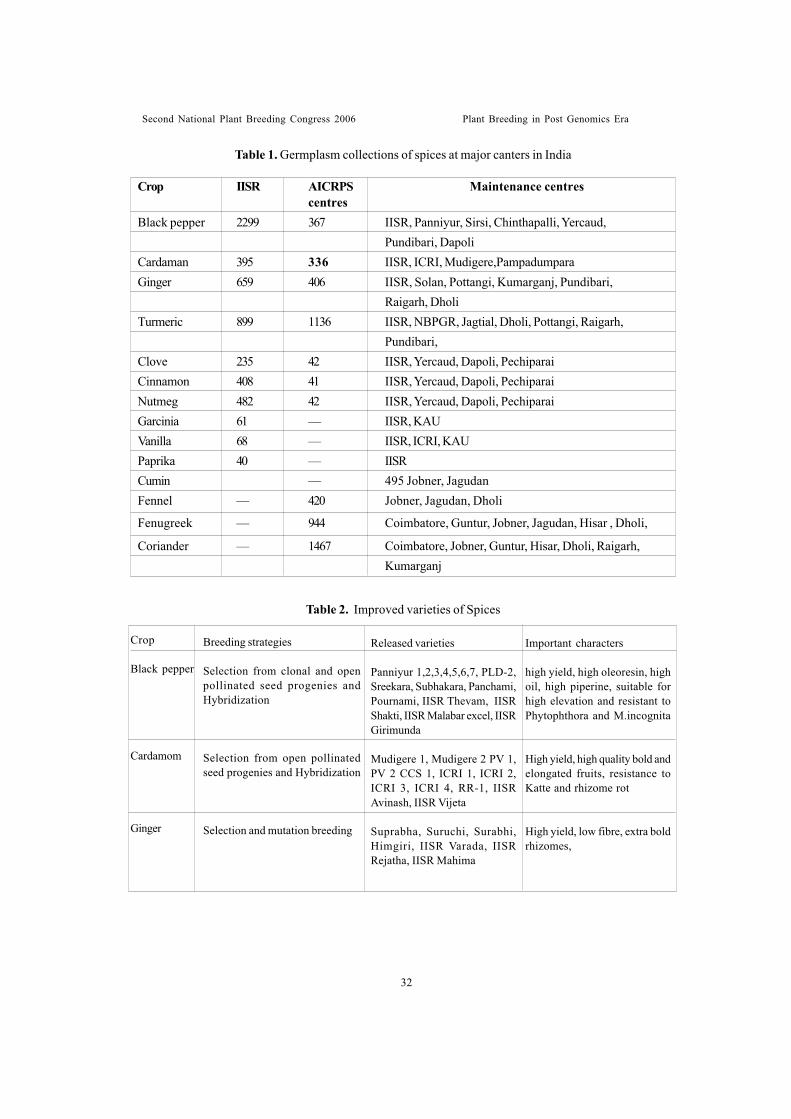
Crop IISR AICRPS Maintenance centrescentres
Black pepper 2299 367 IISR, Panniyur, Sirsi, Chinthapalli, Yercaud,Pundibari, Dapoli
Cardaman 395 336 IISR, ICRI, Mudigere,PampadumparaGinger 659 406 IISR, Solan, Pottangi, Kumarganj, Pundibari,
Raigarh, DholiTurmeric 899 1136 IISR, NBPGR, Jagtial, Dholi, Pottangi, Raigarh,
Pundibari,Clove 235 42 IISR, Yercaud, Dapoli, PechiparaiCinnamon 408 41 IISR, Yercaud, Dapoli, PechiparaiNutmeg 482 42 IISR, Yercaud, Dapoli, PechiparaiGarcinia 61 — IISR, KAUVanilla 68 — IISR, ICRI, KAUPaprika 40 — IISRCumin — 495 Jobner, JagudanFennel — 420 Jobner, Jagudan, Dholi
Fenugreek — 944 Coimbatore, Guntur, Jobner, Jagudan, Hisar , Dholi,
Coriander — 1467 Coimbatore, Jobner, Guntur, Hisar, Dholi, Raigarh,Kumarganj
Table 1. Germplasm collections of spices at major canters in India
Table 2. Improved varieties of Spices
Crop
Black pepper
Cardamom
Ginger
Breeding strategies
Selection from clonal and openpollinated seed progenies andHybridization
Selection from open pollinatedseed progenies and Hybridization
Selection and mutation breeding
Released varieties
Panniyur 1,2,3,4,5,6,7, PLD-2,Sreekara, Subhakara, Panchami,Pournami, IISR Thevam, IISRShakti, IISR Malabar excel, IISRGirimunda
Mudigere 1, Mudigere 2 PV 1,PV 2 CCS 1, ICRI 1, ICRI 2,ICRI 3, ICRI 4, RR-1, IISRAvinash, IISR Vijeta
Suprabha, Suruchi, Surabhi,Himgiri, IISR Varada, IISRRejatha, IISR Mahima
Important characters
high yield, high oleoresin, highoil, high piperine, suitable forhigh elevation and resistant toPhytophthora and M.incognita
High yield, high quality bold andelongated fruits, resistance toKatte and rhizome rot
High yield, low fibre, extra boldrhizomes,
Second National Plant Breeding Congress 2006 Plant Breeding in Post Genomics Era
32
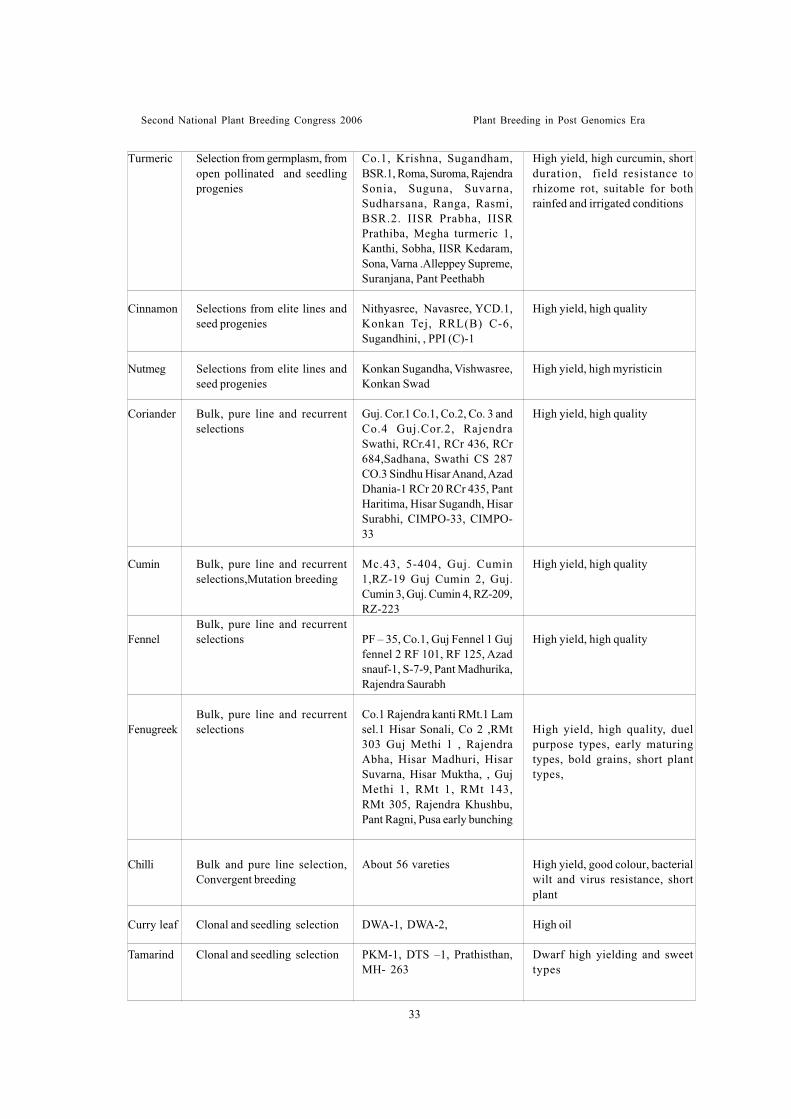
Turmeric
Cinnamon
Nutmeg
Coriander
Cumin
Fennel
Fenugreek
Chilli
Curry leaf
Tamarind
Selection from germplasm, fromopen pollinated and seedlingprogenies
Selections from elite lines andseed progenies
Selections from elite lines andseed progenies
Bulk, pure line and recurrentselections
Bulk, pure line and recurrentselections,Mutation breeding
Bulk, pure line and recurrentselections
Bulk, pure line and recurrentselections
Bulk and pure line selection,Convergent breeding
Clonal and seedling selection
Clonal and seedling selection
Co.1, Krishna, Sugandham,BSR.1, Roma, Suroma, RajendraSonia, Suguna, Suvarna,Sudharsana, Ranga, Rasmi,BSR.2. IISR Prabha, IISRPrathiba, Megha turmeric 1,Kanthi, Sobha, IISR Kedaram,Sona, Varna .Alleppey Supreme,Suranjana, Pant Peethabh
Nithyasree, Navasree, YCD.1,Konkan Tej, RRL(B) C-6,Sugandhini, , PPI (C)-1
Konkan Sugandha, Vishwasree,Konkan Swad
Guj. Cor.1 Co.1, Co.2, Co. 3 andCo.4 Guj.Cor.2, RajendraSwathi, RCr.41, RCr 436, RCr684,Sadhana, Swathi CS 287CO.3 Sindhu Hisar Anand, AzadDhania-1 RCr 20 RCr 435, PantHaritima, Hisar Sugandh, HisarSurabhi, CIMPO-33, CIMPO-33
Mc.43, 5-404, Guj. Cumin1,RZ-19 Guj Cumin 2, Guj.Cumin 3, Guj. Cumin 4, RZ-209,RZ-223
PF – 35, Co.1, Guj Fennel 1 Gujfennel 2 RF 101, RF 125, Azadsnauf-1, S-7-9, Pant Madhurika,Rajendra Saurabh
Co.1 Rajendra kanti RMt.1 Lamsel.1 Hisar Sonali, Co 2 ,RMt303 Guj Methi 1 , RajendraAbha, Hisar Madhuri, HisarSuvarna, Hisar Muktha, , GujMethi 1, RMt 1, RMt 143,RMt 305, Rajendra Khushbu,Pant Ragni, Pusa early bunching
About 56 vareties
DWA-1, DWA-2,
PKM-1, DTS –1, Prathisthan,MH- 263
High yield, high curcumin, shortduration, field resistance torhizome rot, suitable for bothrainfed and irrigated conditions
High yield, high quality
High yield, high myristicin
High yield, high quality
High yield, high quality
High yield, high quality
High yield, high quality, duelpurpose types, early maturingtypes, bold grains, short planttypes,
High yield, good colour, bacterialwilt and virus resistance, shortplant
High oil
Dwarf high yielding and sweettypes
Second National Plant Breeding Congress 2006 Plant Breeding in Post Genomics Era
33
ENHANCING UTILIZATION OF PLANT GENETIC RESOURCES INCROP IMPROVEMENT
Upadhyaya, H.D1. and C.L.L. Gowda
ABSTRACTCrop plant genetic resources (PGR) including landraces, old and new cultivars, mutant
etc., are vital to crop improvement. These were used in research to develop improved cultivarsthat has resulted in increase of productivity and production considerably of various crops.The need for collecting and conserving germplasm was realized during 1960s, when therewas threat of loss of landraces due to large adoption of improved varieties. Currently oversix million-germplasm accessions are held in over 1300 genebanks across the world. Thispaper discusses assembly and management of genetic resources of sorghum, pearl millet,chickpea, pigeonpea, groundnut and six small millets at the Rajendra S Paroda Genebankat ICRISAT-Patancheru, India and means to further enhance their utilization for sustainableagriculture globally.
Various institutes and organizations worldwide have donated germplasm to the ICRISATgenebank. In addition, two hundred and thirteen germplasm collection missions wereorganized in 62 countries securing 33,194 germplasm accessions. The entire holding isover 118,800 accessions of the above crops from 130 countries. The germplasm accessionsreceive high priority for regeneration, characterization, conservation and distribution.The focus of research is on diversity assessment and on developing representative core,mini-core and composite collections to enhance utilization by the breeders. Molecularcharacterization of diverse germplasm sets is pursued for value addition and to enhancetheir utilization. Most of the accessions have been characterized. Germplasm seeds areconserved under very precise (cool and dry) conditions. Adequate seed of each accession isconserved to meet the requests of researchers and for posterity.
The ICRISAT genebank has been supplying over 21,000 germplasm samples annuallyto scientists across the countries. ICRISAT has restored crop germplasm to several countriesincluding India. From the basic germplasm supplied from ICRISAT genebank, 66 varietieswere released for cultivation in 44 countries.
IntroductionThe wealth of plant genetic resources that
includes landraces, old and new cultivars, geneticstocks, mutants etc., has contributed enormouslytowards achieving the global objectives of foodsecurity, poverty alleviation, environmentprotection and sustainable development. Thevalue of genetic resources in developing superiorcrop cultivars is well recognized. The utilizationof Norin 10 gene in wheat and Dee Geo WooGen in rice (sources of reducing plant height)have revolutionized the production of these cropsglobally. Wheat productivity increased by 137%
1. International Crops Research Institute for the Semi-Arid Tropics (ICRISAT),Patancheru 502 324, Andhra Pradesh, India
and of rice by 93% in last 40 years due to theimproved cultivars (Table 1), coupled with goodagronomic management. Diverse genotypeswere used in developing improved cultivars ofsoybean (resistance to diseases and insect-pests, tolerance to pod shattering, promiscuousnodulation and high yield; cf Dashiell andFatokun, 1997) and groundnut (broadeninggenetic base, adding disease resistance and highyield; cf Singh and Nigam, 1997) that resultedin 93.2% productivity increase in soybean and69.6% in groundnut in the last 40 years. Similarly,diverse germplasm sources having traits of
Second National Plant Breeding Congress 2006 Plant Breeding in Post Genomics Era
34
Second National Plant Breeding Congress 2006 Plant Breeding in Post Genomics Era
short-duration, large seed size and diseaseresistance were used to develop new and highyielding cultivars of Chickpea (cf Singh et al.,1997) and pigeonpea (cf Remanandan and Singh,1997).
The concern of PGR exploration and ex-situconservation was not serious until 1960s. Thedevelopment and spread of high yielding varietiesof wheat and other crops by 1960s startedreplacing the local cultivars very rapidly leadingto erosion of plant diversity. This loss of nativecrop landraces and cultivars prompted theinternational organizations such as the Food andAgriculture Organization (FAO) and the WorldBank to create new institutional structures forthe collection and preservation of valuable plantgenetic resources in ex-situ genebanks. Sincethe last four decades, this program has achievedspectacular success. Over six million germplasmaccessions have been collected and/orassembled in 1308 genebanks world over (FAO,1998).
Created in 1971, the Consultative Group onInternational Agricultural Research (CGIAR) isan association of public and private memberssupporting a system of 15 Future HarvestCenters that work in more than 100 developingcountries to achieve sustainable food securityand reduce poverty through scientific researchand development activities in the fields ofagriculture, forestry, fisheries, policy andenvironment.
The CGIAR germplasm collections are aunique resource, available to all researchers.Germplasm contributions have helped lay thefoundations of recovery by jumpstartingagricultural growth in countries emerging fromconflict such as Afghanistan, Angola,Mozambique and Somalia.
The International Crops Research Institute forthe Semi-Arid Tropics (ICRISAT), one of the15 CGIAR centers, is responsible for germplasmassembly, characterization, conservation anddistribution of germplasm of five mandate crops
(sorghum, pearl millet, chickpea, pigeonpea andgroundnut) and six small millets (finger millet,foxtail millet, kodo millet, little millet, proso milletand barnyard millet) and their wild relatives.
Germplasm Assembly in the ICRISATGenebank
When ICRISAT was established in 1972,efforts were begun to assemble the germplasmof the mandate crops that existed with variousresearch institutes in India and other countries.The Rockefeller Foundation had assembledover 16,000 sorghum germplasm accessionsfrom major sorghum areas, and ICRISATacquired 11,961 accessions of this collection in1974 that existed in India and USA, besides2000 pearl millet accessions. ICRISAT alsoobtained 2000 accessions of pearl milletcollected by the Institut Francais de RecherchéScientifique pour le Development enCooperation (ORSTOM) in francophone WestAfrica.
The germplasm material of chickpea andpigeonpea originally collected and assembledby the former Regional Pulse ImprovementProject (RPIP), a joint project of the IndianAgricultural Research Institute (IARI), theUnited States Department of Agriculture(USDA) and Karaj Agricultural University inIran, formed the initial collection. Sets of thisgermplasm, which were available in severalagricultural research institutes in India and Iran,and at the USDA, were donated to ICRISATin 1973. ICRISAT also acquired over 1,200chickpea accessions from the Arid LandsAgricultural Development (ALAD) program inLebanon. Similarly, much of the groundnutgermplasm was received from the Indiangroundnut research program, [now the NationalResearch Center for Groundnut (NRCG),Junagadh], and USDA. Besides germplasmdonations by the All India CoordinatedResearch Projects on various crops,considerable number of germplasm werereceived from agricultural universities at
35
Second National Plant Breeding Congress 2006 Plant Breeding in Post Genomics Era
Pantnagar (Uttranchal), Rajendranagar (AndhraPradesh), Ludhiana (Punjab), Coimbatore (TamilNadu), Jabalpur (Madhya Pradesh), Rahuri(Maharashtra) and IARI at New Delhi. FifteenIndian organizations that donated highest numberof germplasm are listed in Table 2. Recently, in2004-05, we obtained chickpea germplasmsamples from Washington State University,Pullman, USA (2083 cultivated, 68 wild) andICARDA, Syria (682 cultivated, 21 wild). Wealso received 622 groundnut germplasm samplesfrom the National Institute of AgrobiologicalSciences, Japan. Over 400 accessions ofsorghum collected in Niger were received fromour regional genebank in Niamey.
ICRISAT initiated activities to add newgermplasm of its mandate crops from areas thatwere not adequately represented in thegermplasm collection. Between 1975 and 2000,a total of 213 joint missions were launched in 62countries, from which 33,194 accessions(sorghum 9011; pearl millet 10841; chickpea4228, pigeonpea 3873, groundnut 2776; and smallmillets 2465) were collected. A large number ofbreeding lines or germplasm selections aredeveloped and evaluated at important locations.The promising/improved germplasm lines werealso registered in the genebank and conservedfor future utilization. The genebank currentlyholds 118,833 accessions of which 73.8% havebeen conserved as base collection and 93.0%are designated with FAO (Table 3).
Germplasm Management
Phenotypic characterization andevaluation
Agronomic and morphological characterizationis necessary to facilitate the utilization ofgermplasm. To achieve this, germplasmaccessions of all the crops were sown in batchesover the years and characterized formorphological and agronomic traits. Germplasmscreening against biotic and abiotic stresses wereconducted in collaboration with various
disciplinary scientists. Grains were tested fornutritional value. Germplasm sets wereevaluated over locations jointly with scientistsin India, Nepal, Thailand, Indonesia, Ethiopia,Kenya and more intensively with the NationalBureau of Plant Genetic Resources (NBPGR),India. The results of joint evaluations have ledto a better understanding of the germplasmmaterial.
RegenerationRegeneration was carried out to meet the
seed increase of (1) accessions that hadreached a critical low level of seed stock orviability; (2) accessions required for medium-term storage (MTS; 5 oC, 25-30%RH) or long-term storage (LTS; -20 oC); and (3) germplasmrepatriation, particularly to the NBPGR, India.Some of the germplasm accessions that do notproduce seeds under ICRISAT-Patancheruclimatic conditions (some wild Arachis species)are maintained vegetatively in the greenhouse.Some other accessions (wild Cicer species)need long day length and cool weather to growand produce seeds. These species are alsoregenerated in greenhouse facilities.
ConservationGermplasm conservation requires cleaning
the seed material, drying to minimal seedmoisture content, storing in cool and dryconditions and regular monitoring of seed healthduring storage. In the ICRISAT genebank, theseeds are stored in medium-term storage(MTS) in aluminium cans. A recent monitoringof the health of seed conserved for 10–25 years(MTS) indicated greater than 75% seed viabilityfor majority of the accessions. Accessions withdeclining seed viability (less than 75% seedgermination) are regenerated on priority andthe old stock is replaced with fresh seeds. Thegermplasm accessions are also conserved inlong-term storage (LTS) after packing invacuum-sealed aluminium foil pouches. Beforepacking, the seeds are dried to about 5%
36
Second National Plant Breeding Congress 2006 Plant Breeding in Post Genomics Era
moisture content in a walk-in drying room (100m3 size; 15 oC and 15% RH) facility. At present,we have about 76% of the FAO designatedgermplasm in the LTS facility.
Documentation and supply of informationThe vast germplasm data gathered on chickpea
and pigeonpea germplasm has been summarizedand presented to the users in the form of catalogs(Pundir et al., 1988; Remanandan et al., 1988).During the last 20 years, we had a verypurposeful collaboration with NBPGR, India, ongermplasm exploration, and evaluation at anumber of locations, and results were publishedas ‘Collaboration on Genetic Resources’(ICRISAT 1989). The data on joint germplasmevaluations were analyzed and published twocatalogs each on forage sorghum germplasm(Mathur et al., 1991, 1992), and pearl millet(Mathur et al., 1993b and 1993c), and one onchickpea (Mathur et al., 1993a). Core and mini-core collections of ICRISAT mandate cropswere established and the information waspublished for the benefit of fellow researchworkers. A Manual of Genebank Operations andProcedures was published (Rao and Bramel,2000) documenting the procedures forgermplasm acquisition, maintenance,documentation, conservation, and distribution.Existing procedures were reviewed and revisedto maintain the collections according tointernational standards. A taxonomic key for theidentification of wild species of the mandatecrops has also been included in the manual.
Global germplasm supply to scientists andinstitutions
The ICRISAT genebank is holding germplasmthat was donated by various institutes,organizations and farm communities and is everwilling to supply the same for research. Fromthe beginning of our work (1973) until 2005, wehave supplied 674,108 germplasm samples toscientists in 142 countries (Table 4).
Repatriation of germplasm to nationalprograms
The global collections held at ICRISAT servethe purpose of restoration germplasm to thesource countries when national collections arelost due to natural calamities, civil strife, etc.We supplied 362 sorghum accessions toBotswana; 1827 sorghum and 922 pearl milletto Cameroon; 1723 sorghum and 931 chickpeato Ethiopia; 838 sorghum and 332 pigeonpea toKenya; 1436 and 445 sorghum accessionsrespectively to Nigeria and Somalia; and 71pigeonpea accessions to Sri Lanka. Thegermplasm collection maintained in theICRISAT genebank includes 44,822 accessionsreceived from or jointly collected with the IndianNational Programs. The National Bureau ofPlant Genetic Resources (NBPGR), Indiarequested ICRISAT for restoration of thisgermplasm. As part of ICAR/ICRISATPartnership Projects, the genebank hasrepatriated almost full set of this germplasmby July 2004 (Table 5). Thus the NARS ofseveral countries have regained their preciousheritage which could have been lost if this wasnot conserved in the ICRISAT genebank.
Impact of germplasm supplied to NARSworldwide
Besides the utilization of germplasm inongoing research at other institutes, 66germplasm accessions (sorghum 30, pigeonpea7, chickpea 19, groundnut 6, finger millet 2, and1 each of pearl millet and barnyard millet)supplied from the ICRISAT genebank havebeen directly released as cultivars in 44countries (Figure 1). Pigeonpea germplasmaccession ICP 8863 collected from farmer’sfield in India was found very promising againstfusarium wilt and was purified for the trait. Thepurified line was found high yielding and it wasreleased for cultivation in 1986 as Maruthi inKarnataka state, India. This variety is also
37
grown on large hectarage in adjacent states,namely, Maharashtra and Andhra Pradesh(Bantilan and Joshi 1996).
A sorghum variety, Parbhani Moti wasreleased in Maharashtra, India, in 2002. Thisvariety is an excellent Maldandi-type[predominant postrainy (Rabi) sorghum landracein Maharashtra and Karnataka states of India)with large lustrous grains and high yield. Thiswas selected from a germplasm collection fromGhane Gaon, Sholapur, Maharashtra, made byICRISAT genebank staff during 1989.
Another example is the release of barnyardvariety (PRJ 1) in Uttranchal state during 2003.This variety yielded 45.4% higher grain yieldcompared to the check variety VL 29. It providessubstantial fodder yield as well. This variety is aselection from ICRISAT germplasm collectionIEC 542 that originated in Japan.
Present scenario of PGR utilizationMuch progress has been in developing
stable and high-yielding cultivars using diversegermplasm resources. This has resulted in areaincrease under some crops. During the last 40years, area under soybean increased by 250.9%;pigeonpea: 60.7%; groundnut: 47.9% and rice:22.4%. For other crops such as wheat andchickpea, area remained nearly unchanged.Productivity has improved considerably in mostof the crops (Table 1). However, in future, thereis much to be done to further improveproductivity of the crops to meet the foodrequirement of ever increasing population.
A glance of ICRISAT genebank serviceto researchers revealed that on an average,21,065 germplasm samples are supplied annuallyto users outside the ICRISAT (mean from 1974to 2005). According to Marshall (1989), thisfigure indicates satisfactory germplasmdistribution service of the genebank. However,the use of basic germplasm in breeding programsis scanty. For example, the summary of parentallines used in the ICRISAT groundnut-breeding
program at ICRISAT (1986-2002) revealed that986 unique parents were used in developing8279 breeding lines, but this included only 132unique germplasm accessions of groundnut and10 of wild Arachis species. The two most oftenused cultivars were Robut 33-1 (3096 times)and Chico (1180 times). In the ICRISATchickpea-breeding program (1978-2004),12,887 parents (586 unique parents) were usedin developing 3548 breeding lines, whichincluded only 91 unique germplasm accessionsof chickpea and five of wild Cicer species(Upadhyaya et al., 2006). The two mostfrequently used cultivars were L 550 (903times) and K 850 (851 times). The data analysisfrom the Indian chickpea research programrevealed that during 1967 - 2003, a total of 86varieties was developed through hybridizationthat traced back to 95 unique parents. The top10 parents contributed more than 35% to thegenetic base of the released varieties. Mostfrequently used parents were Pb 7, IP 58, F 8,Rabat and S 26. About 41% varieties developedhave Pb 7 as one of the parents in their pedigree(Kumar et al., 2004). There are similar reportsfrom China (Jiang and Duan, 1998), and theUSA (Knauft and Gorbet, 1989) in groundnut.
Strategies to enhance germplasmutilization
Assessment of diversity in thegermplasm collection
The germplasm characterization andassessment of diversity is important to plantbreeders for crop improvement and to genebankcurators for efficient and effectivemanagement of their collection.
The chickpea germplasm collection(16,820 accessions) was characterized forseven morphological and 13 agronomic traitsand reaction to fusarium wilt to determinephenotypic variation in different geographicalregions. The means for different agronomictraits differed significantly between regions.
Second National Plant Breeding Congress 2006 Plant Breeding in Post Genomics Era
38
Second National Plant Breeding Congress 2006 Plant Breeding in Post Genomics Era
The variances for all the traits among regionswere heterogeneous. South Asia regioncontained the largest range of variation for allthe traits. The Shannon-Weaver (Shannon andWeaver, 1949) diversity index (H‘) was variablein different regions for different traits. Analysisrevealed the need to secure more germplasmcollections from Mediterranean countries andEthiopia. Cluster analysis delineated two regionalclusters consisting Africa and South andSoutheast Asia in the first cluster; and theAmericas, Europe, West Asia, Mediterraneanand East Asia in the second cluster (Upadhyaya,2003) (Figure 2). An earlier study of chickpeagermplasm data at ICRISAT (Pundir et al.,1988) revealed that in general, Indian accessionswere highest yielding and the accessions fromChile had higher plant height and greater seedmass. The accessions from Spain and Syria hadlonger flowering duration and the accessionsfrom Greece and Russia had erect growth habit.Resistance to fusarium wilt was more commonin accessions from Bangladesh than from othercountries.
The groundnut germplasm collection (13,342accessions) was characterized for 16morphological and 10 agronomic traits in twoseasons to determine the phenotypic variation indifferent geographical regions. The means fordifferent agronomic traits differed significantlyamong regions. The variances for all the traitsamong regions were heterogeneous. SouthAmerica, which showed 100% range variationfor 12 of the 16 morphological traits, also revealedhighest range variation. From South Americaamong regions, primary seed color amongmorphological traits and leaflet length amongagronomic traits showed highest pooled H‘.Three of the six botanical varieties, aequatoriana,hirsuta, and peruviana were poorly representedindicating the need to be collected. PCA using38 traits and clustering on first seven PC scoresdelineated three regional clusters; consistingNorth America, Middle East, and East Asia in
the first Cluster, South America in the secondcluster, and West Africa, Europe, CentralAfrica, South Asia, Oceania, Southern Africa,Eastern Africa in second cluster and Southeastand Central Asia and the Caribbean in the thirdcluster (Upadhyaya et al., 2002b) (Figure 3).
The pigeonpea germplasm collection (11,402accessions from 54 countries grouped into 11regions) was analyzed for patterns of variationfor 14 qualitative and 12 quantitative traits.Semi-spreading growth habit, green stem color,indeterminate flowering pattern, and yellowflower color were predominant amongqualitative traits. Primary seed color hadmaximum variability and orange color, followedby cream were the two most frequent seedcolors in the collection. Variances for all thetraits were heterogeneous among regions. Thegermplasm accessions from Oceania wereconspicuous by short growth duration, shortheight, fewer branches, pods with fewer seeds,smaller seed size, and lower seed yields. Theaccessions from Africa were of longerduration, taller, with multiseeded pods, andlarger seeds. The germplasm diversity, indicatedby H‘ pooled over all traits, was highest forAfrica and lowest for Oceania. The clusteranalysis delineated three clusters: cluster 1includes accessions from Oceania; cluster 2from India and adjacent countries, and cluster3 from Indonesia, Thailand, The Philippines,Europe, Africa, America and the Caribbeancountries. Pigeonpea-rich countries such asMyanmar, Uganda, and others like Bahamas,Burundi, Comoros, Haiti, and Panama are notadequately represented in the collection, andneed priority attention for germplasmexploration (Upadhyaya et al., 2005c).
Developing core collectionsOne of the reasons that plant breeders are
using less basic germplasm in research is thelack of information on traits of economicimportance, which often shows high genotypex environment interactions and requires
39
replicated multilocational evaluations. Evaluationis very costly and resource-demanding taskowing to the large size of the germplasmcollections. To overcome this, our research nowfocuses on studying the diversity of germplasmcollection and developing “core collections,”which are about 10% of the entire collection,but represent almost full diversity of the species.From the germplasm collection in the ICRISATgenebank, we have already developed corecollection of sorghum (2,247 accessions, Grenieret al., 2001); pearl millet (1,600 accessions,Bhattacharjee, 2000); chickpea (1,956accessions, Upadhyaya et al., 2001a); groundnut(1,704 accessions, Upadhyaya et al., 2003);groundnut Asia core (504 accessions,Upadhyaya et al. 2001c); pigeonpea (1,290accessions, Reddy et al., 2005); finger millet (622accessions, Upadhyaya et al., 2005a) and foxtailmillet (155 accessions, Upadhyaya – unpublisheddata) (Table 6).
Developing mini-core collectionWhen the size of the entire collection is very
large, even a core collection size becomesunwieldy for evaluation by breeders. Toovercome this, ICRISAT scientists developed aseminal two-stage strategy to develop a mini-core collection, which consists of 10%accessions in the core collection (and hence only1% of the entire collection) (Upadhyaya andOrtiz, 2001). This mini-core collection stillrepresents the diversity of the entire corecollection. The first stage involves developing arepresentative core collection (about 10%) fromthe entire collection using all the availableinformation on origin, geographical distribution,and characterization and evaluation data ofaccessions. The second stage involves evaluationof the core collection for various morphological,agronomic, and quality traits, and selecting afurther subset of about 10% accessions fromthe core collection. At both stages standardclustering procedures should be used to formgroups (clusters) of similar accessions and then
select desired number of accessions from eachcluster. At ICRISAT, we have alreadydeveloped mini-core collections of chickpeaconsisting of 211 accessions (Upadhyaya andOrtiz, 2001), groundnut (184 accessions)(Upadhyaya et al., 2002a), pigeonpea (146accessions), and finger millet (65 accessions)(Upadhyaya – unpublished data) (Table 6).
Developing composite collectionThe revolution in molecular biology,
bioinformatics, and information technology hasprovided the scientific community withtremendous opportunities for solving some ofthe world’s most serious agricultural and foodsecurity issues, and has led to the formation ofGeneration Challenge Program (GCP) entitled“Unlocking Genetic Diversity in Crops for theResource-Poor ( www.generationcp.org)”. The
GCP is designed to utilize molecular tools andcomparative biology to explore and exploit thevaluable genetic diversity existing in germplasmcollections held at the CGIAR and NARSgenebanks, with particular focus on droughttolerance. In recent years, several studiesconducted on plants have detected DNAmarkers associated with ecology, geography,disease resistance, and quantitative traits(Thornsberry et al., 2001; Turpeinen et al.,2001; Ivandic et al., 2002, 2003; Russel et al.,2003; Sun et al., 2001, 2003; Gebhardt et al.,2004; Sabharwal et al., 2004; and Amirul Islamet al. 2004) demonstrating that it is a viablealternative to classical QTL analyses, whichwere time taking and costly measurements.
ICRISAT and collaborating institutes haveconstituted composite collections of chickpea(Upadhyaya et al., 2006a) and sorghum (3000accessions each) and groundnut, pigeonpea,finger millet (1000 accessions each) (Table 7)that contain maximum diversity known in thespecies, accessions with economic traits andsome representation of the related wild species.The composite collections will be genotypedusing SSR markers. The data generated will
Second National Plant Breeding Congress 2006 Plant Breeding in Post Genomics Era
40
Second National Plant Breeding Congress 2006 Plant Breeding in Post Genomics Era
be used to define the genetic structure of thecollection for functional and comparativegenomics. The analysis of genetic diversity willhelp to elucidate population structures thatinfluence the analysis of the associationsbetween molecular markers and themorphological or reaction traits. Using allavailable information, about 10% accessions willbe selected containing maximum diversity andthose could be used in the breeding programs.
Identification of new sources for traits ofeconomic importance for use in cropimprovement program
Due to the reduced size, the core collectioncan be evaluated extensively to identify the usefulparents for crop improvement. By evaluatingcore collection of chickpea, we identified newsources of important traits, namely, early maturity(28 accessions), large seeded kabuli (16accessions) and high-yielding (39 accessions)types. The clustering of 28 early maturingaccessions along with four controls revealedthree clusters. Cluster-1 was formed of fiveentries including three controls (ICCVs 2, 96029and Harigantars). Cluster-2 was formed of 14entries including control Annigeri. Thirteenentries constituted cluster-3 and no controlamong them. It can be presumed that these 13accessions are more distant from controls thanother accessions (Figure 4). The phenotypicdiversity index was highest between ICC 14648and ICCV 96029, compared to the other entrypairs. Such information has high value tochickpea breeders.
The evaluation of groundnut core collectionresulted in identification of 21 accessions withearly maturity (Upadhyaya et al., 2005c). Thecluster analysis done on these 21 accessions andthree controls revealed three clusters. Cluster-1comprised of four entries including two controls(Gangapuri and Chico). Cluster-2 contained 13entries including one control (JL-24). Seven testaccessions formed cluster-3 and theseaccessions are more distinct from the three
controls used in this study (Figure 5). In thegroundnut core, 158 accessions had lowtemperature tolerance at germination(Upadhyaya et al., 2001b). Also found were15 Valencia, 20 Spanish, and 25 Virginia typegermplasm lines in groundnut with high yield,good shelling percentage and 100-seed weightthrough multilocational evaluation of the ‘Asiaregion core collection’ (Upadhyaya et al.,2005b). These new sources performed betterthan or similar to the best control cultivars forparticular trait (s), but were diverse from them.Holbrook et al. (1997) achieved similarlythrough examining all accessions in thegroundnut core collection (Holbrook et al.,1993) for resistance to the groundnut root-knotnematode (Meloidogyne arenaria (Neal) race1) and resistance to pre-harvest aflatoxincontamination (PAC) (Holbrook, 1998) whileFranke et al. (1999) later did similarly forresistance to Rhizoctonia limb rot (Rhizoctoniasolani Kuhn AG-4).
The mini-core collections of chickpea andgroundnut have been evaluated and diversesources of useful traits were identified. Fromthe chickpea mini-core, 18 accessions havingtraits related to drought tolerance (Kashiwagiet al., 2005) and 29 accessions tolerant to soilsalinity (Serraj et al., 2004) have been identified.Similarly, Pande et al. (2006) screened the mini-core collection for resistance to various diseasesand identified 67 accessions resistant/highlyresistant to fusarium wilt, moderate resistanceto ascochyta blight in 3 accessions, botrytis greymold in 55 accessions, and to dry root rot in 6accessions. Some accessions also with multipleresistances were identified. The evaluation ofgroundnut mini-core resulted in identification of18 diverse accessions with high water useefficiency (Upadhyaya, 2005). The evaluationof chickpea mini-core at the Indian Institute ofPulses Research (IIPR), Kanpur, India during2002 to 2004 seasons revealed 12 verypromising accessions. Of these six accessions
41
were involved in hybridization to develop largeseeded kabuli cultivars. The evaluation ofgroundnut mini-core in Thailand (2004-05)indicated ten accessions high-yielding. Thegroundnut mini-core evaluation in China during2005 resulted in identification of 14 accessionshighly resistant to bacterial wilt, six with high oilcontent and four with high Oleic and low Linoleicacid. Three accessions had highest Oleic:Linoleic acid ratio.
Molecular characterization of germplasmCharacterization of germplasm with molecular
markers can help improve their utilization. It canform the basis for mining and cloning of genesof agronomically important traits.
Genotyping chickpea accessionsA total of 288 chickpea accessions including
211 mini-core subset accessions consisting of75% desi type (Upadhyaya and Ortiz, 2001), 57accessions of kabuli chickpea, and 20 accessionsof wild Cicer species from ICARDA weregenotyped using 40 SSR markers. The resultsindicated that the chickpea mini-core developedat ICRISAT was allelically more diverse thanthe germplasm from ICARDA. The accessionsfrom ICARDA consisted of more heterozygousindividuals compared with mini-core accessions.The dendogram constructed based on sharedallele distance using unweighted pair group meanaverage (UPGMA) method indicated two maingroups: one consisting mainly of accessions fromthe Indian subcontinent and the other group ofaccessions from Mediterranean, Middle-Eastand Ethiopia. The accessions of wild species (C.reticulatum and C. echinospermum) formedtwo groups of their own flanking two ends ofthe chickpea accessions (Upadhyaya et al.,2006b).
Validating the chickpea mini corecollection:
Discriminant function analysis was used todetermine the level of congruence between thegenotypic data set and the 28 phenotypic clusters
of the chickpea mini-core (Upadhyaya andOrtiz, 2001) based on morphological andagronomic traits. For DFA analysis, genotypicdata from 210 accessions screened with 40 SSRmarkers was used. Overall most individualswere assigned with a high degree of confidenceto the original (phenotypic) clusters from whichaccessions constituting mini core collection wereselected. Only 27% of the individuals were re-assigned into new clusters according togenotypic data, which were mainly identifiedwithin clusters 4, 6, and 7 of the mini-core(ICRISAT, 2004). This confirmed that thechickpea mini core was well selected.
Genotyping chickpea accessions ofvarying maturity duration
Sixty-two chickpea germplasm accessions (50early-, 6 medium- and 6 late-maturing) wereanalyzed with 37 SSR markers. A total of 673alleles were found. The number of alleles permarker varied from 4 to 28 with an average of18. The polymorphic information content (PIC)values ranged from 0.53 to 0.94 with an averageof 0.85. Mean heterozygosity was low (0.0276).The principal component analysis (PCA) plotof Rogers’s distance indicated three distinctclusters (ICRISAT, 2004).
Genotyping groundnut accessionsIn groundnut, 26-accessions were analyzed
with random amplified polymorphic DNA(RAPD) assays. The genetic similarity (Sij)ranged from 59.0 to 98.8% with an average of86.2%. Both multidimensional scaling andunweighted pair-group method with arithmeticaverages (UPGMA) dendograms revealed theexistence of five distinct clusters. Someaccessions with diverse DNA profiles (ICGs1448, 7101, and 1471, and ICGVs 99006 and99014) were identified for mapping and geneticenhancement in groundnut (Dwivedi et al.,2001). Molecular marker based diversityestimates are useful to select diverse lines fordeveloping populations that may be used for
Second National Plant Breeding Congress 2006 Plant Breeding in Post Genomics Era
42
Second National Plant Breeding Congress 2006 Plant Breeding in Post Genomics Era
mapping studies to identify DNA markers linkedwith resistance to rosette disease in groundnut.Nine amplified fragment length polymorphism(AFLP) using primer pairs were performed onnine rosette resistant and one susceptibleaccessions. Across the 10 accessions, the nineprimer pairs identified 94 unique markers, withan average of 10.4 markers per primer pair. Thegenetic dissimilarity (Dij) values ranged from 3.92to 50.53% with an average of 19.56%.Groundnut accessions, namely, ICG 11044 withICGs 3436, 9558 and 11968 showed greatergenetic diversity (36.59 to 50.53%) amongst thenine rosette resistant accessions used. Theseaccessions possess high levels of resistance torosette, average d”2% compared to e”90%infection in susceptible control ICG 7827 acrossfour seasons’ evaluation at Lilongwe, Malawi.These accessions therefore could be inter-crossed among themselves to produce diversifiedrosette resistant breeding populations (Dwivediet al., 2003).
ConclusionCrop genetic resources have contributed
enormously towards sustainability of agricultureand alleviation of poverty. These are beingassembled and conserved at several genebanksfor future use. Using raw germplasm resources,a large number of crop varieties and hybridshave been developed and released for cultivation.New strategies on core and mini-core collectionswere developed to enhance the precision ofgermplasm characterization and reducing coston germplasm regeneration and conservation.Composite sets of ICRISAT mandate crops arebeing developed under the Generation ChallengeProgram. Phenotypic and genotypiccharacterization of these sets will provide vastscope of identifying useful and unique germplasmresources for utilization in crop improvement.Molecular characterization of the germplasm ofagronomic importance has been pursued forvalue addition and to enhance their utilization.
REFERENCESAmirul Islam, F.M., Beebe, S., Munoz, M.,
Tohme, J., Redden, R.J. and Basford, K.E.2004. Using molecular markers to assessthe effect of introgression on quantitativeattributes of common bean in the Andeangene pool. Theoretical and AppliedGenetics 108:243-252.
Bantilan, M.C.S. and Joshi, P.K. 1996. Adoptionand impact pigeonpea ICP 8863. Pages 36-39. in Partners in impact assessment:summary proceedings of an ICRISAT/NARS workshop on methods and jointimpact targets in Western and CentralAfrica, 3-5 May 1995, Sadore, Niger.ICRISAT, Patancheru, 502 324, India. 116pp.
Bhattacharjee, R. 2000. Studies on theestablishment of a core collection of pearlmillet (Pennisetum glaucum). Ph. D.Thesis, CCS Haryana AgriculturalUniversity, Hisar – 125 004, India. 162 pp.
Dashiell, K. and Fatokun, C. 1997. Soybean.Pages 181-190 in Fuccillo D, Sears L andStapleton P (eds.). Biodiversity in Trust.Cambridge University Press, Cambidge,UK
Dwivedi, S.L., Gurtu, S., Chandra, S.,Upadhyaya, H.D. and Nigam, S.N. 2003.AFLP Diversity among selected rosetteresistant groundnut germplasm.International Arachis Newsletter 23: 21-23.
Dwivedi, S.L., Gurtu, S., Chandra, S., Yuejin,W. and Nigam, S.N. 2001. Assessment ofgenetic diversity among selected groundnutgermplasm. I: RAPD analysis. PlantBreeding 120: 345-349.
FAO. 1998. The state of ex-situ conservation.Page 90 in The state of the world’s plantgenetic resources for food and agriculture.Rome, Italy: FAO.
Franke, M.D., Brenneman, T.B. and Holbrook,43
C.C. 1999. Identification of resistance toRhizoctonia limb rot in a core collection ofpeanut germplasm. Plant Dis. 83: 944-948.
Gebhardt, C., Ballvora, A., Walkemeier, B.,Oberhagemann, P. and Schuler, K. 2004.Assessing genetic potential in germplasmcollections of crop plants by marker-traitassociation: a case study for potatoes withquantitative variation of resistance to lateblight and maturity type. MolecularBreeding 13: 93-102.
Grenier, C., Bramel, P.J. and Hamon, P. 2001.Core collection of the genetic resources ofsorghum: 1. Stratification based on eco-geographical data. Crop Science 41: 234–240.
Holbrook, C.C., Anderson, W.F. and Pittman,R.N. 1993. Selection of a core collectionfrom the U.S. germplasm collection ofpeanut. Crop Science 33: 859-861.
Holbrook, C.C., Stephenson, M.G. and Johnson,A.W. 1997. Level and geographicaldistribution of resistance to Meloidogynearenaria in the germplasm collection ofpeanut. Agron. Abstr.:157.
Holbrook, C.C., Wilson, D.W. and Matheron,M.E. 1998. Sources of resistance to pre-harvest aflatoxin contamination in peanut.Proceedings of the American PeanutResearch & Education Society 30:21.
ICRISAT (International Crops ResearchInstitute for the Semi-Arid Tropics). 1989.Collaboration on Genetic Resources:summary proceedings of a joint ICRISAT/NBPGR (ICAR) workshop on germplasmexploration and evaluation in India, 14–15Nov 1988, ICRISAT, Patancheru, India.Patancheru 502 324, Andhra Pradesh, India:International Crops Research Institute forthe Semi-Arid Tropics.
ICRISAT (International Crops ResearchInstitute for the Semi-Arid Tropics). 2004.Harnessing Biotechnology for the Poor –
Archival Report 2004. Patancheru, India:ICRISAT.
Ivandic, V., Hackett, C.A., Nevo, E., Keith, R.,Thomas, W.T.B. and Forster, B.P. 2002.Analysis of simple sequence repeats(SSRs) in wild barley from the FertileCrescent: associations with ecology,geography and flowering time. PlantMolecular Biology 48:511-527.
Ivandic, V., Thomas, W.T.B., Nevo, E., Zhang,Z. and Forster BP. 2003. Association ofsimple sequence repeats with quantitativetrait variation including biotic and abioticstress tolerance in Hordeum spontaneum.Plant Breeding 122:300-304.
Jiang, H.F. and Duan, N.X. 1998. Utilization ofgroundnut germplasm resources inbreeding programme. Crop GeneticResources 2:24-25.
Kashiwagi, J., Krishnamurthy, L., Upadhyaya,H,D,, Krishna, H., Chandra, S., VincentVadez. and Serraj, R. 2005. Geneticvariability of drought-avoidance root traitsin the mini-core germplasm collection ofchickpea (Cicer arietinum L.). Euphytica146: 213-222.
Knauft, D.A. and Gorbet, D.W. 1989. Geneticdiversity among peanut cultivars. CropScience 29:1417-1422.
Kumar, S., Gupta, S., Chandra, S. and Singh,B.B. 2004. How wide is the genetic baseof pulse crops? In: Ali M, Singh BB, KumarS and Dhar V (eds.). Pulses in newperspective. Indian Society of PulsesResearch and Development, IIPR, Kanpur,India. pp. 211-221.
Marshall, D.R. 1989. Limitations to the use ofgermplasm collections. In: Brown AHD,Frankel OH, Marshall DR and Williams JT(eds.). The use of plant genetic resourcesCambridge Univ. Press, New York, pp.105-120.
Second National Plant Breeding Congress 2006 Plant Breeding in Post Genomics Era
44
Second National Plant Breeding Congress 2006 Plant Breeding in Post Genomics Era
Mathur, P.N., Prasada Rao, K.E., Singh, I.P.,Agrawal, R.C., Mengesha, M.H., and Rana,R.S. 1992. Evaluation of Forage SorghumGermplasm, Part-2: NBPGR-ICRISATCollaborative Programme. NBPGR, NewDelhi, India. 296 pp.
Mathur, P.N., Prasada Rao, K.E., Thomas, T.A.,Mengesha, M.H., Sapra, R.L. and Rana,R.S. 1991. Evaluation of Forage SorghumGermplasm, Part-1: NBPGR-ICRISATCollaborative Programme. NBPGR, NewDelhi, India. 269 pp.
Mathur, P.N., Pundir, R.P.S., Patel, D.P., Rana,R.S. and Mengesha, M.H. 1993a. Evaluationof Chickpea Germplasm, Part-1: NBPGR-ICRISAT Collaborative Programme.NBPGR, New Delhi, India. 194 pp.
Mathur, P.N., Rao, S.A., Agrawal, R.C.,Mengesha, M.H. and Rana, R.S. 1993b.Evaluation of Pearl Millet Germplasm, Part-1: NBPGR-ICRISAT CollaborativeProgramme. NBPGR, New Delhi, India. 200pp.
Mathur, P.N., Rao, S.A., Sapra, R.L.,Mengesha, M.H., and Rana, R.S. 1993c.Evaluation of Pearl millet Germplasm, Part-2: NBPGR-ICRISAT CollaborativeProgramme. NBPGR, New Delhi, India. 215pp.
Pande, S., Kishore, G.K., Upadhyaya, H.D.and Raom, J.N. 2006. Identification ofsources of multiple fungal diseasesresistance using mini-core collection inchickpea. Plant Disease (in press).
Pundir, R.P.S., Reddy, K.N. and Mengesha,M.H. 1988. ICRISAT Chickpea GermplasmCatalog: Evaluation and Analysis.Patancheru, A. P. 503 324, India:International Crops Research Institute forthe Semi-Arid Tropics. 94 pp.
Rao, N.K. and Bramel, P.J. 2000. Manual ofGenebank Operations and Procedures.Technical Manual no. 6. Patancheru, A. P.
502 324, India: International CropsResearch Institute for the Semi-AridTropics. 190 pp.
Reddy, L.J., Upadhyaya, H.D., Gowda, C.L.L.and Sube Singh. 2005. Development of corecollection in pigeonpea (Cajanus cajan (L)Millsp. Genetic Resources and CropEvolution. 52:1049-1056.
Remanandan, P., Sastry, D.V.S.S.R. andMengesha, M.H. 1988. ICRISATPigeonpea Germplasm Catalog: Evaluationand Analysis. Patancheru, A P 502 324,India: International Crops ResearchInstitute for the Semi-Arid Tropics. 89 pp.
Remanandan, P. and Singh, L. 1997. Pigeonpea.Pages 156-167. in Fuccillo D, Sears L andStapleton P (eds.). Biodiversity in Trust.Cambridge University Press, Cambidge,UK.
Russel, J.R., Booth, A., Fuller, J.D., Baum ,M.,Ceccarelli, S., Grando, S. and Powel, W.2003. Patterns of polymorphism detectedin the chloroplast and nuclear genomes ofbarley landraces sampled from Syria andJordan. Theoretical and Applied Genetics107: 413-421.
Sabharwal, V., Negi, M.S., Banga, S.S. andLakshmikumaran, M. 2004. Mapping ofAFLP markers linked to seed coat colorloci in Brassica juncea (L) Czern.Theoretical and Applied Genetics 109:160-166.
Serraj, R., Krishnamurthy, L. and Upadhyaya,H.D. 2004. Screening of chickpea mini-core germplasm for tolerance to soil salinity.International Chickpea and PigeonpeaNewsletter
Shannon, C.E. and Weaver, W.1949. Themathematical theory of Communication.Univ. Illinois Press, Urbana.
Singh, A.K. and Nigam, S.N. 1997. Groundnut.Pages 114-127. in Fuccillo D, Sears L and
45
Stapleton P (eds.). Biodiversity in Trust.Cambridge University Press, Cambidge,UK.
Singh, K.B., Pundir, R.P.S., Robertson, L.D., vanRheenen, H.A., Singh, U., Kelley, T.J.,Parthasarthy Rao, P., Johansen, C. andSaxena, N.P. 1997. Chickpea. Pages 100-113. in Fuccillo D, Sears L and Stapleton P(eds.). Biodiversity in Trust. CambridgeUniversity Press, Cambidge, UK.
Sun, G.L., William ,M., Liu, J., Kasha, K.J. andPauls. K.P. 2001. Microsatellites and RAPDpolymorphisms in Ontario corn hybrids arerelated to the commercial sources andmaturity ratings. Molecular Breeding 7:13-24.
Sun, G., Bong, M., Nass, H., Martin, R. and Dong,Z. 2003. RAPD polymorphism in springwheat cultivars and lines with different levelof Fusarium resistance. Theoretical andApplied Genetics 106:1059-1067.
Thornsberry, J.M., Goodman, M.M., Doebley,J., Kresovitch, S., Neilsen, D. and Buckler,I.V. E.S. 2001. Dwarf 8 polymorphismassociate with variation in flowering time.Nature Genetics 28:286-289.
Turpenien, T., Tenhola, T., Manninen, O., Nevo,E. and Nissila, E. 2001. Microsatellitediversity associated with ecological factorsin Hordeum spontaneum populations inIsrael. Molecular Ecology 10:1577-1591.
Upadhyaya, H.D. and Ortiz, R. 2001. A minicore subset for capturing diversity andpromoting utilization of chickpea geneticresources. Theoretical and AppliedGenetics 102: 1292–1298.
Upadhyaya, H.D., Bramel ,P.J. and Sube Singh.2001a. Development of a chickpea coresubset using geographic distribution andquantitative traits. Crop Science 41:206–210.
Upadhyaya, H.D., Nigam, S.N. and Sube Singh.2001b. Evaluation of groundnut core
collections to identify sources of toleranceto low temperature at germination. IndianJ. Plant Genet. Resources 14:165-167.
Upadhyaya, H.D., Ortiz, R., Bramel, P.J., andSube Singh. 2001c. Development ofgroundnut core collection from Asia region.Hundered years of post Mendeliangenetics and plant breeding – retrospectand prospects, 6-9 November 2001, IARI,New Delhi
Upadhyaya, H.D., Bramel, P.J., Ortiz, R. andSube Singh. 2002a. Developing a mini coreof peanut for utilization of geneticresources. Crop Science 42:2150–2156.
Upadhyaya, H.D., Bramel, P.J., Ortiz, R. andSube Singh. 2002b. Geographical patternsof diversity for morphological andagronomic traits in the groundnutgermplasm collection. Euphytica 128:191-204.
Upadhyaya, H.D. 2003. Geographical patternsof variation for morphological andagronomic characteristics in the chickpeagermplasm collection. Euphytica 132:343-352.
Upadhayaya ,H.D., Ortiz, R., Bramel, P.J. andSube Singh, 2003. Development of agroundnut core collection usingtaxonomical, geographical andmorphological descriptors. GeneticResources and Crop Evaluation 50:139-148.
Upadhyaya, H.D. 2005. Variability for droughtresistance related traits in the mini-corecollection of peanut. Crop Science 45:1432-1440.
Upadhyaya, H.D., Gowda, C.L.L. , Pundir,R.P.S., Gopal Reddy, V., and Sube Singh.2005a. Development of core subset offinger millet germplasm using geographicorigin and data on 14 morpho-agronomictraits. Genetic Resources and CropEvolution (in press).
Second National Plant Breeding Congress 2006 Plant Breeding in Post Genomics Era
46
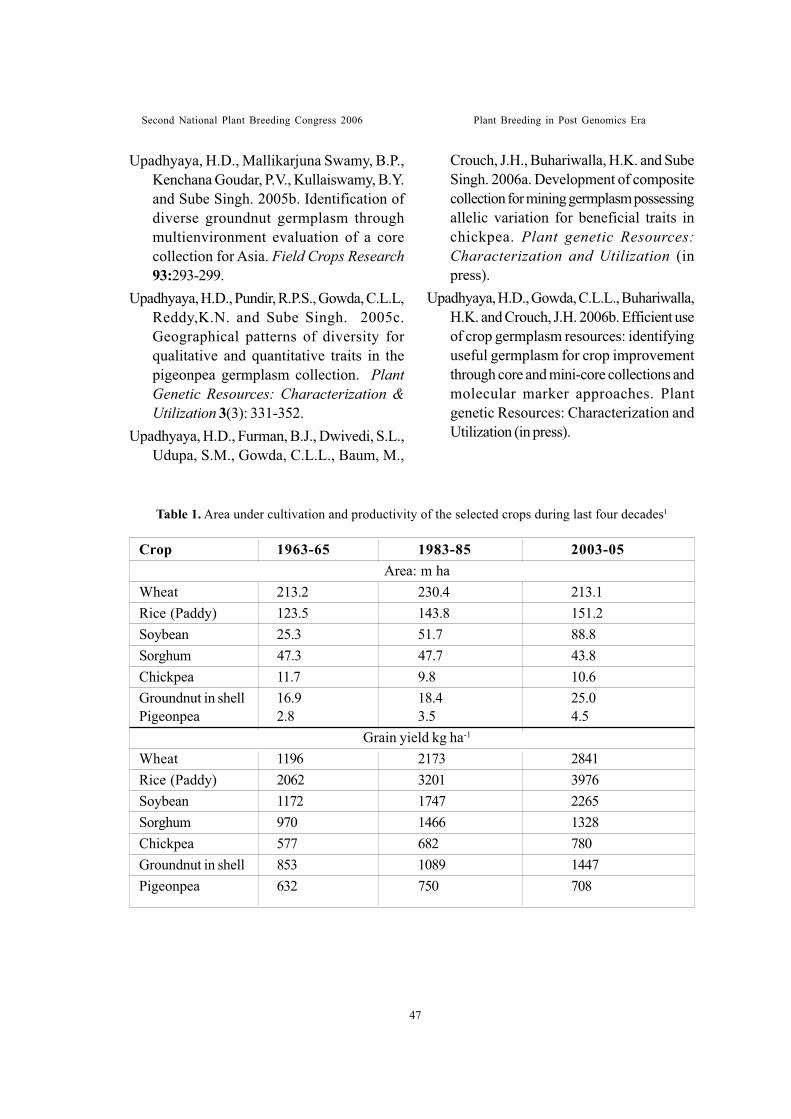
Second National Plant Breeding Congress 2006 Plant Breeding in Post Genomics Era
Table 1. Area under cultivation and productivity of the selected crops during last four decades1
Upadhyaya, H.D., Mallikarjuna Swamy, B.P.,Kenchana Goudar, P.V., Kullaiswamy, B.Y.and Sube Singh. 2005b. Identification ofdiverse groundnut germplasm throughmultienvironment evaluation of a corecollection for Asia. Field Crops Research93:293-299.
Upadhyaya, H.D., Pundir, R.P.S., Gowda, C.L.L,Reddy,K.N. and Sube Singh. 2005c.Geographical patterns of diversity forqualitative and quantitative traits in thepigeonpea germplasm collection. PlantGenetic Resources: Characterization &Utilization 3(3): 331-352.
Upadhyaya, H.D., Furman, B.J., Dwivedi, S.L.,Udupa, S.M., Gowda, C.L.L., Baum, M.,
Crouch, J.H., Buhariwalla, H.K. and SubeSingh. 2006a. Development of compositecollection for mining germplasm possessingallelic variation for beneficial traits inchickpea. Plant genetic Resources:Characterization and Utilization (inpress).
Upadhyaya, H.D., Gowda, C.L.L., Buhariwalla,H.K. and Crouch, J.H. 2006b. Efficient useof crop germplasm resources: identifyinguseful germplasm for crop improvementthrough core and mini-core collections andmolecular marker approaches. Plantgenetic Resources: Characterization andUtilization (in press).
Crop 1963-65 1983-85 2003-05Area: m ha
Wheat 213.2 230.4 213.1Rice (Paddy) 123.5 143.8 151.2Soybean 25.3 51.7 88.8Sorghum 47.3 47.7 43.8Chickpea 11.7 9.8 10.6Groundnut in shell 16.9 18.4 25.0Pigeonpea 2.8 3.5 4.5
Grain yield kg ha-1
Wheat 1196 2173 2841Rice (Paddy) 2062 3201 3976Soybean 1172 1747 2265Sorghum 970 1466 1328Chickpea 577 682 780Groundnut in shell 853 1089 1447Pigeonpea 632 750 708
47
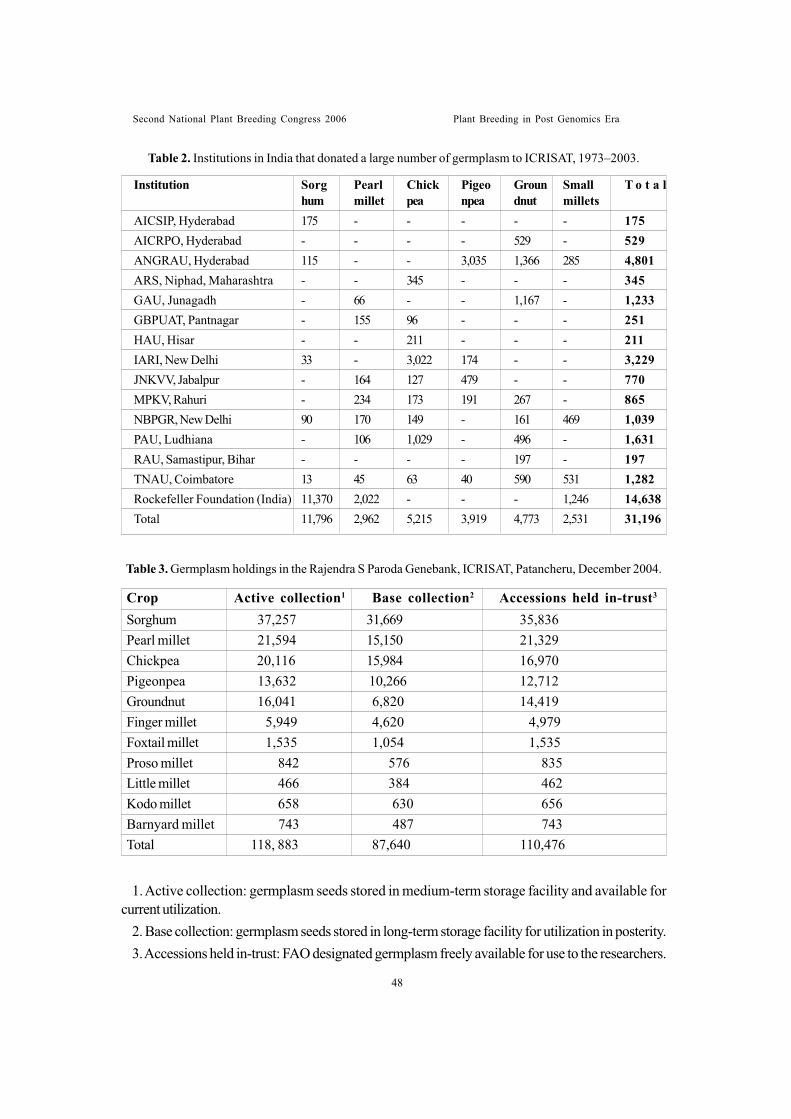
1. Active collection: germplasm seeds stored in medium-term storage facility and available forcurrent utilization.
2. Base collection: germplasm seeds stored in long-term storage facility for utilization in posterity.3. Accessions held in-trust: FAO designated germplasm freely available for use to the researchers.
Second National Plant Breeding Congress 2006 Plant Breeding in Post Genomics Era
Table 2. Institutions in India that donated a large number of germplasm to ICRISAT, 1973–2003.
Institution Sorg Pearl Chick Pigeo Groun Small T o t a lhum millet pea npea dnut millets
AICSIP, Hyderabad 175 - - - - - 175AICRPO, Hyderabad - - - - 529 - 529ANGRAU, Hyderabad 115 - - 3,035 1,366 285 4,801ARS, Niphad, Maharashtra - - 345 - - - 345GAU, Junagadh - 66 - - 1,167 - 1,233GBPUAT, Pantnagar - 155 96 - - - 251HAU, Hisar - - 211 - - - 211IARI, New Delhi 33 - 3,022 174 - - 3,229JNKVV, Jabalpur - 164 127 479 - - 770MPKV, Rahuri - 234 173 191 267 - 865NBPGR, New Delhi 90 170 149 - 161 469 1,039PAU, Ludhiana - 106 1,029 - 496 - 1,631RAU, Samastipur, Bihar - - - - 197 - 197TNAU, Coimbatore 13 45 63 40 590 531 1,282Rockefeller Foundation (India) 11,370 2,022 - - - 1,246 14,638Total 11,796 2,962 5,215 3,919 4,773 2,531 31,196
Sorghum 37,257 31,669 35,836Pearl millet 21,594 15,150 21,329Chickpea 20,116 15,984 16,970Pigeonpea 13,632 10,266 12,712Groundnut 16,041 6,820 14,419Finger millet 5,949 4,620 4,979Foxtail millet 1,535 1,054 1,535Proso millet 842 576 835Little millet 466 384 462Kodo millet 658 630 656Barnyard millet 743 487 743Total 118, 883 87,640 110,476
Table 3. Germplasm holdings in the Rajendra S Paroda Genebank, ICRISAT, Patancheru, December 2004.
Crop Active collection1 Base collection2 Accessions held in-trust3
48
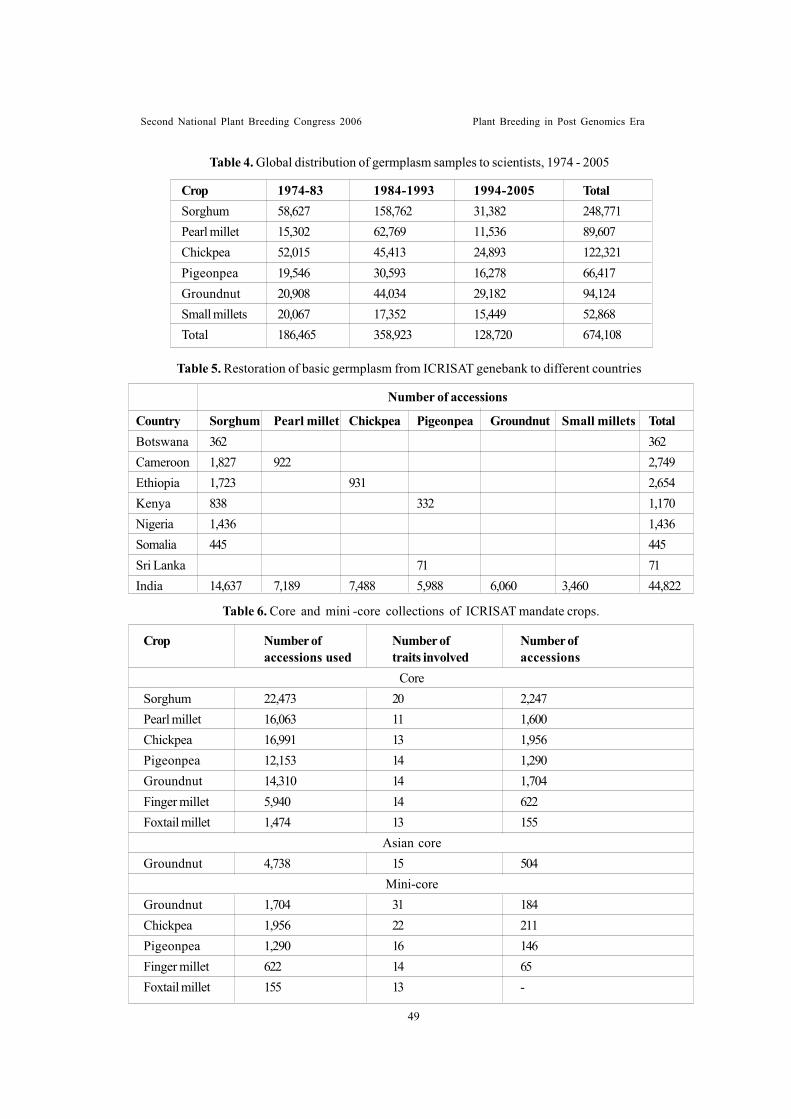
Second National Plant Breeding Congress 2006 Plant Breeding in Post Genomics Era
Crop 1974-83 1984-1993 1994-2005 TotalSorghum 58,627 158,762 31,382 248,771Pearl millet 15,302 62,769 11,536 89,607Chickpea 52,015 45,413 24,893 122,321Pigeonpea 19,546 30,593 16,278 66,417Groundnut 20,908 44,034 29,182 94,124Small millets 20,067 17,352 15,449 52,868Total 186,465 358,923 128,720 674,108
Table 4. Global distribution of germplasm samples to scientists, 1974 - 2005
Table 5. Restoration of basic germplasm from ICRISAT genebank to different countries
Country Sorghum Pearl millet Chickpea Pigeonpea Groundnut Small millets TotalBotswana 362 362Cameroon 1,827 922 2,749Ethiopia 1,723 931 2,654Kenya 838 332 1,170Nigeria 1,436 1,436Somalia 445 445Sri Lanka 71 71India 14,637 7,189 7,488 5,988 6,060 3,460 44,822
Number of accessions
Crop Number of Number of Number ofaccessions used traits involved accessions
CoreSorghum 22,473 20 2,247Pearl millet 16,063 11 1,600Chickpea 16,991 13 1,956Pigeonpea 12,153 14 1,290Groundnut 14,310 14 1,704Finger millet 5,940 14 622Foxtail millet 1,474 13 155
Asian coreGroundnut 4,738 15 504
Mini-coreGroundnut 1,704 31 184Chickpea 1,956 22 211Pigeonpea 1,290 16 146Finger millet 622 14 65Foxtail millet 155 13 -
Table 6. Core and mini -core collections of ICRISAT mandate crops.
49
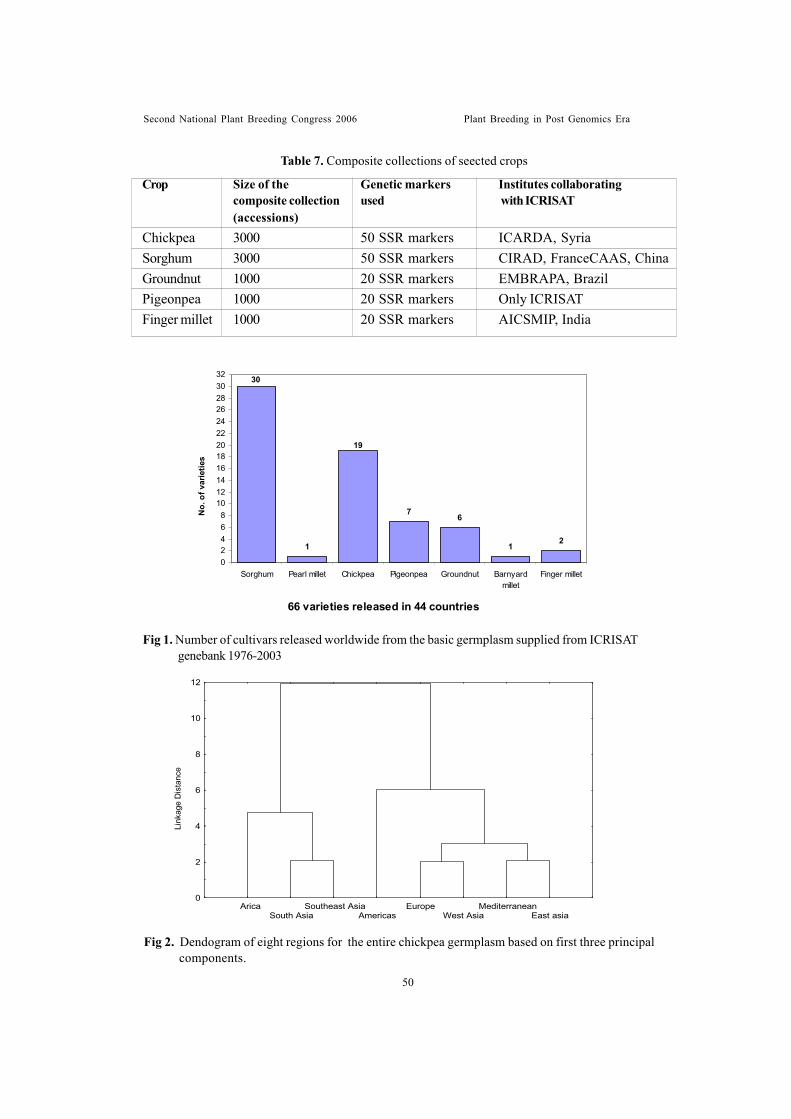
Crop Size of the Genetic markers Institutes collaboratingcomposite collection used with ICRISAT(accessions)
Chickpea 3000 50 SSR markers ICARDA, SyriaSorghum 3000 50 SSR markers CIRAD, FranceCAAS, ChinaGroundnut 1000 20 SSR markers EMBRAPA, BrazilPigeonpea 1000 20 SSR markers Only ICRISATFinger millet 1000 20 SSR markers AICSMIP, India
Table 7. Composite collections of seected crops
Fig 1. Number of cultivars released worldwide from the basic germplasm supplied from ICRISATgenebank 1976-2003
Second National Plant Breeding Congress 2006 Plant Breeding in Post Genomics Era
Fig 2. Dendogram of eight regions for the entire chickpea germplasm based on first three principalcomponents.
50
1
76
12
30
19
02468
101214161820222426283032
Sorghum Pearl millet Chickpea Pigeonpea Groundnut Barnyardmillet
Finger millet
No.
of v
arie
ties
66 varieties released in 44 countries
Link
age
Dis
tanc
e
0
2
4
6
8
10
12
AricaSouth Asia
Southeast AsiaAmericas
EuropeWest Asia
MediterraneanEast asia
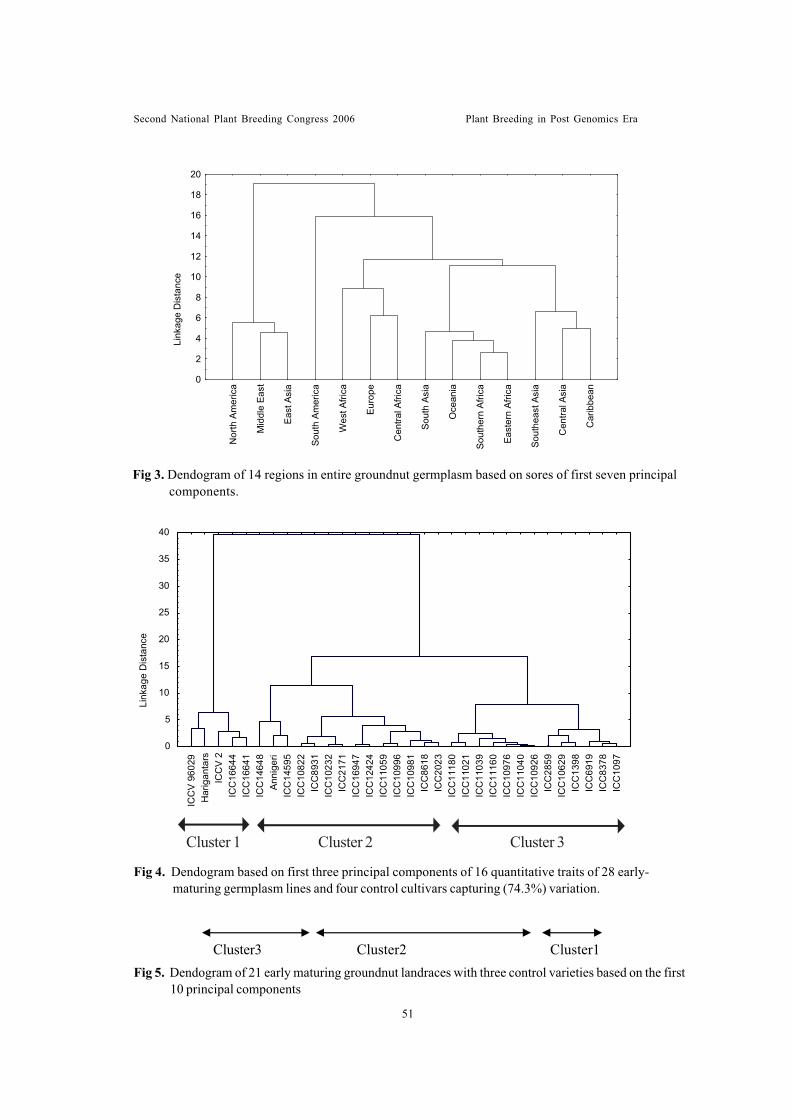
Fig 3. Dendogram of 14 regions in entire groundnut germplasm based on sores of first seven principalcomponents.
Second National Plant Breeding Congress 2006 Plant Breeding in Post Genomics Era
Fig 4. Dendogram based on first three principal components of 16 quantitative traits of 28 early- maturing germplasm lines and four control cultivars capturing (74.3%) variation.
Link
age
Dis
tanc
e
0
2
4
6
8
10
12
14
16
18
20
Nor
th A
mer
ica
Mid
dle
East
East
Asi
a
Sout
h Am
eric
a
Wes
t Afri
ca
Euro
pe
Cen
tral A
frica
Sout
h As
ia
Oce
ania
Sout
hern
Afri
ca
East
ern
Afric
a
Sout
heas
t Asi
a
Cen
tral A
sia
Car
ibbe
an
Fig 5. Dendogram of 21 early maturing groundnut landraces with three control varieties based on the first10 principal components
Cluster3 Cluster2 Cluster1
51
Cluster 1 Cluster 2 Cluster 3
Link
age
Dis
tanc
e
0
5
10
15
20
25
30
35
40
ICC
V 96
029
Har
igan
tars
ICC
V 2
IC
C16
644
IC
C16
641
IC
C14
648
Ann
iger
i
ICC
1459
5
ICC
1082
2
ICC
8931
IC
C10
232
IC
C21
71
ICC
1694
7
ICC
1242
4
ICC
1105
9
ICC
1099
6
ICC
1098
1
ICC
8618
IC
C20
23
ICC
1118
0
ICC
1102
1
ICC
1103
9
ICC
1116
0
ICC
1097
6
ICC
1104
0
ICC
1092
6
ICC
2859
IC
C10
629
IC
C13
98
ICC
6919
IC
C83
78
ICC
1097
Second National Plant Breeding Congress 2006 Plant Breeding in Post Genomics Era
RICE BIODIVERSITY AND ITS UTILIZATIONSubramanian, M1. and S.Tirumeni2
ABSTRACTRice (Oryza sativa L.) the most essential food crop of the world, is popularly known as
“Global Grain”. Unlike other crop plants, rice is endowed with enormous biodiversity,spread in many countries of the globe. The land races, indigenous cultivars, modern varieties,genetic stocks, breeding lines and wild species form the major components of the ricebiodiversity found abundantly in South East Asia, Africa, Australia and Southern CentralAmerica.
This germplasm with wide variability is the wealth of the country because of its valuablegene system. These genetic differences are very much useful to breed high yielding rice varietiesresistant to biotic and abiotic stresses and quality traits improvement. Therefore, explorationand conservation of these valuable rice genotypes had been initiated already during 60s witha view to investigate their origin, variability and to evaluate their relationship for utilization.The responsibility of collection, conservation and regeneration of those germplasm is vestedwith international and national research institutes and stations of all rice growing countries.In spite of countless problems and constraints, these efforts have already been in vogue tocollect and conserve the variability found in the globe and to utilize them in rice improvementwork.
IntroductionBiological diversity or biodiversity is the
variability among living organisms from allsources. Agricultural biodiversity focuses aportion of the biodiversity that has undergoneselection and modification over millennia byhuman civilization to better serve their needs.Genetic diversity, one of the components ofbiodiversity, refers to the variety of geneticinformation contained in all the individual plants,animals and microorganism. The plant diversityis not only distributed over the globe and India isalso recognized as one of he 17 mega biodiversityareas of the world with enormous diversity inmany flora and fauna. 1. Former Director of Research TNAU, Plot
No.9, VOC Street, Chokkanathapuram,Madurai - 625 014, Tamil Nadu, India.
2.Associate Professor (Plant Breeding)AJANCOA & RI, Karaikal - 609 603.
Rice, the world’s most important staple foodcrop needs continuous improvement to feed the
ever-growing population of the world. This cropwarrants resistance against abiotic and bioticstresses besides other quality characters to beimproved. The components of agro biodiversityused in the development of new plant varietiesor hybrids are called genetic material. Ricegenetic resources comprising land races,modern and obsolete varieties, genetic stocks,breeding lines and wild races are the basis offood security. Currently, the land races andvarieties under cultivation are declining. Thewild species are threatened with extinctionthrough changes in land use, extension ofagriculture into marshal areas and deforestation.Besides, the future progress in the improvementof rice crop largely depends on exploration. Inview of the above, the conservation of ricebiodiversity is taken up with great care andimportance in South East Asia, South Asia,Africa, Australia and South Central America.Collection and conservation are in progress inmany places of the aforesaid regions and thedetails are discussed in this paper.
1. Former Director of Research TNAU, Plot No.9, VOC Street, Chokkanathapuram, Madurai - 625 014, Tamil Nadu, India.
2. Associate Professor (Plant Breeding) PAJANCOA & RI, Karaikal - 609 603.
52
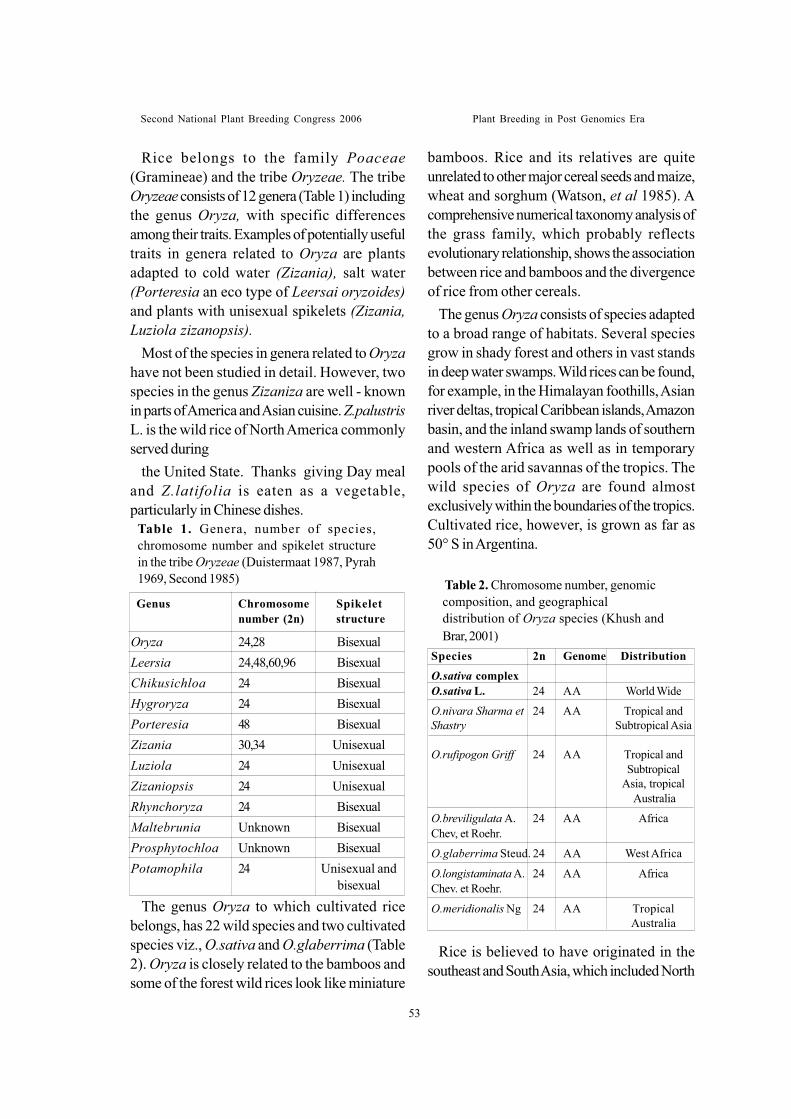
Second National Plant Breeding Congress 2006 Plant Breeding in Post Genomics Era
53
Rice belongs to the family Poaceae(Gramineae) and the tribe Oryzeae. The tribeOryzeae consists of 12 genera (Table 1) includingthe genus Oryza, with specific differencesamong their traits. Examples of potentially usefultraits in genera related to Oryza are plantsadapted to cold water (Zizania), salt water(Porteresia an eco type of Leersai oryzoides)and plants with unisexual spikelets (Zizania,Luziola zizanopsis).
Most of the species in genera related to Oryzahave not been studied in detail. However, twospecies in the genus Zizaniza are well - knownin parts of America and Asian cuisine. Z.palustrisL. is the wild rice of North America commonlyserved during
the United State. Thanks giving Day mealand Z.latifolia is eaten as a vegetable,particularly in Chinese dishes.
The genus Oryza to which cultivated ricebelongs, has 22 wild species and two cultivatedspecies viz., O.sativa and O.glaberrima (Table2). Oryza is closely related to the bamboos andsome of the forest wild rices look like miniature
bamboos. Rice and its relatives are quiteunrelated to other major cereal seeds and maize,wheat and sorghum (Watson, et al 1985). Acomprehensive numerical taxonomy analysis ofthe grass family, which probably reflectsevolutionary relationship, shows the associationbetween rice and bamboos and the divergenceof rice from other cereals.
The genus Oryza consists of species adaptedto a broad range of habitats. Several speciesgrow in shady forest and others in vast standsin deep water swamps. Wild rices can be found,for example, in the Himalayan foothills, Asianriver deltas, tropical Caribbean islands, Amazonbasin, and the inland swamp lands of southernand western Africa as well as in temporarypools of the arid savannas of the tropics. Thewild species of Oryza are found almostexclusively within the boundaries of the tropics.Cultivated rice, however, is grown as far as50° S in Argentina.
Table 2. Chromosome number, genomiccomposition, and geographicaldistribution of Oryza species (Khush andBrar, 2001)
Rice is believed to have originated in thesoutheast and South Asia, which included North
Table 1. Genera, number of species,chromosome number and spikelet structurein the tribe Oryzeae (Duistermaat 1987, Pyrah1969, Second 1985)
Genus Chromosome Spikeletnumber (2n) structure
Oryza 24,28 BisexualLeersia 24,48,60,96 BisexualChikusichloa 24 BisexualHygroryza 24 BisexualPorteresia 48 BisexualZizania 30,34 UnisexualLuziola 24 UnisexualZizaniopsis 24 UnisexualRhynchoryza 24 BisexualMaltebrunia Unknown BisexualProsphytochloa Unknown BisexualPotamophila 24 Unisexual and
bisexual
Species 2n Genome DistributionO.sativa complexO.sativa L. 24 AA World Wide
O.nivara Sharma et 24 AA Tropical andShastry Subtropical Asia
O.rufipogon Griff 24 AA Tropical andSubtropical
Asia, tropical Australia
O.breviligulata A. 24 AA AfricaChev, et Roehr.
O.glaberrima Steud. 24 AA West Africa
O.longistaminata A. 24 AA AfricaChev. et Roehr.
O.meridionalis Ng 24 AA TropicalAustralia
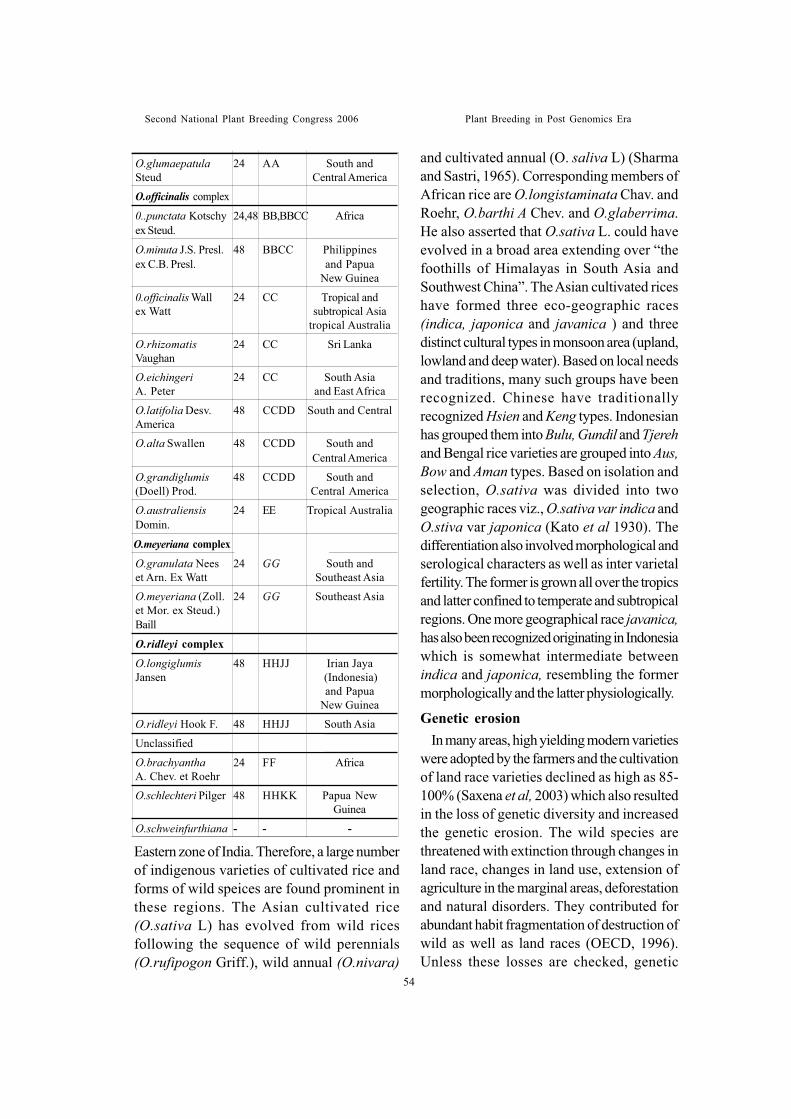
Second National Plant Breeding Congress 2006 Plant Breeding in Post Genomics Era
Eastern zone of India. Therefore, a large numberof indigenous varieties of cultivated rice andforms of wild speices are found prominent inthese regions. The Asian cultivated rice(O.sativa L) has evolved from wild ricesfollowing the sequence of wild perennials(O.rufipogon Griff.), wild annual (O.nivara)
and cultivated annual (O. saliva L) (Sharmaand Sastri, 1965). Corresponding members ofAfrican rice are O.longistaminata Chav. andRoehr, O.barthi A Chev. and O.glaberrima.He also asserted that O.sativa L. could haveevolved in a broad area extending over “thefoothills of Himalayas in South Asia andSouthwest China”. The Asian cultivated riceshave formed three eco-geographic races(indica, japonica and javanica ) and threedistinct cultural types in monsoon area (upland,lowland and deep water). Based on local needsand traditions, many such groups have beenrecognized. Chinese have traditionallyrecognized Hsien and Keng types. Indonesianhas grouped them into Bulu, Gundil and Tjerehand Bengal rice varieties are grouped into Aus,Bow and Aman types. Based on isolation andselection, O.sativa was divided into twogeographic races viz., O.sativa var indica andO.stiva var japonica (Kato et al 1930). Thedifferentiation also involved morphological andserological characters as well as inter varietalfertility. The former is grown all over the tropicsand latter confined to temperate and subtropicalregions. One more geographical race javanica,has also been recognized originating in Indonesiawhich is somewhat intermediate betweenindica and japonica, resembling the formermorphologically and the latter physiologically.
Genetic erosionIn many areas, high yielding modern varieties
were adopted by the farmers and the cultivationof land race varieties declined as high as 85-100% (Saxena et al, 2003) which also resultedin the loss of genetic diversity and increasedthe genetic erosion. The wild species arethreatened with extinction through changes inland race, changes in land use, extension ofagriculture in the marginal areas, deforestationand natural disorders. They contributed forabundant habit fragmentation of destruction ofwild as well as land races (OECD, 1996).Unless these losses are checked, genetic
O.glumaepatula 24 AA South andSteud Central America
O.officinalis complex
0..punctata Kotschy 24,48 BB,BBCC Africaex Steud.
O.minuta J.S. Presl. 48 BBCC Philippinesex C.B. Presl. and Papua
New Guinea
0.officinalis Wall 24 CC Tropical andex Watt subtropical Asia
tropical Australia
O.rhizomatis 24 CC Sri LankaVaughan
O.eichingeri 24 CC South AsiaA. Peter and East Africa
O.latifolia Desv. 48 CCDD South and CentralAmerica
O.alta Swallen 48 CCDD South andCentral America
O.grandiglumis 48 CCDD South and(Doell) Prod. Central America
O.australiensis 24 EE Tropical AustraliaDomin.
O.meyeriana complex
O.granulata Nees 24 GG South andet Arn. Ex Watt Southeast Asia
O.meyeriana (Zoll. 24 GG Southeast Asiaet Mor. ex Steud.)Baill
O.ridleyi complex
O.longiglumis 48 HHJJ Irian JayaJansen (Indonesia)
and PapuaNew Guinea
O.ridleyi Hook F. 48 HHJJ South Asia
Unclassified
O.brachyantha 24 FF AfricaA. Chev. et Roehr
O.schlechteri Pilger 48 HHKK Papua NewGuinea
O.schweinfurthiana - - -
54
Second National Plant Breeding Congress 2006 Plant Breeding in Post Genomics Era
55
erosion will invariably increase and replacementof such biodiversity will cost more. This can bereduced by strategic and timely conservationaction. Therefore, exploration and conservationof biodiversity are given importance.
Germplasm collectionThe collecting activities are closely linked to
conservation and use. Most samples in thecollection are land race varieties of O.sativa.Farmers throughout Asia usually maintain theidentity of each rice variety and help to identitydifferent varieties for effective collection ofgermplasm. Using this method more than 2000samples of O.sativa were collected during thesecond half of 1995 from Southern provinces ofthe Lao Peoples Democratic Republic (PDR).It is estimated that about 60% of these samplesare unique varieties. IRRI received almost 700samples of Oryza sativa and 84 samples ofdifferent wild species form the Lao PDR,Tanzania, Philippines and Costa Rica during 2000.More than 24,700 samples of cultivated rice and2400 samples of wild rice were collected in 165missions from 22 countries (Anon 2000).
India, the primary centre of origin of cultivatedrice (O.sativa) obviously conserves a very highgenetic diversity of rice with its diverse ecogeographic conditions. Collecting the variabilityobserved in indigenous rice cultivars began inIndia around the turn of this century. The workreceived special attention following establishmentof the attention following establishment of theAgricultural Research Station at Dacca (EasternIndia) in 1961 and Paddy Breeding Station,Coimbatore (Southern India) in 1912. Setting upthe Indian Council of Agricultural ResearchInstitute (ICAR) at New Delhi in 1929 and theCentral Rice Research Institute (CRRI) atCuttack in 1946 further strengthened theseefforts. The Jaipur Botanical survey exploredsouth Orissa and adjoining areas of MadhyaPradesh during 1955-60 and collected 1745cultivars. During 1965 - 67, 900 traditionalcultivars of Manipur in Eastern India were
collected.The Plant Introduction of IARI, New Delhi
was converted as National Bureau of PlantGenetic Resources (NBPGR) in 1976 andacted as a nodal agency for explorationcollection, conservation, characterization,evaluation and documentation of germplasm.A large number of collections were made bySharma and his team from 1968 to 1983, withthe help of IARI (Sharma 1982). Thosecollections were known as Assam RiceCollection (ARC). The Raipur collections of19,116, rice cultivars grown locally in MadhyaPradesh region were made from 1971 - 76.Additional collections of 1938 cultivars weremade through a special drive for uplandvarieties in Andhra Pradesh, Karnataka,Madhya Pradesh, Orissa and West Bengal.Collaborative explorations by NBPGR and StateAgricultural Universities added 7000 cultivarsduring 1978 - 80. The Vigyan Parishad KendraAgricultural Station at Almorah collected 1247cultivars from hilly regions of Uttarpradesh.NBPGR and CRRI jointly explored Sikkim,South Bihar and parts of Orissa in 1985 andcollected 447 local types. Exploration byNBPGR during 1983 - 89 led to further additionof 4862 cultivars to the National GermplasmBank.
ICAR and the 82 research stationsestablished at various agroclimatic regions ofthe country collected more than 80,000accessions of rice (Table 3). The InternationalRice gene bank (IRG) of IRRI Philippinesrepresents the largest and most diversecollection of rice in any gene bank. Thecollection comprises about 2% of all germplasmsamples conserved world wide donated frommore than 110 countries. The collectioncurrently holds 1,02,700 samples of Asia riceOryza sativa (95%) and West African RiceO.glaberrima (15%). The accessions weremostly collected from land races varietiesnurtured by farmers for generations, modern
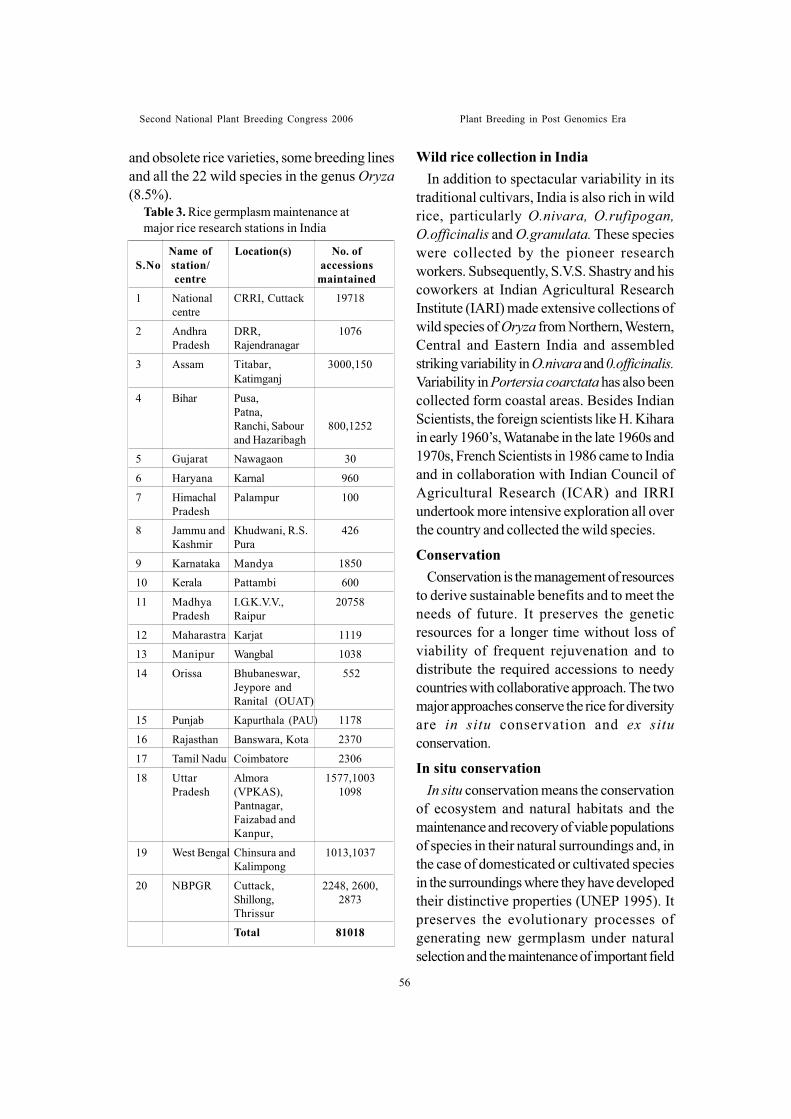
Second National Plant Breeding Congress 2006 Plant Breeding in Post Genomics Era
and obsolete rice varieties, some breeding linesand all the 22 wild species in the genus Oryza(8.5%).
Table 3. Rice germplasm maintenance atmajor rice research stations in India
Wild rice collection in IndiaIn addition to spectacular variability in its
traditional cultivars, India is also rich in wildrice, particularly O.nivara, O.rufipogan,O.officinalis and O.granulata. These specieswere collected by the pioneer researchworkers. Subsequently, S.V.S. Shastry and hiscoworkers at Indian Agricultural ResearchInstitute (IARI) made extensive collections ofwild species of Oryza from Northern, Western,Central and Eastern India and assembledstriking variability in O.nivara and 0.officinalis.Variability in Portersia coarctata has also beencollected form coastal areas. Besides IndianScientists, the foreign scientists like H. Kiharain early 1960’s, Watanabe in the late 1960s and1970s, French Scientists in 1986 came to Indiaand in collaboration with Indian Council ofAgricultural Research (ICAR) and IRRIundertook more intensive exploration all overthe country and collected the wild species.
ConservationConservation is the management of resources
to derive sustainable benefits and to meet theneeds of future. It preserves the geneticresources for a longer time without loss ofviability of frequent rejuvenation and todistribute the required accessions to needycountries with collaborative approach. The twomajor approaches conserve the rice for diversityare in situ conservation and ex situconservation.
In situ conservationIn situ conservation means the conservation
of ecosystem and natural habitats and themaintenance and recovery of viable populationsof species in their natural surroundings and, inthe case of domesticated or cultivated speciesin the surroundings where they have developedtheir distinctive properties (UNEP 1995). Itpreserves the evolutionary processes ofgenerating new germplasm under naturalselection and the maintenance of important field
Name of Location(s) No. ofS.No station/ accessions
centre maintained1 National CRRI, Cuttack 19718
centre
2 Andhra DRR, 1076Pradesh Rajendranagar
3 Assam Titabar, 3000,150Katimganj
4 Bihar Pusa,Patna,Ranchi, Sabour 800,1252and Hazaribagh
5 Gujarat Nawagaon 30
6 Haryana Karnal 960
7 Himachal Palampur 100Pradesh
8 Jammu and Khudwani, R.S. 426Kashmir Pura
9 Karnataka Mandya 1850
10 Kerala Pattambi 600
11 Madhya I.G.K.V.V., 20758Pradesh Raipur
12 Maharastra Karjat 1119
13 Manipur Wangbal 1038
14 Orissa Bhubaneswar, 552Jeypore andRanital (OUAT)
15 Punjab Kapurthala (PAU) 1178
16 Rajasthan Banswara, Kota 2370
17 Tamil Nadu Coimbatore 2306
18 Uttar Almora 1577,1003Pradesh (VPKAS), 1098
Pantnagar,Faizabad andKanpur,
19 West Bengal Chinsura and 1013,1037Kalimpong
20 NBPGR Cuttack, 2248, 2600,Shillong, 2873Thrissur
Total 81018
56
Second National Plant Breeding Congress 2006 Plant Breeding in Post Genomics Era
57
laboratories for crop biology and biogeography.It serves as a continuous source of germplasmfor ex situ conservation, and also to conservepotentially useful alleles, protects speciallyadapted species. It allows to natural evolution tocontinue, preserve pest and disease resistantspecies which can coevolve with their parasites,serves several sectors at one place. (Cropbreeding and forestry maintained with in thesame protected area facilitate research onspecies in their natural habitats).
On farm conservationIt is also an in situ conservation of the rice
genetic resources under continued cultivation andmanagement of a diverse set of rice populationby the farmers in the agro ecosystem where ricehas evolved. It is a dynamic complex process ofcrop evolution involving origin, domestication,spread, diversification and evolution. Fourcomponents of farmer’s management of diversityare seed flows, variety selection, varietyadaptation and seed selection and storage. Thereis general consensus that farmers are notconservationists in nature but areconservationists through use. Therefore, farmershave to be provided with the right technical andeconomical options, so that they would bebenefited by sowing the varieties targeted forconservationists.
Nature and objectives of on farmconservations
• Maintain and enhances allelic diversity• Access to and control over the diversity at
the local level• Promotion of genetic diversity conservation
a house hold security.The competition between traditional and
modern varieties is increasing, and adaptationof modern high quality varieties affects thecultivation of traditional varieties. Besides, thehigher market price for traditional varieties doesnot compensate their lower yield and longerduration. Therefore, farmers will cultivate the
traditional varieties only if their cultivation doesnot penalize them.
The seed stores generally carry only modernvarieties and certified seed growers, a part ofthe Department of Agriculture system of seedprocurement strategy, grow only modernvarieties. Even under a scheme “Plant nowPay later scheme”, the farmers are givenseeds at no cost, but upon harvest are expectedto pay for them. The seeds given in the schemeare from the certified seed growers, and arealways modern varieties and sometimes onlythe recommended varieties. Traditional varietiesare not planted by certified seed growers andwere not included in the scheme.
The varieties that were planted in irrigatedplots were obviously less affected by thedrought than the varieties planted on rainfedplots. Therefore, irrigation sustained the use ofmodern varieties, as farmers plant only modernvarieties in irrigated plots (Morin et al 1998).Poor storage condition is a cause of geneticerosion. Therefore, a simple and cheap seeddrying and storage device that farmers coulduse to store the seeds for several years needto be supplied.
Changing land use patterns may have aninfluence on diversity. It was suggested thatland fragmentation may permit farmers to growlandraces on one plot of land, and commercialvarieties on others. Since the development ofonfarm conservation approaches beyondcurrent practices have hardly been started, andthe mechanism poorly understood, need toincrease awareness of the potential of onfarmconservation through dialogues, training andeducation at all levels was felt must. Interactionwith farmers to enhance their understandingof the broader issues of plant geneticconservation would be one approach. It wasfurther agreed that since on farm conservationis important for many groups, this is onearea in which government; non-governmentorganizations, the science community and
Second National Plant Breeding Congress 2006 Plant Breeding in Post Genomics Era
farming groups should have a common interest.
Ex situ conservationEx situ conservation refers to the conservation
of germplasm away from its natural habitat. It isnow being practiced to some extent in almost allcountries as a means to conserve crop speciesdiversity for posterity. This strategy is particularlyimportant for crop gene pools and can be derivedby propagating and maintaining the plants ingenetic resource centres, botanical gardens,tissue culture respositories or in seed gene bank(OECD, 1996).
Periodical regeneration and rejuvenation ofcollections kept in the short, medium and longterm storages are either done in the field insuitable conditions or in special situations suchas green houses, grow houses, screen housesetc. At IRRI about 500 rice accessions aregrown every season in such a way as tocharacterize them and rejuvenate them. NBPGRnow keeps its field collection numbering about5000 in three centres in the field as well as inthe store. A long-term seed store also caters tothe needs of safer storage of collectionsimmediately after field characterization andevaluation.
Conservation of wild species * The IRGC of IRRI shall preserve a complete
set of genotypes. Other national and international centres help IRRI on rejuvenation.
* IRRI shall preserve, rejuvenate and distributeIndica, Japonica cultivars ofO.sativa and Oryza species except thosefrom Africa.
* The National Institute of AgrobiologicalResources in Tsukuba Japan shall preserve,rejuvenate and distribute Japonica varietiesof East Asia.
* The National Plant Germplasm System(NPGS) of USA shall preserve theaccessions from USA, South America andMediterranean area. The USA also shallcontinue to store duplicate samples of
conserved IRRI stock. * IITA (International Institute of Tropical
Agriculture, Ibadan Nigeria) willpreserve,rejuvenate and distribute cultivarsof O.glaberrima and wild species ofAfrica.
* Institute de Recharche Scientistique etTechnique out line - Mer FranceTheinternational network for rice germplasmconservation has the followingcomponents (ORSTOM) and WestAfrican Rice Development Association,Bouake, Ivory Coast (WARDA) plan tocollaborate with IITA.The abovecentres shall exchange and carefullycompare the accession lists to minimizethe maintenance of obviously duplicateaccessions. Now, the need of multilevel(National/ State/ Lesser entities)public and private collaboration in variousconservation activities is felt.
In vitro conservationThis technology is used to ensure the survival
of seed lots with low viability. Seeds may havelow viability when they are sent to gene banksfor long term conservation. Anther culture,embryo cultures and cold treatment of flowerbuds or panicles (at 9-1l°c for 14 days) inducedmore number of plantlets. Further, anther floatculture or cell suspension culture were alsoutilized. Meanwhile culture of isolated pollenwas also carried out to induce plantlets.
The development of isozyme classificationprovides an unequivocal biological frameworkfor the use and analysis of diversity patterns ofgermplasm based on other molecular markers.
DNA markers (RFLP, AFLP, RAPD andSSR) are routinely used for the managementand evaluation of crop germplasm collections(Westman and Kresovich, 1997).
Molecular biology, by generating newtechnologies and methods of analysis thatproved new approaches of supplement classical
58
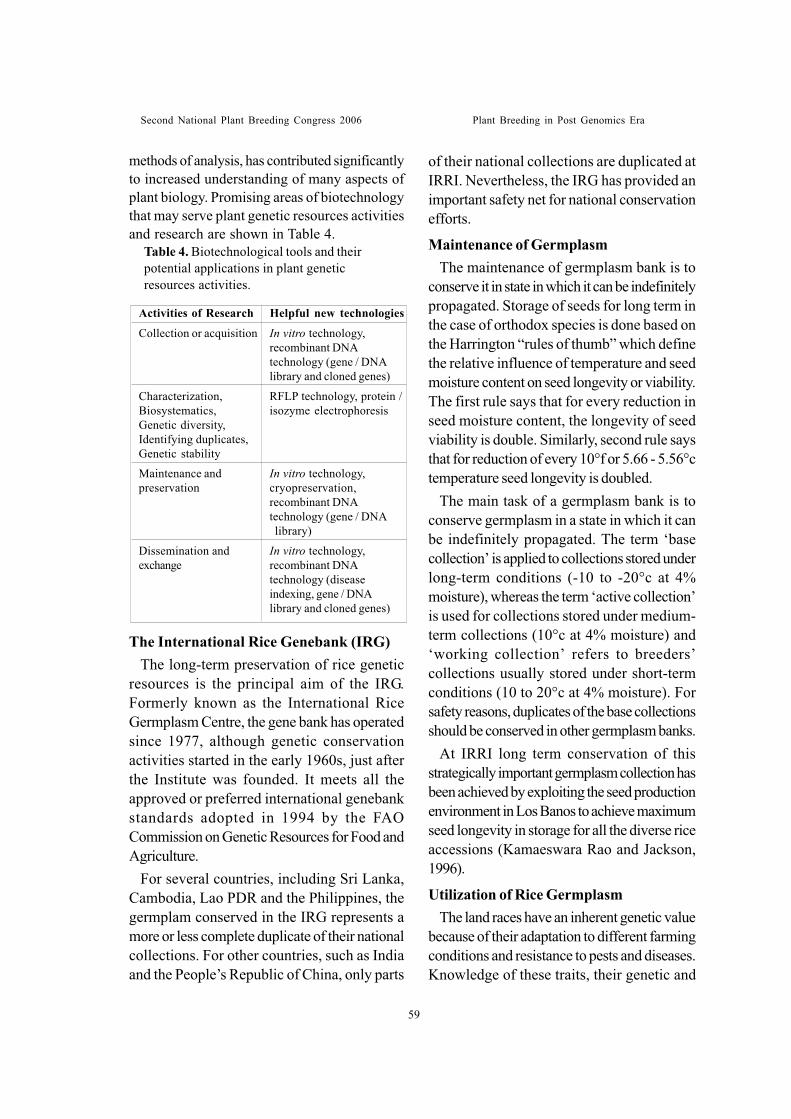
Second National Plant Breeding Congress 2006 Plant Breeding in Post Genomics Era
59
methods of analysis, has contributed significantlyto increased understanding of many aspects ofplant biology. Promising areas of biotechnologythat may serve plant genetic resources activitiesand research are shown in Table 4.
Table 4. Biotechnological tools and theirpotential applications in plant geneticresources activities.
The International Rice Genebank (IRG)The long-term preservation of rice genetic
resources is the principal aim of the IRG.Formerly known as the International RiceGermplasm Centre, the gene bank has operatedsince 1977, although genetic conservationactivities started in the early 1960s, just afterthe Institute was founded. It meets all theapproved or preferred international genebankstandards adopted in 1994 by the FAOCommission on Genetic Resources for Food andAgriculture.
For several countries, including Sri Lanka,Cambodia, Lao PDR and the Philippines, thegermplam conserved in the IRG represents amore or less complete duplicate of their nationalcollections. For other countries, such as Indiaand the People’s Republic of China, only parts
of their national collections are duplicated atIRRI. Nevertheless, the IRG has provided animportant safety net for national conservationefforts.
Maintenance of GermplasmThe maintenance of germplasm bank is to
conserve it in state in which it can be indefinitelypropagated. Storage of seeds for long term inthe case of orthodox species is done based onthe Harrington “rules of thumb” which definethe relative influence of temperature and seedmoisture content on seed longevity or viability.The first rule says that for every reduction inseed moisture content, the longevity of seedviability is double. Similarly, second rule saysthat for reduction of every 10°f or 5.66 - 5.56°ctemperature seed longevity is doubled.
The main task of a germplasm bank is toconserve germplasm in a state in which it canbe indefinitely propagated. The term ‘basecollection’ is applied to collections stored underlong-term conditions (-10 to -20°c at 4%moisture), whereas the term ‘active collection’is used for collections stored under medium-term collections (10°c at 4% moisture) and‘working collection’ refers to breeders’collections usually stored under short-termconditions (10 to 20°c at 4% moisture). Forsafety reasons, duplicates of the base collectionsshould be conserved in other germplasm banks.
At IRRI long term conservation of thisstrategically important germplasm collection hasbeen achieved by exploiting the seed productionenvironment in Los Banos to achieve maximumseed longevity in storage for all the diverse riceaccessions (Kamaeswara Rao and Jackson,1996).
Utilization of Rice GermplasmThe land races have an inherent genetic value
because of their adaptation to different farmingconditions and resistance to pests and diseases.Knowledge of these traits, their genetic and
Activities of Research Helpful new technologies
Collection or acquisition In vitro technology,recombinant DNAtechnology (gene / DNAlibrary and cloned genes)
Characterization, RFLP technology, protein /Biosystematics, isozyme electrophoresisGenetic diversity,Identifying duplicates,Genetic stability
Maintenance and In vitro technology,preservation cryopreservation,
recombinant DNAtechnology (gene / DNAlibrary)
Dissemination and In vitro technology,exchange recombinant DNA
technology (diseaseindexing, gene / DNAlibrary and cloned genes)
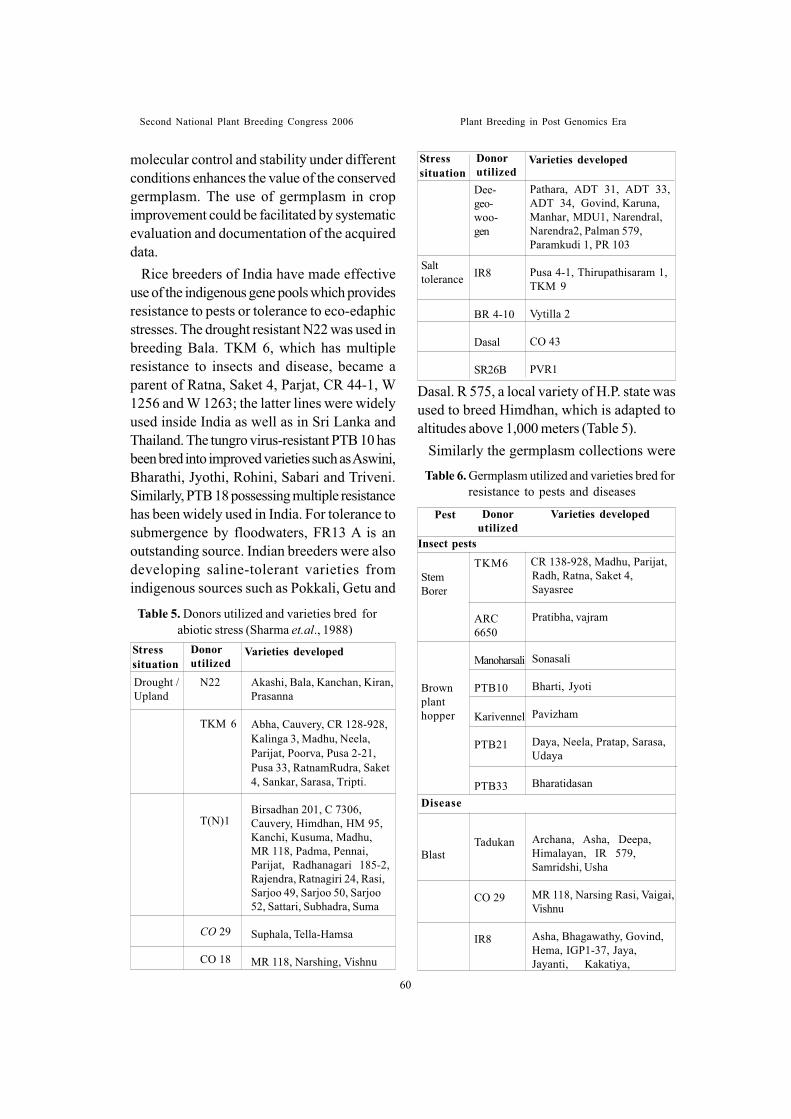
Second National Plant Breeding Congress 2006 Plant Breeding in Post Genomics Era
molecular control and stability under differentconditions enhances the value of the conservedgermplasm. The use of germplasm in cropimprovement could be facilitated by systematicevaluation and documentation of the acquireddata.
Rice breeders of India have made effectiveuse of the indigenous gene pools which providesresistance to pests or tolerance to eco-edaphicstresses. The drought resistant N22 was used inbreeding Bala. TKM 6, which has multipleresistance to insects and disease, became aparent of Ratna, Saket 4, Parjat, CR 44-1, W1256 and W 1263; the latter lines were widelyused inside India as well as in Sri Lanka andThailand. The tungro virus-resistant PTB 10 hasbeen bred into improved varieties such as Aswini,Bharathi, Jyothi, Rohini, Sabari and Triveni.Similarly, PTB 18 possessing multiple resistancehas been widely used in India. For tolerance tosubmergence by floodwaters, FR13 A is anoutstanding source. Indian breeders were alsodeveloping saline-tolerant varieties fromindigenous sources such as Pokkali, Getu and
Varieties developed
N22
TKM 6
T(N)1
CO 29
CO 18
Akashi, Bala, Kanchan, Kiran,Prasanna
Abha, Cauvery, CR 128-928,Kalinga 3, Madhu, Neela,Parijat, Poorva, Pusa 2-21,Pusa 33, RatnamRudra, Saket4, Sankar, Sarasa, Tripti.
Birsadhan 201, C 7306,Cauvery, Himdhan, HM 95,Kanchi, Kusuma, Madhu,MR 118, Padma, Pennai,Parijat, Radhanagari 185-2,Rajendra, Ratnagiri 24, Rasi,Sarjoo 49, Sarjoo 50, Sarjoo52, Sattari, Subhadra, Suma
Suphala, Tella-Hamsa
MR 118, Narshing, Vishnu
Drought /Upland
Stresssituation
Donorutilized
Table 5. Donors utilized and varieties bred forabiotic stress (Sharma et.al., 1988)
Pathara, ADT 31, ADT 33,ADT 34, Govind, Karuna,Manhar, MDU1, Narendral,Narendra2, Palman 579,Paramkudi 1, PR 103
Pusa 4-1, Thirupathisaram 1,TKM 9
Vytilla 2
CO 43
PVR1
Dee-geo-woo-gen
IR8
BR 4-10
Dasal
SR26B
Salttolerance
Varieties developedStresssituation
Donorutilized
Dasal. R 575, a local variety of H.P. state wasused to breed Himdhan, which is adapted toaltitudes above 1,000 meters (Table 5).
Similarly the germplasm collections were
Table 6. Germplasm utilized and varieties bred forresistance to pests and diseases
Varieties developedPest Donorutilized
Insect pests
StemBorer
Brownplanthopper
Blast
TKM6
ARC6650
Manoharsali
PTB10
Karivennel
PTB21
PTB33
Tadukan
CO 29
IR8
CR 138-928, Madhu, Parijat,Radh, Ratna, Saket 4,Sayasree
Pratibha, vajram
Sonasali
Bharti, Jyoti
Pavizham
Daya, Neela, Pratap, Sarasa,Udaya
Bharatidasan
Archana, Asha, Deepa,Himalayan, IR 579,Samridshi, Usha
MR 118, Narsing Rasi, Vaigai,Vishnu
Asha, Bhagawathy, Govind,Hema, IGP1-37, Jaya,Jayanti, Kakatiya,
Disease
60
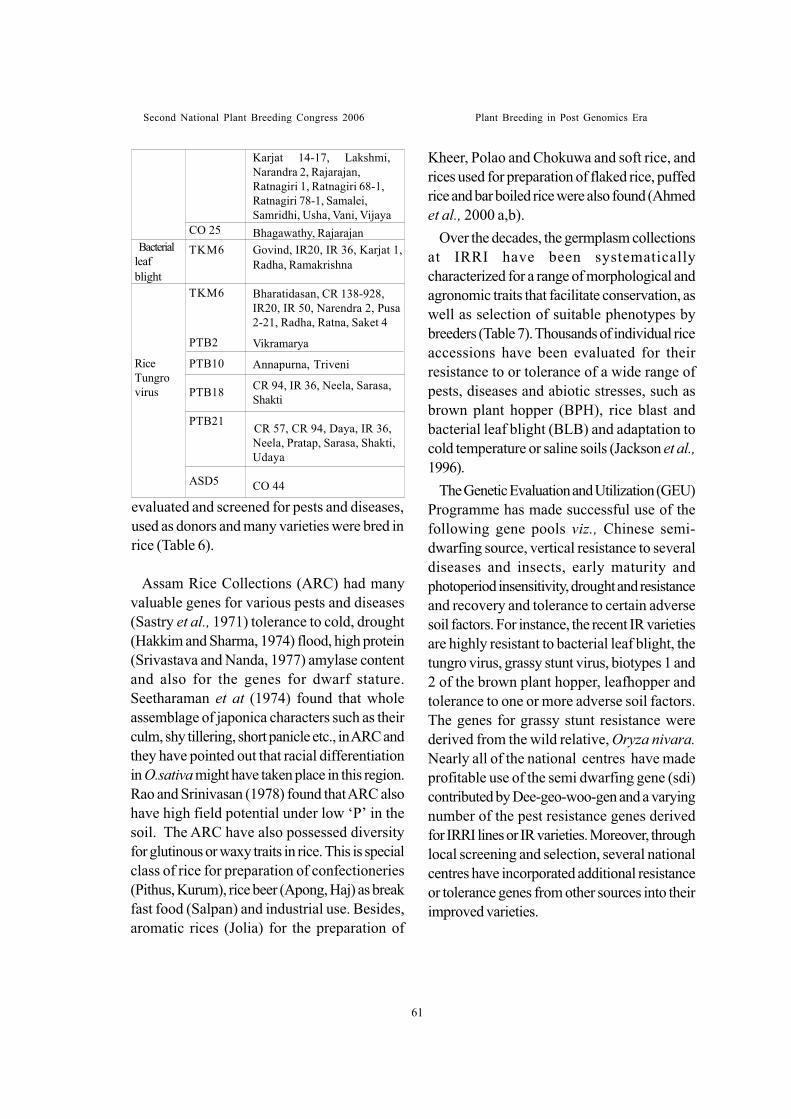
Second National Plant Breeding Congress 2006 Plant Breeding in Post Genomics Era
61
Assam Rice Collections (ARC) had manyvaluable genes for various pests and diseases(Sastry et al., 1971) tolerance to cold, drought(Hakkim and Sharma, 1974) flood, high protein(Srivastava and Nanda, 1977) amylase contentand also for the genes for dwarf stature.Seetharaman et at (1974) found that wholeassemblage of japonica characters such as theirculm, shy tillering, short panicle etc., in ARC andthey have pointed out that racial differentiationin O.sativa might have taken place in this region.Rao and Srinivasan (1978) found that ARC alsohave high field potential under low ‘P’ in thesoil. The ARC have also possessed diversityfor glutinous or waxy traits in rice. This is specialclass of rice for preparation of confectioneries(Pithus, Kurum), rice beer (Apong, Haj) as breakfast food (Salpan) and industrial use. Besides,aromatic rices (Jolia) for the preparation of
Kheer, Polao and Chokuwa and soft rice, andrices used for preparation of flaked rice, puffedrice and bar boiled rice were also found (Ahmedet al., 2000 a,b).
Over the decades, the germplasm collectionsat IRRI have been systematicallycharacterized for a range of morphological andagronomic traits that facilitate conservation, aswell as selection of suitable phenotypes bybreeders (Table 7). Thousands of individual riceaccessions have been evaluated for theirresistance to or tolerance of a wide range ofpests, diseases and abiotic stresses, such asbrown plant hopper (BPH), rice blast andbacterial leaf blight (BLB) and adaptation tocold temperature or saline soils (Jackson et al.,1996).
The Genetic Evaluation and Utilization (GEU)Programme has made successful use of thefollowing gene pools viz., Chinese semi-dwarfing source, vertical resistance to severaldiseases and insects, early maturity andphotoperiod insensitivity, drought and resistanceand recovery and tolerance to certain adversesoil factors. For instance, the recent IR varietiesare highly resistant to bacterial leaf blight, thetungro virus, grassy stunt virus, biotypes 1 and2 of the brown plant hopper, leafhopper andtolerance to one or more adverse soil factors.The genes for grassy stunt resistance werederived from the wild relative, Oryza nivara.Nearly all of the national centres have madeprofitable use of the semi dwarfing gene (sdi)contributed by Dee-geo-woo-gen and a varyingnumber of the pest resistance genes derivedfor IRRI lines or IR varieties. Moreover, throughlocal screening and selection, several nationalcentres have incorporated additional resistanceor tolerance genes from other sources into theirimproved varieties.
evaluated and screened for pests and diseases,used as donors and many varieties were bred inrice (Table 6).
CO 25
TKM6
TKM6
PTB2
PTB10
PTB18
PTB21
ASD5
Karjat 14-17, Lakshmi,Narandra 2, Rajarajan,Ratnagiri 1, Ratnagiri 68-1,Ratnagiri 78-1, Samalei,Samridhi, Usha, Vani, VijayaBhagawathy, RajarajanGovind, IR20, IR 36, Karjat 1,Radha, Ramakrishna
Bharatidasan, CR 138-928,IR20, IR 50, Narendra 2, Pusa2-21, Radha, Ratna, Saket 4
Vikramarya
Annapurna, Triveni
CR 94, IR 36, Neela, Sarasa,Shakti
CR 57, CR 94, Daya, IR 36,Neela, Pratap, Sarasa, Shakti,Udaya
CO 44
Bacterialleafblight
RiceTungrovirus
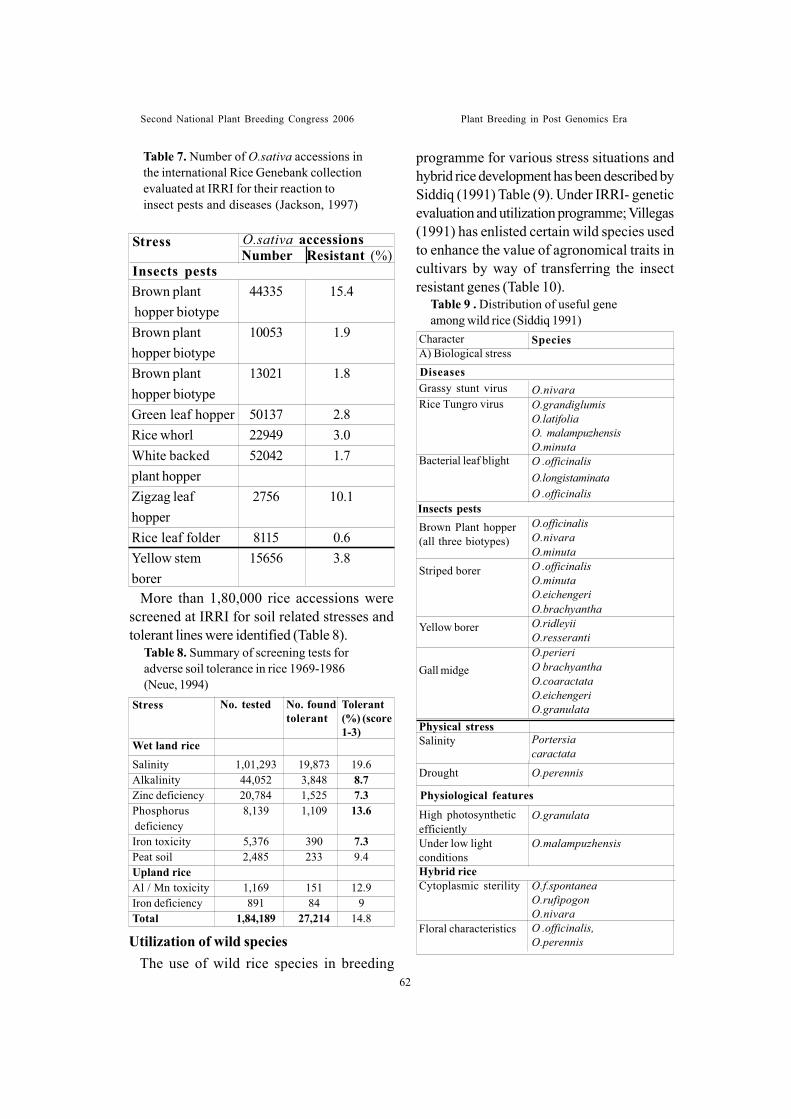
Second National Plant Breeding Congress 2006 Plant Breeding in Post Genomics Era
Table 7. Number of O.sativa accessions inthe international Rice Genebank collectionevaluated at IRRI for their reaction toinsect pests and diseases (Jackson, 1997)
Brown plant 44335 15.4 hopper biotypeBrown plant 10053 1.9hopper biotypeBrown plant 13021 1.8hopper biotypeGreen leaf hopper 50137 2.8Rice whorl 22949 3.0White backed 52042 1.7plant hopperZigzag leaf 2756 10.1hopperRice leaf folder 8115 0.6Yellow stem 15656 3.8borer
Insects pests
Stress O.sativa accessionsNumber Resistant (%)
More than 1,80,000 rice accessions werescreened at IRRI for soil related stresses andtolerant lines were identified (Table 8).
Table 8. Summary of screening tests foradverse soil tolerance in rice 1969-1986(Neue, 1994)
Wet land riceSalinity 1,01,293 19,873 19.6Alkalinity 44,052 3,848 8.7Zinc deficiency 20,784 1,525 7.3Phosphorus 8,139 1,109 13.6 deficiencyIron toxicity 5,376 390 7.3Peat soil 2,485 233 9.4Upland riceAl / Mn toxicity 1,169 151 12.9Iron deficiency 891 84 9Total 1,84,189 27,214 14.8
Stress No. tested No. foundtolerant
Tolerant(%) (score1-3)
Utilization of wild speciesThe use of wild rice species in breeding
programme for various stress situations andhybrid rice development has been described bySiddiq (1991) Table (9). Under IRRI- geneticevaluation and utilization programme; Villegas(1991) has enlisted certain wild species usedto enhance the value of agronomical traits incultivars by way of transferring the insectresistant genes (Table 10).
Table 9 . Distribution of useful geneamong wild rice (Siddiq 1991)
CharacterA) Biological stress
Grassy stunt virusRice Tungro virus
Bacterial leaf blight
Brown Plant hopper(all three biotypes)
Striped borer
Yellow borer
Gall midge
Physical stressSalinity
Drought
High photosyntheticefficientlyUnder low lightconditionsHybrid riceCytoplasmic sterility
Floral characteristics
Species
O.nivaraO.grandiglumisO.latifoliaO. malampuzhensisO.minutaO .officinalisO.longistaminataO .officinalis
O.officinalisO.nivaraO.minutaO .officinalisO.minutaO.eichengeriO.brachyanthaO.ridleyiiO.resserantiO.perieriO brachyanthaO.coaractataO.eichengeriO.granulata
Portersiacaractata
O.perennis
O.granulata
O.malampuzhensis
O.f.spontaneaO.rufipogonO.nivaraO .officinalis,O.perennis
Diseases
Insects pests
Physiological features
62
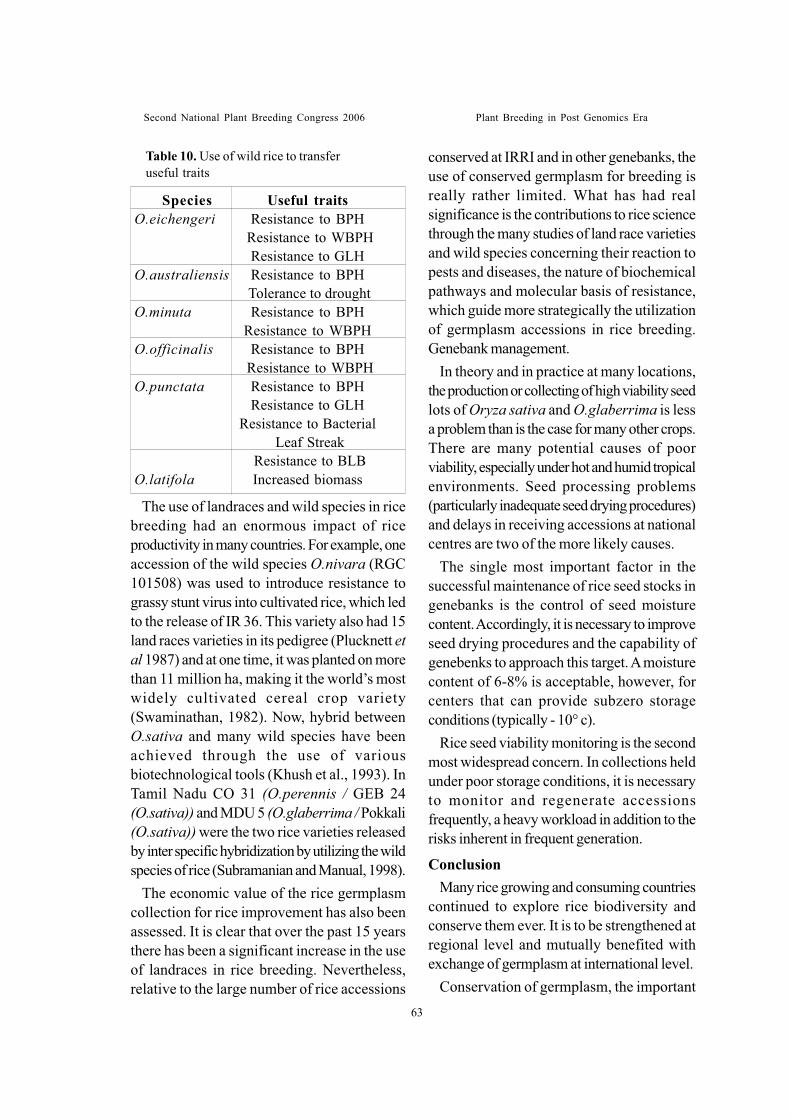
Second National Plant Breeding Congress 2006 Plant Breeding in Post Genomics Era
63
Table 10. Use of wild rice to transferuseful traits
Species Useful traitsO.eichengeri Resistance to BPH
Resistance to WBPHResistance to GLH
O.australiensis Resistance to BPH Tolerance to drought
O.minuta Resistance to BPHResistance to WBPH
O.officinalis Resistance to BPH Resistance to WBPH
O.punctata Resistance to BPHResistance to GLH
Resistance to Bacterial Leaf Streak
Resistance to BLBO.latifola Increased biomass
The use of landraces and wild species in ricebreeding had an enormous impact of riceproductivity in many countries. For example, oneaccession of the wild species O.nivara (RGC101508) was used to introduce resistance tograssy stunt virus into cultivated rice, which ledto the release of IR 36. This variety also had 15land races varieties in its pedigree (Plucknett etal 1987) and at one time, it was planted on morethan 11 million ha, making it the world’s mostwidely cultivated cereal crop variety(Swaminathan, 1982). Now, hybrid betweenO.sativa and many wild species have beenachieved through the use of variousbiotechnological tools (Khush et al., 1993). InTamil Nadu CO 31 (O.perennis / GEB 24(O.sativa)) and MDU 5 (O.glaberrima / Pokkali(O.sativa)) were the two rice varieties releasedby inter specific hybridization by utilizing the wildspecies of rice (Subramanian and Manual, 1998).
The economic value of the rice germplasmcollection for rice improvement has also beenassessed. It is clear that over the past 15 yearsthere has been a significant increase in the useof landraces in rice breeding. Nevertheless,relative to the large number of rice accessions
conserved at IRRI and in other genebanks, theuse of conserved germplasm for breeding isreally rather limited. What has had realsignificance is the contributions to rice sciencethrough the many studies of land race varietiesand wild species concerning their reaction topests and diseases, the nature of biochemicalpathways and molecular basis of resistance,which guide more strategically the utilizationof germplasm accessions in rice breeding.Genebank management.
In theory and in practice at many locations,the production or collecting of high viability seedlots of Oryza sativa and O.glaberrima is lessa problem than is the case for many other crops.There are many potential causes of poorviability, especially under hot and humid tropicalenvironments. Seed processing problems(particularly inadequate seed drying procedures)and delays in receiving accessions at nationalcentres are two of the more likely causes.
The single most important factor in thesuccessful maintenance of rice seed stocks ingenebanks is the control of seed moisturecontent. Accordingly, it is necessary to improveseed drying procedures and the capability ofgenebenks to approach this target. A moisturecontent of 6-8% is acceptable, however, forcenters that can provide subzero storageconditions (typically - 10° c).
Rice seed viability monitoring is the secondmost widespread concern. In collections heldunder poor storage conditions, it is necessaryto monitor and regenerate accessionsfrequently, a heavy workload in addition to therisks inherent in frequent generation.
ConclusionMany rice growing and consuming countries
continued to explore rice biodiversity andconserve them ever. It is to be strengthened atregional level and mutually benefited withexchange of germplasm at international level.
Conservation of germplasm, the important
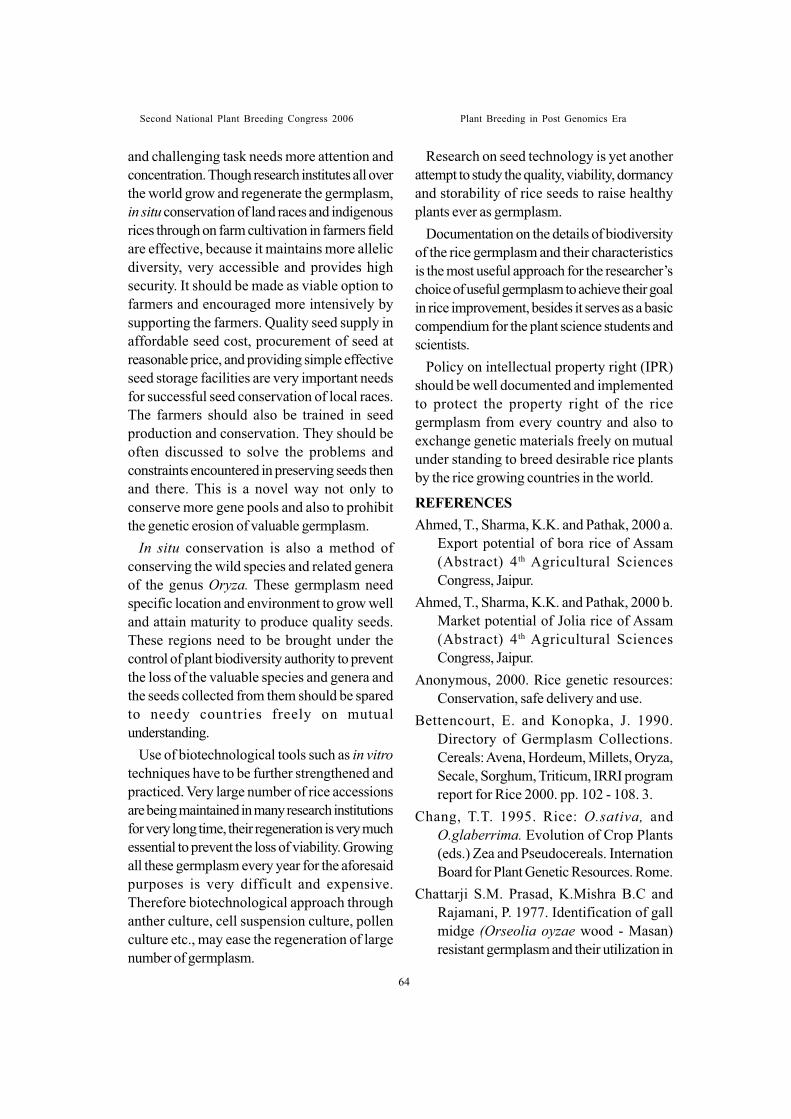
Second National Plant Breeding Congress 2006 Plant Breeding in Post Genomics Era
and challenging task needs more attention andconcentration. Though research institutes all overthe world grow and regenerate the germplasm,in situ conservation of land races and indigenousrices through on farm cultivation in farmers fieldare effective, because it maintains more allelicdiversity, very accessible and provides highsecurity. It should be made as viable option tofarmers and encouraged more intensively bysupporting the farmers. Quality seed supply inaffordable seed cost, procurement of seed atreasonable price, and providing simple effectiveseed storage facilities are very important needsfor successful seed conservation of local races.The farmers should also be trained in seedproduction and conservation. They should beoften discussed to solve the problems andconstraints encountered in preserving seeds thenand there. This is a novel way not only toconserve more gene pools and also to prohibitthe genetic erosion of valuable germplasm.
In situ conservation is also a method ofconserving the wild species and related generaof the genus Oryza. These germplasm needspecific location and environment to grow welland attain maturity to produce quality seeds.These regions need to be brought under thecontrol of plant biodiversity authority to preventthe loss of the valuable species and genera andthe seeds collected from them should be sparedto needy countries freely on mutualunderstanding.
Use of biotechnological tools such as in vitrotechniques have to be further strengthened andpracticed. Very large number of rice accessionsare being maintained in many research institutionsfor very long time, their regeneration is very muchessential to prevent the loss of viability. Growingall these germplasm every year for the aforesaidpurposes is very difficult and expensive.Therefore biotechnological approach throughanther culture, cell suspension culture, pollenculture etc., may ease the regeneration of largenumber of germplasm.
Research on seed technology is yet anotherattempt to study the quality, viability, dormancyand storability of rice seeds to raise healthyplants ever as germplasm.
Documentation on the details of biodiversityof the rice germplasm and their characteristicsis the most useful approach for the researcher’schoice of useful germplasm to achieve their goalin rice improvement, besides it serves as a basiccompendium for the plant science students andscientists.
Policy on intellectual property right (IPR)should be well documented and implementedto protect the property right of the ricegermplasm from every country and also toexchange genetic materials freely on mutualunder standing to breed desirable rice plantsby the rice growing countries in the world.
REFERENCESAhmed, T., Sharma, K.K. and Pathak, 2000 a.
Export potential of bora rice of Assam(Abstract) 4th Agricultural SciencesCongress, Jaipur.
Ahmed, T., Sharma, K.K. and Pathak, 2000 b.Market potential of Jolia rice of Assam(Abstract) 4th Agricultural SciencesCongress, Jaipur.
Anonymous, 2000. Rice genetic resources:Conservation, safe delivery and use.
Bettencourt, E. and Konopka, J. 1990.Directory of Germplasm Collections.Cereals: Avena, Hordeum, Millets, Oryza,Secale, Sorghum, Triticum, IRRI programreport for Rice 2000. pp. 102 - 108. 3.
Chang, T.T. 1995. Rice: O.sativa, andO.glaberrima. Evolution of Crop Plants(eds.) Zea and Pseudocereals. InternationBoard for Plant Genetic Resources. Rome.
Chattarji S.M. Prasad, K.Mishra B.C andRajamani, P. 1977. Identification of gallmidge (Orseolia oyzae wood - Masan)resistant germplasm and their utilization in
64
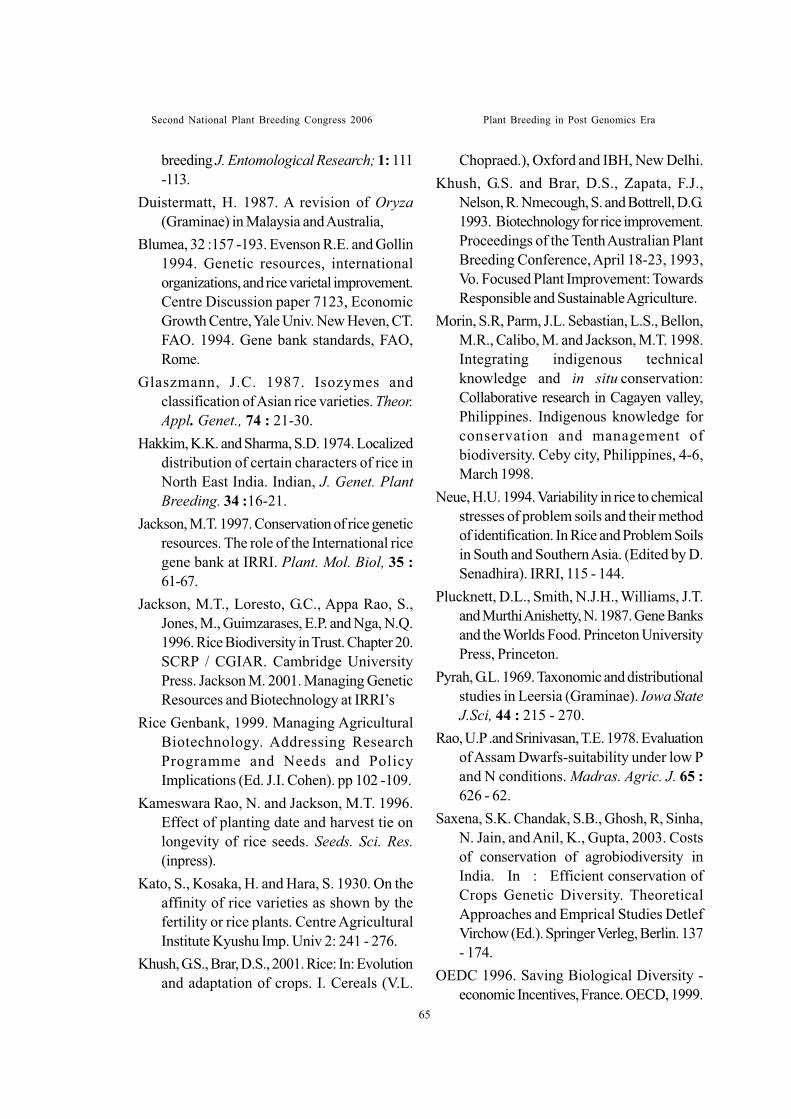
Second National Plant Breeding Congress 2006 Plant Breeding in Post Genomics Era
65
breeding J. Entomological Research; 1: 111-113.
Duistermatt, H. 1987. A revision of Oryza(Graminae) in Malaysia and Australia,
Blumea, 32 :157 -193. Evenson R.E. and Gollin1994. Genetic resources, internationalorganizations, and rice varietal improvement.Centre Discussion paper 7123, EconomicGrowth Centre, Yale Univ. New Heven, CT.FAO. 1994. Gene bank standards, FAO,Rome.
Glaszmann, J.C. 1987. Isozymes andclassification of Asian rice varieties. Theor.Appl. Genet., 74 : 21-30.
Hakkim, K.K. and Sharma, S.D. 1974. Localizeddistribution of certain characters of rice inNorth East India. Indian, J. Genet. PlantBreeding. 34 :16-21.
Jackson, M.T. 1997. Conservation of rice geneticresources. The role of the International ricegene bank at IRRI. Plant. Mol. Biol, 35 :61-67.
Jackson, M.T., Loresto, G.C., Appa Rao, S.,Jones, M., Guimzarases, E.P. and Nga, N.Q.1996. Rice Biodiversity in Trust. Chapter 20.SCRP / CGIAR. Cambridge UniversityPress. Jackson M. 2001. Managing GeneticResources and Biotechnology at IRRI’s
Rice Genbank, 1999. Managing AgriculturalBiotechnology. Addressing ResearchProgramme and Needs and PolicyImplications (Ed. J.I. Cohen). pp 102 -109.
Kameswara Rao, N. and Jackson, M.T. 1996.Effect of planting date and harvest tie onlongevity of rice seeds. Seeds. Sci. Res.(inpress).
Kato, S., Kosaka, H. and Hara, S. 1930. On theaffinity of rice varieties as shown by thefertility or rice plants. Centre AgriculturalInstitute Kyushu Imp. Univ 2: 241 - 276.
Khush, G.S., Brar, D.S., 2001. Rice: In: Evolutionand adaptation of crops. I. Cereals (V.L.
Chopraed.), Oxford and IBH, New Delhi.Khush, G.S. and Brar, D.S., Zapata, F.J.,
Nelson, R. Nmecough, S. and Bottrell, D.G.1993. Biotechnology for rice improvement.Proceedings of the Tenth Australian PlantBreeding Conference, April 18-23, 1993,Vo. Focused Plant Improvement: TowardsResponsible and Sustainable Agriculture.
Morin, S.R, Parm, J.L. Sebastian, L.S., Bellon,M.R., Calibo, M. and Jackson, M.T. 1998.Integrating indigenous technicalknowledge and in situ conservation:Collaborative research in Cagayen valley,Philippines. Indigenous knowledge forconservation and management ofbiodiversity. Ceby city, Philippines, 4-6,March 1998.
Neue, H.U. 1994. Variability in rice to chemicalstresses of problem soils and their methodof identification. In Rice and Problem Soilsin South and Southern Asia. (Edited by D.Senadhira). IRRI, 115 - 144.
Plucknett, D.L., Smith, N.J.H., Williams, J.T.and Murthi Anishetty, N. 1987. Gene Banksand the Worlds Food. Princeton UniversityPress, Princeton.
Pyrah, G.L. 1969. Taxonomic and distributionalstudies in Leersia (Graminae). Iowa StateJ.Sci, 44 : 215 - 270.
Rao, U.P .and Srinivasan, T.E. 1978. Evaluationof Assam Dwarfs-suitability under low Pand N conditions. Madras. Agric. J. 65 :626 - 62.
Saxena, S.K. Chandak, S.B., Ghosh, R, Sinha,N. Jain, and Anil, K., Gupta, 2003. Costsof conservation of agrobiodiversity inIndia. In : Efficient conservation ofCrops Genetic Diversity. TheoreticalApproaches and Emprical Studies DetlefVirchow (Ed.). Springer Verleg, Berlin. 137- 174.
OEDC 1996. Saving Biological Diversity -economic Incentives, France. OECD, 1999.
Second National Plant Breeding Congress 2006 Plant Breeding in Post Genomics Era
Handbook of Incentives Measures forBiodiversity. Design and Implementation.
Second, G. 1985. Relation evolutiveschezlegenere O. precessus derdomestication des riz. Orstom etudes andtheses: 1-189. Paris. Seetharaman R andGhorai D. P. 1976. Occurrence of types withcharacters of glaberrima. In Assam RiceColelction Curr. 50: 62-69.
Seetharaman, R., Srivastava, D.P. and Ghorai,D.P. 1974. Preliminary studies in ricecultivars from North East India. Indian J.Genet. Plant Breeding., 34 : 3-149.
Sharma, S.D. 1982. Collection and evaluationof rice germplasm form North East India.IBPGR Plant Genetic ResourcesNewsletter, 50 : 62 - 69.
Sharma, S.D. and Shastry, S.V.S. 1965.Taxonomic studies in the genus OryzaO.rufipogon Griff. Sensustricks andO.nivara Sharma et Shastry nom. Nov.Indian Genet., 25 :157 - 165.
Sharma, S.D., Krishnanusti, A. and S.R. Dhua1988. Genetic diversity in rice and itsutilization in India. Plant Genetic Resources(Indian Perspectives) pp 108 -120.
Shastry, S.V.S., Sharma, S.D., John, V.T. andKrishnaiah, 1971. New sources ofresistance to pests and disease in the AssameRice collections. Intern. Rice Comm.Newsletter, 22 :1-16.
Siddiq, E.A. 1991. Genes and rice improvement.Oryza, 28 :1-17.
Srivastava, D.P. and Nanda, B.B. 1977. variation
in grain protein in some groups of ricevarieties from the collection of North EastIndia. Oryza, 14 : 45-46.
Subramanian, M. and Manual, W.W.1998. Varietal description of rice,Aduthurai, Platinum Jubliee Publication, pp.1-80.
Swaminathan, M.S. 1982. Beyond IR 36: Riceresearch strategies for the 80s. Paperpresented at the International Centers;Week, World Bank, November 20.1982.
Washington, D.C. Tzvelev, N.N. 1989. Thesystem of grasses (Poaceae) and theirevolution. Bot. Rev., 55 :141 - 204. UNEP,1992. Guidelines for country studies onBiological Diversity UNEP, Nairobi.
UNEP, 1995. Global Diversity Assessment.Cambridge University Press. Cambridge.
Villegas, V.N. 1991. Rice germplasm collecting,preservation in USA. Proc. of the thirdinternational workshop. InternationalRice Research Institute, Manila.Philippines, 10-12, March 1991. p.120.
Watson, L., Cliford, H.T. and Dallwitz., M.J.1985. The classification of Poaceae:Subfamilies and supertribes. Aust. J. Bot.,33 : 433 - 484.
Westman, A.L .and Kresorich, S. 1997. Use ofmolecular marker techniques fordescription of Plant Genetic variation. In :Biotechnology and Plant GeneticResources. Conservation and use; editedby J.A. Callow, B.R. Ford - Lloyd and H.J.Newbury. Walling Ford.
66
Second National Plant Breeding Congress 2006 Plant Breeding in Post Genomics Era
GENETIC DIVERSITY OF ROBUSTA - ARABICA HYBRIDS OF COFFEEAND UTILIZATION IN BREEDING
Santa Ram, A1., D. Ganesh, N. Sandhyarani, S.R. Mythrasree, C. Murugan,
R.K. Sabir, K.P. Dinesh, A. Manoharan, M.K. Mishra and Jayarama
ABSTRACTCoffee is an important commodity of international trade and India is one of the
important exporting countries. Leaf rust caused by Hemileia vastatrix is a devastatingdisease of coffee. Coffea arabica is susceptible to this disease. Through selection overyears, a number of resistant selections were developed. Sln.5A, Sln.5B, Sln6 and Sln.8were tested against susceptible check Sln.3 in three locations. All the new resistant selectionsshowed a high degree of resistance ranging from 81.25 to 95.0 per cent. In the check Sln.3an average of 92.0 per cent plants were susceptible. Preliminary observations on RAPDmarkers in Sln.6 and Sln.8 indicated distinctions between resistant and susceptible plantsin these selections. A general description of the genetic architecture, diversity, inheritanceof rust resistance, quality and possible use of RAPD markers in selecting resistant plants inadvanced generations is presented.
1. Division of Botany, Central Coffee Research Institute, Coffee Research Station 577117, Chikmagalur District,Karnataka, India
IntroductionCoffee is an internationally important
commodity in trade volume and money value. Itis not an exaggeration to state that the economiesof most of the coffee producing developingcountries depend on the earnings from this crop(Marshal, 1985). Leaf rust is a devastatingdisease of great economic significance on thiscrop (Kushalappa and Eskes, 1989). Thisdisease is caused by the Basidiomycete fungusHemileia vastatrix B. et Br. Of the twocommercially important species of Coffea, C.arabica L. (Arabica) is more susceptible thanC.canephora Pierre ex Froehner (Robusta).Incidentally, Arabica is the species, whichproduces quality coffee with fine aroma and tasteattributes. C. arabica is also the speciessusceptible to pests and diseases. Leaf rustdisease has wiped out Arabica in Sri Lanka andIndonesia where only Robusta is grown now.The susceptibility of Arabica is possibly due tothe narrow genetic base of the commercialpopulations which are known to have beenderived from very few plants (Smith, 1985).Another possible reason for the susceptibility of
Arabica coffee is the perennial nature of thecrop plant and quick adaptation of the rustfungus to the resistance offered by the host.Added to these, is the autogamous reproductivebehaviour of C. arabica, which tends to fixthe traits and reduce the variability in adaptivegenotypes or land races. Another importantpoint is the tetraploidy of C. arabica versusthe diploidy of all other species of Coffeapreventing ready flow of genes between otherspecies and Arabica. Thus, improving Arabicacoffee with the specific objective of rustresistance without compromising on yield andquality is a task of considerable dimensions.
Resistance to leaf rust in Arabica coffee isknown to be conditioned by 9 genes symbolisedSH1 – SH9 (Rodrigues et al., 1975; Eskes,1989). Old cultivars of C. arabica such asBourbon and Typica are highly susceptible tothis devastating disease. Four genes ofresistance viz. SH1, SH2, SH4 and SH5 wereidentified in the cultivated/wild gene pool of C.arabica (Rodrigues et al., 1975,2000).However, the resistance of coffee plantscarrying these genes in different combinations
67
Second National Plant Breeding Congress 2006 Plant Breeding in Post Genomics Era
was defeated by the virulent races of the rustfungus (Rodrigues et al., 1975; Eskes, 1989).Current coffee breeding programmes utilize theresistance genes resident in some spontaneousinterspecific hybrids. Thus, the early Indiancoffee selections are known to carry the SH3resistance gene putatively derived from C.liberica (Rodrigues et al., 1975). Hibrido deTimor (HDT) spotted in an Arabica field in Timor(Bettencourt, 1973) is the extensively used sourceof rust resistance genes. This is commerciallyexploited in our country as Selection-8 (Sln.8).HDT manifests resistance to all known races ofthe rust fungus and was shown to be SH6, SH7,SH8, SH9 in genotype (Bettencourt et al., 1992).Resistance of the commercially exploited hybridsof HDT ancestry was, at least, partially defeatedby the new races of the rust fungus while HDThas been maintaining its high resistance(Rodrigues et al., 1993; Sreenivasan et al.,1994). This situation prompts that breeders shouldgenerate or identify alternative sources ofresistance to this important disease. In the coffee-breeding programme of India, certain uniqueRobusta – Arabica hybrids carrying a highdegree of resistance to leaf rust were created.Sln.5A and Sln.5B were derived by crossingDevamachy, a natural Arabica – Robusta hybridwith S.881 (Rume Sudan Arabica) and S.333 (anatural hybrid of Arabica and Liberica fromDoobla, India) respectively. Sln.6 (Robarbica)is an artificial hybrid developed by crossingRobusta (S.274) and Arabica (Kents) andbackcrossing the hybrid to Kents. However, theallelic composition of these hybrids is not yetelucidated. This led to gaps in the knowledge ofbehaviour of genes and resulted in a set back inunderstanding the stability of resistance in theseimportant sources of resistance. Present studyattempted a comparison of the manifesteddiversity of these interspecific hybrids in a bid toassess their utility as sources of resistance genes.
Materials and MethodsObservations on various morphological
characters were recorded from a sample of 10plants of each of the selections Sln.5A, Sln.5B,Sln.6 and Sln.8. Sln.3 (S.795) was included ascontrol. Summary of observations is presentedin table 1.
Incidence of leaf rust was recorded from allindividuals of three populations of each of theseselections in three different locations andsummary of observations is presented in table2.
Beverage quality of the samples of allselections was assessed by the quality lab atCoffee Board Head Office, Bangalore. Resultsof three consecutive tests are presented in Table3. RAPD markers were generated from theDNA of resistant and susceptible plants of Sln.6and Sln.8 by the method described earlier (Ramand Sreenath, 1999, Williams et al., 1990).
Results and DiscussionThe Genetic System of Coffea arabicaA brief consideration of hereditary dynamics
of Arabica coffee is important to explain theobserved durable resistance in the genusCoffea and propose a model breeding strategyfor imparting durable resistance to C. arabicawithout compromising on quality. Arabica is thelone tetraploid in the genus and has manybiological distinctions apart from its chromosomenumber. This species was considered asegmental allotetraploid on the basis of itsdiploid cytological behaviour with occasionalquadrivalent formation at meiosis (Carvalho,1952; Grassias and Kammacher, 1975). Mostof the allopolyploid species manifest variationsthat are illustrative of the processes of naturalselection (Darlington, 1946) and C. arabica isan example. An important point to be noted isthat the evolutionary processes which led tothe isolated populations of Coffea (with theirmorphological peculiarities) from a possiblecommon ancestor were unable to proceed asfar as creating biological species showingabsolute isolation or a marked chromosomalrestructuring. Thus, the diploid groups that are
68
Second National Plant Breeding Congress 2006 Plant Breeding in Post Genomics Era
mostly homosequential in chromosome structureform a vast genetic continuum (Kammacher,1977). The wild populations of Coffea adaptedbalanced heterotic breeding as the basic strategyof evolution that facilitates relatively easy lateraltransfer of genes across sympatric populationseven as the so-called species maintain theirrelative identities (Stebbins, 1971). The singularmajor distinction of C. arabica is its tetraploidy,even while it carries a considerable degree ofgenetic homology with several diploids. The largegenetic variability of this species in its center oforigin and diversity and its ability to assimilatethe genes of several diploid species indicate thatit could be a compilospecies (Ram, 2004). Thishas tremendous implications for breeding andpotential materials that can be used in exploitingthis feature of Arabica are already available forbreeding purposes (Ram et al., 2004). In thiscontext, the observed resistance of Arabicoiddescendants from interspecific hybrids can beeffectively exploited to evolve gene pyramids(Ram, 2001). Another important point is that anallotetraploid is a permanent hybrid whoserecessive gene mutations cannot segregate whenit is self-fertilized. The self-sterility system of itsparents need not necessarily work in theallopolyploid species rendering it effectivelyendogamous. The only possible mode ofenlarging its variation is by secondary segregationof ancestral differences (Darlington, 1946;Dawson, 1962) or induced mutations. The largediversity of C. arabica in the land of its origin(Lashermes et al., 1995,1996; Anthony et al.,2001) is not exactly reflective of this situationand renders credibility to the possibility of its beinga compilospecies. Dual modes of inheritance inthe tetraploid Arabicoid interspecific hybrids(Lashermes et al., 2000; Teixeira-Cabral et al.,2004) and gene conversion in diploid interspecifichybrids (Ky et al., 2000) were reported and canlead to inconsistencies in realizing expectedresults in resistance breeding programmes. Theheredity and durability of disease resistance
should be understood by superimposing it onthis basic genetic system that is responsible forthe observed inconsistencies.
Genetic Diversity and Inheritance inRobusta – Arabica Hybrids
Four selections of the present study wereall derived from the natural or artificialhybridization of the commercially importantspecies C. arabica and C. canephora. Theseare morphologically very similar to C. arabicaand are distinct from each other (Table 1).These distinctions indicate that the geneticarchitecture of each of these selections is uniqueeven though they are derived from similarparents. Distinctions in leaf shape, size andpetiole length appear to have been a contributionof the ancestral Arabica parent. Morphologicalhomogeneity of each of these selections is aresult of continuous selection for characteristicfeatures. Relative uniformity of plants in eachof the selections is a reflection of this. Selectionfor young leaf colour, angle of insertion ofprimary branches, fruit colour, and frequencyof A-grade beans contribute largely to thismorphological and genetic homogeneity of theselections.
Heredity of Leaf Rust ResistanceAll these selections also manifest a high
degree of resistance to the leaf rust diseaseranging from 81.25 to 95.00 percent of thepopulation being resistant (Table 2). In the plotsof Sln.3 (S.795), the control variety, a highfrequency of plants averaging 92.00 percentwere observed to be susceptible. An importantpoint to be considered is that these commercialpopulations are derived from selected plants andhence segregations do not necessarily reflectgenetic laws. However, the observed ratios inRobusta – Arabica hybrids approach 15:1 ofresistant and susceptible plants respectively,indicating that two pairs of genes are involvedin conditioning resistance of these materials.In Sln.3 (S.795) also a similar ratio is observed
69
Second National Plant Breeding Congress 2006 Plant Breeding in Post Genomics Era
with susceptible plants in higher frequency. Thispattern is in conformity with tetrasomic heredityas elucidated in other studies (Ram, 1995,Lashermes et al., 2000; Teixeira-Cabral et al.,2004).
Plants in the commercial populations are thirdgeneration descendants from the parents in thecase of Sln.5A and Sln.5B. It is the thirdgeneration from second backcross in the caseof Sln.6 and second generation in the case ofSln.8. Sln.3 (S.795) included as control is thesixth and seventh generation. Rust resistancegenes of Sln.5A, Sln.5B and Sln.8 are derivedfrom C. canephora while that of Sln.3 is derivedfrom C. liberica (Rodrigues et al., 1975; Eskes,1989; Sreenivasan et al., 1993,1994). From theobserved resistance patterns of various selectionsit is evident that the resistance genes are graduallygetting eliminated with advancing generations, apossible manifestation of negative naturalselection (Sreenivasan et al., 1994). Thus,imposing artificial selection for leaf rust resistancein the seed plots and isolating them can maintainresistance of a high order for a long time in thecommercial populations.
Complementary action of the vertical andhorizontal resistance genes in these selectionswas elucidated (Ram, 2006) and can besuperimposed on the cytogenetics ofinterspecific hybrids to explain the longevity ofrust resistance of Robusta – Arabica hybrids. Asimplified picture of the dynamics of cytogeneticphenomena involved in gene transfer is asfollows.
The genotype of an Arabicoid derived frominterspecific hybridization of Robusta andArabica and stabilized through backcrossing toArabica is shown in the figure 1. This genotypeis derived from the homologous recombinationbetween the chromosomes of Arabica andRobusta. Hereditary dynamics of thischromosomal genotype is shown in thecheckerboard 1.
In the progeny shown in checkerboard 1,normal homozygotes (AA) carrying a pair ofArabica chromosomes form 1/16 of theprogeny (~6%). Structural homozygotes A/R-A/R, R/A-R/A and the substitution line RRbreed true for the character of interest (suchas disease or pest resistance) and comprise aproportion of 3/16 of the progeny (~18%).Structural heterozygotes carrying a Robustachromosome or an Arabica chromosome andthe structurally aberrant Arabica chromosomescarrying a segment of Robusta chromosomeor the structurally aberrant Robustachromosome carrying a segment of Arabicachromosome form the entire remaining progenyof 12/16 (~ 76%). Structural heterozygositymaintains the manifested characters of theseplants by suppressing chromosomalrecombination in a large frequency of sporemother cells. In essence, this leads us to realizeabout 94% of the progeny manifesting thecharacter of interest, leading to an apparentfixation of heterosis (Brewbaker, 1964). Thissituation is described as balanced polymorphismor functional homozygosity of a heterozygote.Dynamic reproductive selection processes(selective fitness of structural heterozygotes,genetic drift etc.) lead to a stabilized populationover three to four generations. This is theexisting situation in all the Robusta – Arabicahybrid selections of the present study. If naturalselection does not favour structuralheterozygotes, the population tends to revert topure Arabica type and substitution types with afew structural homozygotes. Among them, onlythe latter two categories manifest the trait ofinterest, as often observed in the case of rustresistance in advanced generations of Arabicacoffee hybrids. Sixth and seventh generationSln.3 populations represent this situation. Thisexplains the importance of a genomic imprintin the context of evolutionary fitness. Thiscytogenetic model explains the process ofintrogression of genes from diploid species into
70
Second National Plant Breeding Congress 2006 Plant Breeding in Post Genomics Era
C. arabica and holds good for the genesconditioning VR as well as HR as introgressionof these two types of genes can be parallel.
Transmission of Quality TraitsThere is a belief that coffee quality is
compromised in interspecific hybrids. Quality ofcoffee is assessed on the basis of bean size andorganoleptic quality of beverage. Bean sizesabove 6.6mm (A- or AA-grade) are consideredimportant in trade and achieving higherfrequency of this grade in the produce is animportant breeding objective (Walyaro,1983,1997). However, beverage quality wasknown not to be dependent on the bean size(Roche, 1995). Thus, bean grades assumedimportance because uniform size gives uniformroasting that is important to realize good beveragequality (Ram, 2003). Fair Average Quality (FAQ)that is generally accepted in international marketsis realized in the four Robusta – Arabica hybridselections. From the data in table 3, the qualityof various selections derived from diverseparents combining the genes of C. arabica, C.canephora and C. liberica appears not to bediffering significantly. This manifestation haspowerful implications for breeding to improvethe quality of beverage in Arabica as Robustaand Liberica produce a very inferior beverage(Charrier and Berthaud, 1988; Barre et al., 1998).Thus, C. liberica genes introgressed into theArabica variety Sln.3 (S.795) are confined tothe resistance factors (SH genes) and all othersappear to have been eliminated or neutralized inthe course of evolution of this selection. Similarly,Sln.5A, Sln.5B, Sln.6 and Sln.8 that incorporatethe genes of C. canephora are also notexpressing them in the context of quality.
It is possible that some of the genes of C.canephora and C. librica that contribute toquality are suppressed in their expression in C.arabica genomic background. As Robusta andLiberica are diploid species (carrying only twosets of chromosomes and thereby two sets ofgenes) the alternative states of good versus bad
quality character come to expression, as theyexist in the genetic set-up. Arabica, on the otherhand, is a tetraploid (carrying four sets ofchromosomes) in which several othermechanisms of gene expression are likely tobe operational. One such mechanism is“homology dependent or repeat induced genesilencing” in which, the expression of acharacter is driven from a single gene whenmore than two copies of the gene conditioningthat character are present in the same genome(Jorgensen, 1995). In Arabica, apparently thegenes introgressed from other species andinfluencing quality appear to be unable to findexpression as not only the quality of Sln.3carrying the genes of C. liberica but also thequality of Sln.5A, Sln.5B, Sln.6 and Sln.8carrying the genes of C. canephora isappreciated well in the various cup tests. Inthese cases, it is possible that co-suppressionis operating to prevent the expression of genescoming from the diploid species.
Another genetic mechanism that can possiblycause the observed quality in selections is “geneconversion”. In the interspecific hybridsgenerated by crossing closely related species,the reproductive process eliminates most of thenon-homologous chromosomes received fromthe male parent and only those carrying themaximum homology with those of the femaleparent are retained in the first backcrossprogeny. This gets further reduced with eachadvancing cycle of reproduction of thebackcross progeny and within three cycles onlya few blocks of genes of the introgressedspecies will remain in the genome. Thisretention of genes is usually because they arefavourably selected in each reproductive cycle.Such conscious selection was practiced in ourcountry with reference to the rust resistancegenes. The selection for genes conditioningquality of coffee was also evidently verysuccessful as reflected in the data of Table 3even though it was not intended. How does this
71
Second National Plant Breeding Congress 2006 Plant Breeding in Post Genomics Era
happen? Available evidence indicates thatinheritance of genes in Arabica does not alwaysconform to the simple Mendelian order. Thus,for the characters native to C. arabicaMendelian inheritance was recorded (Krug andCarvalho, 1951). Conversion of genes wasreported in the interspecific hybrids of Coffea(Ky et al., 2000). Considering the basicinterspecific hybrid nature of C. arabica andthe dual modes of inheritance for single lociobserved in the tetraploid interspecific hybridsof C. arabica x C. canephora, it is plausible toinfer that natural selection favours the genes ofC. arabica conditioning the various traits ofquality (which are well conserved in all the abovehybrids) (Narasimhaswamy, 1960, 1971; Ganeshet al., 2002) through conversion of diploid genes.Thus, natural selection played a key role in thequality improvement of Indian coffee selections.This inference gains support from reports on thebeverage quality of Icatu hybrids of Brazil(Fazuoli et al., 1977; Petracco, 2000), Hibridode Timor and derived lines such as Catimor,Sarchimor and Colombia (Bertrand et al., 2003)and a recently developed hybrid of Catimor x(Congensis x Robusta) (Srinivasan et al., 2004)as all of them are reported to possess goodbeverage quality.
RAPD Markers in Advanced GenerationsIt is hypothesized that in advanced generations
all characters and the genes conferring them arewell stabilized and hence, unique markers foundto be associated with a complex of charactersbreed true. Preliminary results obtained from theamplification experiments on the DNA of Sln.8and Sln.6 (Figs. 2 and 3) indicate distinctionsbetween resistant and susceptible plants in theseselections. These observations appear to confirmthe hypothesis. Some of the unique RAPDfragments inherited from specific parent werealso identified in Sln.6 (Fig. 4). Further work inthis aspect is expected to lead to the identificationof additional unique markers in the resistant plants
producing good beverage quality. Thesemarkers have a diagnostic utility in identifyingplants possessing these traits at an earlydevelopmental stage like nursery for theestablishment of seed gardens and constitutethe initial approach to a marker assistedselection programme.
Foregoing discussion provides a deep insightinto the genetic and cytogenetic phenomenaunderlying the evolution of Robusta – Arabicahybrids of coffee. The insight gained is of greatpractical utility in identifying the particulargeneration that can be exploited commercially.The four selections of Robusta – Arabicahybrids are derived from diverse parents butpossess similar quality. They also manifest highresistance to leaf rust. The diversity of parentsimplies that these traits are conferred by adifferent complex of genes in each of theselections. Thus, a combination of theseselections yields produce of relatively uniformquality and forms a resistance gene pyramidthat stands highly resistant to the leaf rustdisease for a very long time. These insights alsohelp in identifying the mother plants that canbe excellent seed bearers that maintain theresistance genes without compromisingproductivity and quality. This analysis alsoprovides a clear understanding of the directionand method of selection and backcrossing tobe undertaken when loss of resistance isexperienced in advanced generations. Thus, anew strategy combining the cytogenetic resultsand molecular markers is expected to result ingreater efficiency of the coffee breedingprogramme. This study also revealed that IndianRobusta – Arabica hybrids could be potentialsources of new rust resistance genes.
REFERENCESAnthony, F., Bertrand, B., Quiros, O., Wilches,
A., Lashermes, P., Berthaud, J., Charrier,A. 2001. Genetic diversity of wild coffee(Coffea arabica L.) using molecular
72
Second National Plant Breeding Congress 2006 Plant Breeding in Post Genomics Era
markers. Euphytica. 118: 53-65.Barre, P., Akaffou, S., Louarn, J., Charrier, A.,
Hamon, S., Noirot, M. 1998. Inheritance ofcaffeine and heteroside in an interspecificcross between a cultivated coffee speciesCoffea liberica var. dewevrei and a wildspecies caffeine free C. pseudozanguebariae. Theor. Appl. Genet. 96:306-311.
Bertrand, B., Guyot, B., Anthony, F., Lashermes,P. 2003. Impact of the Coffea canephoragene introgression on beverage quality ofC. arabica. Theor. Appl. Genet. 107: 387-394.
Bettencourt, A.J. 1973. Consideracoes geraissobre o Hibrido de Timor. Circular # 23.Sao Paulo (Brazil): Instituto Agronomico deCampinas. 20 p.
Bettencourt, A.J., Lopes, J., Palma, S. 1992.Factores geneticos que condicionam aresistencia as racas de Hemileia vastatrixBerk. et Br. dos clones tipo dos grupos 1, 2e 3 de derivados de Hibrido de Timor.Broteria Genetica. XIII (LXXX): 185-194.
Brewbaker, J.L. 1964. Agricultural Genetics.Englewood Cliffs, New Jersey (USA):Prentice-Hall. 156 p.
Carvalho, A. 1952. Taxonomia de Coffeaarabica L., caracters morfologicos doshaploides. Bragantia 12: 201-212.
Charrier, A., Berthaud J. 1988. Principles andMethods in Coffee Plant Breeding: Coffeacanephora Pierre. In: Clarke RJ, MacraeR, editors. Coffee (Vol.IV) Agronomy.London (UK) and New York (USA):Elsevier Applied Science. p.167-197.Darlington CD. 1946. The Evolution ofGenetic Systems. London (UK): CambridgeUniversity Press. 151 p.
Dawson, G.W.P. 1962. An Introduction to theCytogenetics of Polyploids. Oxford (UK):Blackwell Scientific. 95 p.
Eskes, A.B. 1989. Resistance. In: KushalappaAC, Eskes AB, editors. Coffee Rust:Epidemiology, Resistance andManagement. Boca Raton (Florida, USA):CRC Press. p.171-292.
Fazuoli, L.C., Carvalh, A., Monaco, L.C.,Teixeira, A.A. 1977. Qualidade de bebidado café Icatu. Bragantia. 36: 165-172.
Ganesh, D., Ram, A.S., Prakash, N.S., Ahmed,J., Mishra, M.K., Jagadeesan, M., Reddy,A.G.S., Srinivasan, C.S. 2002. Evaluationof Coffea liberica x Coffea eugenioidesand its progenies for yield, leaf rusttolerance and quality. In: Sreedharan K,Vinod Kumar PK, Jayarama, Chulaki, BM,editors. Proceedings of PLACROSYMXV, 10-13, December 2002. Mysore(India): Indian Society for Plantation Crops.p. 72-77.
Grassias, M., Kammacher, P. 1975.Observations sur la conjugaisonchromosomique de Coffea arabica L.Café Cacao The 19: 177-190.
Jorgensen, R.A. 1995. Cosuppression, Flowercolor patterns and Metastable geneexpression states. Science 268: 686-691.
Kammacher, P. 1977. Utilisation des ressourcesgenetiques du genre Coffea pourl’amelioration des cafeiers cultives. In:Proceedings of VIII International ScientificColloquium on Coffee. 28 November – 3December 1977. Abidjan (Ivory Coast).Association Scientifique Internationale duCafé. p. 335-358.
Krug, C.A, Carvalho, A. 1951. The Geneticsof Coffea. Adv. Genet. 4: 128-158.
Kushalappa, A.C., Eskes, A.B. 1989. CoffeeRust: Epidemiology, Resistance andManagement. Boca Raton (Florida, USA),CRC Press. 345 p.
Ky CL, Barre, P., Lorieux, M., Trouslot, P.,Akaffou, S., Luarn, J., Charrier, A., Hamon,S., Noirot, M. 2000. Interspecific genetic
73
linkage map, segregation distortion andgenetic conversion in coffee (Coffea sp.).Theor. Appl. Genet. 101: 669-676.
Lashermes, P., Combes, M.C., Trouslot, P.,Charrier, A. 1996. Genetic diversity forRAPD markers between cultivated and wildaccessions of Coffea arabica. Euphytica.87: 59-64.
Lashermes, P., Paczek, V., Trouslot, P., Combes,M.C., Couturon,E., Charrier, A. 2000. Singlelocus inheritance in the allotetraploid Coffeaarabica L. and interspecific hybrid C.arabica x C. canephora. J. Heredity. 91:81-85.
Lashermes, P., Combes, M.C., Cros, J., Trouslot,P., Anthony, F., Charrier, A.1995. Origin andgenetic diversity of Coffea arabica L. basedon DNA molecular markers. In :Proceedings of XVI International ScientificColloquim on Coffee, 9 – 14 April 1995.Kyoto City (Japan): Association ScientifiqueInternationale du Café. p.528-536.
Marshall, C.F. 1985. World Coffee Trade. In:Clifford MN, Willson KC, editors. Coffee:Botany, Biochemistry and Production ofBeans and Beverage Westport (Connecticut,USA): Avi Publishing Co. Inc. p.251-283.
Narasimhaswamy, R.L. 1960. Arabica selectionS.795: Its origin and performance – A study.Indian Coffee 24:197-204.
Narasimhaswamy, R.L. 1971. S.795 Arabica andQuality. Indian Coffee 35: 371-372.
Petracco, M. 2000. Organoleptic properties ofespresso coffee as influenced by coffeebotanical variety. In: Sera T, Soccol, CR,Pandey A, Roussos S, editors. CoffeeBiotechnology and Quality. Dordrecht (TheNetherlands). Kluwer Academic Publishers.p. 347-353.
Ram ,A.S. 1995. New dimensions inunderstanding inheritance of coffee rustresistance: A Mendelian perspective. In :Proceedings of XVI International Scientific
Colloquim on Coffee, 9 –14 April 1995.Kyoto City (Japan): AssociationScientifique Internationale du Café. p.548-556.
Ram, A.S. 2001. Breeding for rust resistancein coffee: The gene pyramid model. J.Plantn. Crops. 29: 10-15.
Ram, A.S. 2003. Coffee primary processing inKenya and Tanzania. Indian Coffee 67:(9):9-11.
Ram, A.S. 2004. Coffea arabica L- ACompilospecies: Implications for Breeding.In: Proceedings of XX InternationalScientific Colloquium on Coffee. Bangalore(India): 10-14 October 2004. AssociationScientifique Internationale du Café.(Electronic Publication).
Ram, A.S. 2006. Genetic basis of rustresistance in Arabica coffee. (inpreparation).
Ram, A.S, Ganesh, D., Srinivasan, C.S., Reddy,A.G.S. 2004. Ligenioides – A source of newgenes for Arabica coffee breeding. J.Plantn. Crops. 32 (Suppl.): 5-11.
Ram, A.S, Sreenath, H.L. 1999. A method forthe isolation and amplification of coffeeDNA with random octamer and decamerprimers. J. Plantn. Crops. 27:125-130.
Roche, D. 1995. Coffee genetics and quality.In : Proceedings of XVI InternationalScientific Colloquim on Coffee, 9 –14 April1995. Kyoto City (Japan): AssociationScientifique Internationale du Café. p.584-588.
Rodrigues, J.r. C.J., Bettencourt, A.J., Rijo, L.1975. Races of the pathogen and resistanceto coffee rust. Annu. Rev. Phytopathology 13: 49-70.
Rodrigues, Jr. C,.J., Varzea, V.M.P., Godinho,I.L., Palma, S., Rato, R.C. 1993. Newphysiologic races of Hemileia vastatrix.In: Proceedings of XV InternationalScientific Colloquium on Coffee,
Second National Plant Breeding Congress 2006 Plant Breeding in Post Genomics Era
74
Second National Plant Breeding Congress 2006 Plant Breeding in Post Genomics Era
Montpellier (France). AssociationScientifique Internationale du Café. p. 318-321.
Rodrigues, Jr. C.J., Varzea ,V., Silva, M.C.,Guerra-Guimares, L., Rocheta, M., Marques,D.V. 2000. Recent advances on coffee leafrust. In: Prakash NS, Raghuramulu Y,Devasia J, editors. Proceedings ofInternational Symposium on Coffee. CentralCoffee Research Institute. p. 179-193.
Smith, R.F. 1985. A history of coffee. In: CliffordMN, Willson KC, editors. Coffee: Botany,Biochemistry and Production of Beans andBeverage. Westport (Connecticut, USA):Avi Publishing Co. Inc. p. 1-12.
Sreenivasan, M.S., Ram, A.S., Prakash, N.S.1993. Tetraploid interspecific hybrids incoffee breeding in India. In: Proceedings ofXV International Scientific Colloquium onCoffee. Montpellier (France) 6-11 June 1993.Association Scientifique Internationale duCafé. p. 226-233.
Sreenivasan, M.S., Ram, A.S., Prakash, N.S.1994. Search for new sources of resistanceto coffee leaf rust. Report on theInternational Collaborative Project“Pathology and Improvement of Coffee(Coffea arabica) for the Main Diseases”,Central Coffee Research Institute (India).24 p.
Srinivasan, C.S., Kumar, A., Amaravenmathy,V.S., Ram, A.S. 2004. Robusta like coffeeplants with arabica like coffee quality. Mythor possibility. In: Proceedings of XXInternational Scientific Colloquium onCoffee. Bangalore (India). 10-14 October2004. Association Scientifique Internationale
du Café. (Electronic Publication).Stebbins, G.L. 1971. Processes of Organic
Evolution (2nd Ed.). Englewood Cliffs (NewJersey, USA): Prentice-Hall, 193 p.
Teixeira-Cabral, T.A, Sakiyama, N.S.,Zambolim, L., Pereira, A.A., Schuster, I.2004. Single locus inheritance and partiallinkage map of Coffea arabica L. CropBreeding and Applied Biotechnology 4:416-421.
Walyaro, D.J. 1983. Considerations inbreeding for improved yield and qualityin arabica coffee (Coffea arabica L.).Ph.D. Thesis. Wageningen (TheNetherlands): Agricultural University ofWageningen. 119 p.
Walyaro, D.J. 1997. Breeding for disease andpest resistance and improved quality incoffee. In: Proceedings of XVIIInternational Scientific Colloquium onCoffee. Nairobi (Kenya). 20-25 July 1997.Association Scientifique Internationale duCafé. p.391-404.
Williams, J.G.K., Kubelik, A.R., Livak, K.J.,Rafalski, J.A., Tingey, S.V. 1990. DNApolymorphisms amplified by arbitraryprimers are useful as genetic markers.Nucleic Acids Res. 18: 6531-6535.
75
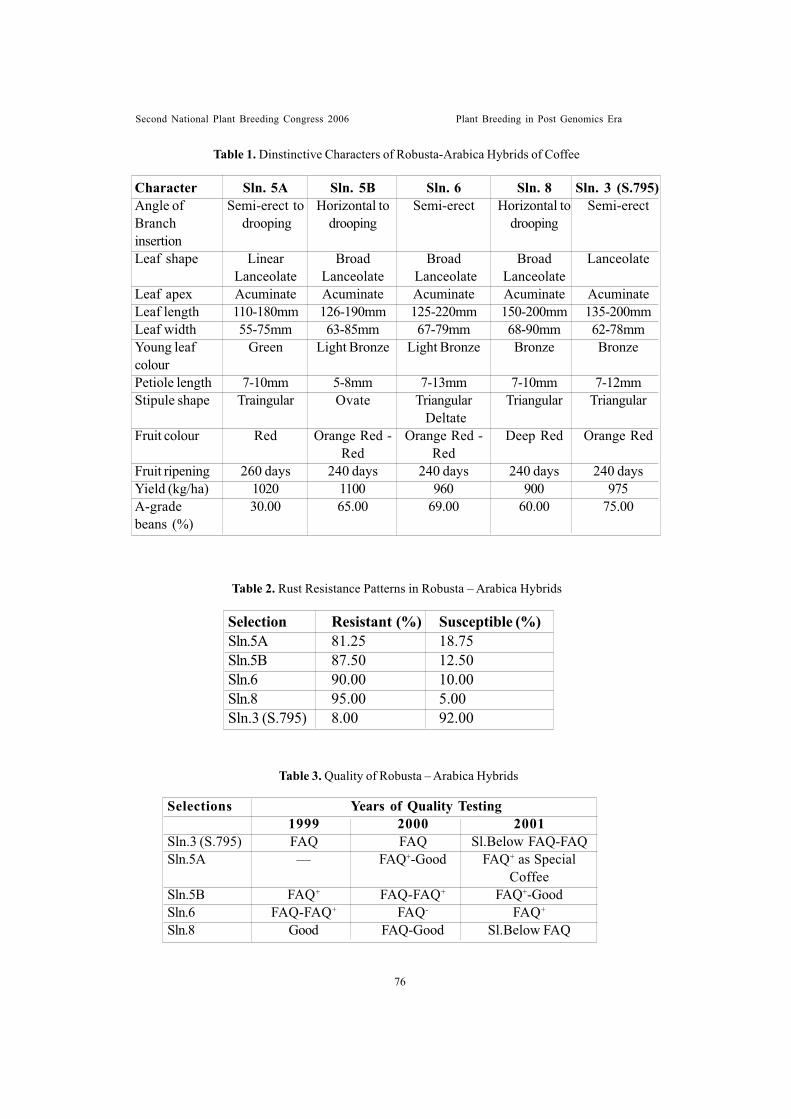
Table 1. Dinstinctive Characters of Robusta-Arabica Hybrids of Coffee
Character Sln. 5A Sln. 5B Sln. 6 Sln. 8 Sln. 3 (S.795)Angle of Semi-erect to Horizontal to Semi-erect Horizontal to Semi-erectBranch drooping drooping droopinginsertionLeaf shape Linear Broad Broad Broad Lanceolate
Lanceolate Lanceolate Lanceolate LanceolateLeaf apex Acuminate Acuminate Acuminate Acuminate AcuminateLeaf length 110-180mm 126-190mm 125-220mm 150-200mm 135-200mmLeaf width 55-75mm 63-85mm 67-79mm 68-90mm 62-78mmYoung leaf Green Light Bronze Light Bronze Bronze BronzecolourPetiole length 7-10mm 5-8mm 7-13mm 7-10mm 7-12mmStipule shape Traingular Ovate Triangular Triangular Triangular
DeltateFruit colour Red Orange Red - Orange Red - Deep Red Orange Red
Red RedFruit ripening 260 days 240 days 240 days 240 days 240 daysYield (kg/ha) 1020 1100 960 900 975A-grade 30.00 65.00 69.00 60.00 75.00beans (%)
Table 2. Rust Resistance Patterns in Robusta – Arabica Hybrids
Table 3. Quality of Robusta – Arabica Hybrids
Second National Plant Breeding Congress 2006 Plant Breeding in Post Genomics Era
Years of Quality TestingSelections1999 2000 2001
Sln.3 (S.795) FAQ FAQ Sl.Below FAQ-FAQSln.5A — FAQ+-Good FAQ+ as Special
CoffeeSln.5B FAQ+ FAQ-FAQ+ FAQ+-GoodSln.6 FAQ-FAQ+ FAQ- FAQ+
Sln.8 Good FAQ-Good Sl.Below FAQ
Selection Resistant (%) Susceptible (%)Sln.5A 81.25 18.75Sln.5B 87.50 12.50Sln.6 90.00 10.00Sln.8 95.00 5.00Sln.3 (S.795) 8.00 92.00
76
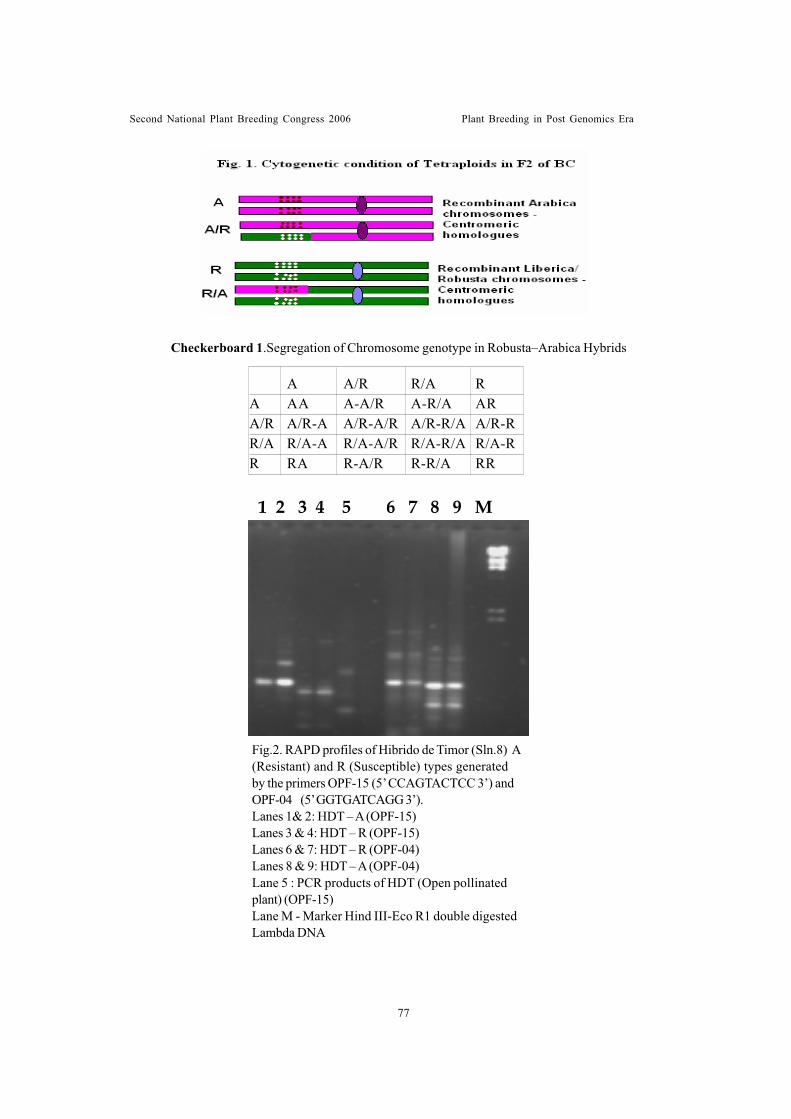
Second National Plant Breeding Congress 2006 Plant Breeding in Post Genomics Era
Checkerboard 1.Segregation of Chromosome genotype in Robusta–Arabica Hybrids
Fig.2. RAPD profiles of Hibrido de Timor (Sln.8) A(Resistant) and R (Susceptible) types generatedby the primers OPF-15 (5’ CCAGTACTCC 3’) andOPF-04 (5’ GGTGATCAGG 3’).Lanes 1& 2: HDT – A (OPF-15)Lanes 3 & 4: HDT – R (OPF-15)Lanes 6 & 7: HDT – R (OPF-04)Lanes 8 & 9: HDT – A (OPF-04)Lane 5 : PCR products of HDT (Open pollinatedplant) (OPF-15)Lane M - Marker Hind III-Eco R1 double digestedLambda DNA
A A/R R/A RA AA A-A/R A-R/A ARA/R A/R-A A/R-A/R A/R-R/A A/R-RR/A R/A-A R/A-A/R R/A-R/A R/A-RR RA R-A/R R-R/A RR
77
1 2 3 4 5 6 7 8 9 M
EVALUATION AND UTILIZATION OF BIODIVERSITY IN CASSAVA(MANIHOT ESCULENTA CRANTZ)
Santha V. Pillai1, R.R. Nair, M.S. Palaniswami, C.S. Ravindran,
S.N. Moorthy, V. Ravi and S. Sree Lekha
ABSTRACTCollection, evaluation and utilization of the biodiversity available in the crop is the
basic requirement in any plant breeding program. As such, more than 1600 accessions ofCassava, consisting of both indigenous and exotic accessions, were assembled at CentralTuber crops Research Institute, Trivandrum. These accessions were evaluated for economiccharacters like tuber yield and quality parameters like starch content, cooking quality,cyanogen content, keeping quality and tolerance to Cassava Mosaic Disease (CMD),white fly, drought etc and genetic stocks were identified for each character. Some of thepromising accessions, combining high yield, good quality and tolerance were evaluated inreplicated trials and the selections are undergoing on-farm trials in Kerala and TamilNadu. CMD tolerant accessions are being utilized in the hybridization program. Theywere also evaluated for unconventional characters like leaf yield and also quality ofstarch. Cassava leaf is increasingly being used in cattle feed, pet animal feed and alsosilviculture. The quality of starch namely, Amylose content, Amylopectin and AP/Am ratiowhich determine the suitability of starch for specific industrial use, was analysed. Thegermplasm was also screened for morphological characters, biochemical markers (Isozyme)as well as molecular markers (DNA-RAPD) in tune with international standards foridentification of varieties and isolation of duplicates. This information, along with thaton economic characters and passport data were utilized to arrive at a core collection ofcassava germplasm. At present, the land races of cassava are being analysed formicrosatellite markers to study the molecular variability and diversity available in thepopulation and also for DNA fingerprinting of farmer’s varieties. Microsatellite markersare also being utilized to identify varieties resistant to CMD and white fly. Details arepresented in the paper.
IntroductionCassava (Manihot esculenta Crantz) is a
popular tuber crop grown in the tropical belt ofAsia, Africa and South America. In India, it ismostly grown in the Southern region, especially,Kerala, Tamil Nadu and parts of Andhra Pradesh.In Kerala, it is grown as a subsidiary food crop,whereas in Tamil Nadu and Andhra Pradesh, itforms the raw material for starch and sagoindustry. Research on cassava started in Keralaabout 50 years ago, under the University, byintroduction of varieties from other cassavagrowing areas and improving them byintercrossing, mutation breeding, polyploidy
breeding etc. The Central Tuber CropsResearch Institure, Trivandrum was establishedin 1963 and it is the main centre for tuber cropsresearch.Research on cassava is going on in afew Universties as well including TNAU,Coimbatore.
India can boast of the highest productivity inthe world; 26t/ha, against the global average of10 t/ha. This high yield in India is mostly acontribution of Tamil Nadu, where improvedvarieties developed at research centres aregrown under irrigated conditions.
Still, development of improved varieties, suitedto different needs, at different times is a major
1. Central Tuber Crops Research Institute, Trivandrum 695017
Second National Plant Breeding Congress 2006 Plant Breeding in Post Genomics Era
78
item of research. Germplasm is the raw materialfor the purpose. The Central Tuber CropsResearch Institute is maintaining more than 1600accessions of cassava collected from differentcountries. Over the years, a number of improvedvarieties, suited for both edible purpose as wellas for stach extraction were developed. Thevarieties H-226 and H-165 developed at theInstitute occupy sizeable area in the starchfactory areas. At present the germplasm is alsoevaluated for non-conventional characters andfor varying purposes and more sophisticated toolsare employed for evaluation and utilization ofgermplasm. Some of the items of work going onat CTCRI, Trivandrum in this direction arepresented in the paper.
Materials and MethodsThe germplasm collection of cassava,
numbering about 1600, available at the Instituteformed the material for the study. They werescreened for presence or absence of CassavaMosaic Disease (CMD) symptom and a subsetof about 75 symptom free accessions wereevaluated for yield, quality and other specialcharacters. The accessions showing any of theyield / quality component in high level wereselected as genetic stocks for that character, forfurther use in the breeding program. The bestpromising accessions were evaluated onreplicated trial for 3 consecutive years andselected ones are undergoing on-farm trials bothin Kerala and Tamil Nadu.
The subset was screened for specialcharacters like tolerance to drought , white fly,keeping quality etc and the best performers wereidentified. The subset was also screened for non-conventional characters like leaf yield and qualityof starch.
The germplasm, was also characterized basedon different markers namely, morphological,biochemical (Isozyme) and molecular (DNA-RAPD), to identify and isolate duplicates andeliminate them from the field in due course. This
information, along with that on genetic stocksand geographical representation, was used toidentify a tentative core collection of thegermplasm.
Results and DiscussionSeventy five out of the 1300 accessions,
screened for the incidence of CMD were foundto the symptom free. The symptom freeaccessions (75) were evaluated for yield andquality and subjected to genetic analysis.Phenotypic coefficient of variation was thehighest for weight of shoot (69.74), followedby cyanogen content (66.74) and tuber yieldper plant (54.85) (Table 1). Weight of shootper plant was found to have the highestcorrelation with yield (0.80), followed bynumber of tubers per plant (0.60).
Genetic stocks for yield, starch and lowcyanogen were identified for use inrecombination breeding [Table 2]. Tuber yieldabove 2.55 kg/plant, starch above 30% andcyanogen below 20 ppm were kept asyardsticks. Six promising lines identified fromthe subset were evaluated in replicated plot trial.Two of the selected accessions are undergoingon-farm trials in 6 districts of Kerala and theperformance is good. Some of the selectionsare undergoing on-farm trial in Tamil Nadu.These selections were found to be better suitedto the hilly regions of the state.
Sixty three CMD free accessions werescreened for drought tolerance under rain fedcondition in upland. Four months drought periodexisted during the season.
Nineteen accessions showed very highdrought tolerance based on one or other criterianamely, high Leaf Area Index (LAI), high tuberyield or high starch content (Table 3). Nowcassava cultivation is spreading to dry areas aswell, especially in Andhra Pradesh and there isa need for drought tolerant varieties. At presentH-165, a short duration variety, which escapedrought, is cultivated in these areas.
Second National Plant Breeding Congress 2006 Plant Breeding in Post Genomics Era
79
Twenty one CMD free accessions wereevaluated for the incidence of white fly. Twoaccessions were found to have very lowincidence (Table 4). CMD is a serious diseasein cassava and it is spread through white fly.Varieties having resistance to white flyinfestation may be able to evade CMD and hencethis approach.
About 50 CMD free accessions wereevaluated for keeping quality of tuber. Tuberswere cut into 2 pieces and kept under net. Twoaccessions could be kept up to 5 days withoutblack spot. Fast perishability is a very biglimitation in cassava and we had observed thatvariability for this character exists. But thenumber of varieties with keeping quality is verylow.
Six CMD free accessions with branchingcharacter were screened for leaf yield.Accession no E-34 gave the highest leaf yieldof 1.68 kg per plant. Cassava leaf is found to besuited for pet animal feed, in addition to cattlefeed and is in great demand (Metha Wanapat,2002). And hence, this work was initiated tocreate a database.
Twelve accessions were screened for qualityof starch namely Amylose content, Amylopectincontent and Ap/Am ratio. The accession no E-108 gave the highest Amylose content of 30 %,and accession no E-109 showed the highest Ap/Am ratio of 4 (Table 5). The proportion of thesecomponents of starch determines the suitabilityof starch for specific purposes. Satrch with highAmylose content is best suited for textileswhereas that with high Ap/Am ratio is bestsuited for fish feed, by virtue of its bindingproperty.
The germplasm was also characterized basedon morphological markers as well as biochemical(Iszoyme) and molecular markers (DNA /RAPD). This information was used to identifyduplicate accessions in the germplasm as perinternational standards (Ocampo et al. 1995).
About 90 accessions were found to be duplicate.
DNA/RAPD analysis was also used forDNA fingerprinting of released varieties as wellas that of elite breeding lines. This is veryimportant to safe guard the Plant Breeders’Right as well as the Farmers’ Right in the newIPR (Intellectual Property Right) regime.
The data on genetic stocks, duplicates andgeographical representation were utilized toarrive at a core collection of the germplasmconsisting of 15% of the accessions (Table 6).Identification of a smaller subset, representingthe variability is essential when the number ofcollection become very large (Santha and Nair,2002).
Researches are going on to use morepowerful molecular markers like SSR and ISSRto screen the varieties for resistance to CMDand white fly,and also to study the variabilityand diversity available in the local collection.
REFERENCESMetha Wanapat. 2002. The role of cassava hay
as animal feed. Paper presented in SeventhAsian Cassava Research Workshop,October 28-November 1, 2002. CIAT,Bangkok. P.21.
Ocampo, C., Angel, F., Jimenez, A., Jaramillo,G., Hershey, C., Granados, E., Iglesias, C.1995. DNA fingerprinting to confirmpossible genetic duplicates in cassavagermplasm .Paper presented in the SecondInternational Scientific Meeting of theCassava Biotechnology Network held atBogor, Indonesia: August 22-26, 1994,CIAT, Cali, Columbia. P.145-151.
Santha, V., Pillai Nair, R. R. 2002. Germplasmmanagement in cassava with specialemphasis on core collection Paperpresented in the National VegetableConference held at Bangalore, Nov. 10-14, 2002.
Second National Plant Breeding Congress 2006 Plant Breeding in Post Genomics Era
80
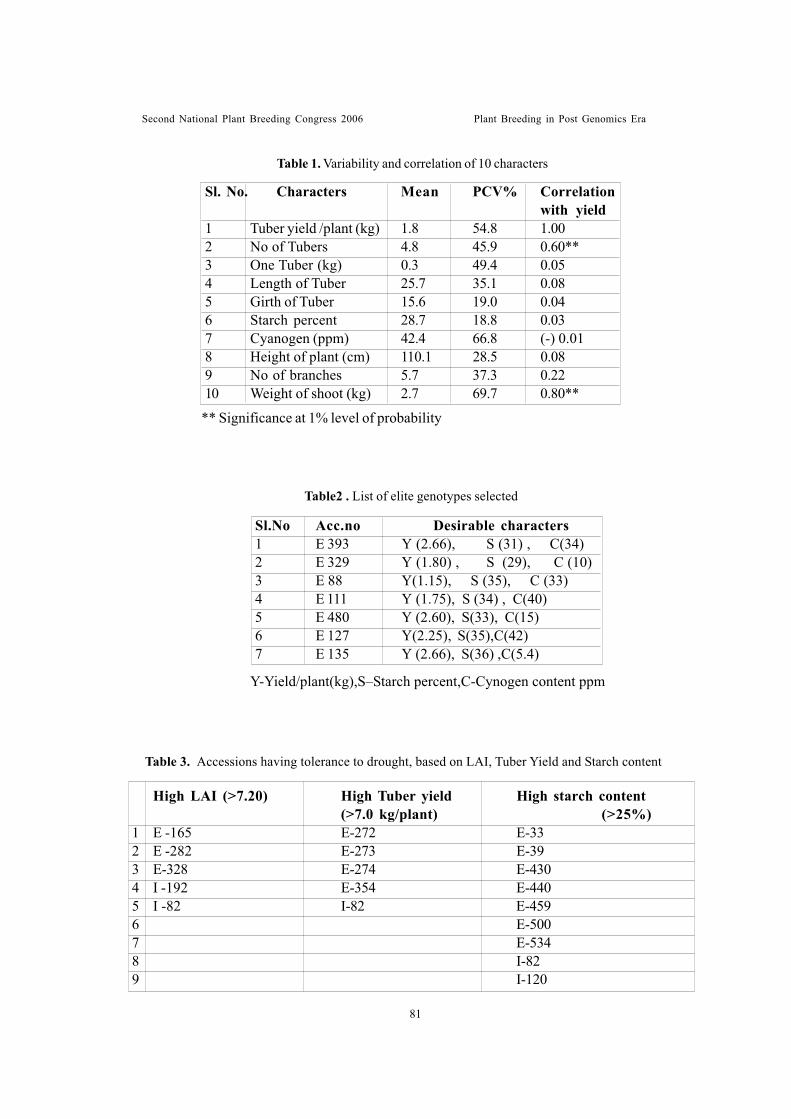
Table 1. Variability and correlation of 10 characters
Sl. No. Characters Mean PCV% Correlationwith yield
1 Tuber yield /plant (kg) 1.8 54.8 1.002 No of Tubers 4.8 45.9 0.60**3 One Tuber (kg) 0.3 49.4 0.054 Length of Tuber 25.7 35.1 0.085 Girth of Tuber 15.6 19.0 0.046 Starch percent 28.7 18.8 0.037 Cyanogen (ppm) 42.4 66.8 (-) 0.018 Height of plant (cm) 110.1 28.5 0.089 No of branches 5.7 37.3 0.2210 Weight of shoot (kg) 2.7 69.7 0.80**
** Significance at 1% level of probability
Table2 . List of elite genotypes selected
Sl.No Acc.no Desirable characters1 E 393 Y (2.66), S (31) , C(34)2 E 329 Y (1.80) , S (29), C (10)3 E 88 Y(1.15), S (35), C (33)4 E 111 Y (1.75), S (34) , C(40)5 E 480 Y (2.60), S(33), C(15)6 E 127 Y(2.25), S(35),C(42)7 E 135 Y (2.66), S(36) ,C(5.4)
Y-Yield/plant(kg),S–Starch percent,C-Cynogen content ppm
Table 3. Accessions having tolerance to drought, based on LAI, Tuber Yield and Starch content
Second National Plant Breeding Congress 2006 Plant Breeding in Post Genomics Era
High LAI (>7.20) High Tuber yield High starch content(>7.0 kg/plant) (>25%)
1 E -165 E-272 E-332 E -282 E-273 E-393 E-328 E-274 E-4304 I -192 E-354 E-4405 I -82 I-82 E-4596 E-5007 E-5348 I-829 I-120
81
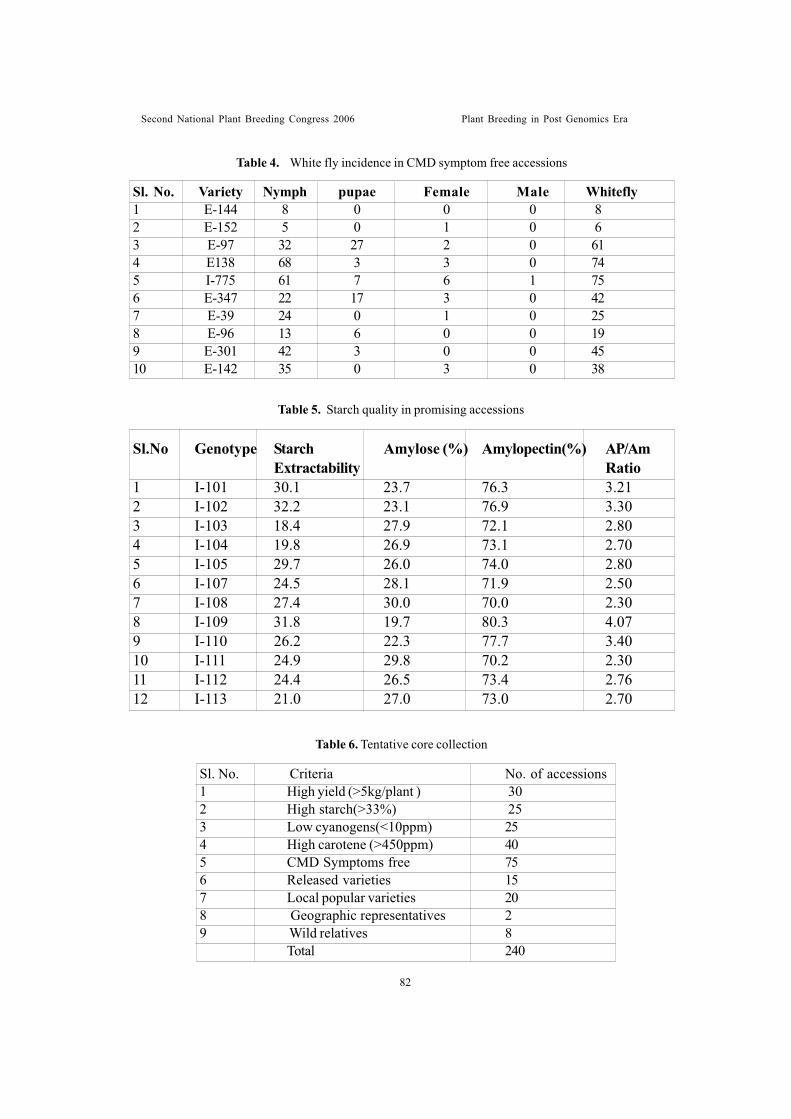
Table 4. White fly incidence in CMD symptom free accessions
Table 5. Starch quality in promising accessions
Sl. No. Variety Nymph pupae Female Male Whitefly1 E-144 8 0 0 0 82 E-152 5 0 1 0 63 E-97 32 27 2 0 614 E138 68 3 3 0 745 I-775 61 7 6 1 756 E-347 22 17 3 0 427 E-39 24 0 1 0 258 E-96 13 6 0 0 199 E-301 42 3 0 0 4510 E-142 35 0 3 0 38
Sl.No Genotype Starch Amylose (%) Amylopectin(%) AP/AmExtractability Ratio
1 I-101 30.1 23.7 76.3 3.212 I-102 32.2 23.1 76.9 3.303 I-103 18.4 27.9 72.1 2.804 I-104 19.8 26.9 73.1 2.705 I-105 29.7 26.0 74.0 2.806 I-107 24.5 28.1 71.9 2.507 I-108 27.4 30.0 70.0 2.308 I-109 31.8 19.7 80.3 4.079 I-110 26.2 22.3 77.7 3.4010 I-111 24.9 29.8 70.2 2.3011 I-112 24.4 26.5 73.4 2.7612 I-113 21.0 27.0 73.0 2.70
Table 6. Tentative core collection
Sl. No. Criteria No. of accessions1 High yield (>5kg/plant ) 302 High starch(>33%) 253 Low cyanogens(<10ppm) 254 High carotene (>450ppm) 405 CMD Symptoms free 756 Released varieties 157 Local popular varieties 208 Geographic representatives 29 Wild relatives 8
Total 240
Second National Plant Breeding Congress 2006 Plant Breeding in Post Genomics Era
82
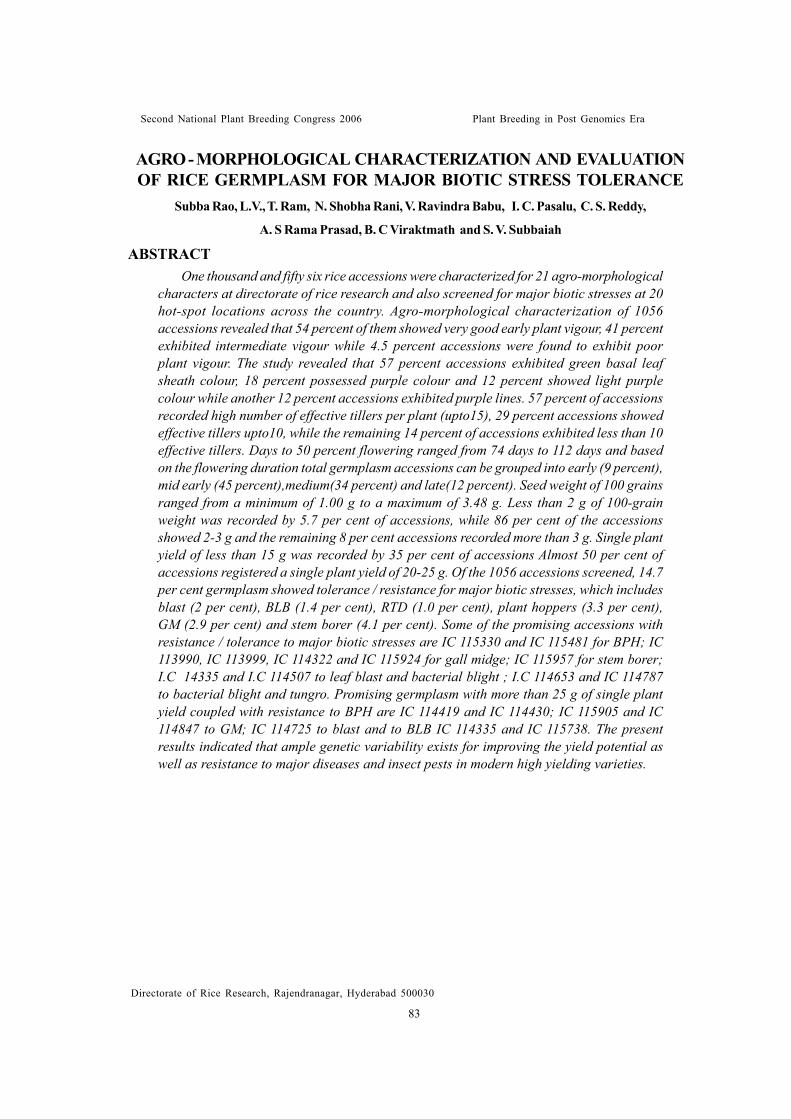
AGRO - MORPHOLOGICAL CHARACTERIZATION AND EVALUATIONOF RICE GERMPLASM FOR MAJOR BIOTIC STRESS TOLERANCE
Subba Rao, L.V., T. Ram, N. Shobha Rani, V. Ravindra Babu, I. C. Pasalu, C. S. Reddy,
A. S Rama Prasad, B. C Viraktmath and S. V. Subbaiah
ABSTRACTOne thousand and fifty six rice accessions were characterized for 21 agro-morphological
characters at directorate of rice research and also screened for major biotic stresses at 20hot-spot locations across the country. Agro-morphological characterization of 1056accessions revealed that 54 percent of them showed very good early plant vigour, 41 percentexhibited intermediate vigour while 4.5 percent accessions were found to exhibit poorplant vigour. The study revealed that 57 percent accessions exhibited green basal leafsheath colour, 18 percent possessed purple colour and 12 percent showed light purplecolour while another 12 percent accessions exhibited purple lines. 57 percent of accessionsrecorded high number of effective tillers per plant (upto15), 29 percent accessions showedeffective tillers upto10, while the remaining 14 percent of accessions exhibited less than 10effective tillers. Days to 50 percent flowering ranged from 74 days to 112 days and basedon the flowering duration total germplasm accessions can be grouped into early (9 percent),mid early (45 percent),medium(34 percent) and late(12 percent). Seed weight of 100 grainsranged from a minimum of 1.00 g to a maximum of 3.48 g. Less than 2 g of 100-grainweight was recorded by 5.7 per cent of accessions, while 86 per cent of the accessionsshowed 2-3 g and the remaining 8 per cent accessions recorded more than 3 g. Single plantyield of less than 15 g was recorded by 35 per cent of accessions Almost 50 per cent ofaccessions registered a single plant yield of 20-25 g. Of the 1056 accessions screened, 14.7per cent germplasm showed tolerance / resistance for major biotic stresses, which includesblast (2 per cent), BLB (1.4 per cent), RTD (1.0 per cent), plant hoppers (3.3 per cent),GM (2.9 per cent) and stem borer (4.1 per cent). Some of the promising accessions withresistance / tolerance to major biotic stresses are IC 115330 and IC 115481 for BPH; IC113990, IC 113999, IC 114322 and IC 115924 for gall midge; IC 115957 for stem borer;I.C 14335 and I.C 114507 to leaf blast and bacterial blight ; I.C 114653 and IC 114787to bacterial blight and tungro. Promising germplasm with more than 25 g of single plantyield coupled with resistance to BPH are IC 114419 and IC 114430; IC 115905 and IC114847 to GM; IC 114725 to blast and to BLB IC 114335 and IC 115738. The presentresults indicated that ample genetic variability exists for improving the yield potential aswell as resistance to major diseases and insect pests in modern high yielding varieties.
Directorate of Rice Research, Rajendranagar, Hyderabad 500030
Second National Plant Breeding Congress 2006 Plant Breeding in Post Genomics Era
83
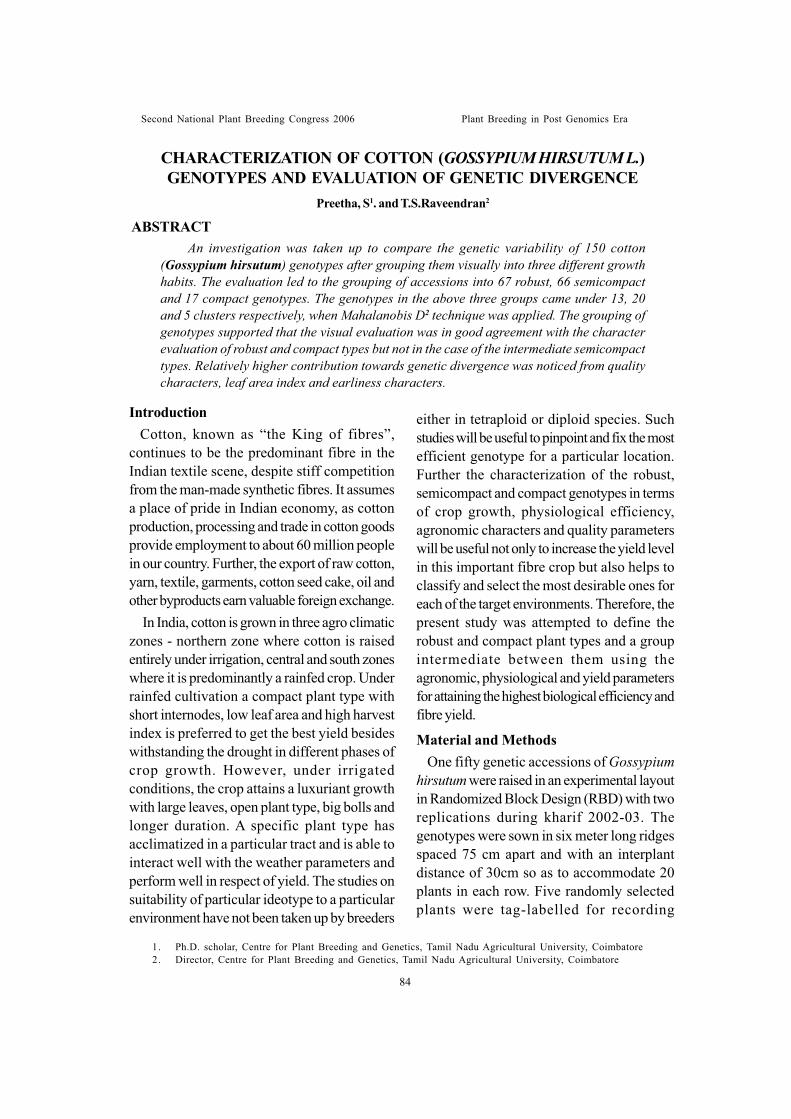
CHARACTERIZATION OF COTTON (GOSSYPIUM HIRSUTUM L.)GENOTYPES AND EVALUATION OF GENETIC DIVERGENCE
Preetha, S1. and T.S.Raveendran2
ABSTRACT An investigation was taken up to compare the genetic variability of 150 cotton
(Gossypium hirsutum) genotypes after grouping them visually into three different growthhabits. The evaluation led to the grouping of accessions into 67 robust, 66 semicompactand 17 compact genotypes. The genotypes in the above three groups came under 13, 20and 5 clusters respectively, when Mahalanobis D2 technique was applied. The grouping ofgenotypes supported that the visual evaluation was in good agreement with the characterevaluation of robust and compact types but not in the case of the intermediate semicompacttypes. Relatively higher contribution towards genetic divergence was noticed from qualitycharacters, leaf area index and earliness characters.
IntroductionCotton, known as “the King of fibres”,
continues to be the predominant fibre in theIndian textile scene, despite stiff competitionfrom the man-made synthetic fibres. It assumesa place of pride in Indian economy, as cottonproduction, processing and trade in cotton goodsprovide employment to about 60 million peoplein our country. Further, the export of raw cotton,yarn, textile, garments, cotton seed cake, oil andother byproducts earn valuable foreign exchange.
In India, cotton is grown in three agro climaticzones - northern zone where cotton is raisedentirely under irrigation, central and south zoneswhere it is predominantly a rainfed crop. Underrainfed cultivation a compact plant type withshort internodes, low leaf area and high harvestindex is preferred to get the best yield besideswithstanding the drought in different phases ofcrop growth. However, under irrigatedconditions, the crop attains a luxuriant growthwith large leaves, open plant type, big bolls andlonger duration. A specific plant type hasacclimatized in a particular tract and is able tointeract well with the weather parameters andperform well in respect of yield. The studies onsuitability of particular ideotype to a particularenvironment have not been taken up by breeders
1. Ph.D. scholar, Centre for Plant Breeding and Genetics, Tamil Nadu Agricultural University, Coimbatore2. Director, Centre for Plant Breeding and Genetics, Tamil Nadu Agricultural University, Coimbatore
either in tetraploid or diploid species. Suchstudies will be useful to pinpoint and fix the mostefficient genotype for a particular location.Further the characterization of the robust,semicompact and compact genotypes in termsof crop growth, physiological efficiency,agronomic characters and quality parameterswill be useful not only to increase the yield levelin this important fibre crop but also helps toclassify and select the most desirable ones foreach of the target environments. Therefore, thepresent study was attempted to define therobust and compact plant types and a groupintermediate between them using theagronomic, physiological and yield parametersfor attaining the highest biological efficiency andfibre yield.
Material and MethodsOne fifty genetic accessions of Gossypium
hirsutum were raised in an experimental layoutin Randomized Block Design (RBD) with tworeplications during kharif 2002-03. Thegenotypes were sown in six meter long ridgesspaced 75 cm apart and with an interplantdistance of 30cm so as to accommodate 20plants in each row. Five randomly selectedplants were tag-labelled for recording
Second National Plant Breeding Congress 2006 Plant Breeding in Post Genomics Era
84
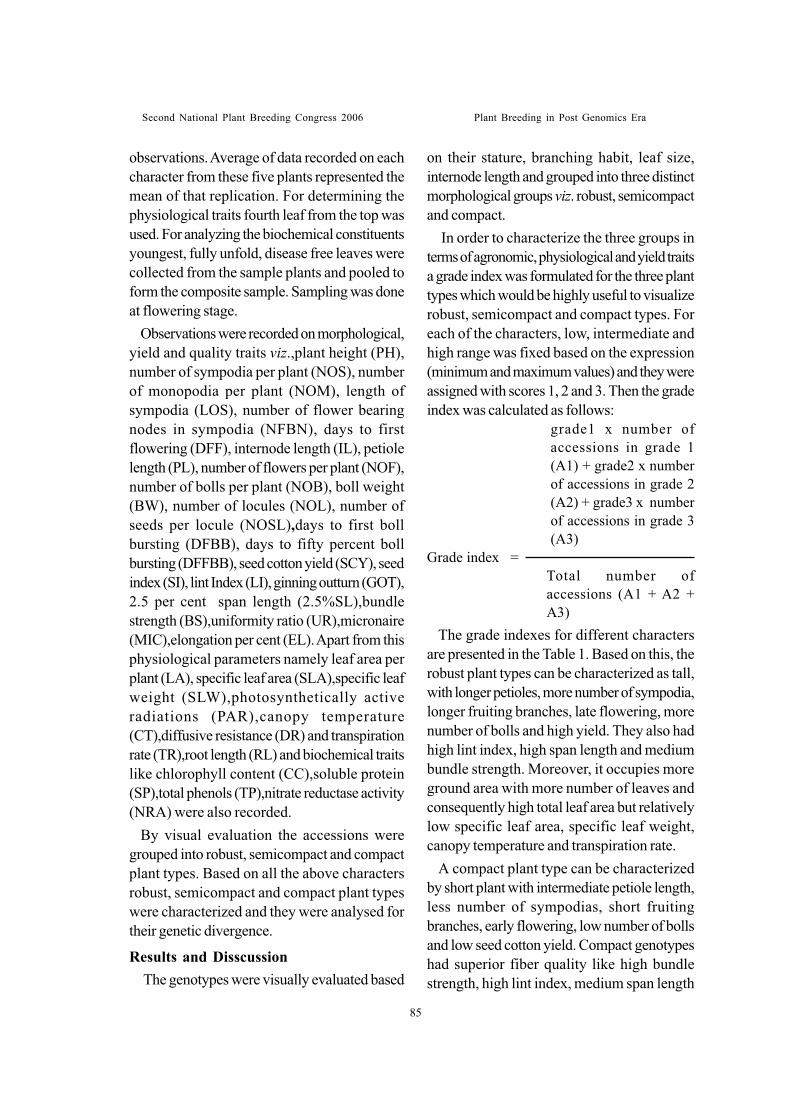
observations. Average of data recorded on eachcharacter from these five plants represented themean of that replication. For determining thephysiological traits fourth leaf from the top wasused. For analyzing the biochemical constituentsyoungest, fully unfold, disease free leaves werecollected from the sample plants and pooled toform the composite sample. Sampling was doneat flowering stage.
Observations were recorded on morphological,yield and quality traits viz.,plant height (PH),number of sympodia per plant (NOS), numberof monopodia per plant (NOM), length ofsympodia (LOS), number of flower bearingnodes in sympodia (NFBN), days to firstflowering (DFF), internode length (IL), petiolelength (PL), number of flowers per plant (NOF),number of bolls per plant (NOB), boll weight(BW), number of locules (NOL), number ofseeds per locule (NOSL),days to first bollbursting (DFBB), days to fifty percent bollbursting (DFFBB), seed cotton yield (SCY), seedindex (SI), lint Index (LI), ginning outturn (GOT),2.5 per cent span length (2.5%SL),bundlestrength (BS),uniformity ratio (UR),micronaire(MIC),elongation per cent (EL). Apart from thisphysiological parameters namely leaf area perplant (LA), specific leaf area (SLA),specific leafweight (SLW),photosynthetically activeradiations (PAR),canopy temperature(CT),diffusive resistance (DR) and transpirationrate (TR),root length (RL) and biochemical traitslike chlorophyll content (CC),soluble protein(SP),total phenols (TP),nitrate reductase activity(NRA) were also recorded.
By visual evaluation the accessions weregrouped into robust, semicompact and compactplant types. Based on all the above charactersrobust, semicompact and compact plant typeswere characterized and they were analysed fortheir genetic divergence.
Results and DisscussionThe genotypes were visually evaluated based
on their stature, branching habit, leaf size,internode length and grouped into three distinctmorphological groups viz. robust, semicompactand compact.
In order to characterize the three groups interms of agronomic, physiological and yield traitsa grade index was formulated for the three planttypes which would be highly useful to visualizerobust, semicompact and compact types. Foreach of the characters, low, intermediate andhigh range was fixed based on the expression(minimum and maximum values) and they wereassigned with scores 1, 2 and 3. Then the gradeindex was calculated as follows:
grade1 x number ofaccessions in grade 1(A1) + grade2 x numberof accessions in grade 2(A2) + grade3 x numberof accessions in grade 3(A3)
Grade index =Total number ofaccessions (A1 + A2 +A3)
The grade indexes for different charactersare presented in the Table 1. Based on this, therobust plant types can be characterized as tall,with longer petioles, more number of sympodia,longer fruiting branches, late flowering, morenumber of bolls and high yield. They also hadhigh lint index, high span length and mediumbundle strength. Moreover, it occupies moreground area with more number of leaves andconsequently high total leaf area but relativelylow specific leaf area, specific leaf weight,canopy temperature and transpiration rate.
A compact plant type can be characterizedby short plant with intermediate petiole length,less number of sympodias, short fruitingbranches, early flowering, low number of bollsand low seed cotton yield. Compact genotypeshad superior fiber quality like high bundlestrength, high lint index, medium span length
Second National Plant Breeding Congress 2006 Plant Breeding in Post Genomics Era
85
and seed index. Compact types occupy lessground area with low total leaf area but theyhad relatively high specific leaf area, high leaftemperature and low transpiration rate. Compactgenotypes had high leaf soluble proteins andchlorophyll contents.
The semicompact types were intermediate forall the characters.
The percentage of genotypes of each groupunder different range for different characterswas calculated. In robust group, high frequencyof genotypes were in the minimum range ofexpression for the characters number of flowerbearing nodes, days to first boll bursting, days tofifty per cent boll bursting, specific leaf area,canopy temperature, diffusive resistance,chlorophyll ‘a’ and oil content. For the characterspetiole length, internode length, number ofsympodia, length of sympodia, number of bolls,seed cotton yield, ginning outturn, 2.5 per centspan length, uniformity ratio, micronaire, bundlestrength, elongation length, root length,photosynthetically active radiations, transpirationrate, phenol content, high frequency of genotypesfell in the intermediate range. More than fiftyper cent of the robust genotypes had high totalleaf area, soluble proteins and nitrate reductaseactivity.
Compact group had majority of genotypesunder low expression for the characters plantheight, internode length, number of flowerbearing nodes, number of bolls, seed cotton yield,specific leaf weight, diffusive resistance andchlorophyll ‘a’. All the accessions had registeredlow range for length of sympodia. Intermediaterange was predominant for the character petiolelength, number of sympodia, boll weight, lintindex, ginning outturn, 2.5 per cent span length,uniformity ratio, micronaire, elongationpercentage, canopy temperature and phenolcontent. High frequency of plants fell under thehigh range for bundle strength and nitratereductase activity.
Semicompact genotypes fell under the
intermediate range for most of the characters.The distribution of genotypes under the
different levels of expression indicated that ingeneral, robust genotypes can serve as donorsfor earliness, leaf area, soluble protein andnitrate reductase activity while compactgenotypes can be considered for improvingbundle strength, photosynthetically activeradiations, and nitrate reductase activity.
The genetic divergence in the genotypes wasestimated by subjecting them to distanceanalysis, using Mahalanobis D2 statistics. Agroupwise analysis of genetic divergenceindicated that the sixty seven robust genotypescould be grouped into 13 clusters. It wasobserved that cluster I was the largest including54 genotypes followed by cluster XIIIcomprising of two genotypes. All the otherclusters had only one genotype. In a similar way,the 66 semicompact genotypes came undertwenty clusters. Cluster I comprised themaximum number of 14 genotypes followed bycluster II (13 genotypes) cluster III (11genotypes), cluster VII (4 genotypes), clusterIX and XII (3 genotypes), cluster XIII, XV andXX (2 genotypes). All the other clusters hadonly one genotype. The 17 compact genotypeswhich were subjected to diversity analysis using12 characters after stepwise elimination of lessimportant characters were grouped into fiveclusters. Cluster I comprised the maximumnumber of nine genotypes followed by clusterII (5 genotypes). Cluster III, IV and V had onlyone genotype each. The above groupingsupported that visual evaluation was in goodagreement with the character evaluation inrespect of robust and compact types as mostof the genotypes came under a single cluster.However, the agreement in respect ofsemicompact types was not as much as in theother two groups because for some charactersit is towards robust type and for others it istowards compact type and so further detailedstudy is needed. The clustering pattern of the
Second National Plant Breeding Congress 2006 Plant Breeding in Post Genomics Era
86
genotypes from various geographical regions intodifferent clusters was random indicating theabsence of parallelism between genetic groupingand diversity. Earlier studies of Kowsalya andRaveendran (1996) and Gururajan andManickam (2002) also indicated more are lesssimilar observations. This may be due to frequentexchange of breeding material between thebreeders and common objectives of selection indifferent locations. Murthy and Arunachalam(1966) also suggested that the forces of geneticdrift and natural selection under diverseenvironmental conditions within a country causeconsiderable diversity than geographic isolation.So, selection of parents for hybridizationprogrammes should be based on genetic ratherthan the geographical diversity. However, acomparison between the two methods ofparental selection based on geographical andgenetic diversity, and study of segregatingprogenies of the hybrids synthesized within eachgroup will give a better result on further use ofparents.
Inter cluster distances were greater than intracluster distances, revealing considerable amountof genetic diversity among genotypes studied.Use of genetically distant genotypes as parentsto get most promising hybrids or segregants havebeen suggested by Kowsalya and Raveendran(1996), Manimaran and Raveendran (2001) andGururajan and Manickam (2002).
In case of robust genotypes (Table 2) theminimum inter cluster distance was recordedbetween the genotypes S-1622 and 560 whereashighest distance was noticed between clusterII(Able - 51(P)) and cluster XIII (Gregg and5143) followed by cluster XII (920) and clusterXIII. Cluster XIII recorded highest mean valuefor the characters ginning outturn, specific leafarea, micronaire and elongation percentage(Table 3). Cluster II showed low mean valuesfor all the characters. Cluster XII recorded highmean values for number of bolls, specific leafweight and 2.5 per cent span length. It would be
a good effort to hybridize the genotype 920 withgenotypes of cluster XIII to get bettersegregants showing good performance for yieldcomponents, earliness and fibre quality. ClusterIX (Empire-16 WR) also can be involved inhybridization programme to improve the seedcotton yield.
In semicompact group, the lowest intercluster distance recorded was between clustersIV and XI and highest distance was recordedbetween clusters XIII and XIV followed byclusters XIII and XVI and cluster VI andXVIII(table 4). Cluster XIII (Stoneville andAcala-1577-D) recorded the highest meanvalue for specific leaf area (table 5). ClusterXIV (47-2) showed high expression for plantheight, number of sympodia and number ofbolls. These results indicate that Stoneville andAcale-1577-D can be crossed with 47-2 to getdesirable recombinants. Further cluster XVI(Nectariless) which had recorded secondhighest distance with cluster XIII showeddesirable expression for quality traits viz.uniformity ratio, micronaire value and elongationpercentage. Thus, to combine high physiologicalefficiency and good fibre quality characters,cluster XIII and cluster XVI can be used incrossing programme while, cluster VIII (Buri-147) will serve as a good source for yieldimprovement. To produce hybrids with widegenetic base and with pronounced hybrid vigourthis genotype can be crossed with any otherhighly divergent cluster having desirablegenotypes.
The compact genotypes (table 6) registeredhighest inter cluster divergence between clusterII (Kapland, BP-52NC-62, Stardel, Brazos andDeltapine) and cluster III (72/1). Cluster IIshowed high expression for bundle strengthwhereas cluster III registered high sympodialnumber and specific leaf weight (table 7). Thecluster IV (199F) recording high mean valuesfor seed cotton yield, number of bolls, length ofsympodia, plant height, internode and petiole
Second National Plant Breeding Congress 2006 Plant Breeding in Post Genomics Era
87
length showed high divergence with cluster II.So 199F can be hybridized with the genotypesof cluster II to improve the seed cotton yield.
The data pertaining to robust and semicompactgenotypes (table 8) have also shown that qualitycharacters were found to be good indices forselection of genotypes in the present study. Asthe yield and yield components failed to exhibithigh degree of influence on genetic divergence,care should be taken to identify segregants forgood yield performance from the limitedvariability available in the material under study.Similar reports have been given by Amudha etal. (1997).
REFERENCESAmudha, K., Raveendran, T.S, Krishnadoss,
D. 1997. Genetic diversity in coloured lintedcotton varieties.Madras Agric. J.,84:334-337
Gururajan, K.N., Manickam, S. 2002. Geneticdivergence in Egyptian cotton (GossypiumbarbadenseL.).J. Indian Soc. CottonImprov., 27: 77-83.
Kowsalya, R., Raveendran, T.S. 1996. Geneticvariability and D2 analysis in upland cotton.Crop Res. 12: 36-42.
Manimaran, R., Raveendran, T.S. 2001.Relationship between genetic diversity andheterosis in cotton. Crop Res. 22 : 72-77.
Murthy, B.R, Arunachalam, V. 1966. Thenature of genetic divergence in relation tobreeding systemin crop plants.IndianJ.Genet., 26(A):188-198
Second National Plant Breeding Congress 2006 Plant Breeding in Post Genomics Era
88
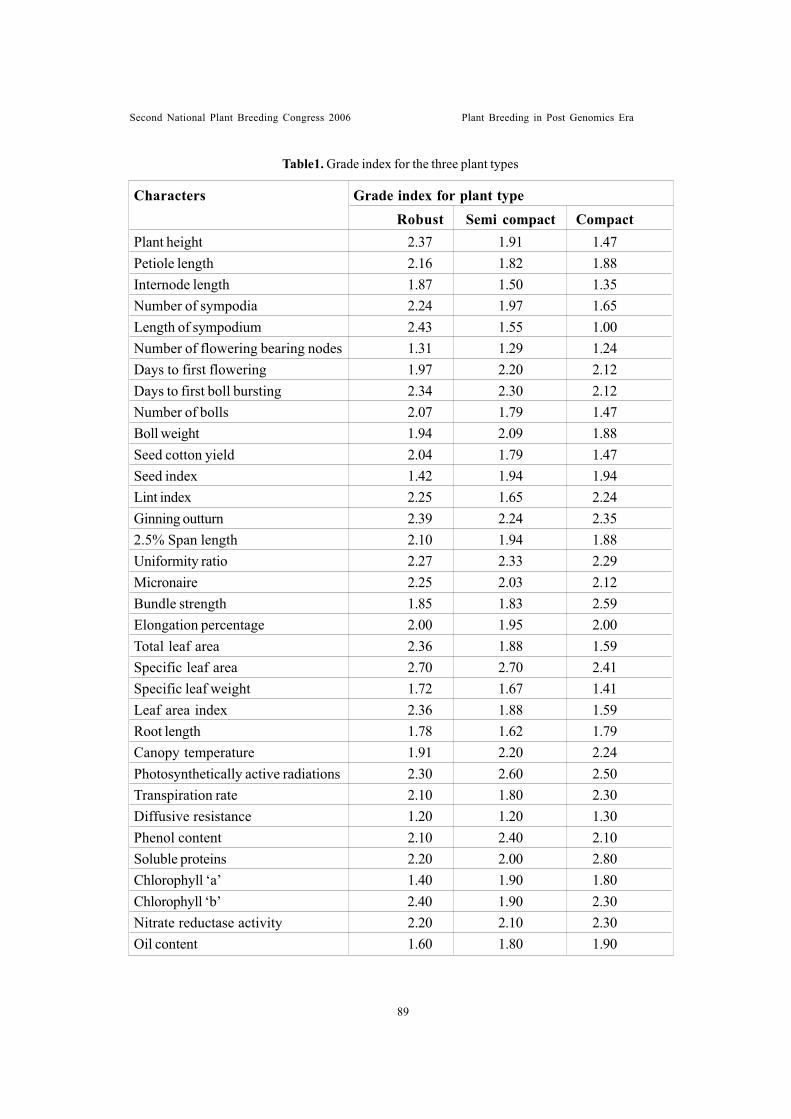
Table1. Grade index for the three plant types
Characters Grade index for plant typeRobust Semi compact Compact
Plant height 2.37 1.91 1.47Petiole length 2.16 1.82 1.88Internode length 1.87 1.50 1.35Number of sympodia 2.24 1.97 1.65Length of sympodium 2.43 1.55 1.00Number of flowering bearing nodes 1.31 1.29 1.24Days to first flowering 1.97 2.20 2.12Days to first boll bursting 2.34 2.30 2.12Number of bolls 2.07 1.79 1.47Boll weight 1.94 2.09 1.88Seed cotton yield 2.04 1.79 1.47Seed index 1.42 1.94 1.94Lint index 2.25 1.65 2.24Ginning outturn 2.39 2.24 2.352.5% Span length 2.10 1.94 1.88Uniformity ratio 2.27 2.33 2.29Micronaire 2.25 2.03 2.12Bundle strength 1.85 1.83 2.59Elongation percentage 2.00 1.95 2.00Total leaf area 2.36 1.88 1.59Specific leaf area 2.70 2.70 2.41Specific leaf weight 1.72 1.67 1.41Leaf area index 2.36 1.88 1.59Root length 1.78 1.62 1.79Canopy temperature 1.91 2.20 2.24Photosynthetically active radiations 2.30 2.60 2.50Transpiration rate 2.10 1.80 2.30Diffusive resistance 1.20 1.20 1.30Phenol content 2.10 2.40 2.10Soluble proteins 2.20 2.00 2.80Chlorophyll ‘a’ 1.40 1.90 1.80Chlorophyll ‘b’ 2.40 1.90 2.30Nitrate reductase activity 2.20 2.10 2.30Oil content 1.60 1.80 1.90
Second National Plant Breeding Congress 2006 Plant Breeding in Post Genomics Era
89
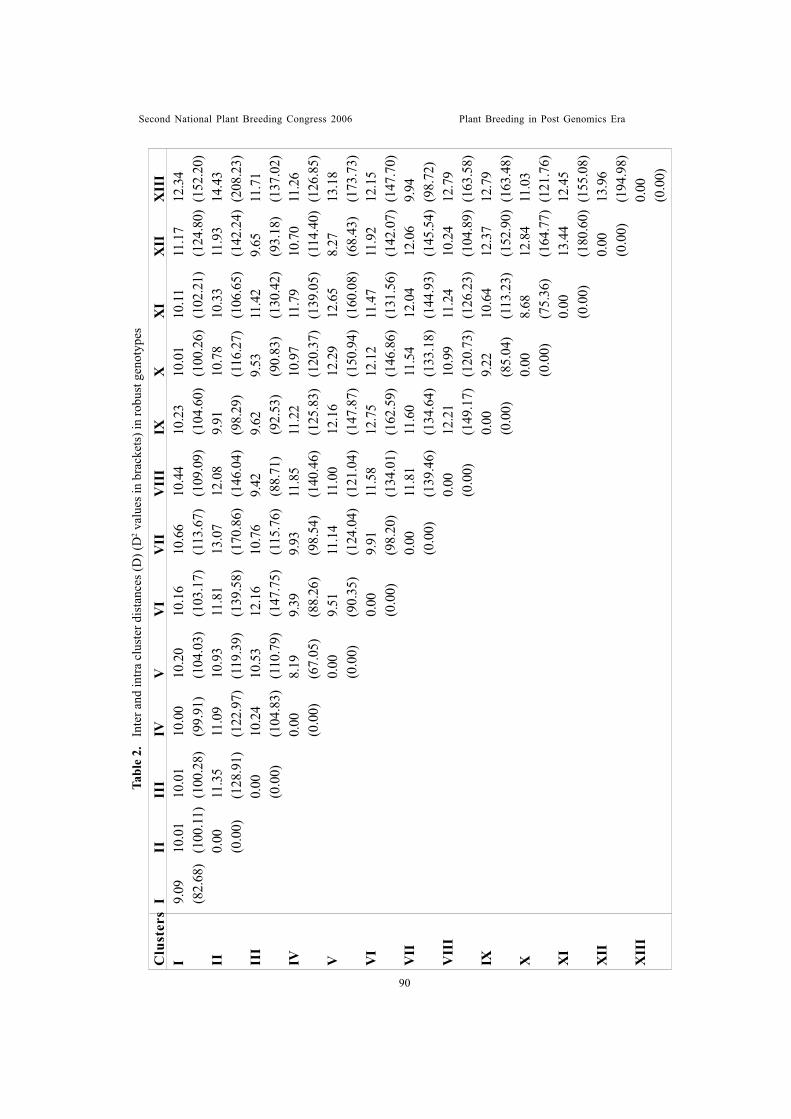
Tabl
e 2.
In
ter a
nd in
tra c
lust
er d
ista
nces
(D) (
D2 v
alue
s in
brac
kets
) in
robu
st g
enot
ypes
Clu
ster
sI
IIII
IIV
VV
IV
IIV
III
IXX
XI
XII
XII
II
9.09
10.0
110
.01
10.0
010
.20
10.1
610
.66
10.4
410
.23
10.0
110
.11
11.1
712
.34
(82.
68)
(100
.11)
(100
.28)
(99.
91)
(104
.03)
(103
.17)
(113
.67)
(109
.09)
(104
.60)
(100
.26)
(102
.21)
(124
.80)
(152
.20)
II0.
0011
.35
11.0
910
.93
11.8
113
.07
12.0
89.
9110
.78
10.3
311
.93
14.4
3(0
.00)
(128
.91)
(122
.97)
(119
.39)
(139
.58)
(170
.86)
(146
.04)
(98.
29)
(116
.27)
(106
.65)
(142
.24)
(208
.23)
III
0.00
10.2
410
.53
12.1
610
.76
9.42
9.62
9.53
11.4
29.
6511
.71
(0.0
0)(1
04.8
3)(1
10.7
9)(1
47.7
5)(1
15.7
6)(8
8.71
)(9
2.53
)(9
0.83
)(1
30.4
2)(9
3.18
)(1
37.0
2)IV
0.00
8.19
9.39
9.93
11.8
511
.22
10.9
711
.79
10.7
011
.26
(0.0
0)(6
7.05
)(8
8.26
)(9
8.54
)(1
40.4
6)(1
25.8
3)(1
20.3
7)(1
39.0
5)(1
14.4
0)(1
26.8
5)V
0.00
9.51
11.1
411
.00
12.1
612
.29
12.6
58.
2713
.18
(0.0
0)(9
0.35
)(1
24.0
4)(1
21.0
4)(1
47.8
7)(1
50.9
4)(1
60.0
8)(6
8.43
)(1
73.7
3)V
I0.
009.
9111
.58
12.7
512
.12
11.4
711
.92
12.1
5(0
.00)
(98.
20)
(134
.01)
(162
.59)
(146
.86)
(131
.56)
(142
.07)
(147
.70)
VII
0.00
11.8
111
.60
11.5
412
.04
12.0
69.
94(0
.00)
(139
.46)
(134
.64)
(133
.18)
(144
.93)
(145
.54)
(98.
72)
VII
I0.
0012
.21
10.9
911
.24
10.2
412
.79
(0.0
0)(1
49.1
7)(1
20.7
3)(1
26.2
3)(1
04.8
9)(1
63.5
8)IX
0.00
9.22
10.6
412
.37
12.7
9(0
.00)
(85.
04)
(113
.23)
(152
.90)
(163
.48)
X0.
008.
6812
.84
11.0
3(0
.00)
(75.
36)
(164
.77)
(121
.76)
XI
0.00
13.4
412
.45
(0.0
0)(1
80.6
0)(1
55.0
8)X
II0.
0013
.96
(0.0
0)(1
94.9
8)X
III
0.00
(0.0
0)
Second National Plant Breeding Congress 2006 Plant Breeding in Post Genomics Era
90
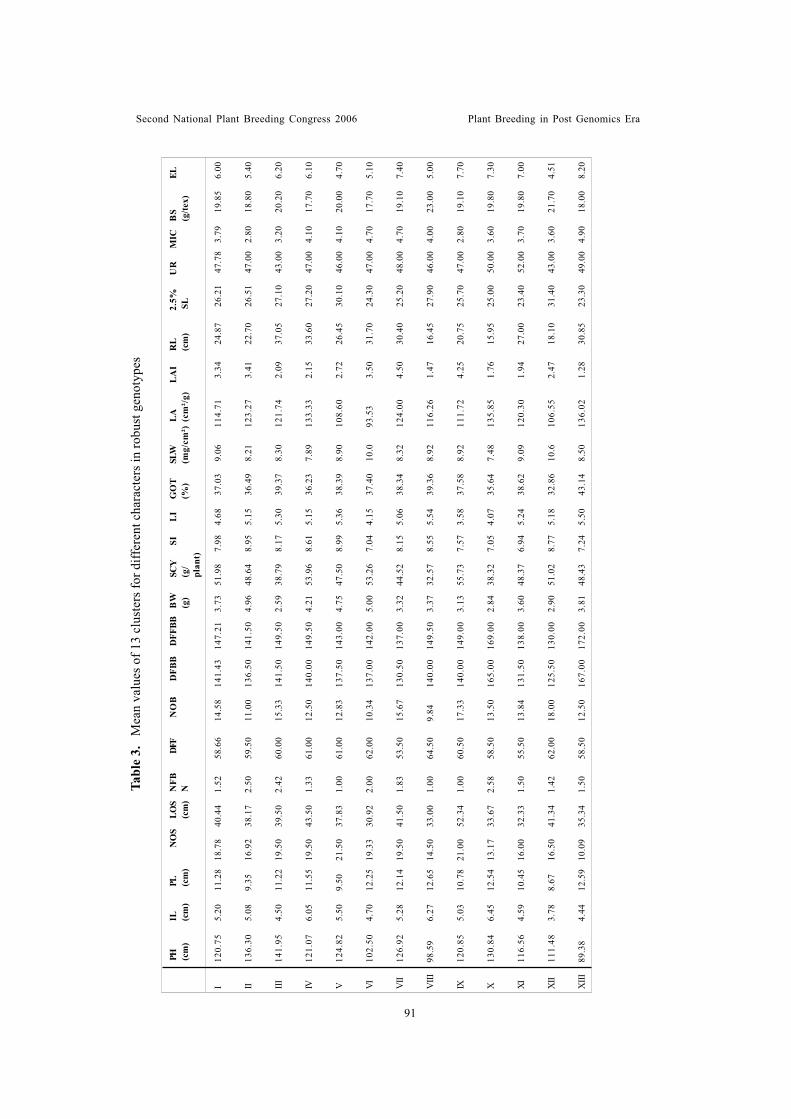
Tabl
e 3.
M
ean
valu
es o
f 13
clus
ters
for d
iffer
ent c
hara
cter
s in
robu
st g
enot
ypes
I12
0.75
5.20
11.2
818
.78
40.4
41.
5258
.66
14.5
814
1.43
147.
213.
7351
.98
7.98
4.68
37.0
39.
0611
4.71
3.34
24.8
726
.21
47.7
83.
7919
.85
6.00
II13
6.30
5.08
9.35
16.9
238
.17
2.50
59.5
011
.00
136.
5014
1.50
4.96
48.6
48.
955.
1536
.49
8.21
123.
273.
4122
.70
26.5
147
.00
2.80
18.8
05.
40
III14
1.95
4.50
11.2
219
.50
39.5
02.
4260
.00
15.3
314
1.50
149.
502.
5938
.79
8.17
5.30
39.3
78.
3012
1.74
2.09
37.0
527
.10
43.0
03.
2020
.20
6.20
IV12
1.07
6.05
11.5
519
.50
43.5
01.
3361
.00
12.5
014
0.00
149.
504.
2153
.96
8.61
5.15
36.2
37.
8913
3.33
2.15
33.6
027
.20
47.0
04.
1017
.70
6.10
V12
4.82
5.50
9.50
21.5
037
.83
1.00
61.0
012
.83
137.
5014
3.00
4.75
47.5
08.
995.
3638
.39
8.90
108.
602.
7226
.45
30.1
046
.00
4.10
20.0
04.
70
VI10
2.50
4.70
12.2
519
.33
30.9
22.
0062
.00
10.3
413
7.00
142.
005.
0053
.26
7.04
4.15
37.4
010
.093
.53
3.50
31.7
024
.30
47.0
04.
7017
.70
5.10
VII
126.
925.
2812
.14
19.5
041
.50
1.83
53.5
015
.67
130.
5013
7.00
3.32
44.5
28.
155.
0638
.34
8.32
124.
004.
5030
.40
25.2
048
.00
4.70
19.1
07.
40
VIII
98.5
96.
2712
.65
14.5
033
.00
1.00
64.5
09.
8414
0.00
149.
503.
3732
.57
8.55
5.54
39.3
68.
9211
6.26
1.47
16.4
527
.90
46.0
04.
0023
.00
5.00
IX12
0.85
5.03
10.7
821
.00
52.3
41.
0060
.50
17.3
314
0.00
149.
003.
1355
.73
7.57
3.58
37.5
88.
9211
1.72
4.25
20.7
525
.70
47.0
02.
8019
.10
7.70
X13
0.84
6.45
12.5
413
.17
33.6
72.
5858
.50
13.5
016
5.00
169.
002.
8438
.32
7.05
4.07
35.6
47.
4813
5.85
1.76
15.9
525
.00
50.0
03.
6019
.80
7.30
XI11
6.56
4.59
10.4
516
.00
32.3
31.
5055
.50
13.8
413
1.50
138.
003.
6048
.37
6.94
5.24
38.6
29.
0912
0.30
1.94
27.0
023
.40
52.0
03.
7019
.80
7.00
XII
111.
483.
788.
6716
.50
41.3
41.
4262
.00
18.0
012
5.50
130.
002.
9051
.02
8.77
5.18
32.8
610
.610
6.55
2.47
18.1
031
.40
43.0
03.
6021
.70
4.51
XIII
89.3
84.
4412
.59
10.0
935
.34
1.50
58.5
012
.50
167.
0017
2.00
3.81
48.4
37.
245.
5043
.14
8.50
136.
021.
2830
.85
23.3
049
.00
4.90
18.0
08.
20
PH (cm
)IL (c
m)
PL (cm
)N
OS
LOS
(cm
)N
FBN
DFF
NO
BD
FBB
DFF
BBB
W(g
)EL
SCY
(g/
plan
t)
SIL
IG
OT
(%)
SLW
(mg/
cm²)
LA
(cm
²/g)
LA
IR
L(c
m)
2.5%
SL
UR
MIC
BS
(g/te
x)
Second National Plant Breeding Congress 2006 Plant Breeding in Post Genomics Era
91
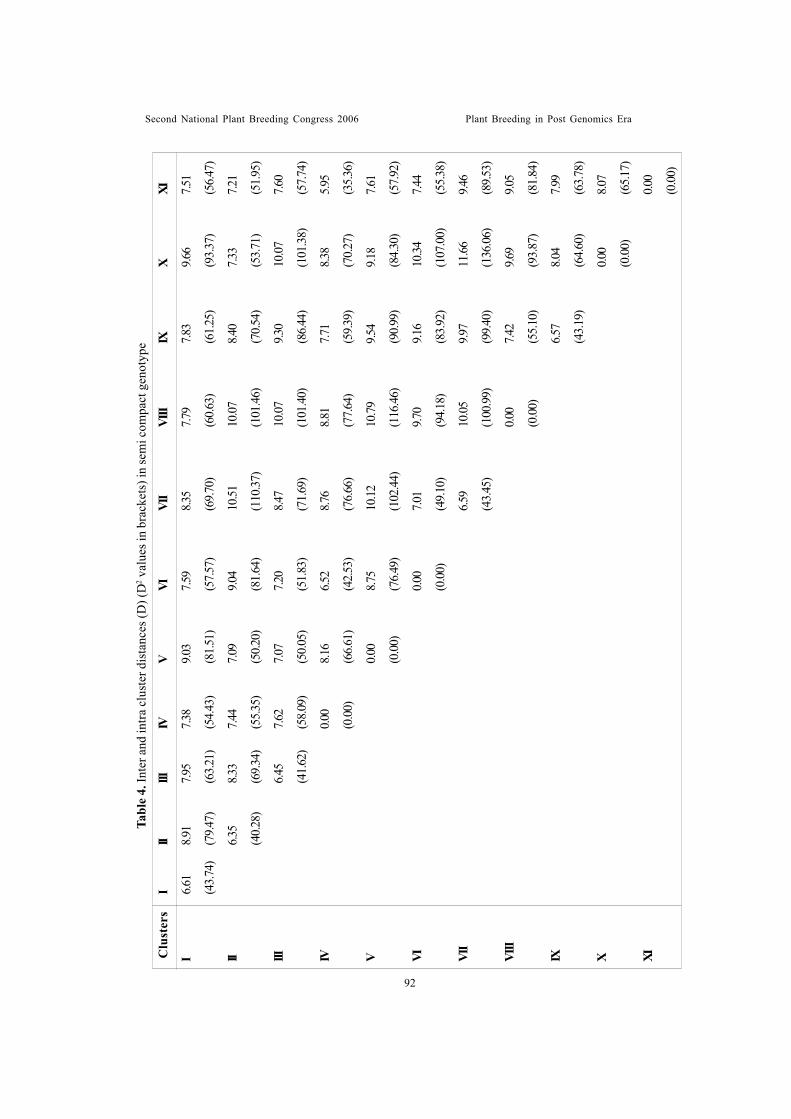
Tabl
e 4.
Inte
r and
intra
clu
ster
dis
tanc
es (D
) (D
2 val
ues i
n br
acke
ts) i
n se
mi c
ompa
ct g
enot
ype
Clu
ster
sI
IIIII
IVV
VIVI
IVI
IIIX
XXI
I6.6
18.9
17.9
57.3
89.0
37.5
98.3
57.7
97.8
39.6
67.5
1
(43.7
4)(7
9.47)
(63.2
1)(5
4.43)
(81.5
1)(5
7.57)
(69.7
0)(6
0.63)
(61.2
5)(9
3.37)
(56.4
7)
II6.3
58.3
37.4
47.0
99.0
410
.5110
.078.4
07.3
37.2
1
(40.2
8)(6
9.34)
(55.3
5)(5
0.20)
(81.6
4)(1
10.37
)(1
01.46
)(7
0.54)
(53.7
1)(5
1.95)
III6.4
57.6
27.0
77.2
08.4
710
.079.3
010
.077.6
0
(41.6
2)(5
8.09)
(50.0
5)(5
1.83)
(71.6
9)(1
01.40
)(8
6.44)
(101
.38)
(57.7
4)
IV0.0
08.1
66.5
28.7
68.8
17.7
18.3
85.9
5
(0.00
)(6
6.61)
(42.5
3)(7
6.66)
(77.6
4)(5
9.39)
(70.2
7)(3
5.36)
V0.0
08.7
510
.1210
.799.5
49.1
87.6
1
(0.00
)(7
6.49)
(102
.44)
(116
.46)
(90.9
9)(8
4.30)
(57.9
2)
VI0.0
07.0
19.7
09.1
610
.347.4
4
(0.00
)(4
9.10)
(94.1
8)(8
3.92)
(107
.00)
(55.3
8)
VII
6.59
10.05
9.97
11.66
9.46
(43.4
5)(1
00.99
)(9
9.40)
(136
.06)
(89.5
3)
VIII
0.00
7.42
9.69
9.05
(0.00
)(5
5.10)
(93.8
7)(8
1.84)
IX6.5
78.0
47.9
9
(43.1
9)(6
4.60)
(63.7
8)
X0.0
08.0
7
(0.00
)(6
5.17)
XI0.0
0
(0.00
)
Second National Plant Breeding Congress 2006 Plant Breeding in Post Genomics Era
92
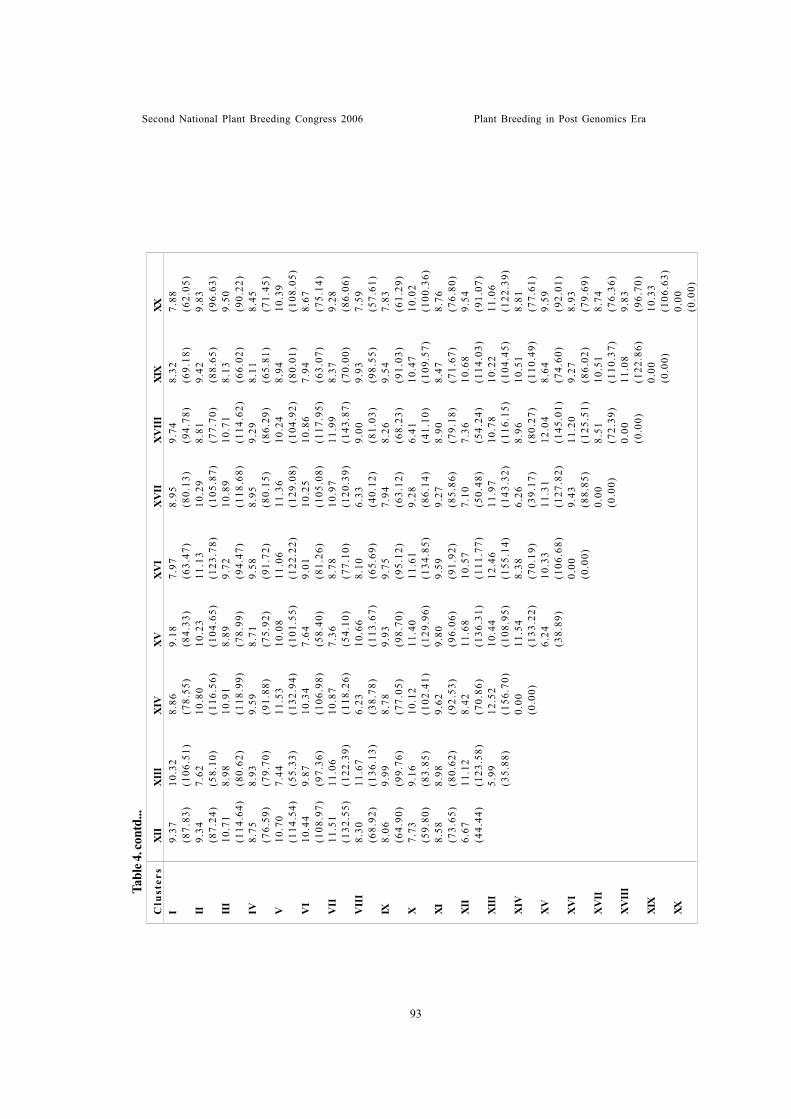
Tabl
e 4. c
ontd
...C
lust
ers
XII
XII
IX
IVX
VX
VI
XV
IIX
VII
IXI
XXX
I9.
3710
.32
8.86
9.18
7.97
8.95
9.74
8.32
7.88
(87.
83)
(106
.51)
(78.
55)
(84.
33)
(63.
47)
(80.
13)
(94.
78)
(69.
18)
(62.
05)
II9.
347.
6210
.80
10.2
311
.13
10.2
98.
819.
429.
83(8
7.24
)(5
8.10
)(1
16.5
6)(1
04.6
5)(1
23.7
8)(1
05.8
7)(7
7.70
)(8
8.65
)(9
6.63
)II
I10
.71
8.98
10.9
18.
899.
7210
.89
10.7
18.
139.
50(1
14.6
4)(8
0.62
)(1
18.9
9)(7
8.99
)(9
4.47
)(1
18.6
8)(1
14.6
2)(6
6.02
)(9
0.22
)IV
8.75
8.93
9.59
8.71
9.58
8.95
9.29
8.11
8.45
(76.
59)
(79.
70)
(91.
88)
(75.
92)
(91.
72)
(80.
15)
(86.
29)
(65.
81)
(71.
45)
V10
.70
7.44
11.5
310
.08
11.0
611
.36
10.2
48.
9410
.39
(114
.54)
(55.
33)
(132
.94)
(101
.55)
(122
.22)
(129
.08)
(104
.92)
(80.
01)
(108
.05)
VI
10.4
49.
8710
.34
7.64
9.01
10.2
510
.86
7.94
8.67
(108
.97)
(97.
36)
(106
.98)
(58.
40)
(81.
26)
(105
.08)
(117
.95)
(63.
07)
(75.
14)
VII
11.5
111
.06
10.8
77.
368.
7810
.97
11.9
98.
379.
28(1
32.5
5)(1
22.3
9)(1
18.2
6)(5
4.10
)(7
7.10
)(1
20.3
9)(1
43.8
7)(7
0.00
)(8
6.06
)V
III
8.30
11.6
76.
2310
.66
8.10
6.33
9.00
9.93
7.59
(68.
92)
(136
.13)
(38.
78)
(113
.67)
(65.
69)
(40.
12)
(81.
03)
(98.
55)
(57.
61)
IX8.
069.
998.
789.
939.
757.
948.
269.
547.
83(6
4.90
)(9
9.76
)(7
7.05
)(9
8.70
)(9
5.12
)(6
3.12
)(6
8.23
)(9
1.03
)(6
1.29
)X
7.73
9.16
10.1
211
.40
11.6
19.
286.
4110
.47
10.0
2(5
9.80
)(8
3.85
)(1
02.4
1)(1
29.9
6)(1
34.8
5)(8
6.14
)(4
1.10
)(1
09.5
7)(1
00.3
6)XI
8.58
8.98
9.62
9.80
9.59
9.27
8.90
8.47
8.76
(73.
65)
(80.
62)
(92.
53)
(96.
06)
(91.
92)
(85.
86)
(79.
18)
(71.
67)
(76.
80)
XII
6.67
11.1
28.
4211
.68
10.5
77.
107.
3610
.68
9.54
(44.
44)
(123
.58)
(70.
86)
(136
.31)
(111
.77)
(50.
48)
(54.
24)
(114
.03)
(91.
07)
XII
I5.
9912
.52
10.4
412
.46
11.9
710
.78
10.2
211
.06
(35.
88)
(156
.70)
(108
.95)
(155
.14)
(143
.32)
(116
.15)
(104
.45)
(122
.39)
XIV
0.00
11.5
48.
386.
268.
9610
.51
8.81
(0.0
0)(1
33.2
2)(7
0.19
)(3
9.17
)(8
0.27
)(1
10.4
9)(7
7.61
)X
V6.
2410
.33
11.3
112
.04
8.64
9.59
(38.
89)
(106
.68)
(127
.82)
(145
.01)
(74.
60)
(92.
01)
XV
I0.
009.
4311
.20
9.27
8.93
(0.0
0)(8
8.85
)(1
25.5
1)(8
6.02
)(7
9.69
)X
VII
0.00
8.51
10.5
18.
74(0
.00)
(72.
39)
(110
.37)
(76.
36)
XV
III
0.00
11.0
89.
83(0
.00)
(122
.86)
(96.
70)
XIX
0.00
10.3
3(0
.00)
(106
.63)
XX0.
00
(0
.00)
Second National Plant Breeding Congress 2006 Plant Breeding in Post Genomics Era
93
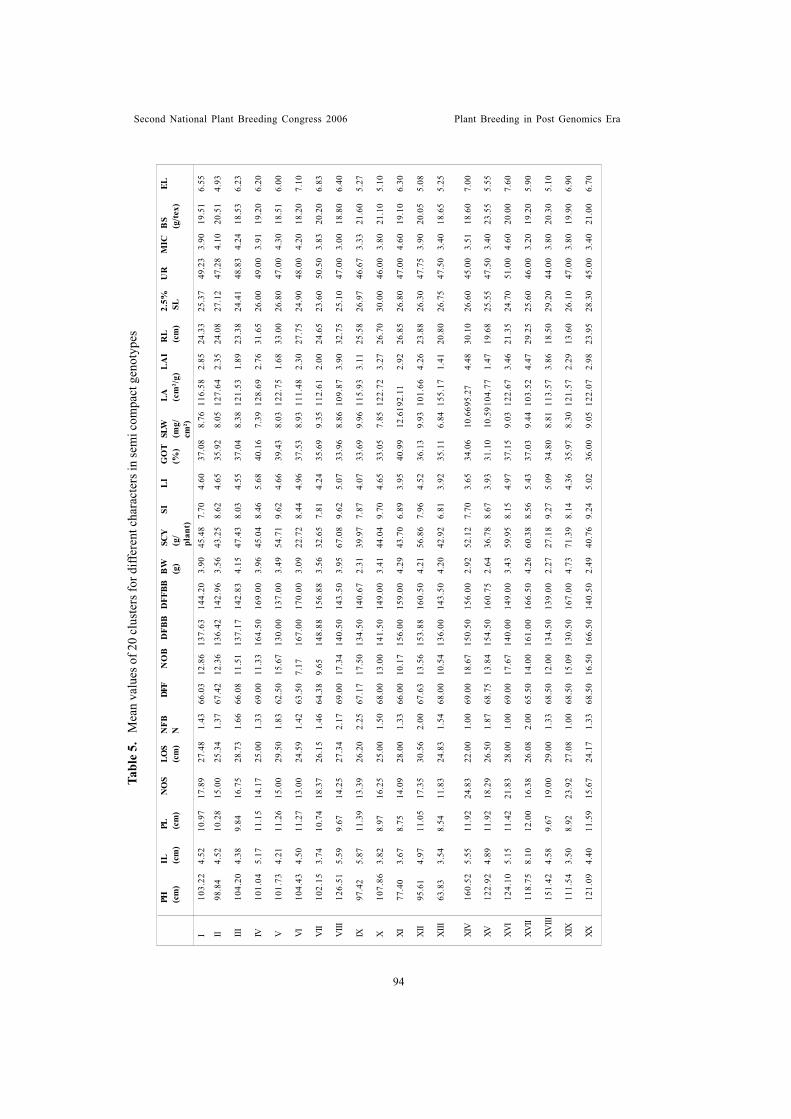
Tabl
e 5.
M
ean
valu
es o
f 20
clus
ters
for d
iffer
ent c
hara
cter
s in
sem
i com
pact
gen
otyp
es
I10
3.22
4.52
10.9
717
.89
27.4
81.
4366
.03
12.8
613
7.63
144.
203.
9045
.48
7.70
4.60
37.0
88.
7611
6.58
2.85
24.3
325
.37
49.2
33.
9019
.51
6.55
II98
.84
4.52
10.2
815
.00
25.3
41.
3767
.42
12.3
613
6.42
142.
963.
5643
.25
8.62
4.65
35.9
28.
0512
7.64
2.35
24.0
827
.12
47.2
84.
1020
.51
4.93
III10
4.20
4.38
9.84
16.7
528
.73
1.66
66.0
811
.51
137.
1714
2.83
4.15
47.4
38.
034.
5537
.04
8.38
121.
531.
8923
.38
24.4
148
.83
4.24
18.5
36.
23
IV10
1.04
5.17
11.1
514
.17
25.0
01.
3369
.00
11.3
316
4.50
169.
003.
9645
.04
8.46
5.68
40.1
67.
3912
8.69
2.76
31.6
526
.00
49.0
03.
9119
.20
6.20
V10
1.73
4.21
11.2
615
.00
29.5
01.
8362
.50
15.6
713
0.00
137.
003.
4954
.71
9.62
4.66
39.4
38.
0312
2.75
1.68
33.0
026
.80
47.0
04.
3018
.51
6.00
VI10
4.43
4.50
11.2
713
.00
24.5
91.
4263
.50
7.17
167.
0017
0.00
3.09
22.7
28.
444.
9637
.53
8.93
111.
482.
3027
.75
24.9
048
.00
4.20
18.2
07.
10
VII
102.
153.
7410
.74
18.3
726
.15
1.46
64.3
89.
6514
8.88
156.
883.
5632
.65
7.81
4.24
35.6
99.
3511
2.61
2.00
24.6
523
.60
50.5
03.
8320
.20
6.83
VIII
126.
515.
599.
6714
.25
27.3
42.
1769
.00
17.3
414
0.50
143.
503.
9567
.08
9.62
5.07
33.9
68.
8610
9.87
3.90
32.7
525
.10
47.0
03.
0018
.80
6.40
IX97
.42
5.87
11.3
913
.39
26.2
02.
2567
.17
17.5
013
4.50
140.
672.
3139
.97
7.87
4.07
33.6
99.
9611
5.93
3.11
25.5
826
.97
46.6
73.
3321
.60
5.27
X10
7.86
3.82
8.97
16.2
525
.00
1.50
68.0
013
.00
141.
5014
9.00
3.41
44.0
49.
704.
6533
.05
7.85
122.
723.
2726
.70
30.0
046
.00
3.80
21.1
05.
10
XI77
.40
3.67
8.75
14.0
928
.00
1.33
66.0
010
.17
156.
0015
9.00
4.29
43.7
06.
893.
9540
.99
12.6
192.
112.
9226
.85
26.8
047
.00
4.60
19.1
06.
30
XII
95.6
14.
9711
.05
17.3
530
.56
2.00
67.6
313
.56
153.
8816
0.50
4.21
56.8
67.
964.
5236
.13
9.93
101.
664.
2623
.88
26.3
047
.75
3.90
20.0
55.
08
XIII
63.8
33.
548.
5411
.83
24.8
31.
5468
.00
10.5
413
6.00
143.
504.
2042
.92
6.81
3.92
35.1
16.
8415
5.17
1.41
20.8
026
.75
47.5
03.
4018
.65
5.25
XIV
160.
525.
5511
.92
24.8
322
.00
1.00
69.0
018
.67
150.
5015
6.00
2.92
52.1
27.
703.
6534
.06
10.6
695.
274.
4830
.10
26.6
045
.00
3.51
18.6
07.
00
XV12
2.92
4.89
11.9
218
.29
26.5
01.
8768
.75
13.8
415
4.50
160.
752.
6436
.78
8.67
3.93
31.1
010
.591
04.7
71.
4719
.68
25.5
547
.50
3.40
23.5
55.
55
XVI
124.
105.
1511
.42
21.8
328
.00
1.00
69.0
017
.67
140.
0014
9.00
3.43
59.9
58.
154.
9737
.15
9.03
122.
673.
4621
.35
24.7
051
.00
4.60
20.0
07.
60
XV
II11
8.75
8.10
12.0
016
.38
26.0
82.
0065
.50
14.0
016
1.00
166.
504.
2660
.38
8.56
5.43
37.0
39.
4410
3.52
4.47
29.2
525
.60
46.0
03.
2019
.20
5.90
XV
III15
1.42
4.58
9.67
19.0
029
.00
1.33
68.5
012
.00
134.
5013
9.00
2.27
27.1
89.
275.
0934
.80
8.81
113.
573.
8618
.50
29.2
044
.00
3.80
20.3
05.
10
XIX
111.
543.
508.
9223
.92
27.0
81.
0068
.50
15.0
913
0.50
167.
004.
7371
.39
8.14
4.36
35.9
78.
3012
1.57
2.29
13.6
026
.10
47.0
03.
8019
.90
6.90
XX12
1.09
4.40
11.5
915
.67
24.1
71.
3368
.50
16.5
016
6.50
140.
502.
4940
.76
9.24
5.02
36.0
09.
0512
2.07
2.98
23.9
528
.30
45.0
03.
4021
.00
6.70
PH (cm
)IL (c
m)
PL (cm
)N
OS
LOS
(cm
)N
FBN
DFF
NO
BD
FBB
DFF
BBB
W(g
)EL
SCY
(g/
plan
t)
SIL
IG
OT
(%)
SLW
(mg/
cm²)
LA
(cm
²/g)L
AI
RL
(cm
)2.
5% S
LU
RM
ICB
S(g
/tex)
Second National Plant Breeding Congress 2006 Plant Breeding in Post Genomics Era
94
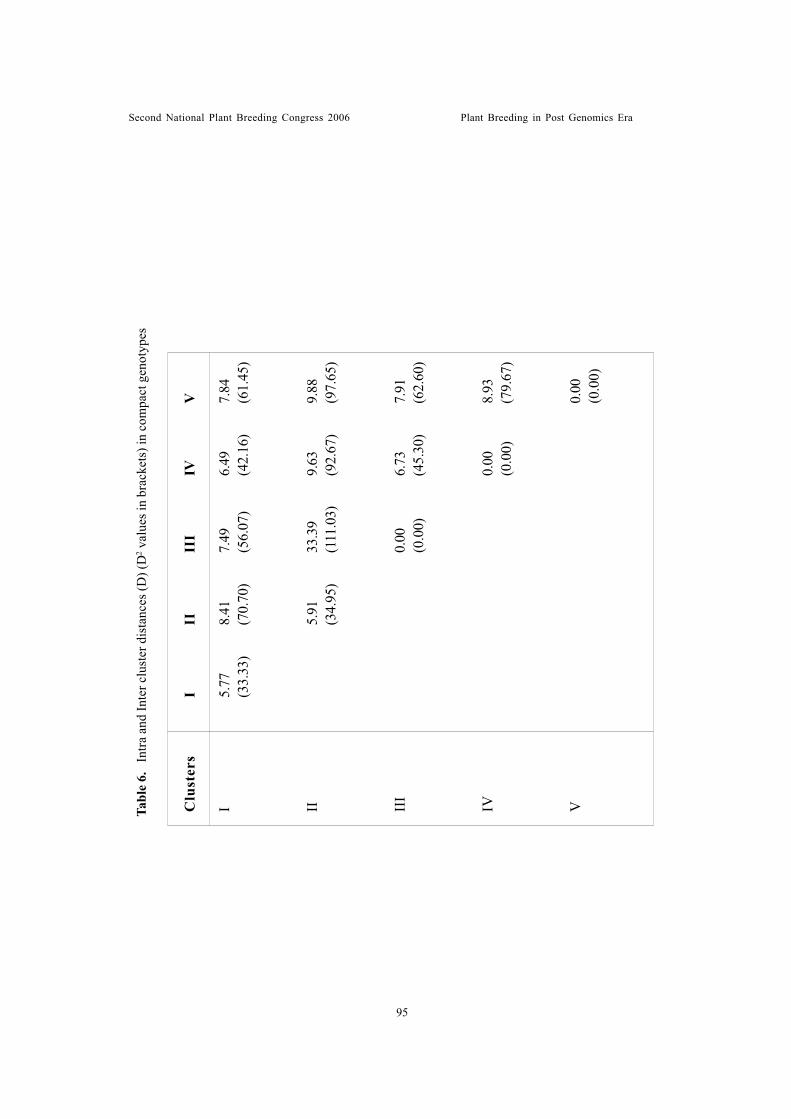
Tabl
e 6.
In
tra a
nd In
ter c
lust
er d
ista
nces
(D) (
D2 v
alue
s in
brac
kets
) in
com
pact
gen
otyp
es
Clu
ster
sI
IIII
IIV
V
I5.
778.
417.
496.
497.
84(3
3.33
)(7
0.70
)(5
6.07
)(4
2.16
)(6
1.45
)
II5.
9133
.39
9.63
9.88
(34.
95)
(111
.03)
(92.
67)
(97.
65)
III
0.00
6.73
7.91
(0.0
0)(4
5.30
)(6
2.60
)
IV0.
008.
93(0
.00)
(79.
67)
V0.
00(0
.00)
Second National Plant Breeding Congress 2006 Plant Breeding in Post Genomics Era
95
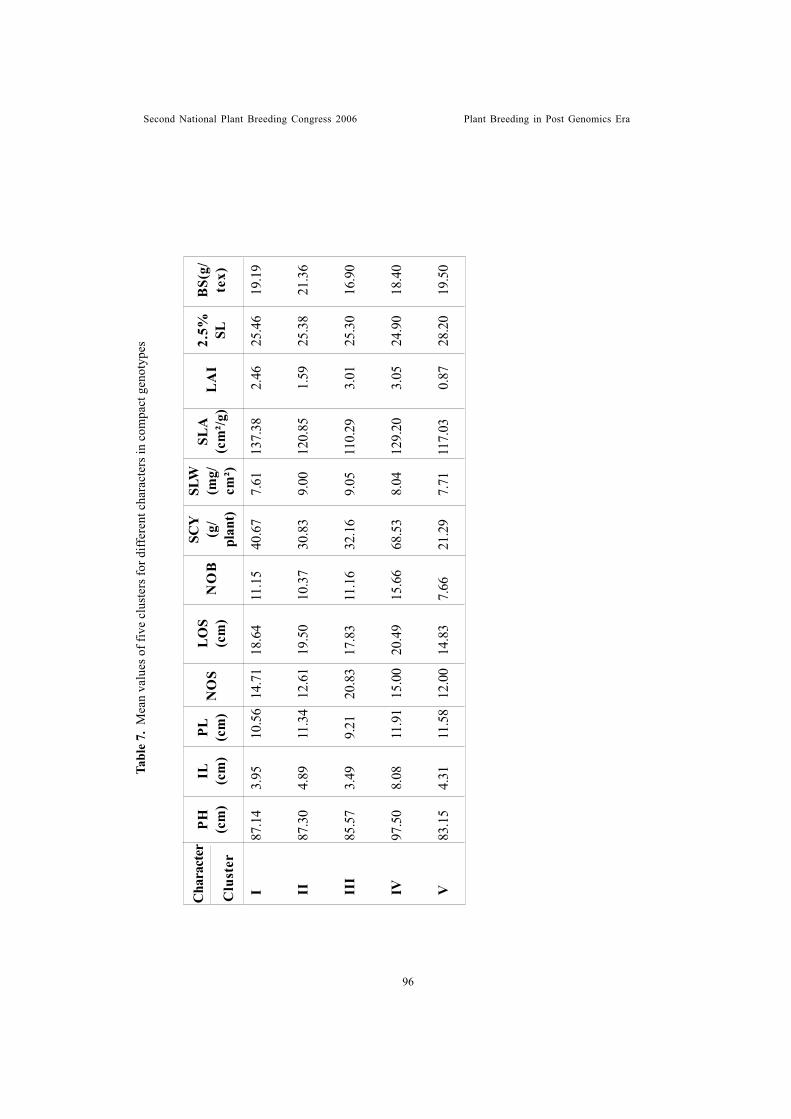
Tabl
e 7.
Mea
n va
lues
of f
ive
clus
ters
for d
iffer
ent c
hara
cter
s in
com
pact
gen
otyp
es
I87
.14
3.95
10.5
614
.71
18.6
411
.15
40.6
77.
6113
7.38
2.46
25.4
619
.19
II87
.30
4.89
11.3
412
.61
19.5
010
.37
30.8
39.
0012
0.85
1.59
25.3
821
.36
III
85.5
73.
499.
2120
.83
17.8
311
.16
32.1
69.
0511
0.29
3.01
25.3
016
.90
IV97
.50
8.08
11.9
115
.00
20.4
915
.66
68.5
38.
0412
9.20
3.05
24.9
018
.40
V83
.15
4.31
11.5
812
.00
14.8
37.
6621
.29
7.71
117.
030.
8728
.20
19.5
0
Cha
ract
erPH (c
m)
IL (cm
)PL (cm
)N
OS
LO
S(c
m)
NO
BSC
Y(g
/pl
ant)
SLW
(mg/
cm²)
SLA
(cm
²/g)
LA
I2.
5% SLC
lust
er
BS(
g/te
x)
Second National Plant Breeding Congress 2006 Plant Breeding in Post Genomics Era
96
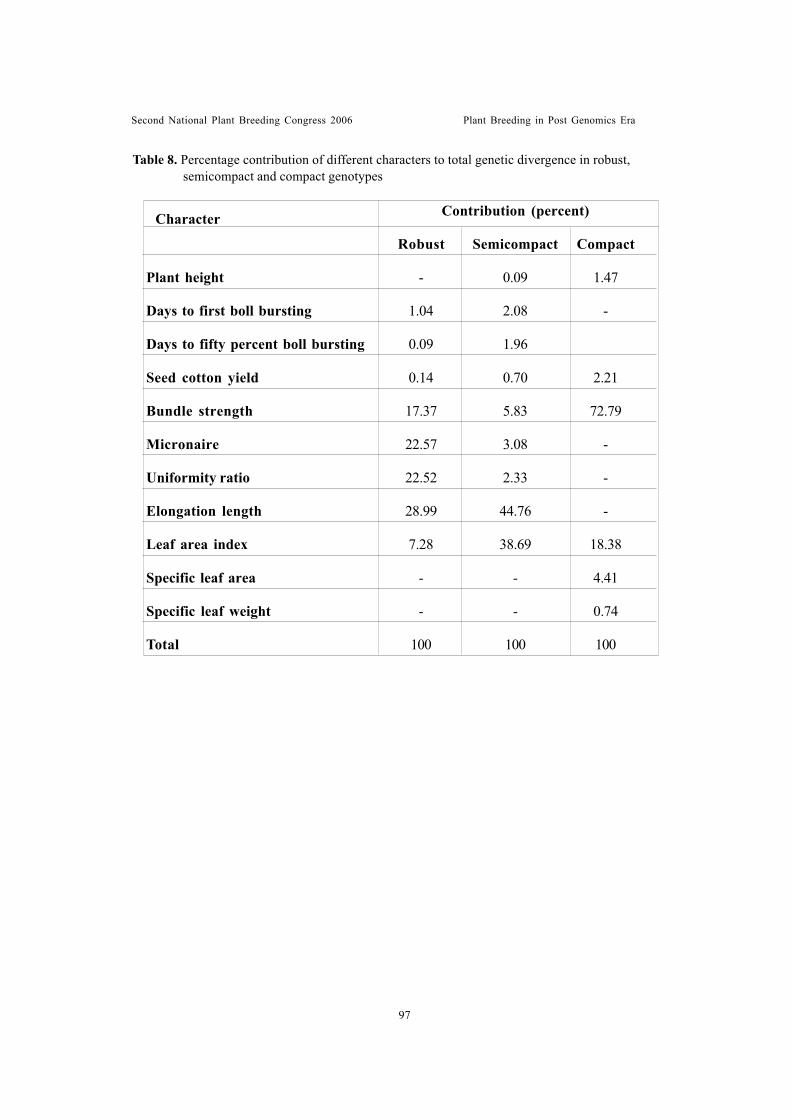
Table 8. Percentage contribution of different characters to total genetic divergence in robust, semicompact and compact genotypes
Contribution (percent)
Robust Semicompact Compact
Plant height - 0.09 1.47
Days to first boll bursting 1.04 2.08 -
Days to fifty percent boll bursting 0.09 1.96
Seed cotton yield 0.14 0.70 2.21
Bundle strength 17.37 5.83 72.79
Micronaire 22.57 3.08 -
Uniformity ratio 22.52 2.33 -
Elongation length 28.99 44.76 -
Leaf area index 7.28 38.69 18.38
Specific leaf area - - 4.41
Specific leaf weight - - 0.74
Total 100 100 100
Character
Second National Plant Breeding Congress 2006 Plant Breeding in Post Genomics Era
97
INTERFAMILY VARIATION AND FAMILY SELECTION ININTERVARIETAL CROSSES IN SUGARCANE UNDER EXCESS
WATER STRESS CONDITIONGovindaraj, P
ABSTRACTIn sugarcane breeding programmes two methods of selection viz., family selection and
individual progeny selection are followed. Family selection even though laborious givesmuch dividend compared to individual selection. Excess water stress is one of major limitingfactor of productivity in North Central Zone. Even though targeted breeding programeshave not been initiated so far, sugarcane breeders have always look for clones with waterlogging tolerance as an ancillary character in addition to cane yield, sucrose content injuice, red rot resistance and tolerant to top borer in the regular breeding programme. Themain effect of excess water stress is not only yield but also sugar recovery due toaccumulations of low sucrose in juice at harvest. In order to study the family variationunder excess water stress conditions, two hundred progenies developed from 8 families ofsugarcane intervarietal crosses were planted clonally in single row plot of 6m and wereevaluated for their performance to 4 quality parameters recorded in 8th and 11th months and3 yield contributing traits. High variation was observed among the families for all thecharacters. Family mean values for CCS % at 11th month ranged from 11.52 (UP 22 X Co775) to 10.30 (CoSe 92423 X CoS 510) with overall mean value of 11.09 and two familiesexceeded this mean value. Sucrose % in juice at 8th month ranged from 12.33 (CoS 88216X Co 87272) to 14.89 (CoG 93076 X Co 93009) with overall family mean value of 14.22.For single cane weight, the range was from 1.41kg (UP 22 X Co 775) to 0.82 kg (CoS 932X BO 91) with the family mean value of 1.11 kg. Range for each characters also variedamong the families. While the range for the family CoG 93076 X Co 93009 was the highest(13.30 to 7.05), the family CoS 88216 X Co 87272 had the narrow range (11.74 to 10.37)for sucrose % at 11th month. For single cane weight, the highest range was recorded by UP22 X Co 775 (2.30 – 0.70 kg) and the lowest range was observed with CoS 90269 X CoS510 (1.15 – 0.75 kg). Variance estimate also differed among the crosses. The highestvariance component for sucrose was exhibited by CoG 93076 X Co 93009 (24.35) and thelowest variance was recorded by Co 1158 X CoJ 64 (7.92). Results clearly indicated thatvariation was observed for both quality and yield traits among the families. The familieswith the highest variance resulted in the progenies with maximum per se values for CCS %at 11th month and single cane weight the important quality and yield contributing traitrespectively. Hence it is concluded that in the early generation of selection family selectionfollowed by individual selection will improve the efficiency of selection and such familieswith wider variation should be repeated as proven crosses. Interfamily differences foreconomic traits and the importance of family selection is discussed.
Senior Scientist (Plant Breeding), Sugarcane Breeding Institute, Coimbatore – 7
IntroductionModern sugarcane varieties are the complex
hybrids involving different species ofSaccharum. A wide range of variability amongseedlings ranging from wild cane (Saccharumspontaneum) to noble cane (S. officinarum) isobserved among the intervarietal progenies. The
frequency of seedlings having desirableagronomical traits depend upon the parentalcombination used, genetic control of the traitand selection efficiency. Very limited studieson inheritance of agronomically important traitshave been made in sugarcane due to itscomplex genetic architecture and non-
Second National Plant Breeding Congress 2006 Plant Breeding in Post Genomics Era
98
fulfillment of certain assumption or design.Sugarcane breeders worldwide differ in their
opinion on selection in the early segregatinggeneration ie individual performance or familyper se. In the individual selection the assumptionof gene x environmental variance is consideredas negligible hence the genotype selected in thefirst generation is fixed in the later clonalgenerations. However another school of thoughtargues that in the absence of any statisticalprocedure adapted, the families with high meanperformance is selected and further individualselection is within the selected families only. Inaddition, the families with high meanperformance is repeated (proven crosses) toproduce larger families to recover more elitesegregants.
Increasing population, improved standard ofliving and demand for sugar necessitated toexpand the cultivation to the sub optimal areaslike water logging. In North central zone of India,the main constraints are the early drought andlate water logging. Water logging is mainly dueto excess rain during Aug-Sep and poor drainagein many parts of Bihar, Eastern Uttar Pradeshand certain pockets of Orissa. Under severewaterlogging, growth of the crop is reduced andsugar recovery also affected. Since it is verydifficult to manage waterlogging stress througheither agronomical or physiological manipulations,development of water logging tolerant varietiesis the most appropriate solution and incorporationof water logging tolerance is an integral part ofvarietal development for these areas. Hence, itis essential to breed varieties suitable towaterlogging condition and the breeders shouldknow appropriate breeding procedures to beadapted for this purpose. In the present studyvariability for economic traits and theirrelationship to selection efficiency is discussed.
Materials and methodEight different parental combinations were
constituted with seven pistil parents viz., Co
1158, CoS 932, UP 22, CoG 93076, CoS 92423,CoS 88216, CoS 90269 and seven pollenparents viz., CoJ 64, BO 91, Co 775, Co 93009,Co 62198, Co 87272 and CoS 510 among themUP 22, CoS 92423, BO 91 and Co 87272 weretolerant to water logging. Crosses wereeffected in the lantern method and fluff weresown to raise segregating progenies. Twohundred progenies developed from these 8families of sugarcane intervarietal crosses wereplanted clonally in single row plot of 6m andwere evaluated. Data on juice brix% andsucrose% were estimated at 8th and 11th monthand CCS % and Purity % were worked out.
CCS % = (1.022 x Sucrose %) – (0.292 xBrix %); Purity % = Sucrose % x 100/ Brix %
Three important yield-contributing traits viz.,single cane weight (SCW), cane length (CL)and cane girth (CG) were recorded in all theprogenies and mean, variance and range wereestimated.
Results and discussionGenetic potential of sugarcane families to
produce superior seedlings (elite genotypes) canbe estimated through several methods whichinclude factors for superior performance (FSP)by Arceneaux et al. (1986), the probability ofexceeding target value (PROB) (Milligan andLegendre, 1991) and a univariate crossprediction method (Chang and Milligan, 1992).The factors for superior performance (FSP)method is easy to use, but a FSP value canonly be obtained after the original seedlingshave been carried through all stages ofselections. The univariate cross predictionmethod described by Chang and Milligan (1992)requires extensive data collection. Sugarcanebreeder needs a method, which is very simpleto estimate but reliable and repeatable. Simpleestimate of co efficient of variation, mean andrange can also bring out required informationto understand the genetic potential of thesegregating families.
Second National Plant Breeding Congress 2006 Plant Breeding in Post Genomics Era
99
The selection percentage is a measure of theoverall merit of the cross, which represents allthe aspects of desirability considered in thesestages and the weight given to each componentcharacter by the selector (Walker, 1963). A highselection percentage indicates that the populationhad a high mean and/or variance for some or alldesirable characters. Tai and Miller (1989)reported that selection rate between early stagesof selection was highly correlated. A progenytest with small number of individuals is routinelyused to estimate the selection rate or theevaluation of proven crosses in sugarcanebreeding programmes in Australia (Hogarth,1987). The progeny assessment trials also havebeen routinely used to identify the best familiesand select superior clones from these families(Cox et al. 2000).
Stalk height and stalk weight were stronglycorrelated with cane yield both in dry and wetzone and can be considered as ideal trait forselection in these stress conditions (Bissessur etal., 2001 and Brown et al., 1968). Under waterand salt stress conditions, stalk diameter has thehighest heritability and is the most reliablecharacter for selection (Bakshi Ram et al.,2001). Hence all these three easily measurabletraits were recorded as yield contributing traits(Malavia and Ramani, 1992) in the progenies.In the present study, variance estimate differedamong the crosses for yield and qualitycharacters (Table 1). The highest variancecomponent for sucrose at 11th month wasexhibited by CoG 93076 X Co 93009 (24.35) andthe lowest variance was recorded by Co 1158 XCoJ 64 (7.92) and the same trend was observedfor CCS %. Many families recorded lowervariance (<10) and the existence of lowvariability for quality characters indicates thedifficulty in improving quality traits by selection.The large amount of variability in single caneweight is in agreement with the observation ofWright (1956) on the existence of large amountof variability in hybrid population of asexually
propagated out breeding species.Variability was observed among the families
for mean values for all the characters exceptfor cane length, cane girth and purity %. Familymean values for CCS % at 11th month rangedfrom 11.52 (UP 22 X Co 775) to 10.30 (CoSe92423 X CoS 510) with over all mean value of11.09 and two families exceeded this meanvalue. Sucrose % in juice at 8th month rangedfrom 12.33 (CoS 88216 X Co 87272) to 14.89(CoG 93076 X Co 93009) with over all familymean value of 14.22. For single cane weight,the range was from 1.41kg (UP 22 X Co 775)to 0.82 kg (CoS 932 X BO 91) with the familymean value of 1.11 kg.
Range for all characters also varied amongthe families. While the range for the family CoG93076 X Co 93009 was the highest (13.30 to7.05), the family CoS 88216 X Co 87272 hadthe narrow range (11.74 to 10.37) for sucrose% at 11th month. For single cane weight, thehighest range was recorded by UP 22 X Co775 (2.30 to 0.70 kg) and the lowest range wasobserved with CoS 90269 X CoS 510 (1.15 to0.75 kg). In accordance with these results, in arandom population Balasundaram andBhagyalakshmi (1978) reported the range forstalk thickness (1.28 to 3.21 cm), stalk length (112.6 to 190.1 cm) single stalk weight (0.28 to1.52 kg) and sucrose % (11.14 to 16.90).
Number of selection for various traits inrelation to mean and variance are given in table2. Selections were made for each characterbased on selection cutoff value (single caneweight :1.0 kg, cane length : 200 cm, cane girth: 2.5 cm and sucrose % 16.0). For single caneweight, high variance (10.12) and high meanvalue (1.14 kg) resulted in high selection (12)in UP 22 x Co 775 and the same trend reflectedin CoSe 92423 x CoS 510. The estimates areless in either variance or mean number ofselections are also less as evidenced from othertwo crosses. Sucrose % at 11th month, morenumber of selections were obtained in UP 22 x
Second National Plant Breeding Congress 2006 Plant Breeding in Post Genomics Era
100
Co 775 and CoSe 92423 x CoS 510 due to highmean and variance respectively. For cane girthCoG 93076 x Co 93009 and UP 22 x Co 775produced more number of selectable sergeantsdue to variance and high mean respectively. Thefamilies UP 22 x Co 775 and CoSe 92423 x CoS510 recorded more family mean values whereasCoG 93076 x Co 93009 registered more varianceto produce more selections. Hence it is evidentthat selection based on family per se followedby variance will yield more selections thanselection based on individual performance toharness additive genetic variance.
Simultaneous selection for differenteconomical traits is possible only when thecomponents have positive association. A numberof studies have examined relationships amongcomponents of cane and sugar yield withgenetically different populations and varyingsample size. Relationships among componenttraits have been found to be affected by differentgenetic background of populations (Bakshi Ramand Hemaprabha, 1991), water stress (BakshiRam et al., 2001) and selection ( Bakshi Ramet al., 2000).
Under excess water stress condition, thehighest significant positive correlation wasobserved between sucrose % and brix % at 8th
(0.9726) and 11th (0.9475) months indicating thatbrix % which can be estimated easily can beused as indirect selection for sucrose % in largersegregating population (Table 3). Like wise, Brixat 8th month had significant positive associationwith brix % (0.3575) and sucrose % (0.3508) at11th month signifying the possibility of earlyelection for quality traits in early generation. Allthe three yield contributing traits had positivesignificant inter correlations among themselves.In the earlier studies also the associationbetween stalks weight and stalk diameter(Madhavi et al., 2002, Kang et al., 1983, Vermaet al., 1988) and stalk weight and stalk length(Madavi, et al., 2002) were found to be positiveand significant. Earlier studies indicated that stalk
weight had low positive correlation with sucrosepercent (Balasundaram and Bhagyalakshmi,1978; Hogarth, 1971). Hence it is concludedthat stalk diameter can be regarded as moststable character under different environmentalconditions and can be considered for selectionin various stress environment (Bakshi Ram etal., 2001; Tai and Miller, 1989; Ortiz andCaballero, 1989; Bakshi Ram and Hemaprabha1991 and Bakshi Ram et al., 1996) which canbe also measured in larger population in shorttime.
SummaryImprovement of sugarcane seedling
population by eliminating inferior progeniesshould increase the frequency of elite clonesand increase the selection efficiency. Theobjective of this study is to evaluate thedifferent families for their efficiency in givinghigher selectable segregants and suggest thatthe families with higher frequency of selectablesegregant would be designated as proven crossand the same can be repeated for raising largerfamilies and effect selections. Instead ofselecting the best progeny from the populationsraised, selecting the best individual from thebest families would be a stable performer.Results clearly indicated that variation wasobserved for both quality and yield traits amongthe families. The families with the highestvariance resulted in the progenies withmaximum per se values for CCS % at 11th
month and single cane weight the importantquality and yield contributing trait respectively.Hence it is concluded that in the earlygeneration of selection family selection followedby individual selection will improve theefficiency of selection and such families withwider variation should be repeated as provencrosses. The families with high mean valuethrew more number of selections for yieldcomponents. Single cane weight had significantpositive association with cane length and canegirth. Hence these two easily observable
Second National Plant Breeding Congress 2006 Plant Breeding in Post Genomics Era
101
characters cane be used for selection in earlygeneration with the greater emphasis on stalkdiameter. For quality traits Brix % had significantpositive association with sucrose per cent bothin 8th and 11th month hence spindle brix % canbe used for selection in early generation.
REFERENCESArceneaux, G.J.F., Van Breemen. and Despradel,
J.O. 1986. A new approach in sugarcanebreeding: Comparative study of progenies forincidence of superior seedlings. Sugar Cane0 7-10
Bakshi Ram. and Hemaprabha, G. 1991.Character relationship in cultivar x speciesprogenies in sugarcane. Indian J. Genet. 51:89-95
Bakshi Ram Sahi, B.K. and Chaudhary, B.S.2000. Effect of selection stages onrelationships between attributes insugarcane. Sugarcane International 8: 5-11
Bakshi Ram, Chaudhary, B.S. and Singh, S. 1996.Repeatability of important traits amongseedling, ratoon of seedlings and settlingstages in three population of sugarcane(Saccharum spp. Hybrids) Indian J. AgricSci. 66: 546-548
Bakshi Ram, Kumar, S., Sahi, B.K. and Tripathi,B.K. (2001). Traits for selecting elitesugarcane clones under water and salt stressconditions. Proc. IISCT 431-438.
Balasundaram, N. and Bhagyalakshmi, K.V.1978. Variability, heritability and associationamong yield and yield components insugarcane. Indian J. Agric. Sci. 48:291-295.
Bissessur, D., Tiney-Bassett, R.A.E and Lim ShinChong Lim. 2001. Genetic potential ofsugarcane progenies grown in extremely wetand dry environments in Mauritius.Sugarcane International Nov: 5-10
Brown, A.H.D., Daniel, J. and Latter, B.D.H.
1968. Quantitative genetics of sugarcaneII. Correlation analysis of continuouscharacters in relation to hybrid sugarcanebreeding. Theoretical and AppliedGenetics. 38: 1-10
Chang, Y.S. and Milligan, S.B. 1992. Estimatingthe potential of sugarcane families toproduce elite genotypes using univariatecross prediction methods. Theoretical andApplied Genetics. 84: 662-671
Cox, M.C., Hogarth, D.M. and Smith, G.R.2000. Cane breeding and improvement. In.D.M. Hogarth and Allsopp P.G. (Eds.)Manual of cane growing. Bureau of SugarExperiment Station, Brisbane, Queensland,Australia pp 91-108
Hogarth, D.M. 1971. Quantitative inheritancestudies. II. Correlation and predictedresponse to selection. Aust. J. Agric. Res.22: 103-109
Hogarth, D.M. 1987. Genetics of sugarcane.In. Heinz (Editor), Sugarcane improvementthrough breeding. Elsvier, New York. Pp255-272
Kang, M.S., Miller, J.D. and Pai, P.Y.P. (1983).Genetic and phenotypic path analysis andheritability in sugarcane breeding. CropScience, 23: 643-647
Madhavi, D., Reddy, C.R., Reddy, P.M., ReddyG.L.K., Reddy, K.R. and Reddy, K.H.P.2002. Correlation Studies in sugarcane.Co-operative Sugars. 22: 379-381
Malavia, D. D. and Ramani, V.V 1992.Correlation path analysis of cane yield insugarcane. Indian Sugars. 4: 19-22
Milligan, S.B. and Legendre, B.L. 1991.Development of a practical method forsugarcane cross appraisal. J. Am. Soc.Sugarcane Tech. 11: 59-68
Ortiz, R. and Caballero A. (1989). Feasibilityof using family selection at the sugarcaneseedling stage. Cultivos Tropicales, 11:
Second National Plant Breeding Congress 2006 Plant Breeding in Post Genomics Era
102
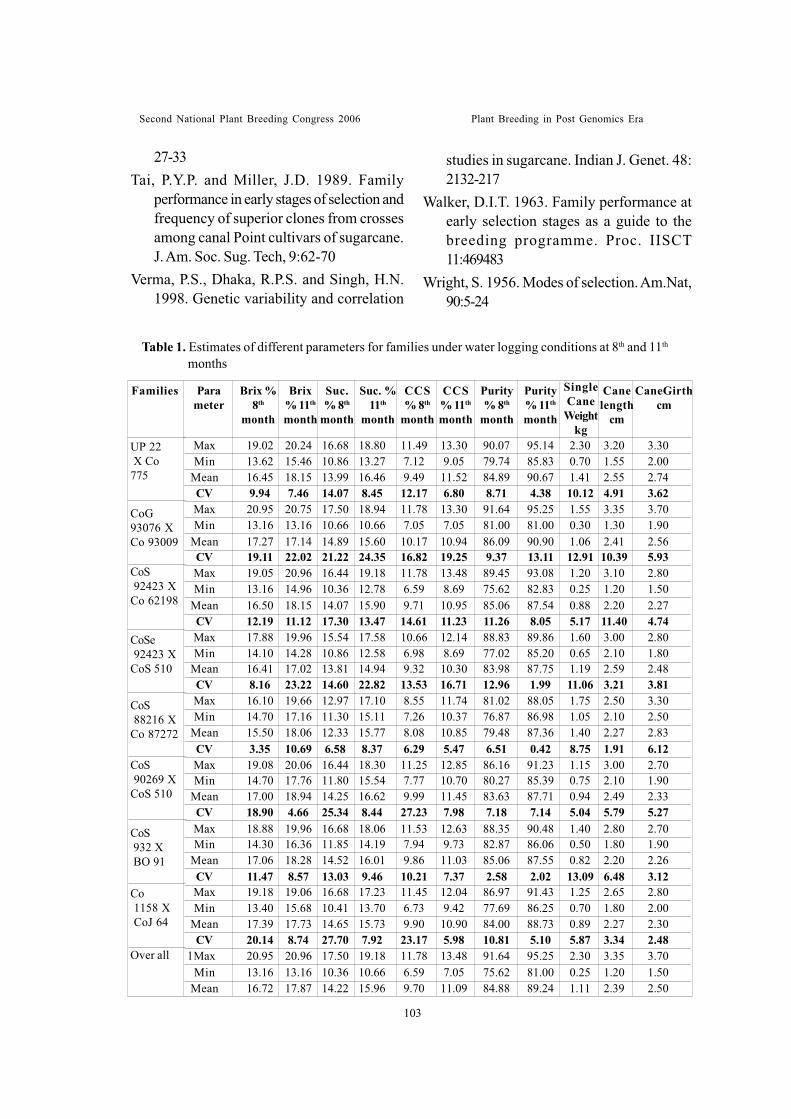
27-33Tai, P.Y.P. and Miller, J.D. 1989. Family
performance in early stages of selection andfrequency of superior clones from crossesamong canal Point cultivars of sugarcane.J. Am. Soc. Sug. Tech, 9:62-70
Verma, P.S., Dhaka, R.P.S. and Singh, H.N.1998. Genetic variability and correlation
Table 1. Estimates of different parameters for families under water logging conditions at 8th and 11th
months
UP 22 X Co775
CoG93076 XCo 93009
CoS 92423 XCo 62198
CoSe 92423 XCoS 510
CoS 88216 XCo 87272
CoS 90269 XCoS 510
CoS 932 X BO 91
Co 1158 X CoJ 64
Over all
Max 19.02 20.24 16.68 18.80 11.49 13.30 90.07 95.14 2.30 3.20 3.30Min 13.62 15.46 10.86 13.27 7.12 9.05 79.74 85.83 0.70 1.55 2.00
Mean 16.45 18.15 13.99 16.46 9.49 11.52 84.89 90.67 1.41 2.55 2.74CV 9.94 7.46 14.07 8.45 12.17 6.80 8.71 4.38 10.12 4.91 3.62Max 20.95 20.75 17.50 18.94 11.78 13.30 91.64 95.25 1.55 3.35 3.70Min 13.16 13.16 10.66 10.66 7.05 7.05 81.00 81.00 0.30 1.30 1.90
Mean 17.27 17.14 14.89 15.60 10.17 10.94 86.09 90.90 1.06 2.41 2.56CV 19.11 22.02 21.22 24.35 16.82 19.25 9.37 13.11 12.91 10.39 5.93Max 19.05 20.96 16.44 19.18 11.78 13.48 89.45 93.08 1.20 3.10 2.80Min 13.16 14.96 10.36 12.78 6.59 8.69 75.62 82.83 0.25 1.20 1.50
Mean 16.50 18.15 14.07 15.90 9.71 10.95 85.06 87.54 0.88 2.20 2.27CV 12.19 11.12 17.30 13.47 14.61 11.23 11.26 8.05 5.17 11.40 4.74Max 17.88 19.96 15.54 17.58 10.66 12.14 88.83 89.86 1.60 3.00 2.80Min 14.10 14.28 10.86 12.58 6.98 8.69 77.02 85.20 0.65 2.10 1.80
Mean 16.41 17.02 13.81 14.94 9.32 10.30 83.98 87.75 1.19 2.59 2.48CV 8.16 23.22 14.60 22.82 13.53 16.71 12.96 1.99 11.06 3.21 3.81Max 16.10 19.66 12.97 17.10 8.55 11.74 81.02 88.05 1.75 2.50 3.30Min 14.70 17.16 11.30 15.11 7.26 10.37 76.87 86.98 1.05 2.10 2.50
Mean 15.50 18.06 12.33 15.77 8.08 10.85 79.48 87.36 1.40 2.27 2.83CV 3.35 10.69 6.58 8.37 6.29 5.47 6.51 0.42 8.75 1.91 6.12Max 19.08 20.06 16.44 18.30 11.25 12.85 86.16 91.23 1.15 3.00 2.70Min 14.70 17.76 11.80 15.54 7.77 10.70 80.27 85.39 0.75 2.10 1.90
Mean 17.00 18.94 14.25 16.62 9.99 11.45 83.63 87.71 0.94 2.49 2.33CV 18.90 4.66 25.34 8.44 27.23 7.98 7.18 7.14 5.04 5.79 5.27Max 18.88 19.96 16.68 18.06 11.53 12.63 88.35 90.48 1.40 2.80 2.70Min 14.30 16.36 11.85 14.19 7.94 9.73 82.87 86.06 0.50 1.80 1.90
Mean 17.06 18.28 14.52 16.01 9.86 11.03 85.06 87.55 0.82 2.20 2.26CV 11.47 8.57 13.03 9.46 10.21 7.37 2.58 2.02 13.09 6.48 3.12Max 19.18 19.06 16.68 17.23 11.45 12.04 86.97 91.43 1.25 2.65 2.80Min 13.40 15.68 10.41 13.70 6.73 9.42 77.69 86.25 0.70 1.80 2.00
Mean 17.39 17.73 14.65 15.73 9.90 10.90 84.00 88.73 0.89 2.27 2.30CV 20.14 8.74 27.70 7.92 23.17 5.98 10.81 5.10 5.87 3.34 2.48
l Max 20.95 20.96 17.50 19.18 11.78 13.48 91.64 95.25 2.30 3.35 3.70Min 13.16 13.16 10.36 10.66 6.59 7.05 75.62 81.00 0.25 1.20 1.50
Mean 16.72 17.87 14.22 15.96 9.70 11.09 84.88 89.24 1.11 2.39 2.50
Families Parameter
Brix %8th
month
Brix% 11th
month
Suc.% 8th
month
Suc. %11th
month
CCS% 8th
month
CCS% 11th
month
Purity% 8th
month
Purity% 11th
month
SingleCane
Weightkg
Canelength
cm
CaneGirthcm
studies in sugarcane. Indian J. Genet. 48:2132-217
Walker, D.I.T. 1963. Family performance atearly selection stages as a guide to thebreeding programme. Proc. IISCT11:469483
Wright, S. 1956. Modes of selection. Am.Nat,90:5-24
Second National Plant Breeding Congress 2006 Plant Breeding in Post Genomics Era
103
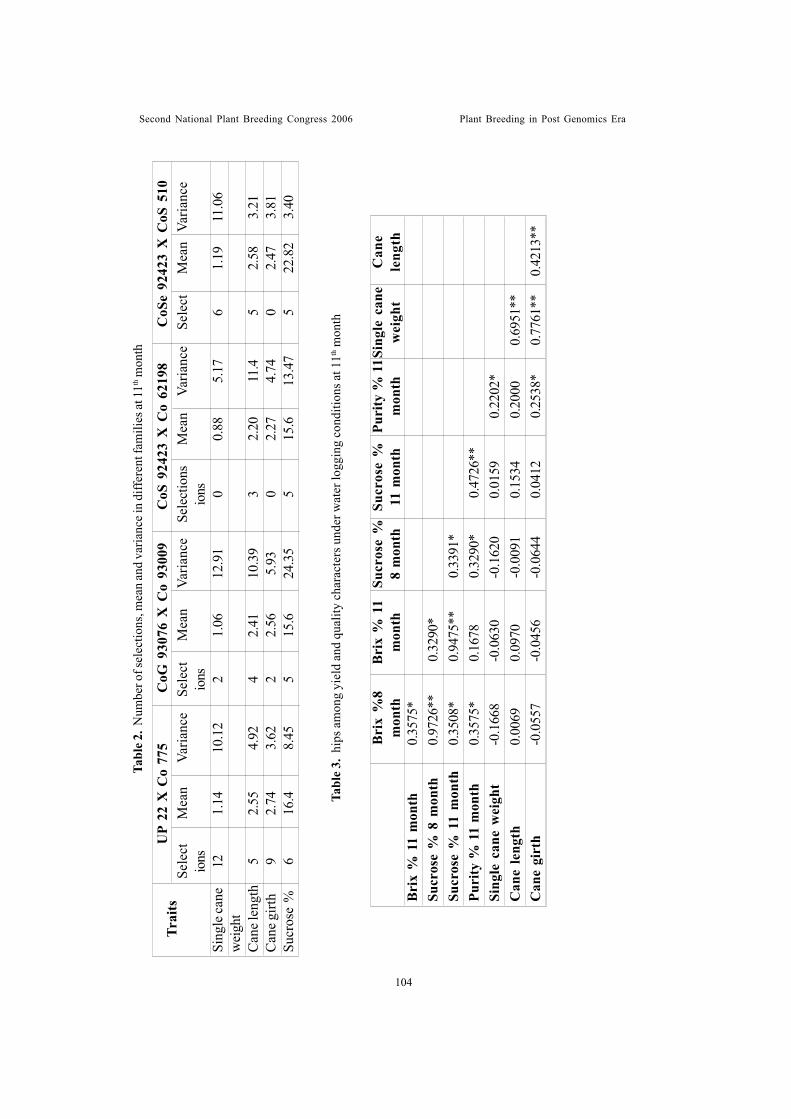
Tabl
e 2. N
umbe
r of s
elec
tions
, mea
n an
d va
rianc
e in
diff
eren
t fam
ilies
at 11
th m
onth
Sele
ctM
ean
Varia
nce
Sele
ctM
ean
Varia
nce
Sele
ctio
nsM
ean
Varia
nce
Sele
ctM
ean
Varia
nce
ions
ions
ions
Sing
le ca
ne12
1.14
10.1
22
1.06
12.9
10
0.88
5.17
61.
1911
.06
wei
ght
Can
e len
gth
52.
554.
924
2.41
10.3
93
2.20
11.4
52.
583.
21C
ane g
irth
92.
743.
622
2.56
5.93
02.
274.
740
2.47
3.81
Sucr
ose
%6
16.4
8.45
515
.624
.35
515
.613
.47
522
.82
3.40
Trai
tsU
P 22
X C
o 77
5C
oG 9
3076
X C
o 93
009
CoS
924
23 X
Co
6219
8C
oSe
9242
3 X
CoS
510
Tabl
e 3.
hip
s am
ong
yiel
d an
d qu
ality
cha
ract
ers u
nder
wat
er lo
ggin
g co
nditi
ons a
t 11th
mon
th
Can
ele
ngth
Bri
x %
11
mon
th0.
3575
*Su
cros
e %
8 m
onth
0.97
26**
0.32
90*
Sucr
ose
% 1
1 m
onth
0.35
08*
0.94
75**
0.33
91*
Puri
ty %
11
mon
th0.
3575
*0.
1678
0.32
90*
0.47
26**
Sing
le c
ane
wei
ght
-0.1
668
-0.0
630
-0.1
620
0.01
590.
2202
*C
ane
leng
th0.
0069
0.09
70-0
.009
10.
1534
0.20
000.
6951
**C
ane
girt
h-0
.055
7-0
.045
6-0
.064
40.
0412
0.25
38*
0.77
61**
0.42
13**
Bri
x %
8m
onth
Bri
x %
11
mon
thSu
cros
e %
8 m
onth
Sucr
ose
%11
mon
thPu
rity
% 1
1m
onth
Sing
le c
ane
wei
ght
Second National Plant Breeding Congress 2006 Plant Breeding in Post Genomics Era
104
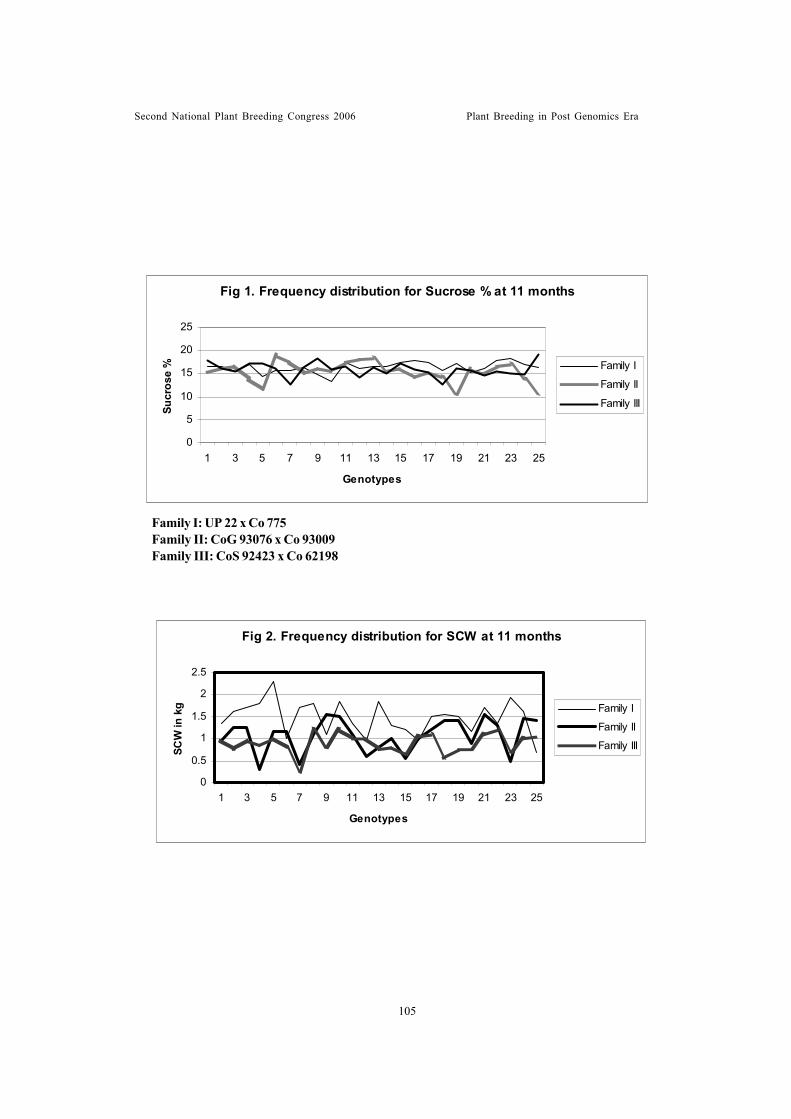
Family I: UP 22 x Co 775Family II: CoG 93076 x Co 93009Family III: CoS 92423 x Co 62198
Fig 2. Frequency distribution for SCW at 11 months
0
0.5
1
1.5
2
2.5
1 3 5 7 9 11 13 15 17 19 21 23 25
Genotypes
SCW
in k
g Family I
Family II
Family III
Second National Plant Breeding Congress 2006 Plant Breeding in Post Genomics Era
Fig 1. Frequency distribution for Sucrose % at 11 months
0
5
10
15
20
25
1 3 5 7 9 11 13 15 17 19 21 23 25
Genotypes
Sucr
ose
% Family I
Family II
Family III
105
DEVELOPING HIGH YIELDING RICE VARIETIES FOR KERALA-ANEW APPROACH
Chandrasekharan, P
ABSTRACTCrosses were done between promising rice accessions from different parts of Kerala
during 1996-97, hybrids were identified and subsequent selections continued based onheight (80 -120 cm), higher productive tillers, longer panicles and high grain numbers andmatta (bold grain and red rice). Those selected were given PC numbers. PC 1 was identifiedin F6, PC 2 in F7 and both were released in February 2003. Four more short durationvarieties have been identified: PC 5 in F9, PC 3, PC 4 and PC 6 in F10. These wereevaluated in yield trials in the second crop of 2004-05 and in the first crop 2005-06 andthe superiority of their performance was confirmed. PC 3 “Sivam” and PC 6 “Sundaram”are two varieties where genes responsible for high grain number exceeding 400 grains fromTKTM have been transferred in full since the latter was the donor for this trait. PC 1 andPC 2 have now spread to about 600 and 500 acres respectively during the last 4 seasons inalmost all districts of Kerala.
Tamil Nadu Agricultural University, Coimbatore 641003
IntroductionThavalakkannan is a tall indica variety and
phenotypically very similar to Chenkazhama andboth were very popular among Palakkad ricefarmers before the introduction of high yieldingdwarfs by IRRI, Philippines. Extreme palatabilityof their rice, the ability of cooked rice to preservein cold water for 12 hours without losinghardness and taste and their high recovery frompaddy after milling (above 60 %) were thewelcome traits. Main difference between thesetwo varieties is that Chenkazhama is a weekearlier than Thavalakkannan (TK) of 135 days.To ensure maximum plant diversity, TK wascollected from a farmer in Thiruvilvamala(TKTM) and Chenkazhama from another inOttappalam (OTP), in 1995. In the first crop of1996-97, when TKTM population was studied,it was surprising to observe one plant of height182 cm, main panicle length of 31 cm and had430 spikelets (potential grains), two plants had344 and 327 and others between 188 and 282spikelets. This population of TKTM representedgrain production of a very high order whencompared with the grain numbers of IR 36, IR8, Athira and Matta Thriveni, the dwarfs then incultivation, their maximum -grain number being
214. Other varieties, or TK (PTB 8, PTB 9)and Chenkazhama (PTB 26) and the onecollected from Ottappalam (OTP) and includedin the present study had the maximum of 250grains on the main panicle. Thus TKTM is adistinctly superior variety from the point of viewof the plant breeder. Since all characters aregoverned by genes, it should be possible totransfer this high grain number to the currentlycultivated semi - tall and dwarf varieties.Crosses were done from 1996 - 97, hybridswere identified and subsequent selectioncontinued based on height (80-120 cm) higherproductive tillers, longer panicle, high grainnumber and Matta (bold grain; red rice) whichfarmers of Kerala prefer. Rice farmer ofPalakkad gets Rs. 300 more for 500 kg paddyif it belongs to the category, Matta.
Materials and methodsRice varieties, PTB 8, 9 (TK Matta and TK
White rice), IR 8 and IR 36 were obtained fromPattambi Rice Research Station as also PTB26 (Chenkazhama). Other varieties, Athira andMatta Thriveni (dwarfs of Kerala AgriculturalUniversity) were obtained from local farmers.Since the first crop commencing May is themost suitable for TK and Chenkazhama,
Second National Plant Breeding Congress 2006 Plant Breeding in Post Genomics Era
106
crossing work was invariably done in first crop.Farmers do not grow TK and Chenkazhama insecond (II) crop since their yield performance ispoor. Seeds collected from crossing, had to besown and therefore, in the majority of cases,sowings had to be done in the second crop forthe identification of hybrids. Dwarf varieties aregrown in both crops (I and II) and therefore,selections in succeeding generations have beendone in both the crops and better looking plantscarried forward. Selection work up to II cropwas done at Mannapra. From the year 2000, thework was done at Alampallam, Vandazhi andVadakkencherry, all in Palakkad district. Sincethe aim of the study was to transfer the highgrain-number of the tall Indica variety ofThavalakkannan from Thiruvilvamala (TKTM),four important characters,
(I) height of the plant in cm, (2) number ofproductive tillers, (3) length of panicle and (4)number of spikelets on the main panicle wererecorded for all plants selected. Only in the finalstages was the duration of the crop recorded.Those selected were initially given culturenumbers and yield trials were conductedfollowing standard procedures. Those finallyselected, based on grain yield, were given PC(my initials) numbers and also named, todistinguish them from other varieties. PC 1 wasidentified in F6, PC 2 in F7 (in the farmers’ fieldsat Alampallam and Vandazhi respectively) andnamed” second coming of Thavalkkannan andChenkazhama respectively “by Karshaka Sree,a monthly Publication of Malayala Manoramafor Kerala farmers in its February 2003 issue.Four more short duration varieties were identified:PC 5 “Santham” in F9 and PC 3 “Sivam”, PC 4“Sathyam”, PC 6 “Sundaram”in F10. These shortduration varieties were all evaluated in the secondcrop of 2004-05 and their yield performanceconfirmed in first crop of 2005-06 before namingthem. Details of these varieties were brought tothe notice of the Palakkad farmers by theMalayalam daily, Mathrubhoomi on February 6th
2006 followed by Karshaka Sree, in March2006. The Scientific aspects of the study arepresented and discussed in this paper.
Results and DiscussionTable 1 gives details of these characters for
I and II crops. Data for the second (II) cropclearly show reduction in height, length ofpanicle and number of spikeiets while the tillernumber gets increased in the II crop in some(e.g., TKTM;Chenkazhama (OTP), IR 8).Excepting PC 6, Sundaram, all others showedthe ability of producing more tillers, especiallyin the II crop (Table, 4).
Table 2 gives details of number of inter -varietal hybrids between tall Indica (TKTM)and Chenkazhama (OTP) and dwarf ricevarieties IR 8, IR 72 (IRRI) matta Thriveni,Athira (Kerala Agr. Univ.varieties). Spikeletfertility or seed - fertility percentage providesan index of relationship (close or otherwise) ofvarieties involved in the cross.
Usually, it is the maximum fertility that shouldbe compared and for the study to be completeda number of F1 hybrids should be available. Seedfertility of IR 8 x PTB 8 and Chenkazhama(OTP) X IR 8 are similar indicating thatThavalkkannan Matta of Pattambi research.station (PTB 8) is similar in genetic relationshipto Chenkazhama of Ottappalam (OTP). Seedfertility of TKTM X IR 8, TKTM X MattaThriveni and its reciprocal (about 30 %)showed that IR 8 and Matta Thriveni are themost diverged from TKTM. Seed fertility ofIR 36, Athira with TKTM (maximum 69 %)compared with those of Chenkazhama(maximum 99 %) do indicate great divergenceof TKTM and Chenkazhama (OTP). If fertilityindicates close relationship, seed sterility (100-seed fertility per cent) percentage shows howfar are the two varieties distant. An attempthas been made to pictorially represent thesevarieties, TKTM and Chenkazhama (OTP)based on sterility per cent. While Chenkazhama
Second National Plant Breeding Congress 2006 Plant Breeding in Post Genomics Era
107
(OTP) is comparatively recent in evolutionaryscale, TKTM is ancient.
Table 3 gives details of the maximum grainnumber recorded and the number of selectionsmade in F2 to F10 as well as details of range ofnumber of spikelets in F1 generation. However,it is the responsibility of the plant Breader toselect a variety if it is likely to be superior to thecurrent variety under cultivation by the farmer.This happened in the case of the cross, IR 36 XTKTM. In this cross although the range ofnumber of spikelets in the 3 F1 hybrids suggestedmaximum of 322, maximum of 272 was reachedin F6 in 135 days of duration; further increasewas difficult to be achieved. The figuresunderlined indicate those studied in II crop andthe number of 272 was achieved in the II cropand since this variety had grains which are boldand 1000 grains weighed 28 g (more than theweight of TKTM) the plants of this line washarvested and seeds mixed to form a culture.After yield trials, this was named PC 1. In thecase of the cross, Athira X Chenkazhama, therewere eight F1 hybrids raised in the second crop.Subsequently in each generation there was risein the maximum of spikelets if the crop was in Icrop, a temporary decrease if it was in II cropand a dramatic increase in the subsequent I crop(216,388 in I crops in F2, F3» 289 in second cropof F4and 379 in I crop of F5). Maximum of 496was reached in F8. By that time the paniclesstarted showing symptoms of disease andselection work had to be restricted to F7(maximum of 417 spikelets).
As can be seen in table 4 this was a semi - tall(about 120 cm). One thousand grains weighed25.0 g. Yield trial of this culture was done atVandazhy Village of Palakkad District. PC 1 isdwarf and capable of yielding 6.0 mt/ha in aduration of 135 days while P6 2 gives 5.6 mt/hain 120 days (Table 5). Subsequently PC 1 andPC2 have now spread to 600 and 500 acresrespectively in almost all the districts of Kerala,during the last four Seasons.
TKTM X AthiraThis cross needs special mention because it
has yielded two short duration varieties, one of100 and the other of 110 days duration. Thiscross succeeded only when Thavalkkannanwas used as mother. Three F1 hybrids wereidentified in the second crop (Table 3) and theirmaximum spikelets ranged from 127 to 184.Thereafter it rose to 369 in F3and the maximumnumber of 413 was reached in F10 in the I cropof 2004 - 05. One particular plant neededspecial mention. It was semi-tall (122 cm), had6 tillers: main tiller carried 413 spikelets and370, 345, 337, 174 and 158 in second to sixthrespectively, of spikelets totaling 1797 grainsper plant in the first crop. However, the progenyof the same plant showed maximum of 216 inthe II crop (Table, 4). The culture emanatingfrom the progeny of this line recorded maximumof 6.375 mt/ha in the second crop of 2004-2005,the maximum under the short-duration category(Table 5), with 110 days’ duration. Anotherdistinct group of plants in this cross was shorter(107 cm), with 5 productive tillers and 435spikelets in I crop of 2004-05; in the II crop,the height was reduced to 80 cm and spikeletsto 181. However, the culture that emanatedfrom this plant - progeny proved to be shortestin duration of 100 days and the grain yieldrecorded from the yield trial was 5.579 mt/ha.Higher yielding 110 days’ duration, PC 3 , wasnamed “Sivam” and the shortest duration of100 days, PC 6, “Sundaram”.
TKTM X matta ThriveniIn this cross, both the cross and their
reciprocals were successful; seven F1’s wereidentified in the former and two in the latter(Table 2). Subsequently, the aim was to selectall progenies showing higher fertility, moreproductive tillers and number of grains,reduction in height of the plant and in theprocess the progenies of Matta Thriveni XTKTM got eliminated. Here also plant
Second National Plant Breeding Congress 2006 Plant Breeding in Post Genomics Era
108
parameters got reduced in the II crop comparedto the I; however, F3 plant 24 proved to be thebetter in the I and II crop, the difference beingthe minimum. A number of progenies of this plantfigured in subsequent generations and in the tenth(F10) it was decided to make a culture of seedsof all the plants and conduct yield trial in the IIcrop of 2004-05. The best one, recorded 5.963mt/ha. This was numbered PC 4 named“Sathyam”. It is a dwarf capable of producingmore tillers (upto 17) in II crop and maximum of266 spikelets (Table 4), of 110 days’ duration.
TKTM X IR 8Since this cross with 14 F1 hybrids with
maximum spikelet fertility of 26.3 %, selectionfrom second generation onwards was based onhigher fertility, more productive tillers and spikeletnumber (Tables 2,3). Maximum spikelet numberof 299 was achieved in F9. In the first crop, theplant had height of 105 cm, 6 tillers, panicle lengthof 32 cm. This culture recorded the lowest yieldof 4.083 mt/ha in II crop (Table 5). This culturehad largest sized seeds and highest weight of30.5 g for 1000 grains (Table 6). The variety isPC 5 and named “Santham”. In the yield trialconducted in the first crop of 2005-06, with morerains received, it yielded 6.114 mt/ha. The largersized grain of this variety is preferred forconsumption in Thrissur, Kollam and Kottayamin addition to making avil (beaten rice), a valueadded product fetching a premium price for thefarmer. Currently, it is Jyothi, another existingvariety, derived from crossing IR 8, that is usedfor making avil. In the trial in the I crop of 2005-06, it was found that Santham produced grainyield of 0.85 mt/ha more than Jyothi, with a 7days’ more duration.
It is interesting to note that a medium durationvariety like TKTM (Tavalakkannan fromThiruvilvamala) and a near medium durationvariety, Athira had given rise to two short durationvarieties, one with 110 days and another of 100days in the second crop, where Athira takes 125days for maturity. This is the only cross where
genes responsible for high grain memberexceeding 400 grains from TKTM have beentransferred in full. This can only be explainedby ‘gene -transfer’ as a result of chiasmaformation in meiosis between homologousregions of genes (chromatids) responsible fordetermining duration of these two varieties.Since linked genes near the centromere aredifficult to be broken, chromatid ends ofchromosomes generally take part in chiasmaformation (Elliott, 1958; Darlington and Mather,1950). If the above assumption is correct, itwould mean that duration determining lociconstitute a complex unit of a few genes whichcan give rise to shorter duration varieties undercertain conditions. A Palakkad Rice Farmerat present gets maximum of 4 mt/ha and thesevarieties would be a welcome addition to him.That Palakkad district, enjoying 35 % of itsland under irrigation from river valley projects,produces only 2 mt/ha and Kerala is a deficitState producing only one fifth of itsrequirement, calls for more short duration veryhigh yielding rices suited to varying agro-climatic Zones and it is this need that varietieslike the above (PC 3 to PC 6) would fulfil. Asfar as I am aware, this is the first report oftransfer of genes responsible for 430 grainsfrom a tall Indica like TKTM to two shorterduration (100 to 110 days) varieties in F10, whileboth parents had duration of 125 to 135 days.PC 3, “Sivam” had 413 and PC 6 “Sundaram”435 grains; the increased grain yield in thesetwo varieties is not solely due to high grainnumber but also due to higher productive tillers.Higher tillers which are productive were alsoobserved in all these varieties, excepting PC6, “Sundaram”. PC 2, Chenkazhama (second-coming) and PC 3 “Sivam” are two semi-tallvarieties selected not only for grain-yield, butalso due to need for straw for cattle that asmall farmer will maintain in his farm.
The highest grain yielder that ushered in thegreen revolution in Rice, IR 8 of International
Second National Plant Breeding Congress 2006 Plant Breeding in Post Genomics Era
109
Rice Research Institute, Philippines produces,on an average, 150 grains per main panicle andas part of upgrading rice production, IRRI istrying to bring 200 grains per panicle and in thisproject IR 72 has been made use of. The climaticconditions of Palakkad are different from thoseof Philippines and would account for low yieldsespecially the water deficit. This situation canbe changed only when more short duration, veryhigh grain yielders like the PC 3 “Sivam”, PC 4“Sathyam”, PC 5 “Santham” and PC 6“Sundaram” with 100 to 115 days in durationare introduced. Grain size and weight of 1000grains of these varieties are given in Table 6.Palakkad farmers prefer grains likeThavalkkannan and Chenkazhama whileKottayam and Kollam farmers prefer a littlemore longer and wider grains that Jyothi orSantham (PC 5) provide. Gradual introductionof Varieties like these short duration varietiesdepending on their suitability, in different climaticzones in the State would bring about self -sufficiency in rice production in the State. By2020 it is feared that the growth of populationwould outstrip grain production in India andKerala can face the future, with confidence.
Significance of Thavalakkannan fromThiruvilvamala, tall Indica rice Variety
Vavilov (1926 and 1949 - 1950 In Elliott, 1958)designated eight main ancient and independentworld centres of diversity for .our major cropplants. Of these, South east Asia was consideredthe second main centre of origin involvingHindustan (including Burma and Siam), theMalay Archipelago, Java, Borneo, Sumatra, thePhilippines and Indo-china. This area was thecentre of origin for rice, sugarcane, numerouslegumes and many tropical fruits. This regionincludes India and Palakkad district is consideredthe ‘Rice-Bowl’ of Kerala. Almost all varietiescultivated here are grown through out Kerala.Krishnaswamy and Chandrasekharan (1957)reported a naturally occurring tetraploid speciesof Oryza, O.mlampuzhaensis from
Malampuzha of Palakkad. Although the diploidof the species O.officinalis occurs naturally inAssam, its tetraploid species occurred here. Thefact that a variety like Thavalakkannan hasmany varied known forms (matta TK - PTB 8,white rice TK-PTB 9, the present TKTMstudied now) and its close phenotypic similarityto Chenkazhama (PTB 26) and currentlystudied Chenkazhama (OTP) which are allgenetically different show great diversity. BothThavalakkannan and Chenkazhama have violet(reddish-purple) coloured leaf sheath, leafmargin and leaf - junction, tip of glumes andwhen exposed to continued sunshine the uppersurface of the flag-leaf also assumed violetcolour. Sterile glumes of PTB 8 as well as thetip of glumes show extended violet colour.Excepting that Chenkazhama is a week earlierin duration to TK, there is no difference betweenthe two. The maximum grain number in PTB 8,PTB 9, PTB 26 (Chenkazhama) andChenkazhama (OTP) does not exceed 250.Therefore the variety, TKTM which possessed430 grains is an exceptionally superior variety.Another important point to note is that whileIRRI varieties show panicle length of about 24cm, more frequently, varieties likeThavalakkannan and Chenkazhama showpanicles of 28 - 30 cm indicating that our fore-fathers, as practical breeders, had preferredlonger panicled rice plants with more grains perpanicle for improvement in grain yield. All thesewould suggest that the superiority of TKTMamong rice genotypes of the region and asecondary centre of origin for the cultivatedvarieties of rice. It is a reasonable hypothesisto suggest that both Thavalakkannan andChenkazhama have evolved from a commonancestor with high grain number or that thevarieties now known as land races, TK andChenkazhma have originated from TKTM.Another important aspect is the tendency ofTKTM to form more productive tillers in the IIcrop which it passes on to its progenies (genetic).
Second National Plant Breeding Congress 2006 Plant Breeding in Post Genomics Era
110
PC 1 to PC 5 clearly showed this trait (Table4). More Productive tillers would certainlyincrease the grain yield as indeed the experienceof other farmers of Kollam, Kottayam andThrissur where PC 1 and PC 2 have been triedand tested for grain yield, getting pure seedsfrom progressive farmers associated with thiswork. Some details are given below.
PC 1 and PC 2 were released for generalcultivation in February 2003 and has grown incultivation through the effort of individualfarmers and Seed procuring Agencies to theextent of 600 and 500 acres respectively. Theobservation of different farmers of Kerala indifferent parts of the state are:
Palakkad regionMany farmers have reported that 6.0 mt/ha
can be obtained from PC 1 for both I and IIcrop. Shri. Rajakrishnan of Alampallam,Palakkad who supplied pure seeds of the varietyto others have shown that upto 7.5 mt/ha canbe obtained by varying cultural practices. PC2,semi-tall variety yields 5.6 mt/ha.
Kole cultivation, ThrissurLvla Ravindranath of Kanattukara found that
PC 1 can multiply 47 times by volume and PC2, 40 times. Her neighbouring farmers whoinspected the crop in the I crop season said thateven though PC 2 yielded grains less, theywanted straw for their cattle and liked PC 2also. The farmer then tried PC2 for ‘puncha -third crop’ and obtained a bumper yield of 8.4mt/ha.
Cool region, WvanadMr. L.G.Robinson and A.M. Joseph tested PC
1 and found they could obtain 6.72 mt/ha.
Kottayam, Kumarakom regionHere too much water is their problem. Since
Kuttanad is a region below the sea level, theyfrequently get water level rising rapidlyremaining for some time and draining. AlexanderChako, a farmer of the region, Kumarakom
obtained 28 quintals per acre despite the cropdrowning in water twice (7 mt/ha). Mr.C.K.Das, Managing Director, Rajiv GandhiPaddy Procurement and Marketing Societyhas obtained 10.8 metric tones of pure seedsfor sowing and planting large area, has informedme that the performance of the crop isexcellent in the area. George Joseph ofAlappuzha who has sown both PC 1 and PC 2feel that a very good crop of paddy, 6.75 mt/ha, is now grown where his farm of 3 acreswas running at a loss of Rs.4000 every season.
All the above facts clearly bring about thefact that TKTM is an ancient and mostsuccessful variety of Palakkad, being cultivatedby our fore-fathers for hundreds of years inall the varied conditions of Kerala and shouldhave accumulated necessary genetic changesin its genome and developed ‘built - intolerance’ for varied adverse conditions whichoccur in the State. I have discovered itaccidentally and transferred its yielding abilityto the currently grown dwarfs resulting in veryhigh yielding dwarfs (Table 5) which are alsoMatta (Table 6) preferred in the State. I believethese short duration varieties would aisoperform similarly and help increase theaverage yield of rice which remains staticaround 2 mt/ ha in Kerala State. Highest grainnumber found in the variety is proof that it cantolerate higher temperature prevalent in thedistrict. On the other hand, studies done bythe IRRI scientists (Peng et al 2004) haveshown that rise of one degree Celsius in nighttemperature decreases rice grain yields by 10per cent, of IRRI varieties, which form thedwarf parents in crosses.
REFERENCESDarlington, CD., and K. Mather. 1950. The
elements of Genetics. The MacillanCompany, New York.
Elliott Fred, C. 1958. Plant Breeding andCytogenetics. McGraw Hill Book
Second National Plant Breeding Congress 2006 Plant Breeding in Post Genomics Era
111
Company, London.Krishnaswamy, N. and P.Chandrasekharan.
(1957) Note on a naturally occurringtetraploid species of Oryza. Sci. and Cult.23: 307-310.
Peng Shaobing, Jianliang Huang, John, E.,Sheehy, Rebecca, C., Laza, Romeo, M.,Visperas, Xuhuazhong, Grace, S,. Centeno,Grudev, S., Khush. and Kenneth, G.,Cassman. 2004. Rice yields decline withhigher night temperature from globalwarming. PNAS 101, 27 : 9971 - 9975.
Second National Plant Breeding Congress 2006 Plant Breeding in Post Genomics Era
112
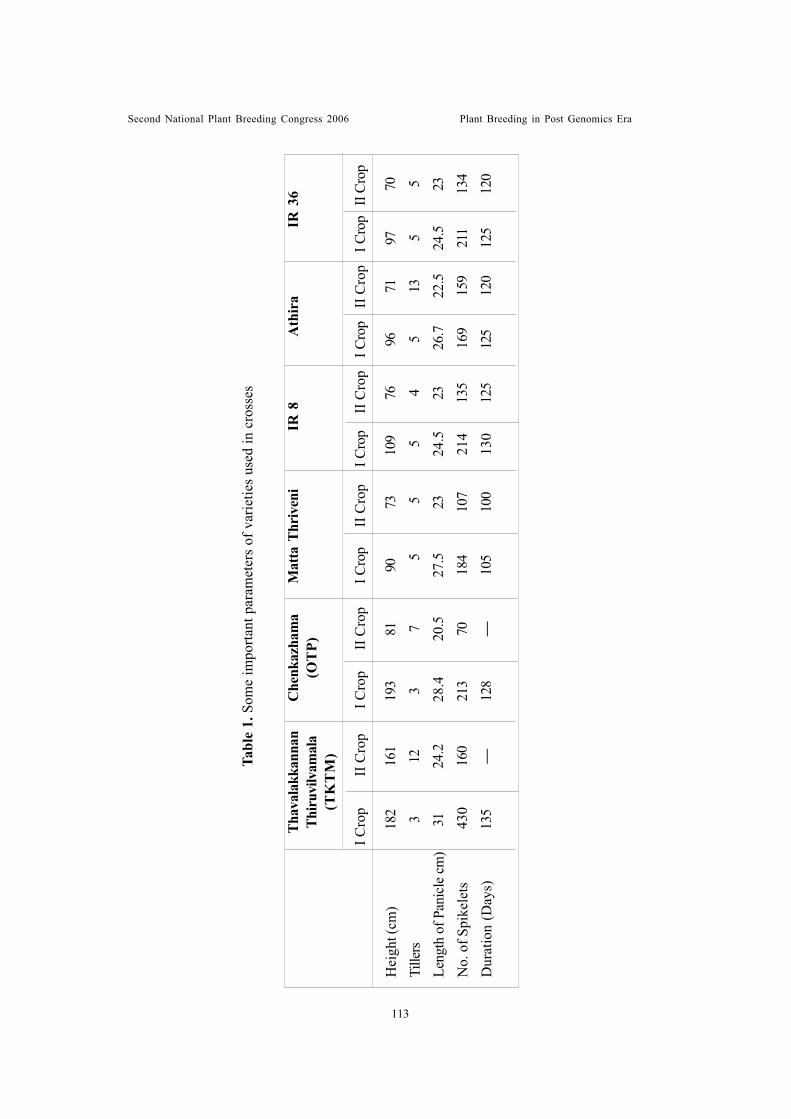
Tabl
e 1.
Som
e im
porta
nt p
aram
eter
s of
var
ietie
s us
ed in
cro
sses
Second National Plant Breeding Congress 2006 Plant Breeding in Post Genomics Era
182 3 31 4
30 135
Hei
ght (
cm)
Tille
rsLe
ngth
of P
anic
le c
m)
No.
of S
pike
lets
Dur
atio
n (D
ays)
97 5 24.5
211
125
193 3
28.
421
312
8
81 7 20.5 70 —
905
27.5
184
105
73 5 23 107
100
109 5 2
4.5
214
130
96 5 2
6.7
169
125
71 13 22.5
159
120
161
12 24.2
160
—
70 5 23 134
120
76 4 23 135
125
I Cro
pII
Cro
pI C
rop
II C
rop
I Cro
pII
Cro
pI C
rop
II C
rop
I Cro
pII
Cro
pI C
rop
II Cr
op
Thav
alak
kann
anTh
iruv
ilvam
ala
(TK
TM
)
Che
nkaz
ham
a(O
TP)
Mat
ta T
hriv
eni
Ath
ira
IR 8
IR 3
6
113
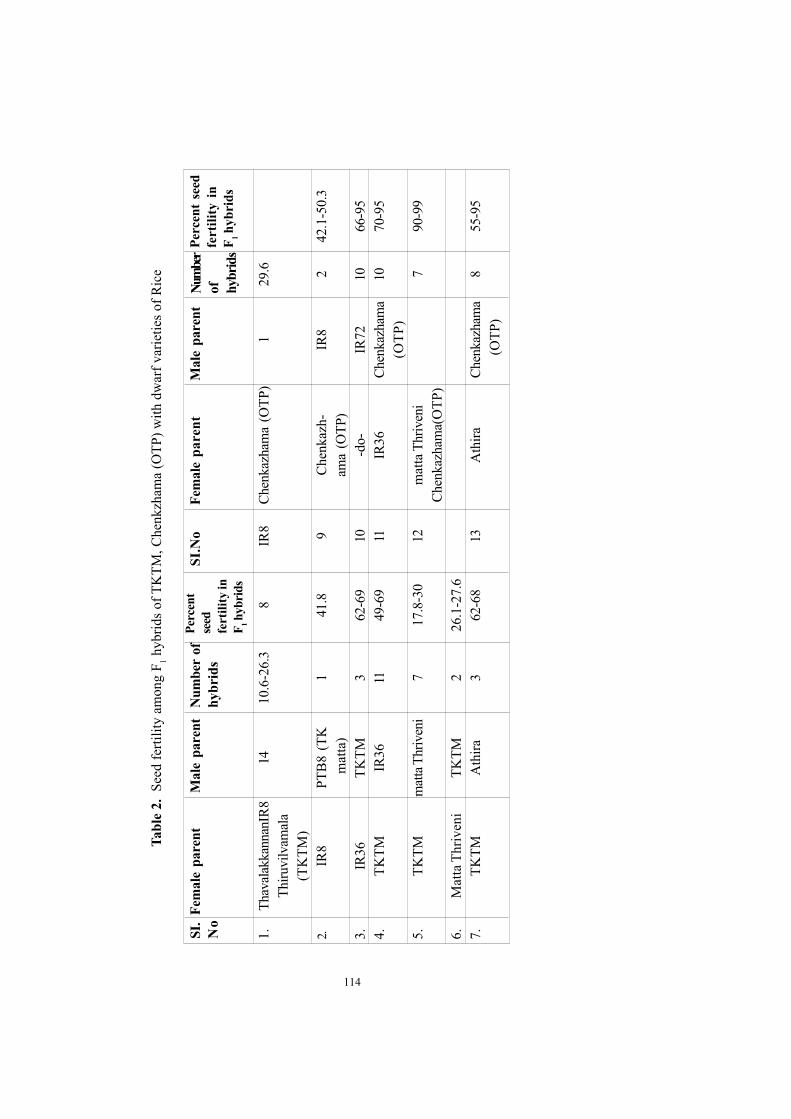
Tabl
e 2.
See
d fe
rtilit
y am
ong
F 1 hyb
rids o
f TK
TM, C
henk
zham
a (O
TP) w
ith d
war
f var
ietie
s of R
ice
1.Th
aval
akka
nnan
IR8
1410
.6-2
6.3
8IR
8Ch
enka
zham
a (O
TP)
129
.6Th
iruvi
lvam
ala
(TK
TM)
2.IR
8PT
B8
(TK
141
.89
Che
nkaz
h-IR
82
42.1
-50.
3 m
atta
)am
a (O
TP)
3.IR
36TK
TM3
62-6
910
-do-
IR72
1066
-95
4.TK
TMIR
3611
49-6
911
IR36
Chen
kazh
ama
1070
-95
(OTP
)5.
TKTM
mat
ta T
hriv
eni
717
.8-3
012
mat
taTh
riven
i7
90-9
9Ch
enka
zham
a(O
TP)
6.M
atta
Thr
iven
iTK
TM2
26.1
-27.
67.
TKTM
Ath
ira3
62-6
813
Ath
iraCh
enka
zham
a8
55-9
5 (
OTP
)
SI.
No
Fem
ale
pare
ntM
ale
pare
ntN
umbe
r of
hybr
ids
Perc
ent
seed
fert
ility
inF 1 h
ybri
ds
SI.N
oFe
mal
epa
rent
Mal
e pa
rent
Num
ber
of hybr
ids
Perc
ent
seed
fert
ility
in
F 1 hyb
rids
114
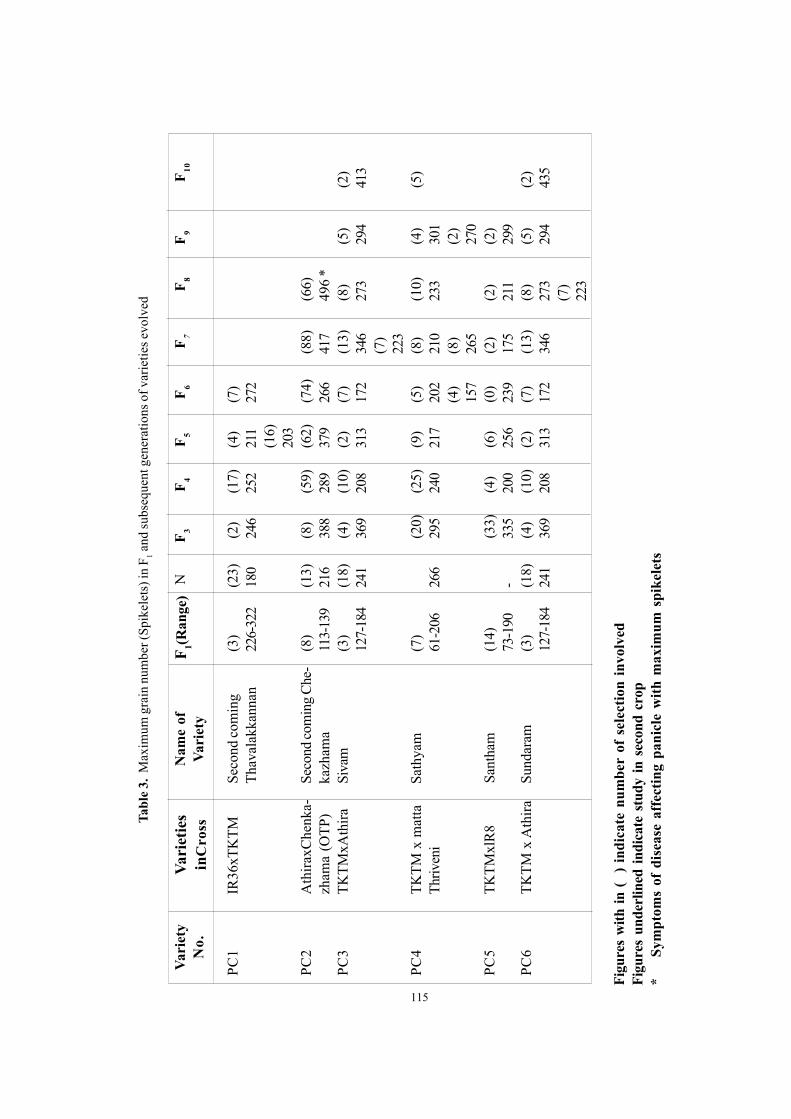
115
Tabl
e 3.
Max
imum
gra
in n
umbe
r (Sp
ikel
ets)
in F
1 and
subs
eque
nt g
ener
atio
ns o
f var
ietie
s evo
lved
Figu
res
with
in (
) in
dica
te n
umbe
r of
sel
ectio
n in
volv
edFi
gure
s un
derl
ined
indi
cate
stu
dy in
sec
ond
crop
*
Sym
ptom
s of
dis
ease
aff
ectin
g pa
nicl
e w
ith m
axim
um s
pike
lets
PC1
IR36
xTK
TMSe
cond
com
ing
(3)
(23)
(2)
(17)
(4)
(7)
Thav
alak
kann
an22
6-32
218
024
625
221
127
2(1
6)20
3PC
2A
thira
xChe
nka-
Seco
nd co
min
g Ch
e-(8
)(1
3)(8
)(5
9)(6
2)(7
4)(8
8)(6
6)zh
ama
(OTP
)ka
zham
a11
3-13
921
638
828
937
926
641
749
6 *
PC3
TKTM
xAth
iraSi
vam
(3)
(18)
(4)
(10)
(2)
(7)
(13)
(8)
(5)
(2)
127-
184
241
369
208
313
172
346
273
294
413
(7)
223
PC4
TKTM
x m
atta
Sath
yam
(7)
(20)
(25)
(9)
(5)
(8)
(10)
(4)
(5)
Thriv
eni
61-2
0626
629
524
021
720
221
023
330
1(4
)(8
)(2
)15
726
527
0PC
5TK
TMxl
R8
Sant
ham
(14)
(33)
(4)
(6)
(0)
(2)
(2)
(2)
73-1
90-
335
200
256
239
175
211
299
PC6
TKTM
x A
thira
Sund
aram
(3)
(18)
(4)
(10)
(2)
(7)
(13)
(8)
(5)
(2)
127-
184
241
369
208
313
172
346
273
294
435
(7)
223
Vari
ety
No.
Vari
etie
sin
Cro
ssN
ame
ofVa
riet
yF 1(R
ange
)N
F 3F
4F
5F
6F
7F
8F
9F
10
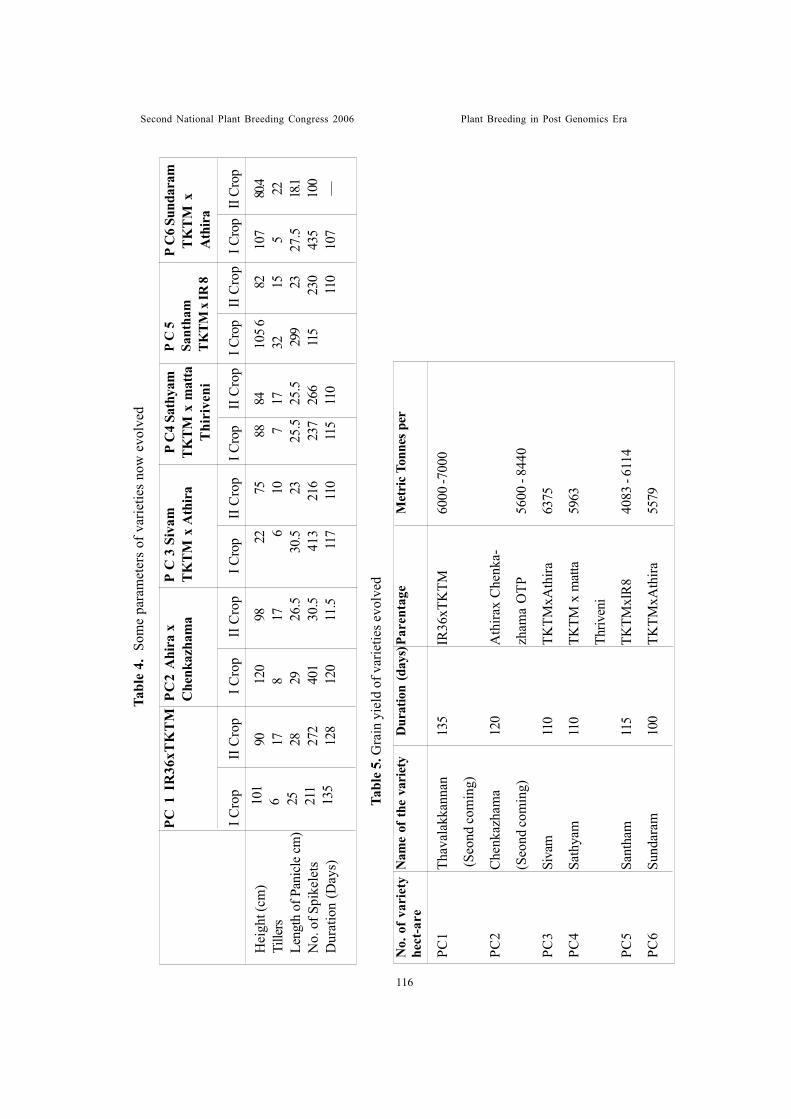
Second National Plant Breeding Congress 2006 Plant Breeding in Post Genomics Era
Tabl
e 4.
Som
e pa
ram
eter
s of
var
ietie
s no
w e
volv
ed
No.
of v
arie
tyN
ame
of th
e va
riet
yD
urat
ion
(day
s)Pa
rent
age
Met
ric
Tonn
es p
erhe
ct-a
re
PC1
Thav
alak
kann
an13
5IR
36xT
KTM
6000
-700
0
(Seo
nd co
min
g)
PC2
Che
nkaz
ham
a12
0A
thira
x C
henk
a-
(Seo
nd co
min
g)zh
ama
OTP
5600
- 84
40
PC3
Siva
m11
0TK
TMxA
thira
6375
PC4
Sath
yam
110
TKTM
x m
atta
5963
Thriv
eni
PC5
Sant
ham
115
TKTM
xlR
840
83 -
6114
PC6
Sund
aram
100
TKTM
xAth
ira55
79
Tabl
e 5.
Gra
in y
ield
of v
arie
ties e
volv
ed
101
6 25 211
135
Hei
ght (
cm)
Tille
rsLe
ngth
of P
anic
le c
m)
No.
of S
pike
lets
Dur
atio
n (D
ays)
107 5 27.5
435
107
120
8 29 401
120
98 17 26.5
30.5
11.5
22 630
.5 4
13 117
75 10 23 216
110
88 7 25.5
237
115
105 6
32 299
115
82 15 23 230
110
90 17 28 272
128
80.4 22 18.1
100
—
84 17 25.5
266
110
I Cro
pII
Cro
pI C
rop
II C
rop
I Cro
pII
Cro
pI C
rop
II C
rop
I Cro
pII
Cro
pI C
rop
II Cr
op
PC 1
IR
36xT
KT
MPC
2A
hira
xC
henk
azha
ma
P C
3 S
ivam
TKTM
x A
thir
aP
C 5
Sant
ham
TKTM
x IR
8
P C
4 Sa
thya
mTK
TM x
mat
taT
hiri
veni
P C
6 Su
ndar
amT
KT
M x
Ath
ira
116
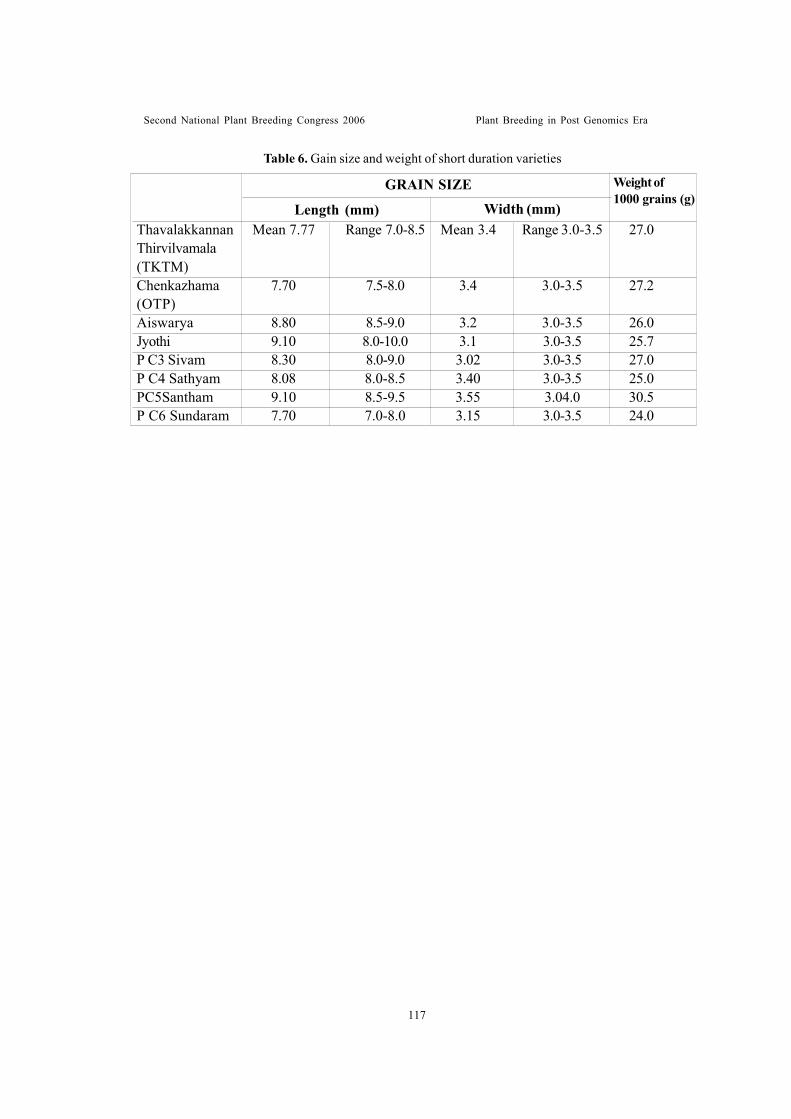
Second National Plant Breeding Congress 2006 Plant Breeding in Post Genomics Era
117
Table 6. Gain size and weight of short duration varieties
GRAIN SIZE Weight of1000 grains (g)
Length (mm) Width (mm)Thavalakkannan Mean 7.77 Range 7.0-8.5 Mean 3.4 Range 3.0-3.5 27.0Thirvilvamala(TKTM)Chenkazhama 7.70 7.5-8.0 3.4 3.0-3.5 27.2(OTP)Aiswarya 8.80 8.5-9.0 3.2 3.0-3.5 26.0Jyothi 9.10 8.0-10.0 3.1 3.0-3.5 25.7P C3 Sivam 8.30 8.0-9.0 3.02 3.0-3.5 27.0P C4 Sathyam 8.08 8.0-8.5 3.40 3.0-3.5 25.0PC5Santham 9.10 8.5-9.5 3.55 3.04.0 30.5P C6 Sundaram 7.70 7.0-8.0 3.15 3.0-3.5 24.0
Second National Plant Breeding Congress 2006 Plant Breeding in Post Genomics Era
TECHNICAL SESSION II
QUANTITATIVE GENETICS AND ANALYSIS OFGENOTYPE X ENVIRONMENT INTERACTION
Second National Plant Breeding Congress 2006 Plant Breeding in Post Genomics Era
There are two avenues of utilizing a vastsubject like Quantitative Genetics - one as anappetizing theory and its development that needa theoretical bent of mind including goodknowledge of Statistics and elements ofMathematics, and the other as a beacon fortargeted plant breeding. In the context of theformer, in other countries good foundation ofMathematics and Statistics is laid at the schooland undergraduate level; but diversity of testcrops and of growing environments is not alwaysavailable for practical testing of biological andquantitative genetic concepts. In India, thereverse is true with weak or absence of strongfoundation of Mathematics and Statistics butunlimited diversity of crops and growingenvironments. This imbalance defies anyinnovative correction in India, leading, at times,to misplaced doubts of the practical relevanceof the subject of Quantitative Genetics.
However, any theory initiates underrestricted and often indefensible assumptions anddeveloped relaxing the assumptions in stages.For instance, the popular model, P = G + E or itsextensions have untenable built-in assumptions.
Good conceptual strides have been made intargeted plant breeding, with designs of fieldexperiments, whose strong foundation were laidby Fisher, playing an important role. But the gapsbetween practical plant breeding and the promptsto it through quantitative genetics theory continueto remain wide.
QUANTITATIVE GENETICS - WHERE ARE WE TODAY?Arunachalam, V
ABSTRACT
The evolution of Quantitative Genetics concurrently with Population Genetics, fromthe time Charles Darwin discovered ‘variation’ and provided a logical frame, has beendocumented extensively. The monumental work of the greats - Sir Ronald Fisher, SewallGreen Wright and John B.S. Haldane that shaped Quantitative Genetics, has been taken togreater heights by a number of well-known geneticists including Kenneth Mather, John L.Jinks, Oscar Kempthome, Ralph .E. Comstock, Harold F. Robinson, to name a few.
M.S. Swaminathan Research Foundation, 3rd Cross Road, Taramani Institutional Area, Chennai 600113
In general, there are accepted lines ofpractices to breed for improvement ofquantitative traits (QTs), like diversityevaluation, parental choice for hybridizationdesigns and selective breeding. How farQuantitative Genetics guides a breeder fortargeted improvement is an open question.
At this point, strides made in molecularbiology from around 1980s, were set to providethe new avenue. Capacities to identify markersof QTs using molecular tools started increasing;with a good funding back-up, research prioritiesgot shifted to the new avenue at the cost oftime-tested Mendeiian breeding. Whatpathways are explored to integrate the best ofMendelian and Molecular breeding (a relativelynew subject)? What is the role of QuantitativeGenetics here? Such questions are intriguingand annoying. Until we address them, soonerthan later, the scope for realizing more thanadditive benefits from integrating Mendeiianand Molecular approaches would be elusive.This paper addresses issues central andperipheral to them.
Charles Darwin first discovered ‘variation’after his voyage on H.M.S. Beagle. The geneticbasis of variation became clear after the first‘Classical experiments on Plant hybridisation’by Gregor Johann Mendel that helped in theformulation of the famous Laws of Heredity.Further work by various researchers onvariation and evolution, including Francis Galton
118
Second National Plant Breeding Congress 2006 Plant Breeding in Post Genomics Era
led to two differing schools of thought - (1)Darwin’s school of continuous evolution (withthose professing this school being calledBiometricians) and (2) Galton’s school ofdiscontinuous evolution (with those professingthis school being called Mendelians). But it wasa lingering question whether the two schoolswere consistent with Darwin’s theory ofevolution by natural selection. It was R.A. Fisherwho synthesized the two schools and establishedthe principle of natural selection, more rigorouslythan Darwin, as the cause of evolutionarychange using a mathematical theory developedon the basis of extant genetic research (cf.Fisher, 1930). Further work by another peergeneticist, J.B.S. Haldane reestablished thatnatural selection was the premier mechanism ofevolution. He explained it in terms ofmathematical consequences of Mendeiiangenetics. His book, ‘The Causes of Evolution’(1932), came to be known as the “modernevolutionary synthesis”. Sewall Wright, anothergreat geneticist and contemporary of Fisher andHaldane, founded the theory of genetic drift (thatlater came to be known as the Sewall Wrighteffect), a random effect caused by randomsampling of genotypes. Through this theory, hecould explain how evolution occurred. This washugely influential in the evolution of evolutiontheory itself. Wright further drew a pathway tovisualise the relationship between genotype andphenotype.
Thus Fisher, Haldane and Wright whosemonumental work shaped Quantitative Geneticsare known as the founders of QuantitativeGenetics. Their work was taken to greaterheights by a number of well-known geneticistsincluding Kenneth Mather, John L. Jinks, OscarKempthorne, Ralph .E. Comstock, Harold F.Robinson, to name a few. The subject ofQuantitative Genetics has two important utilities:
1. Analysis of genetic phenomena underlyingQT expression, variation, and evolution usingadvances in theory [has specific congruence
with Population Genetics]. To deal with thisarea without adequate knowledge ofstatistics and probability theory would beprofoundly difficult.
2. Optimization of methods of plant breedingusing the leads given by QuantitativeGenetics concepts that would provide firm(with a probability) responses leading tomore hits than misses.
This are a is within the reach of plantbreeders and applied geneticists and we shalldeal with this area therefore in this paper. Anybasic conceptualization initiates under restrictedand often indefensible assumptions. A numberof theoretical results obtained this way have tobe understood in their proper perspective andgreat caution is needed before applying themto a practical problem. An example is givenhere to illustrate this point. It is known that agenotype needs an environment to express andmanifests itself as phenotype; in this processgenotype interacts with environment in a verycomplex way and in general, it is not possibleto model phenotype (P) in terms of genotype(G) and environment (E).
However, the theory starts with thesimplest additive model,
P = G + E Known Unknown
As indicated, in the above equation onlyphenotypic value (dependent variable) can bemeasured and the independent variables, G andE are unknown.
Fisher circumvented this problem using thestrategy of growing the phenotypes in the fieldusing an appropriate design and estimatingenvironmental variance (= error mean square).Again by simplifying assumptions that G and Eare independent which is not so anyway, heshowed that variance of G can be estimatedas
Variance of G = Variance of P - Variance
119
Second National Plant Breeding Congress 2006 Plant Breeding in Post Genomics Era
of E, and symbolically,
F2G = F2F - F2E
Likewise, the genetic value G in P = G + Eis partitioned into two orthogonal components, A(Additive Effect) and D (Dominance Effect). Itcan be shown that A is also equivalent toBreeding Value and gca effect (Arunachalam,1993). Without going to details, we recognize thata fit of a best possible straight line to the 3phenotypic values of a population governed by asingle diallelic gene leads to the value of A (fullerdetails in Li, 1955; Arunachalam and Owen,1971) and the deviations from the fitted straightline leads to D (Table 1). What often times isnot recognized is the fact that the estimate of Ainvolves the frequency of genotypes in thepopulation and in fact, A is a function of not onlythe value (phenotypic) but also the genefrequency of T (equivalently the frequencies ofgenotypes, TT, Tt and tt, see Table 1) in general.In the particular case of a population where thefrequencies of TT, Tt and tt are V*, Vz and %(implying p, the gene frequency of T = V2), theexpression for A seemingly does not contain p(but actually it contains p with the numericalvalue, p= 1/4 !). In the context of treatises onQuantitative Genetics being naive and inexpliciton this point, the above explanation becomescrucial (see also Arunachalam, 1976).
We thus note that in partitioning G into Aand D, the following assumptions are implicit:
1. Population governed by a single diallelic gene
2. Fit of a straight line or additive model to the3 phenotypic values
3. At times, the added simplification by confiningoneself to a single diallelicpopulation withfrequency of dominant gene = Vz ;for this, itis assumed that an F2 population is generatedfrom the cross, TT x tt , noting that it is hardto ensure selection of parental phenotypesto be completely homozygous to be of
genotypes, TT and tt.
GY: genotype; f: frequency; A: additive effect;D: dominance effect; GV: Genetic value
Hence in utilizing various test expressions,as for example, heterosis, heritability (bothnarrow and broad sense) and the like, it iscrucial to be aware of the limitations beforeextrapolating decisions for further breeding inpractical situations.
However the theory is further developedafter relaxing the assumptions in stages, thoughit is difficult to develop it to exactly match anypractical situation.
From the days of Mendel, breedersdifferentiate between qualitative (with defineddiscrete classes) and quantitative (continuousvariation preventing to define discrete classes)traits. However, with scientific advances, it isnow possible to measure traits in continuousscale and therefore argue that only QTs existand qualitative trait is not defensible. Forexample, leaf colour that is defined usingdiscrete scores, like 1- dark green; 2- green; 3-
pale green can now be quantitativelymeasured as colour intensity in a continuousscale. The same argument holds for other traitsdefined by colour, for example flower colour.Other traits that are common are seedlingvigour (that can now be measured as dry weightof young seedlings) and disease incidence (thatcan be measured as leaf area affected andsimilar other measurements).
GY f A D GV RemarkTT P2 ATT -2q2h GTT where h is theTt 2pq ATt +2pqh GTt phenotypictt Att -2p2h Gtt value of the
heterozygote,Tt, measured asthe deviation
Table 1. Genetic values partitioned intoadditive (A) and dominance (D) components
120
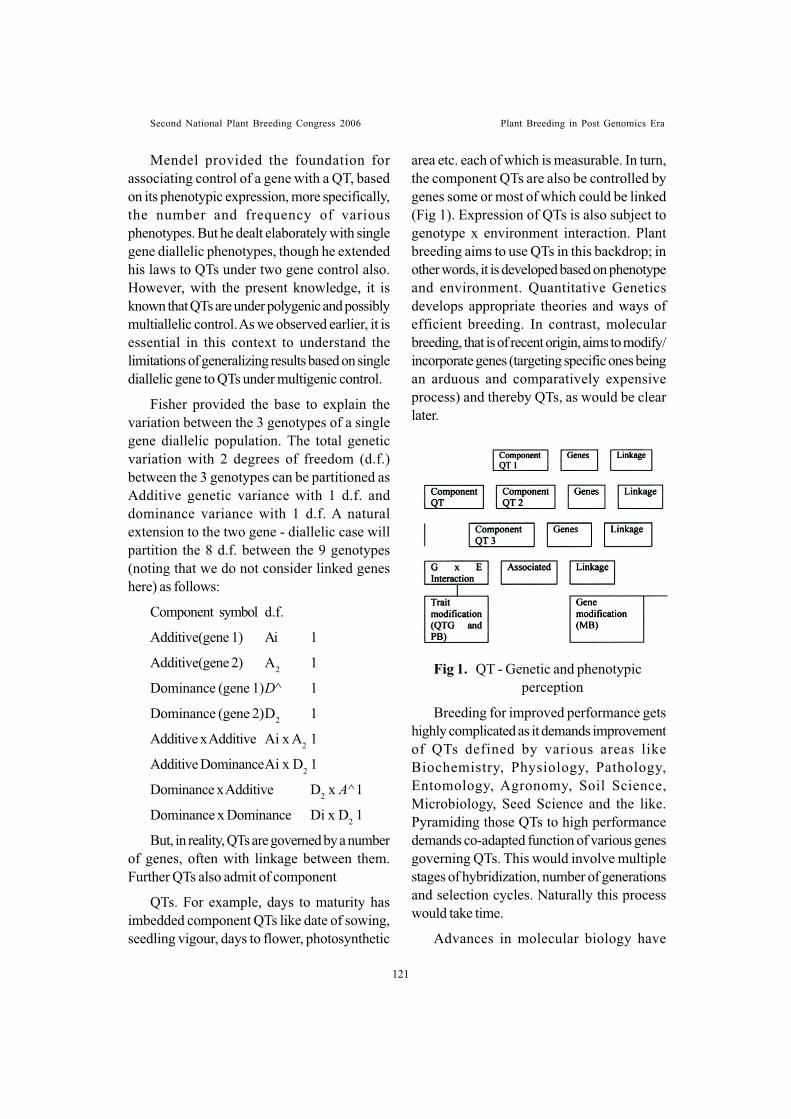
Second National Plant Breeding Congress 2006 Plant Breeding in Post Genomics Era
Mendel provided the foundation forassociating control of a gene with a QT, basedon its phenotypic expression, more specifically,the number and frequency of variousphenotypes. But he dealt elaborately with singlegene diallelic phenotypes, though he extendedhis laws to QTs under two gene control also.However, with the present knowledge, it isknown that QTs are under polygenic and possiblymultiallelic control. As we observed earlier, it isessential in this context to understand thelimitations of generalizing results based on singlediallelic gene to QTs under multigenic control.
Fisher provided the base to explain thevariation between the 3 genotypes of a singlegene diallelic population. The total geneticvariation with 2 degrees of freedom (d.f.)between the 3 genotypes can be partitioned asAdditive genetic variance with 1 d.f. anddominance variance with 1 d.f. A naturalextension to the two gene - diallelic case willpartition the 8 d.f. between the 9 genotypes(noting that we do not consider linked geneshere) as follows:
Component symbol d.f.
Additive(gene 1) Ai 1
Additive(gene 2) A2 1
Dominance (gene 1)D^ 1
Dominance (gene 2)D2 1
Additive x Additive Ai x A2 1
Additive DominanceAi x D2 1
Dominance x Additive D2 x A^ 1
Dominance x Dominance Di x D2 1
But, in reality, QTs are governed by a numberof genes, often with linkage between them.Further QTs also admit of component
QTs. For example, days to maturity hasimbedded component QTs like date of sowing,seedling vigour, days to flower, photosynthetic
area etc. each of which is measurable. In turn,the component QTs are also be controlled bygenes some or most of which could be linked(Fig 1). Expression of QTs is also subject togenotype x environment interaction. Plantbreeding aims to use QTs in this backdrop; inother words, it is developed based on phenotypeand environment. Quantitative Geneticsdevelops appropriate theories and ways ofefficient breeding. In contrast, molecularbreeding, that is of recent origin, aims to modify/incorporate genes (targeting specific ones beingan arduous and comparatively expensiveprocess) and thereby QTs, as would be clearlater.
Fig 1. QT - Genetic and phenotypic perception
Breeding for improved performance getshighly complicated as it demands improvementof QTs defined by various areas likeBiochemistry, Physiology, Pathology,Entomology, Agronomy, Soil Science,Microbiology, Seed Science and the like.Pyramiding those QTs to high performancedemands co-adapted function of various genesgoverning QTs. This would involve multiplestages of hybridization, number of generationsand selection cycles. Naturally this processwould take time.
Advances in molecular biology have
121
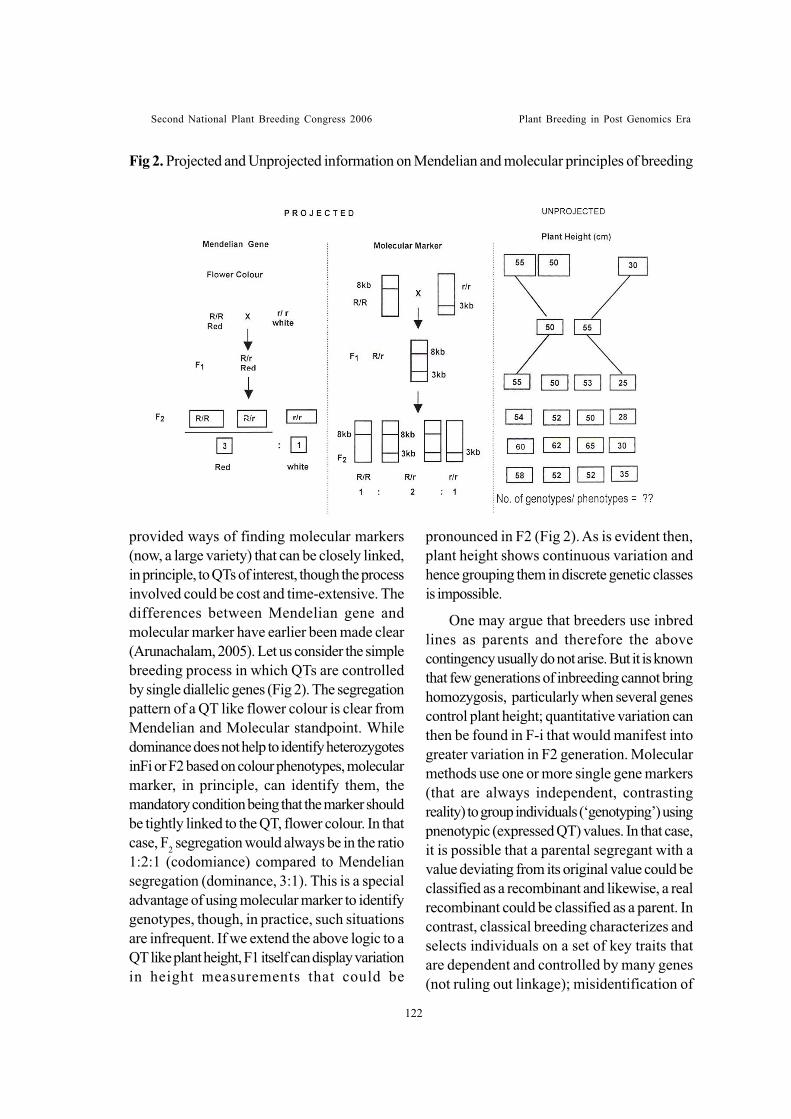
Second National Plant Breeding Congress 2006 Plant Breeding in Post Genomics Era
provided ways of finding molecular markers(now, a large variety) that can be closely linked,in principle, to QTs of interest, though the processinvolved could be cost and time-extensive. Thedifferences between Mendelian gene andmolecular marker have earlier been made clear(Arunachalam, 2005). Let us consider the simplebreeding process in which QTs are controlledby single diallelic genes (Fig 2). The segregationpattern of a QT like flower colour is clear fromMendelian and Molecular standpoint. Whiledominance does not help to identify heterozygotesinFi or F2 based on colour phenotypes, molecularmarker, in principle, can identify them, themandatory condition being that the marker shouldbe tightly linked to the QT, flower colour. In thatcase, F2 segregation would always be in the ratio1:2:1 (codomiance) compared to Mendeliansegregation (dominance, 3:1). This is a specialadvantage of using molecular marker to identifygenotypes, though, in practice, such situationsare infrequent. If we extend the above logic to aQT like plant height, F1 itself can display variationin height measurements that could be
pronounced in F2 (Fig 2). As is evident then,plant height shows continuous variation andhence grouping them in discrete genetic classesis impossible.
One may argue that breeders use inbredlines as parents and therefore the abovecontingency usually do not arise. But it is knownthat few generations of inbreeding cannot bringhomozygosis, particularly when several genescontrol plant height; quantitative variation canthen be found in F-i that would manifest intogreater variation in F2 generation. Molecularmethods use one or more single gene markers(that are always independent, contrastingreality) to group individuals (‘genotyping’) usingpnenotypic (expressed QT) values. In that case,it is possible that a parental segregant with avalue deviating from its original value could beclassified as a recombinant and likewise, a realrecombinant could be classified as a parent. Incontrast, classical breeding characterizes andselects individuals on a set of key traits thatare dependent and controlled by many genes(not ruling out linkage); misidentification of
Fig 2. Projected and Unprojected information on Mendelian and molecular principles of breeding
122
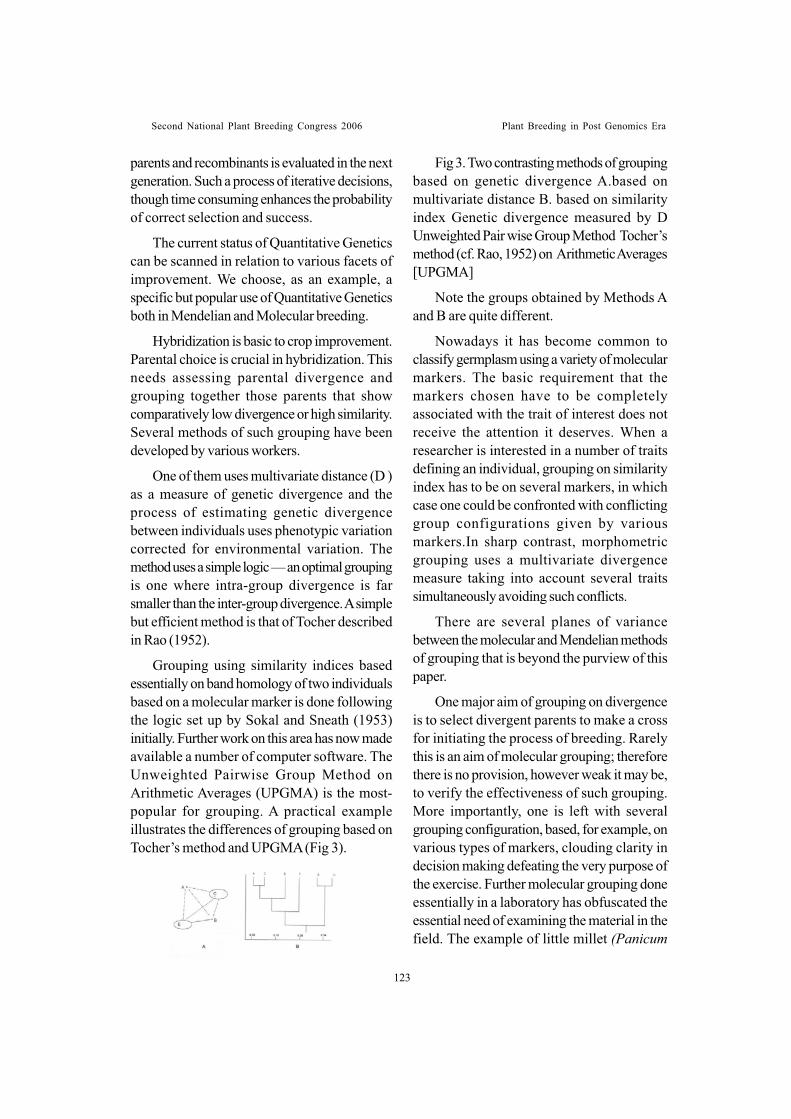
Second National Plant Breeding Congress 2006 Plant Breeding in Post Genomics Era
parents and recombinants is evaluated in the nextgeneration. Such a process of iterative decisions,though time consuming enhances the probabilityof correct selection and success.
The current status of Quantitative Geneticscan be scanned in relation to various facets ofimprovement. We choose, as an example, aspecific but popular use of Quantitative Geneticsboth in Mendelian and Molecular breeding.
Hybridization is basic to crop improvement.Parental choice is crucial in hybridization. Thisneeds assessing parental divergence andgrouping together those parents that showcomparatively low divergence or high similarity.Several methods of such grouping have beendeveloped by various workers.
One of them uses multivariate distance (D )as a measure of genetic divergence and theprocess of estimating genetic divergencebetween individuals uses phenotypic variationcorrected for environmental variation. Themethod uses a simple logic — an optimal groupingis one where intra-group divergence is farsmaller than the inter-group divergence. A simplebut efficient method is that of Tocher describedin Rao (1952).
Grouping using similarity indices basedessentially on band homology of two individualsbased on a molecular marker is done followingthe logic set up by Sokal and Sneath (1953)initially. Further work on this area has now madeavailable a number of computer software. TheUnweighted Pairwise Group Method onArithmetic Averages (UPGMA) is the most-popular for grouping. A practical exampleillustrates the differences of grouping based onTocher’s method and UPGMA (Fig 3).
Fig 3. Two contrasting methods of groupingbased on genetic divergence A.based onmultivariate distance B. based on similarityindex Genetic divergence measured by DUnweighted Pair wise Group Method Tocher’smethod (cf. Rao, 1952) on Arithmetic Averages[UPGMA]
Note the groups obtained by Methods Aand B are quite different.
Nowadays it has become common toclassify germplasm using a variety of molecularmarkers. The basic requirement that themarkers chosen have to be completelyassociated with the trait of interest does notreceive the attention it deserves. When aresearcher is interested in a number of traitsdefining an individual, grouping on similarityindex has to be on several markers, in whichcase one could be confronted with conflictinggroup configurations given by variousmarkers.In sharp contrast, morphometricgrouping uses a multivariate divergencemeasure taking into account several traitssimultaneously avoiding such conflicts.
There are several planes of variancebetween the molecular and Mendelian methodsof grouping that is beyond the purview of thispaper.
One major aim of grouping on divergenceis to select divergent parents to make a crossfor initiating the process of breeding. Rarelythis is an aim of molecular grouping; thereforethere is no provision, however weak it may be,to verify the effectiveness of such grouping.More importantly, one is left with severalgrouping configuration, based, for example, onvarious types of markers, clouding clarity indecision making defeating the very purpose ofthe exercise. Further molecular grouping doneessentially in a laboratory has obfuscated theessential need of examining the material in thefield. The example of little millet (Panicum
123
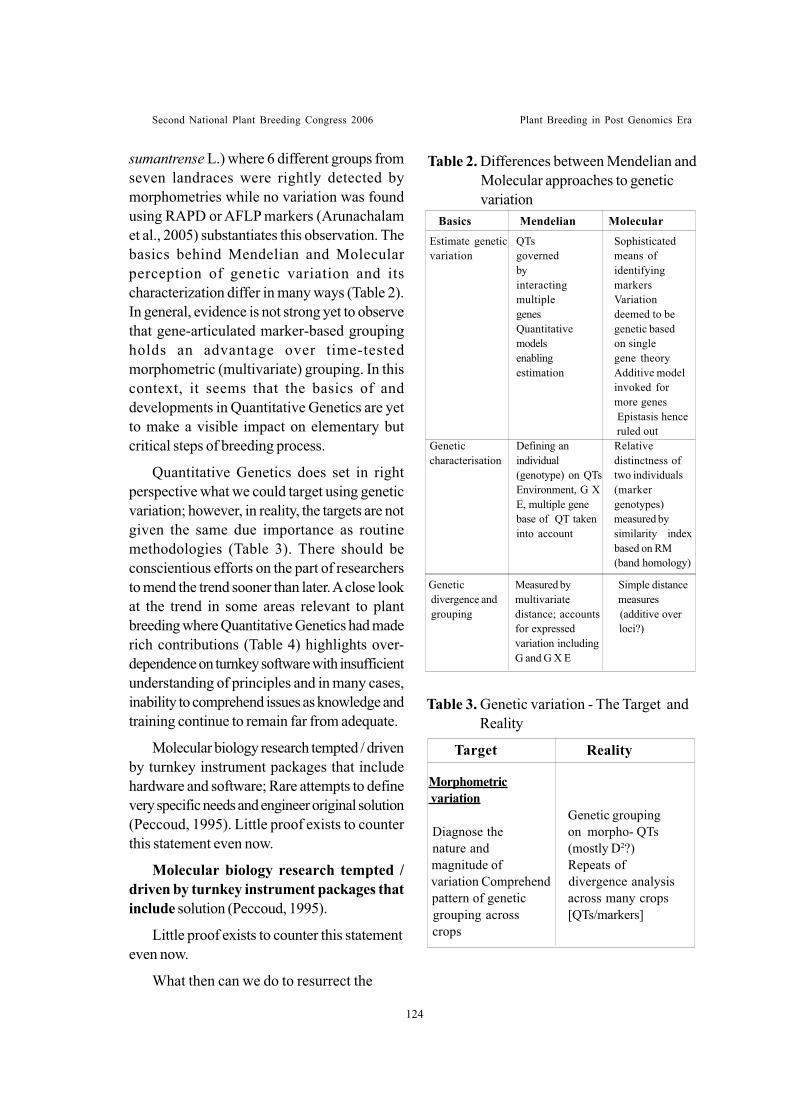
Second National Plant Breeding Congress 2006 Plant Breeding in Post Genomics Era
sumantrense L.) where 6 different groups fromseven landraces were rightly detected bymorphometries while no variation was foundusing RAPD or AFLP markers (Arunachalamet al., 2005) substantiates this observation. Thebasics behind Mendelian and Molecularperception of genetic variation and itscharacterization differ in many ways (Table 2).In general, evidence is not strong yet to observethat gene-articulated marker-based groupingholds an advantage over time-testedmorphometric (multivariate) grouping. In thiscontext, it seems that the basics of anddevelopments in Quantitative Genetics are yetto make a visible impact on elementary butcritical steps of breeding process.
Quantitative Genetics does set in rightperspective what we could target using geneticvariation; however, in reality, the targets are notgiven the same due importance as routinemethodologies (Table 3). There should beconscientious efforts on the part of researchersto mend the trend sooner than later. A close lookat the trend in some areas relevant to plantbreeding where Quantitative Genetics had maderich contributions (Table 4) highlights over-dependence on turnkey software with insufficientunderstanding of principles and in many cases,inability to comprehend issues as knowledge andtraining continue to remain far from adequate.
Molecular biology research tempted / drivenby turnkey instrument packages that includehardware and software; Rare attempts to definevery specific needs and engineer original solution(Peccoud, 1995). Little proof exists to counterthis statement even now.
Molecular biology research tempted /driven by turnkey instrument packages thatinclude solution (Peccoud, 1995).
Little proof exists to counter this statementeven now.
What then can we do to resurrect the
Table 2. Differences between Mendelian and Molecular approaches to genetic variation
Table 3. Genetic variation - The Target and Reality
Target Reality
Morphometric variation
Genetic grouping Diagnose the on morpho- QTs nature and (mostly D2?) magnitude of Repeats of variation Comprehend divergence analysis pattern of genetic across many crops grouping across [QTs/markers] crops
Estimate genetic QTs Sophisticatedvariation governed means of
by identifyinginteracting markersmultiple Variationgenes deemed to beQuantitative genetic basedmodels on singleenabling gene theoryestimation Additive model
invoked formore genesEpistasis hence
ruled outGenetic Defining an Relativecharacterisation individual distinctness of
(genotype) on QTs two individualsEnvironment, G X (markerE, multiple gene genotypes)base of QT taken measured byinto account similarity index
based on RM(band homology)
Basics Mendelian Molecular
Genetic Measured by Simple distance divergence and multivariate measures grouping distance; accounts (additive over
for expressed loci?)variation includingG and G X E
124
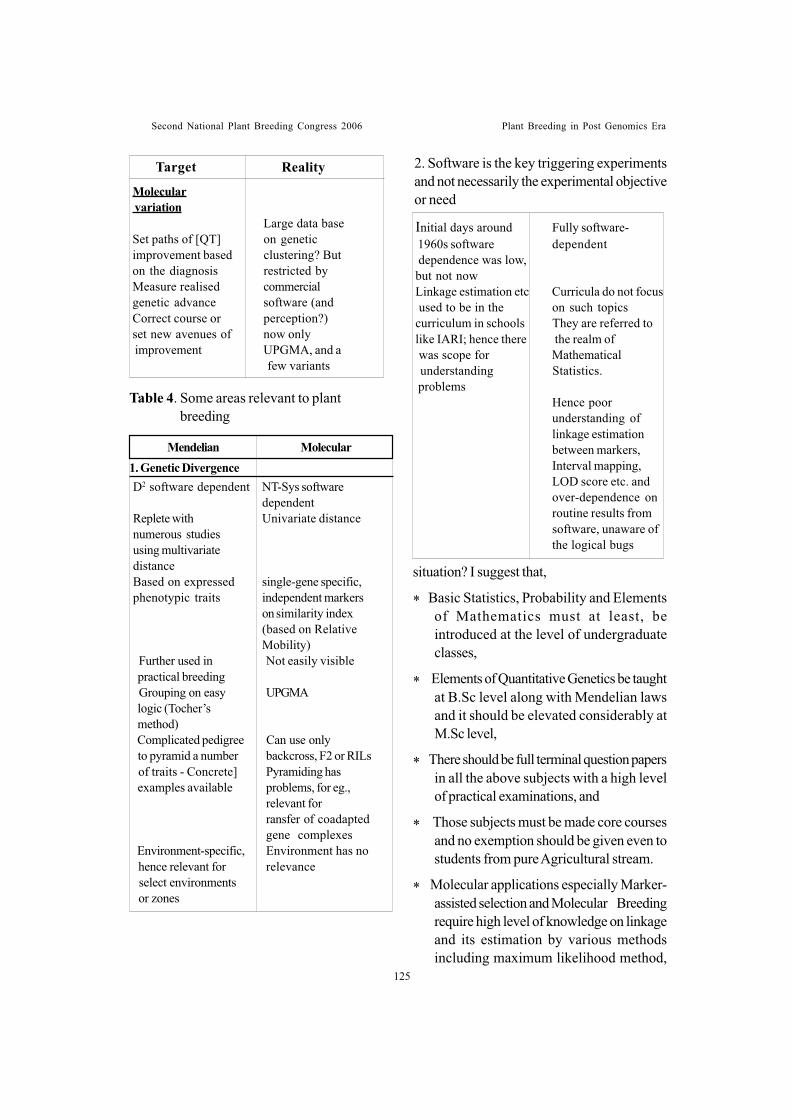
Second National Plant Breeding Congress 2006 Plant Breeding in Post Genomics Era
Initial days around Fully software- 1960s software dependent dependence was low,but not nowLinkage estimation etc Curricula do not focus used to be in the on such topicscurriculum in schools They are referred tolike IARI; hence there the realm of was scope for Mathematical understanding Statistics. problems
Hence poorunderstanding oflinkage estimationbetween markers,Interval mapping,LOD score etc. andover-dependence onroutine results fromsoftware, unaware ofthe logical bugs
Molecular variation
Large data baseSet paths of [QT] on geneticimprovement based clustering? Buton the diagnosis restricted byMeasure realised commercialgenetic advance software (andCorrect course or perception?)set new avenues of now only improvement UPGMA, and a
few variants
Target Reality
Table 4. Some areas relevant to plant breeding
Mendelian Molecular1. Genetic DivergenceD2 software dependent NT-Sys software
dependentReplete with Univariate distancenumerous studiesusing multivariatedistanceBased on expressed single-gene specific,phenotypic traits independent markers
on similarity index(based on RelativeMobility)
Further used in Not easily visible practical breeding Grouping on easy UPGMA logic (Tocher’s method) Complicated pedigree Can use only to pyramid a number backcross, F2 or RILs of traits - Concrete] Pyramiding has examples available problems, for eg.,
relevant forransfer of coadaptedgene complexes
Environment-specific, Environment has no hence relevant for relevance select environments or zones
2. Software is the key triggering experimentsand not necessarily the experimental objectiveor need
situation? I suggest that,
* Basic Statistics, Probability and Elementsof Mathematics must at least, beintroduced at the level of undergraduateclasses,
* Elements of Quantitative Genetics be taughtat B.Sc level along with Mendelian lawsand it should be elevated considerably atM.Sc level,
* There should be full terminal question papersin all the above subjects with a high levelof practical examinations, and
* Those subjects must be made core coursesand no exemption should be given even tostudents from pure Agricultural stream.
* Molecular applications especially Marker-assisted selection and Molecular Breedingrequire high level of knowledge on linkageand its estimation by various methodsincluding maximum likelihood method,
125
Second National Plant Breeding Congress 2006 Plant Breeding in Post Genomics Era
principles of Analysis of Variance etc. Thereshould then be a separate compulsory coursethat should lead, through practical examples,to just-sufficient theory to avoid overload.
Unfortunately, good teachers of QuantitativeGenetics have become a vanishing breed. Untilnew good teachers become available, we couldenlist known teachers [junior/senior] in a virtualknowledge forum (as suggested by President ofIndia) to teach and interact with students acrossinstitutions. This will compensate for existingintra-institutional deficiency. Purposive fundingis needed for this activity. To sustain efficiency,it is prudent to introduce evaluation of teachersby students on open discussion. Such an openevaluation would remove bad practices like highscore cards given to students without justificationin return for high rating of teachers. It would beinnovative to introduce open valuation systemof students’ performance so that scores do notbecome blocks in proper learning. It is equallyimportant to encourage good teachers to moveacross institutions to teach and learn. Confidenceneed to be nurtured to encourage free and frankdiscussion among students and, between studentsand teachers. An indirect force imposing qualityis to stop routine field experiments, analysis byroutine software and unappetizing thesiscontaining routine results/discussion.
Finally, we should Identify bright studentsand encourage them to remain in research andteaching, through innovative placements withinthe Institution. Honourable President’ssuggestion of adopting ‘Singapore Biopolis’model (Hindu, 23 Feb 2006) in whichOrganisations/Universities engaged inagricultural research could get their promisinghuman resources trained in a known globalInstitution, meeting their expenses fully. Onreturn, such human resources could be utilizedon a covenant of 6-7 years. We must be strongto utilize the existing ICAR, CSIR, UGC etc.schemes for such human resource upgradation
and should ask for more, effectively anddecisively with reason. We need to helpourselves before looking for lucrative help fromelsewhere!!
REFERENCES
Arunachalam, V. 1976. Evaluation of diailelcrosses by graphical and combining abilitymethods. Indian Journal of Genetics andPlant Breeding, 36: 358-366.
Arunachalam ,V. 1993. A genetic basis behindcombining ability and breeding values inmonogenic and digenic systems.Biometrical Journal, 2: 217-228.
Arunachalam, V. 2005. Plant Breeding:Translation, Transgression orTransformation? Chapter 13, pp. 182-196.In: Perspectives of Agricultural Researchand Development’s). C. Ramasamy, S.Ramanathan and M. Dhakshinamoorthy,Tamilnadu Agricultural Univesity,Coimbatore, India, 675 pp.
Arunachalam, V. and Owen, A.R.G. 1971Polymorphisms with Linked Loci. Chapman& Hall, London.
Arunachalam, V., Rangalakshmi, R. andKubera Raj, M.S. 2005. Ecological stabilityof genetic diversity among landraces oflittle millet (Panicum sumatrense) in SouthIndia. Genetic Resources and CropEvolution, 52: 15-19.
Fisher, R.A., 1930. The Genetical Theory ofNatural Selection. Oxford UniversityPress, Oxford.
Haldane, J.B.S. 1932. The causes of Evolution.London: Longmans, Green & Co., andNew York: Harper Brothers.
Li, C.C. 1955. Population Genetics. TheUniversity of Chicago Press, Chicago,U.S.A.
Peccoud, J. 1995. Automating molecular
126
Second National Plant Breeding Congress 2006 Plant Breeding in Post Genomics Era
biology: A question of communication.Biotechnology, 13: 741-745.
Rao, C.R. 1952. Advanced Statistical Methodsin Biometric Research. John Wiley, NewYork, USA.
Sokal, R.R. and Sneath, P.H.A (1963) Principlesof Numerical Taxonomy. San Francisco:Freeman.
127
Second National Plant Breeding Congress 2006 Plant Breeding in Post Genomics Era
128
VARIABILITY AND ASSOCIATION ANALYSIS FOR FLORAL TRAITS OFCOCONUT GENOTYPES
Augustine Jerard, B., V. Niral, V. Arunachalam and P. M. Kumaran
ABSTRACTCoconut (Cocos nucifera L.) is an important plantation crop of India. The production
and distribution of quality planting material has gained importance for high productionand productivity as the crop is highly heterozygous and the yield vary greatly if suitablemother palms are not selected for seed production. Since, hybrids have been releasedinvolving selected cultivars as parents, the selection of mother palms gained more importancein the hybridization programmes for the production of quality planting material. Thevariability in the pollen yield greatly affects the hybrid nut production and may affect theyield in the subsequent progeny also. The present investigation involving seven distinctcoconut cultivars showed that there is significant difference in the floral traits and thepollen yield among the cultivars. The tall genotypes Andaman Ordinary (ADOT) andBenaulim tall (BENT) recorded high pollen yield whereas the dwarf cultivars Gangabondam(GBGD) and Chowghat Orange Dwarf (COD) recorded low pollen yields. The associationamong the inflorescence traits and pollen yields is also discussed. The number of spikelets,length of spikelets and male flowers have positive and significant correlation with thepollen yield. The pollen yield correlated positively with the number of female flowers.Selection of mother palms based on the desirable inflorescence traits would help to increasethe hybrid recovery and reduce the cost of hybrid seed production besides quality hybridoutput.
Central Plantation Crops Research Institute, Kasaragod, Kerala
Second National Plant Breeding Congress 2006 Plant Breeding in Post Genomics Era
BREEDING FOR IMPROVED YIELD AND YELLOW MOSAIC VIRUSDISEASE RESISTANCE IN BLACKGRAM (VIGNA MUNGO (L.) HEPPER)
Murugan. E1 and Nadarajan. N2
ABSTRACTFive cross combinations considered in the study of the inheritance pattern of Mungbean
Yellow Mosaic Virus (MYMV) disease revealed different gene actions. In the crosses Co5X VBN (Bg) 4 and Co5 X VBG 66, the segregation was found to be governed by digeniccomplementary interaction. However, in Co5 X VBG 73 the MYMV inheritance was governedby digenic duplicate interaction. In contrast, in the crosses KBG 98005 X VBN (Bg) 4and KBG 98005 X VBG 73, the incidence of MYMV was governed by trigenic inhibitoryinteraction. The putative gene symbols assigned for the five genotypes viz., Co5, KBG98005, VBN (Bg) 4, VBG 66 and VBG 73 are r1r1r2r2r3r3r4r4, r1r1r2r2r3r3r4r4II, R1R1R2R2ii,R1R1R2R2 and R3R3R4R4ii respectively.
1. Department of Plant Breeding and Genetics, Agricultural College & Research Institute, TNAU, Madurai – 6251042. Professor and Head, Department of Pulses, TNAU, Coimbatore – 3
Introduction
Mungbean Yellow Mosaic Virus is one ofthe most destructive diseases and is prevalenton mungbean, blackgram and soybeanthroughout India mainly in the Kharif season.The virus is transmitted by whitefly, Bemisiatabaci. The yield losses up to 100 per cent havebeen reported by Nair (1971) in blackgram.Khattak et al. (2000) reported 32.2 to 78.6 percent decrease in grain yield under field conditionin mungbean. Hence, the present investigationwas taken up to study the inheritance pattern ofMYMV in blackgram as the prerequisite toevolve high yielding blackgram varietiescombined with resistance to MYMV.
Materials and Methods
To study the inheritance pattern of YellowMosaic Virus (MYMV), the following five crosscombinations viz., Co5 X VBN (Bg) 4, Co5 XVBG 73, Co5 X VBG 66, KBG 98005 X VBN(Bg) 4 and KBG 98005 X VBG 73 werechosen. The ‘lines’ (Co5 and KBG 98005) arehighly susceptible and three ‘testers’ (VBN (Bg)4, VBG 73 and VBG 66) are highly resistant forMYMV. Six generations viz., P1, P2, F1, F2, B1and B2 for each of the five crosses were generated
to understand the inheritance pattern ofMYMV.
During Kharif, 2004, six generations of thefive selected cross combinations were raisedat National Pulses Research Centre, Vamban,which is a hot spot area for Yellow Mosaic Virusdisease (MYMV). The above said materialswere raised on ridges of two meter lengthspaced at 30 cm between ridges and 10 cmbetween plants in two replications. For every10th row and as border rows of the experimentalplot the check Co5 (highly susceptible toMYMV) was raised as infector row so as toeffectively spread the inoculum.
The Yellow Mosaic Virus Disease(MYMV) incidence was recorded on all theplants based on the visual scores on 50th day.The classification was made into scales 1 – 9as follows based on the scale adopted by Singhet al. (1988).
The mean disease scale of parents and F1was calculated as follows (Singh, 1980).
The mean disease scale of parents and F1was calculated as follows (Singh, 1980).
Mean scale�= å (Infection rate x
129
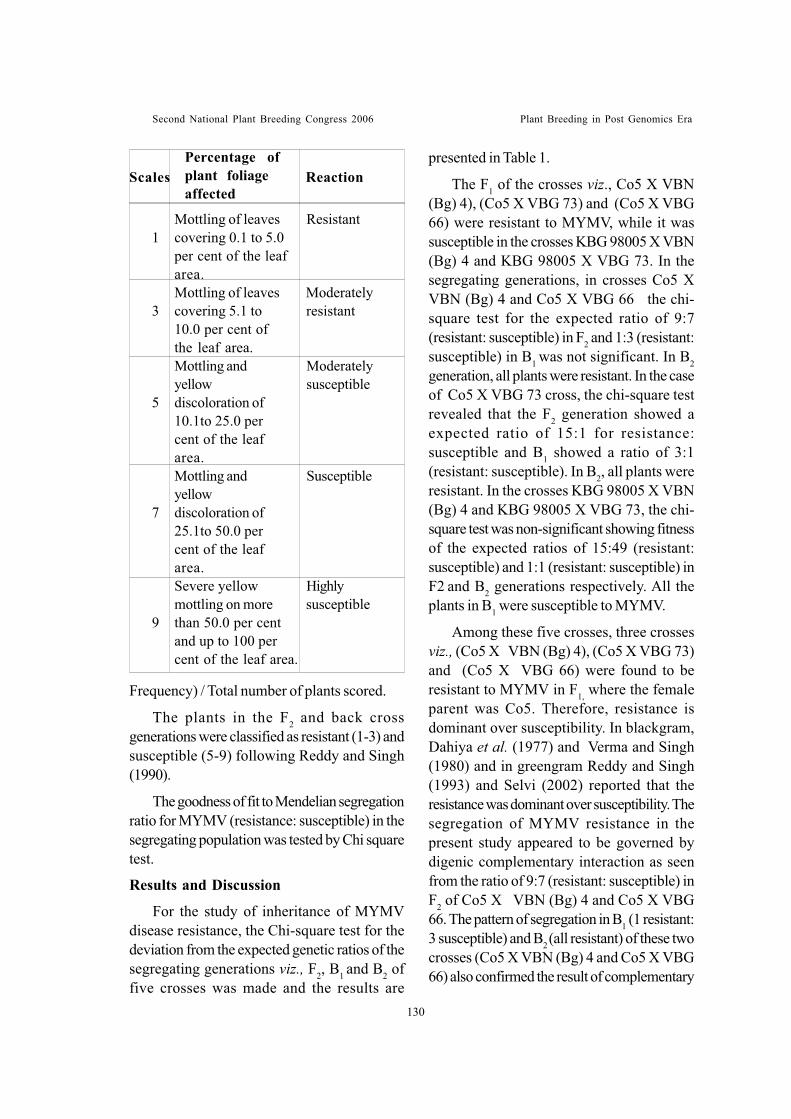
Second National Plant Breeding Congress 2006 Plant Breeding in Post Genomics Era
130
Mottling of leaves Resistant1 covering 0.1 to 5.0
per cent of the leafarea.Mottling of leaves Moderately
3 covering 5.1 to resistant10.0 per cent ofthe leaf area.Mottling and Moderatelyyellow susceptible
5 discoloration of10.1to 25.0 percent of the leafarea.Mottling and Susceptibleyellow
7 discoloration of25.1to 50.0 percent of the leafarea.Severe yellow Highlymottling on more susceptible
9 than 50.0 per centand up to 100 percent of the leaf area.
ScalesPercentage ofplant foliageaffected
Reaction
Frequency) / Total number of plants scored.
The plants in the F2 and back crossgenerations were classified as resistant (1-3) andsusceptible (5-9) following Reddy and Singh(1990).
The goodness of fit to Mendelian segregationratio for MYMV (resistance: susceptible) in thesegregating population was tested by Chi squaretest.
Results and Discussion
For the study of inheritance of MYMVdisease resistance, the Chi-square test for thedeviation from the expected genetic ratios of thesegregating generations viz., F2, B1 and B2 offive crosses was made and the results are
presented in Table 1.
The F1 of the crosses viz., Co5 X VBN(Bg) 4), (Co5 X VBG 73) and (Co5 X VBG66) were resistant to MYMV, while it wassusceptible in the crosses KBG 98005 X VBN(Bg) 4 and KBG 98005 X VBG 73. In thesegregating generations, in crosses Co5 XVBN (Bg) 4 and Co5 X VBG 66 the chi-square test for the expected ratio of 9:7(resistant: susceptible) in F2 and 1:3 (resistant:susceptible) in B1 was not significant. In B2generation, all plants were resistant. In the caseof Co5 X VBG 73 cross, the chi-square testrevealed that the F2 generation showed aexpected ratio of 15:1 for resistance:susceptible and B1 showed a ratio of 3:1(resistant: susceptible). In B2, all plants wereresistant. In the crosses KBG 98005 X VBN(Bg) 4 and KBG 98005 X VBG 73, the chi-square test was non-significant showing fitnessof the expected ratios of 15:49 (resistant:susceptible) and 1:1 (resistant: susceptible) inF2 and B2 generations respectively. All theplants in B1 were susceptible to MYMV.
Among these five crosses, three crossesviz., (Co5 X VBN (Bg) 4), (Co5 X VBG 73)and (Co5 X VBG 66) were found to beresistant to MYMV in F1, where the femaleparent was Co5. Therefore, resistance isdominant over susceptibility. In blackgram,Dahiya et al. (1977) and Verma and Singh(1980) and in greengram Reddy and Singh(1993) and Selvi (2002) reported that theresistance was dominant over susceptibility. Thesegregation of MYMV resistance in thepresent study appeared to be governed bydigenic complementary interaction as seenfrom the ratio of 9:7 (resistant: susceptible) inF2 of Co5 X VBN (Bg) 4 and Co5 X VBG66. The pattern of segregation in B1 (1 resistant:3 susceptible) and B2 (all resistant) of these twocrosses (Co5 X VBN (Bg) 4 and Co5 X VBG66) also confirmed the result of complementary
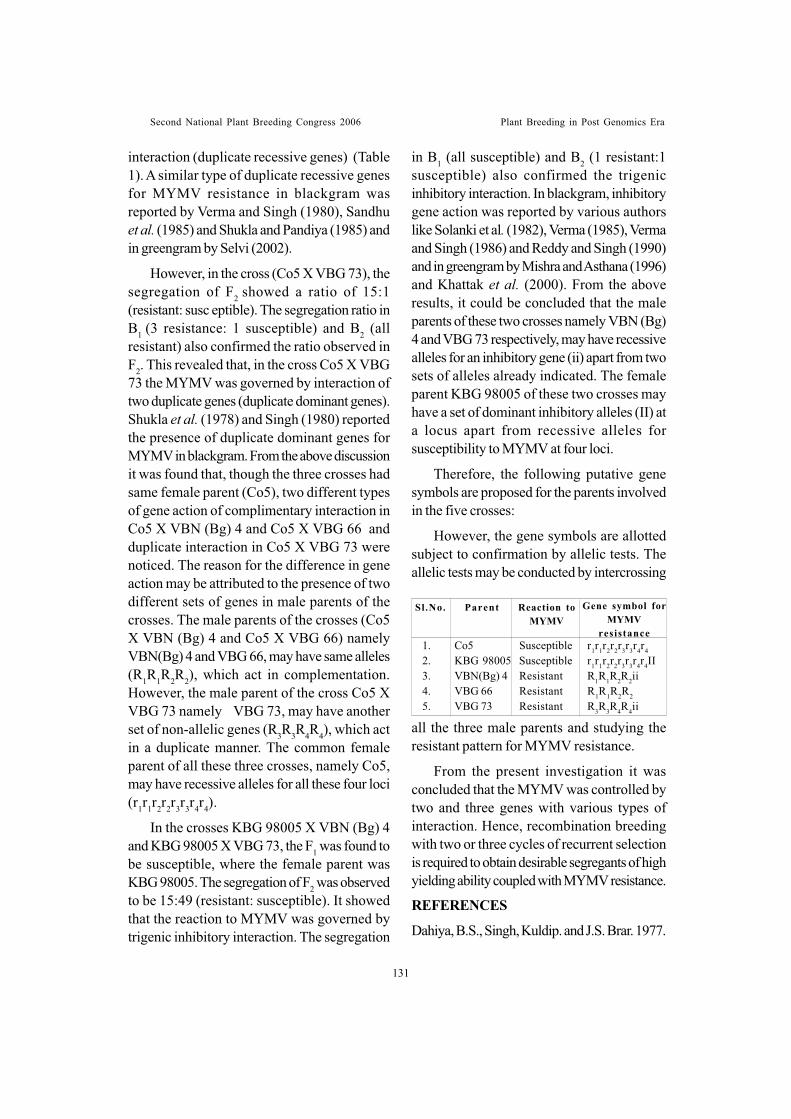
Second National Plant Breeding Congress 2006 Plant Breeding in Post Genomics Era
interaction (duplicate recessive genes) (Table1). A similar type of duplicate recessive genesfor MYMV resistance in blackgram wasreported by Verma and Singh (1980), Sandhuet al. (1985) and Shukla and Pandiya (1985) andin greengram by Selvi (2002).
However, in the cross (Co5 X VBG 73), thesegregation of F2 showed a ratio of 15:1(resistant: susc eptible). The segregation ratio inB1 (3 resistance: 1 susceptible) and B2 (allresistant) also confirmed the ratio observed inF2. This revealed that, in the cross Co5 X VBG73 the MYMV was governed by interaction oftwo duplicate genes (duplicate dominant genes).Shukla et al. (1978) and Singh (1980) reportedthe presence of duplicate dominant genes forMYMV in blackgram. From the above discussionit was found that, though the three crosses hadsame female parent (Co5), two different typesof gene action of complimentary interaction inCo5 X VBN (Bg) 4 and Co5 X VBG 66 andduplicate interaction in Co5 X VBG 73 werenoticed. The reason for the difference in geneaction may be attributed to the presence of twodifferent sets of genes in male parents of thecrosses. The male parents of the crosses (Co5X VBN (Bg) 4 and Co5 X VBG 66) namelyVBN(Bg) 4 and VBG 66, may have same alleles(R1R1R2R2), which act in complementation.However, the male parent of the cross Co5 XVBG 73 namely VBG 73, may have anotherset of non-allelic genes (R3R3R4R4), which actin a duplicate manner. The common femaleparent of all these three crosses, namely Co5,may have recessive alleles for all these four loci(r1r1r2r2r3r3r4r4).
In the crosses KBG 98005 X VBN (Bg) 4and KBG 98005 X VBG 73, the F1 was found tobe susceptible, where the female parent wasKBG 98005. The segregation of F2 was observedto be 15:49 (resistant: susceptible). It showedthat the reaction to MYMV was governed bytrigenic inhibitory interaction. The segregation
in B1 (all susceptible) and B2 (1 resistant:1susceptible) also confirmed the trigenicinhibitory interaction. In blackgram, inhibitorygene action was reported by various authorslike Solanki et al. (1982), Verma (1985), Vermaand Singh (1986) and Reddy and Singh (1990)and in greengram by Mishra and Asthana (1996)and Khattak et al. (2000). From the aboveresults, it could be concluded that the maleparents of these two crosses namely VBN (Bg)4 and VBG 73 respectively, may have recessivealleles for an inhibitory gene (ii) apart from twosets of alleles already indicated. The femaleparent KBG 98005 of these two crosses mayhave a set of dominant inhibitory alleles (II) ata locus apart from recessive alleles forsusceptibility to MYMV at four loci.
Therefore, the following putative genesymbols are proposed for the parents involvedin the five crosses:
However, the gene symbols are allottedsubject to confirmation by allelic tests. Theallelic tests may be conducted by intercrossing
1. Co5 Susceptible r1r1r2r2r3r3r4r4
2. KBG 98005 Susceptible r1r1r2r2r3r3r4r4II3. VBN(Bg) 4 Resistant R1R1R2R2ii4. VBG 66 Resistant R1R1R2R2
5. VBG 73 Resistant R3R3R4R4ii
Sl.No. Parent Reaction toMYMV
Gene symbol forMYMV
resistance
all the three male parents and studying theresistant pattern for MYMV resistance.
From the present investigation it wasconcluded that the MYMV was controlled bytwo and three genes with various types ofinteraction. Hence, recombination breedingwith two or three cycles of recurrent selectionis required to obtain desirable segregants of highyielding ability coupled with MYMV resistance.
REFERENCES
Dahiya, B.S., Singh, Kuldip. and J.S. Brar. 1977.
131
Second National Plant Breeding Congress 2006 Plant Breeding in Post Genomics Era
Incorporation of resistance to mungbeanyellow mosaic virus in blackgram (Vignamungo L.). Tropical grain legume bulletin.,9: 28-32.
Khattak, G.S.S., M.A. Haq, Muhammad Ashraf,and T. Elahi. 2000. Genetics of MungbeanYellow Mosaic Virus (MYMV) in mungbean(Vigna radiata (L.) Wilczek). J. Genet.Breed., 54: 237-243.
Mishra, S.P. and A.N. Asthana. 1996.Inheritance of yellow mosaic virus resistancein mung bean (Vigna radiata (L.) Wilczek).Recent advances in mungbean research. p214-219.
Nair,N.G. 1971.Studies on the yellow mosaic ofurdbean caused by mungbean yellowmosaic virus Ph.D thesis,U.P. Agric.Univ.,Pantnagar, India.
Reddy, K.R. and D.P. Singh. 1990. Inheritanceof resistance to mungbean yellow mosaicvirus in blackgram. New Botanist, 17 : 99-102.
Reddy, K.R. and D.P. Singh. 1993. Inheritanceof resistance to mungbean yellow mosaicvirus. Madras agric. J., 80: 199-201.
Sandhu, T.S., J.S. Brar, S.S. Sandhu and M.M.Verma. 1985. Inheritance of resistance tomung bean yellow mosaic virus ingreengram. J. Res. PAU, 22: 607-611.
Selvi, R. 2002. Genetics and molecular studieson mungbean yellow mosaic virus resistanceas related to economic attributes ingreengram (Vigna radiata (L) Wilczek).Ph.D. Thesis, Tamil Nadu Agric. Univ.,Coimbatore.
Singh, D.P. 1980. Inheritance of resistance toMYMV in blackgram. Theor.Appl.Genet., 57: 233-235.
Shukla, G.P. and B.P. Pandya. 1985. Researchto yellow mosaic in greengram. SABRAOJ., 17: 165-171.
Shukla, G.P., B.P. Pandya, and D.P. Singh. 1978.Inheritance of resistance to yellow mosaicin mungbean. Indian J. Genet. PlantBreed., 38: 357-360.
Singh, G., S. Kapoor and K. Singh. 1988.Multiple disease resistance in mungbeanwith special emphasis on mungbean yellowmosaic virus. In: International Symposiumon Mungbean, 2nd Nov 16-20, Bangkok,Thailand. p 290-296.
Solanki, I.S., B.S. Dahiya and R.S. Waldia.1982. Resistance to mungbean yellowmosaic virus in blackgram. Indian J.Genet. Plant Breed., 43: 240-242.
Verma, R.P.S. 1985. Inheritance of resistanceto mungbean yellow mosaic virus in theinterspecific and intervarietal crosses ofgreengram and blackgram. Ph.D.Thesis.G.B.Pant. Univ. of Agric. & Tech .,Pantnagar, India.80 p.
Verma, R.P.S. and D.P. Singh. 1980.Inheritance of yellow mosaic virus inblackgram (Vigna mungo(L.) Hepper).Theor. Appl. Genet., 55: 233-235.
Verma, R.P.S. and D.P. Singh. 1986. The allelicrelationship of genes giving resistance tomungbean yellow mosaic virus inblackgram. Theor. Appl. Genet., 72: 737- 738.
132
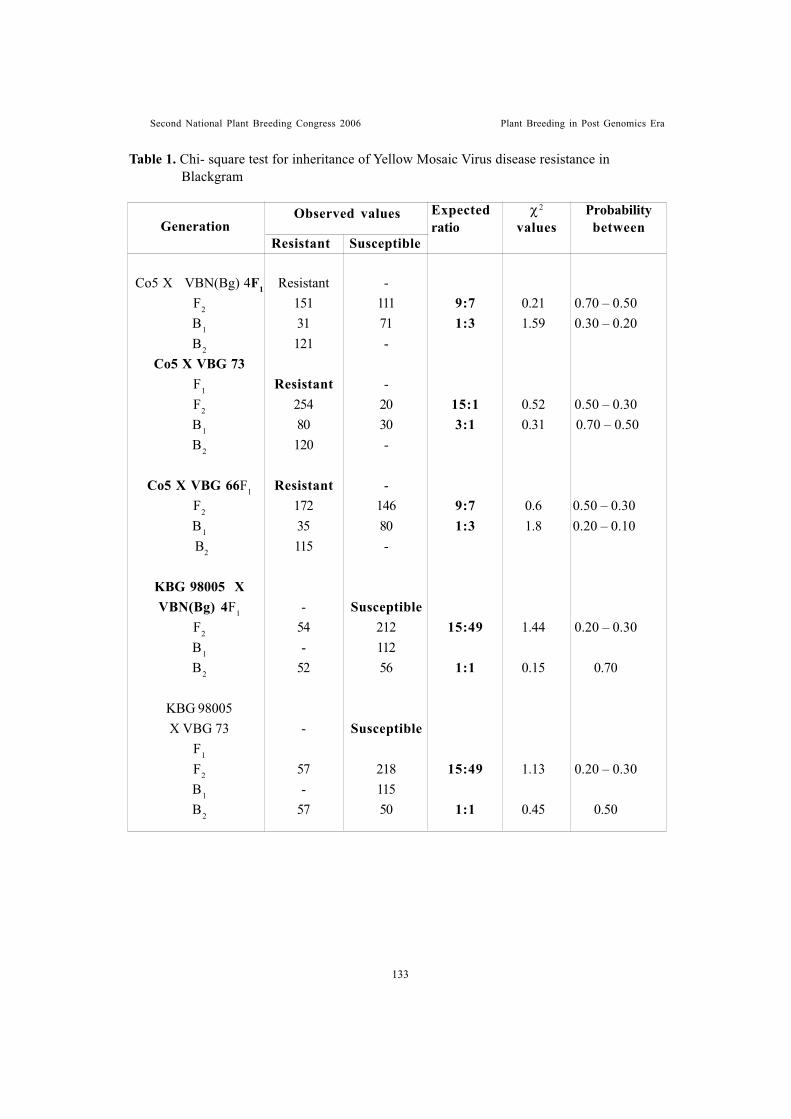
Second National Plant Breeding Congress 2006 Plant Breeding in Post Genomics Era
Table 1. Chi- square test for inheritance of Yellow Mosaic Virus disease resistance in Blackgram
Co5 X VBN(Bg) 4F1 Resistant -F2 151 111 9:7 0.21 0.70 – 0.50B1 31 71 1:3 1.59 0.30 – 0.20B2 121 -
Co5 X VBG 73F1 Resistant -F2 254 20 15:1 0.52 0.50 – 0.30B1 80 30 3:1 0.31 0.70 – 0.50B2 120 -
Co5 X VBG 66F1 Resistant -F2 172 146 9:7 0.6 0.50 – 0.30B1 35 80 1:3 1.8 0.20 – 0.10 B2 115 -
KBG 98005 XVBN(Bg) 4F1 - Susceptible
F2 54 212 15:49 1.44 0.20 – 0.30B1 - 112B2 52 56 1:1 0.15 0.70
KBG 98005X VBG 73 - Susceptible
F1
F2 57 218 15:49 1.13 0.20 – 0.30B1 - 115B2 57 50 1:1 0.45 0.50
GenerationObserved values
Resistant Susceptible
Expectedratio
� 2
valuesProbability
between
133
Second National Plant Breeding Congress 2006 Plant Breeding in Post Genomics Era
134
COMPLEX INHERITANCE IN RICE VARIETY MR1523 OFRESISTANCE TO GALL MIDGE BIOTYPES
Suneetha, K1, J.S. Bentur1, K. Hima Bindu1, P. Vijaya Lakshmi1, C. Cheeralu2,P.Ram Mohan Rao3
ABSTRACTInheritance of gall midge resistance in rice variety MR1523 was studied by generating
F3 families from individual F2 plants of various crosses and evaluating them against fourbiotypes in three greenhouse and two field tests at three locations. Results suggestedinvolvement of two genes conferring resistance against biotypes 1 and 3, one dominantgene against biotype 4 and none against the new biotype 4M. Interactions of the twogenes were different against the two biotypes used in greenhouse tests. While reciprocalcrosses did not confirm to the ratio observed with straight cross, allelic tests with varietieshaving known resistance genes were also inconclusive. We are attempting to identify thesegenes with closely linked known SSR markers.
Introduction
The Asian rice gall midge Orseolia oryzae(Wood-Manson) is a serious pest of rice in certainregions of South, Central and East India causingsignificant yield loss mainly during kharifseason. Breeding rice varieties with pestresistance has been a viable, ecologicallyacceptable approach for the management of thegall midge. However, rapid development ofvirulent biotypes capable of overcoming the hostplant resistance has been posing problem inrecent years. Systematic germplasm evaluationhas led to the identification of important sourcesof resistance like Eswarakorra, Ptb18, Ptb21,Siam 29, Leuang 152 etc. (see Bentur et al.,2003) which have been extensively used inbreeding resistant varieties. Genetic studies haveidentified, so far, 10 major genes conferringresistance (Kumar et al., 2005). Most of the 60plus gall midge resistant rice varieties developedto date contain one of the three major genes viz.,Gm1, Gm2 and unidentified gene (s) in Ptb21conferring immune level of resistance. Sevendistinct gall midge biotypes have beencharacterized so far (Vijaya Lakshmi et al.,
1. Directorate of Rice Research, Rajendranagar, Hyderanad 500 030, AP2. Agricultural Research Station, ANGRAU, Warangal 506 007, AP3. Agricultural Research Station, ANGRAU, Ragolu 532 484, Srikakulam Dist.,
2005), some of them being selected as directconsequence of extensive cultivation of thesevarieties. In most of the studies, resistance togall midge has been found to be conferred by asingle dominant or (as in case of gm3) arecessive gene (Kumar et al., 2005).Exceptionally, sources deriving resistance fromPtb18 and Ptb21 have displayed complexpattern (Kalode and Bentur 1989). We studiedthe genetics of resistance in the rice varietyMR1523, derivative from Ptb21, in order tounderstand this complexity.
Material and Methods
The rice variety CR94-MR1523 (Ptb18/Ptb21//IR8), developed at CRRI, Cuttackinvolving Ptb 21 with unknown resistancegene(s) was crossed with the susceptible checkTN1 as well as with the varieties with knownresistance genes viz., W1263 (with Gm1),Phalguna (Gm2), RP2068 (gm3), Abhaya(Gm4), ARC 5984 (Gm5), and with otherresistance sources with unknown gene(s) likeBhumansan, NHTA8, Banglei, Aganni andARC 6605. These crosses were made in kharif2000. F1 seeds (direct and reciprocal crosses)
Second National Plant Breeding Congress 2006 Plant Breeding in Post Genomics Era
were grown in rabi 2000. Individual F2 plantswere raised in kharif 2001. F3 families consistingof progeny from individual F2 plants wereevaluated in field at Ragolu and Warangal andin greenhouse at DRR against gall midge biotypes1, 3 and 4 during kharif 2002. Nil damagedfamilies across the locations/tests were identifiedand these were advanced to F4 and F5generations and then tested in All IndiaCoordinated Rice Improvement Programme(AICRIP) for two years (2004 & 2005).Individual families were scored for resistancereaction. Progenies showing plant damage of 45per cent and above were considered to besusceptible, 1-44 percent damage asheterozygous and zero damage was consideredas resistant. Chi-square test was carried out totest the goodness of fit for various segregationratios.
Results and Discussion
Results revealed a complex segregatingpattern of resistance depending upon the biotypeused for evaluation (Table 1). Families derivedfrom the cross MR1523 x TN1 showedsegregation ratio of 13 resistant: 3 susceptiblefamilies when evaluated against Biotype 1, 15:1ratio against Biotype 3 and 3:1 ratio againstBiotype 4 in greenhouse test at DRR,Hyderabad. Interestingly, reciprocal crossesbetween TN1 and MR1523 did not show similarratios. Crosses between MR1523 and ricevarieties with known and unknown gall midgeresistance genes did not show any distinctsegregation pattern suggesting higher order ofinteraction and possible involvement ofcytoplasmic inheritance. Thus it is apparent thatgenes controlling gall midge resistance inMR1523 interact differently against differentbiotypes tested. While two genes contributedresistance against biotype 1 and 3, only one genewas effective against biotype 4. These two genesinteracted differently against biotypes 1 and 3.For biotype 1 the interaction appeared as onedominant and one recessive gene while for
biotype 3 two dominant gene interaction wasevident. For biotype 4 single dominant genesegregation ratio was observed. However,variations noted in reciprocal crosses needfurther investigation for a better understanding.
Since allelic tests through crosses involvingMR1523 with known gene sources did notreveal identity of the possible 2-3 genes in MR1523, we propose to investigate using genelinked markers. Preliminary reports showednon-allelic amplification when Gm1 linked SSRmarkers RM444 and RM219, Gm2 linkedmarker RM241 were used for amplifyinggenomic DNA from MR1523. Other genespecific markers are being studied.
Four of the cultures, RP 4516-3-8 and threeselections of RP4518, derived from crossesMR1523 x RP2068 and MR1523 x Abhaya,respectively, identified in the present studieswere nominated for multi location testing underAICRIP trials and showed a wide spectrum ofresistance against gall midge biotypes acrossthe locations (DRR, 2005). Few of the culturesidentified in the present studies are being testedunder AICRIP trails. Of these, RP4510-175 andRP4510-177 recorded resistance againstbiotype 3 while being susceptible to biotype 1while RP4510- 260 showed resistance againstthe biotypes 1,3 and 4 (DRR, 2005). This typeof reaction showing resistant for biotype 3 andsusceptibility for biotype 1 has not beenobserved earlier in any of the cultures. Thus,unknown genes that are suspected to be presentin MR1523 have been segregated and fixed indifferent lines which would serve as pre-breeding material for breeding and geneticstudies.
The single gene conferring resistance inMR1523 against biotype 4 has been overcomeby the newly reported biotype 4M (VijayaLakshmi et al., 2005).
REFERENCES
135
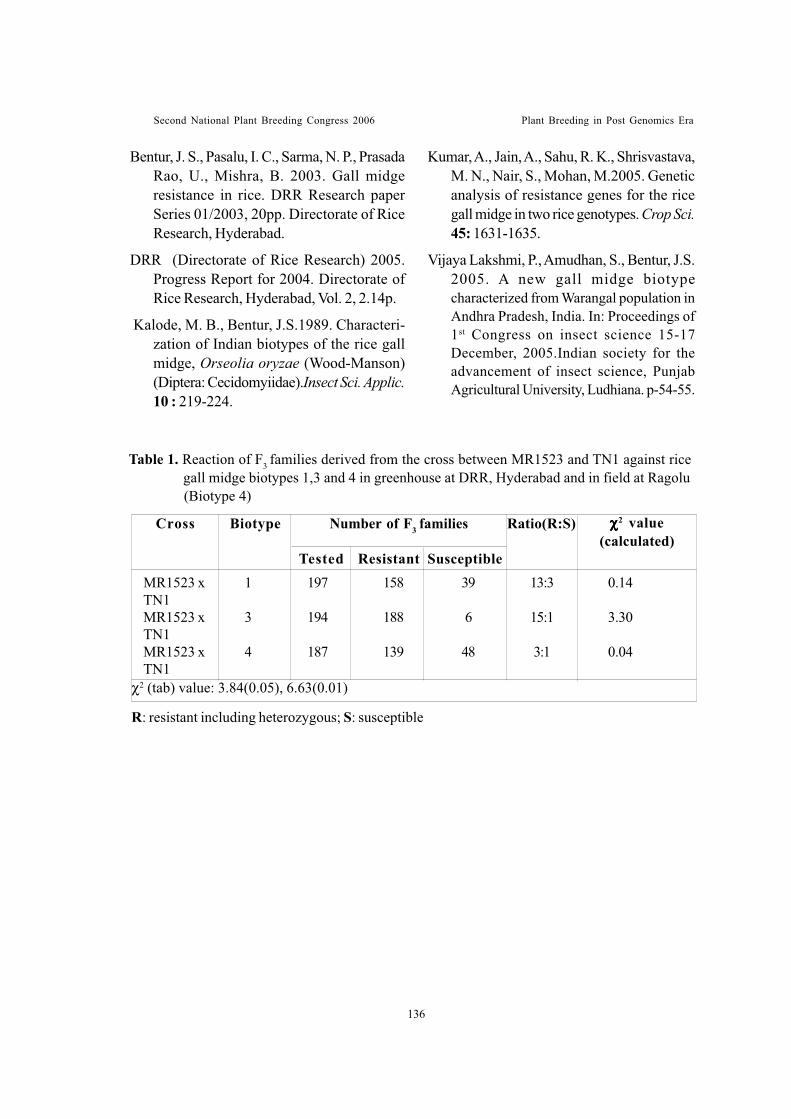
Second National Plant Breeding Congress 2006 Plant Breeding in Post Genomics Era
136
Bentur, J. S., Pasalu, I. C., Sarma, N. P., PrasadaRao, U., Mishra, B. 2003. Gall midgeresistance in rice. DRR Research paperSeries 01/2003, 20pp. Directorate of RiceResearch, Hyderabad.
DRR (Directorate of Rice Research) 2005.Progress Report for 2004. Directorate ofRice Research, Hyderabad, Vol. 2, 2.14p.
Kalode, M. B., Bentur, J.S.1989. Characteri-zation of Indian biotypes of the rice gallmidge, Orseolia oryzae (Wood-Manson)(Diptera: Cecidomyiidae).Insect Sci. Applic.10 : 219-224.
Kumar, A., Jain, A., Sahu, R. K., Shrisvastava,M. N., Nair, S., Mohan, M.2005. Geneticanalysis of resistance genes for the ricegall midge in two rice genotypes. Crop Sci.45: 1631-1635.
Vijaya Lakshmi, P., Amudhan, S., Bentur, J.S.2005. A new gall midge biotypecharacterized from Warangal population inAndhra Pradesh, India. In: Proceedings of1st Congress on insect science 15-17December, 2005.Indian society for theadvancement of insect science, PunjabAgricultural University, Ludhiana. p-54-55.
Table 1. Reaction of F3 families derived from the cross between MR1523 and TN1 against rice gall midge biotypes 1,3 and 4 in greenhouse at DRR, Hyderabad and in field at Ragolu (Biotype 4)
R: resistant including heterozygous; S: susceptible
MR1523 x 1 197 158 39 13:3 0.14TN1MR1523 x 3 194 188 6 15:1 3.30TN1MR1523 x 4 187 139 48 3:1 0.04TN1
Cross Biotype Number of F3 families Ratio(R:S) �����2 value(calculated)
Tested Resistant Susceptible
�2 (tab) value: 3.84(0.05), 6.63(0.01)
Second National Plant Breeding Congress 2006 Plant Breeding in Post Genomics Era
LEAF TRICHOME DENSITY – AN INDICATOR OF JASSID TOLERANCE INCOTTON
Kannan, S., R. Ravikesavan and M. Kumar
ABSTRACT
A study was taken up to evaluate the number of trichomes present in the leaf asrelated to jassid resistance. Three cultivars KC 2, MCU 5 and MCU 12, their F1 andsegregating populations F2 and F3 and backcrosses BC1 F1 were screened. Among the parentsKC 2 recorded highest trichome density of 26.02, when compared to 14.11 and 17.88 permicroscopic field of observation in MCU 5 and MCU 12 respectively. The F1 KC 2 × MCU12 registered more trichome density of 21.48 than KC 2 × MCU 5 (15.47) and MCU 5 ×MCU12 (14.33). In F2 population the mean trichome density ranged from 15.33 to 21.20.The lowest value was observed in MCU5 × MCU 12 and highest value had been observedin KC 2 × MCU 12. In F3, the trichome density ranged from 14.53 to 20.42. The lowestvalue was observed in MCU 5 × MCU 12 and the highest value in KC 2 × MCU 12.Among the BC1 (KC 2 × MCU 12) × KC 2 recorded highest mean trichome density of24.15 when compared to 20.17 and 17.85 of (KC 2 × MCU 5) × KC 2 and (MCU 5 ×MCU 12) × MCU 5 respectively. In BC2 the (KC 2 × MCU 12) × MCU 12 recorded highesttrichome density of 21.16 when compared to 19.38 and 14.81 of (KC 2 × MCU 5) × MCU5 and (MCU 5 × MCU 12) × MCU 12 respectively. The parent KC 2 when used as femalehas contributed more trichome density in the F1 as well as in the segregating populations.This positive relationship between trichome density and jassid tolerance was also confirmedthrough artificial screening.
INTRODUCTION
Cotton, the “White Gold” is an importantcommercial and industrial crop of manycountries. In India, it plays a prominent role ineconomy through foreign exchange earnings.This crop is affected by number of insect pests,among which jassids cause considerable yieldreduction. For managing the jassids farmersspend lot of money through chemical sprays.For reducing the use of chemical insecticidesand in turn the input cost evolving jassid resistantgenotypes is the need of the hour. Among thetraits related to jassid tolerance trichome densityis the primary indicator. Parnell et al. (1949)indicated that the hair length is most importantand if length is maintained increased hair densityconfers more resistance. The presentinvestigation, therefore, aims in assessing therelationship between trichome density and the
jassid resistance in a group of genotypes witha view to develop basic breeding material forevolving jassid resistant varieties.
MATERIALS AND METHODS
The experimental materials comprisedthree parents (KC 2, MCU 5 and MCU 12),three F1’s, F2' s and F3’s (KC 2 x MCU 5, KC2 x MCU 12 and MCU 15 x MCU 12), threeB1’s [(KC 2 x MCU 5) x KC2, (KC2 x MCU12) x KC 2, and (MCU 5 x MCU 12), MCU 5]and three B2’s [(KC 2 x MCU 5) x MCU 5,(KC 2 x MCU 12) x MCU 12, and (MCU 5 xMCU 12) x MCU 12]. The materials weregrown in Randomized Block Design (RBD)with three replications at the Department ofcotton, Tamil Nadu Agricultural University,Coimbatore. The materials were sown in tworows of each replication with 6m length andspacing 75 x 30 cm. Data on ten randomly
1 PG Scholar, CPBG, TNAU2 Associate Professor (Cotton), CPBG * Corresponding Author ([email protected])3 Associate Professor (PB&G), CPBG, TNAU, Coimbatore – 3
137
Second National Plant Breeding Congress 2006 Plant Breeding in Post Genomics Era
selected plants in each genotype/population werecollected and trichome density (per microscopicfield), stomatal counts (per mm2 leaf) and leafthickness (mm)was assessed. The leafthickness was measured using screw gauge. Thehopper burn injury was assessed as per theIndian Central Cotton Committee (ICCC, 1960)methods and based on resultant symptoms ofinfestation.
Jassid resistance index was also calculatedas proposed by Nageswara Rao (1973).
RESULTS AND DISCUSSION
The observations on three morphologicalcharacters which are found to confer jassidtolerance were recorded and the mean andrange presented in Table 1. Among the parentsKC2 recorded highest trichome density of 26.02,when compared to 14.11 and 17.88 of MCU 5and MCU 12 respectively. In F1, F2, B1 and B2generations the cross of KC 2 x MCU 12 wasfound to have more trichome density than othercrosses. Sivasubramanian et al. (1991) reportedthat the number and weight of hairs were higherin resistant than susceptible cultivars.Ravikesavan et al. (2002) have studiedthe trichome density and reported that trichomedensity had a positive correlation with jassidresistance and on the other hand glabarous traitgives tolerance to the boll worms.
Stomatal counts were recorded per mm2 leafarea under microscope. This character is foundto be negatively correlated with jassidresistance. For this character also KC 2 andthe combination of KC 2 x MCU 12 recordedthe lower number of stomata. However ShimaBhaskaran (2004) reported that there is norelationship between stomatal count and jassidresistance. The leaf thickness was found to bepositively related to jassid tolerance and thegenotype KC 2 and the cross combination ofKC 2 x MCU 12 recorded more leaf thicknesscompared to other combinations. Similarly Tidkeand Sane (1962) reported that thicker leaves
conferred resistance to leaf hopper.
Artificial screening was done for parentsand the segregating population and the jassidinjury index of different genotypes is tabulated(Table 2). In artificial screening the lowestgrade index was recorded by parent KC 2(1.0). The parents MCU 5 and MCU 12registered 2.48 and 1.84 grade indexrespectively. Among the F1 KC 2 x MCU 12(1.9) had low grade index compared to KC 2x MCU 5 (2.26) and MCU 5 x MCU 12 (2.63).In F2 population, the grade index of KC 2 xMCU 12 was 1.65, when compared to 2.16and 2.7 of KC 2 x MCU 5 and MCU 5 x MCU12 respectively. In F3 population, the gradeindex of KC 2 x MCU 12 was 1.78 whereas2.52 and 2.55 of KC 2 x MCU 5 and MCU 5x MCU 12 respectively.
Joint Scaling Test and Genetic Effects
Leaf thickness: Scale A was significantin KC 2 x MCU 5. The scales B and C weresignificant in all the crosses. The results of jointscaling test presented in table 3 also indicatedthe inadequacy of the data to fit simple additive-dominance model for all crosses. This isconformed by chi-square test values, which issignificant in all the crosses.
The ‘m’ component was significant in allthe crosses and the values ranged from 0.04mm in MCU 5 x MCU 12 and 0.05 mm in KC2 x MCU 12 and KC 2 x MCU 5. The [d] and[h] components were significant in KC 2 xMCU 12. The [i] component was significantin KC 2 x MCU 5 and KC 2 x MCU 12 andthe values ranged from 0.01 mm in MCU 5 xMCU 12 to 0.04 mm in KC 2 x MCU 12. The[j] component was significant in KC 2 x MCU5 and MCU 5 x MCU 12 and the values rangedfrom -0.02 mm in KC 2 x MCU 5 to 0.01 mmin MCU 5 x MCU 12. The [l] component wasnon significant in all the crosses (Table 4).
Stomatal number: The scales A and B
138
Second National Plant Breeding Congress 2006 Plant Breeding in Post Genomics Era
were significant in all the crosses, while the scaleC was significant in KC 2 x MCU 12. The resultsof joint scaling test presented in table 3 indicatedthe inadequacy of the data to fit simple additive-dominance model for all crosses. This isconformed by Chi-square test values that weresignificant for all the crosses.
The ‘m’ component was significant in all thecrosses and the values ranged from 66.64 in KC2 x MCU 12 to 95.00 in MCU 5 x MCU 12.The [d] component was significant in KC 2 xMCU 12. The [h], [i], and [l] components weresignificant in all the crosses. The values rangedfrom 47.97 in MCU 5 x MCU 12 to 161.46 inKC 2 x MCU 12 in [h] component. The valuesof [i] component ranged from 34.80 in MCU 5x MCU 12 to 172.22 in KC 2 x MCU 12. Thevalues ranged in [l] component from -312.16 inKC 5 x MCU 12 to -84.73 in MCU 5 x MCU12. The [j] component was positively significantin KC 5 x MCU 12 (Table 5).
Trichome density: The scale A wassignificant in KC 2 x MCU 5 and KC 2 x MCU12. The scale B was significant in KC 2 x MCU12 where as scale C was significant in MCU 5x MCU 12. The results of joint scaling test arepresented in table 6 which indicated theinadequacy of the data to fit simple additive-dominance model for all crosses. This is alsoconformed by chi-square test values that aresignificant in all the crosses.
The ‘m’ component was significant in all thecrosses and the values ranged from 17.33 inMCU 5 x MCU 12 to 19.80 in KC 2 x MCU 12.The [d] component was significant in KC 2 xMCU 12. The [h] component was significant inall the crosses and the values ranged from -10.73in MCU 5 x MCU 12 to 8.87 in KC 2 x MCU12. The [i] component was significant in all thecrosses and the values ranged from -9.07 inMCU 5 x MCU 12 to 11.47 in KC 2 x MCU 12.The [j] component was significant in KC 2 xMCU 5. The [l] component was significant in
KC 2 x MCU 5 and KC 2 x MCU 12 and thevalues ranged from -20.13 in KC 2 x MCU 12to 17.51 in KC 2 x MCU 5 (Table 7).
The overall scenario indicated that parentKC 2 had high trichome density and leafthickness which makes it tolerant to jassid.When KC 2 was used as female parent in thecrosses, the trichome density was more whencompared to the other crosses. Artificialscreening also indicated similar results. In thepresent study both additive and dominancecomponents were significant for the crossesand hence reciprocal recurrent selection ormultiple crossing can be used for furtherimprovement of the traits under study in therespective crosses. This study revealed thatthe trichome density is the primary indicatorfor jassid resistance. Among the genotypes, theparent KC 2 was resistant to jassid, MCU 12moderately resistant and MCU 5 susceptibleto jassids. The trichome density and leafthickness were positively correlated with jassidresistance. Uthamasamy (1994) also reportedthat the morphological traits such as leafthickness, leaf hairiness, toughness of leafveins, thickness of leaf lamina, length of hair,and angle of leaf insertion are positively relatedto leaf hopper resistance. The stomatal numberhad negative correlation with jassid resistance.Screening of segregating generation will resultin high yielding plants having better resistanceto leaf hopper. Further, studies in isolating jassidresistant progenies are in progress.
REFERENCES
Nageswara Rao, P. 1973. An index for jassidresistance in cotton. Madras Agric. J.60: 264-266.
Parnell, F.R., H.E. King and D.F. Ruston. 1949.Jassid resistance and hairiness of the cottonplant. Bull. Ent. Res. 39: 539-575.
Ravikesavan, R., T.S.Raveendran, C.Parameshwari, S.Suganthi, S.Mohan and
139
Second National Plant Breeding Congress 2006 Plant Breeding in Post Genomics Era
140
C.Surendran. 2002. Morphological,physiological and biochemical futuresassociated were biotic and abiotic stressesin cotton cultured derived throughintrogressive breeding. Paper presented inthe 2nd meeting of the Asian cotton researchand development network “New GeneticalApproaches to Cotton Improvement’’ heldon November 14-16,2002. Tashkent,Uzbekistan.
Shimna Bhaskaran. 2004. Genetic andanatomical studies on jassid resistance incotton (Gossypium spp.). M.sc., (Ag.)Thesis, TNAU, Coimbatore, India.
Sivasubramaniyan, P., Uthamasamy, S. andParvathy, K. 1991. Resistance in cotton,Gossypium spp. to the leafhopper Amrascadevastans (Dist.). Madras Agric. J. 78(1-4): 80-81.
Tidke, P.M. and Sane, P.V. 1962. Jassidresistance and morphology of cotton leaf.Indian Cott. Grow. Rev. XVI (6): 324-327.
Uthamasamy, S. 1994. Host resistance to theleafhopper, Amrasca devastans (Dist.) incotton, Gossypium spp. Proceedings of theWorld Cotton Research conference,Australia pp. 14-17.
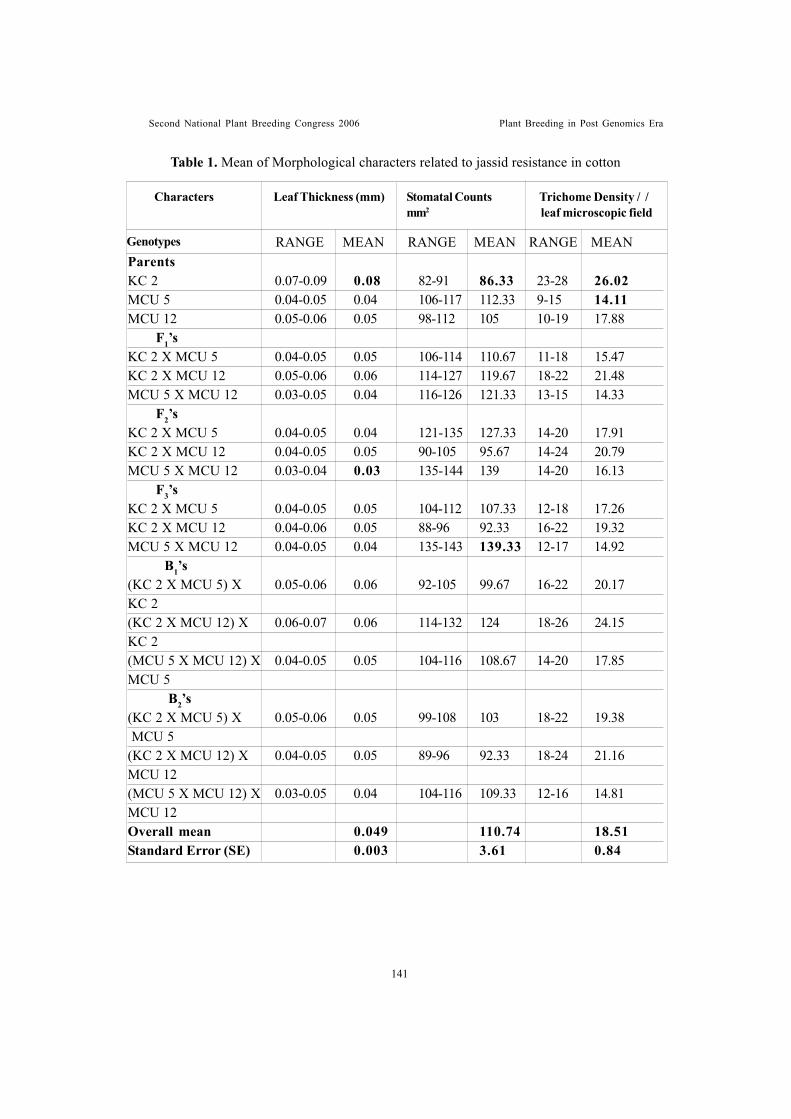
Second National Plant Breeding Congress 2006 Plant Breeding in Post Genomics Era
Table 1. Mean of Morphological characters related to jassid resistance in cotton
ParentsKC 2 0.07-0.09 0.08 82-91 86.33 23-28 26.02MCU 5 0.04-0.05 0.04 106-117 112.33 9-15 14.11MCU 12 0.05-0.06 0.05 98-112 105 10-19 17.88 F1’sKC 2 X MCU 5 0.04-0.05 0.05 106-114 110.67 11-18 15.47KC 2 X MCU 12 0.05-0.06 0.06 114-127 119.67 18-22 21.48MCU 5 X MCU 12 0.03-0.05 0.04 116-126 121.33 13-15 14.33 F2’sKC 2 X MCU 5 0.04-0.05 0.04 121-135 127.33 14-20 17.91KC 2 X MCU 12 0.04-0.05 0.05 90-105 95.67 14-24 20.79MCU 5 X MCU 12 0.03-0.04 0.03 135-144 139 14-20 16.13 F3’sKC 2 X MCU 5 0.04-0.05 0.05 104-112 107.33 12-18 17.26KC 2 X MCU 12 0.04-0.06 0.05 88-96 92.33 16-22 19.32MCU 5 X MCU 12 0.04-0.05 0.04 135-143 139.33 12-17 14.92 B1’s(KC 2 X MCU 5) X 0.05-0.06 0.06 92-105 99.67 16-22 20.17KC 2(KC 2 X MCU 12) X 0.06-0.07 0.06 114-132 124 18-26 24.15KC 2(MCU 5 X MCU 12) X 0.04-0.05 0.05 104-116 108.67 14-20 17.85MCU 5 B2’s(KC 2 X MCU 5) X 0.05-0.06 0.05 99-108 103 18-22 19.38 MCU 5(KC 2 X MCU 12) X 0.04-0.05 0.05 89-96 92.33 18-24 21.16MCU 12(MCU 5 X MCU 12) X 0.03-0.05 0.04 104-116 109.33 12-16 14.81MCU 12Overall mean 0.049 110.74 18.51Standard Error (SE) 0.003 3.61 0.84
RANGE MEAN RANGE MEAN RANGE MEAN
Characters Leaf Thickness (mm) Stomatal Counts Trichome Density / /mm2 leaf microscopic field
Genotypes
141
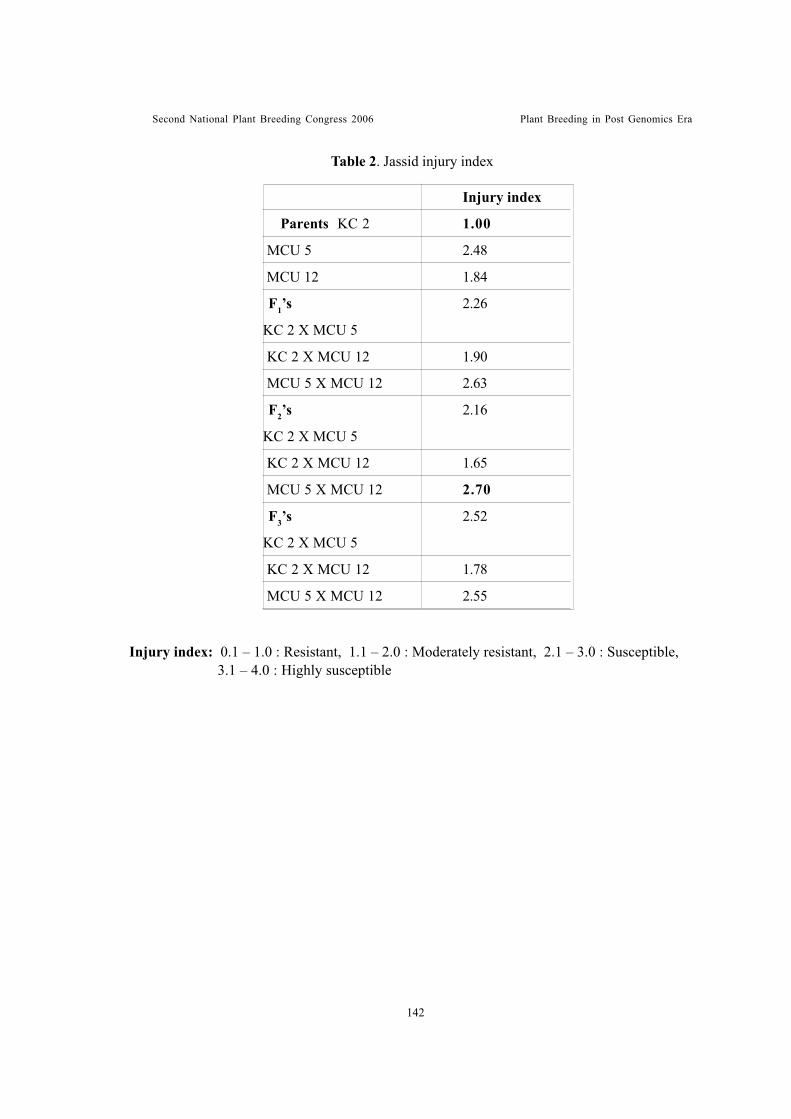
Second National Plant Breeding Congress 2006 Plant Breeding in Post Genomics Era
142
Table 2. Jassid injury index
Injury index: 0.1 – 1.0 : Resistant, 1.1 – 2.0 : Moderately resistant, 2.1 – 3.0 : Susceptible,3.1 – 4.0 : Highly susceptible
Injury index
Parents KC 2 1.00
MCU 5 2.48
MCU 12 1.84
F1’s 2.26
KC 2 X MCU 5
KC 2 X MCU 12 1.90
MCU 5 X MCU 12 2.63
F2’s 2.16
KC 2 X MCU 5
KC 2 X MCU 12 1.65
MCU 5 X MCU 12 2.70
F3’s 2.52
KC 2 X MCU 5
KC 2 X MCU 12 1.78
MCU 5 X MCU 12 2.55
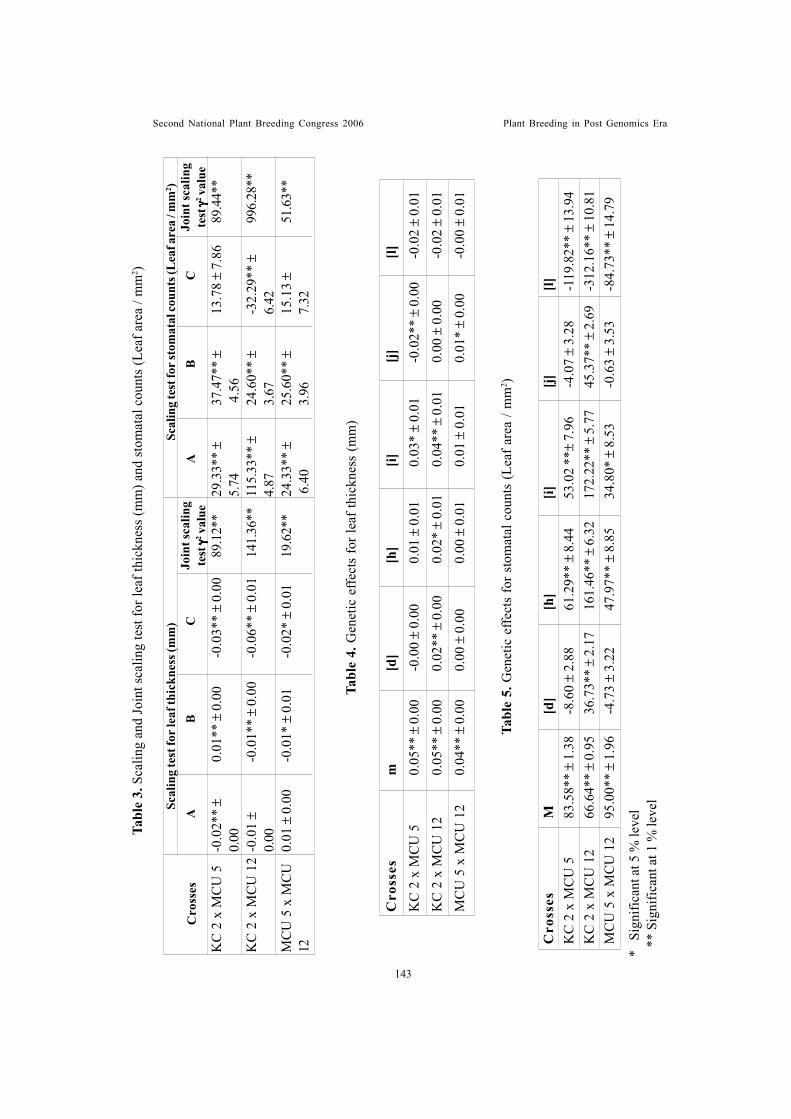
Second National Plant Breeding Congress 2006 Plant Breeding in Post Genomics EraTa
ble
3. S
calin
g an
d Jo
int s
calin
g te
st fo
r lea
f thi
ckne
ss (m
m) a
nd s
tom
atal
cou
nts
(Lea
f are
a / m
m2 )
KC
2 x
MC
U 5
-0.0
2** �
0.01
** �
0.0
0-0
.03*
* �
0.00
89.1
2**
29.3
3** �
37.4
7** �
13.7
8 �
7.86
89.4
4**
0.00
5.74
4.5
6K
C 2
x M
CU
12
-0.0
1 �
-0.0
1** �
0.00
-0.0
6** �
0.01
141.
36**
115.
33**
�24
.60*
* �
-32.
29**
�99
6.28
**0.
004.
873.
676.
42M
CU
5 x
MC
U0.
01 �
0.0
0-0
.01*
� 0
.01
-0.0
2* �
0.0
119
.62*
*24
.33*
* �
25.6
0** �
15.1
3 �
51.6
3**
12 6
.40
3.96
7.32
Scal
ing
test
for l
eaf t
hick
ness
(mm
)Sc
alin
g te
st fo
r sto
mat
al co
unts
(Lea
f are
a / m
m2 )
AB
CJo
int s
calin
gte
st���� �2
val
ueC
ross
esA
BC
Join
t sca
ling
test���� �2
val
ue
Tabl
e 4.
Gen
etic
effe
cts
for l
eaf t
hick
ness
(mm
)
Cro
sses
m[d
][h
][i]
[j][l]
KC
2 x
MC
U 5
0.05
** �
0.0
0-0
.00 �
0.00
0.01
� 0
.01
0.03
* �
0.01
-0.0
2** �
0.00
-0.0
2 �
0.01
KC
2 x
MC
U 1
20.
05**
� 0
.00
0.02
** �
0.0
00.
02* �
0.01
0.04
** �
0.0
10.
00 �
0.0
0-0
.02 �
0.01
MC
U 5
x M
CU
12
0.04
** �
0.0
00.
00 �
0.0
00.
00 �
0.0
10.
01 �
0.0
10.
01* �
0.00
-0.0
0 �
0.01
Tabl
e 5.
Gen
etic
effe
cts
for s
tom
atal
cou
nts
(Lea
f are
a / m
m2 )
Cro
sses
M[d
][h
][i]
[j][l]
KC
2 x
MC
U 5
83.5
8** �
1.38
-8.6
0 �
2.88
61.2
9** �
8.44
53.0
2 **�
7.96
-4.0
7 �
3.28
-119
.82*
* �
13.9
4K
C 2
x M
CU
12
66.6
4** �
0.95
36.7
3** �
2.17
161.
46**
� 6
.32
172.
22**
� 5
.77
45.3
7** �
2.69
-312
.16*
* �
10.8
1M
CU
5 x
MC
U 1
295
.00*
* �
1.96
-4.7
3 �
3.22
47.9
7** �
8.85
34.8
0* �
8.5
3-0
.63 �
3.53
-84.
73**
� 1
4.79
* S
igni
fican
t at 5
% le
vel
**
Sig
nific
ant a
t 1 %
leve
l
143
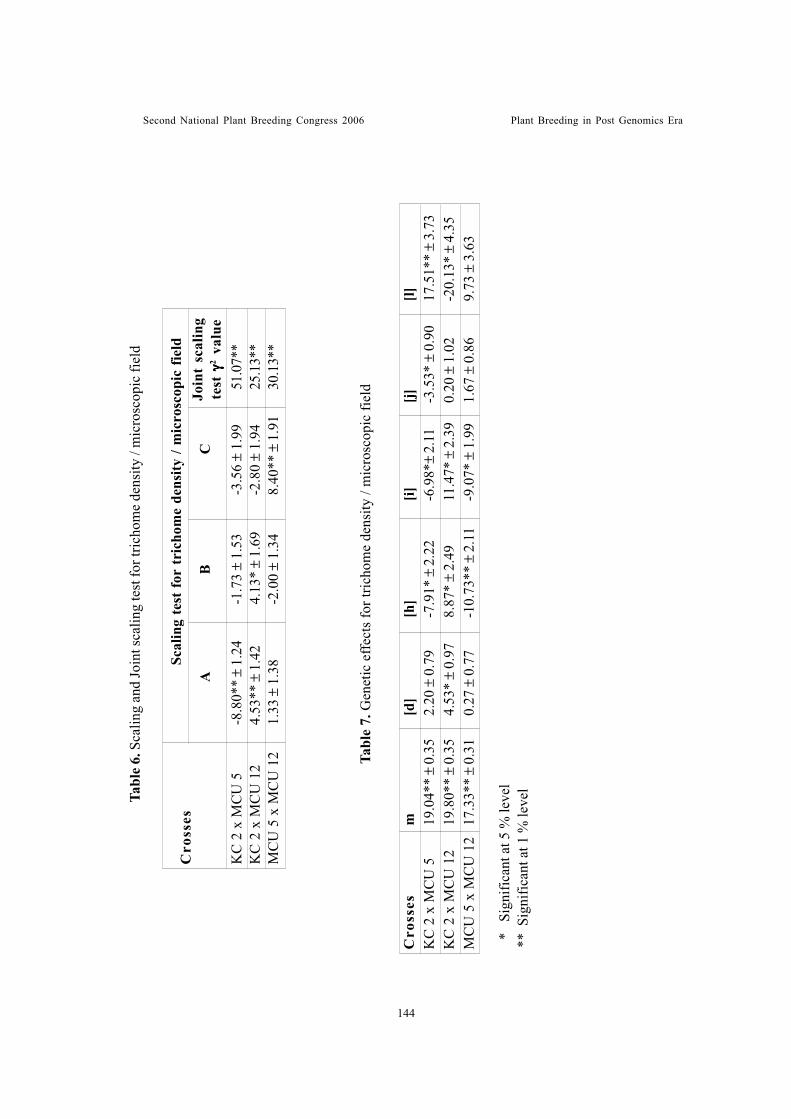
Second National Plant Breeding Congress 2006 Plant Breeding in Post Genomics Era
144
Tabl
e 6.
Sca
ling
and
Join
t sca
ling
test
for t
richo
me
dens
ity /
mic
rosc
opic
fiel
d
Tabl
e 7.
Gen
etic
effe
cts f
or tr
icho
me
dens
ity /
mic
rosc
opic
fiel
d
Cro
sses
m[d
][h
][i]
[j][l]
KC
2 x
MC
U 5
19.0
4** �
0.35
2.20
� 0
.79
-7.9
1* �
2.2
2-6
.98*�
2.11
-3.5
3* �
0.9
017
.51*
* �
3.73
KC
2 x
MC
U 1
219
.80*
* �
0.35
4.53
* �
0.97
8.87
* �
2.49
11.4
7* �
2.3
90.
20 �
1.0
2-2
0.13
* �
4.35
MC
U 5
x M
CU
12
17.3
3** �
0.31
0.27
� 0
.77
-10.
73**
� 2
.11
-9.0
7* �
1.9
91.
67 �
0.8
69.
73 �
3.6
3
*
Si
gnifi
cant
at 5
% le
vel
**
Sig
nific
ant a
t 1 %
leve
l
KC
2 x
MC
U 5
-8.8
0** �
1.24
-1.7
3 �
1.53
-3.5
6 �
1.99
51.0
7**
KC
2 x
MC
U 1
24.
53**
� 1
.42
4.13
* �
1.69
-2.8
0 �
1.94
25.1
3**
MC
U 5
x M
CU
12
1.33
� 1
.38
-2.0
0 �
1.34
8.40
** �
1.9
130
.13*
*
Join
t sc
alin
gte
st���� �2
val
ue
S
calin
g te
st fo
r tr
icho
me
dens
ity /
mic
rosc
opic
fiel
d
AB
CC
ross
es
Second National Plant Breeding Congress 2006 Plant Breeding in Post Genomics Era
VARIABILITY FOR YIELD AND QUALITY ATTRIBUTES ININTERSPECIFIC PROGENIES OF SACCHARUM SP
Nagarajan, R., S.Alarmelu and R.M.Shanthi
ABSTRACT Evaluation of 781 (439 S.officinarum x S. spontaneum and 342 S.robustum x
Commercials / S.officinarum ) hybrid progenies for cane yield and quality traits revealeddifferences between the groups for number of millable canes, cane height, cane weightand juice quality characters. Heritability was moderate (33.8%) for cane height to high(73.18%) for single cane weight in S.officinarum x S.spontaneum group. Heritabilitywas 38.82% for cane diameter to 62.87% for brix in S.robustum x Commercials /S.officinarum group. Heritability was moderate for sucrose in both the groups.The higherestimates of heritability coupled with higher genetic advance for number of millablecanes and moderate sucrose indicated that the heritability of the traits is mainly due toadditive effects and selection would be effective for these traits.High heritability combinedwith low genetic advance for single cane weight indicates the role of non additiveeffect.S.robustum x commercials /S.officinarum group had high heritability coupledwith moderate genetic advance for brix and sucrose. Mean performance of the traitsunder study revealed the superiority of the S.robustum x commercial /S.officinarumgroup over S.officinarum x S.spontaneum for cane thickness,cane weight, brix, sucroseand yield in F1 for further use. S.officinarum x S.spontaneum group can be exploited inproducing elite hybrids after back crossing and nobilization.
Introduction
Genetic variability is essential for anysuccessful crop improvement and use of wildgermplasm in broadening the gene base need noemphasis..Over the decades, sugarcane breedinghave been a sort of closed one though not strictlyinbreeding.Initial involvement of a few clonesfrom the cultivated S.officinarum , S.barberiand S.sinense and wild S.spontaneum in thebeginning of the century provided the geneticbase and needed variation for the varietalimprovement in sugarcane for many decades.Thewider genetic base is essential to have a bettergenetic gain for longer term and in sugarcanethis is all the more needed, as the genetic gain inrecent years has declined for many yield andquality attributes.In this connection thestatement of Hawkes ( 1977) that in most cropsthe need for a wider genetic base is stronglyapparent and this can be generally provided from
wild species and primitive cultivars is quiterelevant. Narrowing of genetic base with slowrate of genetic improvement warranted theneed for widening the genetic base by exploitingunutilised clones of cultivated and wild speciesof Saccharum in breeding programmes[Arceneaux (1965) , Price (1965),Roach(1968), Dunckelman and Breaux (1971) andRoach (1977)]. Apart from base broadening,interspecific hybridisation programme isimportant considering the increase in sugarcanearea under adverse environments and manydiverse use sugarcane is put into besidesconventional sugar production. Walker (1987)reported that a range of improved nobles isavailable for utilisation, which have beenevolved from a small programme ofgenerationwise polycrossing and selection foryield and quality within this species. He alsoindicated that these improved nobles must form
Sugarcane Breeding Institute, Coimbatore- 641 007, India [email protected]
145
Second National Plant Breeding Congress 2006 Plant Breeding in Post Genomics Era
a better base for sugarcane improvement. Ingeneral, S.officinarum clones are known toimpart sucrose genes,clones of S.spontaneumconfer vigour ,high tillering, resistance to bioticand abiotic stresses and wider adaptability andS.robustum for biomass and fibre.Thedeveloped improved clones of the three specieswere utilised in crossing and the progenies fromtwo different nobilized groups involving improvedS.officinarum, S.spontaneum and S.robustumwere assessed for genetic variability, heritabilityand genetic advance for further exploitation.
Materials and methods
Improved clones of S.officinarum andS.spontaneum utilised in the presentinvestigation were developed by selecting clonesof S. officinarum followed by intercrossingamong themselves and the progenies weresubjected to selection for economic attributesthrough seedling and clonal stages. This resultedin a number of improved clones of S.officinarum. Similarly selected clones ofS.spontaneum and S.robustum were also usedin a crossing and selection cycle to produceimproved clones of S.spontaneum andS.robustum.The improved clones developedwere utilised in crossing and evaluated to studythe genetic parameters in F1 population andexploit them for sugarcane improvement.
The experimental material comprised sevenhundred and eighty one (439 S.officinarum x S.spontaneum and 342 S.robustum xCommercials /S.officinarum) hybrid progeniesfrom 30 crosses involving 9 S.officinarum, 12S.spontaneum, 7 S.robustum and 5 commercialsclones.The progenies were selected at seedlingstage based on economic traits and the hybridityof the progenies was confirmed by distinctfeatures of the species.The selected progeniesalong with checks were evaluated in 1R with3m plot size in randomized block design with tworeplications.The crop was given normalpackage of practices and monitored. At the age
of 12 months, data on number of canes /plot(NMC), cane diameter,cane length,single caneweight and H. R Brix were recorded. Caneyield/ plot was estimated as a product of numberof canes /plot and single cane weight.Data onten quantitative charcaters were recorded usingstandard procedures. Observations on NMC,cane height, cane diameter, brix, sucrose,singlecane weight and sucrose were recorded.Thedata were tabulated and statistically analysedto derive heritability, genetic advance,GCV andPCV(Singh and Chaudary,1985).
Results and Discussion
The mean, range, PCV, GCV andcoefficient of variation for various cane yieldattributes and juice quality parameters for thetwo groups under study are presented inTables 1 and 2 .The results are discussed below.
a) S.officinarum x S.spontaneum progeniesNumber of millable canes
The mean value was high (99.28 nmc)combined with a wide range of 27-170. Theother genetic parameters viz.,genotypic andphenotypic variance, heritability ,PCV, GCV andgenetic advance was observed high for thetrait. There were many individual clones in thisgroup possessing high NMC.
Cane diameter
The mean values were low with a rangeof 1.47-2.82. The population had low genotypicvariance, phenotypic variance,heritability andGA. As expected the canes were thin due tohigh stalk populationwhich is probably due topredominant influence of S.spontanuem, whichneed further improvement throughbackcrossing.
Cane height
For cane height, the population had high mean(200.67 cm), wide range (135-260) and lowgenotypic and phenotypic variance. Heritabilityand genetic advance were low indicating the
146
Second National Plant Breeding Congress 2006 Plant Breeding in Post Genomics Era
role of nonadditive genes for cane height.
Single Cane weight
Low mean values (0.56 kg) with widerange (0.27-1.01), high genotypic and phenotypicvariances, high heritability (0.7318) and GA as%mean was observed for single cane weight. Thepresence of high PCV and GCV indicates thedominance of additive gene effect for theexpresssion of the trait.
Cane yieldHigh mean (53.47 kg/row) and range
(27.75 to 103.29) with low heritability,moderate to high GA was observed indicatingthe role of nonadditive effects in control of thecharacter. Heterosis for cane yield wasobserved by Roach, 1968,1977.The grouprecorded higher cane yield in comparision tocommercial varieties and S. officinarumparental stocks indicating the higher potentialityof their interspecific hybrid population for caneyield.
Quality parameters
Brix
The mean value was generally low for brix(13.12%) with a moderate range of 9.2-17.65.Moderate to high genotypic and phenotypicvariances was observed for the trait. and sucrose(9.74%). Though the population mean in generalwas low from commercial point of view, a numberof types with brix above 17.0 % were identified.
Sucrose
The mean value was generally low forsucrose (9.74%) with a moderate range of 5.40- 14.58. Moderate to high genotypic andphenotypic variances was observed for the trait.GA % mean was high due to moderateheritability and high variability for sucrose.Variation for this character was found to bemoderate.Similar results were also reported inF1 progenies of S.officinarum x S.spontaneum
(Roach, 1968,1977). Walker (1971) alsoreported low ranges for total sugars in suchhybrid populations of S.officinarum andS.spontaneum.
The studies clearly showed the superiorityof this group for cane population..Variation wasalso very substantial for this important attributewhich is neccessary for effective selection.Though high cane population/plot wasobserved,average cane diameter showedconsiderable reduction . In general, canes werethin which is normally expected and certainlyback crossing either to a differentS.officinarum clone or a good commercialclone is required to improve cane thickness.Mean single cane weight was in general low,although individual clones from familiesrecorded single cane weight of around 0.8 to1.0 kg. Improvement in single cane weight isessential along with good cane population toboost the cane yield. This improvement ispossible through improved cane diameter inbackcross generation without reduction in F1vigour. Selection of parents for backcross andsubsequent selection in backcross generationare very important to harness the benefit ofimproved S.officinarum clones and wildS.spontaneum clones. Cane population ingeneral was lower in crosses involvingS.officinarum x S.spontaneum compared tocommercial variety x S.spontaneum(Pers.comm). But in respect to cane diameterand single cane weight, S.officinarum xS.spontaneum crosses had slightly highervalues when compared with hybrid xS.spontaneum. This might be attributed due tothe 2n+n chromosometransmission inS.officinarum x S.spontaneum and n+ntransmission in commercial clones xS.spontaneum. The presence of wide variation,coupled with high heritability and GA for twoimportant components NMC and single caneweight can be exploited to improve cane yieldin this group. The hybrid progenies involving
147
Second National Plant Breeding Congress 2006 Plant Breeding in Post Genomics Era
S.officinarum x S.spontaneum as suggested byWalker (1971) could be utilised for identifyinggenetic stocks with increased sugar content andbetter adaptability. Heritability and geneticadvance was maximum for nmc indicating thereliability of this trait in selection of parents forhybridization. Earlier studies (James, 1971)emphasized the importance of number of stalksas the most reliable character on which selectionhas to be based High heritability coupled withmoderate genetic advance was observed forsingle cane weight and cane diameter whichneeds further improvement through nobilization.Juice quality parameters particularly sucroseshowed moderate heritability and high GA as %mean indicating that selection will be effectivefor sucrose % and it will be moderate for brix%.
b) S.officinarum x S.robustum
The mean values for all the characters exceptnumber of millable canes were higher inS.officinarum x S.robustum progenies with awide range of expression..
Number of millable canesA wide range of 13.75 -57.5 was
observed for the trait. The other geneticparameters viz.,genotypic variance , phenotypicvariance , GCV and PCV were high. The higherestimates of heritability (65.0%) coupled withhigher genetic advance for nmc indicated thatheritability of the trait is mainly due to additiveeffects and selection is effective for such trait.
Cane height
Cane height registered a high mean value of216.42cm with a wide range (180.00 -262.5).High magnitude of phenotypic variance withmoderate genotypic variance and low heritability(37.61%) was observed in the population.Moderate GCV and PCV with moderate GAthough GA % as mean was low was observedfor the triat.
Cane diameter
High mean (2.57) combined with narrowrange (1.67-3.20) was observed in this group.Genotypic variance, phenotypic variance,heritability and GA was very low .
Single cane weight
Single cane weight had higher magnitudeof GCV and PCV and moderately highgenotypic variance and phenotypic variance.The group mean was high (0.963 kg) with anarrow range of 0.48-1.67. High heritabilitycombined with low genetic advance and highGAas % mean for single cane weight indicatehigher role of additive gene in governing thetrait.
Cane yield
For cane yield the overall mean was low(30.46 kg / row) and ranged from 12.75-50.74.Higher magnitude of GCV and PCV withmoderate heritability was observed in thepopulation. Genetic advance as % of mean washigh which may be due to high variation in thepopulation and enough variability for the trait.
Brix
The group had a high mean of 19.00% with awide range between 11.2-23.3 %. The traithad low magnitude for genotypic variance,phenotypic variance , GCV and PCV.Thoughthe heritability was high (63.0%),GA % meanwas low indiacting low variation for the trait inthis population.
Sucrose
The GCV, PCV, genotypic variance andphenotypic variancewas moderate. High mean(16.32 %) with wide range (8.12 -21.33%) wasobserved for the trait.High heritability coupledwith moderate GA as % of mean suggest thatselection will be effective for sucrose.
The superior mean performance for thequality and yield attributes may be due to better
148
Second National Plant Breeding Congress 2006 Plant Breeding in Post Genomics Era
exploitation of both additive and non additivegene effects present in the population.Theestimates of variability, h2 and genetic advancefor most of the characters in this group indicatedgreater variance in the progenies. Ramana Rao(1972) also reported that a large amount ofvariability for most of the characters andemphasized the importance of both additive andnon additive variances for the characters.
GCV in progenies involving improvedS.officinarum x S.robustum was higher for nmcand single cane weight. The characters withwider range viz., number of millable canes, singlecane weight, sucrose, brix and cane yield hadhigher magnitude of GCV and PCV except caneheight.This suggests that there is scope forselecting better segregants in this group basedon NMC, single cane weight and sucrose.
Single cane weight (60.5%), number ofmillable canes (65.06%) and quality parameters(62.8%) showed high genetic advance.Thissuggests that gain from selection based on nmc,single cane weight would be higher inS.officinarum x S.robustum combination thanin S.officinarum x S.spontaneum progenies.
Comparison
Yield components
S.spontaneum progenies had high NMC andcane yieldwhich can be further improved throughnobilization. In S.robustum progenies the
improvement of yield components viz., caneheight, diameter and single cane weight offersscope for realization of more genetic gains foryield.
Quality parameters
S.robustum progenies had substantialincrease for juice quality parameters andcompared well with progenies of crossesinvolving Co varieties.S.spontaneum progenieshad moderate brix and low sucrose low whichsuggests the need of back crossing to improvethe trait.
The breeding material developed fromnobilization for variouscomponent traits of yieldand quality could be utilized as genetic stocksin further breeding programmes.Theoccurrence of superior recombinants among theprogenies of S.officinarum /S.spontaneum /S.robustum indicates the possibility of realizingnew types with desired character. In generalwhile the F1 clones combining high NMC,moderate brix, good vigour and medium thin tothick canes identified from both the groups inthis study needs further exploitation,thepromising first generation hybrids ofS.robustum progenies can be directly inductedinto general breeding programme for furtherevaluation and commercial use.
149
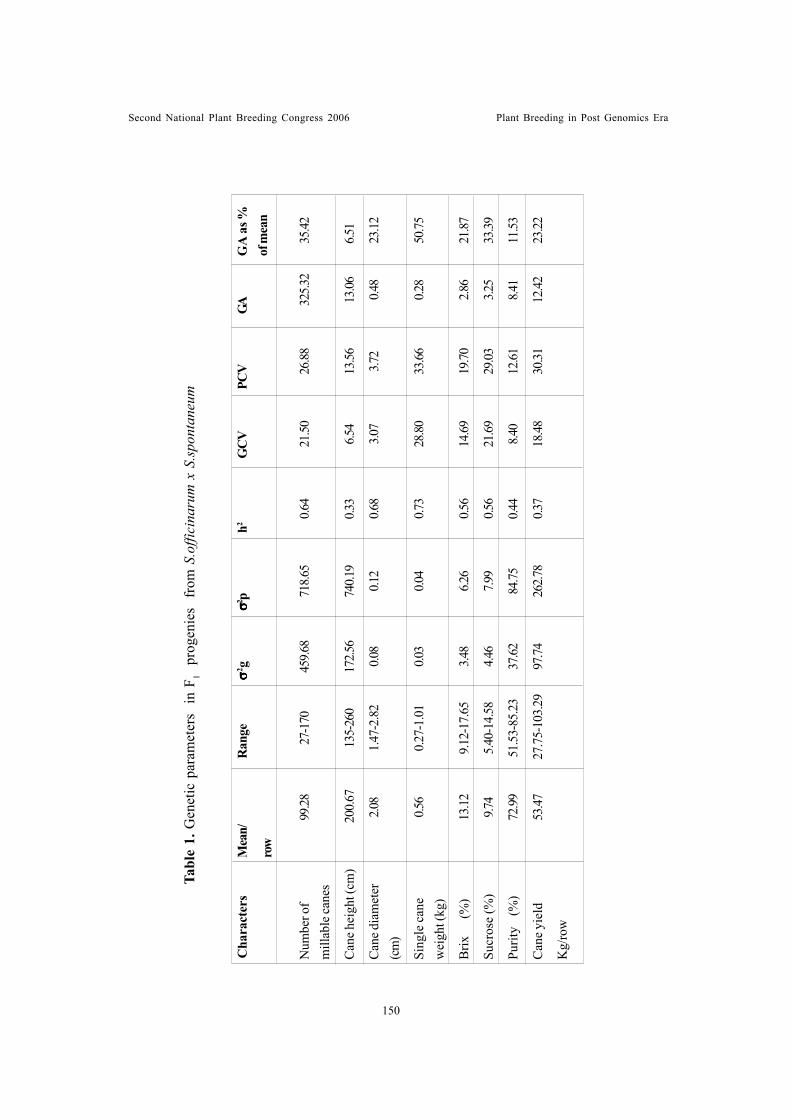
Second National Plant Breeding Congress 2006 Plant Breeding in Post Genomics Era
Tabl
e 1.
Gen
etic
par
amet
ers
in F
1 pr
ogen
ies
fro
m S
.offi
cina
rum
x S
.spon
tane
um
Num
ber o
f99
.2827
-170
459.6
871
8.65
0.64
21.50
26.88
325.3
235
.42m
illab
le ca
nes
Can
e hei
ght (
cm)
200.
6713
5-26
017
2.56
740.1
90.3
36.5
413
.5613
.066.5
1
Can
e dia
met
er2.0
81.
47-2
.82
0.08
0.12
0.68
3.07
3.72
0.48
23.12
(cm
)
Sing
le c
ane
0.56
0.27
-1.0
10.0
30.0
40.7
328
.8033
.660.2
850
.75w
eigh
t (kg
)
Brix
(
%)
13.12
9.12
-17.
653.4
86.2
60.5
614
.6919
.702.8
621
.87
Sucr
ose
(%)
9.74
5.40
-14.
584.4
67.9
90.5
621
.6929
.033.2
533
.39
Purit
y (
%)
72.99
51.5
3-85
.23
37.62
84.75
0.44
8.40
12.61
8.41
11.53
Can
e yie
ld53
.47 27
.75-
103.
2997
.7426
2.78
0.37
18.48
30.31
12.42
23.22
Kg/
row
Cha
ract
ers
Mea
n/
row
Ran
ge���� �2
g���� �2
ph2
PCV
GAG
A a
s %of
mea
n G
CV
150
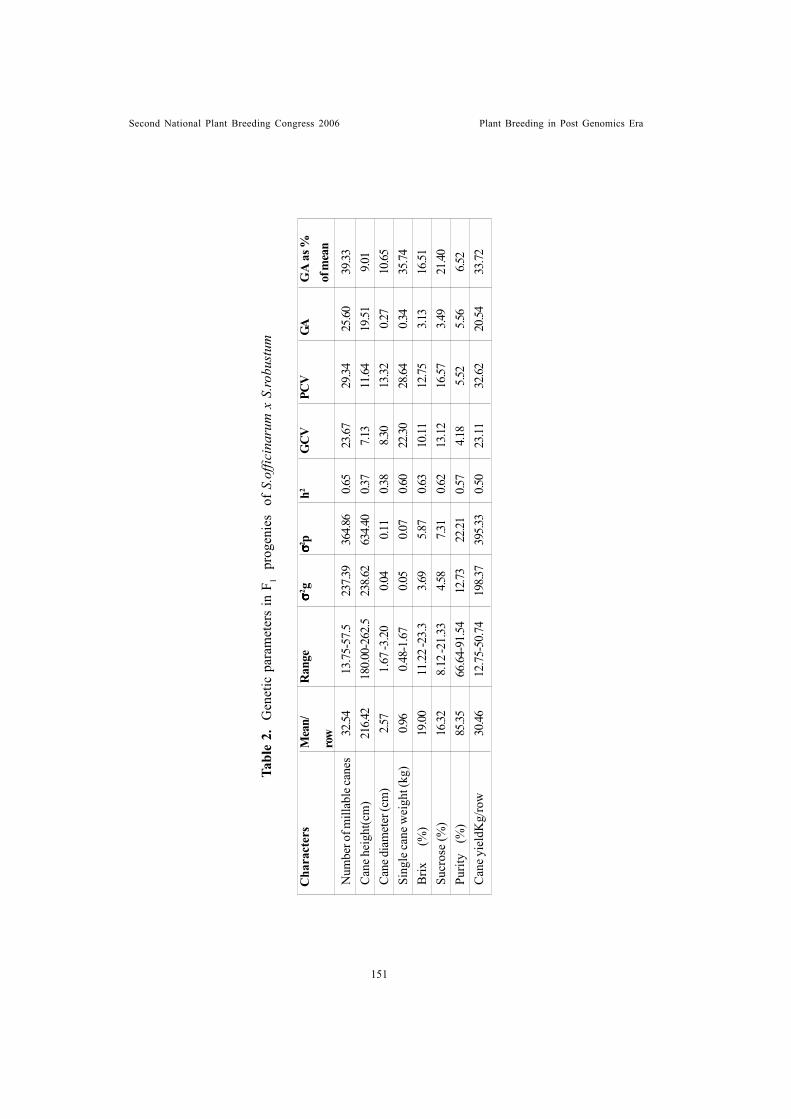
Second National Plant Breeding Congress 2006 Plant Breeding in Post Genomics Era
Tabl
e 2.
G
enet
ic p
aram
eter
s in
F1
prog
enie
s o
f S.
offic
inar
um x
S.ro
bust
um
Num
ber o
f mill
able
cane
s32
.5413
.75-
57.5
237.3
936
4.86
0.65
23.67
29.34
25.60
39.33
Can
e hei
ght(c
m)
216.4
218
0.00
-262
.523
8.62
634.4
00.3
77.1
311
.6419
.519.0
1Ca
ne d
iam
eter
(cm
)2.5
71.
67 -3
.20
0.04
0.11
0.38
8.30
13.32
0.27
10.65
Sing
le ca
ne w
eigh
t (kg
)0.9
60.
48-1
.67
0.05
0.07
0.60
22.30
28.64
0.34
35.74
Brix
(
%)
19.00
11.2
2 -23
.33.6
95.8
70.6
310
.1112
.753.1
316
.51Su
cros
e (%
)16
.328.
12 -2
1.33
4.58
7.31
0.62
13.12
16.57
3.49
21.40
Purit
y (
%)
85.35
66.6
4-91
.54
12.73
22.21
0.57
4.18
5.52
5.56
6.52
Can
e yie
ldK
g/ro
w30
.4612
.75-
50.7
419
8.37
395.3
30.5
023
.1132
.6220
.5433
.72
Cha
ract
ers
Mea
n/
row
Ran
ge���� �2
g���� �2
ph2
PCV
GAG
A a
s %of
mea
n G
CV
151
Second National Plant Breeding Congress 2006 Plant Breeding in Post Genomics Era
REFERENCES
Arceneaux, 1965. Cultivated sugarcanes of theworld and their botanical derivation . Proc.ISSCT 12:844-854.
Dunckelman,T. H. and R.D. Breaux ,1971.Breeding of sugarcane varieties forLouisiana with new germplasm. Proc.ISSCT.14: 233-239.3.
Hawkes,J .G. 1977.The importance of wildgermplasm in plant breeding. Euphytica 26:615-621.
James, N. I. 1971. Yield component in randomand selected sugarcane population. CropSci . 11: 906-908.
Price, S.1965. Interspecific hybridization insugarcane breeding. Proc. ISSCT. 12:1021-1026.
Ramaa Rao,T.C. 1972. Breeding value ofsugarcane genetic stocks with special
reference to Saccharum robustum.
Roach, B.T.1968. Quantitative effects ofhybridization in S.officinarum xS.spontaneum crosses. Proc.ISSCT.13:939-954.
Roach, B.T. 1977. Utilization of S.spontaneumin sugarcane breeding. Proc.ISSCT.16: 43-57.
Singh, R.K and Chaudhary,B.D.1985.Biometrical Methods in quantitative geneticanalysis.
Walker, D. I.T.1971. Utilization of noble andS.spontaneum germplasm in the WestIndies Proc.ISSCT.14: 224-232.
Walker, D . I. T. 1987. Manipulating the geneticbase of sugarcane. CopersucarInternational Sugarcane BreedingWorkshop. Copersucar Technology Center,Brazil. pp. 321-334.
152
Second National Plant Breeding Congress 2006 Plant Breeding in Post Genomics Era
GENETIC STUDIES ON PLANT, MATURITY AND PHYSIOLOGICALCHARACTERS OF MAIZE (ZEA MAYS L.) UNDER RAINFED AND
IRRIGATED CONDITIONSSubba Rao, M. and R.D. Singh
ABSTRACT
In order to study the gene effects for various morpho-physiological charactersrelated to drought tolerance in maize, generation mean analysis was performed in 3 differentcrosses and the results are summarized below.
Results indicated that mean values (m) were highly significant for all charactersstudied under rainfed as well as irrigated conditions. Under irrigated conditions, theinteraction additive x additive was only found significant for days to 50% tasseling incross Ib.62 x Ib.37. The type of epistasis was found to be complementary in one cross andit was duplicate in two other crosses studied. Under rainfed conditions, additive effect(d), dominance effect (h) and epistatic effects additive x additive (i) and dominance xdominance effect (l) were significant for the cross Ib.63 x Ib. 128. The type epistasis wasfound to be complementary in one cross while it was duplicate in nature in other twocrosses studied. Dominance effect (h) and epistatic effect additive x additive (i) anddominance x dominance (l) were found significant for days to 50% silking under rainfedconditions. The type of epistasis was both duplicate and complimentary in different crossesstudied. Dominance effect (h) was found to be significant in the cross Ib. 62 x Ib.128while additive effect (d) was found significant for cross Ib.128 x Ib.145. Both additiveeffect (d) and additive x dominant effect (j) were found significant for cross Ib.62 x Ib. 37.The type of epistasis was duplicate in all the three crosses under rainfed and irrigatedconditions. Dominance effect (h) and dominance x dominance interaction (j) weresignificant in cross Ib.62 x Ib.37 for the character plant height. Epistasis was duplicate innature. For ear height under rainfed conditions, all the types of gene effects were found tobe significant in different crosses studied. The epistasis was of duplicate nature.
Dominance effect (h) was found significant in cross Ib.128 x Ib.145 underirrigated condition for number of leaves per plant while under rainfed condition dominanceeffect (h) and additive x additive effect (i) were significant in cross Ib.62 x Ib.37. Thetype of epistasis was both complementary and duplicate. Additive effect (d) and dominancex dominance (l) were found for the cross Ib.62 x Ib.37. The type of epistasis was duplicate.For wilt ratings under irrigated conditions, all the gene effects (d,h,i,j and l) were highlysignificant in the cross Ib.128 x Ib. 145. Under rainfed condition the gene effects werenon-significant for wilt ratings and canopy air temperature difference.
A perusal of the gene effects revealed that the estimates vary for each cross indifferent degrees. Significant occurrence of additive, dominance and epistatic componentsnecessitates a breeding methodology like reciprocal recurrent selection or biparental matingor diallele selective mating which would be more useful to improve morpho-physiologicalcharacters related to drought tolerance.
Division of Genetics, Indian Agricultural Research Institute, New Delhi
Introduction
Maize is one of the most important cerealcrops in India grown for grain as well as fodder
purpose. Nearly 65 per cent of maize is grownunder rainfed condition. Moisture stress is amajor limiting factor for maize production under
153
Second National Plant Breeding Congress 2006 Plant Breeding in Post Genomics Era
rainfed conditions. Global estimate indicates thatthere is a loss of about 15 per cent due to drought.Therefore, it is essential for enhancing thebreeding effort for drought tolerance in maize.Drought is a complex phenomenon and dependson several characters like plants, maturity andphysiological traits. Hence, it is essential togenerate information on genetics of these traits.Keeping this in view, an experiment wasconducted involving three crosses, respectiveinbred lines, F2 and two parental back crosses(BC1 and BC2). The results of these studiesare described in this paper.
Material and Methods
The material for the study consisted of threecrosses viz., Ib.62 x Ib.128, Ib.62 x Ib.37 andIb.128 x Ib.145 along with respective parentallines and the two respective back crosses (BC1and BC2) with male and female parents. Theexperimental material was grown in arandomized block design with 3 replications atIndian Agricultural Research Institute, NewDelhi. The irrigated crop was grown withrecommended number (5 irrigations during cropseason) while rainfed crop was grown underpurely rainfed conditions without anysupplementary irrigation. Data were recordedon 5 plants for parents and hybrids and on 20plants for F2 and back crosses. Observationswere recorded on plant height, ear height, daysto 50 per cent tasseling, days to 50 silking,anthesis silking interval (ASI),number of leaves/plant, specific leaf weight, wilt ratings at seedlingstage (1-5 scale) and canopy air temperaturedifference (CATD).
Recommended cultural practices werefollowed during crop growth. Genetic analysiswas performed as per the six-parameter modeldescribed by Hayman (1958). Additive (d),dominance (h) and non-allelic effects i,j and lwere calculated as per the generation meananalysis described by Hayman (1958).Theestimates of h and l along with their sign were
utilized to understand the nature of epistasis.
Results and Discussion
The results obtained from generation meananalysis for different characters studied arepresented in table 1. Estimates of gene effectsunder irrigated and rainfed conditions arediscussed below.
Maturity and plant characters
Results indicated that mean values (m)were highly significant for the charactersstudied for all the three crosses under rainfedas well as irrigated conditions (Table 1).
Days to 50 % per cent tasseling
The interaction additive x additive (i) wasfound to be significant under irrigated conditionin the cross Ib.62 x Ib.37. The type of epistasiswas complimentary in this cross while this wasduplicate in nature in other two crosses. Underrainfed condition, additive effect (d), dominanceeffect (h) and interaction dominance xdominance (l) were found significant in the crossIb.62 x Ib.128. The type of epistasis wascomplimentary in Ib.62 x Ib.37 while it wasduplicate in nature in other two crosses.Estimates of gene effects indicatedpredominance of non-additive gene effects forthis trait. Additive gene effects were foundimportant for days to 50 per cent tasseling byGousenard et al. (1989) and Hemalatha andSarkar (1990). Guo et al. (1986) reportedpredominance of dominance effects. Bothadditive and non additive effects were reportedto be important by Ramesha (1988).
Days to 50 % silking
None of the gene effects were foundsignificant under irrigated condition and typeof epistasis was duplicate for all the crosses.Under rainfed condition, dominance effect (h)and epistatic effects additive x additive (i) anddominance x dominance effect (l) were foundsignificant. The type of epistasis was duplicate
154
Second National Plant Breeding Congress 2006 Plant Breeding in Post Genomics Era
in Ib.62 x Ib. 128, Ib.62 x Ib.37 andcomplimentary in Ib.128 x Ib.145. Dominanceeffects were found important for this trait bySingh et al, (1979), while epistatic effects werefound important by Saha (1981) and Ahuja etal. (1983).
Anthesis, silking interval
Dominance effect was found to besignificant for the cross Ib.128 x Ib.145 underirrigated conditions. Under rainfed condition,dominance effect (h) and epistatic effect (i) werefound significant in cross Ib.62 x Ib.128. In crossIb.128 x Ib.145 cross, additive effect (d) wasfound significant while both additive effect (d)and additive x dominant effect (j) were foundsignificant for cross Ib.62 x Ib.37. The type ofepistasis was found to be duplicate in nature forall the three crosses under irrigated and rainfedconditions. Bonaparte (1977) found theimportance of additive and dominance geneeffects for this character, the magnitude ofdominance effects being more important.
Plant height
Under irrigated condition, none of the geneeffects were found significant. Under rainfedcondition, dominance effect (h) and dominancex dominance effect (l) were found significant incross Ib.62 x Ib.128 while additive effect (d)and additive x dominance effect (j) were foundsignificant in the cross Ib.62 x Ib.37. The typeof epistasis was of duplicate nature. Singh et al(1975), Khalidi (1982) reported the importanceof non-additive gene action for plant height whileHauller and Mirinda (1988) and Crossa et al(1990) reported the significance of additive geneaction. Pal et al (1986), Debnath and Sarkar,(1987) reported that both additive and dominancegene effects were important. Marker and Joshi,(2005) indicated the importance of dominancevariance for this trait though additive geneticvariance was also found significant under rainfedcondition.
Ear height
Under irrigated condition additive effect(d) was found significant in cross Ib.128 x Ib.145while dominance x dominance epistatic effect(l) was found significant for cross Ib.62 x Ib.37.Under rainfed condition, dominance effect (d)and epistatic effects additive x additive (i)anddominance x dominance (l) effects were foundsignificant for the cross Ib.128 x Ib.145 whileonly additive x dominance effect (j) were foundsignificant in the cross Ib.62 x Ib.37. The typeof epistasis was of duplicate nature in all thethree crosses. The importance of both additiveand non-additive gene effects were foundimportant by Pal et al. (1986) and Debnathand Sarkar, (1987).
Physiological Traits
Mean effects (m) were highly significantfor physiological characters for most of thecrosses in both the moisture regimes. Estimatesof gene effects for four physiological charactersunder two growing conditions are presented intable 2.
Number of leaves per plant
Dominance effect (h) was found significantin cross Ib.128 x Ib.145 under irrigatedcondition. The type of epistasis was of duplicatenature. Under rainfed condition, dominanceeffect (h) and additive x additive epistatic effect(i) were found significant in cross Ib.62 x Ib.37.The type of epistasis was duplicate in Ib.62 xIb.37 and complementary in other two crosses.Sharma, (1987) and Brar and Labana (1991)reported the significance of additive geneeffects for leaf number per plant.
Specific leaf weight
Dominance effect (h) and additive xadditive epistatic effect (i) were foundsignificant for cross Ib.62 x Ib.37under irrigatedcondition. The type of epistasis was duplicatein two crosses while it was complementary in
155
Second National Plant Breeding Congress 2006 Plant Breeding in Post Genomics Era
Ib.128 x Ib.145. Under rainfed condition, additiveeffect (d) and dominance x dominance effect(l) were found to be highly significant in crossIb.62 x Ib.37. The type of epistasis wasduplicate in the three crosses.
Wilt rating at seedling stage
All the gene effects (d,h,i,j and l) were foundsignificant in cross Ib.12 x Ib.145. In the crossIb.62 x Ib.128 dominance x dominanceinteraction (l) was found significant while additiveeffect (d) additive x additive effect (i) werefound significant in cross Ib.62 x Ib.137. Thetype of epistasis was duplicate. Under rainfedcondition, the gene effects were found to be nonsignificant for this trait. Hemalatha and Sarkar(1990) reported greater importance ofdominance variance for wilt ratings due to waterstress.
Canopy air temperature difference (CATD)
The gene effects were non significant forthis character under rainfed and irrigatedcondition.
Estimation of various gene effects fordifferent plant, maturity and physiologicalcharacters indicated the presence of additive,dominant and all the three digenic epistaticeffects in various crosses studied. Hence,breeding procedures like reciprocal recurrentselection or biparental crosses or dialleleselective mating would be useful tools to improvethe characters related to drought tolerance. Blum(1979), Martinello (1983) and Ashok Kumar andSharma (2005) earlier reported such breedingprocedures .
REFERENCES
Ahuja, V.P., Mukharjee, B.K and Agarwal, K.N.1983. Epistasis and its contribution to theexpression of yield and other metric traits inmaize (Zea mays L.). Genetika 15: 1-8
Ashok Kumar and Sharma, S.C.2005 Geneaction and heterosis for some quantitative
characters in bread wheat (Triticumaestivum L). Indian J. Genet. 65: 281-283
Blum, A. 1979. Principles and methodology ofselecting for dourght resistance in sorghum.Monografic de Genetica Agrano. 4: 205-215
Bonaparte, E.N.A. 1977. Diallel analysis of leafnumber and duration of mid silk in maize.Can.J.Genet. Cytol. 19: 251-258.
Brar, G.P.S and Labana, K.S. 1991. Partitioningof quantitative variability for grain yield andits components in maize. In: Abstracts ofGolden Jubilee Symposium on GeneticResearch and Education: Currents trendsand Next Fifty Years. Feb. 12-15,1991,New Delhi. 2: 385
Crossa, J, Vasal, S.K. and Beck, D.L. 1990.Combining ability estimates of CIMMYT’stropical late yellow maize germplasm.Maydica, 35: 273-278.
Debnath, S.C and Sarkar, K.R. 1987. Geneticanalysis of grain yield and some of itsattributes in maize (Zea mays L.). Thei. J.Agric. Sci. 20: 263-276
Gouesnard, B, Gallas, A and Lefort-Buson, M.1989. Intra and inter population geneticvariability in two forage maize populations.Agronomie 9: 867-876.
Guo, P.Z., Gardner, C.O and Obaidi, M. 1986.Genetic variation and gene effectscontrolling prolificacy and other traits inmaize (Zea mays L.). Acta. Genet. Sin.13 : 35-42.
Hallauer, A.R and Miranda, J.B.1988.Quantitative Genetics in Maize Breeding.Iowa State Univ. Press, Ames. P. 267-294.
Hayman, B.I. 1958. The separation of epistasisfrom additive and dominance variation in
156
Second National Plant Breeding Congress 2006 Plant Breeding in Post Genomics Era
generation means. Heredity 12: 371-390.
Hemalatha, G.V and Sarkar, K.R. 1990.Genetical studies on some parameters ofdrought tolerance in maize. Phytobreedon.
Khalidi, G.A. 1982. Genetic analysis of yield andother quantitative characters in heterozygouspopulations of maize (Zea mays L.) M.Sc.Thesis. IARI., New Delhi.
Martinello, P. 1983. Outlines of majorcomponents of maize breeding progrmmesfor semi-arid regions (Capitanata plain).Genet. Agr. 37: 361-390.
Marker, S and Joshi, V.N. 2005. Genetic analysisof maize (Zea mays L.) composite understress and non-stress conditions. Indian J.Genet. 65: 211-212
Pal, S.S, Khera, A.S and Dhillon, B.S. 1986.Genetic analysis of and selection advancein maize populations. Maydica. 31: 153-162.
Ramesha, M.S. 1988. Genetic study of some rarequantitative characters in maize (Zea maysL.), M.Sc . Thesis; UAS., Dharwad.
Saha, B.C. 1981. Nature of inheritance andheterosis manifestation in physiological andagronomic attributes in hybrids of maize(Zea mays L.). Ph.D. thesis, IARI, NewDelhi.
Sharma, J.K. 1987. Study of Genetics of somemorphological, physiological andbiochemical characters associated withdrought resistance in maize (Zea mays L.).Thesis abstracts. H.P. KrishiViswavidyalaya, Palampur, P.107-108.
Singh, R.D, Joshi, A.B, Dhawan, N.L andMukharjee, B.K. 1975. Studies on eliteIndian maize composites. I. Geneticanalysis of grain yield and other agronomictraits. Genetika. 7 : 26-268.
Singh, A.K, Dixit, R.K and Singh, H.G. 1979.Combining ability analysis for yield and itsattributes in maize (Zea mays L.). IndianJ. Agric. Res. 13: 27-30.
Spangole, W.E. 1986. Moisture stress responsein maize. Diss. Abst. Internat. B46:2135B
157
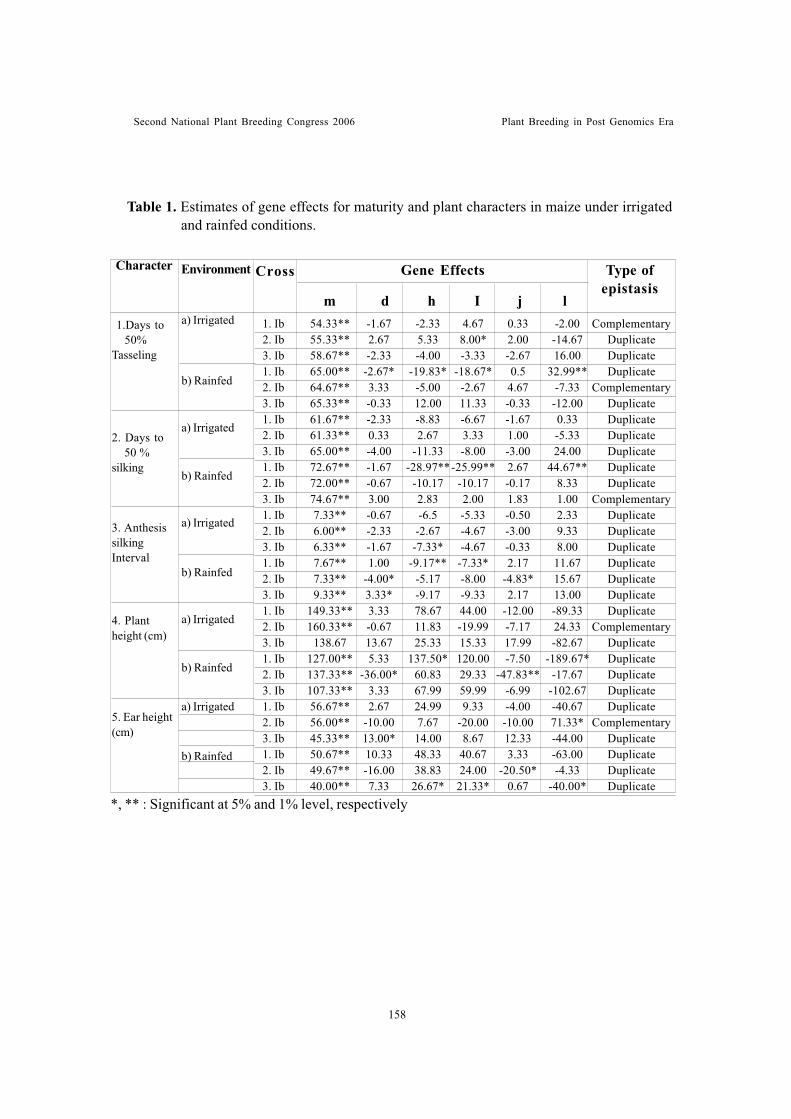
Second National Plant Breeding Congress 2006 Plant Breeding in Post Genomics Era
Table 1. Estimates of gene effects for maturity and plant characters in maize under irrigated and rainfed conditions.
*, ** : Significant at 5% and 1% level, respectively
1. Ib 54.33** -1.67 -2.33 4.67 0.33 -2.00 Complementary2. Ib 55.33** 2.67 5.33 8.00* 2.00 -14.67 Duplicate3. Ib 58.67** -2.33 -4.00 -3.33 -2.67 16.00 Duplicate1. Ib 65.00** -2.67* -19.83* -18.67* 0.5 32.99** Duplicate2. Ib 64.67** 3.33 -5.00 -2.67 4.67 -7.33 Complementary3. Ib 65.33** -0.33 12.00 11.33 -0.33 -12.00 Duplicate1. Ib 61.67** -2.33 -8.83 -6.67 -1.67 0.33 Duplicate2. Ib 61.33** 0.33 2.67 3.33 1.00 -5.33 Duplicate3. Ib 65.00** -4.00 -11.33 -8.00 -3.00 24.00 Duplicate1. Ib 72.67** -1.67 -28.97**-25.99** 2.67 44.67** Duplicate2. Ib 72.00** -0.67 -10.17 -10.17 -0.17 8.33 Duplicate3. Ib 74.67** 3.00 2.83 2.00 1.83 1.00 Complementary1. Ib 7.33** -0.67 -6.5 -5.33 -0.50 2.33 Duplicate2. Ib 6.00** -2.33 -2.67 -4.67 -3.00 9.33 Duplicate3. Ib 6.33** -1.67 -7.33* -4.67 -0.33 8.00 Duplicate1. Ib 7.67** 1.00 -9.17** -7.33* 2.17 11.67 Duplicate2. Ib 7.33** -4.00* -5.17 -8.00 -4.83* 15.67 Duplicate3. Ib 9.33** 3.33* -9.17 -9.33 2.17 13.00 Duplicate1. Ib 149.33** 3.33 78.67 44.00 -12.00 -89.33 Duplicate2. Ib 160.33** -0.67 11.83 -19.99 -7.17 24.33 Complementary3. Ib 138.67 13.67 25.33 15.33 17.99 -82.67 Duplicate1. Ib 127.00** 5.33 137.50* 120.00 -7.50 -189.67* Duplicate2. Ib 137.33** -36.00* 60.83 29.33 -47.83** -17.67 Duplicate3. Ib 107.33** 3.33 67.99 59.99 -6.99 -102.67 Duplicate1. Ib 56.67** 2.67 24.99 9.33 -4.00 -40.67 Duplicate2. Ib 56.00** -10.00 7.67 -20.00 -10.00 71.33* Complementary3. Ib 45.33** 13.00* 14.00 8.67 12.33 -44.00 Duplicate1. Ib 50.67** 10.33 48.33 40.67 3.33 -63.00 Duplicate2. Ib 49.67** -16.00 38.83 24.00 -20.50* -4.33 Duplicate3. Ib 40.00** 7.33 26.67* 21.33* 0.67 -40.00* Duplicate
1.Days to 50%Tasseling
2. Days to 50 %silking
3. AnthesissilkingInterval
4. Plantheight (cm)
5. Ear height(cm)
a) Irrigated
b) Rainfed
a) Irrigated
b) Rainfed
a) Irrigated
b) Rainfed
a) Irrigated
b) Rainfed
a) Irrigated
b) Rainfed
Character Environment Cross Gene Effects Type ofepistasis
m d h I j l
158
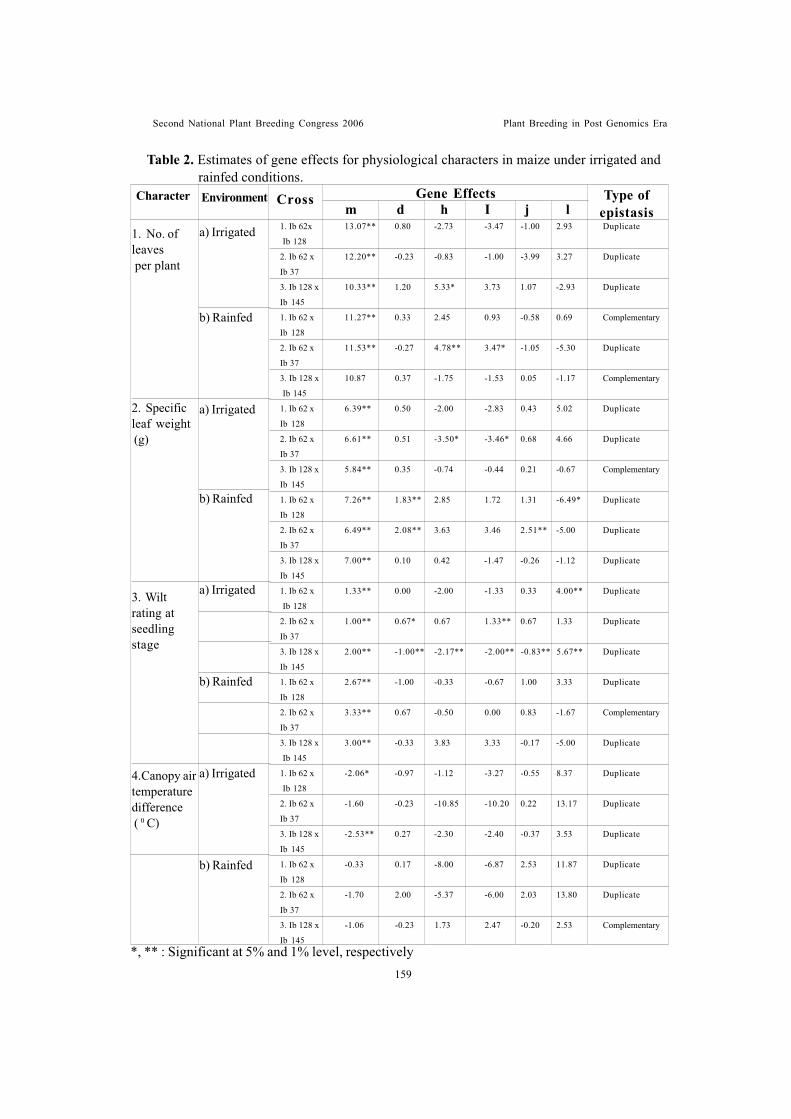
Second National Plant Breeding Congress 2006 Plant Breeding in Post Genomics Era
Table 2. Estimates of gene effects for physiological characters in maize under irrigated and rainfed conditions.
*, ** : Significant at 5% and 1% level, respectively
1. Ib 62x 13.07** 0.80 -2.73 -3.47 -1.00 2.93 Duplicate
Ib 128
2. Ib 62 x 12.20** -0.23 -0.83 -1.00 -3.99 3.27 Duplicate
Ib 37
3. Ib 128 x 10.33** 1.20 5.33* 3.73 1.07 -2.93 Duplicate
Ib 145
1. Ib 62 x 11.27** 0.33 2.45 0.93 -0.58 0.69 Complementary
Ib 128
2. Ib 62 x 11.53** -0.27 4.78** 3.47* -1.05 -5.30 Duplicate
Ib 37
3. Ib 128 x 10.87 0.37 -1.75 -1.53 0.05 -1.17 Complementary
Ib 145
1. Ib 62 x 6.39** 0.50 -2.00 -2.83 0.43 5.02 Duplicate
Ib 128
2. Ib 62 x 6.61** 0.51 -3.50* -3.46* 0.68 4.66 Duplicate
Ib 37
3. Ib 128 x 5.84** 0.35 -0.74 -0.44 0.21 -0.67 Complementary
Ib 145
1. Ib 62 x 7.26** 1.83** 2.85 1.72 1.31 -6.49* Duplicate
Ib 128
2. Ib 62 x 6.49** 2.08** 3.63 3.46 2.51** -5.00 Duplicate
Ib 37
3. Ib 128 x 7.00** 0.10 0.42 -1.47 -0.26 -1.12 Duplicate
Ib 145
1. Ib 62 x 1.33** 0.00 -2.00 -1.33 0.33 4.00** Duplicate
Ib 128
2. Ib 62 x 1.00** 0.67* 0.67 1.33** 0.67 1.33 Duplicate
Ib 37
3. Ib 128 x 2.00** -1.00** -2.17** -2.00** -0.83** 5.67** Duplicate
Ib 145
1. Ib 62 x 2.67** -1.00 -0.33 -0.67 1.00 3.33 Duplicate
Ib 128
2. Ib 62 x 3.33** 0.67 -0.50 0.00 0.83 -1.67 Complementary
Ib 37
3. Ib 128 x 3.00** -0.33 3.83 3.33 -0.17 -5.00 Duplicate
Ib 145
1. Ib 62 x -2.06* -0.97 -1.12 -3.27 -0.55 8.37 Duplicate
Ib 128
2. Ib 62 x -1.60 -0.23 -10.85 -10.20 0.22 13.17 Duplicate
Ib 37
3. Ib 128 x -2.53** 0.27 -2.30 -2.40 -0.37 3.53 Duplicate
Ib 145
1. Ib 62 x -0.33 0.17 -8.00 -6.87 2.53 11.87 Duplicate
Ib 128
2. Ib 62 x -1.70 2.00 -5.37 -6.00 2.03 13.80 Duplicate
Ib 37
3. Ib 128 x -1.06 -0.23 1.73 2.47 -0.20 2.53 Complementary
Ib 145
1. No. ofleaves per plant
2. Specificleaf weight (g)
3. Wiltrating atseedlingstage
4.Canopy airtemperaturedifference ( 0 C)
a) Irrigated
b) Rainfed
a) Irrigated
b) Rainfed
a) Irrigated
b) Rainfed
a) Irrigated
b) Rainfed
Character Environment Cross Gene Effects Type ofepistasism d h I j l
159
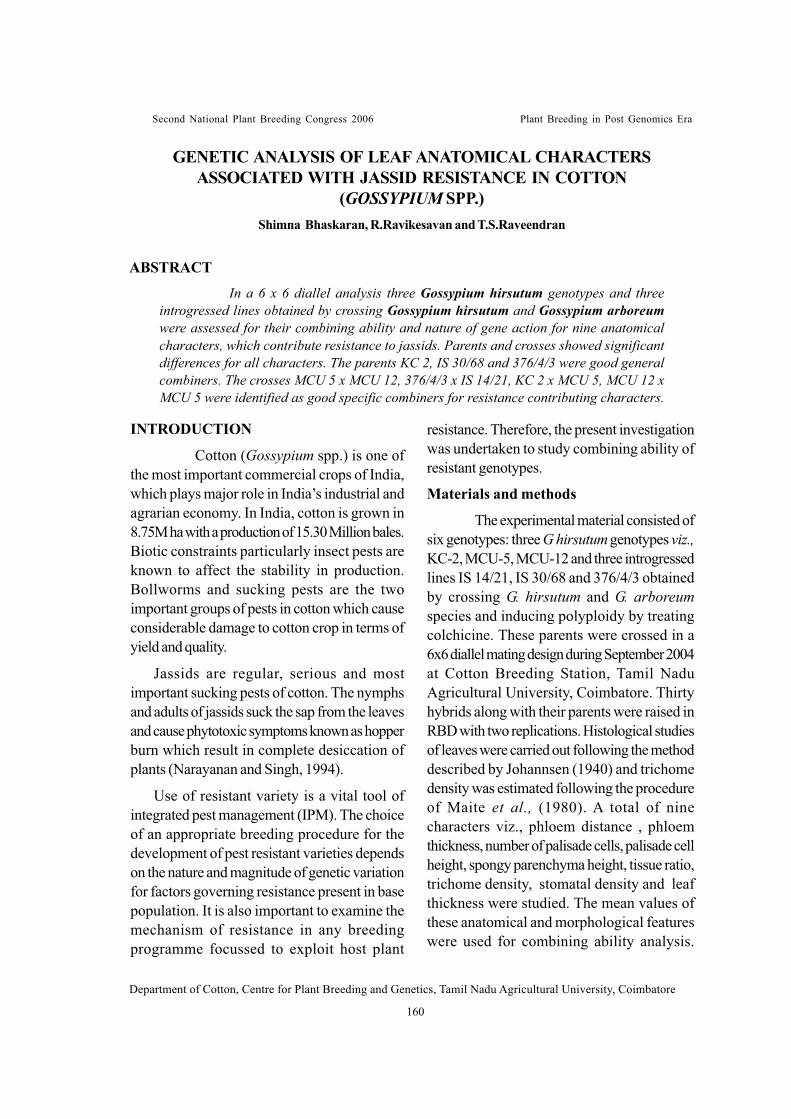
Second National Plant Breeding Congress 2006 Plant Breeding in Post Genomics Era
GENETIC ANALYSIS OF LEAF ANATOMICAL CHARACTERSASSOCIATED WITH JASSID RESISTANCE IN COTTON
(GOSSYPIUM SPP.)Shimna Bhaskaran, R.Ravikesavan and T.S.Raveendran
ABSTRACT In a 6 x 6 diallel analysis three Gossypium hirsutum genotypes and three
introgressed lines obtained by crossing Gossypium hirsutum and Gossypium arboreumwere assessed for their combining ability and nature of gene action for nine anatomicalcharacters, which contribute resistance to jassids. Parents and crosses showed significantdifferences for all characters. The parents KC 2, IS 30/68 and 376/4/3 were good generalcombiners. The crosses MCU 5 x MCU 12, 376/4/3 x IS 14/21, KC 2 x MCU 5, MCU 12 xMCU 5 were identified as good specific combiners for resistance contributing characters.
INTRODUCTION
Cotton (Gossypium spp.) is one ofthe most important commercial crops of India,which plays major role in India’s industrial andagrarian economy. In India, cotton is grown in8.75M ha with a production of 15.30 Million bales.Biotic constraints particularly insect pests areknown to affect the stability in production.Bollworms and sucking pests are the twoimportant groups of pests in cotton which causeconsiderable damage to cotton crop in terms ofyield and quality.
Jassids are regular, serious and mostimportant sucking pests of cotton. The nymphsand adults of jassids suck the sap from the leavesand cause phytotoxic symptoms known as hopperburn which result in complete desiccation ofplants (Narayanan and Singh, 1994).
Use of resistant variety is a vital tool ofintegrated pest management (IPM). The choiceof an appropriate breeding procedure for thedevelopment of pest resistant varieties dependson the nature and magnitude of genetic variationfor factors governing resistance present in basepopulation. It is also important to examine themechanism of resistance in any breedingprogramme focussed to exploit host plant
resistance. Therefore, the present investigationwas undertaken to study combining ability ofresistant genotypes.
Materials and methods
The experimental material consisted ofsix genotypes: three G hirsutum genotypes viz.,KC-2, MCU-5, MCU-12 and three introgressedlines IS 14/21, IS 30/68 and 376/4/3 obtainedby crossing G. hirsutum and G. arboreumspecies and inducing polyploidy by treatingcolchicine. These parents were crossed in a6x6 diallel mating design during September 2004at Cotton Breeding Station, Tamil NaduAgricultural University, Coimbatore. Thirtyhybrids along with their parents were raised inRBD with two replications. Histological studiesof leaves were carried out following the methoddescribed by Johannsen (1940) and trichomedensity was estimated following the procedureof Maite et al., (1980). A total of ninecharacters viz., phloem distance , phloemthickness, number of palisade cells, palisade cellheight, spongy parenchyma height, tissue ratio,trichome density, stomatal density and leafthickness were studied. The mean values ofthese anatomical and morphological featureswere used for combining ability analysis.
Department of Cotton, Centre for Plant Breeding and Genetics, Tamil Nadu Agricultural University, Coimbatore
160
Second National Plant Breeding Congress 2006 Plant Breeding in Post Genomics Era
Combining ability analysis was done by theprocedure outlined by Griffing (1956) for methodI in model I.
Results and discussion
The analysis of variance for anatomical andmorphological characters revealed highlysignificant difference among genotypes qualifyingthem for further study (Table 1). The combiningability analysis provides useful informationregarding selection of parents in terms of theperformance of their hybrid. Further, the analysiselucidates the nature and magnitude of varioustypes of gene action involved in expression ofquantitative traits (Dhillion, 1975).
The analysis of combining ability revealedthat the variance due to GCA and SCA werehighly significant for all the characters studied,indicating the presence of both additive and nonadditive gene action controlling these characters.The magnitude of GCA variance (Table 2) washigher than that of SCA for all characters exceptspongy parenchyma height indicatingpreponderance of additive gene action whichcould be exploited for improvement of these traitsby following simple selection, mass selection andpedigree selection. The GCA/SCA variance ratiowas narrow for all the characters studiedrevealing the importance of both additive andnon-additive gene action controlling thesecharacters. Singh and Gupta (1970) also reportedresults similar to the present findings.
Information on the per se performance andnature of general combining ability of charactersis necessary for selection of suitable parents fordeveloping hybrids. The parent KC 2 recordedhighest mean performance for phloem distanceand leaf thickness. Parent 376/4/3 was the bestperformer for tissue ratio and trichome density.IS 30/68-recorded superior performance fornumber of palisade cells and palisade cell height.
The parent KC 2 was considered as bestgeneral combiner for characters phloem
thickness and leaf thickness (plate 2). The parentMCU 5 was best combiner for phloem distanceand stomatal density. MCU 12 had higher gcaeffect for spongy parenchyma height and tissueratio.
Identification of parents based on eitherper se performance or gca effect alone wasmisleading in selection programme (ArumugamPillai and Amirthadevarathinam, 1998). In thepresent study, considering gca effects andper se performance together, parents KC 2,376/4/3 and IS 14/21 were selected as best.None of the parents was found to be goodgeneral combiner for all the traits. Hence, itwould be desirable to have multiple crossesinvolving the parents and subject them toselection in segregating generations to detectsuperior genotypes with resistant characters.
For all the traits some of the parentspossessed favorable genes and some did not.The gca effects depend on the relative valuerather than absolute value. Simmonds (1979)stated that the gca values relatively depend onthe mean of the chosen material. But if a parentpossessed significant gca effects for as manytraits as possible it is ideal to consider it forhybridization rather than parents with low gcaeffects or based on mean performance. Theother parent chosen for hybridization shouldpossess favorable gca effects for othercomplementary traits, so that favorablerecombinants for all traits could be obtained.
sca effects and hybrid vigour of the crossesare considered frequently in cases where non-additive component of genetic variancepredominates the inheritance. The superiorhybrids were selected on the basis of high perse performance and sca effects (Table 3) foreach of the trait in the present investigation.
The hybrid MCU 12 × KC-2 recorded highmean performance for phloem distance and leafthickness (plate 4) and the hybrid IS 30/68 × IS
161
Second National Plant Breeding Congress 2006 Plant Breeding in Post Genomics Era
14/21 had high mean performance for trichomedensity and low mean performance for tissueratio. Hybrid 376/4/3 x MCU 5 showed high perse performance for thickness of phloem.
The hybrid MCU 5 × MCU 12 recordedhighest positive significant sca effects for, phloemdistance and tissue ratio (plate 3). The hybridMCU 12 x MCU 5 recorded positive significantsca effects for phloem thickness and spongyparenchyma height. Out of thirty hybridsseventeen recorded positive significant sca effectfor phloem distance and sixteen hybrids recordedpositive sca effect for palisade cell height. Hybrid,376/4/3 X IS 14/21, a combination resistant tojassid, had significant positive sca effect for thattrait. The hybrid MCU 5 × MCU 12 recordedpositive significant sca effect for all the resistantcharacters studied.
It is concluded that the parents, KC 2, IS 30/68 and 376/4/3 are good general combiners forresistant characters. The crosses MCU 5 x MCU12, 376/4/3 x IS 14/21, KC 2 x MCU 5, MCU 12x MCU 5 were identified as good specificcombiners.
REFERENCE
Arumugam Pillai, N. and Amirthadevarathinam,A. 1998. Combining ability for economic traitsusing CMS system in cotton. AgricSci.Digest 18: 54-58
Dhillion, B.S.1975. Application of partial diallelcrosses in plant breeding. A review. CropImprovement., 2:1-7.
Griffing, B. 1956. Concept of general andspecific combining ability in relation to diallelcrossing systems. Australian J. Biol. Sci.,9: 463-493.
Johannsen, D.A., 1940. Plant micro techniques.McGrew Hill Bock co. tuc. New York. Pp.121-154.
Maite, R. K., Bidinger, F.R., Reddy, K.V.S. andDavies, J.C. 1980. Nature of occurenceof trichomes in sorghum lines withresistance to sorghum shootfly. JointProgress report, Sorghum Physiology-3,sorghum entomology-3, ICRISAT,Patancheru, A.P. India, pp. 20-23.
Narayanan, S.S. and Phundan Singh. 1994.Resistance to Heliothis and other seriousinsect pest in Gossypium spp. - A Review.Indian Soc. Cott. Improv., 19: 10-24.
Simmonds, N.W. 1979. Principles of cropimprovement. Longman Group Ltd.,Londan .408p
Singh, R.B. and Gupta, M.P. 1970. Combiningability for yield characters in upland cotton.Indian J. Genet., 30(3): 608-618.
162
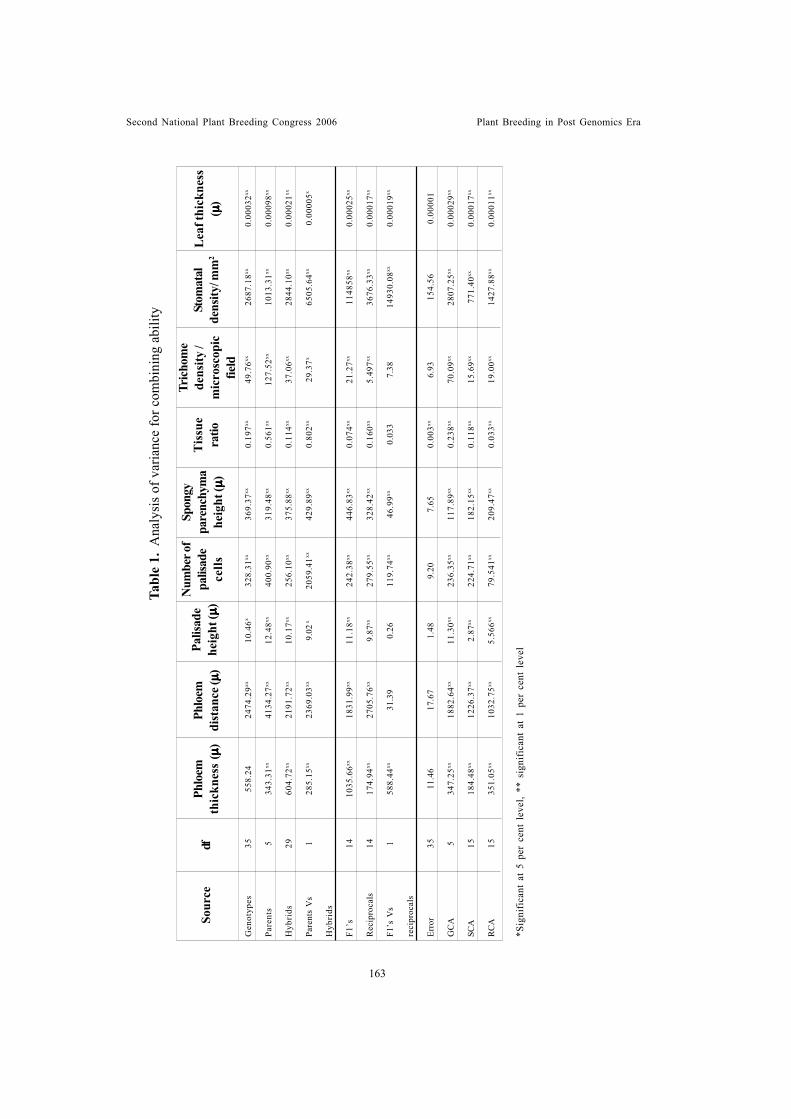
Second National Plant Breeding Congress 2006 Plant Breeding in Post Genomics Era
Tabl
e 1.
Ana
lysi
s of
var
ianc
e fo
r com
bini
ng a
bilit
y
*Sig
nific
ant
at 5
per
cen
t le
vel,
** s
igni
fican
t at
1 p
er c
ent
leve
l
Sour
cedf
Phlo
emth
ickn
ess
( ���� �)
Phlo
emdi
stan
ce ( ���� �
)
Num
ber o
fpa
lisad
ece
lls
Palis
ade
heig
ht ( ���� �
)
Tric
hom
ede
nsity
/m
icro
scop
icfie
ld
Spon
gypa
renc
hym
ahe
ight
( ���� �)
Stom
atal
dens
ity/ m
m2
Tis
sue
ratio
Lea
f thi
ckne
ss( ���� �
)
Gen
otyp
es35
558.
2424
74.2
9xx10
.46x
328.
31xx
369.
37xx
0.19
7xx49
.76xx
2687
.18xx
0.00
032xx
Pare
nts
534
3.31
xx41
34.2
7xx12
.48xx
400.
90xx
319.
48xx
0.56
1xx12
7.52
xx10
13.3
1xx0.
0009
8xx
Hyb
rids
2960
4.72
xx21
91.7
2xx10
.17xx
256.
10xx
375.
88xx
0.11
4xx37
.06xx
2844
.10xx
0.00
021xx
Pare
nts
Vs
128
5.15
xx23
69.0
3xx9.
02 x
2059
.41xx
429.
89xx
0.80
2xx29
.37x
6505
.64xx
0.00
005x
Hyb
rids
F1’s
1410
35.6
6xx18
31.9
9xx11
.18xx
242.
38xx
446.
83xx
0.07
4xx21
.27xx
1148
58xx
0.00
025xx
Rec
ipro
cals
1417
4.94
xx27
05.7
6xx9.
87xx
279.
55xx
328.
42xx
0.16
0xx5.
497xx
3676
.33xx
0.00
017xx
F1’s
Vs
158
8.44
xx31
.39
0.26
119.
74xx
46.9
9xx0.
033
7.38
1493
0.08
xx0.
0001
9xx
reci
proc
als
Erro
r35
11.4
617
.67
1.48
9.20
7.65
0.00
3xx6.
9315
4.56
0.00
001
GC
A5
347.
25xx
1882
.64xx
11.3
0xx23
6.35
xx11
7.89
xx0.
238xx
70.0
9xx28
07.2
5xx0.
0002
9xx
SCA
1518
4.48
xx12
26.3
7xx2.
87xx
224.
71xx
182.
15xx
0.11
8xx15
.69xx
771.
40xx
0.00
017xx
RC
A15
351.
05xx
1032
.75xx
5.56
6xx79
.541
xx20
9.47
xx0.
033xx
19.0
0xx14
27.8
8xx0.
0001
1xx
163
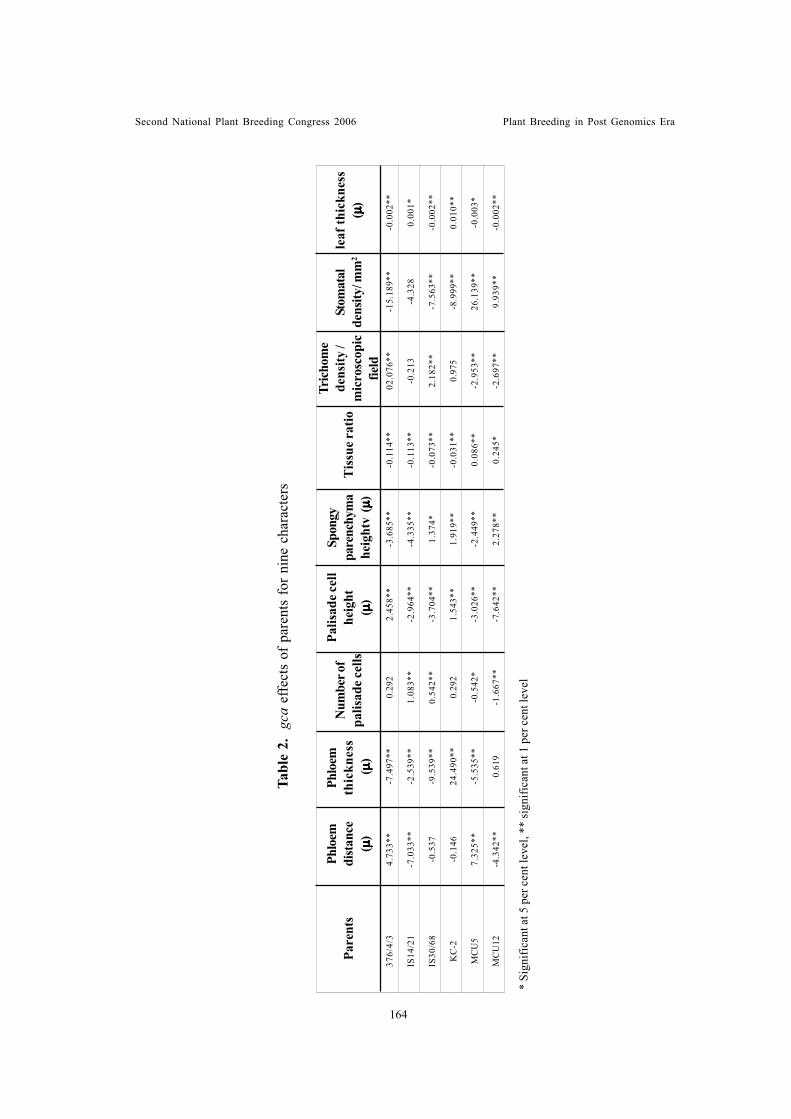
Second National Plant Breeding Congress 2006 Plant Breeding in Post Genomics Era
376/
4/3
4.73
3**
-7.4
97**
0.29
22.
458*
*-3
.685
**-0
.114
**02
.076
**-1
5.18
9**
-0.0
02**
IS14
/21
-7.0
33**
-2.5
39**
1.08
3**
-2.9
64**
-4.3
35**
-0.1
13**
-0.2
13-4
.328
0.00
1*
IS30
/68
-0.5
37-9
.539
**0.
542*
*-3
.704
**1.
374*
-0.0
73**
2.18
2**
-7.5
63**
-0.0
02**
KC
-2-0
.146
24.4
90**
0.29
21.
543*
*1.
919*
*-0
.031
**0.
975
-8.9
99**
0.01
0**
MC
U5
7.32
5**
-5.5
35**
-0.5
42*
-3.0
26**
-2.4
49**
0.08
6**
-2.9
53**
26.1
39**
-0.0
03*
MC
U12
-4.3
42**
0.61
9-1
.667
**-7
.642
**2.
278*
*0.
245*
-2.6
97**
9.93
9**
-0.0
02**
* Si
gnifi
cant
at 5
per
cen
t lev
el, *
* si
gnifi
cant
at 1
per
cen
t lev
el
Pare
nts
Phlo
emth
ickn
ess
( ���� �)
Phlo
emdi
stan
ce( ���� �
)
Num
ber o
fpa
lisad
e cel
ls
Palis
ade c
ell
heig
ht( ���� �
)
Tric
hom
ede
nsity
/m
icro
scop
icfie
ld
Spon
gypa
renc
hym
ahe
ight
v ( ���� �
)
Stom
atal
dens
ity/ m
m2
Tis
sue r
atio
leaf
thic
knes
s( ���� �
)
Ta
ble
2. g
caef
fect
s of
par
ents
for n
ine
char
acte
rs
164
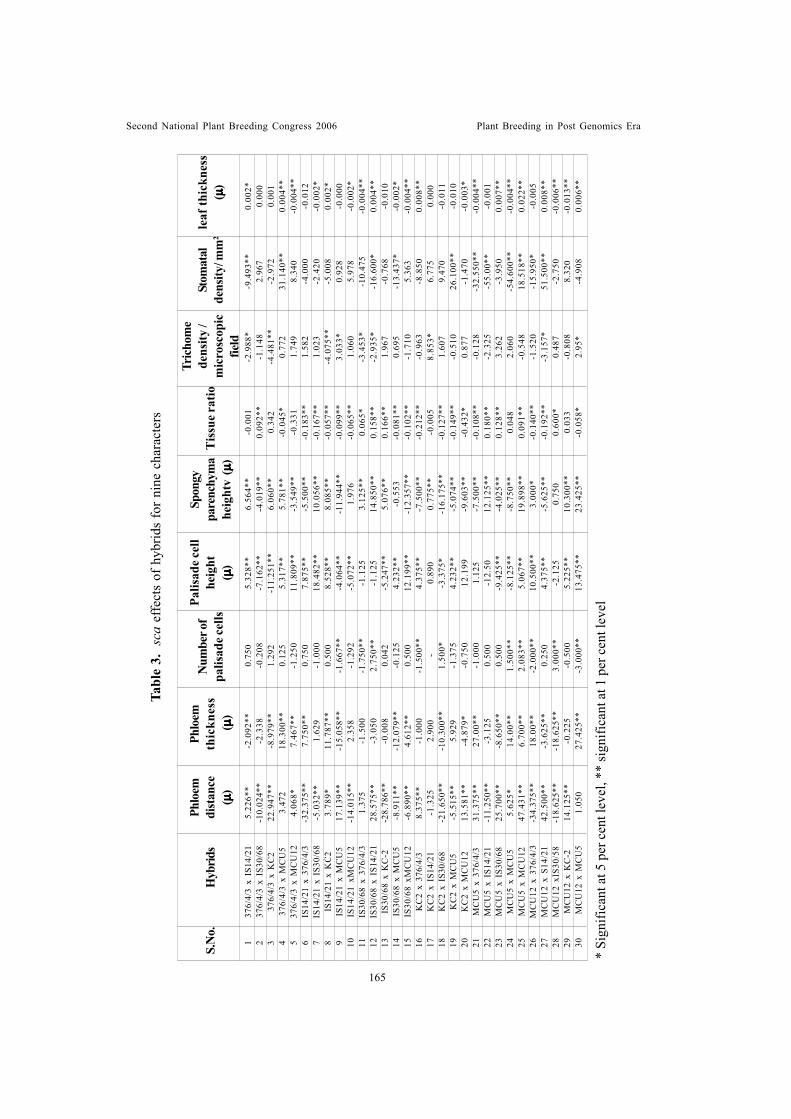
Second National Plant Breeding Congress 2006 Plant Breeding in Post Genomics Era
Tabl
e 3.
sca
effe
cts
of h
ybrid
s fo
r nin
e ch
arac
ters
* Si
gnifi
cant
at 5
per
cen
t lev
el, *
* si
gnifi
cant
at 1
per
cen
t lev
el
137
6/4/
3 x
IS14
/21
5.22
6**
-2.0
92**
0.75
05.
328*
*6.
564*
*-0
.001
-2.9
88*
-9.4
93**
0.00
2*2
376/
4/3
x IS
30/6
8-1
0.02
4**
-2.3
38-0
.208
-7.1
62**
-4.0
19**
0.09
2**
-1.1
482.
967
0.00
03
376/
4/3
x K
C2
22.9
47**
-8.9
79**
1.29
2-1
1.25
1**
6.06
0**
0.34
2-4
.481
**-2
.972
0.00
14
376/
4/3
x M
CU
53.
472
18.3
00**
0.12
55.
317*
*5.
781*
*-0
.045
*0.
772
31.1
40**
0.00
4**
537
6/4/
3 x
MC
U12
4.06
8*7.
467*
*-1
.250
11.8
09**
-3.5
49**
-0.3
311.
749
8.34
0-0
.004
**6
IS14
/21
x 37
6/4/
3-3
2.37
5**
7.75
0**
0.75
07.
875*
*-5
.500
**-0
.183
**1.
582
-4.0
00-0
.012
7IS
14/2
1 x
IS30
/68
-5.0
32**
1.62
9-1
.000
18.4
82**
10.0
56**
-0.1
67**
1.02
3-2
.420
-0.0
02*
8IS
14/2
1 x
KC
23.
789*
11.7
87**
0.50
08.
528*
*8.
085*
*-0
.057
**-4
.075
**-5
.008
0.00
2*9
IS14
/21
x M
CU
517
.139
**-1
5.05
8**
-1.6
67**
-4.0
64**
-11.
944*
*-0
.099
**3.
033*
0.92
8-0
.000
10IS
14/2
1 xM
CU
12-1
4.01
5**
2.35
8-1
.292
-5.0
72**
1.97
6-0
.065
**1.
060
5.97
8-0
.002
*11
IS30
/68
x 37
6/4/
31.
375
-1.5
00-1
.750
**-1
.125
3.12
5**
0.06
5*-3
.453
*-1
0.47
5-0
.004
**12
IS30
/68
x IS
14/2
128
.575
**-3
.050
2.75
0**
-1.1
2514
.850
**0.
158*
*-2
.935
*-1
6.60
0*0.
004*
*13
IS30
/68
x K
C-2
-28.
786*
*-0
.008
0.04
2-5
.247
**5.
076*
*0.
166*
*1.
967
-0.7
68-0
.010
14IS
30/6
8 x
MC
U5
-8.9
11**
-12.
079*
*-0
.125
4.23
2**
-0.5
53-0
.081
**0.
695
-13.
437*
-0.0
02*
15IS
30/6
8 xM
CU
12-6
.890
**4.
612*
*0.
500
12.1
99**
-12.
357*
*-0
.102
**-1
.710
5.36
3-0
.004
**16
KC
2 x
376/
4/3
8.37
5**
-1.0
00-1
.500
**4.
375*
*-7
.500
**-0
.212
**-0
.963
-8.8
500.
008*
*17
KC
2 x
IS14
/21
-1.3
252.
900
-0.
890
0.77
5**
-0.0
058.
853*
6.77
50.
000
18K
C2
x IS
30/6
8-2
1.65
0**
-10.
300*
*1.
500*
-3.3
75*
-16.
175*
*-0
.127
**1.
607
9.47
0-0
.011
19K
C2
x M
CU
5-5
.515
**5.
929
-1.3
754.
232*
*-5
.074
**-0
.149
**-0
.510
26.1
00**
-0.0
1020
KC
2 x
MC
U12
13.5
81**
-4.8
79*
-0.7
5012
.199
-9.6
03**
-0.4
32*
0.87
7-1
.470
-0.0
03*
21M
CU
5 x
376/
4/3
31.3
75**
27.0
0**
-1.0
001.
125
-7.5
00**
-0.1
08**
-0.1
28-3
2.55
0**
-0.0
04**
22M
CU
5 x
IS14
/21
-11.
250*
*-3
.125
0.50
0-1
2.50
12.1
25**
0.18
0**
-2.3
25-5
5.00
**-0
.001
23M
CU
5 x
IS30
/68
25.7
00**
-8.6
50**
0.50
0-9
.425
**-4
.025
**0.
128*
*3.
262
-3.9
500.
007*
*24
MC
U5
x M
CU
55.
625*
14.0
0**
1.50
0**
-8.1
25**
-8.7
50**
0.04
82.
060
-54.
600*
*-0
.004
**25
MC
U5
x M
CU
1247
.431
**6.
700*
*2.
083*
*5.
067*
*19
.898
**0.
091*
*-0
.548
18.5
18**
0.02
2**
26M
CU
12 x
376
/4/3
-34.
375*
*18
.00*
*-2
.000
**10
.500
**3.
000*
-0.1
40**
-1.5
20-1
5.95
0*-0
.005
27M
CU
12 x
S14
/21
42.5
00**
-3.6
25**
0.25
04.
375*
*-5
.625
**-0
.192
**-3
.157
*51
.500
**0.
008*
*28
MC
U12
xIS
30/5
8-1
8.62
5**
-18.
625*
*3.
000*
*-2
.125
0.75
00.
600*
0.48
7-2
.750
-0.0
06**
29M
CU
12 x
KC
-214
.125
**-0
.225
-0.5
005.
225*
*10
.300
**0.
033
-0.8
088.
320
-0.0
13**
30 M
CU
12 x
MC
U5
1.05
027
.425
**-3
.000
**13
.475
**23
.425
**-0
.058
*2.
95*
-4.9
080.
006*
*
Phlo
emth
ickn
ess
( ���� �)
Phlo
emdi
stan
ce( ���� �
)
Num
ber o
fpa
lisad
e cel
ls
Palis
ade c
ell
heig
ht( ���� �
)
Tric
hom
ede
nsity
/m
icro
scop
icfie
ld
Spon
gypa
renc
hym
ahe
ight
v ( ���� �
)
Stom
atal
dens
ity/ m
m2
Tis
sue r
atio
leaf
thic
knes
s( ���� �
)S.
No.
Hyb
rids
165
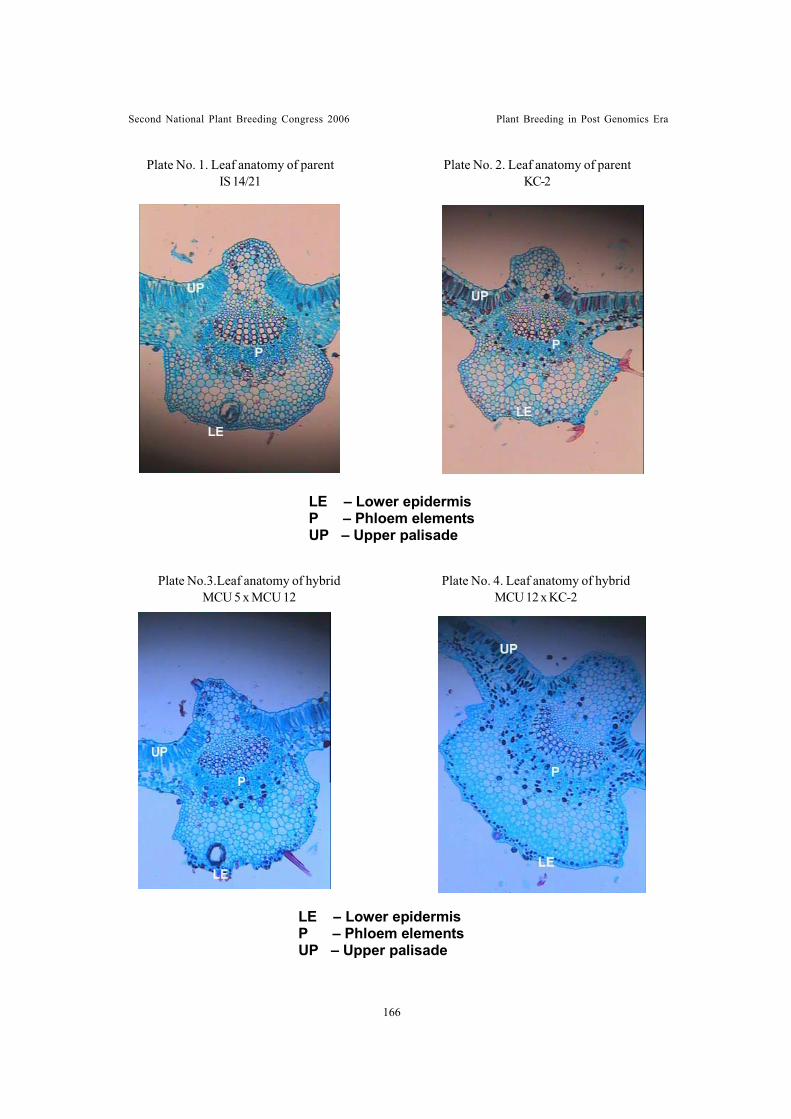
Second National Plant Breeding Congress 2006 Plant Breeding in Post Genomics Era
Plate No. 4. Leaf anatomy of hybridMCU 12 x KC-2
Plate No.3.Leaf anatomy of hybridMCU 5 x MCU 12
Plate No. 2. Leaf anatomy of parentKC-2
Plate No. 1. Leaf anatomy of parentIS 14/21
166
LE – Lower epidermis P – Phloem elements UP – Upper palisade
LE – Lower epidermis P – Phloem elements UP – Upper palisade
Second National Plant Breeding Congress 2006 Plant Breeding in Post Genomics Era
TECHNICAL SESSION III
UTILIZATION OF PLOIDY BREEDING IN CROPIMPROVEMENT
Second National Plant Breeding Congress 2006 Plant Breeding in Post Genomics Era
PRE-BREEDING THROUGH PLOIDY MANIPULATION TO EXPLOITALIEN GENETIC VARIABILITY
Amala J. Prabhakaran
ABSTRACTPlant breeding efforts to develop varieties/hybrids with desired economic characteristics
are constrained by the narrow genetic base of the cultivated species. Wild relatives of thecultivar species are rich sources of novel genetic variability in terms of resistance to bioticand abiotic factors, quality parameters, plant types and other desirable agronomiccharacteristics and continue to serve as sources of cytoplasm in case of hybrid crops.Hence, concerted efforts are required to incorporate additional variability from these reliablesources so as to develop varieties/hybrids with desired characteristics. Successfulintrogression of desirable genes from the distantly related wild into cultivated species requiresa clear understanding about the genomes and many severe problems like incompatibility,genetic distance, increased or decreased number, structural heterozygosity need to beovercome. Extensive genetic, cytogenetic, and molecular investigations will immenselyhelp to plan the strategies to over come many of the problems. A wide gap exists betweenmaking initial hybrids and releasing cultivars with good agronomic performance and yield.While alien genes from primary gene pool could be easily transferred through conventionalbreeding, the introgression of traits of interest from the species from secondary and tertiarygene pools requires several manipulations both at chromosome and genome levels usingrecent techniques since the interspecific/ intergeneric hybrids showed sterility caused byploidy differences, genomic incompatibility, cytoplasmic imbalances or other factors.Altering the ploidy levels of either the parental species or the interspecific hybrid itselfthrough colchiploidy or in vitro techniques is necessary. The various approaches to transferalien genetic variability into cultivars combining conventional methods with recentadvancements in cytogenetics and crop breeding are discussed with a few representativecrops.
Indian Agricultural Research Institute, Regional Station, Wellington, The Nilgiris
167
Second National Plant Breeding Congress 2006 Plant Breeding in Post Genomics Era
WHEAT POLYPLOIDS AS A MODEL SYSTEM FOR CROPIMPROVEMENT
Dalmir Singh and P.K.P. Meena
ABSTRACTEvaluation of polyploidy is younger than evaluation of life. It evolved by nature to
suit environment conditions. Obviously, it evolved from low chromosome organism (likebacteria and virus) to organism with high chromosomes (plant and animals). Range ofchromosome number varied from 2n=4, n=2 (Haplopaphus gtracillic and 2n > 1200 insome petridophytes. In nature polyploids are very common. Plants serve majority ofrequirements of not only of human being but also animals which are used by human beingdirectly or indirectly. All these plants complied of diploids and polyploids. The contributionof wheat, cotton, Oat, Tabacum, Sugarbeet, Sugarcane, lilium, turnip, brassica as poliploidcan not ignored. Polyploids can be classified mainly into four different classes,autoplolyploids, alloploiploids, segmental allopolyploids and autoallopolyploids.
In a diploid, one chromosome of each kind will form a set of chromosomesknown as genome so that in a diploid two similar genomes will be present, i.e. AA. Anautotriploid and an autotetraploid will have three doses and four doses of the same genomei.e. AAA and AAAA. If A is equal to 7 chromosomes, a monoploid will have 2n = 7chromosomes, a diploid, 2n = 14 chromosomes, a triploid 2n = 21 chromosomes and atetraploid 2n = 28 chromosomes. In an allopolyploid more than one genomes, each havingsame or different chromosome numbers may be involved. For example, a tetraploid wheathas 2n = 4x = AABB = 28 and hexaploid wheat has 2n = 6x = AABBDD = 42, where A,B and D each genome comprises 7 chromosomes. Today hexaploid wheat is the only polyploidsystem where a maximum number of aneuploids are available. Thanks to Dr. Sears for hismonumental work, for developing and providing such a huge cytogenetical stocks to to thewheat scientists. Before we learn about the details of aneuploids, we must be aware of thedetailed architect of wheats.
Evaluation of wheat from commonancestor
There are several diploid species ofwheat which have been classified into genomeslike AA ( T.monococcum Linn., T. boeoticumBoiss.), BB (Ae. speltoides, T. searsii Feldmanet Kisl.), CC ( Ae. caudate Linn.), DD (Ae.squarossa Linn.) MM (Ae. comosa Sibth etSm), Nn (Ae. unicaritata Vis.), SS (Ae.sharonensis Eig.) and TT (Ae. mutica Boiss).It is suggested that first a wild diploid wheat (AA,2n=14=7II) got crossed with Ae. speltoides(2n=14=7II) and F1 hybrid got amphidiploid(AABB= 2n=28). A mutation for ph gene tookplace in the F1 hybrid resulting the hybrid to haveregular chromosome pairing (forming 14II at
meiosis). Several tetraploid wheat speciesoriginated from the amphidiploid. Subsequently,one of the tetraploid got crossed with anotherdiploid species with DD genome and gave riseto wild hexaploid wheat species with genomeconstitution of AABBDD (2n=42).
Identification of chromosomes belongingto different genomes in T. aestivum.
Crosses were made between differentmono’s (2n-1) and T. dicoccum (AABB)Meiosis of all 21 F1’s was studied. In situationwhen there were 14II+ 6I, the monosomic linewas grouped into D genome. On the contrary,when there were 13II+ 8I, then the monosomicline was grouped into A genome and B genome.
Monosomics belonging to A and B genomesIndian Agricultural Research Institute, New Delhi-110012
168
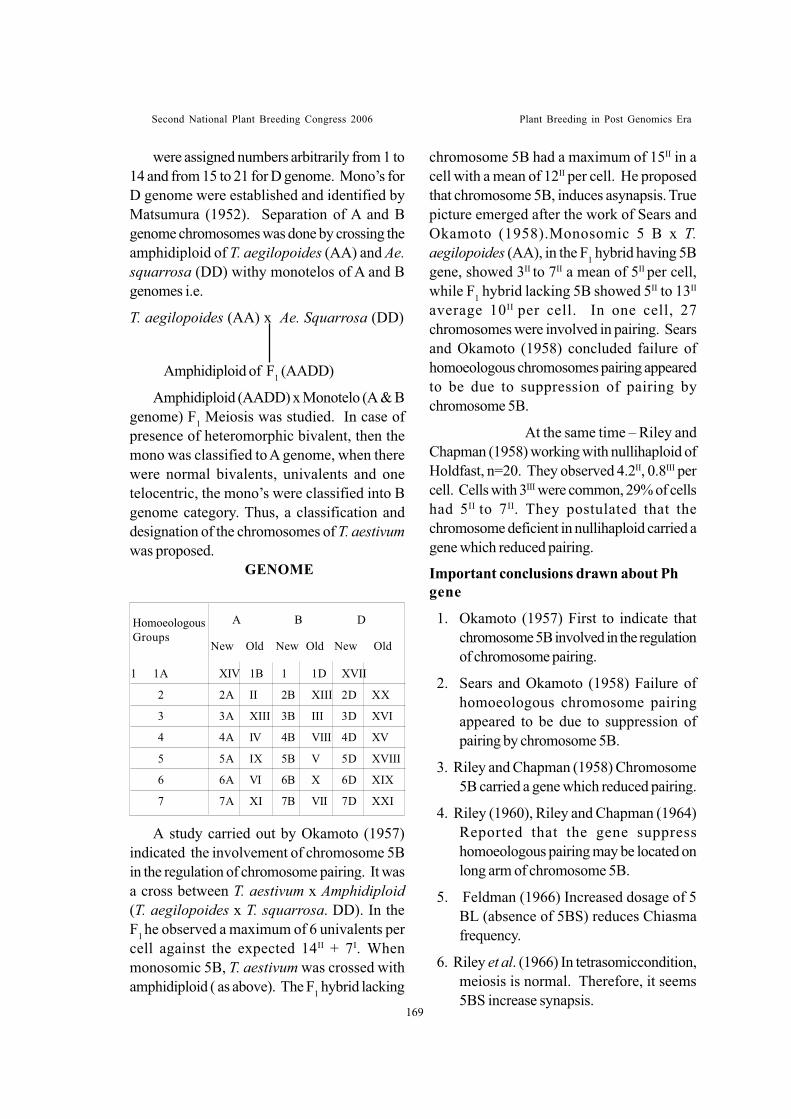
Second National Plant Breeding Congress 2006 Plant Breeding in Post Genomics Era
were assigned numbers arbitrarily from 1 to14 and from 15 to 21 for D genome. Mono’s forD genome were established and identified byMatsumura (1952). Separation of A and Bgenome chromosomes was done by crossing theamphidiploid of T. aegilopoides (AA) and Ae.squarrosa (DD) withy monotelos of A and Bgenomes i.e.
T. aegilopoides (AA) x Ae. Squarrosa (DD)
Amphidiploid of F1 (AADD)
Amphidiploid (AADD) x Monotelo (A & Bgenome) F1 Meiosis was studied. In case ofpresence of heteromorphic bivalent, then themono was classified to A genome, when therewere normal bivalents, univalents and onetelocentric, the mono’s were classified into Bgenome category. Thus, a classification anddesignation of the chromosomes of T. aestivumwas proposed.
GENOME
A study carried out by Okamoto (1957)indicated the involvement of chromosome 5Bin the regulation of chromosome pairing. It wasa cross between T. aestivum x Amphidiploid(T. aegilopoides x T. squarrosa. DD). In theF1 he observed a maximum of 6 univalents percell against the expected 14II + 7I. Whenmonosomic 5B, T. aestivum was crossed withamphidiploid ( as above). The F1 hybrid lacking
chromosome 5B had a maximum of 15II in acell with a mean of 12II per cell. He proposedthat chromosome 5B, induces asynapsis. Truepicture emerged after the work of Sears andOkamoto (1958).Monosomic 5 B x T.aegilopoides (AA), in the F1 hybrid having 5Bgene, showed 3II to 7II a mean of 5II per cell,while F1 hybrid lacking 5B showed 5II to 13II
average 10II per cell. In one cell, 27chromosomes were involved in pairing. Searsand Okamoto (1958) concluded failure ofhomoeologous chromosomes pairing appearedto be due to suppression of pairing bychromosome 5B.
At the same time – Riley andChapman (1958) working with nullihaploid ofHoldfast, n=20. They observed 4.2II, 0.8III percell. Cells with 3III were common, 29% of cellshad 5II to 7II. They postulated that thechromosome deficient in nullihaploid carried agene which reduced pairing.
Important conclusions drawn about Phgene
1. Okamoto (1957) First to indicate thatchromosome 5B involved in the regulationof chromosome pairing.
2. Sears and Okamoto (1958) Failure ofhomoeologous chromosome pairingappeared to be due to suppression ofpairing by chromosome 5B.
3. Riley and Chapman (1958) Chromosome5B carried a gene which reduced pairing.
4. Riley (1960), Riley and Chapman (1964)Reported that the gene suppresshomoeologous pairing may be located onlong arm of chromosome 5B.
5. Feldman (1966) Increased dosage of 5BL (absence of 5BS) reduces Chiasmafrequency.
6. Riley et al. (1966) In tetrasomiccondition,meiosis is normal. Therefore, it seems5BS increase synapsis.
1 1A XIV 1B 1 1D XVII
2 2A II 2B XIII 2D XX
3 3A XIII 3B III 3D XVI
4 4A IV 4B VIII 4D XV
5 5A IX 5B V 5D XVIII
6 6A VI 6B X 6D XIX
7 7A XI 7B VII 7D XXI
HomoeologousGroups
A B D
OldNew Old New Old New
169
Second National Plant Breeding Congress 2006 Plant Breeding in Post Genomics Era
7. Riley (1960) None of the putativeprogenitors possess this gene, it might havearose by mutation.
8. Feldman (1966). The gene is operative insomatic cells also.
9. Riley et al. (1966) It is possible to inducemutations which suppress the effect of 5B.
10.Riley (1966) The homoeologouschromosomes 5A and 5D also excise aregulatory influence over meiotic pairing.
11. Wall et al. (1971) Reported the location ofgene on the long arm of chromosome 5B.
12. Riley and Chapman (1958, 1963) Riley(1966, 1967) Sears (1967), Joshi and Singh(1979) and Singh (1992) Reported thepractical applications of 5B system in wheatimprovement.
13. Riley (1966) It is recessive in nature.
In hexaploid wheat, after the developmentof monosomic nullisomuics by Sears (1954),a large number of aneuploid lines have beenadded which are listed below.
Aneuploidy in polyploids
1. Monosomics (2n – 1)
2. Double monosomics (2n – 1 - 1)
3. Nullisomics (2n – 2)
4. Tetrasomics (2n + 2)
5. Trisomics (2n + 1)
6. Double trisomics (2n + 1 + 1)
7. Telocentrics (2n – 1 chromosome arm) Monotelosomics (2n – 2 + 1 arm) Monotelo disomic (2n-1+1 arm) Double monotelosomics (2n – 2 + 1 arm1 + 1 arm2) Ditelosomics (2n – 2 + 1 arm1 + 1 arm1) Double ditelosomics (2n – 2 + 2 arm1 + 2 arm2)8. Addition lines (alien chromosome)
Mono addition (2n + 1) Diaddition (2n + 2)9. Substitution line (2n) varietal hromosome10. Nullipolyhaploid (n – 1)11. Nullitetra [2n – 2 (1A) + 2 (1B)]
Uses of aneuploids of wheat
Location of dominant gene
To locate dominant gene, identify allthe monosomic plants from the (2n=41) fromthe monosomic lines possessing the trait inrecessive form. Cross the identified monosomicplants (2n=41) as female with the variety inquestion (2n=42) as male. Raise the F1 hybrids.Identify all the monosomic F1 hybridscytologically. All the monosomic (2n=41) anddisomic (2n=42) hybrids will show dominanttraits like the parent in question. Self all themonosomic F1 hybrids and one or two disomicF1 hybrids. Grow the seed obtained frommonosomic and disomic F1 hybrids in the field.Evaluate all the F2 progenies derived frommonosomic and disomic F1 hybrids. All the F2progenies will segregate in a expected ratio of3 dominant: 1 recessive, except one monosomicF2, where all the F2 plants will show dominanttrait. this particular line is referred to as acritical line. Therefore the in question is locatedon this particular chromosome.
Location of recessive gene
To locate recessive gene, it isbetter to take a monosomic series possessingthe trait in dominant condition. Identifiedmonosomic (2n=41) plants are crossed asfemale with the variety in question as maleparent. From F1 hybrids, monosomic (2n=41)F1 hybrids are identified. In this case, all themonosomic and disomic F1 hybrids will showdominant trait except one monosomic F1 hybrid,which will show recessive trait. The criticalmonosomic line can be determined on the basisof monosomic F1 hybrids, but it has to confirmed
170
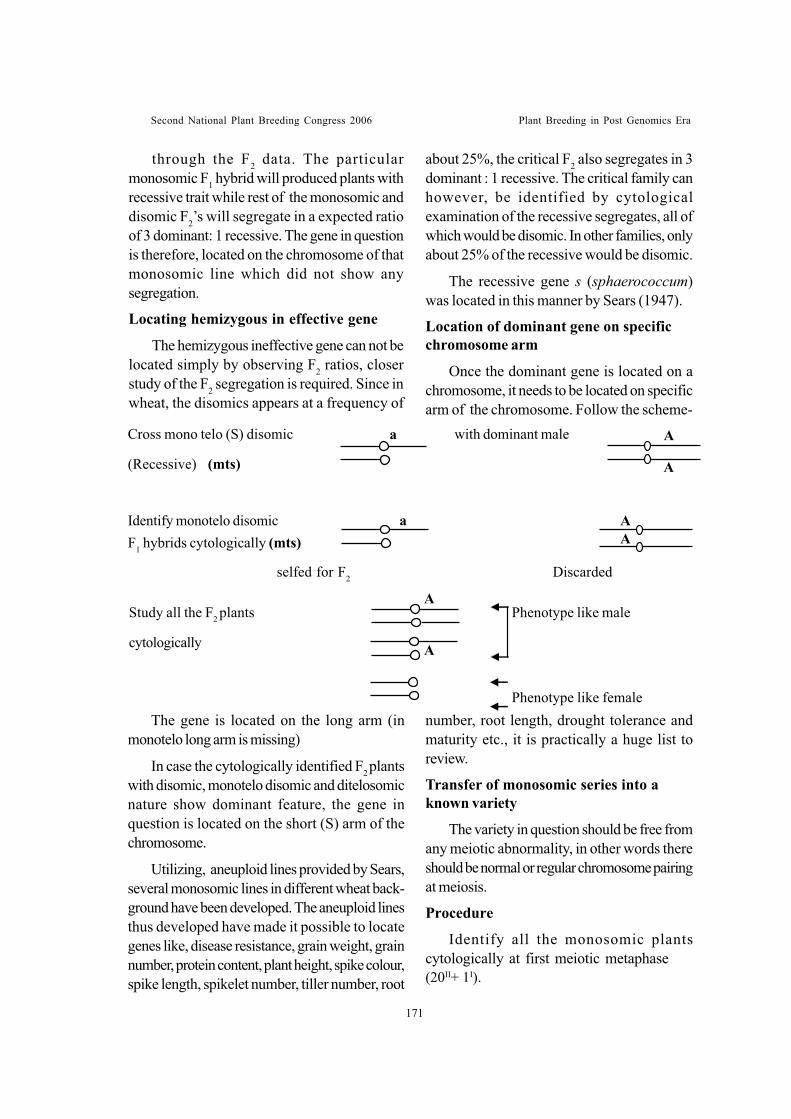
Second National Plant Breeding Congress 2006 Plant Breeding in Post Genomics Era
through the F2 data. The particularmonosomic F1 hybrid will produced plants withrecessive trait while rest of the monosomic anddisomic F2’s will segregate in a expected ratioof 3 dominant: 1 recessive. The gene in questionis therefore, located on the chromosome of thatmonosomic line which did not show anysegregation.
Locating hemizygous in effective gene
The hemizygous ineffective gene can not belocated simply by observing F2 ratios, closerstudy of the F2 segregation is required. Since inwheat, the disomics appears at a frequency of
about 25%, the critical F2 also segregates in 3dominant : 1 recessive. The critical family canhowever, be identified by cytologicalexamination of the recessive segregates, all ofwhich would be disomic. In other families, onlyabout 25% of the recessive would be disomic.
The recessive gene s (sphaerococcum)was located in this manner by Sears (1947).
Location of dominant gene on specificchromosome arm
Once the dominant gene is located on achromosome, it needs to be located on specificarm of the chromosome. Follow the scheme-
Cross mono telo (S) disomic with dominant male A
(Recessive) (mts)
Identify monotelo disomic a AF1 hybrids cytologically (mts) A
selfed for F2 Discarded
Study all the F2 plants Phenotype like male
cytologically
Phenotype like female
A
A
The gene is located on the long arm (inmonotelo long arm is missing)
In case the cytologically identified F2 plantswith disomic, monotelo disomic and ditelosomicnature show dominant feature, the gene inquestion is located on the short (S) arm of thechromosome.
Utilizing, aneuploid lines provided by Sears,several monosomic lines in different wheat back-ground have been developed. The aneuploid linesthus developed have made it possible to locategenes like, disease resistance, grain weight, grainnumber, protein content, plant height, spike colour,spike length, spikelet number, tiller number, root
number, root length, drought tolerance andmaturity etc., it is practically a huge list toreview.
Transfer of monosomic series into aknown variety
The variety in question should be free fromany meiotic abnormality, in other words thereshould be normal or regular chromosome pairingat meiosis.
Procedure
Identify all the monosomic plantscytologically at first meiotic metaphase(20II+ 1I).
A
a
171
Second National Plant Breeding Congress 2006 Plant Breeding in Post Genomics Era
Cross all the mono’s of Var. Chinese springx Variety in question (2n= 42, 21II).
1. Identify 42 and 41 hybrids, backcross41 hybrid x Variety.
2. Identify 42 and 41 hybrids, IInd backcross41 hybrid x Variety
3. Identify 42 and 41 hybrids, 3rd backcross41 hybrid x Variety.
Repeat the procedure upto 6th backcross.After six backcrosses, identify the monosomicplants showing 20II+ 1I at first meiotic metaphase.Like this, monosomics of all the 21 chromosomesare developed.
A last step –test the monosomic lines fortheir trueness. For this cross all the monosomiclines with their respective monotelosomic lines.Correctness of the line can be determined onthe basis of meiosis of F1 hybrids. If at meiosis,a heteromorphic bivalent is present along with20II regulator bivalents, the line is correct. If thissituation is not observed, line is not correct andunivalent shift has taken place. The line has tobe developed again.
Method of substituting a specificchromosome
Using monosomics in hexaploid wheats
Methodology
Identify all the monosomic lines cytologicallyat first meiotic metaphase (2n=41, 20II+ 1I).
1. Cross all the monosomics of Var. Chinesespring (2n=41) x Variety in question(2n=42). Identify monosomic plant fromF1 and self it.
2. Monosomics 1A of Chinese spring x Pollenfrom disomic selfed hybridIdentifymono somic F1 hybrid and self it.
3. Monosomic of Chinese spring x Pollenfrom disomic selfed hybrid.
Continue the backcross till BC6. After 6th
backcross identify a monosomic plant in whichmost of nuclear part will be of var. Chinesespring, with a exception that it will have onechromosome from the variety in question.
This way all the 21 chromosomes of avariety of interest can be substituted in thegenetic background of var. Chinese spring bycrossing all the monosomic lines of var. Chinesespring with the variety of interest. Disomicsubstitution lines can be obtained by selfing themonosomic plants. Critical analysis of thesesubstitution lines can revealed the location ofgene (s) on individual chromosomes in thevariety of interest.
Substitution lines were produced earlierusing varieties Kenya Farmer, Mida andMarquis utilizing monoteloentric method. Usingmonosomics of var. Chinese spring,Swaminathan et al. produced substitution linesof var. Pb.C591.
Wheat varieties, such as Hope, Thatcher,Red Egyptian and Timstein, resistant to stemrust were used to produce substitution lines(Sears et al., 1957). The substitution lines werecompared for stem rust resistance with Chinesespring and the donor resistant varieties. A totalof 9 different substitution lines (Chromosome4B, 1D from Hope, 2B, 3B and 6B fromThatcher, 6A, 2B and 2D from Red Egyptianand 6B from Timstein) were found to beresistant to stem rust.
Transfer of individual wholechromosome
The addition of whole genome did not showmuch improvement except in few cases, it wasthought that addition or substitution of individualwhole alien chromosome might build desiredresults.
A. Alien addition lines
Rye chromosome additions
An amphidiploid (2n=56) involving
172
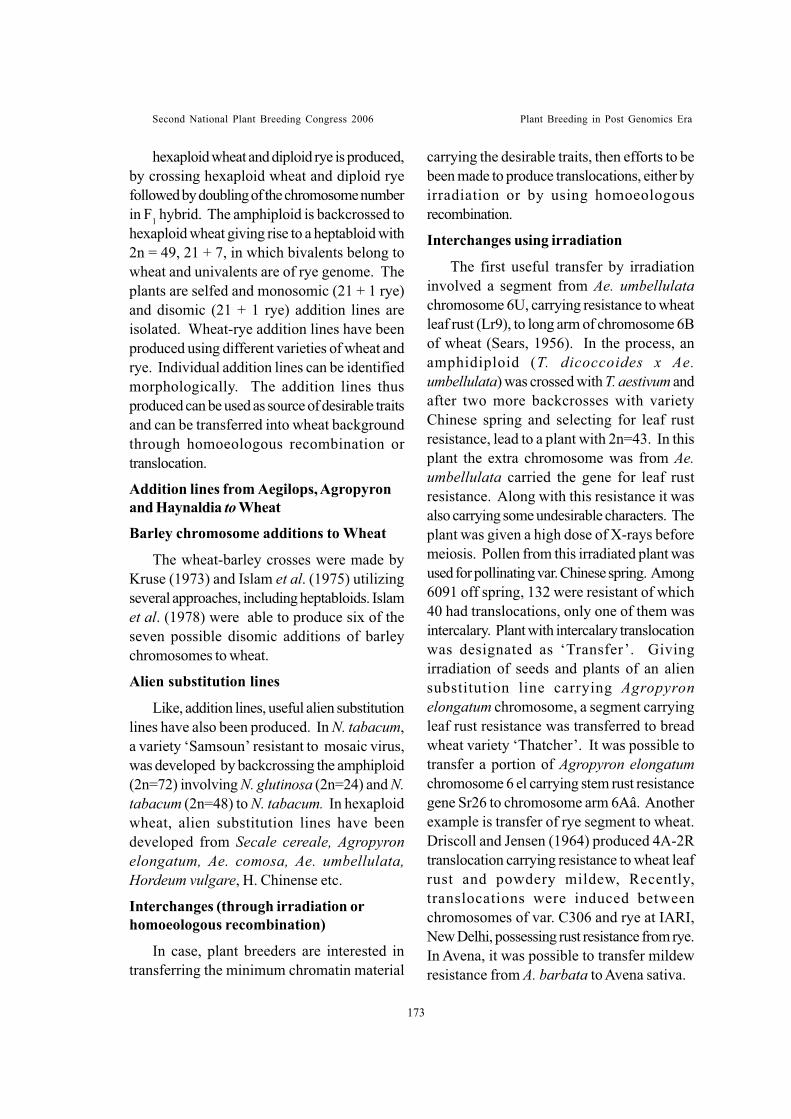
Second National Plant Breeding Congress 2006 Plant Breeding in Post Genomics Era
173
hexaploid wheat and diploid rye is produced,by crossing hexaploid wheat and diploid ryefollowed by doubling of the chromosome numberin F1 hybrid. The amphiploid is backcrossed tohexaploid wheat giving rise to a heptabloid with2n = 49, 21 + 7, in which bivalents belong towheat and univalents are of rye genome. Theplants are selfed and monosomic (21 + 1 rye)and disomic (21 + 1 rye) addition lines areisolated. Wheat-rye addition lines have beenproduced using different varieties of wheat andrye. Individual addition lines can be identifiedmorphologically. The addition lines thusproduced can be used as source of desirable traitsand can be transferred into wheat backgroundthrough homoeologous recombination ortranslocation.
Addition lines from Aegilops, Agropyronand Haynaldia to Wheat
Barley chromosome additions to Wheat
The wheat-barley crosses were made byKruse (1973) and Islam et al. (1975) utilizingseveral approaches, including heptabloids. Islamet al. (1978) were able to produce six of theseven possible disomic additions of barleychromosomes to wheat.
Alien substitution lines
Like, addition lines, useful alien substitutionlines have also been produced. In N. tabacum,a variety ‘Samsoun’ resistant to mosaic virus,was developed by backcrossing the amphiploid(2n=72) involving N. glutinosa (2n=24) and N.tabacum (2n=48) to N. tabacum. In hexaploidwheat, alien substitution lines have beendeveloped from Secale cereale, Agropyronelongatum, Ae. comosa, Ae. umbellulata,Hordeum vulgare, H. Chinense etc.
Interchanges (through irradiation orhomoeologous recombination)
In case, plant breeders are interested intransferring the minimum chromatin material
carrying the desirable traits, then efforts to bebeen made to produce translocations, either byirradiation or by using homoeologousrecombination.
Interchanges using irradiation
The first useful transfer by irradiationinvolved a segment from Ae. umbellulatachromosome 6U, carrying resistance to wheatleaf rust (Lr9), to long arm of chromosome 6Bof wheat (Sears, 1956). In the process, anamphidiploid (T. dicoccoides x Ae.umbellulata) was crossed with T. aestivum andafter two more backcrosses with varietyChinese spring and selecting for leaf rustresistance, lead to a plant with 2n=43. In thisplant the extra chromosome was from Ae.umbellulata carried the gene for leaf rustresistance. Along with this resistance it wasalso carrying some undesirable characters. Theplant was given a high dose of X-rays beforemeiosis. Pollen from this irradiated plant wasused for pollinating var. Chinese spring. Among6091 off spring, 132 were resistant of which40 had translocations, only one of them wasintercalary. Plant with intercalary translocationwas designated as ‘Transfer’. Givingirradiation of seeds and plants of an aliensubstitution line carrying Agropyronelongatum chromosome, a segment carryingleaf rust resistance was transferred to breadwheat variety ‘Thatcher’. It was possible totransfer a portion of Agropyron elongatumchromosome 6 el carrying stem rust resistancegene Sr26 to chromosome arm 6Aâ. Anotherexample is transfer of rye segment to wheat.Driscoll and Jensen (1964) produced 4A-2Rtranslocation carrying resistance to wheat leafrust and powdery mildew, Recently,translocations were induced betweenchromosomes of var. C306 and rye at IARI,New Delhi, possessing rust resistance from rye.In Avena, it was possible to transfer mildewresistance from A. barbata to Avena sativa.
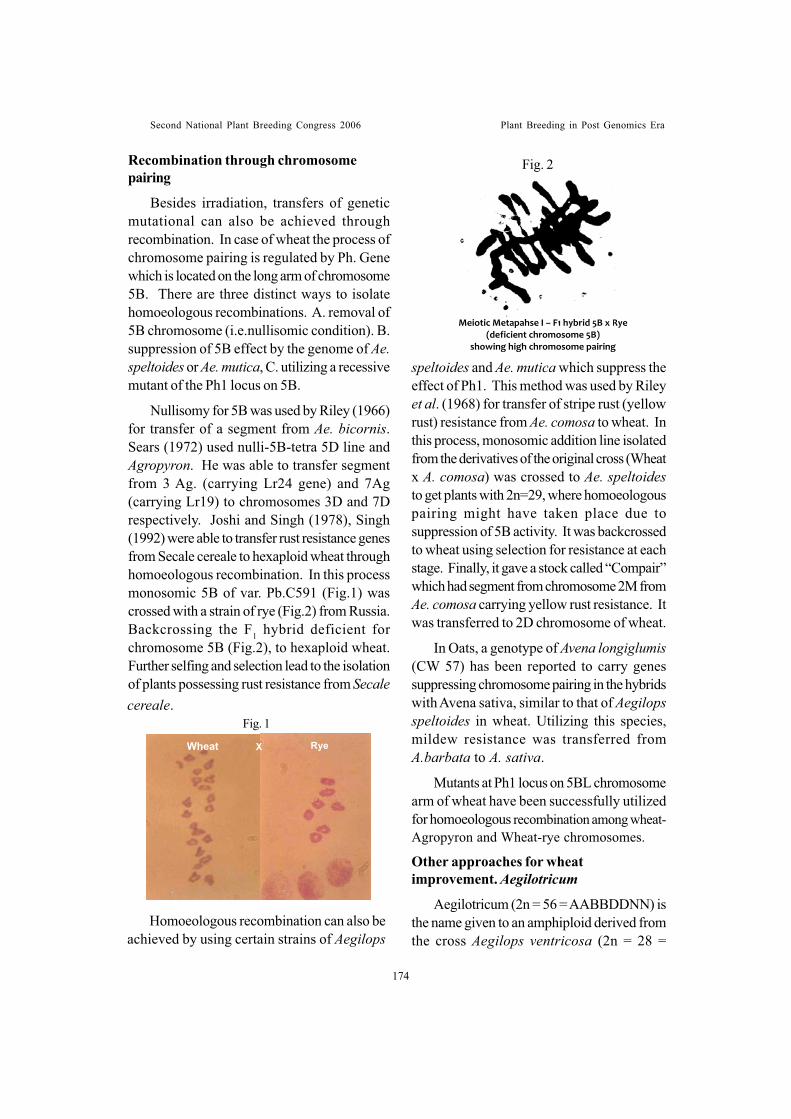
Second National Plant Breeding Congress 2006 Plant Breeding in Post Genomics Era
Recombination through chromosomepairing
Besides irradiation, transfers of geneticmutational can also be achieved throughrecombination. In case of wheat the process ofchromosome pairing is regulated by Ph. Genewhich is located on the long arm of chromosome5B. There are three distinct ways to isolatehomoeologous recombinations. A. removal of5B chromosome (i.e.nullisomic condition). B.suppression of 5B effect by the genome of Ae.speltoides or Ae. mutica, C. utilizing a recessivemutant of the Ph1 locus on 5B.
Nullisomy for 5B was used by Riley (1966)for transfer of a segment from Ae. bicornis.Sears (1972) used nulli-5B-tetra 5D line andAgropyron. He was able to transfer segmentfrom 3 Ag. (carrying Lr24 gene) and 7Ag(carrying Lr19) to chromosomes 3D and 7Drespectively. Joshi and Singh (1978), Singh(1992) were able to transfer rust resistance genesfrom Secale cereale to hexaploid wheat throughhomoeologous recombination. In this processmonosomic 5B of var. Pb.C591 (Fig.1) wascrossed with a strain of rye (Fig.2) from Russia.Backcrossing the F1 hybrid deficient forchromosome 5B (Fig.2), to hexaploid wheat.Further selfing and selection lead to the isolationof plants possessing rust resistance from Secalecereale.
Fig. 1
Homoeologous recombination can also beachieved by using certain strains of Aegilops
speltoides and Ae. mutica which suppress theeffect of Ph1. This method was used by Rileyet al. (1968) for transfer of stripe rust (yellowrust) resistance from Ae. comosa to wheat. Inthis process, monosomic addition line isolatedfrom the derivatives of the original cross (Wheatx A. comosa) was crossed to Ae. speltoidesto get plants with 2n=29, where homoeologouspairing might have taken place due tosuppression of 5B activity. It was backcrossedto wheat using selection for resistance at eachstage. Finally, it gave a stock called “Compair”which had segment from chromosome 2M fromAe. comosa carrying yellow rust resistance. Itwas transferred to 2D chromosome of wheat.
In Oats, a genotype of Avena longiglumis(CW 57) has been reported to carry genessuppressing chromosome pairing in the hybridswith Avena sativa, similar to that of Aegilopsspeltoides in wheat. Utilizing this species,mildew resistance was transferred fromA.barbata to A. sativa.
Mutants at Ph1 locus on 5BL chromosomearm of wheat have been successfully utilizedfor homoeologous recombination among wheat-Agropyron and Wheat-rye chromosomes.
Other approaches for wheatimprovement. Aegilotricum
Aegilotricum (2n = 56 = AABBDDNN) isthe name given to an amphiploid derived fromthe cross Aegilops ventricosa (2n = 28 =
Fig. 2
174
Meeiotic�Metap(deficie
showing�hig
pahse�I�–�F1�hent�chromosgh�chromos
hybrid�5B�xome�5B)�ome�pairing
Rye �
g�
Whheat
�
X RRye
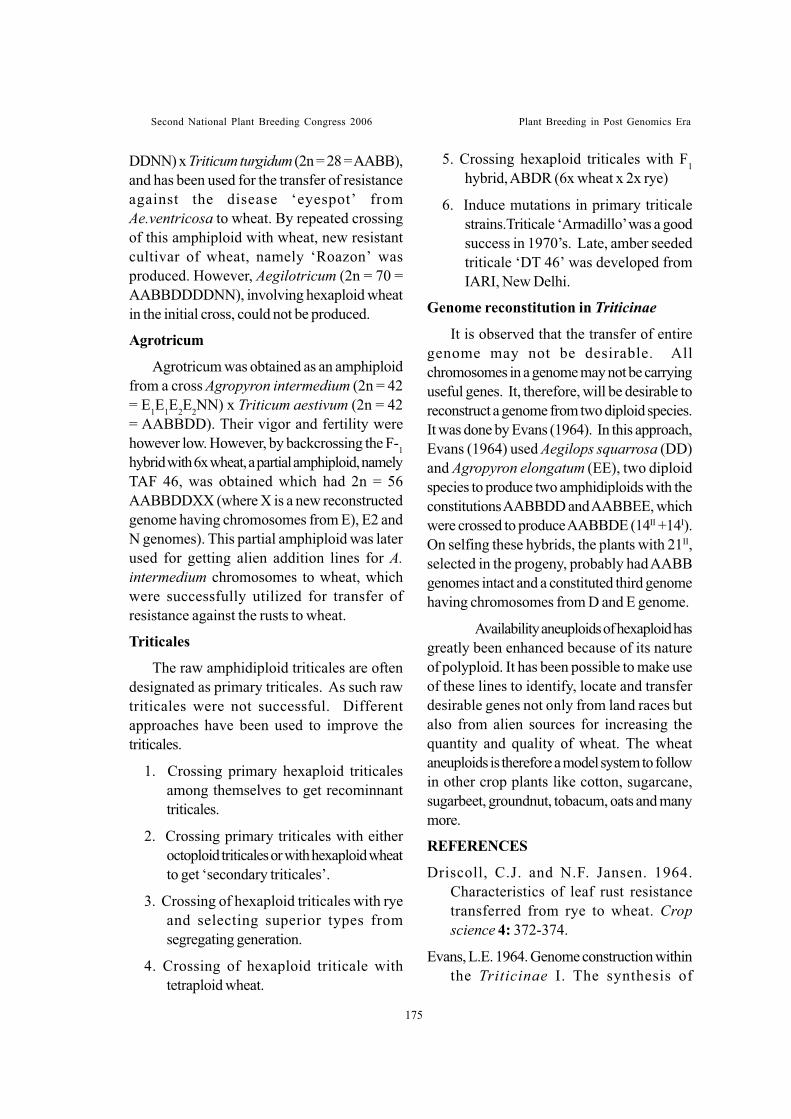
Second National Plant Breeding Congress 2006 Plant Breeding in Post Genomics Era
DDNN) x Triticum turgidum (2n = 28 = AABB),and has been used for the transfer of resistanceagainst the disease ‘eyespot’ fromAe.ventricosa to wheat. By repeated crossingof this amphiploid with wheat, new resistantcultivar of wheat, namely ‘Roazon’ wasproduced. However, Aegilotricum (2n = 70 =AABBDDDDNN), involving hexaploid wheatin the initial cross, could not be produced.
Agrotricum
Agrotricum was obtained as an amphiploidfrom a cross Agropyron intermedium (2n = 42= E1E1E2E2NN) x Triticum aestivum (2n = 42= AABBDD). Their vigor and fertility werehowever low. However, by backcrossing the F-1hybrid with 6x wheat, a partial amphiploid, namelyTAF 46, was obtained which had 2n = 56AABBDDXX (where X is a new reconstructedgenome having chromosomes from E), E2 andN genomes). This partial amphiploid was laterused for getting alien addition lines for A.intermedium chromosomes to wheat, whichwere successfully utilized for transfer ofresistance against the rusts to wheat.
Triticales
The raw amphidiploid triticales are oftendesignated as primary triticales. As such rawtriticales were not successful. Differentapproaches have been used to improve thetriticales.
1. Crossing primary hexaploid triticalesamong themselves to get recominnanttriticales.
2. Crossing primary triticales with eitheroctoploid triticales or with hexaploid wheatto get ‘secondary triticales’.
3. Crossing of hexaploid triticales with ryeand selecting superior types fromsegregating generation.
4. Crossing of hexaploid triticale withtetraploid wheat.
5. Crossing hexaploid triticales with F1hybrid, ABDR (6x wheat x 2x rye)
6. Induce mutations in primary triticalestrains.Triticale ‘Armadillo’ was a goodsuccess in 1970’s. Late, amber seededtriticale ‘DT 46’ was developed fromIARI, New Delhi.
Genome reconstitution in Triticinae
It is observed that the transfer of entiregenome may not be desirable. Allchromosomes in a genome may not be carryinguseful genes. It, therefore, will be desirable toreconstruct a genome from two diploid species.It was done by Evans (1964). In this approach,Evans (1964) used Aegilops squarrosa (DD)and Agropyron elongatum (EE), two diploidspecies to produce two amphidiploids with theconstitutions AABBDD and AABBEE, whichwere crossed to produce AABBDE (14II +14I).On selfing these hybrids, the plants with 21II,selected in the progeny, probably had AABBgenomes intact and a constituted third genomehaving chromosomes from D and E genome.
Availability aneuploids of hexaploid hasgreatly been enhanced because of its natureof polyploid. It has been possible to make useof these lines to identify, locate and transferdesirable genes not only from land races butalso from alien sources for increasing thequantity and quality of wheat. The wheataneuploids is therefore a model system to followin other crop plants like cotton, sugarcane,sugarbeet, groundnut, tobacum, oats and manymore.
REFERENCES
Driscoll, C.J. and N.F. Jansen. 1964.Characteristics of leaf rust resistancetransferred from rye to wheat. Cropscience 4: 372-374.
Evans, L.E. 1964. Genome construction withinthe Triticinae I. The synthesis of
175
Second National Plant Breeding Congress 2006 Plant Breeding in Post Genomics Era
hexaploids (2n=42) having chromosome ofAgropyron and Aegilops in addition to theA and B genome of Triticum durum Can. J.Genet. Cytol.. 6: 19-28.
Feldman, M. 1966 The effect of chromosomes5B, 5D and 5A on chromosomal pairing inTriticum aestivum.. Proc. Natl. Acad. Sci.USA 55:1447-1453.
Islam, A.K.M.R. Shepherd, K.W. and Sparrow,D.H.B. 1975. Addition of individual barleychromosomes to wheat. In: Gaul H. (ed.)Barley Genetics III. (Proc. 3rd Int. BarleyGenet. Symp. Garching), pp. 260-270.
Islam, A.K.M.R., Shepherd,K.W. and Sparrow,D.H.B. (1978). Production andcharacterization of wheat-barley additionlines. In: Ramanujam, S. (ed) Proc. 5th Int.Wheat Genet. Symp. New Delhi, pp.365-371.
Joshi, B.C. and D. Singh. 1978. Introduction ofalien variation into bread wheat. Proc. VthIntl. Wheat Genet. Symp. (India) 1: 342-348.
Kruse, A. 1973. Hordeum X Triticum hybrids.Hereditas 73: 157-161.
Matsumura, S. 1952. Chromosome analysis ofthe Dinkel genome in the offspring of apentaploid wheat hybrid. III. 29Chromosome D- haplosomics and theirrelation to nullisomuics. Cytologia. 17: 35-49.
Okamoto, M. 1957. Asyneptic effect ofchromosome V. Wheat Info. Services. 5: 6.
Riley, R. 1960. The diplodization of polyploidwheat. Heredity. 15: 407-429.
Riley, R. 1966b. The genetic regulation of meioticbehaviour in wheat and its relatives. MackeyJ. (ed). Proc. 2nd Int. Wheat Genet. Symp.Hereditas (Suppl.) 2: 395-408.
Riley, R., and Chapman, V. 1958. Genetic Controlof the cytologically diploid behaviour of
hexaploid wheat. Nature (Lord) 182 : 713-715.
Riley, R., and Chapman, V. 1963. The effectof the deficiency of chromosome V (5B)of Triticum aestivum on the meiosis ofsynthetic amphidiploids. Heredity.18(4):473-484.
Riley, R., Chapman, V. and Belfield, A. M.1966. Induced mutation affecting thecontrol of meiotic chromosome pairing inTriticum aestivum. Nature 211: 368-369.
Riley, R., Chapman, V. and Johnsen, R. 1968.The incorporation of alien diseaseresistance in wheat by genetic interferencewith regulation of meiotic chromosomesynapsis. Genet. Res. 12: 199-219.
Sears, E. R. 1947. The sphaerococcum genein wheat. Genetics 32: 102-103.
Sears, E.R. 1954. The aneuploids of commonwheat. Messouri. Agri. Sta. Res. Bull.572:1-58.
Sears, E.R. 1956. The transfer of leaf rustresistance from Aegilops umbellulata towheat. Brookhaven Symp. Biol. 9:1-22.
Sears, E. R., Loegering, W.Q. and Rodenhiser,H.A. 1957. Identification of chromosomescarrying genes for stem rust resistance infour varieties of wheat. Agronomy Journal49:208-212.
Sears, E.R., Okamoto ,M. 1958 Intergenomicchromosome relationship in hexaploidwheat. Proceedings of the Xth InternationalCongress of Genetics 2: 258-259.
Singh, D. 1992. Mutation and recombinationstudies in wheat and rye. Ann. WheatNewsletter, 38: 119-120.
Wall, A.M., Riley, R. and Chapman, V. 1971.Wheat mutants permitting homoeologousmeiotic chromosome pairing. Genet. Res.18: 311-328.
176
Second National Plant Breeding Congress 2006 Plant Breeding in Post Genomics Era
ROLE OF POLYPLOIDY IN COTTONKhadi, B.M. and Vinita P. Gotmare
ABSTRACTPolyploidy is common in plants and probably has been involved in the evolution of
all Eukaryotes). The genus Gossypium L. is one of the best systems for examining genomeevolution in polyploids, which comprises approximately 50 known species distributed inArid to Semi-arid regions of the Tropics and Subtropics. Out of these 50 known species ofGossypium, 45 species are diploid and 5 allopolyploid falling into eight cytological groupsdesignated as A, B, C, D, E, F, G and K while five allopolyploid species are designatedwith AD genome. A peculiarity among the 50 species identified and described so far inGossypium, four species namely G. arboreum, G.herbaceum, G.hirsutum and G.barbadense are cultivated and remaining all are wild species.. Five natural polyploids ofGossypium species are recognized of which all are allotetraploid bearing A and D genomes(AADD, 2n = 52). These species originated following hybridization between an African orAsian diploid species (Genome AA, 2n = 26), as female with a diploid American pollendonor (Genome DD, 2n = 26). Molecular data suggests that allopolyploid Gossypiumlineage arose about 1-2 million years ago (mya), with divergence of the two progenatordiploid genomes occurring 4-8 mya. Recent studies have clarified many evolutionary aspectsof Gossypium, relationship within and among the eight genome groups, domestication ofthe four cultivated species and the origin of the allopolyploid cottons. Also that chromosometranslocation have not played a role in the divergence of polyploid cottons . The resultinggenomic reunions have led to an array of genetic mechanisms and adaptive response thatare not yet fully understood. An insight of the polyploidy of Cotton will help in understandingits contribution to the ecological success and agronomic potential for its improvement.
Central Institute for Cotton Research, Post Bag No 2, Shankar Nagar P. O., Nagpur-10
Introduction
Polyploidy is common in plants and probablyhas been involved in the evolution of alleukaryotes ( Soltis & Soltis 1992) The cottongenus Gossypium L, is one of the ideal systemfor examining genome evolution in polyploids,which comprises of approximately 50 speciesdistributed in arid to semi-arid regions of thetropics and sub-tropics. Out of these 50 knownspecies of Gossypium, 45 species are diploidand 5 allopolyploid falling into eight cytologicalgroups designated as A, B, C, D, E, F, G and Kwhile five allotetraploid species are designatedwith AD genome. A peculiarity among the 50species identified and described so far inGossypium, four species namely, G. arboreum,G. herbaceum, G. hirsutum and G. barbadenseare cultivated and remaining all are wild species(Endrizzi et al. 1985; Steward 1995 and Wendel
et al. 2003). Five natural polyploid Gossypiumspecies are recognized of which all areallotetraploid bearing A and D genomes (viz.AADD; 2N = 4x = 52). These speciesoriginated following hybridisation between anAfrican or Asian diploid species (genome AA;2n = 26), as female and with a diploid Americanpollen donor (genome DD; 2n = 26) (Percivalet al.1999, Wendel 1995, Wendel et al.1999).Molecular data suggest that the allopolyploidGossypium lineage arose about 1-2 millionyears ago, with divergence of the two progenitordiploid genomes occurring 4-8 million yearsearlier (Seelanan et al. 1997, Wendel and Albert1992). Molecular data suggests thatallopolyploid Gossypium lineage arose about 1-2 million years ago (mya), with divergence ofthe two progenator diploid genomes occurring4-8 mya. Recent studies have clarified many
177
Second National Plant Breeding Congress 2006 Plant Breeding in Post Genomics Era
evolutionary aspects of Gossypium,relationship within and among the eight genomegroups, domestication of the four cultivatedspecies and the origin of the allopolyploid cottons.Also that chromosome translocation have notplayed a role in the divergence of polyploidcottons ( Waghmare et al 2005). The resultinggenomic reunions have led to an array of geneticmechanisms and adaptive response that are notyet fully understood. An insight of the polyploidyof Cotton will help in understanding itscontribution to the ecological success andagronomic potential for its improvement.
Origin and diversification of Cotton
Cotton is unique among crop plants in thatfour separate species were independentlydomesticated for the specialised single-celledtrichomes, or fibres, that occur on the epidermisof the seeds. This parallel domestication processinvolved four species, two from Americas,Gossypium hirsutum and Gossypiumbarbadense and two from Africa-Asia namelyG. arboreum and G. herbaceum. Although allfour cotton species spread beyond their ancestralhomes during the last several millenia, onespecies G. hirsutum has dominated the worldcotton scenario. G. hirsutum has spread fromits original home in Mesoamerica to over 50countries in both hemispheres. G. hirsutum(upland cotton) and G. barbadense (Pima cotton,Egyptian cotton) have polyploidy genomesresulting from a truly remarkable chancebiological reunion among ancestral diploidgenomes that are geographically restricted todifferent hemispheres.
The cotton tribe, which includes eight genera(Fryxell et al. 1992) is different from othermembers of the Malvaceae on the basis ofmorphological features of the embryo, wool andseed-coat anatomy, and by the presence ofgossypol glands also known as punctae orlysigenous cavities widely distributed on the plantbody. Monoploidy of the tribe has been confirmed
using comparative analysis of chloroplast DNArestriction site variation (La Duke and Doebley1995) and DNA sequence data (Seelanan etal. 1997, Wendel et al. 2002, Wendel & Cronn2003). Genus Gossypium in the tribeGossypieae is largest and most widelydistributed containing about 50 species (Fryxell1992) including four domesticated species.These cultivated species are genetically diversebut this diversity is dwarfed by that included inthe genus as a whole whose species belong toboth tropical and sub-tropical regions of theworld. Gossypium is distinguished from otherrelated genera like Lebronnecia,Gossypioides, Cephalohibiscus, Kokia,Hampea, Cienfugosia and Thespeca by acombination of characters including - Undividedstyle, Coriacious capsule containing severalseeds per locule, A somatic chromosomenumber of 26 and Presence of three foliaceousinvolucellar bracts subtending each flower
Recent molecular phylogenetic analysishave demonstrated that the diverse group ofspecies belonging to Gossypium constitute asingle natural lineage (monophylectic group)despite their world-wide distribution andextraordinary morphological and cytogeneticdiversity (Cronn et al. 2002b, Seelanan et al.1997, Wendel et al. 2002) Using sequencedivergence data from the chloroplast gene ndhFand published sequence divergence rates tocalibrate a molecular clock, it was suggestedthat Gossypium branched off from Kokia andGossypioides approx. 12.5 mya with Kokiaand Gossypioides separating some 3 mya(Cronn et al. 2002b). These two genera whichhave now geographically isolated from oneanother by thousands of kilometers of openocean (Kokia from Hawaii and Gossypioidesfrom Madagaskar and East Africa) implies thattrans-oceanic dispersal was evolved in theevolution of one or both genera. Thus,Gossypioides-Kokia examples represent onlythe long distance, oceanic dispersal as a factor
178
Second National Plant Breeding Congress 2006 Plant Breeding in Post Genomics Era
179
in the evolution of the cotton Tribe and thegenus Gossypium (De Joode and Wendel 1992;Wendel and Percy 1990).
Species in the Genus Gossypium
At present, Gossypium includesapproximately 50 species, but new speciescontinue to be discovered from the primarycentres of diversity in tropics and sub-tropics andare grouped as Australian species , African –Asian species and American diploid species. .The wild species of cotton represent an amplegenetic repository for potential exploitation bythe cotton breeders but still remain largelyuntapped genetic resource (Khadi et al. 2003,Kulkarni & Khadi 1998).
Asian-African species
Gossypium consists of fourteen species fromAfrica and Arabia. There are four subsectionsin Gossypium (Fryxell 1992).
1. Senata : G. turfacatum from deserts inSomalia. This species is poorly understoodtaxonomically and cytogenetically andthere is a possibility that it may not belongto Gossypium but to Cienfulgosia due toits unusual feature of dentate leaves.
2. Sub-section Pseudopambak : E-genome,very limited material is available. G.benadirense, G. brichettii, G. volksenii.Cytogenetic characteristics or molecularphylogenetic affinities not yet studied.
3. Cultivated cottons of sub-sectionGossypium, one G. arboreum and G.herbaceum : A genome
4 Sub section Anomalum : B genome speciesF-genome longicalyx.
Australian species
Australian species (Sub-genus: Strata)comprises of 16 named species as well as a newspecies that is yet to be named. They compriseof C- (Sturtia), G-(Hibiscoides) and K-(Grandicalyx taxonomic section) groups with 2,
3 and 12 species respectively.They areherbaceous perennials with a bi-seasonalgrowth pattern whereby vegetative growth diesback during the dry season. Grandicalyx havepedicels that recurve following pollination sothat the capsules are pendent and open invertedat maturity; releasing seeds that bear laisomes,which attract ants. Many of these species arepoorly represented in collections areincompletely understood taxonomically.Molecular phylogenetic analysis have yieldedconflicting results regarding interspecificrelationships in this group (Liu et al. 2000,2001a; Seelanan 1999; Small & Wendel 2000,2002b; Seelanan 1999)
American diploid species
These are the New World D-genomediploids (Table-1) and have been collected andstudied than others and their taxonomy is wellunderstood. Increasing evidences suggest thatG. gossypioides is basal-most . The centre ofdiversity for 13 species of D-genome diploidsis western Mexico, but long distance dispersalshave led to the evolution of G. raimondii inPeru and G. klotzschianum in GalapogasIslands.
Chromosomal evolution and the conceptof genome group
Cytogenetic investigations started as earlyas 1920s and revealed that species inGossypium had haploid chromosomecomplement 13 and 26. Longley (1933)suggested that “a duplication of thechromosomes of an ancestral type for thisdoubled chromosome number 26”. Later, it wassuggested that the species having 26 pairs areallotetraploids and that the ancestral donorsinvolved both wild American species and Asiaticspecies. Allopolyploid nature of the Americantetraploid cotton species emerged from thework of Beasley (1940) and Harland (1940)wherein allotetraploids from A genome (Asiatic)and D genome (American) diploids showed that
Second National Plant Breeding Congress 2006 Plant Breeding in Post Genomics Era
these could form fertile hybrids.
These classical cytogenetic studiesdemonstrated that American tetraploid speciesare true allopolyploids consisting of A and Dgenomes and that D genome is similar to thosefound in the American diploids. A number ofadditional findings support this hypothesis ofallopolyploidy origin of the American tetraploidorigin which include studies of duplicate factorscontrolling morphology, meoitic pairing behaviourin synthetic polyploid, phytochemical analysis,isozyme markers, comparative genetic mappingand comparative analysis of DNA sequences.These studies prove that the allotetraploid speciesformed from hybridization between A and Dgenomes ancestors, most nuclear genes areduplicated in the AD-genome cottons and whenboth copies are isolated and sequenced, theycorrespond phylogenetically and phenetically tothose of A and D genome diploids (Wendel etal. 2002).
Five known allopolyploid Gossypium speciesare diversified and distinct. G. darwinii is nativeto the Galapogas islands where large andcontinuous populations are formed. G.tomentosum has more diffuse populationstructure, occurring mostly as scatteredindividuals. G. mustelinium is restricted to NEBrazil and is an uncommon species. All abovethree are the true wild species whereas theremaining two G. hirsutum and G. barbadensehave been domesticated over a period of time.G.hirsutum is distributed in Central and SouthAmerica, the Carribean and islands in thePacific. G. barbadense is distributed in the Northof South America.
Phylogenetic relationship among thespecies
Recent molecular phylogenetic investigationshave shown the genealogical lineages of thespecies and relationship within and among thedifferent genomic group and geographicaldistribution. Each genome group corresponds to
single natural lineage. (Cronn et al. 2002b)
Phylogenetic history of Gossypium
There exist four major lineages of diploidspecies corresponding to three continents –Australia(C, G, K genome), America(Dgenome), Africa-Arabia (A, B & F genomein one group, and E genome in the other group).New world and Old world diploids arephylogenetic sisters. African F genome, whichconsists only one species G. longicalyx couldbe sister to A genome species. The wild formsare more closely related to the A genomespecies G. arboreum and G. herbaceum. Atthe time of allopolyploid formation, the A andD genomes have merged which represents thereunion of two genomes belonging to differenthemispheres and diverged for millions of yearsin isolation from one another. The lineages ofGossypium were established in relatively rapidsuccession from Kokia – Gossypioides. Thephylogenetic studies suggest that all African –Arabian Cottons comprise a single group.
A lot of variation exists in the views for thedivergence of Gossypium. Gossypium isrelatively ancient and was thought to be evolved60-100mya (million years ago). Recentmolecular data suggest that the earliest split inGossypium has taken place 12 mya (Seelanan1997) and another Cp DNA sequencedivergence data suggests that the genusoriginated 5-15 mya (Cronn et al.). While themaximum likelihood approach to estimate thelineage of diploid cottons suggest that theirdivergence occurred within a span of 2 mya.
Long distance dispersal has played animportant role in the diversification ofGossypium and atleast one dispersal betweenAustralia and Africa and another to theAmerica’s (probably Mexico) has lead to theevolution of the D genome diploids and latercolonization of New World has taken place bythe A genome ancestor of the AD genomeallopolyploids.
180
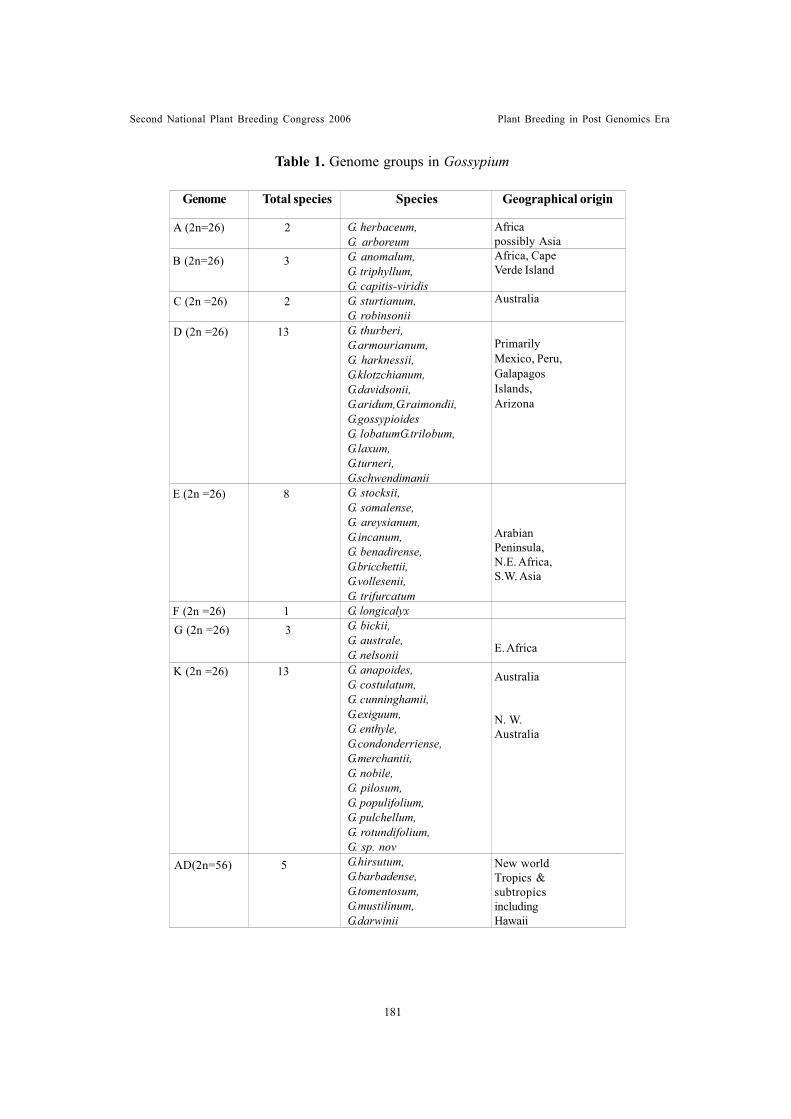
Second National Plant Breeding Congress 2006 Plant Breeding in Post Genomics Era
Table 1. Genome groups in Gossypium
G. herbaceum,G. arboreumG. anomalum,G. triphyllum,G. capitis-viridisG. sturtianum,G. robinsoniiG. thurberi,G.armourianum,G. harknessii,G.klotzchianum,G.davidsonii,G.aridum,G.raimondii,G.gossypioidesG. lobatumG.trilobum,G.laxum,G.turneri,G.schwendimaniiG. stocksii,G. somalense,G. areysianum,G.incanum,G. benadirense,G.bricchettii,G.vollesenii,G. trifurcatumG. longicalyxG. bickii,G. australe,G. nelsoniiG. anapoides,G. costulatum,G. cunninghamii,G.exiguum,G. enthyle,G.condonderriense,G.merchantii,G. nobile,G. pilosum,G. populifolium,G. pulchellum,G. rotundifolium,G. sp. novG.hirsutum,G.barbadense,G.tomentosum,G.mustilinum,G.darwinii
Africapossibly AsiaAfrica, CapeVerde Island
Australia
PrimarilyMexico, Peru,GalapagosIslands,Arizona
ArabianPeninsula,N.E. Africa,S.W. Asia
E. Africa
Australia
N. W.Australia
New worldTropics &subtropicsincludingHawaii
A (2n=26) 2
B (2n=26) 3
C (2n =26) 2
D (2n =26) 13
E (2n =26) 8
F (2n =26) 1G (2n =26) 3
K (2n =26) 13
Genome Total species Species Geographical origin
AD(2n=56) 5
181
Second National Plant Breeding Congress 2006 Plant Breeding in Post Genomics Era
intergenomic hybrids (Hutchinson et al. 1945).The ployploid parentage could be explain withthe help of cytogenetic data combined with theobservations suggesting that the only knownwild A genome cotton is African (G. herbaceumsubsp. Africanum) and that polyploidization hasoccurred following a trans Atlantic introductionto the New World of species similar to G.herbaceum.
As a member of the D genome diploids G.raimondii, from Peru, belongs to Mexicanevolutionary lineage and appears to sharecytoplasm with G. gossypoides. But G.gossypoides genome contains a number ofrepetitive DNA’s that are shared with Agenome species (Endrizzi et al. 1985). As G.gossypoides is the only D genome diploidsthat exhibits evidence of genetic contacts withan A genome plant, it must have acquired theseintrogressant genomic components afterphylogenetic separation from the lineage leadingto G. raimondii (Abdalla et al. 2001, Cronn etal. 1999) Hence, long distance dispersal of Agenome in the New World may have occurredafter G. gossypioides diverged from G.raimondii. This evolutionary history raises thepossibility that the G. gossypioides lineage wasinvolved in the origin of allopolyploid. A-genomeintrogression into G. gossypioides and initialpolyploid formation may have been spaciallytemporarally-associated events (Wendel et al.1995b) But recent analysis of nuclear genesplace G. gossypioides as basal within thesubgenus of, distant from D-genome of theallopolyploids. Thus, there are difference ofopinion for the chloroplast and nuclear genomeswith respect to the relationship between G.gossypioides and G. raimondii and a fullunderstanding of the parentage of polyploids isyet not clear.
Stabilization of Chromosomes andGenomic Interaction in Polyploids
The A and D-genomes of allopolyploid
Long distance dispersal clearly has playedan important role not only in the diversificationof major evolutionary lines but also in speciationwithin Gossypium genome groups. Examplesinclude dispersals from Southern Mexico to Peru(G. raimondii), from Northern Mexico toGalapagos Islands (G. klotzschianum), fromWestern South America to Galapagos Islands (G.darwinii), from Africa to Cape Verde Islands(G. capitis viridis). The origin of Kokia –Gossypioides from a common ancestor suggesta common dispersal mechanism of Oceanic drift.In this respect it is found that seeds of manyspecies of Gossypium are tolerant to prolongedperiods of immersion in salt water. Seeds of G.tomentosum are capable of germination evenafter three years of immersions in artificial saltwater. Seeds of some species may retainbuoyancy for atleast two to three months, whichmay be insufficient for trans oceanic dispersalperhaps in some cases long distance dispersal,may have taken place through natural rafting onfloating debris (Stephens 1966).
Parentage of Alloployploids
Which of the modern species of A and Dgenome diploids best serve as models for theprogenitor genome donors? Over the decades adiverse arrays of tools have been used to solvethis questions. Phylogenetic investigations usingDNA sequencing of homologous genes is thelatest tool. Allometric occurring allopolyploids G.hirsutum and G. darwinii (Stephens 1946) werethe first two to explain the hypothesis ofparentage and it states that either G.klotzschianum its closed relative of G.davidsonii or G. raimondii in combination withG. arboreum would produce a hybrid showingconsiderable similarity to present day New WorldCottons. Addition support for the hypothesis ofG.raimondii as D genome donor emerged fromcomparative analysis of plant habit and shape,floral features and extra floral bract morphologyin synthetic A ´ D amphiploids and fromobservations of lint characteristics and vigour of
182
Second National Plant Breeding Congress 2006 Plant Breeding in Post Genomics Era
Gossypium are more distinct from one anotherthan their diploid progenitors (endrizzi et al.1985) One possibility of genome stabilizationafter polyploidization could be reorganization ofthe two genomes so that they are no longercapable of homeologous pairing. Genetic mapcomparisons showed that two reciprocaltranslocations arose in the diploid lineage afterallopolyploid formation. AllopolyploidGossypium was not accompanied bychromosomal rearrangement (Paterson et al.2000, Wendel & Cronn et al. 2003).
Recent data shows that Chromosome –arm translocations have not played a role inthe divergence of polyploid Cottons and thatone terminal inversion on Chromosome 3appears to differentiate G.tomentosum from G.barbadense (Waghmare et al 2005).
A - genome diploids have twice the DNAcontent per cell as D genome diploids, with acorresponding difference in chromosome size(Endrizzi et al 1985). These differences aremaintained in allopolyploid Gossypium, althoughDNA content is not additive and A genome haschromosome size slightly smaller than those indiploids (Brubaker et al 1999b). Recombinationrates are conserved between A & D diploidgenomes and for a common set of markers,the genetic length of these two genomes differby 6 % and at tetraploid level, the recombinationin the two resident genomes differed by onlyby 5%. Polyploidy has promoted higher ratesof recombination in Gossypium.
The genomic consequences ofallopolyploidy in Gossypiumcould be correlatedto duplication of all nuclear genes and thisduplication is responsible for relaxation,divergence between the duplicated genes andacquisition of new function (Lynch and Conery2000, Otto and Whitton 2000, Zhao et al. 1998).The other possibility of outcome of geneduplication could be that one member of theduplicated gene pair will become silenced and
ultimately degenerate as pseudogene.Duplicated genes may maintain their originalfunction or their function may be distributed .The mechanism that affect gene expression ,evolution and gene silencing for stabilization ofallopolyploids have played a very important role.
Ecological and AgronomicalConsequences of Polyploidization
Polyploidy is often associated with broaderecological amplitude and novel evolutionaryopportunity, mediated by the increased“buffering” capacity afforded by duplicatedgenes and the enhanced vigor resulting fromthe fixed heterozygosity of their duplicatedgenomes. In Gossypium allopolyploidy led tothe established of a new ecological niche. Incontrast to majority of diploid species ,allopolyploid species occur in coastal habitat andamong the five allopolyploid species , two arecompletely restricted to near coastline( G. darwinii & G.tomentosum ) and forG.barbadense and G . hirsutum , wild formsin litoral habitats from Gulf of Mexico, NWSouth America to Pacific Islands (Brubaker andWendel 1994, Fryxell 1979). In case ofallopolyploid Gossypium, this dispersal capacitywas associated with specialization forestablishment in coastal communities. Thus, theallopolyploid could exploit the fluctuating sealevels i.e a new ecological niche.
The agronomic consequence of polyploidyis important as it deals with the fibre. Fourseparate species of Gossypium weredomesticated for their seed hairs, whichevolved only once in the progenitors of all fourcotton species . Earlier Gossypium species hadseed with short seed trichomes and tightlyadherent to the seed . Mature seeds from wildspecies exhibit great diversity in fibre length ,colour and other properties but the earliestdevelopmental stages are similar among allspecies (Applequist et al. 2001) . The fibreelongation terminates about two weeks from
183
Second National Plant Breeding Congress 2006 Plant Breeding in Post Genomics Era
Brubaker, C. L., Bourland, F. M., and Wendel,J. F. (1999a). The origin and domesticationof cotton. In “Cotton : Origin, History,Technology and Production” (C. W. Smithand J. T. Cothren, Eds.), pp. 3-31. Wiley,New York.
Brubaker, C. L., Paterson, A. H., and Wendel,J. F. (1999b). Comparative geneticmapping of allotetraploid cotton and itsdiploid progenitors. Genome 42: 184—203.
Cronn, R. C., Zhao,X., Paterson, A. H., andWendel, J. F. (1996). Polymorphism andconcerted evolution in a tandemly repeatedgene family : 5S ribosomal DNA in diploidand allopolyploid cottons. J. Mol. Evol. 42.685-705.
Cronn. R., Small. R. L., and Wendel. J. F.(1999). Duplicated genes evolveindependently following polyploid formationin cotton. Proc. Natl. Acad. Sci. USA 96.14406-14411.
Cronn, R. C., Small. R. L., Haselkorn, T., andWendel. J. F. (2002b). Rapid diversificationof the cotton genes (Gossypium :Malvaceae) revealed by analysis ofsixteen nuclear and chloroplast genes. Am.J. Bot. 89. 707-725.
Endrizzi, J. E., Turcotte, E. L., and Kohel, R.J. (1985), Genetics, cytogenetics, andevolution of Gossypium. Adv. Genet. 23:271-375.
Fryxell, P. A., Craven, L. A., and Stewart, J.M. (1992). A revision of Gossypium sect.Grandicalyx (Malvaceae), including thedescription of six new species. Syst. Bot.17: 91-114.
Geever, R.F., Katterman. F. R. H., andEndrizzi, J. E. (1998). DNA hybridizationanalyses of a Gosssypium allotetraploidand two closelyrelated diploid species.
anthesis in most of the wild species while in A& F genome diploids it is extended to threeweeks. This prolonged elongation periodrepresents a key evolutionary event in the originof long fibre and it happened prior todomestication. Thus , domestication of the NewWorld Cotton was first precipitated by adevelopmental switch that occurred millions ofyears ago in a different hemisphere. Fibregrowth curves for wild AD genomeallopolyploids are similar to those of the wild Agenome species but the fibre of allopolyploids issuperior than that of cultivated Old Worlddiploids. The genome wide gene duplicationcaused by allopolyploidization provided the rawmaterial necessary for the evolution of novel geneexpression pattern, which subsequently wereexploited by the modern plant breeders ofG.hirsutum and G. barbadense (Jiang et al.1998, Wright et al 1998) . Majority of the lociaffecting the fibre yield and quality are found inthe D genome rather than A genome whichexplains the superiority of the lint of theallopolyploids. Theses studies in turn suggestallopolyplodization provided novel opportunitiesfor agronomic improvement.
REFERENCES
Abdalla, A. M., Reddy, O.U.K., El-Zik, K.M.,and Pepper, A. E. (2001). Genetic diversityand relationships of diploid and tertraploidcottons revealed using AFLP. Theor. Appl.Genet. 102: 222-229.
Applequist, W. L., Cronn, R.C., and Wendel, J.F. (2001). Comparative development of fiberin wild and cultivated cotton. Evol. Dev. 3:3-17.
Brubaker, C.L., and Wendel, J. F. (1994). Re-evaluating the origin of domesticated cotton(Gossypiun hirsutum; Malvaceae) usingnuclear restriction fragment lengthpolymorphisms (RFLPs). Am. J. Bot. 81:1309-1326.
184
Second National Plant Breeding Congress 2006 Plant Breeding in Post Genomics Era
185
Theor. Appl. Genet. 77: 553-559.
Hang. C., Wright, R. J., Woo, S. S., DelMonte,T.A., and Patterson, A. H., (2000). QTLanalysis of leaf morphology in tetraploidGossypium (Cotton).Theor. Appl. Genet.100: 409-418.
Hanson, R. E., Zhao, X.-P., Islam-Faridi, M.N., Paterson, a. H., Zwick, M. S., Crane,C. F., McKnight, T. D., Stelly, D. M. , andprice, H. J. (1998). Evolution ofinterspersed repetitive elements inGossypium (Malvaceae). Am. J. Bot. 85:1364-1368.
Jiang, C., Wright, R., Ei-Zik, K., and Patterson,A.H. (1998). Polyploid formation createdunique avenues for response to selectionin Gosssypium (cotton). Proc. Natl. Acad.Sci. USA 95. 4419-4454.
Khadi,B.M.,Kulkarni,V.N.,AnsighkarA.S.,Singh, V.V. and Gotmare Vinita, (2003)Genepool concept for diploid cultivatedcotton. World Cotton Research Conference–3 held at Cape Town South Africa, 9-13March 2003 pp, 213-225
Kulkarni,V.N. and Khadi, B.M. (1998).Longlinted G.arboreum for meeting textileindustry needs. Proceedings of world cottonresearch conference-2 held at Athens,Greece: 1074-77.
Liu, B., and Wendel, J. F. (2000). Retroelementactivation followed by rapid repression ininterspecific hybrid plants. Genome 43:874-880.
Liu, B., Brubaker, C. L., Mergeai, G., Cronn,R. C., and Wendel, J. F. (2001a). Polyploidformation in cotton is not accompanied byrapid genomic changes. Gemone 43: 874-880.
Lynch, M., and Conery. J. S., (2000). Theevoluationary fate and consequences ofduplicate genes. Science 290: 1151-1155.
Otto, S. P., and Whitton, J. (2000). Polyploidincidence and evolution. Annu. Rev. Genet.34: 401-437.
Paterson, A.H., Bowers, J. E., Burow, M. D.,Draye, X., Elsik, C. G., Jiang, C. –X.,Katsar, C. S., Lan, Y. –R., Ming, R., andWright, R. J. (2000). Comparativegenomics of plant choromosomes. PlantCell 12: 1523-1539.
Percy, R.G., and Wendel, J. F., (1990).Allozyme evidence for the origion anddiversification of Gossypium barbadenseL. Theor. Appl. Genet. 79: 529-542.
Seelanan, T., Brubaker, C. L., Stewart, J. M.,Craven. L. A., and Wendel, J. F. (1999).Molecular systematics of AustralianGossypium section Grandicalyx(Malavaceae). Syst. Bot. 24: 183-208.
Small, R. L., and Wendel, J. F. (2000). Copynumber liability and evolutionary dynamicsof the Adh gene family in diploid andtetraploid cotton (Gossypium). Genetics155: 1913-1926.
Small, R. L., and Wendel, J. F. (2000).Phylogeny, duplication, and intraspecificvariation of Adh sequences in New Worlddiploid cottons (Gossypium L. Malvaceae).Mol. Phyl. Evol. 16: 73-84.
Small, R. L., and Wendel, J. F. (2002).Differential evolutionary dynamics ofduplicated paralogous Adh loci inallotetraploid cotton (Gossypium). Mol.Biol. Evol. 19:597-607.
Soltis, D. E., and Soltis. P. S. (1995). Thedynamic nature of polyploid genomes.Proc. Natl. Acad. Sci. USA 92. 8089-8091.
Waghmare V.N. , J Rong , C Rogers , G JPierce, J F Wendel & AH Paterson (2005)Genetic mapping of a cross betweenG.hirsutum (Cotton) and the Hawaiiendemic , G. tomentosum. Theor. App.
Second National Plant Breeding Congress 2006 Plant Breeding in Post Genomics Era
Genet. 111: 665- 676.
Wendel J F (2000). Genome evolution inpolyploids. Plant Mol. Biol. 42: 225-249
Wendel J F and R. C. Cronn ( 2003) . Polyploidyand the evolutionary history of Cotton.Advances of Agronomy . 78: 139-186
Wright R. J. , Thaxton P.M , El Zik , K. M andPaterson A. H. ( 1998) D-subgenome biasof Xcm resistance genmes in tetraploid
Gossypium (cotton) suggests that polyploidformation has created novel avenues forevolution. Genetics 149: 1987-1996.
Zhao. X.-P., Si, Y., Hanson, R. E., Crane, C.F.,Price, H. J., Stelly, D. M. Wendel. J. F.,and Paterson, A.H. (1998). Dispersedrepetitive DNA has spread to new genomesince polyploid formation in cotton.Genome Res. 8: 479-492.
186
Second National Plant Breeding Congress 2006 Plant Breeding in Post Genomics Era
CRYPTIC GENOMIC EXCHANGE BETWEEN CULTIVATEDSAFFLOWER (CARTHAMUS TINCTORIUS L.) AND WILD SPECIES, C.
GLAUCUS M. BIEB. SUBSP. ANATOLICUS (BIOSS.)Anjani, K1 and M. Pallavi
ABSTRACTPhenotypic traits, meiosis and nuclear DNA (2C) content were investigated in partial
hybrids between cultivated safflower (C. tinctorius L.) and the wild species C. glaucus M.Bieb. ssp anatolicus (Bioss.) to confirm partial hybridity About 2% of F1 plants werepredominantly similar to the female parent C. tinctorius in morphological and phenologicaltraits while the rest were intermediate to both the parents and female-sterile due to cytogeneticabnormalities. The tinctorius-type F1 plants were both male sterile and fertile. In fertilehybrids there were 24 chromosomes forming 10 to 12 bivalents. In F2 and F3 of tinctorius-type F1 plants, partial to fully male sterile and fertile progenies with few distinctlyintermediate traits of both parents as well as fertile progenies with predominantly tinctoriusphenotype have appeared. This indicated that the tinctorius-type F1 plants resulted frompartial hybridization. Nuclear DNA content of parents and tinctorius-type hybrids wasestimated using Partec-PA flow cytometry. DNA content of partial hybrids (2.8-3.08 pg)was close to that of C. tinctorius (2.33 pg) as corresponding to their phenotype. Thenuclear DNA content of male parent C. glaucus ssp anatolicus was quite high (6.31 pg).The phenotype and 2C DNA content strongly suggest that the phenotype and genotype ofpartial hybrids were due to higher contribution of female parent to hybrid. The occurrenceof plants with few intermediate traits among progenies of tinctorius-type hybrid suggestsgenome exchange between male and female genomes. The cryptic genome exchange betweencultivated and wild species in partial hybrids would allow exploitation of wild speciesgenome, when this interpecific cross was a failure due to female-male sterility.
Introduction
Safflower is a multi-purpose crop with wideadoptability. It is now grown for its much-valuededible oil. Safflower (Carthamus tinctorius L.)belongs to the family Compositae or Asteraceae.The genus Carthamus contains approximately25 valid species. Of which, C. tinctorius is theonly cultivated species. Safflower is vulnerableto many diseases and insect pests. Theresistance sources for many biotic stresses areeither not available or extremely narrow withinthe cultivated species. Carthamus speciesremained unexploited and there has been littleresearch on these species. The wild speciesCarthamus glaucus ssp anatolicus (2n=20) isnot readily crossable to C. tinctorius (2n=24)due to chromosomal imbalance. It is a source of
1. Directorate of Oilseeds Research, Hyderabad-500 030, India. Email: anjani_kammili @rediffmail.com
resistance to Fusarium wilt, the major diseaseof safflower. In order to assay the feasibility oftransferring the desirable trait from the wildspecies to cultivated one, the cultivated species(C. tinctoius) as a female was manuallycrossed to C. glaucus M. Bieb. ssp anatolicus.Herein we report on the remarkable featuresdisplayed by interspecific hybrid plants and theirself-derivatives and backcross individuals withregard to phenotypic traits, meioticchromosomal behaviour and nuclear DNAcontent. This paper will discuss the confirmationof partial hybridity and cryptic genomicexchange between the incompatible parentalspecies.
Material and methods
Plant material: The wild species C. glaucus
187
Second National Plant Breeding Congress 2006 Plant Breeding in Post Genomics Era
M. Bieb. ssp anatolicus (Bioss.), 2n=20,received from Institute of Plant Genetics andCrop Plant Research, Germany, was establishedin the field and self-pollinated since 1997 to havetrue-to-types. The recessive genetic male sterilelines MS 107 (R), MS 6 (O) and MS 9 (O) belongto cultivated species C. tinctorius were used asmale sterile female parents in the crossingprogramme. The initial crosses between malesterile C. tinctorius lines and C. glaucus sspanatolicus were made by hand pollination undercontrolled conditions. The two types ofphenotypes observed in F1 were backcrossed toPI 259994-1, a non-genetic male sterile line ofC. tinctorius. Each capsule of female and maleparents was covered with butter paper bag priorto anthesis as well as after pollination to preventcross contamination through honeybee. Fornuclear DNA (2C) estimates, tinctorius-type F1and F2 plants, self-pollinated progeny of theplants of C. glaucus ssp anatolicus and of thefemale parents used in the initial crosses and ofPI 259994-1 used in backcross were taken alongwith three genotypes of C. tinctorius (‘A1’, SFS9943, SFS 2032). ‘A1’ is a variety and SFS 9943and SFS 2032 are highly stabilized pure lines.Diploid chromosome number of each species wasconfirmed prior to interspecific hybridization.Male sterility was assessed in main, primary,secondary and higher order capitula by visualobservation for pollen presence, and bysquashing anthers prior to anthesis in aceto-carmine for stainability of pollen grains undermicroscope. Unstained pollen grains wereconsidered sterile. To study meiosis, floral budswere fixed in Piennar’s fluid. PMC smears werestained with aceto-carmine.
Preparation of nuclear samples:Approximately 0.5 cm square slice of freshlypicked leaf of a plant at rosette stage was usedfor each sample. Crude samples containing nucleiwere prepared from leaf material by chopping itvery finely with a sharp razor blade in 300�l ofCyStain UV Precise P nuclei extraction buffer
and left the suspension for 10 minutes. Thenthe suspension was filtered through filerCellTrics and 1200�l of CyStain UV Precise Pstaining buffer containing 4×-6×-diamidino-2-phenylindole (DAPI), was added to the filtratedsuspension. After 20 to 30 minutes, the stainednuclei were analyzed using Partec-PA flowcytometer equipped with a mercury arc lamp.Fluorescence intensities were registered over500 channels and displayed as histograms. Atleast 5000 nuclei were analyzed per run andeach sample was repeated three to four times.To minimize variation due to runs on differentdays, two samples of ‘A1’ nuclei wereanalyzed each day. The first ‘A1’ sample wasused to set the fluorescence intensity at channel50. The unknown samples as well as theremaining ‘A1’ were then analyzed. The secondsample of ‘A1’ was to determine accuracy. Thedata were, therefore, collected and comparedas fluorescence intensity relative to ‘A1’.Samples giving coefficient of variation (CV)less than 6% were considered for nuclear DNAcount. Since CV of DNA peaks says nothingabout the reproducibility of DNA contentreplicate measurements were taken for eachgenotype. Florescence ratios, relative to thestandard, were used to calculate DNA content(pg) according to the formula 2C DNA content/sample (pg): [Sample Peak mean x StandardDNA content]/Standard Peak mean (Lysak andDolezel 1998). The symbol C corresponds tothe haploid nuclear DNA content. 2C valuerepresents the DNA content of a diploid somaticnucleus.
Results and Discussion
Morphological and Chromosomal studies:C.tinctorius (2n=24) and C. glaucus sspanatolicus (2n=20) belong to two differentchromosomal groups of the genus Carthamusand do not cross readily (Ashri andKnowles1960). The F1 plants of the cross C.tinctorius x C. glaucus ssp anatolicusexhibited intermediate-type and tinctorius-type
188
Second National Plant Breeding Congress 2006 Plant Breeding in Post Genomics Era
189
phenotypes. About 98% of F1 plants wereintermediate to both parental species in theirmorphological and phenological traits and werefemale-male sterile. At the same time, about 2%of interspecific hybrid plants predominantlyresembled C. tinctorius and were both malesterile and fertile. Intermediate-type plants didnot produce seed upon self-pollination,backcrossing to C. tinctorius, sib crossing tofertile tinctorius-type sister plants thus indicatingtheir male-female sterility. The fertile tinctorius-type plants were advanced to F2 and F3 throughself-pollination and sib crossing to sister plants.Sterile tinctorius-type plants were backcrossedto PI 259994-1 (C. tinctorius). In sib-cross,backcross, F2 and F3 generations, about 98% ofthe plants resembled C. tinctorius and about 2%showed a few intermediate traits of both parents.Tinctoius-type plants were observed amongbackcross progeny. Pollen stainability of sterileinterspecific hybrids and the sterile backcrossprogenies has ranged from 0-3.6%. Variation inpollen size and presence of multiple microsporeswere noticed in sterile plants. Pollen grains offertile plants were well stained, uniform in sizeand round in shape. Pairing of chromosomes inintermediate-type F1 plants was not complete.The chromosome number in pollen mother cellsranged from 20 to 22. The mean number ofbivalents per cell was 6 with a range from 0 to 9whereas the mean number of the univalents percell was 11 with a range from 10 to 22.Occurrence of multipolar division, laggards andbridges were also observed. The variation inpollen size and presence of multiple microsporesin sterile intermediate-type plants was in fullaccord with the irregular and multiploardisjunction of chromosomes at anaphase. Thesechromosomal aberrations were responsible forsterility in intermediate-type F1 plants. Theintermediate-type phenotype and formation ofbivalents and chiasmata in these F1 plantsindicate genomic exchange between parentalspecies. Furthermore, chromosome analysis of
tinctorius-type hybrid plants revealed presenceof 24 chromosomes at meiosis instead ofexpected 22 chromosomes. There was perfectpairing of chromosomes in tinctorius-type F1plants and 12 bivalents at diakinesis. There wasan indication of loose pairing between one pairof heteromorphic chromosomes forming rod-shape bivalent, which is an indication of partialnon-homology. In some of the cells,asynchronization of meiotic divisions was seen,where anaphase-II and telophase-II werefound simultaneously in the same cell. Similarchromosomal number and behaviour wasobserved in tinctorius-type F2 and F3 plantsand in recombinant plants that possessed a fewdistinctly intermediate traits of both parents. Theuniform pollen size in them is in full accord withregular chromosome disjunction at anaphase.Chromosome number and behaviour suggestprogressive elimination of chromosomes of C.glaucus ssp anatolicus and spontaneousdoubling of chromosomes of C. tinctoriusduring hybrid embryo development, whichconfigured tinctorius-type plants in F1.Appearance of plants possessing intermediatetraits with 24 chromosomes in F2 and F3 oftinctorius-type F1 plants indicates that C.glaucus ssp anatolicus genome wasdistributed during zygote formation but only apart of it was able to mix with the entire femalegenome prior to elimination of its chromosomesleading to partial hybridization. Genomicexchange between parental species wassupported by presence of 20-22 univalents,laggards, loops and clumps in (F1-tinctoius-typex C. tinctorius) backcross progenies. If therewas no genome exchange between parentalspecies and the only genome of C. tinctoriuspersisted in tinctorius-type F1 hybrids, thereshould be perfect meiosis in backcrossprogenies when they were backcrossed to C.tinctorius. But the meiotic abnormalities inbackcross progenies clearly indicate presenceof genomic variation in tinctorius-type F1 hybrid
Second National Plant Breeding Congress 2006 Plant Breeding in Post Genomics Era
that appeared from cryptic genomic exchangebetween parental species. Elimination ofcomplete set of chromosomes of one species ininterspecific hybridization was also observed inthe interspecific cross between Hordeumvulgare and H. bulbosum (Kasha and Kao1970) and Crepis capillaries x C. neglecta(Wallace and Landgridge 1971). Only very fewwell-documented cases of chromosome doublinghave been reported; for example, theamphidiploid hybrid between Nicotianaglutinosa L. and N. tabacum L. (Clausen andGoodspeed 1925) and chromosome doubling invine cacti hybrids (Tel-Zur et al 2003). Partialhybridization was reported in rice withintrogressed traits from Zizania latifolia (Liuet al 1999), wheat and oat pollinated by maize,between cultivated sunflower and Helianthustuberosus (Natali et al 1998, Faure et al 2002)and cotton interspecific hybrids (Wendel et al1995). Partial hybridization was interpreted as aconsequence of genomic shock (McClintock1984). Why genomic shock was seen only in afew zygotes that produced tinctorius-type partialhybrids is not understood. This is still to beanalyzed but this sort of mild genomic shock isalso possibly important in interspecifichybridization of incompatible species to isolatepartial hybrids having introgressed hiddengenomic part of the eliminated wild species.
Nuclear DNA content: Flow cytometry wasused to determine nuclear DNA content of theparental species and the hybrid plants as it wasfound to be a useful and highly sensitive tool fordetermining nuclear DNA content in many plantspecies (Armuganathan et al.1999, Asif et al.2001, Moscone et al. 2003, Thiem and Sliwinska2003). Flow cytometric analysis of nuclei isolatedfrom leaves showed one peak that correspondsto the G0/G1 phase (2C level) of the cell cycle.Peaks corresponding to the G2+M (M=mitosis)phase or beyond were not detected, indicatingabsence of dividing cells in the material(Figure1). This also validates that flow cytometry
had unambiguously determined the 2n ploidylevel of material studied. The signals occurringin the lower-channel region (0-50) are resultedfrom disrupted nuclei and/or non-specificstaining of other cell constituents. Table1 givesthe nuclear DNA (2C) contents of parentalspecies and partial interspecific hybrids. Thenuclear DNA content varied remarkablybetween parental species. The men nuclearDNA content of C. tinctorius was 2.33 pgand of C. glaucus ssp anatolicus was 6.31pg. Significant variation was not observed inDNA content among various C. tinctoriusgenotypes. ‘A1’ samples were used fordetermining the accuracy. Its DNA content wasin close agreement with that of other genotypesof C. tinctorius. Nuclear DNA content oftinctorius-type partial hybrids was very closeto that of C. tinctorius, ranging from 2.8 to3.08 pg. The CV of analyses was from 4.1 to5.6, which was in acceptable limits for accuracyof the measurements. The close harmonybetween DNA contents of C. tinctorius andpartial hybrids supports the cytogenetic findingsof elimination of chromosomes of C. glaucusssp anatolicus and doubling of C. tinctoriuschromosomes during hybrid embryodevelopment. Because of occurrence of plantswith a few intermediate traits expressed byrecombinants in F2 and F3, it can be attributedthat the minute genomic exchange betweenparental species was responsible for the slightdeviation of DNA content of partial hybrids(2.8-3.08 pg) from C. tinctorius (2.33 pg). The2C DNA content variability among individualpartial hybrids could be due to variation in theamount of genome exchanged between parents.
In conclusion, the present investigationindicates that under controlled pollination, partialhybridization had taken place between C.tinctorius and C. glaucus ssp anatolicusleading to occurrence of interspecific partialhybrids. Appearance of a few recombinants inF2 and F3, proximity of their DNA content to
190
Second National Plant Breeding Congress 2006 Plant Breeding in Post Genomics Era
C. tinctorius with slight deviation and the DNAcontent variability among partial hybrids supportcryptic genomic exchange between parentalspecies as a result of partial hybridization andelimination of chromosomes of wild species asa consequence of genomic shock. The closenessof phenotype as well as DNA content oftinctorius-type F1 partial hybrids to C. tinctoriusand occurrence of intermediate-type plants inF2 and F3 point out that C. tinctorius genomewas contributed maximum and only a part of C.glaucus ssp anatolicus genome was able to mixwith it. The imprecise meiotic behaviour ofbackcross progenies also support the existenceof cryptic genomic exchange that caused partialhomology among backcross progenychromosomes. The proposition of partialhybridization was conclusively proved in thisinvestigation. Partial hybridization phenomenonin many crops when crossed with their wildrelatives was overlooked because most of theplants did not display the expected hybrid patternbut instead resembled the female parent, whichled to the conclusion that the crosses had failed.However, in our experiment this phenomenoncould be established evidently at morphological,cytological and basic nuclear DNA content level.Partial hybridization had allowed us to exploit apart of the wild species genome, when the crossbetween cultivated safflower and wild specieshad apparently failed. Some of the partial hybridsexhibited resistance against Fusarium wilt in wiltsick plot in two contiguous years, indicatingintrogression of wilt resistant genomic part ofC. glaucus ssp anatolicus into cultivatedspecies. So it was possible to transfer thedesirable trait of C. glaucus ssp anatolicus tocultivated safflower through partial hybridization.Work is underway to analyse DNA of theseplants to spot the introgressed or recombinedfragments using various DNA markers, whichwould further support the cryptic genomicexchange between parental species at molecularlevel.
REFERENCES
Armuganathan, K., Tallury, S.P., Fraser, M.L.,Bruneau, A.H., Qu, R.1999. Nuclear DNAcontent of thirteen turfgrass species byflow cytometry. Crop Sci. 39: 1518-1521.
Asif, M.J., Mak, C., Othman, R.Y. 2001.Characterization of indigenous Musaspecies based on flow cytometric analysisof ploidy and nuclear DNA content.Caryologia. 54: 161-168.
Ashri A and Knowles PF.1960. Cytogeneticsof safflower (Carthamus L.) species andtheir hybrids. Agron. J. 52: 11-17.
Clausen, R.E., Goodspeed, T.H. 1925.Interspecific hybridization in Nicotiana. II.A tetraploid glutinosa-tabacum hybrid, anexperimental verification of Winge’shypothesis. Genetics.10: 279-284.
Faure ,N., Serieys, H., Cazaux, E., Kaan, F.,Berville. 2002. Partial hybridization in wildcrosses between cultivated sunflower andthe perennial Helianthus species H. mollisand H. orgyalis. Ann of Bot. 89: 31-39.
Kasha, K.J., Kao, K.N. 1970. High-frequencyhaploid production in barley (Hordeumvulagare L.). Nature. 225: 874-876.
Liu, B., Piao, H.M., Zhao, F.S., Zhao, J.H.,Zhao, R. 1999. Production and molecularcharacterization of rice lines withintrogressed traits from a wild speciesZizania latifolia (Griseb.). J Geneticsand Breeding. 53: 279-284.
Lysak, M.A., Dolezel, J.1998. Estimation ofnuclear DNA content in Sesleria(Poaceae). Caryologia. 51: 123-132.
McClintock B. 1984. The significance ofresponse of genome to challenge. Science.226: 792-801.
Moscone, E.A., Baranyi, M., Ebert, I.,Greilhuber, J., Ehrendorfer, F., Hunziker,
191
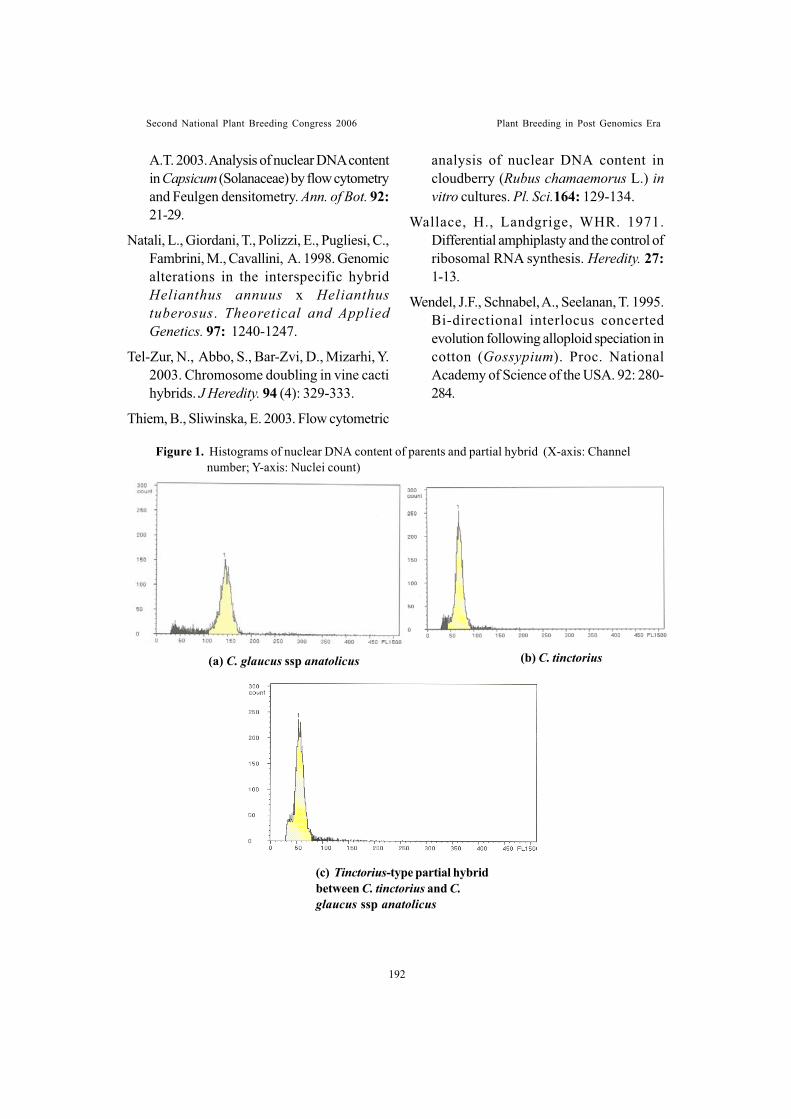
Second National Plant Breeding Congress 2006 Plant Breeding in Post Genomics Era
A.T. 2003. Analysis of nuclear DNA contentin Capsicum (Solanaceae) by flow cytometryand Feulgen densitometry. Ann. of Bot. 92:21-29.
Natali, L., Giordani, T., Polizzi, E., Pugliesi, C.,Fambrini, M., Cavallini, A. 1998. Genomicalterations in the interspecific hybridHelianthus annuus x Helianthustuberosus. Theoretical and AppliedGenetics. 97: 1240-1247.
Tel-Zur, N., Abbo, S., Bar-Zvi, D., Mizarhi, Y.2003. Chromosome doubling in vine cactihybrids. J Heredity. 94 (4): 329-333.
Thiem, B., Sliwinska, E. 2003. Flow cytometric
analysis of nuclear DNA content incloudberry (Rubus chamaemorus L.) invitro cultures. Pl. Sci.164: 129-134.
Wallace, H., Landgrige, WHR. 1971.Differential amphiplasty and the control ofribosomal RNA synthesis. Heredity. 27:1-13.
Wendel, J.F., Schnabel, A., Seelanan, T. 1995.Bi-directional interlocus concertedevolution following alloploid speciation incotton (Gossypium). Proc. NationalAcademy of Science of the USA. 92: 280-284.
Figure 1. Histograms of nuclear DNA content of parents and partial hybrid (X-axis: Channel number; Y-axis: Nuclei count)
(c) Tinctorius-type partial hybridbetween C. tinctorius and C.glaucus ssp anatolicus
(a) C. glaucus ssp anatolicus (b) C. tinctorius
192
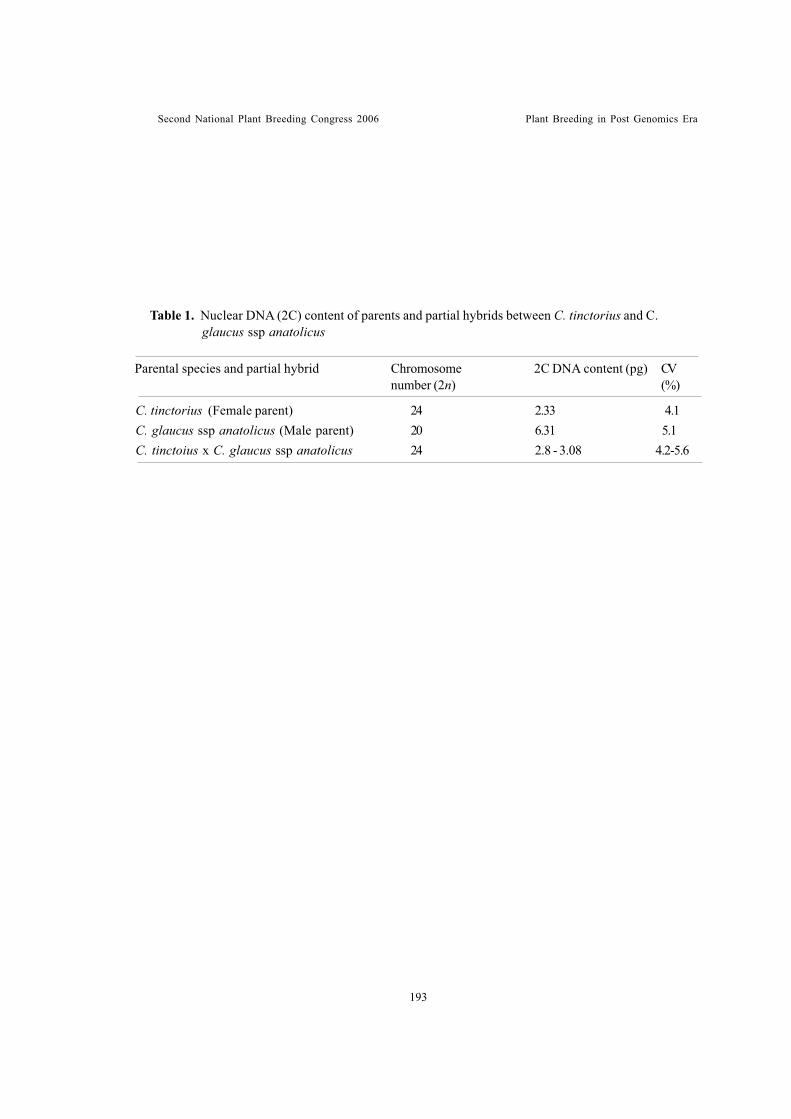
Second National Plant Breeding Congress 2006 Plant Breeding in Post Genomics Era
Table 1. Nuclear DNA (2C) content of parents and partial hybrids between C. tinctorius and C. glaucus ssp anatolicus
C. tinctorius (Female parent) 24 2.33 4.1C. glaucus ssp anatolicus (Male parent) 20 6.31 5.1C. tinctoius x C. glaucus ssp anatolicus 24 2.8 - 3.08 4.2-5.6
Parental species and partial hybrid Chromosome 2C DNA content (pg) CVnumber (2n) (%)
193
Second National Plant Breeding Congress 2006 Plant Breeding in Post Genomics Era
MORPHOLOGICAL, BIOCHEMICAL AND MOLECULARCHARACTERIZATION OF PLOIDY VARIANTS IN COFFEE FOR
GENETIC IMPROVEMENTMishra, M.K.1, M. Violet D’Souza, N. Sandhyarani, S.B. Hareesh, Anil Kumar,
S. R. Mythrasree, R.K. Sabir, A. SantaRam and Jayarama
ABSTRACT
The genus Coffea consists of more than hundred species of which only C. arabica(known as arabica coffee) and C. canephora (known as robusta coffee) are commerciallycultivated. All the species of the genus Coffea are diploids and self incompatible except C.arabica, which is an allotetraploid and self-compatible species. In C. arabica, a series ofploidy variants of spontaneous origin were recovered and documented. In C. canephora,which is a diploid species, colchicine was used successfully to induce tetraploidy. In addition,a few spontaneous triploid plants conforming to either arabica or robusta phenotype werealso recovered. All the ploidy variants were studied for morphological characters such asleaf shape, leaf venation pattern, leaf anatomy, and stomatal features. The biochemicalcharacters such as chlorophyll, starch, carbohydrate, phenol, sugar, amino acid contentand flavonoid profile pattern also have been investigated. Molecular characterization ofall the ploidy variants was carried out by using RAPD and PCR-RFLP and polymorphismwas recorded. These results along with the utilization of the ploidy variants in coffeebreeding program is discussed.
Introduction
The genus Coffea belongs to the familyRubiaceae and consists of over 100 species(Bridson and Verdcourt 1988). All the coffeespecies are diploid except C. arabica, which isa putative allotetraploid. The spontaneousoccurrence of different ploidy levels such ashaploids, hexaploids and octoploids in C. arabicaand other species has been reported by variousworkers (Sybenga 1960; Vishveshwara 1960;Sreenivasan et al1982). Techniques are alsodevised to obtain spontaneous haploids in C.canephora . ( Couturon 1982). In addition, afew spontaneous triploid plants conforming toeither arabica or robusta phenotype were alsodocumented.
Due to the ubiquitous occurrence, polyploidyin higher plants has received maximum attention(Grant 1981; Masterson 1994). For exploitinggenetic potentialities, polyploids and their diploidprogenitors have been compared for diverseaspects like photosynthetic rate, fertility, yield,1. Central Coffee Research Institute, Coffee Research Station – 577117 Dist- Chikmagalur, Karnataka, INDIA
biochemical constituents and moleculardiversity. A perusal of literature reveals thatduplicated genes caused by polyploidy retaintheir original or similar functions or one copymay become silenced (i.e. mutational andepigenetic interactions) and polyploidization willaffect DNA structure, allowing greater diversityat higher ploidy levels (Wendel 2000). Geneticdiversification in polyploids, can therefore, leadto increased polymorphism in nuclear andcytoplasmic markers.
In the present study, severalmorphological, biochemical and molecularaspects of ploidy variants in coffee wereanalysed with an objective to better understandthe influence ploidy on these characteristics.
Materials and Methods
The details of plant materials used inthe present study are given in Table.1. Ploidystatus of all these materials was confirmedthrough chromosome counting (Chinnappa
194
Second National Plant Breeding Congress 2006 Plant Breeding in Post Genomics Era
1968; Sreenivasan et al1982; Mishra et al.(unpublished).
For stomatal measurements the first pair offully expanded leaves were used. A strip of lowerepidermis from the middle portion of the leaf waspeeled off and mounted in glycerol after stainingwith safranin. To determine stomatal guard celllength, 25 randomly selected stomata from fiveleaves per plant were measured microscopicallyusing an ocular micrometer. Similarly, 25randomly selected microscopic field areas fromfive leaves were counted per plant to obtainstomatal and epidermal cell frequency. Forcounting plastids in guard cells the epidermalpeels were stripped and stained in a saturatedsolution of potassium iodide – iodine (I2 K + I)and mounted in glycerol. Counts were made onplastids present in two guard cells of sixty stomataper plant in single plant samples and thirtystomata per plant in other samples. To determinepollen grain diameter, pollen samples werestained in saturated solution of potassium iodide-iodine (I2 K + I) and darkly stained fertile pollengrains were measured by ocular micrometer.Leaf area measurements were carried out using�T area meter. (Delta – T Devices).
For anatomical studies, leaf samples werefixed in FAA and processed following theconventional paraffin methods of Johanson(1940). Serial transections were cut using arotary microtome and sections were stained incrystal violet – Erythrosin and mounted in DPXmountant. For leaf venation patter studies, thirdpair leaves were collected and immersed in 70%ethanol with several changes. Further the leaveswere treated with sodium hydroxide at 400C for12 hours and cleared with a thin brush. Leaveswere further treated with saturated choralhydrate solution. For detail microscopic studies,cleared leaf pieces were stained in safranin andmounted in DPX.
For flavanoid studies, the protocol adaptedby our previous study (Mishra et al.,1998) was
followed. The flavanoid similarity was computedfor pairwise comparison between differentploidy variants using the formula a/a+b wherea= number of spots common to both, and b=collective number of spots exhibited individually.Chlorophyll extraction was carried out from 100mg samples of fully expanded leaves (4th pair)by using DMSO following the method of Hiscoxand Israelstam (1979). Chl a, chl b and totalchlorophyll content were calculated using theformula of Arnon (1949).
Total Carbohydrate was determined in theleaf samples of all the ploidy variants byAnthrone method following the procedure ofHedge and Hofreiter (1962). Sugars and starchwere estimated following the method of Nelson(1944) and Patel (1970) respectively. Themethod of Moore and Stein (1948) was usedfor calculating the total free amino acids andphenolics were analysed following the methodof Malick and Singh (1980).
Genomic DNA was isolated from the freshyoung leaves using the extraction protocol byMurray and Thompson (1990) withmodifications.
PCR amplification using random primers
PCR was carried out in a total volume of25�l Reaction mixture containing in 1x Taqassay buffer with 1.5mM MgCl2,100�MdNTP,0.3�M of the primer (OperonTechnologies) ,50 ng of template DNA. 1U TaqDNA polymerase (Bangalore Genei, 3units/�l).PCR reaction was performed in Palm Cycler(Corbett Research) using the followingamplification profile: 1 cycle of 950C for 4 minfollowed by 40 cycles of 950C for 1 min 380Cfor 1min, 720C for 2 min 1 cycle: and lastly 1cycle of 720C for 10 min. Amplified PCRproducts were electrophoresed on an agarosegel (1.5%) pre stained with Ethidium bromidein 1xTAE buffer and visualized by SyngeneGene snap (UK).
195
Second National Plant Breeding Congress 2006 Plant Breeding in Post Genomics Era
PCR amplification using mitochondria andchloroplast specific primers
Intergenic regions of the chloroplast genome(trnL intron ) were amplified using conesensesprimers (Taberlet et al 1991) . And PCR wasdone according to Dane et al (2004). PCRamplicons were separated on an agarose gel(1.5%) pre-stained with Ethidium bromide in1xTAE buffer and visualized by Syngene Genesnap UK.
Restriction digestion of The GenomicDNA and PCR fragments
PCR products (5-10�l) were digested in areaction mixture (20�l) containing: 2.0�l of 10xAssay buffer, 1mg/ml BSA, Restriction enzyme(Fermentas) 4U at 370C for 2-3 hours. Thedigested DNA was electrophored on 1.5%agarose gel and visualized as described earlier.
Results and Discussion
Leaf area and Pollen grain diameter
Leaf area and pollen grain diameterassociated with various ploidy variants wereanalysed. Distinct differences were observedbetween the diploids and tetraploids of C.canephora and dihaploids and tetraploids of C.arabica (Table 1). However, there is no regularrelation between leaf area and other ploidy levels.In contrast it is interesting to note that there wasa progressive increase in pollen grain diameterwith the increase in ploidy level (Table.1). Indihaploid of C. arabica and diploid of C.canephora, the pollen grain diameter was foundto be almost same indicating the less importanceof genomic constitution affecting this trait incoffee (Sreenivasan et al., 1992). Gould (1957)and Speckmann et al. (1967) also observed apositive correlation with pollen grain diameterand ploidy level in Andropogon and Brassicarespectively and the present observation lendssupport to their views.
Stomatal characteristics
The mean stomatal and epidermal cell
frequency, stomatal guard cell length andstomatal plastid number were calculated atdifferent ploidy levels and data are presentedin Table1. In both C. arabica and C.canephora, the stomatal and epidermal cellfrequency decreased while stomatal guard celllength increased with an increase in ploidy level.However, no significant difference in stomatalfrequency could be found between thehexaploid and octoploid levels although the meanepidermal cell frequency was significantlydifferent. The reduction in stomatal andepidermal cell frequency at higher ploidy levelwas attributed to the larger stomatal andepidermal cell size as well as reduced stomataldifferentiation at higher ploidy level (Mishra etal. 1991; Sreenivasan et al. 1992; Mishra,1997).
The mean number of plastids in stomatalguard cells at different ploidy evels was countedand progressive increase in plastid number wasobserved with the increase in ploidy level(Fig1.J-K) except at the octoploid level wherethe plastid number decreased compared to thehexaploid level (Table1). No significantdifferences in plastid number were observedbetween dihaploid of C.arabica (9.05) andnatural diploids of C. canephora (8.75) as wellas tetraploids of C.arabica (15.96) and C.canephora (15.29). This clearly suggested thatthe plastid number is directly related to thechromosome number rather than genomicconstitution (Sreenivasan et al.1992). Thesame conclusion was also drawn by Bingham(1968) in alfalfa and by Krishnaswami andAndal (1978) in Gossypium.
Foliar anatomy and venation pattern
Various anatomical characters wereanalysed in the different ploidy groups andpresented in table 2. From the table it isapparent that although the basic anatomicalstructure is same at different ploidy levels, thereis a progressive increase in majority of the
196
Second National Plant Breeding Congress 2006 Plant Breeding in Post Genomics Era
197
anatomical features viz., lamina thickness,vertical extent of palisade tissue, diameter ofpalisade cells, thickness of spongy tissue, numberof layers in spongy parenchyma and diameterof spongy cells. In C. arabica and inC .canephora the lamina thickness, verticalextent of palisade tissue, spongy tissue increasedprogressively with the increase of ploidy level(Fig1.A- 1I ) Suryakumari et al. (1989) observedsimilar tendency of increase in thickness ofpalisade, diameter of palisade, thickness ofspongy parenchyma and lamina thickness inpolyploids compared to diploids and the presentobservation is in agreement with their report.
The leaf venation pattern was studied atdifferent ploidy levels of Coffea. In general, thethickness of the 1Ú, 2Ú, and 3Ú veins increasedwith the increase of ploidy level (Fig1C, 1F, 1I).At higher ploidy level, the areoles were smalland the vein islets inside the areoles areextensively branched and very close to eachother. The small areoles with extensive vein isletsis proposed to be advantageous in waterconductions during stress conditions (Mishraet al. communicated). In field conditions,generally coffee polyploids (Hexaploids andoctoploids of arabica and tetraploids of robusta)retain the full leaf complements and remain greenduring the drought conditions. Therefore thisanatomical feature could be of adaptivesignificance in combating drought conditions.
Biochemical characteristics
Chlorophyll content
In coffee, total chlorophyll content generallydecreased with the increase of ploidy levelalthough significant differences were not seenin few cases (Mishra et al.1996). Dihaploidarabica contain the highest chlorophyll (1.76 mg/g) where as octoploid manifested the leastchlorophyll (1.18 mg/g) among the ploidyvariants. (Table 3a) However, in C. canephora,chlorophyll content of diploid (1.785 mg/g) andtetraploid (1.497mg/g) shows significant
differences. Contrasting reports are availableregarding the effects of polyploidy on chlorophyllcontent in many plant species. In tall fescue,chlorophyll/ mg/g fresh leaf tissue increasedwhereas in winter rye chlorophyll contentdecreased (Bordyugova, 1987) with increaseof ploidy level. In contrast to the foregoing, anascending order in chlorophyll content per unitleaf area was registered with increase in ploidylevel (Table 3b). Leaf thickness was found tobe strongly correlated with per unit areachlorophyll content (Leverenz, 1987). In Coffeaincrease in leaf thickness from dihaploid tooctoploid level was reported (Prakash et al.1993). Hence the observed increase inchlorophyll value per unit leaf area could bedue to the influence of leaf thickness.
Starch, carbohydrate and sugar content
The percentage of total carbohydrate,starch and sugar content in different ploidy levelof Coffea was studied and the same is given intable 4. However no consistent pattern wasobserved among all the ploidy variants. In C.arabica, the percentage of total sugar, starchand carbohydrate increased from dihaploid totetraploid level but decreased at the hexaploidand octoploid level. Among arabica ploidyvariants, except in triploid, which is of hybridorigin, maximum percentage of sugar,carbohydrate and starch were observed attetraploid level. However in C. canephora,the per cent of total sugar and carbohydratedecreased and starch content increased fromdiploid to tetraploid level (Table 4). This clearlysuggests that not only ployploidy affect differentphysiological parameters differently but alsodepend upon the genotype.
Phenols and Amino Acids
The phenol and amino acid content wasstudied at various ploidy levels and data ispresented in table 4. It is observed that amongploidy variants of arabica octoploid containshighest phenol and lowest amino acids where
Second National Plant Breeding Congress 2006 Plant Breeding in Post Genomics Era
as in C. canephora, phenolic content increasedand amino acids content decreased from diploidto tetraploid level. In C. arabica, tetraploidscontain the maximum amino acid content thanany other ploidy variants. This observation furtherstrengthens the contention that in plantspolyploidy affect different physiological andbiochemical constituents differentially in variousgenotypes.
Flavonoids
Leaf flavanoids were isolated from variousploidy levels of coffee. A qualitative differencein flavanoid pattern was observed among themembers. Among arabica ploidy variants,dihaploids exhibit the minimum and tetraploidsexhibit the maximum flavanoid profile patterncompared to any other group (data not shown).Most of the flavanoid spots observed in thedihaploid were encountered in tetraploid. Inaddition to the above, tetraploid group containadditional spots those are not seen in dihaploid.The hexaploid and octoploid group displayed lessnumber of spots compared to tetraploid group.Mishra et al. (1993) explained that flavanoidbiosynthesis efficiency reached its maximum attetraploid level and beyond that there is noincrease. Interestingly, most of the flavanoidspots observed in hexaploids were alsoencountered in tetraploid group, which supportsthe hypothesis of autoallopolyploid origin ofhexaploid. Based upon the flavonoid similarityindex value, dihaploids of arabica was found tobe closer to the octoploid group (Table 3a). Lossof duplicate gene expression has beendemonstrated in polyploid crop including Triticumand Chenopodium (Hart 1983; Wilson et al.1983) and if so there may be a chance of genesilencing involving the loss of duplicate geneexpression at higher ploidy level.
In C. canephora, variation in flavanoidprofile pattern was observed between the diploidand tetraploid group. Based on the similarityindex value diploid was found close to colchicines
induced tetraploid than natural tetraploid (Table3b). This could be ascribed to the origin oftetraploid and their genomic constitution(Saraswathi et al .1991).
Molecular analysis
RAPD
Random amplified Polymorphic DNAanalysis was initiated to find out thepolymorphism among ploidy variants. UsingOperon primer (GGGTAACGCC)polymorphism was noticed among the samples.(Fig 2A). In C. canephora, two bands whichare present in diploid were missing in tetraploid.This missing bands in tetraploid could beexplained either due to the alteration or theelimination of the particular sequence duringgenome duplication. The RAPD data furtherrevealed the close similarity between thetetraploid and hexaploid of S.795 and Sarchimorand thereby further strengthening our contentionthat hexaploids in coffee are of autoallopolyploidin origin. In addition, a close similarity wasobserved between the two triploids of coffeeand thereby supporting the close affinitybetween them. However more primers needto be screened for molecular evaluation ofploidy variants in coffee.
Chloroplast and Mitochondrial DNAanalysis
The consensus primer pair of the trnL intron(Taberlet,1991) successfully amplified thecorresponding cpDNA region in all the ploidyvariants (Fig 2B). Although the amplified DNAfragment seemed to be the same in size, theintensity of the bands were less in Sarchimortetraploid and hexaploid and natural octoploidindicating the possibility of low copy number inthese ploidy variants. Restriction digestion ofthe PCR product with enzyme AluI revealedpolymorphism among the ploidy variants (Fig2C). Variations in cpDNA are known to haveevolutionary significance and therefore the
198
Second National Plant Breeding Congress 2006 Plant Breeding in Post Genomics Era
observed variation in cpDNA among the ploidyvariants could be associated with ecologicaladaptation during evolutionary process.
The consensus primer pair of the mt-nad1B– nad 1C region of the mitochondrial genome(Demesure et al. 1995; Dumolin et al. 1997)amplified the corresponding mtDNA region inall the ploidy variants except the tetraploid plantsof Kents, S.795 and Sarchimor and hexaploid ofSarchimor (Fig 2D). Repeated attempts toamplify the mtDNA in these samples failedwhich indicate the possibility of sequencedivergence in mitochondrial genome in thoseploidy variants. Although the PCR amplifiedDNA fragments seemed to be the same in sizebut there were differences in copy number, whichfurther suggests the gene diversification duringevolution.
Polyploids and coffee breeding
Unlike other crops, the utilization of polyploidsin coffee breeding is meagre. This is probablybecause of the perennial nature of the plant andenormous time that usually takes to release acoffee variety. However recently, research wasfocussed on utilizing the polyploids in coffeebreeding. As a first step, a natural triploid ofCoffea canephora was crossed with arabicatetraploid and hybrid plants with both arabicaand canephora phenotypes were recovered(Amaravenmathy et al. 2004). Individual F1plants were selfed and progenies were currentlyevaluated for various characteristics.
Conclusion
Polyploidy or the doubling of chromosomeis a wide spread phenomenon in plants. Due toits ubiquitous nature, polyploidy is the subject ofintense research by various workers. In plants,polyploidy may be advantageous ordisadvantageous depending on their effects. Inthe foregoing as we have observed, in coffee,polyploidy has differentially affected severalfeatures in different genotypes. In coffee (C.
arabica) tetraploid level seems to be theoptimum level as revealed by variousmorphological and biochemical characteristics.Our hypothesis is supported by the fact thattetraploids are commercially cultivated whereinthe physiological and biochemical functions havereached their efficiency. However haploids incoffee are important as they can be exploitedto obtain the homozygous plants for bothbreeding and molecular studies. Similarly,hexaploids and triploids are also important asthey form the important breeding material forcoffee genetic improvement. A completeanalysis of organelle DNA will probably givemore information on the nature of ploidy variantsin coffee and give insight to their evolutionaryand adaptive significance.
REFERENCES
Amaravenmathy, V.S., Kumar, A., Santaram,A., Srinivasan, C.S . 2004. Robusta-likeCoffee plants with Arabica-like Cup quality-Myth or Possibility? ASIC 20th Bangalore1165-1170.
Arnon, P.I.1949. Copper enzymes in isolatedchloroplasts, Polyphenol oxidase in Betavulgaris L. Plant Physiol. 24:1-15
Bingham, E.T.1968. Stomatal chloroplast inalfalfa at four ploidy levels. Crop Science8: 509-511.
Bordyugova, E.D. 1987. Effect of polyploidyon chlorophyll content of the leaves inwinter rye. In: Novoe V Selektsii i.Seminovodstve selskokokhozyaibrstvennykh kul’ tur. Kamennaya step; USSR84-90.
Bridson, D.M. and Verdcourt, B. 1988. Floraof tropical east Africa- Rubiaceae (part2)Polhill R M (Ed) 727p.
Chinnappa, C.C. 1968. Interspecific hybrids ofCoffea canephora x C. arabica CurrentScience. 37: 676-677.
199
Second National Plant Breeding Congress 2006 Plant Breeding in Post Genomics Era
Couturon, E. 1982. Obtention d’ haploidsspontanea de Coffea canephora Pierre parutilisation du greffage d embrynos CaféCacao The (Paris) 30: 155-160.
Dane, F., Lang, P., Bakhtiyarova, R. 2004.Comparative analysis of chloroplast DNAvariability in wild and cultivated Citrullusspecies. Theor and Appl Genetics. 108:958–966
Demesure, B., Sodzi, N., Petit, R. J. 1995. A setof universal primers for amplification ofpolymorphic non-coding regions ofmitochondrial and chloroplast DNA in plants.Mol. Ecol. 4: 129-131.
Dumolin, S., Pemonge, M., Petit, R. 1997. Anenlarged set of consensus primers for thestudy of organelle DNA in plants. Mol Ecol.6: 393-397.
Gould, F.W. 1957. Pollen size as related topolyploidy and speciation in Andropogonsaccharoides A barbinodis complex.Brittonia. 9: 71-75.
Grant, V. 1981. Plant speciation, 2nd edition.Columbia University Press, New York.
Hart, G.E . 1983. Genetics and evolution ofmultilocus isozymes in hexaploid wheat. Inisozymes Current topics in Biologicalresearch. Vol.10: 365-380, M.C. Rattazi etal(eds.) Liss, New York.
Hedge, J.E, Hofreiter, B.T. 1962. CarbohydrateChemistry 17 (Eds Whistler. R. L. and BeMiller, J.N) Academic Press New York.
Hiscox, J.D., Israelstam, G.F.1979. A method forthe extraction of chlorophyll from leaf tissuewithout maceration. Can. J. Bot.57: 1332-1334.
Johanson, D.A. 1940. Plant Microtechnique.McGraw-Hill, New York.
Krishnaswamy, R., Andal, R. 1978. Stomatal
chloroplast number in diploids and polyploidsof Gossypium. Proc. Indian Academy ofScience 87B . Plant Science.109-112.
Leverenz, J.W. 1987. Chlorophyll content andthe light curve of shade adapted coniferneedles. Physiol. Plant. 71: 20-29.
Malick, C.P., Singh, M.P. 1980. PlantEnzymology and Histo EnzymologyKalyani Publishers, New Delhi p 286.
Masterson, J. 1994. Stomatal size in fossil plants:evidence for polyploidy in majority ofangiosperms. Science. 264: 421-424.
Mishra, M.K. 1997. Stomatal characteristicsat different ploidy levels in Coffea L.Annals of Botany. 80: 689-692.
Mishra, M.K., Padmajyothi, D., Prakash, N.S.,Sreenivasan, M.S.1993. Leaf flavanoidprofiles in different cytotypes of Coffeaarabica L . Journal of Plantation Crops21 ( supplement): 258-263.
Mishra, M.K., Padmajyothi, D., .Prakash, N.S.,Srinivasan, C.S., Naidu, R. (1998)Comparative leaf flavonoid profiles ofnatural and induced purpurascens mutantsof Coffea arabica . Journal of PlantationCrops 127-132.
Mishra, M.K., Prakash, N.S., Sreenivasan,M.S. 1991. Relationship of stomatal lengthand frequency to ploidy level in Coffea L.Journal of Coffee Research. 21: 32-41.
Mishra, M.K., Ram, A.S., Prakash, N.S., Jyothi,D.P., Sreenivasan, M.S. 1996. Polyploidyand chlorophyll content in Coffea L. IndianJournal of Forestry. 19(3): 241-243.
Moore, S., Stein, W.H. 1948.: Methods inEnzymology (Eds, Colowick, S. P andKaplan, N.D) Academic press New york3468.
Murray, M., Thompson, W.F. 1980. Rapidisolation of high molecular weight plant
200
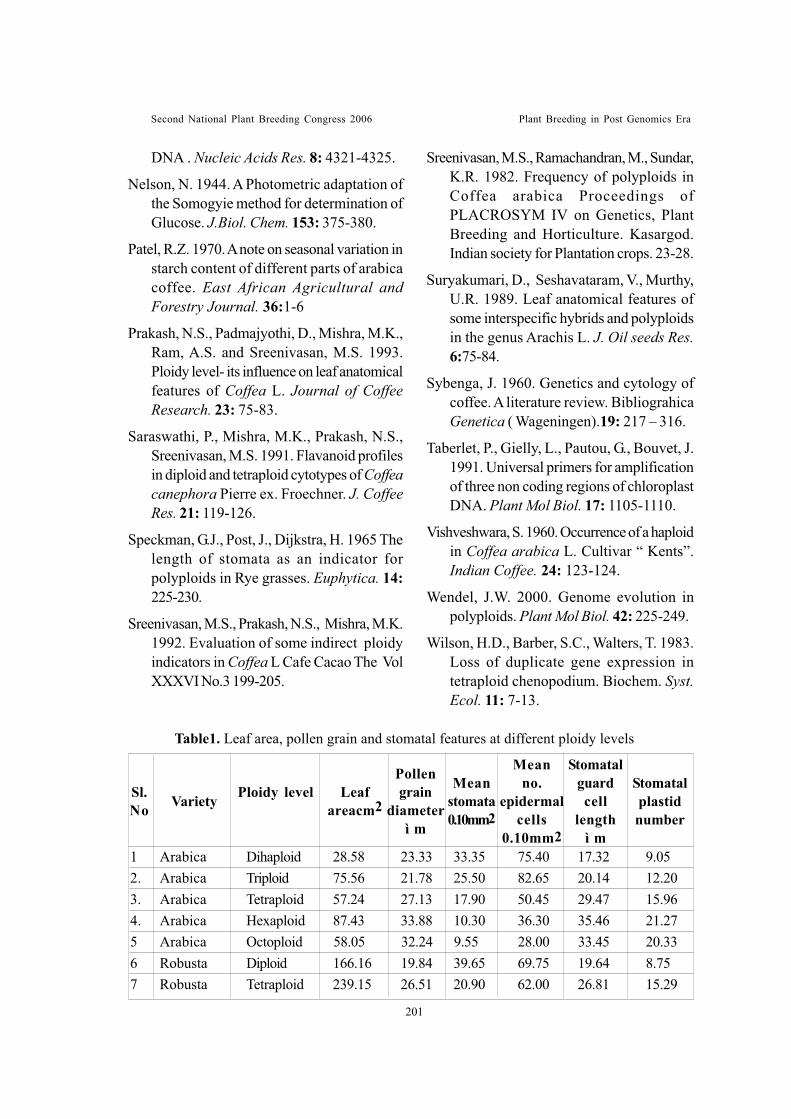
Second National Plant Breeding Congress 2006 Plant Breeding in Post Genomics Era
201
Table1. Leaf area, pollen grain and stomatal features at different ploidy levels
1 Arabica Dihaploid 28.58 23.33 33.35 75.40 17.32 9.052. Arabica Triploid 75.56 21.78 25.50 82.65 20.14 12.203. Arabica Tetraploid 57.24 27.13 17.90 50.45 29.47 15.964. Arabica Hexaploid 87.43 33.88 10.30 36.30 35.46 21.275 Arabica Octoploid 58.05 32.24 9.55 28.00 33.45 20.336 Robusta Diploid 166.16 19.84 39.65 69.75 19.64 8.757 Robusta Tetraploid 239.15 26.51 20.90 62.00 26.81 15.29
Sl.No Variety Ploidy level Leaf
areacm2Mean
stomata0.10mm2
Stomatalplastidnumber
Pollengrain
diameterì m
Meanno.
epidermalcells
0.10mm2
Stomatalguardcell
lengthì m
DNA . Nucleic Acids Res. 8: 4321-4325.
Nelson, N. 1944. A Photometric adaptation ofthe Somogyie method for determination ofGlucose. J.Biol. Chem. 153: 375-380.
Patel, R.Z. 1970. A note on seasonal variation instarch content of different parts of arabicacoffee. East African Agricultural andForestry Journal. 36:1-6
Prakash, N.S., Padmajyothi, D., Mishra, M.K.,Ram, A.S. and Sreenivasan, M.S. 1993.Ploidy level- its influence on leaf anatomicalfeatures of Coffea L. Journal of CoffeeResearch. 23: 75-83.
Saraswathi, P., Mishra, M.K., Prakash, N.S.,Sreenivasan, M.S. 1991. Flavanoid profilesin diploid and tetraploid cytotypes of Coffeacanephora Pierre ex. Froechner. J. CoffeeRes. 21: 119-126.
Speckman, G.J., Post, J., Dijkstra, H. 1965 Thelength of stomata as an indicator forpolyploids in Rye grasses. Euphytica. 14:225-230.
Sreenivasan, M.S., Prakash, N.S., Mishra, M.K.1992. Evaluation of some indirect ploidyindicators in Coffea L Cafe Cacao The VolXXXVI No.3 199-205.
Sreenivasan, M.S., Ramachandran, M., Sundar,K.R. 1982. Frequency of polyploids inCoffea arabica Proceedings ofPLACROSYM IV on Genetics, PlantBreeding and Horticulture. Kasargod.Indian society for Plantation crops. 23-28.
Suryakumari, D., Seshavataram, V., Murthy,U.R. 1989. Leaf anatomical features ofsome interspecific hybrids and polyploidsin the genus Arachis L. J. Oil seeds Res.6:75-84.
Sybenga, J. 1960. Genetics and cytology ofcoffee. A literature review. BibliograhicaGenetica ( Wageningen).19: 217 – 316.
Taberlet, P., Gielly, L., Pautou, G., Bouvet, J.1991. Universal primers for amplificationof three non coding regions of chloroplastDNA. Plant Mol Biol. 17: 1105-1110.
Vishveshwara, S. 1960. Occurrence of a haploidin Coffea arabica L. Cultivar “ Kents”.Indian Coffee. 24: 123-124.
Wendel, J.W. 2000. Genome evolution inpolyploids. Plant Mol Biol. 42: 225-249.
Wilson, H.D., Barber, S.C., Walters, T. 1983.Loss of duplicate gene expression intetraploid chenopodium. Biochem. Syst.Ecol. 11: 7-13.
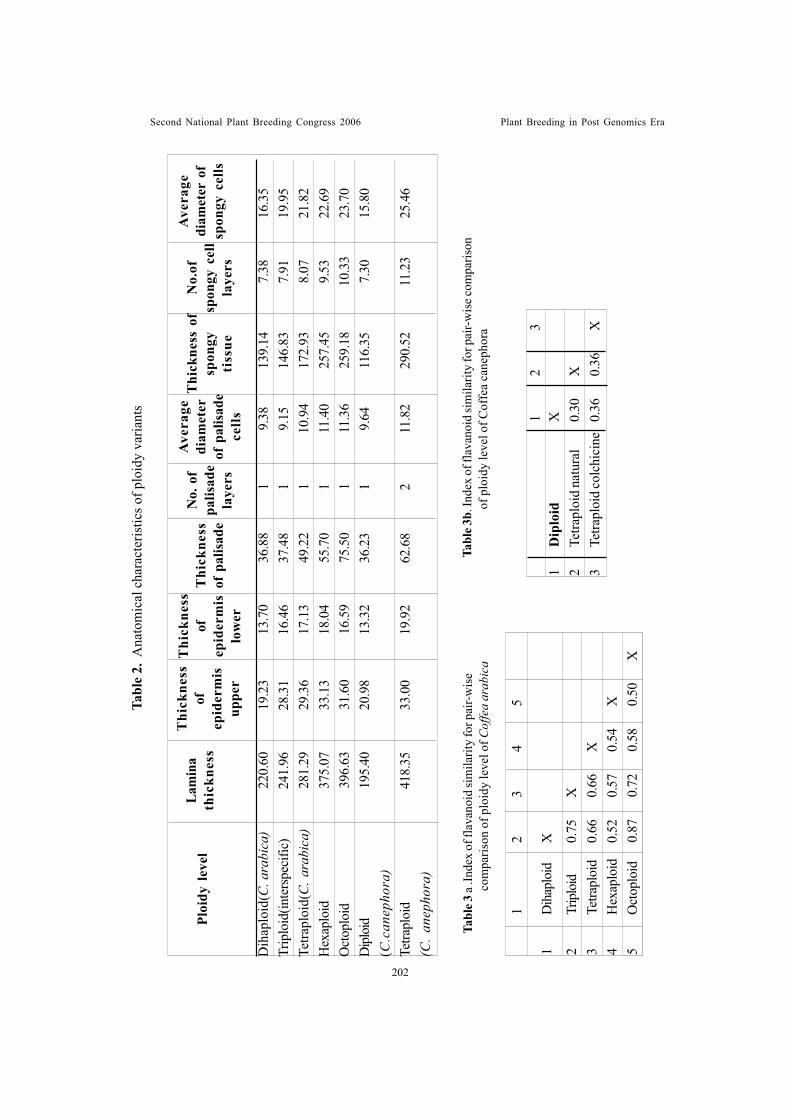
Second National Plant Breeding Congress 2006 Plant Breeding in Post Genomics Era
12
31
Dip
loid
X2
Tetra
ploi
d na
tura
l0.
30X
3Te
trapl
oid
colc
hici
ne0.
360.
36X
Tabl
e 3b.
Inde
x of
flav
anoi
d si
mila
rity
for p
air-w
ise c
ompa
rison
o
f plo
idy
leve
l of C
offe
a ca
neph
ora
Tabl
e 3 a
.Inde
x of
flav
anoi
d si
mila
rity
for p
air-w
ise
com
paris
on o
f plo
idy
leve
l of C
offe
a ar
abic
a
12
34
5
1D
ihap
loid
X
2Tr
iplo
id0.
75X
3Te
trapl
oid
0.66
0.66
X4
Hex
aplo
id0.
520.
570.
54X
5O
ctop
loid
0.87
0.72
0.58
0.50
X
Tabl
e 2.
Ana
tom
ical
cha
ract
eris
tics o
f plo
idy
varia
nts
Dih
aplo
id(C
. ara
bica
)22
0.60
19.2
313
.70
36.8
81
9.38
139.
147.
3816
.35
Trip
loid
(inte
rspe
cific
)24
1.96
28.3
116
.46
37.4
81
9.15
146.
837.
9119
.95
Tetra
ploi
d(C
. ara
bica
)28
1.29
29.3
617
.13
49.2
21
10.9
417
2.93
8.07
21.8
2H
exap
loid
375.
0733
.13
18.0
455
.70
111
.40
257.
459.
5322
.69
Oct
oplo
id39
6.63
31.6
016
.59
75.5
01
11.3
625
9.18
10.3
323
.70
Dip
loid
195.
4020
.98
13.3
236
.23
19.
6411
6.35
7.30
15.8
0(C
.can
epho
ra)
Tetra
ploi
d41
8.35
33.0
019
.92
62.6
82
11.8
229
0.52
11.2
325
.46
(C.
anep
hora
)
Ploi
dy l
evel
Lam
ina
thic
knes
s
Thi
ckne
ssof
epid
erm
isup
per
Thi
ckne
ssof
epid
erm
islo
wer
Thi
ckne
ssof
pal
isad
e
No.
of
palis
ade
laye
rs
Ave
rage
diam
eter
of p
alis
ade
cells
Thi
ckne
ss o
fsp
ongy
tiss
ue
No.
ofsp
ongy
cel
lla
yers
Ave
rage
diam
eter
of
spon
gy c
ells
202
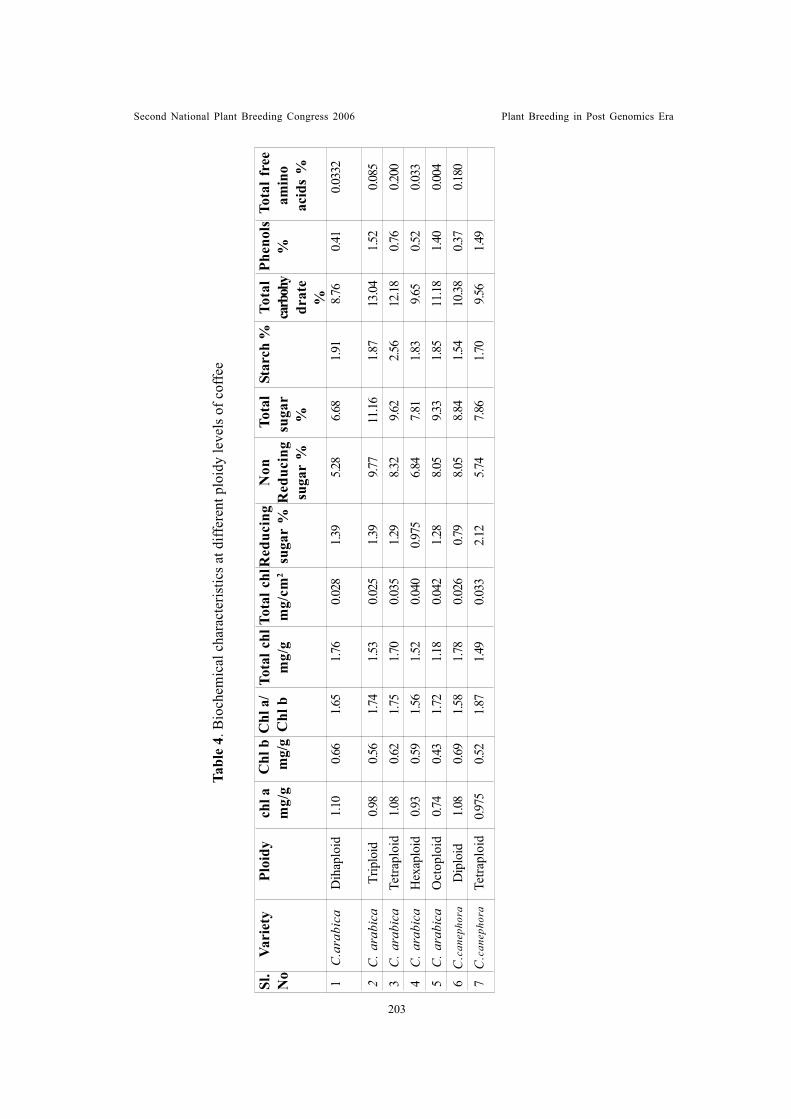
Second National Plant Breeding Congress 2006 Plant Breeding in Post Genomics Era
203
Tabl
e 4.
Bio
chem
ical
cha
ract
eris
tics a
t diff
eren
t plo
idy
leve
ls o
f cof
fee
1C
.ara
bica
Dih
aplo
id1.1
00.6
61.6
51.7
60.0
281.3
95.2
86.6
81.9
18.7
60.4
10.0
332
2C
. ara
bica
Trip
loid
0.98
0.56
1.74
1.53
0.025
1.39
9.77
11.16
1.87
13.04
1.52
0.085
3C
. ara
bica
Tetra
ploi
d1.0
80.6
21.7
51.7
00.0
351.2
98.3
29.6
22.5
612
.180.7
60.2
004
C. a
rabi
caH
exap
loid
0.93
0.59
1.56
1.52
0.040
0.975
6.84
7.81
1.83
9.65
0.52
0.033
5C
. ara
bica
Oct
oplo
id0.7
40.4
31.7
21.1
80.0
421.2
88.0
59.3
31.8
511
.181.4
00.0
046
C.c
anep
hora
Dip
loid
1.08
0.69
1.58
1.78
0.026
0.79
8.05
8.84
1.54
10.38
0.37
0.180
7C
.can
epho
raTe
trapl
oid
0.975
0.52
1.87
1.49
0.033
2.12
5.74
7.86
1.70
9.56
1.49
Tot
alsu
gar
%
Sl.
No
Vari
ety
Ploi
dych
l am
g/g
Chl
b m
g/g
Chl
a/
Chl
bTo
tal c
hlm
g/g
Tota
l chl
mg/
cm2
Red
ucin
gsu
gar
%N
onR
educ
ing
suga
r %
Star
ch %
Tota
lca
rboh
ydr
ate
%
Phen
ols
% T
otal
fre
eam
ino
acid
s %
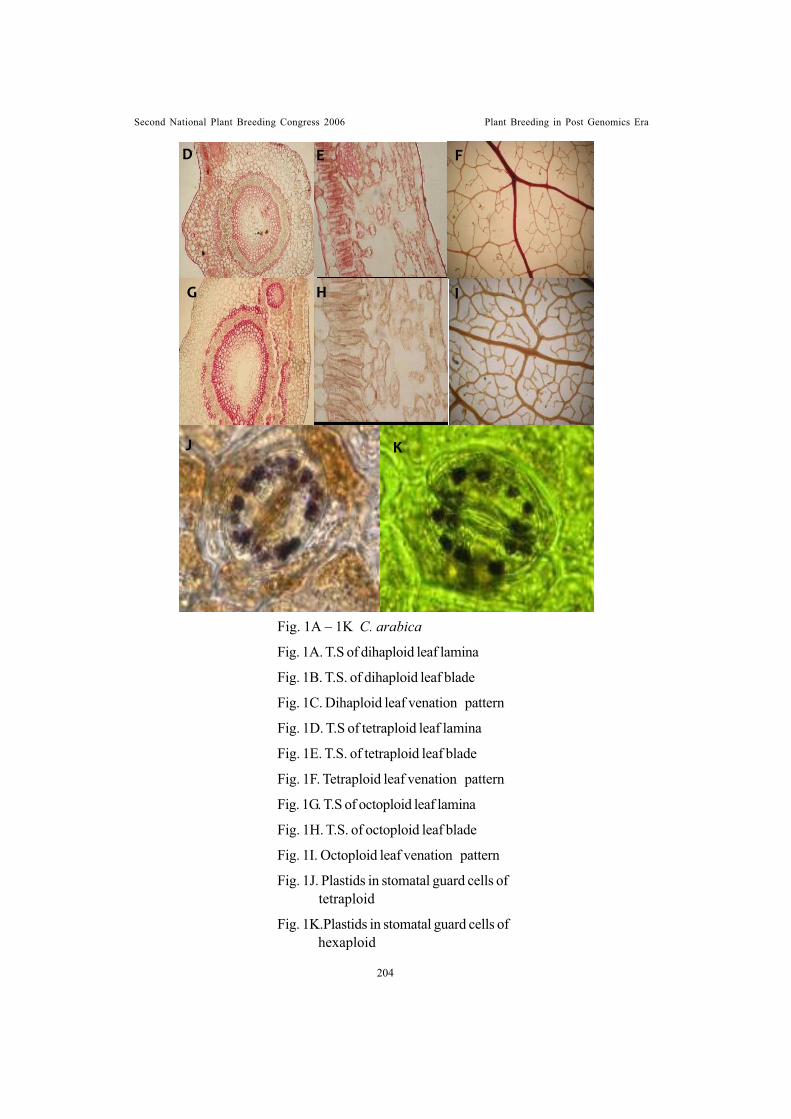
Second National Plant Breeding Congress 2006 Plant Breeding in Post Genomics Era
Fig. 1A – 1K C. arabica
Fig. 1A. T.S of dihaploid leaf lamina
Fig. 1B. T.S. of dihaploid leaf blade
Fig. 1C. Dihaploid leaf venation pattern
Fig. 1D. T.S of tetraploid leaf lamina
Fig. 1E. T.S. of tetraploid leaf blade
Fig. 1F. Tetraploid leaf venation pattern
Fig. 1G. T.S of octoploid leaf lamina
Fig. 1H. T.S. of octoploid leaf blade
Fig. 1I. Octoploid leaf venation pattern
Fig. 1J. Plastids in stomatal guard cells of tetraploid
Fig. 1K.Plastids in stomatal guard cells of hexaploid
204
D��� E� ��F��
G�� �H��� I���
��J�� K��
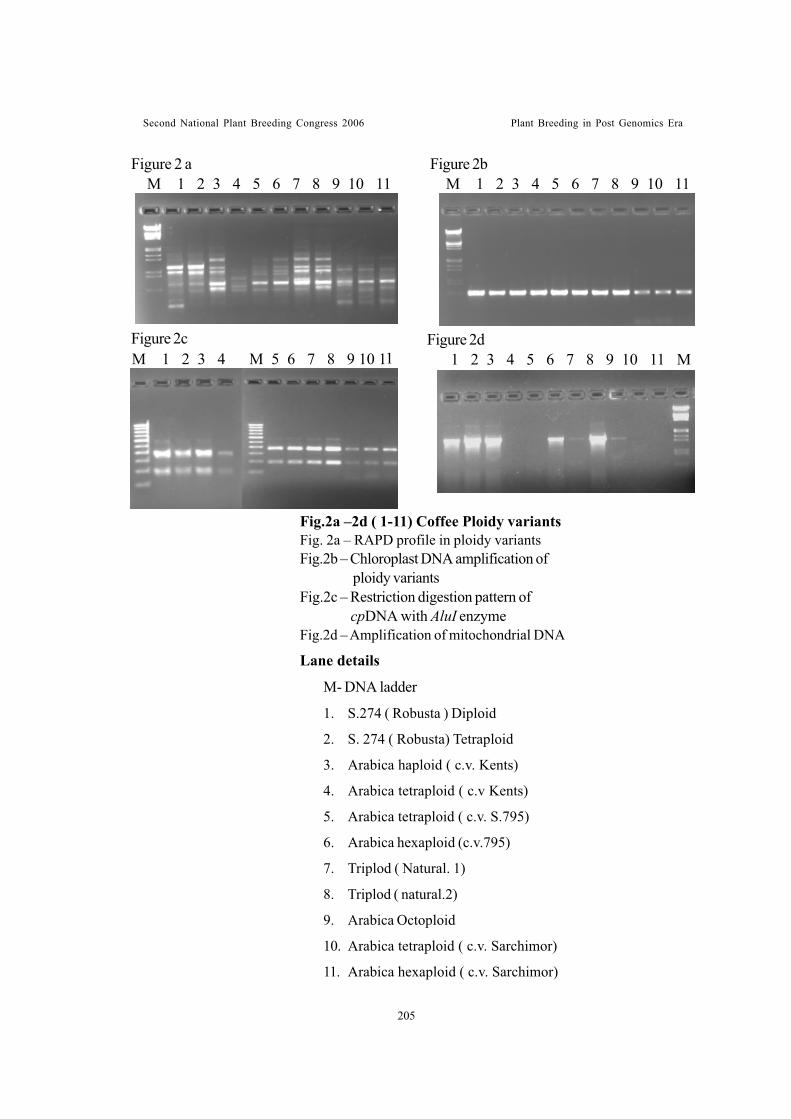
Second National Plant Breeding Congress 2006 Plant Breeding in Post Genomics Era
205
Figure 2 a M 1 2 3 4 5 6 7 8 9 10 11
Figure 2b M 1 2 3 4 5 6 7 8 9 10 11
Figure 2cM 1 2 3 4 M 5 6 7 8 9 10 11
Figure 2d 1 2 3 4 5 6 7 8 9 10 11 M
Fig.2a –2d ( 1-11) Coffee Ploidy variantsFig. 2a – RAPD profile in ploidy variantsFig.2b – Chloroplast DNA amplification of
ploidy variantsFig.2c – Restriction digestion pattern of
cpDNA with AluI enzymeFig.2d – Amplification of mitochondrial DNA
Lane details
M- DNA ladder
1. S.274 ( Robusta ) Diploid
2. S. 274 ( Robusta) Tetraploid
3. Arabica haploid ( c.v. Kents)
4. Arabica tetraploid ( c.v Kents)
5. Arabica tetraploid ( c.v. S.795)
6. Arabica hexaploid (c.v.795)
7. Triplod ( Natural. 1)
8. Triplod ( natural.2)
9. Arabica Octoploid
10. Arabica tetraploid ( c.v. Sarchimor)
11. Arabica hexaploid ( c.v. Sarchimor)
Second National Plant Breeding Congress 2006 Plant Breeding in Post Genomics Era
CYTOLOGICAL STUDIES ON SUGARCANEINTERGENERIC HYBRIDS
Babu, C1., K.Koodalingam1, U.S. Natarajan2, R.M. Shanthi2 and S. Thangasamy1
ABSTRACT
Modern sugarcane varieties (Saccharum spp., 2n=100-130) are derived frominterspecific crosses, between Saccharum officinarum and wild relatives mainly S.spontaneum in which only a few parental clones were involved resulting in narrow geneticbase. To broaden this genetic base, use of other genera from the Saccharum complex,mainly the cane forming Erianthus arundinaceus which is known for high tillering, highfibre, high biomass, resistance to drought, red rot, borers and good ratooning ability wasattempted. Despite several attempts, during the recent past, to introgress E. arundinaceuscharacters in sugarcane varieties, no conclusive success has been achieved. The first difficultyappears to be the identification of true hybrids using morphological traits and other difficultyin getting seed fertility and the lack of recombination between the chromosomes of the twogenera.
In order to overcome the problem of sterility, S. spontaneum could be used asbridge species. In one such cross IK 76-092 (E. arundinaceus) x SES 286 (S. spontaneum),five intergeneric progenies were examined cytologically to confirm their hybridity. Theexpected chromosome number from the cross IK 76-092 (2n=60) x SES 286 (2n=64) forn+n transmission is 62. The root tips were examined and mean of two observations wastaken as the chromosome number. The results showed that none of the hybrids had 62chromosomes for n+n transmission indicating that chromosome elimination could be acommon phenomenon in such crosses. Chromosome elimination in these progenies rangedfrom 4 to 12.
Introduction
Sugarcane belongs to the genus Saccharum,a complex genus which comprises six speciesall characterized by a high ploidy level. Modernsugarcane varieties (Saccharum spp., 2n=100-130) are derived from interspecific crosses,performed early this century, between sugar-producing Saccharum officinarum (2n=80) andwild relatives mainly S. spontaneum (2n=40-128). Only a few parental clones were involvedin these crosses (Arceneaux, 1965; Price, 1965).Thus, the genetic base of modern varietiesappears to be very narrow and could be thereason for the present slow progress insugarcane breeding. To broaden this geneticbase, interest has turned to utilize other generafrom the Saccharum complex, mainly Erianthusarundinaceus (Berding and Roach 1987; Roach
and Daniels 1987; Walker 1987). Cane formingE. arundinaceus (2n = 60) is known for hightillering, high fibre, high biomass, resistance todrought, red rot, borers with multiratooningability. Despite several attempts, during therecent past, to introgress E. arundinaceuscharacters in sugarcane varieties, no conclusivesuccess has been achieved. The first difficultyappears to be the identification of true hybridsusing morphological traits. Two other factorssuggested to be responsible for this lack ofsuccess are difficulty in getting seed fertilityand the lack of recombination between thechromosomes of the two genera.
Many classical cytological studies havebeen undertaken to provide general informationabout the cytogenetics of sugarcane and tosupport breeding programmes (Sreenivasan
1. Centre for Plant Breeding and Genetics,Tamil Nadu Agricultural University, Coimbatore2. Sugarcane Breeding Institute, Coimbatore
206
Second National Plant Breeding Congress 2006 Plant Breeding in Post Genomics Era
207
et al., 1987). The occurrence of 2n gametetransmission in hybrids between S. officinarumand S. spontaneum and their first backcross withS. officinarum has been demonstrated (Bremer1922 and 1961). But unlike in S. spontaneumnobilisation, S. officinarum fails to transmit 2ngametes when it is crossed with E.arundinaceus. Another obstacle is that there ismanifestation of sterility in the intergenerichybrids. To overcome these two difficulties,attempts have been made to use S. spontaneumas bridging species between S. officinarum andE. arundinaceus (Natarajan, 2002). Towardsthis objective crosses have been made(Natarajan, 2002). In one such cross betweenIK 76-092 (E.arundinaceus) as female and SES286 (S. spontaneum) as male, the resultantintergeneric progenies (013501, 013502, 013504,013505 and 013102) were subjected to cytologicalstudies to confirm their hybridity. The expectedchromosome number from the cross IK 76-092(2n=60) x SES 286 (2n=64) for n+n transmissionis 62.
Materials and Methods
Single bud setts of the intergeneric hybridsviz., 013501, 013502, 013504, 013505 and 013102derived from the cross IK 76-092 (2n=60) x SES286 (2n=64) were planted four each in mud potscontaining pure sand in order to facilitate earlygrowth of roots on 07.01.2003. After twenty days,the germinated plants were carefully depottedand the roots were thoroughly washed in freshrunning water and the healthy root tips (asindicated by white portion at the tip) of 0.5 cm inlength were collected. The procedure for the roottip squash technique was followed as per themethod suggested by Jagathesan andRathnambal, 1967. The root tips were pretreatedwith a-1 bromonaphthalene and stored inrefrigerator at 10°C for 1-1.30 hrs. The root tipswere washed free of a-1 bromonaphthalene inrunning water and rinsed with distilled water. Thewashed root tips were then fixed in 6:3:2(methanol: chloroform: distilled water) fixative
and kept in refrigerator for overnight (Ostergrenand Haneen, 1962). Then, the root tips werewashed and hydrolyzed with 1N HCl at 60°Cfor 13 minutes. The root tips were washed freeof HCl in running water and rinsed with distilledwater. The root tips were treated with 1:1 citratebuffer: pectinase mixture and kept in dark for1 hr. Finally, the root tips were stained with basicfuchsine and kept in dark for 1.30 hrs. Theactively dividing portion at the root tip getstained with basic fuchsine and that portion wascarefully excised with a sharp blade in a cleanglass slide and squashed with 1% acetocarmineand examined under microscope.
The salient features of the parental clonesviz., IK 76-092 and SES 286 (Kandasamy etal., 1983; Sreenivasan et al., 2001) are givenin the Table 1.
Results and Discussion
Out of the five test entries viz., 013501,013502, 013504, 013505 and 013102 root tipsfrom four entries viz., 013501, 013502, 013504and 013505 were collected, processed andchromosome number was observed. Sufficientnumber of roots was not formed from the rooteyes of the intergeneric progeny 013102. Themean of two observations was taken as thechromosome number and are given in theTable2.
The results showed that, none of the hybridsbetween E. arundinaceus (IK 76-092; 2n=60)and S. spontaneum (SES 286; 2n=64) observedby cytological methods had the expected 62chromosomes for n+n transmission; between4 and 12 chromosomes were eliminated. Similarresults of chromosome elimination have beenobtained by Piperidis et al. 2000 using GISHtechnique when S. officinarum (2n=80) wascrossed with E. arundinaceus (2n=60). Onehybrid (013505) had chromosome number 58(Fig.1) almost equivalent to the expectednumber 62 and this could be the result of n+ntransmission followed by elimination ofchromosomes to a lesser degree. Although
Second National Plant Breeding Congress 2006 Plant Breeding in Post Genomics Era
slight inaccuracy in chromosome count (due tothe large number and small size of chromosomes)cannot be ruled out completely (Piperidis et al.,2000), this probably reflects that chromosomeelimination has occurred.
REFERENCES
Arceneaux, G. 1965. Cultivated sugarcane of theworld and their botanical derivation. Proc.ISSCT, 12: 844-854.
Berding, N., Roach BT. 1987. Germplasmcollection, maintenance and use. In: HeinzD.J (ed.) Sugarcane improvement throughbreeding. Elsevier Press, Amsterdam. pp143-210.
Bremer, G. 1922. Ned. Indie. pp. 1-112. [Englishtranslation in Genetica, 5: 97-148, 273-326(1923)].
Bremer, G. 1961. Problems in breeding andcytology of sugarcane. Euphytica, 10: 59-78.
Jagathesan, D. and M.J. Rathnambal. 1967.Karyotype analysis in Saccharumofficinarum. The Nucleus. 10: 159-167.
Kandasamy, P.A., Sreenivasan, T.V., RamanaRao, T.C., Palanichami, K., Natarajan, B.V.,Alexander, K.C., Madhusudana Rao, M. andMohan raj, D. 1983. Catalogue on Sugarcanegenetic resources I S. spontaneum.Sugarcane Breeding Institute (ICAR). pp 72.
Natarajan, U.S. 2002. Nobilisation – a pivotalprocedure in sugarcane breeding. In: Winterschool training manual, Sugarcane breeding
and genetics retrospects and prospects, pp42-48.
Ostergen, G. and Haneen, W.K. 1962. a squashtechnique for chromosome morphologystudies. Heriditas. 33 : 261-269.
Piperidis, G., Christopher M.J., Carroll, B.J.,Nils Berding and D’Hont. 2000. Molecularcontribution to selection of intergenerichybrids between sugarcane and the wildspecies Erianthus arundinaceus.Genome. 43: 1033-1037.
Price, S. 1965. Interspecific hybridization insugarcane breeding. Proc. ISSCT, 12:1021-1026.
Roach, B.T., J. Daniels. 1987. A review of theorigin and improvement of sugarcane. In:Coperscular Int. Sugarcane Breed.Workshop, Coperscular, Sao Paulo. pp 1-31.
Sreenivasan, T.V., Ahloowalia, B.S. and Heinz,D.J. 1987. Cytogenetics. In Heinz D.J (ed.)Sugarcane improvement through breeding.Elsevier Press, Amsterdam. pp 211-253.
Sreenivasan, T.V., Amalraj, V.A. and WilliamJebadhas, A. 2001. Catalogue onSugarcane Genetic Resources IVErianthus species. Sugarcane BreedingInstitute (ICAR). pp 54.
Walker, DIT. 1987. Manipulating the geneticbase of sugarcane. In: Coperscular Int.Sugarcane Breed. Workshop, Coperscular,Sao Paulo. pp 321-334.
208
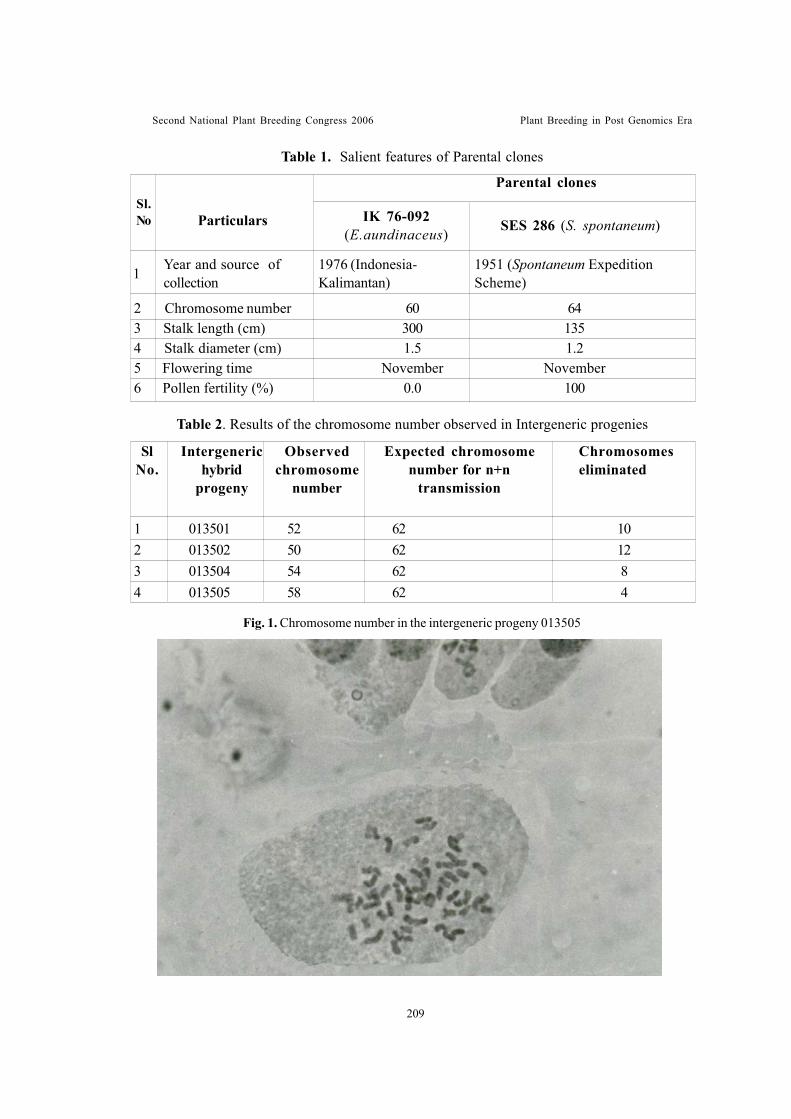
Second National Plant Breeding Congress 2006 Plant Breeding in Post Genomics Era
209
Table 1. Salient features of Parental clones
2 Chromosome number 60 643 Stalk length (cm) 300 1354 Stalk diameter (cm) 1.5 1.25 Flowering time November November6 Pollen fertility (%) 0.0 100
IK 76-092(E.aundinaceus)
1 Year and source ofcollection
1976 (Indonesia-Kalimantan)
1951 (Spontaneum ExpeditionScheme)
Sl.No Particulars
Parental clones
SES 286 (S. spontaneum)
Table 2. Results of the chromosome number observed in Intergeneric progenies
Fig. 1. Chromosome number in the intergeneric progeny 013505
1 013501 52 62 102 013502 50 62 123 013504 54 62 84 013505 58 62 4
Chromosomeseliminated
SlNo.
Intergenerichybrid
progeny
Observedchromosome
number
Expected chromosomenumber for n+n
transmission
�
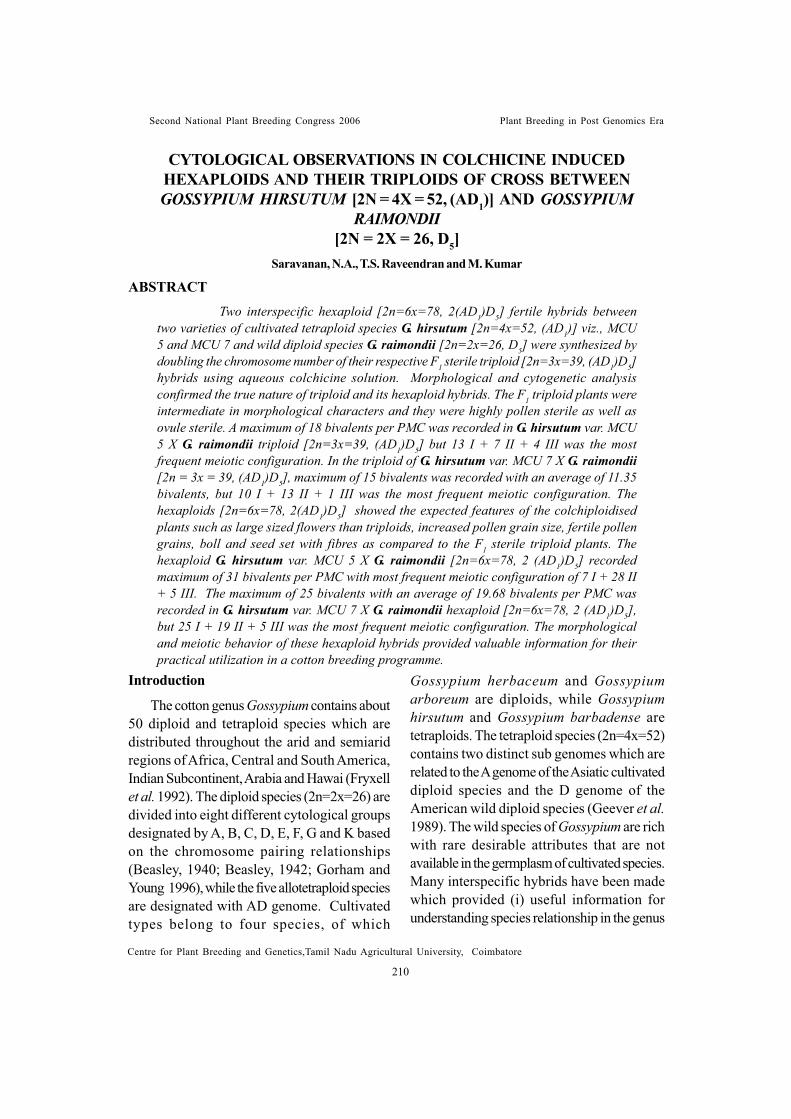
Second National Plant Breeding Congress 2006 Plant Breeding in Post Genomics Era
CYTOLOGICAL OBSERVATIONS IN COLCHICINE INDUCEDHEXAPLOIDS AND THEIR TRIPLOIDS OF CROSS BETWEENGOSSYPIUM HIRSUTUM [2N = 4X = 52, (AD1)] AND GOSSYPIUM
RAIMONDII[2N = 2X = 26, D5]
Saravanan, N.A., T.S. Raveendran and M. Kumar
ABSTRACTTwo interspecific hexaploid [2n=6x=78, 2(AD1)D5] fertile hybrids between
two varieties of cultivated tetraploid species G. hirsutum [2n=4x=52, (AD1)] viz., MCU5 and MCU 7 and wild diploid species G. raimondii [2n=2x=26, D5] were synthesized bydoubling the chromosome number of their respective F1 sterile triploid [2n=3x=39, (AD1)D5]hybrids using aqueous colchicine solution. Morphological and cytogenetic analysisconfirmed the true nature of triploid and its hexaploid hybrids. The F1 triploid plants wereintermediate in morphological characters and they were highly pollen sterile as well asovule sterile. A maximum of 18 bivalents per PMC was recorded in G. hirsutum var. MCU5 X G. raimondii triploid [2n=3x=39, (AD1)D5] but 13 I + 7 II + 4 III was the mostfrequent meiotic configuration. In the triploid of G. hirsutum var. MCU 7 X G. raimondii[2n = 3x = 39, (AD1)D5], maximum of 15 bivalents was recorded with an average of 11.35bivalents, but 10 I + 13 II + 1 III was the most frequent meiotic configuration. Thehexaploids [2n=6x=78, 2(AD1)D5] showed the expected features of the colchiploidisedplants such as large sized flowers than triploids, increased pollen grain size, fertile pollengrains, boll and seed set with fibres as compared to the F1 sterile triploid plants. Thehexaploid G. hirsutum var. MCU 5 X G. raimondii [2n=6x=78, 2 (AD1)D5] recordedmaximum of 31 bivalents per PMC with most frequent meiotic configuration of 7 I + 28 II+ 5 III. The maximum of 25 bivalents with an average of 19.68 bivalents per PMC wasrecorded in G. hirsutum var. MCU 7 X G. raimondii hexaploid [2n=6x=78, 2 (AD1)D5],but 25 I + 19 II + 5 III was the most frequent meiotic configuration. The morphologicaland meiotic behavior of these hexaploid hybrids provided valuable information for theirpractical utilization in a cotton breeding programme.
Introduction
The cotton genus Gossypium contains about50 diploid and tetraploid species which aredistributed throughout the arid and semiaridregions of Africa, Central and South America,Indian Subcontinent, Arabia and Hawai (Fryxellet al. 1992). The diploid species (2n=2x=26) aredivided into eight different cytological groupsdesignated by A, B, C, D, E, F, G and K basedon the chromosome pairing relationships(Beasley, 1940; Beasley, 1942; Gorham andYoung 1996), while the five allotetraploid speciesare designated with AD genome. Cultivatedtypes belong to four species, of which
Gossypium herbaceum and Gossypiumarboreum are diploids, while Gossypiumhirsutum and Gossypium barbadense aretetraploids. The tetraploid species (2n=4x=52)contains two distinct sub genomes which arerelated to the A genome of the Asiatic cultivateddiploid species and the D genome of theAmerican wild diploid species (Geever et al.1989). The wild species of Gossypium are richwith rare desirable attributes that are notavailable in the germplasm of cultivated species.Many interspecific hybrids have been madewhich provided (i) useful information forunderstanding species relationship in the genus
Centre for Plant Breeding and Genetics,Tamil Nadu Agricultural University, Coimbatore
210
Second National Plant Breeding Congress 2006 Plant Breeding in Post Genomics Era
211
and (ii) new sources of germplasm to beincorporated into breeding programme. Withoutdoubt, most hybridization programmes utilizingwild species of Gossypium, have their primaryobjective of the transfer of disease and insectresistance. The work of transferring bollwormresistance from, G. thurberi and G.armourianum to sakel cotton was reported byKnight et al. (1953) and Thombre and Mehetre(1981). Jassid resistance from G. tomentosumand boll weevil resistance from G. armourianumwas transferred to G. hirsutum (Narayanan etal., 2004). Black arm resistance has beentransferred from G. arboreum to G. barbadenseand rust resistance from G. raimondii to G.hirsutum. Besides pest and disease resistancesome of the fibre quality traits have also beenintrogressed from wild species of Gossypiumto cultivated cottons. In texas, hybridizationworks involving thurberi gave successful resultsin the transfer of the high lint strength to uplandcotton (Guany, 1952). Marappan (1960) reportedthe transfer of fineness from G. anomalum tothe back ground of G. arboreum. Muramoto(1969) synthesized hexaploid cottons by crossingG.hirsutum and G. sturtianum and showed thepossibilities of producing spinnable yarn with veryhigh yarn strength. With this background thepresent investigation was attempted forintrogression of desirable genes from G.raimondii into cultivated G. hirsutum cottonvarieties to synthesize new breeding lines within-built resistance to biotic and abiotic stressescoupled with desirable fibre quality traits inaddition to desired economic characters.
Materials and Methods
The experimental materials used for thisstudy consisted of two Gossypium hirsutumcultivated tetraploid [2n=4x=52, (AD1)]genotypes viz., MCU 5 and MCU 7 (used asfemale parents), wild diploid species Gossypiumraimondii [2n=2x=26, D5] (used as male parent),their two F1 sterile triploid [2n=3x=39, (AD1)D5]hybrids viz., G. hirsutum var. MCU 5 X G.
raimondii and G. hirsutum var. MCU 7 X G.raimondii and their colchicine induced fertilehexaploids [2n=6x=78, 2(AD1)D5] viz., G.hirsutum var. MCU 5 X G. raimondii and G.hirsutum var. MCU 7 X G. raimondii. Thetriploids and hexaploids used for morphologicaland meiotic behaviour studies were grown inthe species garden maintained at theDepartment of Cotton, TNAU. Doak’s methodwas followed for hybridization. Simultaneously,selfing of parents was also carried out andselfed bolls were collected, ginned and seedswere secured.
The seeds of the F1 triploid hybrids weresown in the poly bags for colchicine treatment.One week after germination when the seedlingsattained two leaf stage, a thin wad of absorbentcotton was spread over the apical meristemsof the seedlings and sufficient drops of 0.1 and0.2 per cent aqueous solution of colchicine wereapplied to soak the cotton wad to enable theefficient penetration of the chemical into theapical meristem. The treatment was giventwice a day for five consecutive days. Slideswere prepared for cytological examinationfollowing usual procedures. Stainability of pollengrains was also studied using 1 per centacetocarmine.
Results and Discussion
The present investigation was carried outto transfer the genes resistant to biotic andabiotic stresses combined with fibre qualitycharacters from the wild diploid species G.raimondii to susceptible and high yieldingadapted genotypes. Two triploids viz., G.hirsutum (MCU 5) x G. raimondii [(AD1)D5]and G. hirsutum (MCU 7) x G. raimondii[(AD1)D5] developed by interspecifchybridization were found to be characterizedby vigorous healthy and rapid growth, profusebranching and tolerance to jassids during boththe seasons. Evidently, these characters weretransmitted from the wild parent G. raimondiito the triploid hybrids. The observations made
Second National Plant Breeding Congress 2006 Plant Breeding in Post Genomics Era
by Deodikar (1949) involving G. anomalum werealso similar to those obtained in the presenthybrids with 2n = 39 chromosomes.
These two triploids were found to beintermediate between both the parents in plantheight, growth habit, number of monopodialbranches, number of anthers per flower, size ofanther, and length of pistil and bracterial teethnumber which concur with G. hirsutum and G.raimondii. The leaf shape, flower shape, petalspot, flower colour, flower size, stem and leafhairiness etc., of G. raimondii were dominantas the F1 triploid hybrids and their hexaploidsexhibited these characters. Mehetre et al.(2003) also reported that the flower shape, flowersize, petal spot, pollen colour, filament colour,stem and leaf hairiness of G. raimondii weredominant in the F1 triploid hybrids of G. hirsutumx G. raimondii.
Memon and Ahmed (1970) described similarinterspecific triploid hybrid in terms of vigour,tallness, petal spot and hairiness and reportedthat these characters were being transmited fromG. anomalum. However the hybrids had flowershape and petal colour of G. hirsutum indicatingthe dominance nature of these characters incultivated upland hirsutums and recessive in wildrelatives. The same author further reported thatsuch differences at diploid and triploid levelsmight be due to the presence of two Ah Dhchromosome complements carrying genes ormodifier complex or both inhibiting the expressionof the characters of the diploid parent G.anomalum in the triploid hybrid. Mehetre andThombre (1982) reported that in F1 triploid; thebract shape of G. hirsutum was dominant whileleaf shape, petal colour, petal spot and gossypolglands of G. anomalum were dominant.
The triploids did not produce fertile pollengrains obviously due to chromosomal differences.A number of strategies have been proposed forovercoming the ploidy barrier, but all involve thesynthesis of a sterile intergenomic F1 and
doubling chromosome complement to achievethe fertility (Stewart, 1995). Umbeck andStewart (1985) also suggested that the doublingof interspecific hybrids is necessary to restorepollen fertility and it enabled to continue backcrossing with cultigens. Thus polyploidy hasbeen used as the main tool to overcome thesterility of interspecific hybrids. In the presentstudy also two triploid plants G. hirsutum(MCU 5) x G. raimondii [(AD)1 D5] and G.hirsutum (MCU 7) x G. raimondii [(AD)1 D5]were polyploidised using colchicine. Themorphological expressions like slower growth,abnormal branching, stunted growth, large sizedflowers, increased pollen grain size, fertile pollengrains, boll and seed set as compared to normalF1 triploids suggested that the chromosomecomplements of these colchicine treated plantswere successfully doubled. Stephens (1942)reported that doubled tetraploid showing “gigascharacters”, slower growth, coarser andfleshier vegetative parts, increased size of pollengrains, and broader leaves as compared withnormal diploid. Brown and Menzel (1952) alsoobserved that amphidiploids were distinguishedfrom their corresponding F1 hybrids by larger,thicker, less lobed leaves, larger and broaderbracteole, flower parts, larger anther, moreregular shedding of pollen and often by moreirregular, ruffled, some what lobed petalmargins. Similar observations have also beenmade by Harland (1940) and Amin (1941).Brubaker et al. (1999) also confirmed thedoubling of G. sturtianum x G. hirsutum andits reciprocal hybrid G. hirsutum x G.sturtianum by increased flower size.
The hexaploids G. hirsutum (MCU 5) x G.raimondii [2(AD)1D5] and G. hirsutum(MCU 7) x G. raimondii [2(AD)1D5] obtainedby chromosome doubling of their respectivetriploids were also intermediate between thetetraploid Gossypium hirsutum and their wilddiploid parent G. raimondii and conformed tothe findings of Brown and Menzel (1952) who
212
Second National Plant Breeding Congress 2006 Plant Breeding in Post Genomics Era
213
reported that in general, the hexaploids, like F1triploid hybrids, are intermediate between G.hirsutum and the wild diploid parent. Influenceof the wild genome on individual plant parts variesmarkedly from species to species, but both thediploid and the hirsutum components are clearlydiscernible in all. In these two hexaploids, G.hirsutum (MCU 5) x G. raimondii [2(AD1)D5]and G. hirsutum (MCU 7) x G. raimondii [2(AD)1 D5] normal boll formation was observedoccassionally with well developed seeds (PlateI-Fig.13 & 14). Brown and Menzel (1952)concluded that the triploid hybrids, from whichthe hexaploids are derived, are almost completelysterile while all the hexaploids, are more or lessfertile, the degree of fertility being different withthe varying diploid species involved. The E1(Stocksii) hexaploids are most prolific andreadily set many selfed bolls with a high numberof seeds. The A1 (herbaceum), A2 (arboreum),B1 (anomalum) and D1 (thurberi) hexaploidsare also rather highly self-fertile, while in the D5(raimondii) hexaploids boll set was occasional(Brown, 1951).
The bolls produced in the two hexaploidsinvolving D5 genome were smaller in size thanthe hirsutum but larger than the diploidraimondii. The fibres produced on the hexaploidseeds are light brown in colour, shorter in lengthand less dense than the fibres on seeds of theupland cotton probably due to dominant influenceof G. raimondii (Plate I-Fig.17 & 20). Beasley(1940) also reported similar results, in thehexaploids [2 (AD)1 D2], G. hirsutum x G.harknessii and [2 (AD)1 C1], G. hirsutum x G.sturtianum.
In the development of intergenomic hybridsfor resistance, a thorough knowledge about thechromosomal behaviour in hybrids is essentialas it forms the basic information over which thebreeding programme is formulated. Cytologicalstudy helps in establishing desired forms in amore precise way within a shorter span of time.In the present study, in diploid and tetraploid
species, normal orientation, association anddisjunction of chromosomes were observedwhile in triploids and hexaploids, low frequencyof trivalents, quadrivalents and pentavalentsbesides univalents and bivalents wereobserved. The cytological analysis in the F1hybrids, G. hirsutum (MCU 5) x G. raimondii[(AD)1 D5] and G. hirsutum (MCU 7) x G.raimondii [(AD)1 D5] showed the meanpairing association of 11.50 I + 9.97 II + 2.31III + 0.16 IV and 13.50 I + 11.35 II + 0.96 IIIrespectively (Table 1). The chromosomeassociation observed in these hybrids did notmarkedly differ from earlier report (Barducciand Madoo, 1940). Mehetre et al. (2002)observed on an average of 12.78 I 11.13 II +1.32 III at metaphase I of F1 hybrid involvingG. hirsutum CMS x G. raimondii. Similarresults were also noticed by Mehetre et al.(2003). A high frequency of trivalents (2.31)and as high as 4 trivalents in majority of PMC’s(18.75 %) observed, indicate partial homologyof D5 chromosomes with A and Dchromosomes of cultivated tetraploids.
The hexaploids G. hirsutum (MCU 5) x G.raimondii [2(AD)1D5] showed a meanassociation of 4.05 I + 26.91 II + 4.55 III +1.23 IV + 0.32 V (Table 2). Iyengar (1944)and Brown (1951) also recorded similar resultsof mean association 2.32 I + 32.25 II + 0.86 III+ 1.75 IV + 0.02 V + 0.04 VI and 1.26 I +25.81 II + 1.18 III + 5.19 IV respectively. Butthe other hexaploid G. hirsutum (MCU 7) x G.raimondii [2(AD)1D5] showed a meanassociation of 24.55 I + 19.68 II + 3.73 III +0.73 IV (Table 2) indicating diverse geneticconstitution of parents.
The formation of trivalents and higherchromosome associations in triploids andhexaploids indicate the pairing affinitiesbetween the genome involved. Endrizzi (1962)reported that the main force, which controlsregular pairing behaviour in Gossypium, is thedifferences in the degree of chromosome
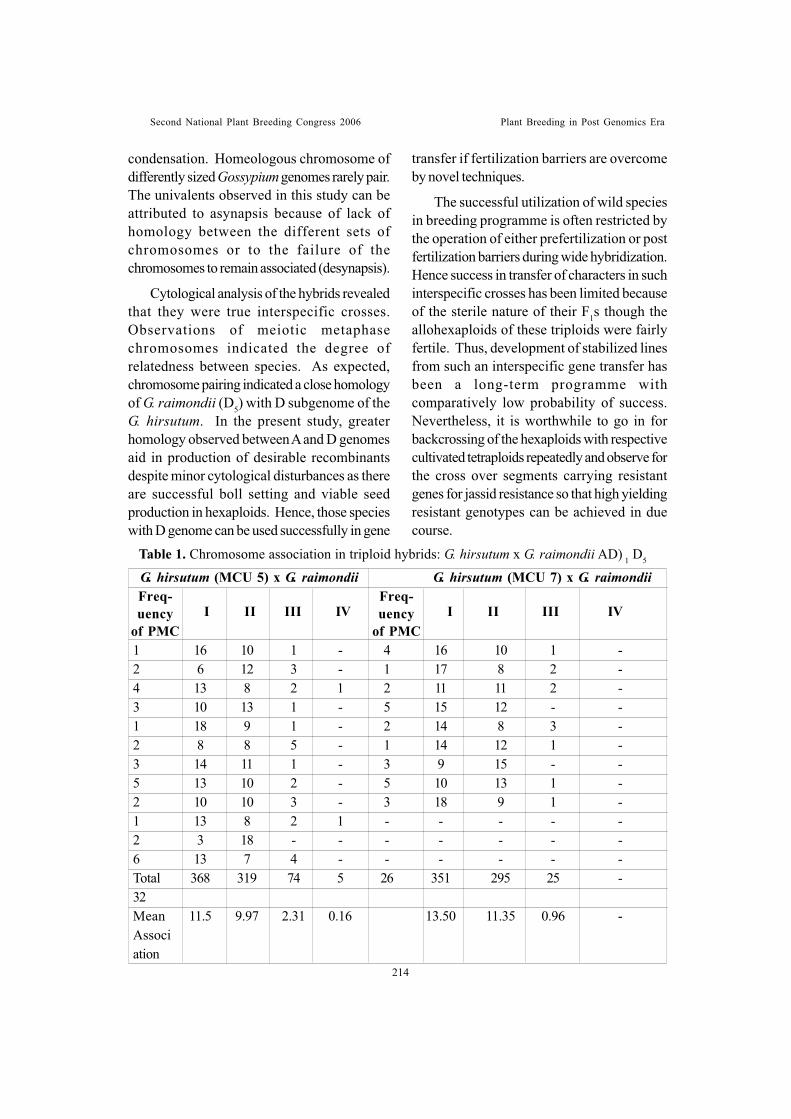
Second National Plant Breeding Congress 2006 Plant Breeding in Post Genomics Era
condensation. Homeologous chromosome ofdifferently sized Gossypium genomes rarely pair.The univalents observed in this study can beattributed to asynapsis because of lack ofhomology between the different sets ofchromosomes or to the failure of thechromosomes to remain associated (desynapsis).
Cytological analysis of the hybrids revealedthat they were true interspecific crosses.Observations of meiotic metaphasechromosomes indicated the degree ofrelatedness between species. As expected,chromosome pairing indicated a close homologyof G. raimondii (D5) with D subgenome of theG. hirsutum. In the present study, greaterhomology observed between A and D genomesaid in production of desirable recombinantsdespite minor cytological disturbances as thereare successful boll setting and viable seedproduction in hexaploids. Hence, those specieswith D genome can be used successfully in gene
transfer if fertilization barriers are overcomeby novel techniques.
The successful utilization of wild speciesin breeding programme is often restricted bythe operation of either prefertilization or postfertilization barriers during wide hybridization.Hence success in transfer of characters in suchinterspecific crosses has been limited becauseof the sterile nature of their F1s though theallohexaploids of these triploids were fairlyfertile. Thus, development of stabilized linesfrom such an interspecific gene transfer hasbeen a long-term programme withcomparatively low probability of success.Nevertheless, it is worthwhile to go in forbackcrossing of the hexaploids with respectivecultivated tetraploids repeatedly and observe forthe cross over segments carrying resistantgenes for jassid resistance so that high yieldingresistant genotypes can be achieved in duecourse.
Table 1. Chromosome association in triploid hybrids: G. hirsutum x G. raimondii AD) 1 D5
1 16 10 1 - 4 16 10 1 -2 6 12 3 - 1 17 8 2 -4 13 8 2 1 2 11 11 2 -3 10 13 1 - 5 15 12 - -1 18 9 1 - 2 14 8 3 -2 8 8 5 - 1 14 12 1 -3 14 11 1 - 3 9 15 - -5 13 10 2 - 5 10 13 1 -2 10 10 3 - 3 18 9 1 -1 13 8 2 1 - - - - -2 3 18 - - - - - - -6 13 7 4 - - - - - -Total 368 319 74 5 26 351 295 25 -32Mean 11.5 9.97 2.31 0.16 13.50 11.35 0.96 -Association
I II III IV I II III IV
G. hirsutum (MCU 5) x G. raimondii G. hirsutum (MCU 7) x G. raimondiiFreq-uency
of PMC
Freq-uency
of PMC
214
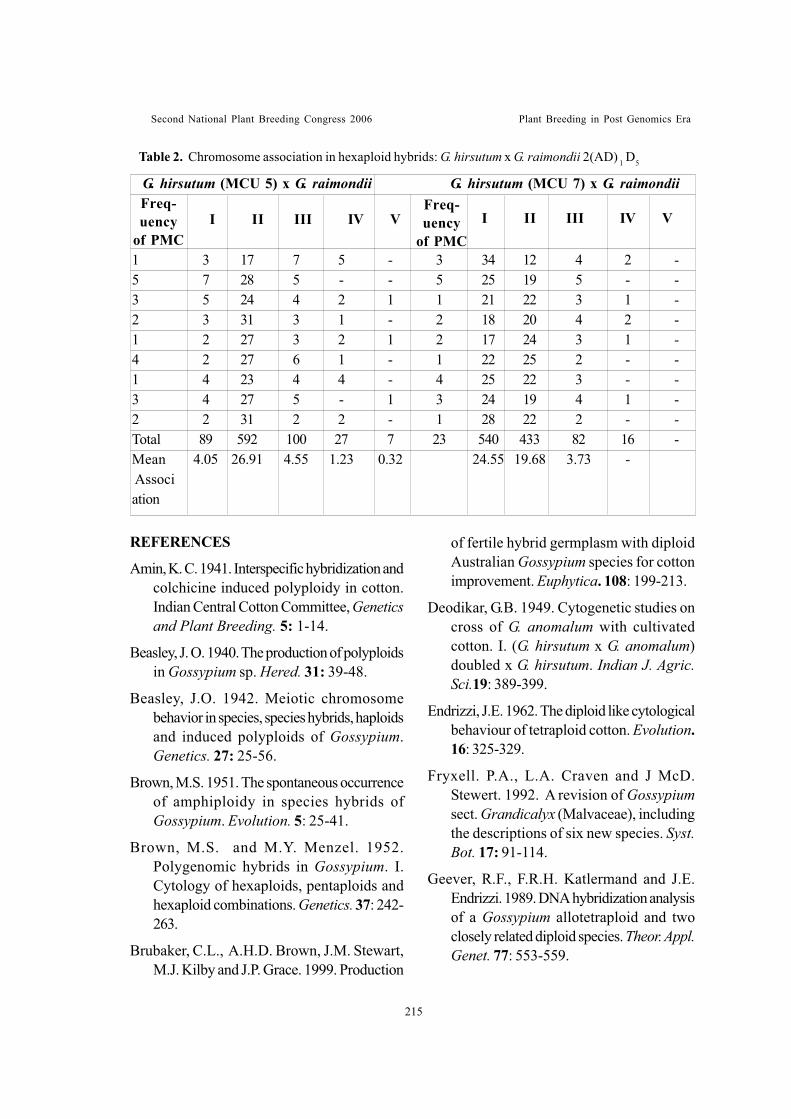
Second National Plant Breeding Congress 2006 Plant Breeding in Post Genomics Era
215
Table 2. Chromosome association in hexaploid hybrids: G. hirsutum x G. raimondii 2(AD) 1 D5
REFERENCES
Amin, K. C. 1941. Interspecific hybridization andcolchicine induced polyploidy in cotton.Indian Central Cotton Committee, Geneticsand Plant Breeding. 5: 1-14.
Beasley, J. O. 1940. The production of polyploidsin Gossypium sp. Hered. 31: 39-48.
Beasley, J.O. 1942. Meiotic chromosomebehavior in species, species hybrids, haploidsand induced polyploids of Gossypium.Genetics. 27: 25-56.
Brown, M.S. 1951. The spontaneous occurrenceof amphiploidy in species hybrids ofGossypium. Evolution. 5: 25-41.
Brown, M.S. and M.Y. Menzel. 1952.Polygenomic hybrids in Gossypium. I.Cytology of hexaploids, pentaploids andhexaploid combinations. Genetics. 37: 242-263.
Brubaker, C.L., A.H.D. Brown, J.M. Stewart,M.J. Kilby and J.P. Grace. 1999. Production
of fertile hybrid germplasm with diploidAustralian Gossypium species for cottonimprovement. Euphytica. 108: 199-213.
Deodikar, G.B. 1949. Cytogenetic studies oncross of G. anomalum with cultivatedcotton. I. (G. hirsutum x G. anomalum)doubled x G. hirsutum. Indian J. Agric.Sci.19: 389-399.
Endrizzi, J.E. 1962. The diploid like cytologicalbehaviour of tetraploid cotton. Evolution.16: 325-329.
Fryxell. P.A., L.A. Craven and J McD.Stewert. 1992. A revision of Gossypiumsect. Grandicalyx (Malvaceae), includingthe descriptions of six new species. Syst.Bot. 17: 91-114.
Geever, R.F., F.R.H. Katlermand and J.E.Endrizzi. 1989. DNA hybridization analysisof a Gossypium allotetraploid and twoclosely related diploid species. Theor. Appl.Genet. 77: 553-559.
1 3 17 7 5 - 3 34 12 4 2 -5 7 28 5 - - 5 25 19 5 - -3 5 24 4 2 1 1 21 22 3 1 -2 3 31 3 1 - 2 18 20 4 2 -1 2 27 3 2 1 2 17 24 3 1 -4 2 27 6 1 - 1 22 25 2 - -1 4 23 4 4 - 4 25 22 3 - -3 4 27 5 - 1 3 24 19 4 1 -2 2 31 2 2 - 1 28 22 2 - -Total 89 592 100 27 7 23 540 433 82 16 -Mean 4.05 26.91 4.55 1.23 0.32 24.55 19.68 3.73 - Association
I II III IV V
G. hirsutum (MCU 5) x G. raimondii G. hirsutum (MCU 7) x G. raimondiiFreq-uency
of PMC
Freq-uency
of PMCI II III IV V
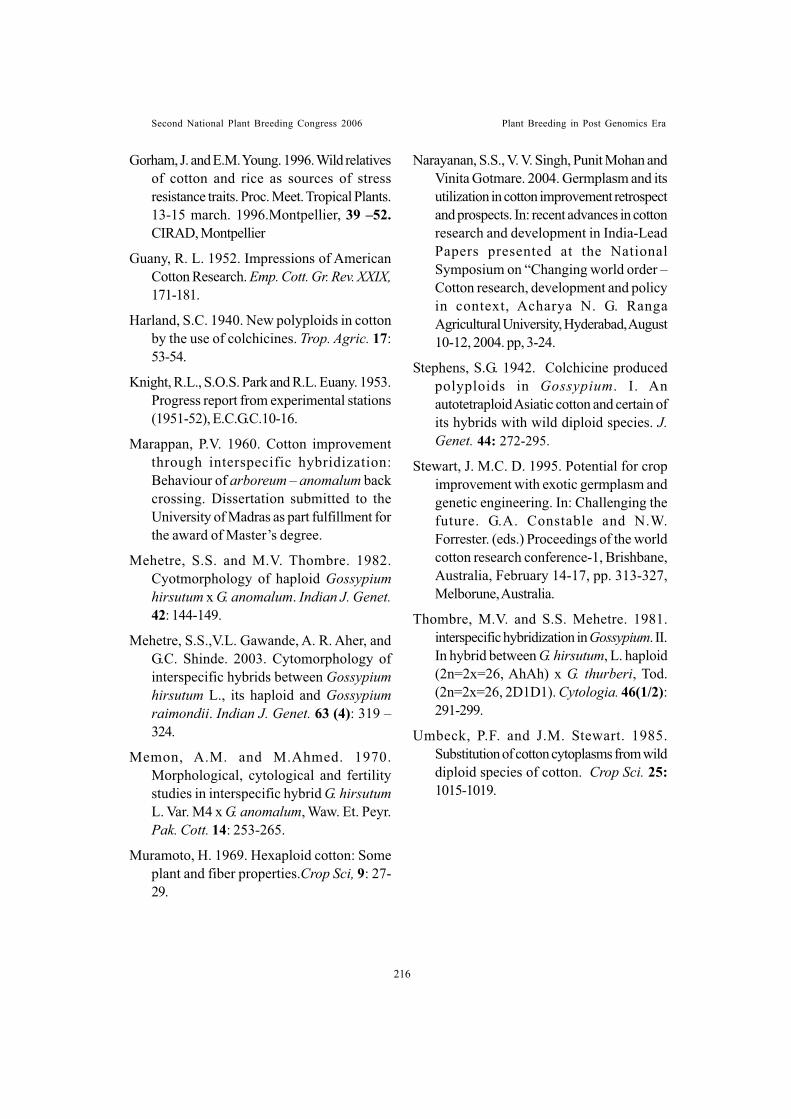
Second National Plant Breeding Congress 2006 Plant Breeding in Post Genomics Era
Gorham, J. and E.M. Young. 1996. Wild relativesof cotton and rice as sources of stressresistance traits. Proc. Meet. Tropical Plants.13-15 march. 1996.Montpellier, 39 –52.CIRAD, Montpellier
Guany, R. L. 1952. Impressions of AmericanCotton Research. Emp. Cott. Gr. Rev. XXIX,171-181.
Harland, S.C. 1940. New polyploids in cottonby the use of colchicines. Trop. Agric. 17:53-54.
Knight, R.L., S.O.S. Park and R.L. Euany. 1953.Progress report from experimental stations(1951-52), E.C.G.C.10-16.
Marappan, P.V. 1960. Cotton improvementthrough interspecific hybridization:Behaviour of arboreum – anomalum backcrossing. Dissertation submitted to theUniversity of Madras as part fulfillment forthe award of Master’s degree.
Mehetre, S.S. and M.V. Thombre. 1982.Cyotmorphology of haploid Gossypiumhirsutum x G. anomalum. Indian J. Genet.42: 144-149.
Mehetre, S.S.,V.L. Gawande, A. R. Aher, andG.C. Shinde. 2003. Cytomorphology ofinterspecific hybrids between Gossypiumhirsutum L., its haploid and Gossypiumraimondii. Indian J. Genet. 63 (4): 319 –324.
Memon, A.M. and M.Ahmed. 1970.Morphological, cytological and fertilitystudies in interspecific hybrid G. hirsutumL. Var. M4 x G. anomalum, Waw. Et. Peyr.Pak. Cott. 14: 253-265.
Muramoto, H. 1969. Hexaploid cotton: Someplant and fiber properties.Crop Sci, 9: 27-29.
Narayanan, S.S., V. V. Singh, Punit Mohan andVinita Gotmare. 2004. Germplasm and itsutilization in cotton improvement retrospectand prospects. In: recent advances in cottonresearch and development in India-LeadPapers presented at the NationalSymposium on “Changing world order –Cotton research, development and policyin context, Acharya N. G. RangaAgricultural University, Hyderabad, August10-12, 2004. pp, 3-24.
Stephens, S.G. 1942. Colchicine producedpolyploids in Gossypium. I. Anautotetraploid Asiatic cotton and certain ofits hybrids with wild diploid species. J.Genet. 44: 272-295.
Stewart, J. M.C. D. 1995. Potential for cropimprovement with exotic germplasm andgenetic engineering. In: Challenging thefuture. G.A. Constable and N.W.Forrester. (eds.) Proceedings of the worldcotton research conference-1, Brishbane,Australia, February 14-17, pp. 313-327,Melborune, Australia.
Thombre, M.V. and S.S. Mehetre. 1981.interspecific hybridization in Gossypium. II.In hybrid between G. hirsutum, L. haploid(2n=2x=26, AhAh) x G. thurberi, Tod.(2n=2x=26, 2D1D1). Cytologia. 46(1/2):291-299.
Umbeck, P.F. and J.M. Stewart. 1985.Substitution of cotton cytoplasms from wilddiploid species of cotton. Crop Sci. 25:1015-1019.
216
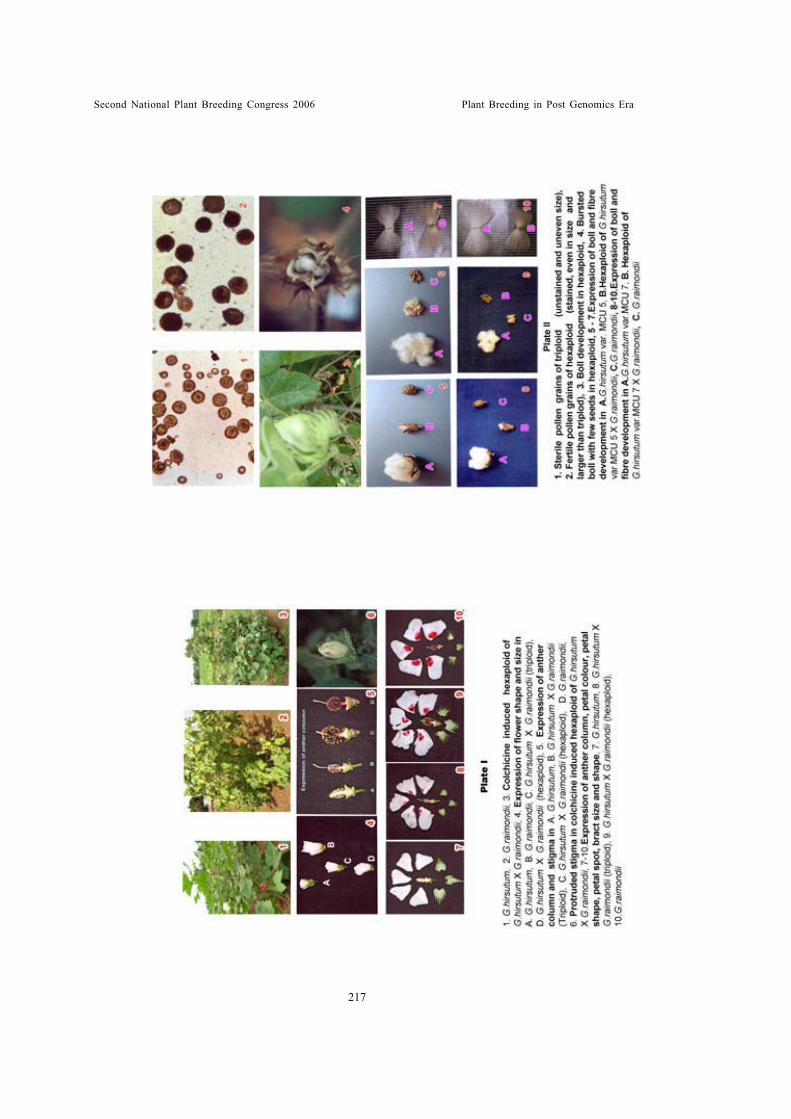
Second National Plant Breeding Congress 2006 Plant Breeding in Post Genomics Era
217
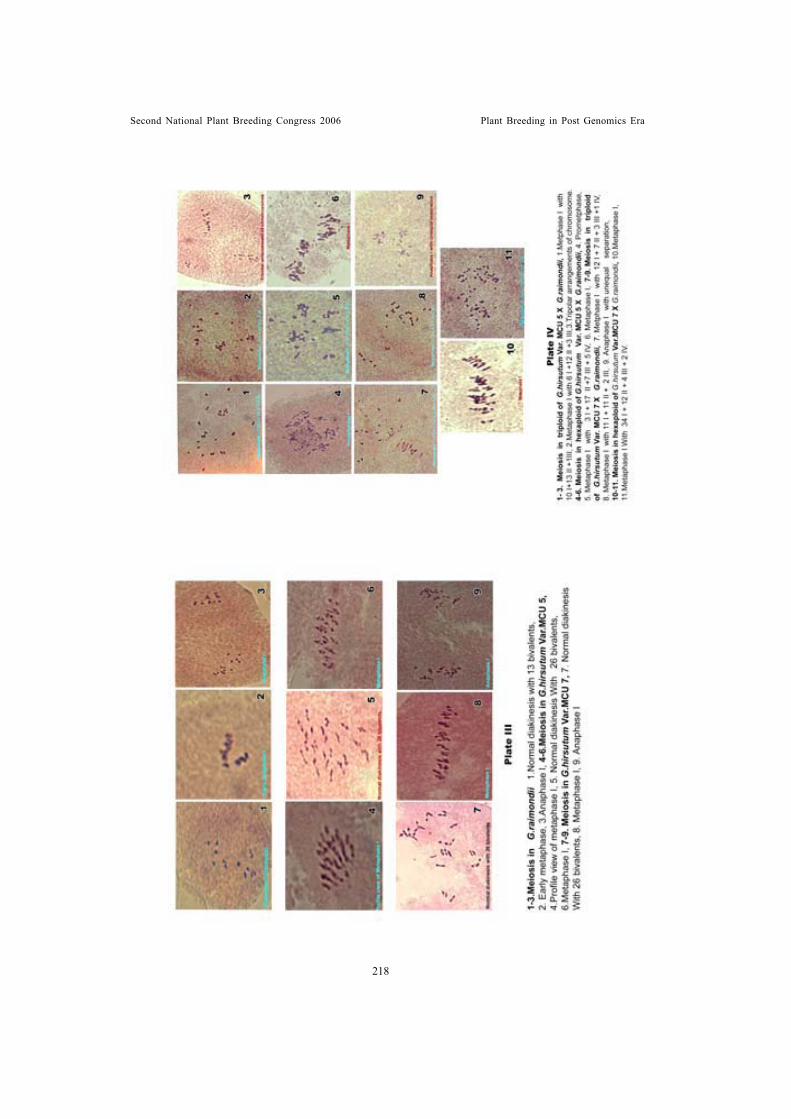
Second National Plant Breeding Congress 2006 Plant Breeding in Post Genomics Era
218
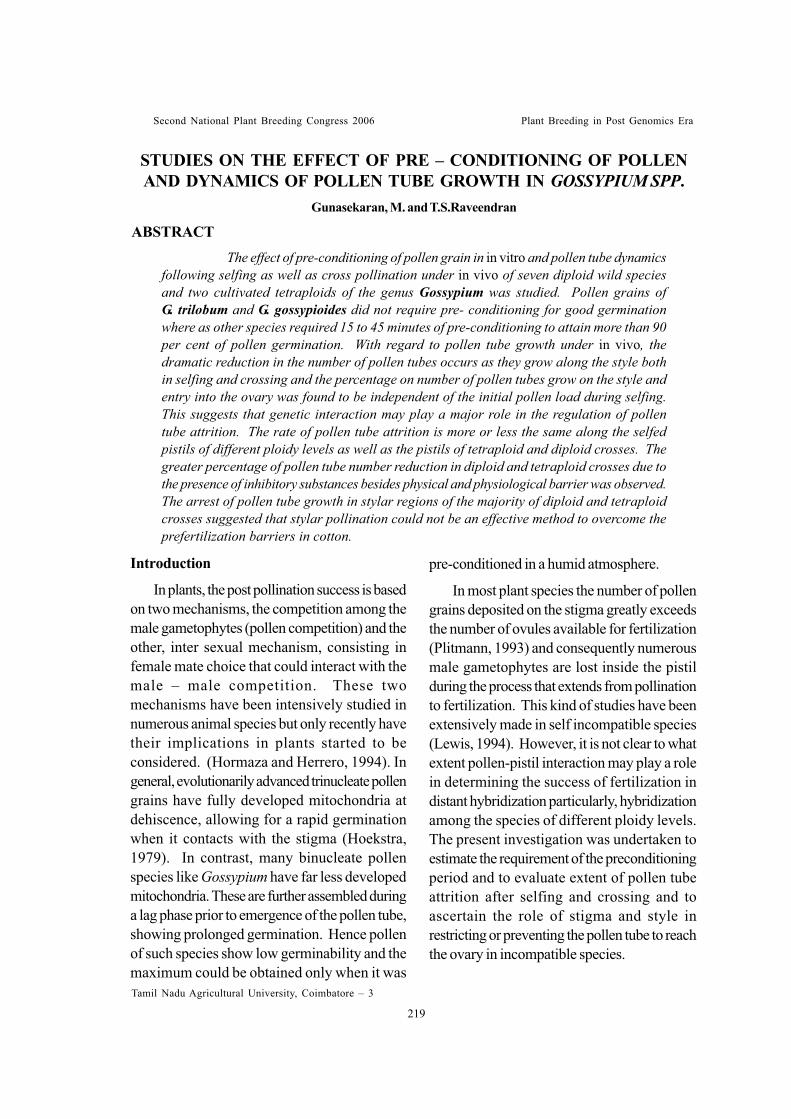
Second National Plant Breeding Congress 2006 Plant Breeding in Post Genomics Era
STUDIES ON THE EFFECT OF PRE – CONDITIONING OF POLLENAND DYNAMICS OF POLLEN TUBE GROWTH IN GOSSYPIUM SPP.
Gunasekaran, M. and T.S.Raveendran
ABSTRACTThe effect of pre-conditioning of pollen grain in in vitro and pollen tube dynamics
following selfing as well as cross pollination under in vivo of seven diploid wild speciesand two cultivated tetraploids of the genus Gossypium was studied. Pollen grains ofG. trilobum and G. gossypioides did not require pre- conditioning for good germinationwhere as other species required 15 to 45 minutes of pre-conditioning to attain more than 90per cent of pollen germination. With regard to pollen tube growth under in vivo, thedramatic reduction in the number of pollen tubes occurs as they grow along the style bothin selfing and crossing and the percentage on number of pollen tubes grow on the style andentry into the ovary was found to be independent of the initial pollen load during selfing.This suggests that genetic interaction may play a major role in the regulation of pollentube attrition. The rate of pollen tube attrition is more or less the same along the selfedpistils of different ploidy levels as well as the pistils of tetraploid and diploid crosses. Thegreater percentage of pollen tube number reduction in diploid and tetraploid crosses due tothe presence of inhibitory substances besides physical and physiological barrier was observed.The arrest of pollen tube growth in stylar regions of the majority of diploid and tetraploidcrosses suggested that stylar pollination could not be an effective method to overcome theprefertilization barriers in cotton.
Introduction
In plants, the post pollination success is basedon two mechanisms, the competition among themale gametophytes (pollen competition) and theother, inter sexual mechanism, consisting infemale mate choice that could interact with themale – male competition. These twomechanisms have been intensively studied innumerous animal species but only recently havetheir implications in plants started to beconsidered. (Hormaza and Herrero, 1994). Ingeneral, evolutionarily advanced trinucleate pollengrains have fully developed mitochondria atdehiscence, allowing for a rapid germinationwhen it contacts with the stigma (Hoekstra,1979). In contrast, many binucleate pollenspecies like Gossypium have far less developedmitochondria. These are further assembled duringa lag phase prior to emergence of the pollen tube,showing prolonged germination. Hence pollenof such species show low germinability and themaximum could be obtained only when it wasTamil Nadu Agricultural University, Coimbatore – 3
pre-conditioned in a humid atmosphere.
In most plant species the number of pollengrains deposited on the stigma greatly exceedsthe number of ovules available for fertilization(Plitmann, 1993) and consequently numerousmale gametophytes are lost inside the pistilduring the process that extends from pollinationto fertilization. This kind of studies have beenextensively made in self incompatible species(Lewis, 1994). However, it is not clear to whatextent pollen-pistil interaction may play a rolein determining the success of fertilization indistant hybridization particularly, hybridizationamong the species of different ploidy levels.The present investigation was undertaken toestimate the requirement of the preconditioningperiod and to evaluate extent of pollen tubeattrition after selfing and crossing and toascertain the role of stigma and style inrestricting or preventing the pollen tube to reachthe ovary in incompatible species.
219
Second National Plant Breeding Congress 2006 Plant Breeding in Post Genomics Era
Materials and Methods
Seven wild diploid species viz., G.thurberi,G.armourianum G.davidsonii, G.gossypioides,G.trilobum, G. triphyllum and G. barbosanum(2n-26) and two cultivated tetraploid speciesG.hirsutum (Variety MCU 5 and MCU 9) andG.babadense (variety Suvin) (2n-52) weresubjected to investigation.
In vitro pollen grain studies
The pre-conditioning period for pollen grainsfor different species of the genus Gossypiumwas studied with pollen grains from freshlydehisced anthers and those after 15, 30 and 45minutes of dehiscence. The above pollen grainswere dusted on a drop of medium placed on acavity slide and observed under microscope. Thematerials were replicated three times with fiveslides per replication. The duration of pre-conditioning period for each species wasassessed by recording the percentage of pollengermination. The percentage values weretransformed into angles and analysed inCompletely Randomised Design (CRD) andtransformed means were compared withDuncan’s Multiple Range Test.
In vivo pollen tube growth studies
Self pollinated pistils and cross pollinatedpistils of direct and reciprocal combinations ofabove parents were collected at 2,10,12 and 24hours after pollination, fixed in 6:3:1 (ethanol :chloroform : acetic acid) fixative and stored at4-10oC for 24 hours. The pistils were thentransferred to 70 per cent ethanol and stored inrefrigerator till further use. For in vivo studies,the pistils taken out from fixative were washedwith distilled water three to four times and thenmacerated in 10 N NaOH for 10 hours (whendiploid was used as female parent). Then theywere thoroughly washed in distilled water andstained for four hours to 12 hours in 0.3 per centaniline blue prepared in 0.1 N K3PO4. Thestained pistils were placed on a glass slide
containing a drop of glycerol and covered with23 x 30 mm coverslip and gently pressed. Theslides were observed under Nikon – Microphot– Fx microscope with fluorescenceattachement, illuminated with 200w highpressure ultraviolet lamp. The observationswere taken with B (380 – 490 nm) and BG(650 nm) excitation filters in combination withBA 520 barrier filters. The number of pollentubes on stigmatic surface, middle of the stylarregion and at the entry of ovary were recordedfrom 10 pistils per cross combination perreplicate and observations were recorded thrice.The data were analysed in CRD to find out thestatistical significance.
Results and Discussion
In vitro pollen germination studies
Among the seven wild and two cultivatedspecies studied, the freshly dehisced pollens ofG.gosssypioides and G.trilobum recordedmore than 90 per cent germination in artificialmedium and indicated that these two speciesare evolutionarily advanced and pollen grainsof these binucleate type equiped with fullydeveloped mitochondria, required activerespiration and quick pollen germination(Table1). The pollens of other species viz., G.thurberi, G.armourianum, G.davidsonii,G.hirsutum var. MCU 5 and MCU 9 required15 minutes of pre-conditioning to give more than90 per cent of pollen germination. Thepercentage of pollen germination was more than90 per cent in the species G.triphyllum,G.barbosanum and G.barbadense when theirpollens were placed in the medium for 45minutes after anther dehiscence. There werealso significant differences between thedifferent duration of pre-conditioning. ExceptG.trilobum and G. gossypioides, all the specieshad less than 90 per cent germination. G.thurberi, G. armourianum, G. davidsonii andthe cultivated G.hirsutum had higher pollengermination of more than 90 per cent which
220
Second National Plant Breeding Congress 2006 Plant Breeding in Post Genomics Era
sustained during subsequent treatments also.G.barbadense required minimum period of 30minutes per-conditioning while the two speciesG.triphyllum and G.barbosanum providedhigher percentage only after 45 minutes of pre-conditioning. The existence of variation in theduration of pre-conditioning in both ploidy levelsindicates that ploidy level did not have anyinfluence on the above phenomena. Stanley andLinkens (1974) also observed that in Petuniafreshly shed pollen showed low germinability andpre-conditioning improved the germination.
According to Bar-Shalom and Mattsson(1977) the pollen from plants of wet stigma typeis often found to germinate readily in liquid mediawith appropriate osmotic balance. In contrast,pollen from species possessing dry stigma oftenrequires special condition to establish somethingnear a natural hydration rate. The present studyreveals the existence of species variation for thepre-conditioning in the genus Gossypium. It alsoindicated that the level of phylogeneticadvancement of the male gametophyte ischaracterized by the overall state of metabolicdevelopment at dehiscence rather than by thenumber of generative cells or ploidy level of thepollen.
In vivo pollen tube growth studies
The number of pollen tubes at stigmatic,stylar and at the entry of ovary in selfing ofparents, diploid x tetraploid and tetraploid x diploidcross combinations is presented in the Tables 2,3 & 4 respectively. The results showed dramaticreduction in the number of pollen tubes as theygrew along the style both in selfing as well ascrossing in Gossypium species and thisphenomenon appears to be consistent uponselfing. However, significant differences amongthe number of pollen tubes on the entry of ovaryin different species showed the presence ofgenetic variability among the species studied.Different number of pollen tubes grew in thestyle depending on the initial number of pollen
grains deposited. However, the presentreduction in the number of pollen tubes wasindependent of the initial load during selfing, withthe number of pollen tubes reaching the ovarybeing more or less similar. The reduction inthe number of pollen tubes passed on the stylarand entry of ovary region in diploid x tetraploidand tetraploid x diploid cross combinations wasfound to be higher than in selfing and suggestedthat the genetic interactions may play a role inthe regulation of the pollen tube attrition.
Although many studies in other species haveshown (Herrero and Dickinson, 1980; Pimientaet al. 1983; Herrero 1992) reduction in thenumber of pollen tubes growing down the style,only in few cases the pattern has been studied.The main bottleneck seems to be the upperportion of the style in Brassica oleracea andCucurbita pepo (Ockendon and Gates, 1975and Winsor and Stephenson, 1995). Penetrabilyis limited to one pollen tube irrespective of morepollen tubes formed in Triticum durum(Rudramuniappa and Panchaksharappa, 1974).
In the present study, gradual reduction inthe number of pollen tubes occur along the styleand only 6.9 (G.thurberi) to 26.11 (G.hirsutumvar. MCU 9) per cent of total pollen tubesreached the ovary in self pollinated pistils. Thissuggested that the selection pressure inGossypium species appears to occur along theentire style length.
It is believed that two main forces coulddetermine such a reduction of malegametophyte in the pistil. One force could bethe differences in competitive ability of the pollenand the other could be a modulation of thesedifferences by the pistil. This modulation wouldcomprise both physical and physiologicalconstraints and genetics of pollen – pistilinteraction as was reported by Hormaza andHerrero (1994). According to Herrero (1992)the width of the transmitting tissue of the stylewould be a physiological limitation while physical
221
Second National Plant Breeding Congress 2006 Plant Breeding in Post Genomics Era
limitation include restriction in the nutrient supply.The bionuleate pollen, as in the case of cropunder investigation, after an initial period ofautotrophic growth, grows heterotrophicallyconsuming large amount of nutrients required toproduce cell wall from stylar tissues. Thistrophic dependence allows the pistil to influencethe pollen tube growth rate and dynamics.
In the present investigation, in diploid xtetraploid crosses out of 21 crosses, pollen tubereached the entry of ovary only in nine crosses.Such greater percentage of reduction in pollentube number can be attributed to the presenceof inhibitory substances besides the physical andphysiological barriers. It is also observed fromthe present study that the fertilization does notdepend uniquely on passive physical orphysiological constraints by the pistil, but also onthe genetic interactions among the malegemetophytes and between the malegemetophytes and female tissues and appearsthis type of interactions are probably superimposed.
REFERENCES
Bar-Shalom, D. and Mattsson, O. (1977). Modeof hybridization as an important factor in thegermination of trinucleate pollen grains. Bot.Tiddskv. 77 : 254 – 257.
Herrero, M and Dickinson, H.G. (1980). Pollentube growth following compatible andincompatible interspecific pollinations inPetunia hybrida. 148 : 217-221.
Herrero, M. (1992). From pollination tofertilization in fruit trees. Plant GrowthRegul, 11 : 27-32.
Hormaza, J.I. and M. Herrero. (1994).Gametophytic competition and selection. I.Williams E.G., Clarke, A.E., Knox R.B.(eds.). Genetic control of incompatibility andreproductive development in floweringplants. Kluwer, Dordrecht. PP 372 – 400.
Hoekstra, F.A., (1979). Mitochondrialdevelopment and activity of binucleate andtrinucleate pollen during germination invitro. Planta, 145 : 25-26.
Lewis, D. (1994). Gametophytic – sporophyticincompatibility. In : Williams E.G., B.R.Know and A.E. Clarke (eds). Geneticcontrol of incompatibility and reproductivedevelopment in flowering plants. Kluwer,Dordrecht. Pp 88-107.
Ockendon, D.J. and Gates, P.J. (1975). Growthof cross and self pollen tubes in the styleof Brassica oleracea. New Phytol. 75 :155 – 160.
Pimienta, E., V.S. Polito and D.E. Kester(1983). Pollen tube growth in cross and selfpollinated ‘Nonpareil’ almond. J. Ann. Soc.Horti. Sci. 108 : 643 – 647.
Plitmann, U. (1993). Pollen tube attrition asrelated to breeding systems inBrassicaceae. Plant. Syst. Evol. 188 : 65-72.
Rudramuniyappa, C.K. and Panchaksharappa,M.G. (1974). Histochemistry of pollen tubegrowth in vivo in Triticum durum. Desf.Cytologica. 39 : 665-671.
Stanley, R.G. and H.F. Linkens (1974). Pollen :Biology, Biochemistry and Management.Springer – Verlag, Berlin.
Winsor, J.A. and Stephenson, A.G. (1995).Demographics of pollen tube growth inCucurbita pepo. Can. J. Bot, 73 : 583 :589.
222
Second National Plant Breeding Congress 2006 Plant Breeding in Post Genomics Era
Table 1. Pre-conditioning of pollen grain of parents
In a column, means followed by common letters are not significantly different at the 5% levelby DMRT. Percentage values are in parentheses
Table 2. Number and percentage (in brackets) of pollen tubes at stigmatic and stylar regions and entry into ovary in parents upon selfing
G. armourianum 68.62 b(86.71) 77.54 b(95.3) 78.06 bcd(95.7) 78.00 b(95.7)G. armourianum 68.62 b(86.71) 77.54 b(95.3) 78.06 bcd(95.7) 78.00 b(95.7)G. davidsonii 64.97 c(82.09) 80.12 ab(97.0) 79.04 a-d(96.3) 79.50 ab(96.7)G. gossypioides 80.33 a(96.95) 80.12 ab(97.0) 80.11 ab(97.) 80.91 ab(97.3)G. trilobum 81.12 a(97.61) 80.64 a(97.3) 81.25 a(97.7) 80.64 ab(97.3)G. triphyllum 45.66 e(51.15) 56.17 c(69.0) 67.49 e(85.3) 74.34 c(92.7)G. barbosanum 47.22e(53.87) 57.42 c(71.0) 68.60 e(86.7) 78.52 b(96.0)G. hirsutum var. MCU 5 66.09(83.56) 80.27 ab(97.0) 80.64 a(97.3) 80.64 ab(97.3)G. hirsutum var. MCU 9 69.15b(87.31) 78.10 ab(95.7) 79.50 abc(96.7) 82.05 a(98.0)G. barbadense var. Suvin 58.62d(72.88) 68.87 b(87.0) 77.54 cd(95.3) 78.98 b(96.3)SE 0.829 0.899 0.788 0.887CD (5%) 2.447 2.696 2.324 2.617
Species Pollen germination (%) min. after dehiscence of antherFreshly shed pollen 15 30 45
G. thurberi 197-247 231(100) 133-172 160(69.3) 37-64 16(6.9)G. armourianum 206-216 213(100) 106-159 110(51.6) 40-52 45(21.3)G. davidsonii 198-258 240(100) 127-175 158(65.5) 50-55 53(22.1)G. gossypioides 219-278 237(100) 127-173 140(59.1) 41-61 46(19.4)G. trilobum 229-265 254(100) 138-170 151(59.4) 32-55 47(18.5)G. triphyllum 180-250 231(100) 116-192 129(55.8) 46.65 52(22.5)G. barbosanum 212-247 235(100) 102-157 139(59.1) 42.55 46(19.6)G. hirsutum var. MCU 5 190-290 278(100) 135-182 179(64.3) 55.82 68(24.5)G. hirsutum var. MCU 9 202-271 265(100) 123-177 160(60.4) 56.79 69(26.1)G. barbadense var. Suvin 296-318 310(100) 175-212 198(63.9) 73.95 80(25.8)SE 8.94 7.98 5.14CD (%) 28.16 24.88 16.19
ParentsNo. of pollen tubes
Stigmatic region Middle of the style Entry into ovaryRange Mean Range RangeMean Mean
223
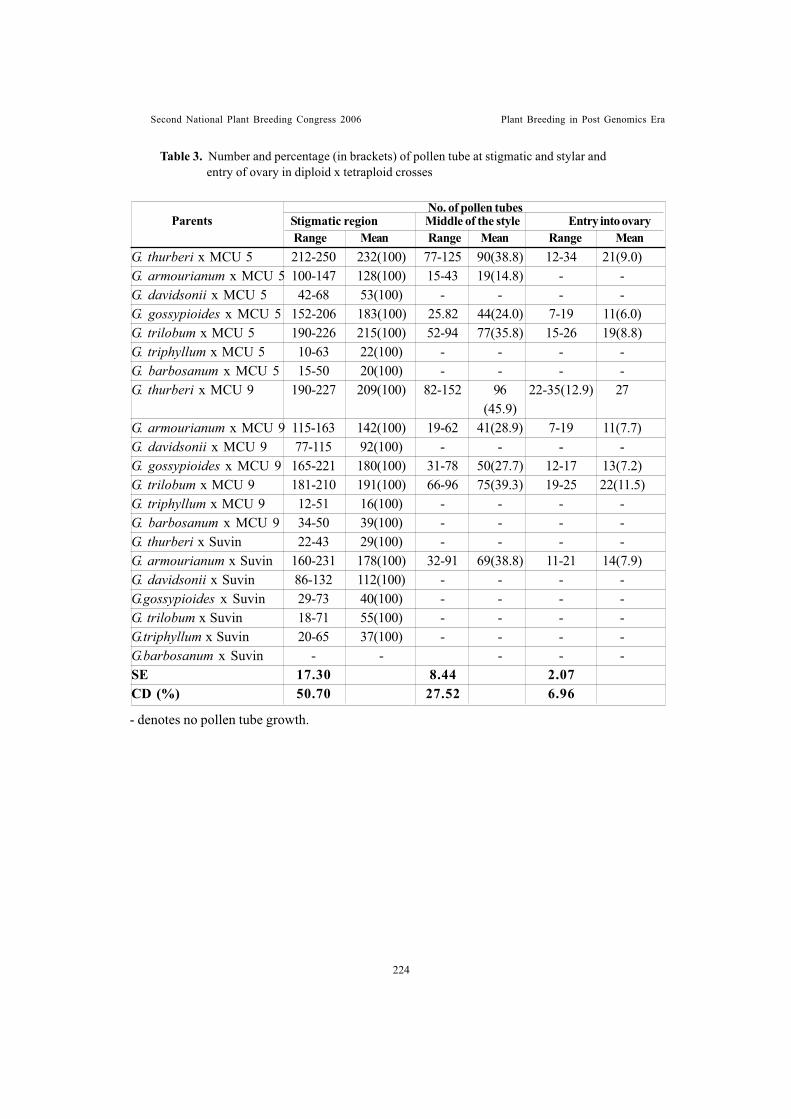
Second National Plant Breeding Congress 2006 Plant Breeding in Post Genomics Era
Table 3. Number and percentage (in brackets) of pollen tube at stigmatic and stylar andentry of ovary in diploid x tetraploid crosses
- denotes no pollen tube growth.
G. thurberi x MCU 5 212-250 232(100) 77-125 90(38.8) 12-34 21(9.0)G. armourianum x MCU 5 100-147 128(100) 15-43 19(14.8) - -G. davidsonii x MCU 5 42-68 53(100) - - - -G. gossypioides x MCU 5 152-206 183(100) 25.82 44(24.0) 7-19 11(6.0)G. trilobum x MCU 5 190-226 215(100) 52-94 77(35.8) 15-26 19(8.8)G. triphyllum x MCU 5 10-63 22(100) - - - -G. barbosanum x MCU 5 15-50 20(100) - - - -G. thurberi x MCU 9 190-227 209(100) 82-152 96 22-35(12.9) 27
(45.9)G. armourianum x MCU 9 115-163 142(100) 19-62 41(28.9) 7-19 11(7.7)G. davidsonii x MCU 9 77-115 92(100) - - - -G. gossypioides x MCU 9 165-221 180(100) 31-78 50(27.7) 12-17 13(7.2)G. trilobum x MCU 9 181-210 191(100) 66-96 75(39.3) 19-25 22(11.5)G. triphyllum x MCU 9 12-51 16(100) - - - -G. barbosanum x MCU 9 34-50 39(100) - - - -G. thurberi x Suvin 22-43 29(100) - - - -G. armourianum x Suvin 160-231 178(100) 32-91 69(38.8) 11-21 14(7.9)G. davidsonii x Suvin 86-132 112(100) - - - -G.gossypioides x Suvin 29-73 40(100) - - - -G. trilobum x Suvin 18-71 55(100) - - - -G.triphyllum x Suvin 20-65 37(100) - - - -G.barbosanum x Suvin - - - - -SE 17.30 8.44 2.07CD (%) 50.70 27.52 6.96
No. of pollen tubesStigmatic region Middle of the style Entry into ovaryRange Mean Range RangeMean Mean
Parents
224
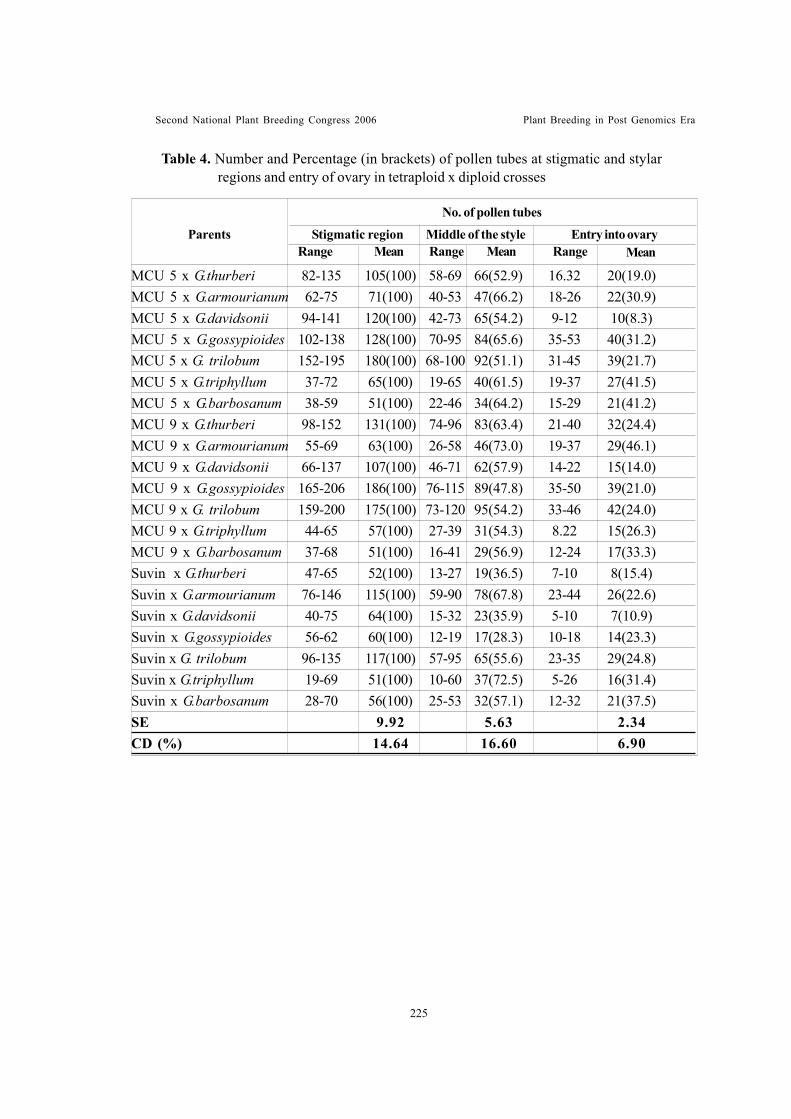
Second National Plant Breeding Congress 2006 Plant Breeding in Post Genomics Era
Table 4. Number and Percentage (in brackets) of pollen tubes at stigmatic and stylarregions and entry of ovary in tetraploid x diploid crosses
MCU 5 x G.thurberi 82-135 105(100) 58-69 66(52.9) 16.32 20(19.0)MCU 5 x G.armourianum 62-75 71(100) 40-53 47(66.2) 18-26 22(30.9)MCU 5 x G.davidsonii 94-141 120(100) 42-73 65(54.2) 9-12 10(8.3)MCU 5 x G.gossypioides 102-138 128(100) 70-95 84(65.6) 35-53 40(31.2)MCU 5 x G. trilobum 152-195 180(100) 68-100 92(51.1) 31-45 39(21.7)MCU 5 x G.triphyllum 37-72 65(100) 19-65 40(61.5) 19-37 27(41.5)MCU 5 x G.barbosanum 38-59 51(100) 22-46 34(64.2) 15-29 21(41.2)MCU 9 x G.thurberi 98-152 131(100) 74-96 83(63.4) 21-40 32(24.4)MCU 9 x G.armourianum 55-69 63(100) 26-58 46(73.0) 19-37 29(46.1)MCU 9 x G.davidsonii 66-137 107(100) 46-71 62(57.9) 14-22 15(14.0)MCU 9 x G.gossypioides 165-206 186(100) 76-115 89(47.8) 35-50 39(21.0)MCU 9 x G. trilobum 159-200 175(100) 73-120 95(54.2) 33-46 42(24.0)MCU 9 x G.triphyllum 44-65 57(100) 27-39 31(54.3) 8.22 15(26.3)MCU 9 x G.barbosanum 37-68 51(100) 16-41 29(56.9) 12-24 17(33.3)Suvin x G.thurberi 47-65 52(100) 13-27 19(36.5) 7-10 8(15.4)Suvin x G.armourianum 76-146 115(100) 59-90 78(67.8) 23-44 26(22.6)Suvin x G.davidsonii 40-75 64(100) 15-32 23(35.9) 5-10 7(10.9)Suvin x G.gossypioides 56-62 60(100) 12-19 17(28.3) 10-18 14(23.3)Suvin x G. trilobum 96-135 117(100) 57-95 65(55.6) 23-35 29(24.8)Suvin x G.triphyllum 19-69 51(100) 10-60 37(72.5) 5-26 16(31.4)Suvin x G.barbosanum 28-70 56(100) 25-53 32(57.1) 12-32 21(37.5)SE 9.92 5.63 2.34CD (%) 14.64 16.60 6.90
No. of pollen tubes
Stigmatic region Middle of the style Entry into ovaryRange Mean Range RangeMean Mean
Parents
225
Second National Plant Breeding Congress 2006 Plant Breeding in Post Genomics Era
CYTOLOGICAL ANALYSIS VIGNA RADIATA X V. UMBELLATA L.HYBRIDS
Pandiyan, M., B. Subbalakshmi, AR. Muthiah and M. Kumar
ABSTRACT
Among the twelve interspecific crosses attempted, seed set was observed in the entirecross combination except V.radiata x V.umbellata cross. The reason for no seed set couldbe attributed to complete pollen sterility. To asses the reasons for the high pollen sterility inthe F1, the cytogenetic. analysis of pollen mother cells (PMCs) was carried out. In thesterile interspecific hybrid, all types of abnormalities were observed. Out of 25 PMCsstudied at Anaphase 1., only one cell revealed 11 bivalents. The univalents and quadrivalentswere frequently observed. The number of univalents ranged from 0 to 14 while the numberof quadrivalents ranged from 0 to 5. The average chromosome association per cell was IV(1.28) + II (4.96) + I (6.96). Precarious separation of chromosomes and formation ofanaphase bridges was commonly observed in many PMCs.
The sporad count for parents and direct crosses were also studied. The highest numberof dyads (8 each) was observed both in V. radiata var. sublobata and V. radiata xV. radiata var. sublobata cross. The lowest number was observed in V. radiata x V. vexillataand V. radiata x V. hainiana. The triads and tetrads were observed in the all the crosscombinations except V. radiata x V. mungo var silvestris and V. radiata x V. hainiana.There was no seed set in back cross with both parents. To asses the reasons for the highfemale sterility in the F1, the cytogenetic analysis of megaspore cells was carried out. Alltypes of abnormalities were observed in the megaspore cells. The hybrid cell megasporecompletely degenerated. The occurrence of abnormal megaspore was frequently observedwhich leads to female sterility.
Tamil Nadu Agricultural University, Coimbatore - 641 003
226
Second National Plant Breeding Congress 2006 Plant Breeding in Post Genomics Era
TECHNICAL SESSION IV
HYBRID BREEDING IN CROPS
Second National Plant Breeding Congress 2006 Plant Breeding in Post Genomics Era
TRANSGENIC HYBRID COTTON TECHNOLOGYAND SOME GENETIC OBSERVATIONS
Narayanan, S.S.1
ABSTRACT
Heterosis has been effectively used in cotton to increase yield through expansion andharmonization in the expression of various yield influencing parameters and fibre quality,while concurrently broadening the adaptability to larger areas. The genetic engineeringadvances and thereby the incorporation of B.t gene (from Bacillus thuringiensis)technology for bollworm control into hybrid technology of cotton have not only enabled toachieve a quantum jump in yield, but also accelerated the process of privatization of R&Dand seed distribution on a more globally competitive scale. If heterosis exploitation is onemethod to rapidly increase the stagnating cotton yields, by incorporating Bt Cry 1Ac gene(transgenic hybrid), the hybrid will yield double benefit of yield improvement throughheterotic vigour for yield as well as consolidating the yield gains through bollworm controlat a reduced cost of production. Genotype deployment strategy, gene outsourcing technique,in-house germplasm development strategy for use as parents of hybrids, molecular evaluationstrategy, transgenic-conversion strategy, parental purity maintenance techniques, mass scalehybrid evaluation and selection techniques at initial and advanced testing stages and inmulti-location and market acceptability tests, strategy for developing competitive hybridsand placement in farms and meeting the expectations of spinners, technology for productionmanagement for maximizing the genetic potential for yield and fibre quality in transgenichybrids, scientific seed production practices for transgenic hybrids and systems for ensuringcost reduction and assured planting quality etc., independently and collectively representthe primary factors influencing the success and sustainability of the transgenic hybridtechnology.
Extra-long staple cottons are needed with 2.5% span length of >34 to 38mm, tensilestrength of >28-32 with 0.90 and above strength-length ratio, Micronair value of 3.6 to4.4 with ginning outturn >33-35 per cent. Parallel development of hirsutum andbarbadense germplasm using superior sources in global gene pool and identifying the bestcombinations for fibre quality and wide adaptation are suggested. Genetics in seed costreduction especially GMS, CMS-R or gametocide systems have not become successful normade any recognizable impact on seed production cost. Self-incompatibility induction throughbiotech approaches was indicated as alternatives and enable harvesting of crossed bollsfrom both parents projected, but still not turned into practical use. Private seed companiesand their R&D face the pressures from competition in the market based on grower acceptanceof the technology and generate partnerships with necessary agreements to advance in thisarea. If the public sector R&Ds can intensify their basic researches in this area, it wouldhelp the Indian seed industry to depend more on local technology and provide service atlower cost to farming community. In-house germplasm development in private seed industryhas gained momentum and is the primary source of parents in successful hybrids ratherthan acquired germplasm.
Development of marker systems such as RFLP, AFLPs, SSRs and SNPs considerablyfacilitated the estimation of genetic diversity. The use of molecular marker RestrictionFragment Length Polymorphism (RFLP) and coefficients of parentage for identifyingheterotic effects in cotton had been beneficial. Such study has been helpful in detecting
Retired Scientist, CICR, Nagpur & Research Advisor (cotton), JK Agri Genetics, Hyderabad
227
Second National Plant Breeding Congress 2006 Plant Breeding in Post Genomics Era
significant heterosis for total and first harvest yields, boll weight, lint percentage, andspan length of fibres. A large leaf area during seedling growth allows the F1 hybrids toabsorb more light than their parents, potentially resulting in increased photosynthetic activityper plant in cotton. Earliness in cotton should allow the maximum usable growing periodwithin the given seasonal limitations for effective lint production and expression of fibrequality attributes. A mismatch between Farmers’ and Breeders’ perception of genotypeproduct for a given area, i.e., a variety genotype or hybrid is sometimes responsible for thelapses in commercial realizations in the field as well as at the end-user level. During2005-06, Australia growing only variety has reported 2100 kg / ha average lint yield,while that of India it is only 460 kg / ha even with hybrids. Regarding Plant VarietiesProtection as per TRIPs, a system for protection has been established in India through thePatents Act and the Plant Variety and Farmers’ Rights Protection Act. The most relevantproprietary technologies and materials being developed all over the world are: (1)transformation systems (2) promoter systems (3) insect resistance genes (4) disease resistancegenes (5) selectable marker genes (6) genetic markers (7) drought resistance genes (8)fibre quality-enhancing genes especially for strength, elongation and length (9) diagnosticprobes and (10) others. Certain frequently asked questions for which more analytical geneticand breeding researches are needed have been listed in the paper. The transgenic hybridtechnology after facing initial resistance from certain farmers and others has now createda great demand from farmers as well as textile industry as it has helped to improve theproduction to more than 4 million tonnes and productivity to over 460kg/ha within 3 yearsof its introduction in India. In the world, several major cotton-growing countries haveadopted this technology on a large scale as a result of which global cotton output hasreached 26 million tonnes and average yields to 730 kg lint per hectare.
The International Cotton Genome Initiative (ICGI) is gradually providing guidelinesfor the study of structural genomics, functional genomics, evolutionary relationships amongGossypium species and related members of the plant kingdom, genetic resources andgermplasm stocks and bio-informatics in cotton for a better appreciation and understandingof the molecular basis of differentiation in the genera. Once such a project takes full shapeat the global level and the various scientific laboratories come together for the mappingof the cotton genomes on a coordinated basis, the era of cotton genetics and breedingwould undergo further metamorphosis. The potentiality for revolutionary improvements inthe diploid cottons as well as barbadense and hirsutum may be expected to touch newhorizons in the history of cotton improvement.
Introduction
Cotton crop yields the most versatile fibre,the purest form of cellulose in nature and also asubstantial quantity of oil and protein in the cottonseed on which the spinnable lint hairs are borne,influencing the industrial economy and globalmarkets. The goal of cotton breeding is toprimarily increase the (1) productivity andprofitability to the cotton farmers and enablethem to produce what the spinners need (2) toimprove the combinations of quality parametersdesired by the textile industry and trade and to
face inter-fibre as well as global competition(3) to increase the oil output primarily throughenhancement of seed yields with reasonableoptimization of oil and protein on the one handand the spinnable lint fibre on the other and (4)to ensure reasonable employment opportunitiesand sustainable livelihoods for a large sectionof the population representing various sectors.Systematic cotton improvement through theintelligent application of Genetics and PlantBreeding has proved to be the most practicalmeans for achieving these primary objectives
228
Second National Plant Breeding Congress 2006 Plant Breeding in Post Genomics Era
and now the new tool of biotechnology andgenetic engineering has provided further impetusto crop improvement in cotton.
Transgenic hybrid technology
When a shift from traditional breedingmethods adopted up to the latter half of 1960soccurred in favour of hybrid breeding technologyin cotton in India, both the seed cotton yield andfibre quality improvements witnessed highergrowth rates. Heterosis has been effectivelyused in cotton to increase yield throughexpansion and harmonization in the expressionof various yield influencing parameters and fibrequality, while concurrently broadening theadaptability to larger areas. The geneticengineering advances and thereby theincorporation of B.t gene (from Bacillusthuringiensis) technology for bollworm controlinto hybrid technology of cotton have not onlyenabled to achieve a quantum jump in yield, butalso accelerated the process of privatization ofR&D and seed distribution on a more globallycompetitive scale. In addition, the higher bollnumbers per plant produced and retained throughheterosis and transgenic effects has given aboost to transgenic heterotic cultivars. If heterosisexploitation is one method to rapidly increase thestagnating cotton yields, incorporating Bt Cry1Ac gene (transgenic hybrid), the hybrid will haveadded advantage of double benefit of yieldimprovement through heterotic vigour for yieldas well as consolidating the yield gains throughbollworm control at a reduced cost of production.
Multiple strategies for success
Genotype deployment strategy, geneoutsourcing technique, in-house germplasmdevelopment strategy for use as parents ofhybrids, molecular evaluation strategy,transgenic- conversion strategy, parental puritymaintenance techniques, mass scale hybridevaluation and selection techniques at initial andadvanced testing stages and in multi-location andmarket acceptability tests, strategy for
developing competitive hybrids and placementin farms and meeting the expectations ofspinners, technology for productionmanagement for maximizing the geneticpotential for yield and fibre quality in transgenichybrids, scientific seed production practices fortransgenic hybrids and systems for ensuring costreduction and assured planting quality etc., eachof which represent a critical factor influencingthe success and sustainability of the transgenichybrid technology. Further, the testing of fibreharvested in the hybrids should be based onproper samples from well-maintained cropplots. The testing of transgenic presence ingrow-out test lots is a critical requirement.Measures to prevent the ginned seeds fromcommercial crops of transgenic hybrids goingto the planting seed market as transgenic F2should be undertaken to ensure the supply ofhomogeneous lint parameters to the textileindustry in the interest of real long-termbenefits.
Existing genotype analysis
Product analysis of cotton genotypes ofproprietary and non-proprietary kinds in Indiain the current context of global competition andmill industry needs is urgently needed to toneup breeding research in both sectors forensuring a 4 per cent higher growth rates. Inhybrid cotton breeding technology, majorcasualties include lower ginning outturn,unimpressive fibre strength improvements, widevariations in micronaire values due to geneticand management deficiencies, some increasein seed coat fragments and motes. Seed ratehas been drastically curtailed and boll load perplant has been increased to five to six folds inIndia in the use of hybrid technology both in Btand non-Bt versions. Yet in most advancedcountries especially in ten top ranking countries,far higher yields per hectare are obtained fromsuperior straight variety cultivars, whethertransgenic or non-transgenic. While admittingthat India has a large rain-fed area unlike those
229
Second National Plant Breeding Congress 2006 Plant Breeding in Post Genomics Era
top cotton countries, the scope for India toaccelerate its yield levels by effective transgenichybrid deployment and cooperative contractualfarming type crop management cannot beunderestimated.
Potential of technology
Hybrid and Bt cotton hybrid technology haveenabled substantial increases in cottonseed yieldsresulting in higher contribution to edible oil output,protein, gossypol, linters and other by-products.Though 100 percent seed replacement rate isadvocated for cotton Bt or non-Bt hybrids anduse of labeled seeds year after year, it is beingwidely misused by certain traders and misguidedfarmers by enabling the supply of F2 seeds. Thisis also a major reason for our shortfalls inproduction and deficiencies in fibre quality.Hybrid technology has also become a ploy inthe hands of certain unscrupulous farmers andtraders by floating of numerous versions ofhybrids with low genetic diversity and causingharm to genuine private seed companies withR&D with a vision and mission to help thegrowers and textile industry. Potential of thispowerful technology may be ruined by suchunscientific activities.
New efforts needed
Bt cotton transgenic technology has becomea boon to farmers, traders and textile industry,but superimposed on the hybrid technology withthe popular hybrids in vogue in last ten yearshas caused innumerable deficiencies in the fieldlevel. For a superb performance of Bt plus hybridtechnology, superior parental choice and efficientpainstaking breeding methods are advocated thatwas not effectively taken care of in the firstgeneration Bt cotton hybrids and a realizationhas come after costly mistakes have beencommitted. Introgressive breeding has beenrevived after a long gap in India and the breedingmaterial reported developed under NATP andTMC projects appear impressive. But thepurification process needs to be done to the core
to carry out genetic enhancement of parentallines developed through introgressive breedingto get the best results through superiorexpression for known and novel, but valuableattributes.
Genomic tools & diversity
Genomic tools like MAS have a significantnew role in parental line development withenhanced fibre quality attributes like high fibrestrength, higher elongation per cent andappreciable micronaire value apart fromdrought tolerance and certain critical factorsthat influence length uniformity in fibre evenunder rain-grown conditions. Gene xEnvironment (G x E) interaction in hybrids isan important fact that cannot be ignored ingenotype deployment and hence specialattention to multi-location testing with specialprecision and attention and critical evaluationof performance a must for ensuring the successof the selected hybrids. The spectrum of geneticand phenotypic diversity in cotton is critical forunderstanding the complex processes in plants,inferring the effects of selection based on veryefficient targeted molecular selection practicesin hybrid breeding programme. Appreciation ofthe molecular basis of complex traits willprovide genetic solutions and remove themisconceptions currently inhibiting anunderstanding and improvement of theperformance of hybrids. Analysis of molecularvariance has assumed importance in detectingpolymorphism, to map the genome to identifythe traits of interest, for critically studying thequantitative trait loci (QTL) and also to detectlinkage with undesirable genes.
Breeding for quality ELS cottons
Extra-long staple cottons are needed with2.5% span length of >34 to 38mm, tensilestrength of >28-32 with 0.90 and above strength-length ratio, micronaire value of 3.6 to 4.4 withginning outturn >33-35 per cent. This requirespriority efforts in the next three years and R&D
230
Second National Plant Breeding Congress 2006 Plant Breeding in Post Genomics Era
Units should focus on this need. After Varalaxmiand DCH32, which are over 25 years old andTCHB 213 also similar, still superior inter-specifichybrids or even a more adaptable pest resistantSuvin-like (3 decades old barbadense cultivar),superior genotypes with acceptable fibre qualitystandards have not been developed and the abovementioned genotypes have lost their charm andpreference, but for the absence of anyalternative. Importing such type quality cottonsare dictated by ruling international prices, politicsand constant escalations. Parallel developmentof hirsutum and barbadense germplasm usingsuperior sources in global gene pool andidentifying the best combinations for fibre qualityand wide adaptation are suggested. Bt genetechnology with stacked genes would be helpfulin effecting early maturity, good quality cottonand pest resistance.
Genetics in seed cost reduction
Forecast or continued efforts on newtechnology to reduce the cost of hybrid seedsproduced especially GMS, CMS-R or gametocidesystems have not become successful nor madeany recognizable impact on seed production cost.Self-incompatibility induction through biotechapproaches was indicated as alternatives andenable harvesting of crossed bolls from bothparents projected, but still not turned into practicaluse. Irrespective of various mechanismsplanned, transfer of pollen in cotton hybridizationis a problem requiring manual work and an issuerequiring molecular approaches to fix heterosis.
Innovative approach on diploid cottons
Desi or diploid cotton area expansionespecially under rain-fed cotton areas isadvocated using the released hybrids and recentstraight variety cultivars in Maharashtra state.The desi cotton hybrids/varieties are no matchin production, handling and processing to the Hx H or H x B hybrids on account of the variousadvantages derived by growing the latter. Thedesi hybrids with GMS system are also not
making much headway. By and large, bollfeatures and fibre quality are unattractive.Attention is needed to improve these aspectsthrough the genetic engineering route, if desicotton has to make a higher progress in superiorspinning uses. More innovative approachesrather than standard breeding methods arerequired to make it useful in the globalcompetitive scenario.
Bt cotton Performance enhancement
Performance appraisal all over the countryon Bt with hybrid technology indicated that thereis need for much more R&D in agronomy andIPM technologies to maximize potential outputand fibre quality for the entire crop duration.The public breeding programme has fallen bynearly half during the last one decade. In theprivate seed R&D sector also constant changesin personnel have resulted in lower breederretention rate. Earlier cotton improvementresorted to pedigree selection, backcross,reselection, bulk, recurrent and single seeddescent systematically for developing cultivars,but now short cuts have been employed withhybrid development, which often tells on thestability and fibre quality. Adoption of strictselection criteria for genes controlling yield,stability, resistance to drought and pests,pubescence, fibre properties etc., is essential.
Public and private sector R&Dcooperation
Public cotton breeders in India spend verylittle efforts in transgenic breeding since accessto transgenic by public breeders has beenlimited. Private seed companies and their R&Dface the pressures from competition in themarket based on grower acceptance of thetechnology and generate partnerships withnecessary agreements to advance in this area.If the public sector R&Ds can intensify theirbasic researches in this area, it would help theIndian seed industry to depend more on localtechnology and provide service at lower cost
231
Second National Plant Breeding Congress 2006 Plant Breeding in Post Genomics Era
to farming community.
In-house germplasm development
In-house germplasm development in privateseed industry has gained momentum and is theprimary source of parents in successful hybridsrather than acquired germplasm. Even in thepublic R&D centers, pre-parental germplasmdevelopment for hybrids and also linedevelopment in different cultivated speciesparticularly in CICR (Nagpur, Coimbatore andSirsa), UAS, Dharwad, MAU, Parbhani etc.,have been accelerated rather than mereacquisition from other countries and this has beenpracticed in a systematic manner. The large arrayof hybrids floated in the market also can provideample scope for new germplasm developmentby all participants by undertaking pedigreeselection coupled with panmixis, selective inter-mating and other methods. Cotton breeders arealso no longer unduly concerned aboutsegregating populations and assumed thatheterogeneity and heterozygosity are beneficialto commercial cotton production. But there is alimit to the level up to which this may beacceptable.
Choice of transgenic hybrid
The search for any unique geneticcombination average more than 100 combinationsin a well planned crossing programme each yearinvolving over a thousand or more twin parentalcrosses (single cross) and depends on distinctparental development and choice of the rightmaterial. A magnificent look at the phenotypeof the hybrid is an important factor for farmeracceptance besides a set of prominentagronomic attributes related to field performancein identifying the best hybrids. Other factors mostimportant from end-user point of view like seedsper boll, lint per seed, lint per cent, fibre lengthand fibre fineness are measured after harvesting.These are very important to decide on thesuitability to meet consumer industryrequirements. The hybrid cotton release and
replacement process in the competitive scenariois a delicate decision making process and is animportant factor in private seed scenario forsurvival and brand image.
Need for higher genetic orientation
The principal genetic models in heterosisare dominance, over-dominance, pseudo-dominance, epistasis and also interactionbetween genetic and environmental and alsophysiological / biochemical factors whichexplain the causes of heterosis and hybridvigour. By pedigree data, morphological dataand agronomic performance information,biochemical data and DNA data, one cananalyze parental genetic distance. The vastgenomic and technological resources availablein model species like Arabidopsis etc could beused to rapidly advance our understanding ofthe underlying physiological and molecularprocesses and a precedence could beestablished that may support the analysis ofheterosis in cotton to make further breedingadvances
Genetics of biomass and harvest index
In crop plants, habitability for biomassproduction ranging from 60-85 per cent has beenreported. Cotton is a predominantly self-pollinated crop and often cross-pollinated tovarying extents in different environments andmay mimic crosses between inbred lines andout-breeders, if a large number of crosses aretested. In well-documented breeding lines,relatedness and consequently genetic distancecan be deduced from pedigree selection.
Quality improvement & MAS
Development of marker systems such asRFLP, AFLPs, SSRs and SNPs considerablyfacilitated the estimation of genetic diversitybetween genotypes in various centres. Therelationship between molecular markers’heterozygosity and heterosis depends ongermplasm used and the characters analyzed.
232
Second National Plant Breeding Congress 2006 Plant Breeding in Post Genomics Era
Hence use of detailed characteristics ofgermplasm and an in-depth comprehension ofthe genetic basis of heterosis would be neededto develop strategies for utilization of molecularmarkers in pre-breeding parental lines exclusivelyfor a hybrid programme and prediction of hybridperformance. Quantitative traits being the mostimportant for improvement of yield and fibreattributes, the focus on genetic factors underlyingthem should be given importance along withheritable epigenetic factors influencing geneexpression. The use of molecular markerRestriction Fragment Length Polymorphism(RFLP) and coefficients of parentage foridentifying heterotic effects in cotton had beenbeneficial. Such study has been helpful indetecting significant heterosis for total and firstharvest yields, boll weight, lint percentage, andspan length of fibres.
Genetics of hybrids for earliness &quality
A large leaf area during seedling growthallows the F1 hybrids to absorb more light thantheir parents, potentially resulting in increasedphotosynthetic activity per plant in cotton.Attention on biomass productivity, root biomass,R/S ratio at seedling stage coupled with hybridvigour and harvest index can be useful to identifybetter hybrids at initial stage of testing. Earlinessin cotton should allow the maximum usablegrowing period within the given seasonallimitations for effective lint production andexpression of fibre quality attributes in full. Somebreeders are attempting shifting ofphotosynthates to lint at the expense of seed toincrease the lint per cent by decreasing the seedsize. But if it is unduly smaller seeds, it can causeproblems in ginning with seed coat fragments tothe detriment of textile processing. Fragile seedcan affect planting seed quality also. Seed oildevelopment requires higher amount of energythan lint development and lint being the primarycommodity for which cotton is grown may begiven the priority for lint attributes. Any increase
in seed cotton yield and thereby increased seedyield can provide the higher oil output and alsoprotein. Hence in identifying the best hybrids,primary attention may be focused on higherseed cotton yield with good quality fibre andthen avail the benefit of resulting higher seedyield and therefore higher amounts of seed oiland protein there from.
Benefits & side effects of technology
India is a pioneer in hybrid cotton technologyand has made great impact on R&D, trade,textile industry and by-product utilization,farmers’ ways and means of cultivation andprofitability, fibre quality improvement to meettextile needs, large scale privatization of seedindustry, employment potential, commercialseed production practices, high quality seed with100 per cent seed replacement rate and manyother spin-off benefits. Since its introduction in1970s to 2002, the total production increasedsubstantially and spinning potential of India’scottons from 40s to 80-120 counts. No othercountry could adopt this technology successfullyon such a large scale for various reasonsincluding the difficulty of hybrid seedproduction. Though they have retained thestraight variety-based cultivation, still managedto far exceed the average productivity level ofIndia. Hybrid technology has a special role inseveral situations in India.
In the continued special emphasis on hybridcotton technology, certain casualties anddeficiencies had occurred such as low volumeseed rate of 1.125 kg per hectare (15-20kg invariety technology in India and 20-70 kg incertain countries) with high cost value of seeds,exploitation of the potential for high boll load(80-150 bolls per plant), opting for high pesticideapplication, increase in cost of production andfacing other problems. The farmers haverealized the advantage of hybrid vigour on yieldpotentials and quality up-gradation and millersgot the produce they wanted. But the primary
233
Second National Plant Breeding Congress 2006 Plant Breeding in Post Genomics Era
loss from bollworms caused high environmentalpollution from large-scale use of chemicals,escalation in cost of production, indebtedness,emergence of resistance in insects, seriousemergence of whitefly, damage to beneficialinsect population and other harmful effects. Italso far reduced the realizable benefits fromheterosis and hybrids, because the bollwormstook a heavy toll on the high boll loads. Howeverthe Bt transgenic hybrid technology has come inhandy from 2002 to ward off these deficiencies.
Perception of commercial genotype
In hybrid breeding, success depends on (1)high mean performance and a large geneticvariance in the hybrid population, (2) high per seperformance and good adaptation of the parentpopulations to the target regions and (3) lowinbreeding depression, if hybrids are producedfrom inbred/homozygous lines. Analysis of theexisting products in the country would indicateonly partial attention to these aspects and a betteradherence to these criteria may help to improvethe performance of cotton hybrid genotypes infuture. A mismatch between Farmers’ andBreeders’ perception of genotype product for agiven area, i.e., a variety genotype or hybrid issometimes responsible for the lapses incommercial realizations in the field as well as atthe end-user level. Under-use of diversegermplasm is responsible for the genetic diversityremaining untapped and in recent years, thisprocess is hampered by the non-availability ofgenetic resources from various sources to userseasily.
Australia’s experience
Under the very high yield conditions inAustralia, the heterosis for yield was notconsistent enough to warrant the production ofhybrid seeds in cotton for achieving higher yields.During 2005-06, Australia has reported 2100 kg/ ha average lint yield, while that of India is only460 kg / ha even with hybrids. However, a studyhas shown that in certain combinations of G.
hirsutum x G. barbadense hybrids, the fibreswere stronger and finer appearing to be bettersuited to cotton spinning equipment now beingused in their textile industry. In the USA, inupland cottons, it was found that in a hybrid,one parent should be from the targeted regionof adaptation and the other parent from anyother source provided it is a good combiner. Inhybrids with one parent having above averagefibre quality combined with high yield and yieldcombining ability, the F2s of such hybrids canbe expected to yield good fibre and high yield.
IPR and genetic engineering
Regarding Plant Varieties Protection as perTRIPs, a system for protection has beenestablished in India through the Patents Act andthe Plant Variety and Farmers’ RightsProtection Act. The most relevant proprietarytechnologies and materials being developed allover the world are: (1) transformation systems(2) promoter systems (3) insect resistancegenes (4) disease resistance genes (5)selectable marker genes (6) genetic markers(7) drought resistance genes (8) fibre quality-enhancing genes especially for strength,elongation and length (9) diagnostic probes and(10) others. In the next one decade, cottonresearch would be witnessing expanded andamazing activities in cotton breeding with thehelp of the new gene technologies.
FAQs & research investigations
Certain frequently asked questions on thesubject include the following for which moreand more analytical genetic and breedingresearches are needed and to provide solutionsfor major deficiencies in the future:
* The genetic behaviour of hybrids withtransgenic (Bt) in hemizygous locus andhomozygous dominant loci condition
* Bt gene incorporation in FP or MP orboth parents and effects and advantages.
* Differential potentials in different Cry234
Second National Plant Breeding Congress 2006 Plant Breeding in Post Genomics Era
1Ac versions and ability to keep all thethree bollworms and Spodoptera undercontrol.
* Constitutive Bt genes in Bollgard I and IIand effect on plant metabolism, proteininteraction and yield level in cotton indiffering environments.
* Bt Cry 1Ac in different characterbackgrounds like medium okra leaf,smooth leaf, hairy leaf, nectarilessness,naked seed, red-plant body pigmentationand effects on major expressions foragronomic and technological attributes,beside pest resistance
* Role of MAS approach with various toolsand techniques for drought tolerance andfibre quality parameters in Bt cotton andmanner of combining them
* Randomness of bombarded Cry 1Ac geneincorporation in cotton genome/chromosomes through genetic analysisand the differential genetic behaviour.
* Combining CLCV/whitefly resistance withCry 1Ac Bt gene by genetic engineering.(whitefly is normally a minor pest thatassumed serious proportions with non-judicious use of synthetic pyrethroids andnow with Bt cotton and reduction in suchpesticide use, whether both whitefly andinduced CLCV would come down)
* Complete backcrossing and limitedbackcrossing and pedigree selection in Btgene incorporation into hybrid’ parentalgenotype.
* Bt transgenic based GMS and CMS-Rhybrids and effect on simultaneousconversions for male sterility and Bt gene.
* Genetic purity assessment techniques /tools and their relative efficiencies indetection for planting seed quality
* Comparison of fibre quality and bollworm
resistance efficacy in F2, F1 and straightvarieties and dilution of effects if any
* Genetic disturbances in Bt Cry 1Ac geneinserted genotypes on oil content, ginningoutturn, boll size and boll weight and seedweight if any, due to linkages on otherfactors
* Gossypol in cottonseed may lose theeffective role as a deterrent againstbollworm in Bt cotton and the effectsthereon.
* Hybrid performance as influenced byincomplete conversion into originalparental genotype in cry 1Ac Btgenotypes
* Plant age increase and diminishing geneexpression in prolonged crop periodsthrough plant management techniquesfor greater effectiveness
* Genotype-phenotype relations and Cry1Ac Bt protein expression variations incotton hybrids
* Bt Cry 1Ac in hirsutum and barbadenseparents either in one or both parents onBt gene effectiveness in hybrids onbollworms and influence on fibre quality.
* Genomic explanations for earliness by50% flowering, 50% boll bursting andBartlett’s earliness index in Bt Cry 1Accotton hybrids.
* Whether the Bollgard II versions nearingthe release stage is really superior inbollworm management in Indianconditions and how much superiority canbe expected in yield. In the samegenotype hybrids with BGII versions, andBGI versions and what are the yieldadvantages likely.
* There are many other points raised byNGOs, scientists with differentperceptions and such numerous queries
235
Second National Plant Breeding Congress 2006 Plant Breeding in Post Genomics Era
also need a scientific study and answer(e.g., super weeds, out-crossing andtransgene flow, itching of fingers and palmduring cotton picking in Bt cotton etc) byundertaking well-planned studies.
Conclusion
The transgenic hybrid technology after facinginitial resistance from certain farmers and othershas now created a great demand from farmersas well as textile industry as it has helped toimprove the production to more than 4 milliontonnes and productivity to over 460 kg/ha within3 years of its introduction in India. In the world,several major cotton-growing countries haveadopted this technology on a large scale as aresult of which global cotton output has reached26 million tonnes and average yields to 730 kglint per hectare. The technology is powerful andto make it safer and sustainable as well asmaking new innovations for improving fibrequality and drought/disease resistance rests in
the hands of geneticists, genetic engineers andcotton breeders. The International CottonGenome Initiative (ICGI) is gradually providingguidelines for the study of structural genomics,functional genomics, evolutionary relationshipsamong Gossypium species and relatedmembers of the plant kingdom, geneticresources and germplasm stocks and bio-informatics in cotton for a better appreciationand understanding of the molecular basis ofdifferentiation in the genera. Once such aproject takes full shape at the global level andthe various scientific laboratories cometogether for the mapping of the cotton genomeson a coordinated basis, the era of cottongenetics and breeding would undergo furthermetamorphosis. The potentiality forrevolutionary improvements in the diploidcottons as well as barbadense and hirsutummay be expected to touch new horizons in thehistory of cotton improvement.
236
Second National Plant Breeding Congress 2006 Plant Breeding in Post Genomics Era
EXPRESSION OF BRIX IN TOMATO INTERVARIETAL HYBRIDS
Panagiotis A. Michalakopoulos and S. R. Sree Rangasamy
ABSTRACT
Total soluble solids [TSS] measured as brix is an important fruit quality trait in tomatoadding to the flavour, taste and nutrition. TSS consists of fructose and glucose sugars andacids. Brix shows a continuous phenotypic range in tomato varieties. Inheritance studiesof brix in tomato made previously have indicated that it is quantitative in nature and ingeneral intermediate between parents. Expression of brix in interspecific hybrids and inbredsdeveloped from such crosses also has indicated that brix is governed by several quantitativetrait loci. In this paper, the inheritance pattern of brix in fruits in intervarietal hybridsbetween genetically diverse tomato varieties and inbred lines showing brix values rangingfrom 3.0 to 5.4 is presented and discussed. Forty four genetically diverse tomato entriescomprising 32 processing tomato varieties and 12 breeding lines were utilized as parents. Atotal of 182 intervarietal hybrids have been generated by crossing between diverse parents.The hybrids were evaluated for brix from fruits collected from replicated trials.
The parents were grouped into low [3.00 to 3.50], medium [3.51 -4.50] and high brix[4.51 and above] phenotyes and hybrid between the three groups were also grouped intolow, medium and high for brix expression. The pattern of variation in the parents andhybrids was continuous and similar. The coefficient of variation was very low (1.52). Thedifferences between the parents and hybrids were highly significant. Among the hybrids,39, 47 and 28 were showing over dominance, dominance and partial dominance respectively.In 36 hybrids brix was equal to either parent [Pt=P2=Ft] and in 22 of them brix was equalto the lower parent. Nine had brix lower than the lower parent. Significant and positiveand negative heterosis was estimated. Significant positive heterosis was evident in 39hybrids ranging from 7.5 to 30.0%.
Different kind of gene actions such as dominance, dominance x dominance, dominancex additive and additive x additive and recessive epistasis governing the brix trait wereevident connoting differences in alleles and different directions of non allelic interactionswithin the polygenic system for brix trait. Overdominance and dominance that were notreported in the hybrids between interspecific inbred lines x variety have been inferred inthis study with intervarietal hybrids and this may be due to differences existing in thealleles between species. Preponderance of dominant gene action more in proportion inlarge number of hybrids suggests recurrent selection for further enhancement of brix levels.
Research and Development Divison,Agroaxon S.A.,Almyros 37100.Greece
237
Second National Plant Breeding Congress 2006 Plant Breeding in Post Genomics Era
DEVELOPMENT OF MALE LINES RESISTANT TO FUSARIUM WILTIN CASTOR (RICINUS COMMUNIS L.,)
Lavanya, C.1 and Raoof, M.A
ABSTRACTCastor, a non edible oilseed crop is an important income generating crop of
several small / marginal farmers’ of rainfed regions of Andhra Pradesh, Karnataka, andTamilnadu. Early or medium (150-180 days) duration varieties so as to complete theirmaturity within the maximum rainfall period with less node number to primary spike (12-14), high branching, long effective spikes (25-40 cm) are preferred. Latest developmentsof breeding for high yielding male lines with in built resistance to Fusarium wilt atDirectorate of Oilseeds Research is reviewed in the present paper.
1. Directorate of Oilseeds Research, Rajendranagar, Hyderabad - 500 030.
Introduction
India accounts for nearly 55% of the worldcastor area (11.63 lakh ha) and 51% of worldcastor production (11.44 l. t) and ranks first inboth area and production (2002-03). It iscultivated in 7.32 lakh ha area with 8.01 l. tproduction and 1094 kg/ha productivity earningnearly Rs.614 crores through the export of castoroil (2003-04). In India, 52% of castor area isunder rainfed conditions in states like AndhraPradesh (40%), Karnataka, Tamilnadu, Orissa,Maharashtra, Madhya Pradesh (<10%) and48% is under irrigated conditions.
Production and productivity of castor islimited by wilt complex involving Fusarium wiltpredisposed by Reniform nematodes andMacrophomina root rot in rainfed regions ofGujarat. Botrytis is another major biotic stresslimiting the productivity in rainfed regions ofcastor cultivation especially during high humidity,continuous rainfall, and cloudy weather. Theresearch efforts launched within and outside theAll India Coordinated Research Project (AICRP)on Oilseeds resulted in the development of anumber of high yielding varieties of regional andmulti-regional importance with relatively earlymaturity habit (90-150 days). The most significantachievement was the release of wilt resistantvarieties like 48-1 and DCS-9 for Southern India
(DOR, 2003). Successful cultivation of castorhybrids viz., GCH 4, DCH 32 and DCH 177even in rainfed regions emphasized the needfor development of high yielding, short durationand wilt resistant male lines or combiners.Breeding programmes initiated at theDirectorate of Oilseeds Research, Hyderabadto develop high yielding male lines with in builtresistance to Fusarium wilt and its importanceare reviewed in the present paper.
Materials and Methods
A systematic and stream linedprogramme of activities is involved in collectionof germplasm, purification, convergent breedingprogramme combined with stringent selectionpressure for early and medium duration highyielding varietal/male lines with resistance topests and diseases. A total of 800 single, 45double, 30 triple, 10 multiple and 20 backcrosses were effected since 1998. Specialemphasis has been given to incorporateresistance to pests and diseases like Fusariumwilt, Macrophomina root rot, Reniformnematode, Botrytis, leaf miner and diversity ofwilt resistance and parental material based ongeographical diversity (Table 1). Using 700crosses, 2500 individual plant selections, 750bulk selections were made. Several selectionswere generated through hybridization involving
238
Second National Plant Breeding Congress 2006 Plant Breeding in Post Genomics Era
wilt resistant male lines viz., DCS 33, DCS 41,DCS 43, DCS 57, DCS 74, early duration,branching types like REC 2, REC 116 with wiltresistant, high yielding pistillate lines like DPC 9,DPC 11, M 574, M 584 followed by back crossand pedigree method of breeding. Suchselections were bulked as advanced lines afterattaining homozygosis for morphologicalcharacters like stem color, bloom and capsulenature and evaluated for their seed yield and yieldcomponents in an augmented randomized blockdesign (ARBD). About 128 bulk selections wereevaluated along with 3 checks replicated afterevery 20 rows in an Augmented RBD. Promisinglines in the trial were further evaluated inpreliminary station trials in three replications andmulti location trials.
Results and Discussion
At the Directorate of OilseedsResearch, Hyderabad, several sources of wiltresistance have been identified through extensivescreening of germplasm lines in the wilt sickplot. Varieties like 48-1, DCS 9, Co-1 andaccessions like Baker 239, JM 6 have beenidentified as resistant sources to this pathogen(AICRP Castor, 1992, 1993 and 1994). Studieson inheritance of wilt resistance indicated thatFusarium resistance is controlled by recessivegenes (Moshkin, 1967; Sviridov, 1967;Podkuichanko, 1989), interaction of duplicategenes (Sviridov, 1988) and polygenes (Desai etal., 2001). Wilt resistance was governed by asingle dominant gene in Baker and by twocomplementary genes in 48-1 (Rao et al., 2003).Among different phenotypic traits, solid stemwithout hollowness in the central portion (pith)of the stem may be associated with wiltresistance and the character is being used invisual selection proceduresby breeders.However, other morphological characters viz.,stem and petiole color, bloom, nature of stemand capsules are not linked with wilt resistance(Rao et al., 2003). Development of cultivars or
lines with improved disease resistance isassociated with the breeding methodologies andselection procedures depending on the matingsystems of the plant, and heritability of the traiti.e. disease resistance. In the absence of anyauthentic information on inheritance ofFusarium resistance in castor, initially, thebreeding methodology was confined tohybridization followed by selection of individualplants in the early segregating generation in thefield condition and finally testing the lines in thewilt sick field conditions.
About 200 crosses were generatedusing the available pistillate lines, high yieldingmale lines and hybrids with the above sourcesof resistance and geographically diversegermplasm accession. Pedigree method ofselection is used to generate high yielding, wiltresistant lines.
Screening of early and advancedgeneration material in wilt sick plot
Ninety-six entries comprising earlygenerations from F2 to F4 stage were screenedunder wilt sick plot conditions for resistance toFusarium wilt (Annual Castor Report, 1999-2000). Nineteen entries were found resistantwith less than 20% wilt infection. Among themthe entries with zero wilt incidence viz., 9-2,119-2, 122-3, 122-5, 125-1, 294-2, 299-2, 392-1, 398-1, 544-3 and 544-7 were furtheradvanced by pedigree method ofselection forselection of resistant lines (Table 2).
Among 128 bulk selections evaluated inaugmented black design, about 35 lines werefound promising for seed yield and yieldcomponents (Table 3). These lines werescreened for wilt incidence in a wilt sick plotestablished at DOR. Six lines were found wiltfree while three lines recorded <15% wiltincidence (Annual Report, Castor, 2001-02).Seventeen promising entries were evaluated inthe wilt sick field along with 5 checks for
239
Second National Plant Breeding Congress 2006 Plant Breeding in Post Genomics Era
confirmation of wilt resistance. Three advancedlines Kh-2k- 505, 660, 1264 were wilt free whileKh-2k-1262, 1267, 507 recorded <10% wiltincidence (Annual Report, Castor, 2001-02).During the last decade about 50 advanced linesrecorded high seed yield ranging from 8-62 %over the best check with low node numbervarying from 8.9 to 17.1 (Table 4). Among them,advanced lines 2K 1262 (37%), and 2K 1253were high yielding than DCS 9 (833 kg/ha) andresistant to Fusarium wilt with 8 and 17% wiltincidence in wilt sick plot in preliminary stationtrials.
Evaluation of varieties/ male lines inAICRP multi location trials
Among six inbreds viz., DCS 99, DCS 100,DCS 101, DCS 102, DCS 103, DCS 104evaluated in AICRP multi location trials (2004-05), DCS 102 evaluated in 11 rainfed centresand 4 irrigated centres recorded 5% increaseover the best check 48-1 (1604 kg/ha) andresistant to Fusarium in wilt sick plots ofDirectorate of Oilseeds Research, SK Nagar andPalem (Table 5).
Several wilt resistant sources are availableboth in the germplasm and male lines or varietiesdue to the net working of common resources.Researchable gaps like screening procedures forcombined infection of root rot, nematode,Fusarium and their interactions, studies onvariability of the pathogen and resistant sourcesto isolates need to be thoroughly examined.Emphasis need to be given for thrust areas likestudies on variability of wilt pathogen consideringthe susceptibility of released wilt resistantvarieties and hybrids like GCH 4, GCH 5 etc.,Molecular tagging of genes for resistance toFusarium wilt resistance may increase theefficiency of screening of large number ofdiverse germplasm in addition to alreadyavailable field screening techniques andartificial root dip techniques.
REFERENCES
Annual Progress Report Castor. 1992-93.Directorate of Oilseeds Research.Rajendranagar, Hyderabad. PP 17p.
Annual Progress Report Castor. 1993-94.Directorate of Oilseeds Research.Rajendranagar, Hyderabad. PP 33p.
Annual Progress Report Castor. 1994-95.Directorate of Oilseeds Research.Rajendranagar, Hyderabad. 165p.
Annual Progress Report Castor. 1999-2000.Directorate of Oilseeds Research.Rajendranagar, Hyderabad. 198p.
Annual Progress Report Castor. 2001-02.Directorate of Oilseeds Research.Rajendranagar, Hyderabad. 181p.
Annual Progress Report Castor. 2001-02.Directorate of Oilseeds Research.Rajendranagar, Hyderabad. 16p.
Annual Progress Report Castor. 2002-03.Directorate of Oilseeds Research.Rajendranagar, Hyderabad. 132p.
Annual Progress Report Castor. 2003-04.Directorate of Oilseeds Research.Rajendranagar, Hyderabad. 133 p.
Chattopadhyay, C., Reddy,MCM. 1995. WiltComplex of Castor (Ricinus communisL.): Role of reniform (Rotylenchulusreniformis Linford and Oliveira) nematode.J. Oilseeds Res.12: 203 - 207.
Desai, A.G., Dange,S.R.S. and Pathak, H.C.2001. Genetics of resistance to wilt incastor caused by Fusariumoxysporum f.sp. ricini Nanda and Prasad.J. Mycol. Pl. Pathol. 31: 322-326.
DOR (Directorate of Oilseeds Research). 2003.Castor in India. Research achievements.17 p.
Rao, Hanumantha, C., Raoof, M.A., Lavanya,C. 2003. Study on segregation patterns andlinkages between morphological characters
240
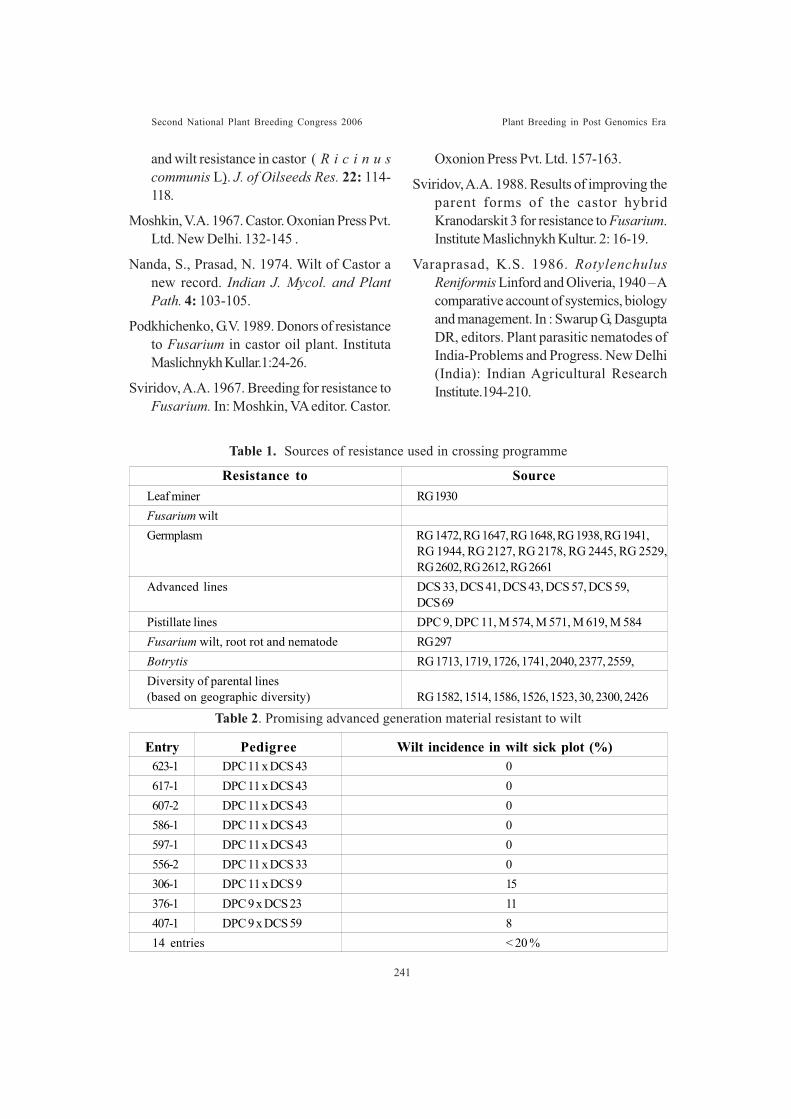
Second National Plant Breeding Congress 2006 Plant Breeding in Post Genomics Era
and wilt resistance in castor ( R i c i n u scommunis L). J. of Oilseeds Res. 22: 114-118.
Moshkin, V.A. 1967. Castor. Oxonian Press Pvt.Ltd. New Delhi. 132-145 .
Nanda, S., Prasad, N. 1974. Wilt of Castor anew record. Indian J. Mycol. and PlantPath. 4: 103-105.
Podkhichenko, G.V. 1989. Donors of resistanceto Fusarium in castor oil plant. InstitutaMaslichnykh Kullar.1:24-26.
Sviridov, A.A. 1967. Breeding for resistance toFusarium. In: Moshkin, VA editor. Castor.
Oxonion Press Pvt. Ltd. 157-163.
Sviridov, A.A. 1988. Results of improving theparent forms of the castor hybridKranodarskit 3 for resistance to Fusarium.Institute Maslichnykh Kultur. 2: 16-19.
Varaprasad, K.S. 1986. RotylenchulusReniformis Linford and Oliveria, 1940 – Acomparative account of systemics, biologyand management. In : Swarup G, DasguptaDR, editors. Plant parasitic nematodes ofIndia-Problems and Progress. New Delhi(India): Indian Agricultural ResearchInstitute.194-210.
Table 2. Promising advanced generation material resistant to wilt
Table 1. Sources of resistance used in crossing programme
Leaf miner RG 1930Fusarium wiltGermplasm RG 1472, RG 1647, RG 1648, RG 1938, RG 1941,
RG 1944, RG 2127, RG 2178, RG 2445, RG 2529,RG 2602, RG 2612, RG 2661
Advanced lines DCS 33, DCS 41, DCS 43, DCS 57, DCS 59,DCS 69
Pistillate lines DPC 9, DPC 11, M 574, M 571, M 619, M 584Fusarium wilt, root rot and nematode RG 297Botrytis RG 1713, 1719, 1726, 1741, 2040, 2377, 2559,Diversity of parental lines(based on geographic diversity) RG 1582, 1514, 1586, 1526, 1523, 30, 2300, 2426
Resistance to Source
623-1 DPC 11 x DCS 43 0617-1 DPC 11 x DCS 43 0607-2 DPC 11 x DCS 43 0586-1 DPC 11 x DCS 43 0597-1 DPC 11 x DCS 43 0556-2 DPC 11 x DCS 33 0306-1 DPC 11 x DCS 9 15376-1 DPC 9 x DCS 23 11407-1 DPC 9 x DCS 59 814 entries < 20 %
Entry Pedigree Wilt incidence in wilt sick plot (%)
241
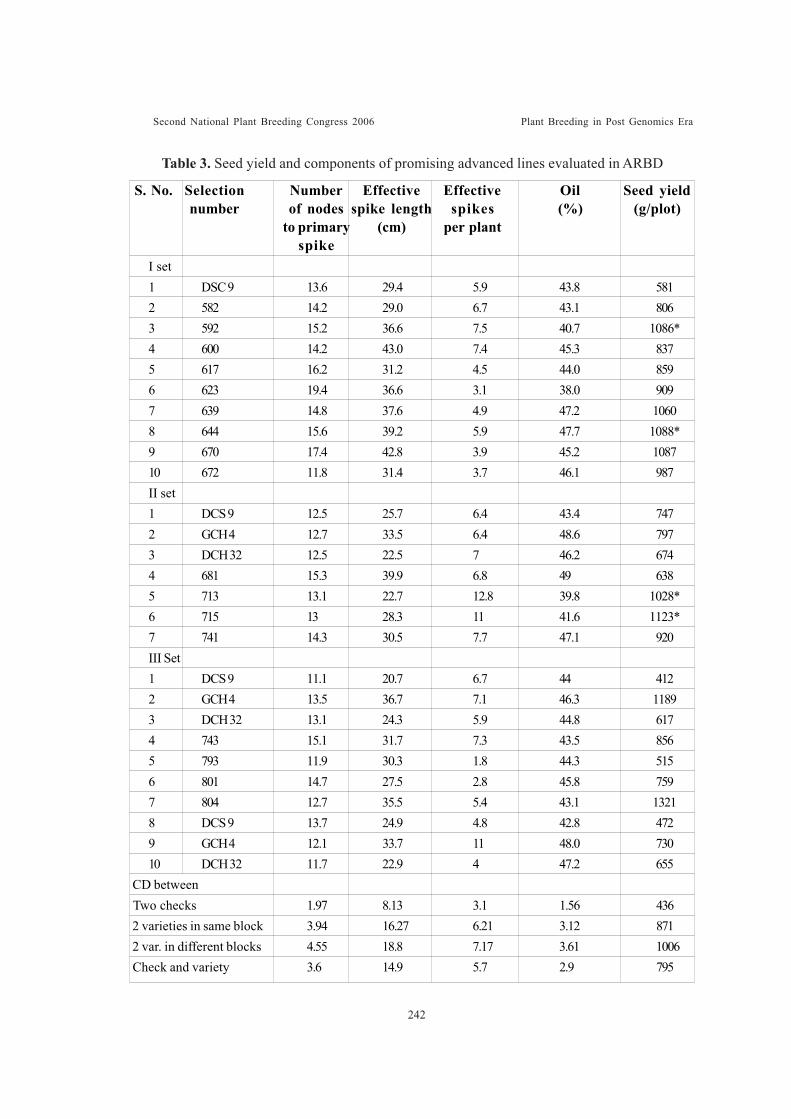
Second National Plant Breeding Congress 2006 Plant Breeding in Post Genomics Era
Table 3. Seed yield and components of promising advanced lines evaluated in ARBD
I set1 DSC 9 13.6 29.4 5.9 43.8 5812 582 14.2 29.0 6.7 43.1 8063 592 15.2 36.6 7.5 40.7 1086*4 600 14.2 43.0 7.4 45.3 8375 617 16.2 31.2 4.5 44.0 8596 623 19.4 36.6 3.1 38.0 9097 639 14.8 37.6 4.9 47.2 10608 644 15.6 39.2 5.9 47.7 1088*9 670 17.4 42.8 3.9 45.2 108710 672 11.8 31.4 3.7 46.1 987II set1 DCS 9 12.5 25.7 6.4 43.4 7472 GCH 4 12.7 33.5 6.4 48.6 7973 DCH 32 12.5 22.5 7 46.2 6744 681 15.3 39.9 6.8 49 6385 713 13.1 22.7 12.8 39.8 1028*6 715 13 28.3 11 41.6 1123*7 741 14.3 30.5 7.7 47.1 920III Set1 DCS 9 11.1 20.7 6.7 44 4122 GCH 4 13.5 36.7 7.1 46.3 11893 DCH 32 13.1 24.3 5.9 44.8 6174 743 15.1 31.7 7.3 43.5 8565 793 11.9 30.3 1.8 44.3 5156 801 14.7 27.5 2.8 45.8 7597 804 12.7 35.5 5.4 43.1 13218 DCS 9 13.7 24.9 4.8 42.8 4729 GCH 4 12.1 33.7 11 48.0 73010 DCH 32 11.7 22.9 4 47.2 655
CD between Two checks 1.97 8.13 3.1 1.56 436 2 varieties in same block 3.94 16.27 6.21 3.12 871 2 var. in different blocks 4.55 18.8 7.17 3.61 1006 Check and variety 3.6 14.9 5.7 2.9 795
S. No. Selection Number Effective Effective Oil Seed yieldnumber of nodes spike length spikes (%) (g/plot)
to primary (cm) per plantspike
242
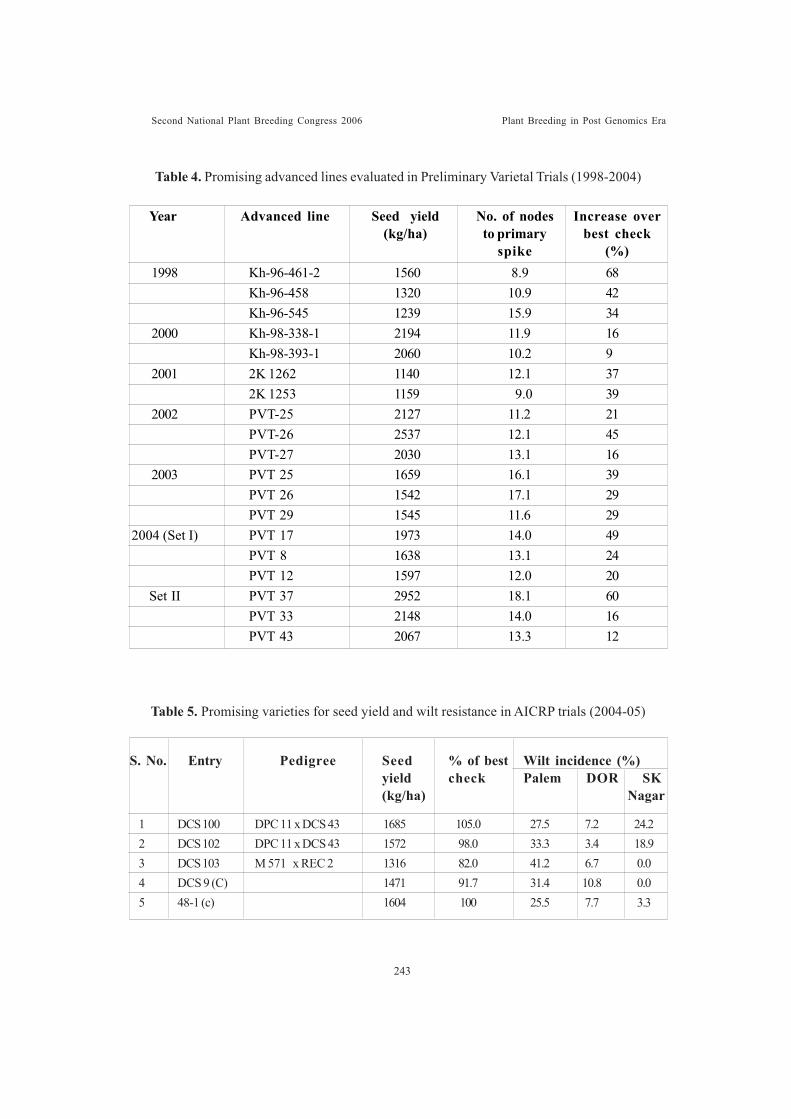
Second National Plant Breeding Congress 2006 Plant Breeding in Post Genomics Era
Table 4. Promising advanced lines evaluated in Preliminary Varietal Trials (1998-2004)
Table 5. Promising varieties for seed yield and wilt resistance in AICRP trials (2004-05)
1 DCS 100 DPC 11 x DCS 43 1685 105.0 27.5 7.2 24.22 DCS 102 DPC 11 x DCS 43 1572 98.0 33.3 3.4 18.93 DCS 103 M 571 x REC 2 1316 82.0 41.2 6.7 0.04 DCS 9 (C) 1471 91.7 31.4 10.8 0.05 48-1 (c) 1604 100 25.5 7.7 3.3
S. No. Entry Pedigree Seed % of best Wilt incidence (%)yield check Palem DOR SK(kg/ha) Nagar
1998 Kh-96-461-2 1560 8.9 68Kh-96-458 1320 10.9 42Kh-96-545 1239 15.9 34
2000 Kh-98-338-1 2194 11.9 16Kh-98-393-1 2060 10.2 9
2001 2K 1262 1140 12.1 372K 1253 1159 9.0 39
2002 PVT-25 2127 11.2 21PVT-26 2537 12.1 45PVT-27 2030 13.1 16
2003 PVT 25 1659 16.1 39PVT 26 1542 17.1 29PVT 29 1545 11.6 29
2004 (Set I) PVT 17 1973 14.0 49PVT 8 1638 13.1 24PVT 12 1597 12.0 20
Set II PVT 37 2952 18.1 60PVT 33 2148 14.0 16PVT 43 2067 13.3 12
Year Advanced line Seed yield No. of nodes Increase over(kg/ha) to primary best check
spike (%)
243
Second National Plant Breeding Congress 2006 Plant Breeding in Post Genomics Era
DEVELOPMENT OF SUPERIOR INBREDS AND SELECTION OFEFFICIENT RESTORERS FOR DIVERSE CMS SOURCES IN
SUNFLOWERRanganatha, A.R.G.1, V. Vijay, C. Lavanya and K. Rukminidevi
ABSTRACTDevelopment of diverse and superior inbreds for seed yield and yield attributes, oil
content and autogamy is required to develop new hybrids with higher heterotic potentials.In this direction, the inbreds are synthesised following recurrent selection from diverse genepools. The superior inbreds identified morphologically were tested for the maintainer andrestorer reaction. The identified maintainer inbreds are converted to develop diverse CMSlines under the background of different CMS sources. The identified superior hybrids aretested in the station and multilocation trials to save the time of conversion, utilizing theGibberlic acid technique, to produce the male sterile inbred line. The results of theexperiments conducted during kharif, rabi and summer seasons of 2004 and 2005 arediscussed in this paper.
Introduction
Sunflower is becoming one of the importantoilseed crops in various agro-productionsituations. However, the productivity levels ofsunflower are continued to be low(Virupakshappa and Ranganatha, 1998 andVirupakshappa and Ranganatha 1999). Hence,to increase the productivity levels and to diversifythe inbred base to develop superior hybrids thefollowing investigations were taken up insunflower.
Material and methods
The morphologically superior inbreds weretested for the maintainer and restorer reaction.The maintainer inbreds were back crossed todevelop new CMS lines under the back groundof different CMS sources. Further, the paralellyidentified promising hybrids were tested in thestation and multi-location trials to save the timeof back crossing, utilizing Gibberlic acidtechnique to produce the male sterile inbred line.The newly developed inbreds were regularlytested further for maintainer and restorerreaction. The new inbreds and crossessynthesized were evaluated in the station and in
the multi location trials during kharif, rabi andsummer seasons of 2004 and 2005.
Results and discussion
The inbreds were synthesized followingrecurrent selection from different gene pools(Ranganatha et al., 2000 and Ranganatha etal., 2003). The superior inbreds were testedfor their maintainer and restorer reaction. Theinbreds and crosses were evaluated for seedyield and yield attributes.
Evaluation of new inbred lines
Newly developed inbreds were evaluatedduring kharif and rabi seasons and a numberof promising inbreds were identified for seedyield, oil content and other attributes. Theidentified inbreds possessed 4-5% higher oilcontent. Two inbred selections (GP 9-472-7-2and GP 9-38-C-2-1) recorded higher oil per cent(>45%) and also exhibited higher necrosisresistance. The inbreds developed through theinbreeding generations and the superiorstabilized types were evaluated under differentsets and the performance of superior inbredsare given in tables 1 to 3. GP9-322-1 exhibitedhighest oil content (45%) followed by GP9-839-
1. Directorate of Oilseeds Research, Rajendranagar, Hyderabad – 500 030
244
Second National Plant Breeding Congress 2006 Plant Breeding in Post Genomics Era
5-1 (44.8%). In set-2, GP317-3 exhibitedmaximum oil content (45.5%) followed byGP2150-5 (44.8%). For seed yield, GP325-3recorded highest (38.7g) followed by GP2166-5(31.7g). In set-3, GP1-1044 (45.7%) recordedmaximum oil content followed by GP1-10(45.3%). For seed yield, GP1-69 (35.5g)recorded highest followed by GP1-2210 (32.9g).
Development of new restorer lines
The GP line inbreds were evaluated for themaintainer and restorer reaction during summerand kharif seasons and identified 22 newrestorers for diverse CMS lines (Table-4). Thestudies resulted in identifying the followingeffective restorers in another set for diverseCMS sources viz., inbred GP201 restored fertilityin ARM 243A, ARM 247A and PET-2-7-1A;line RARM-241 restored in 234A and ARM247A; DRM-34 restored in ARM 247A, PF-853A, PET-2-7-1A and PET2-89A; GP9-163restored in ARM 247A, PET2-7-1A, IMS-400A,IMS-WG and IMS-IB-4; GP9-472-5 restored inARM-247A, IMS-400A, PET2-7-1A and PF-MRA and PF-853A. Further, P356 restoredfertility in 9 lines; 3376R restored in 8 lines; R856 restored in 8 lines and R-272-1 restoredfertility in 3 lines.
Evaluation of inbreds for combining ability
A total of 150 experimental hybrids aresynthesized and evaluated. Identified the newcrosses DSC-20, 6, 35, 23, 27, 4 and 245 assuperior hybrids compared to the popular checksKBSH-1 and MSFH-17 hybrids (Table-5). Thehybrid DRSH-102 exhibited superiority over
popular checks KBSH-1, PAC-1091, MSFH-17 and KBSH-44 for seed yield; KBSH-44,MSFH-17 and PAC-1091 for oil content andKBSH-44, MSFH-17 and PAC-1091 for oilyield in the multilocation evaluation of 14centres (Table.6). Another hybrid DRSH-103also exhibited seed yield and oil yield superiorityover KBSH-1 (Progress Report, 2005) withzero per cent downy mildew in the multilocationevaluation.
REFERENCES
Ranganatha, A.R.G., Pradeep Kumar, P andChattopadhyay, C, 2000. Evaluation ofnew CMS and inbred lines in sunflower,J. Oilseeds Research. 17: 385-386.
Ranganatha, A.R.G., Tirumala Rao, V. andRukmini Devi, K. 2003. Development ofdiverse maintainer and restorer inbreds andpopulations in sunflower. In: Advances inGenetics and Plant Breeding – Impact ofDNA revolution, UAS, Dharwad, p. 67.
Virupakshappa, K. and Ranganatha, A.R.G.1998. Approaches for enhancedexploitation of heterosis in sunflower. Leadpaper presented in Heterosis nationalseminar, PKV, Nagpur
Progress Report 2005. NATP-SunflowerHybrid Project, DOR, Hyderabad
Virupakshappa, K. and Ranganatha, A.R.G.1999. Heterosis and hybrid seed productionin sunflower. In: Heterosis and hybrid seedproduction in agronomic crops. ed. A.S.Basra, Food Products Press, New York,pp. 185-216.
245
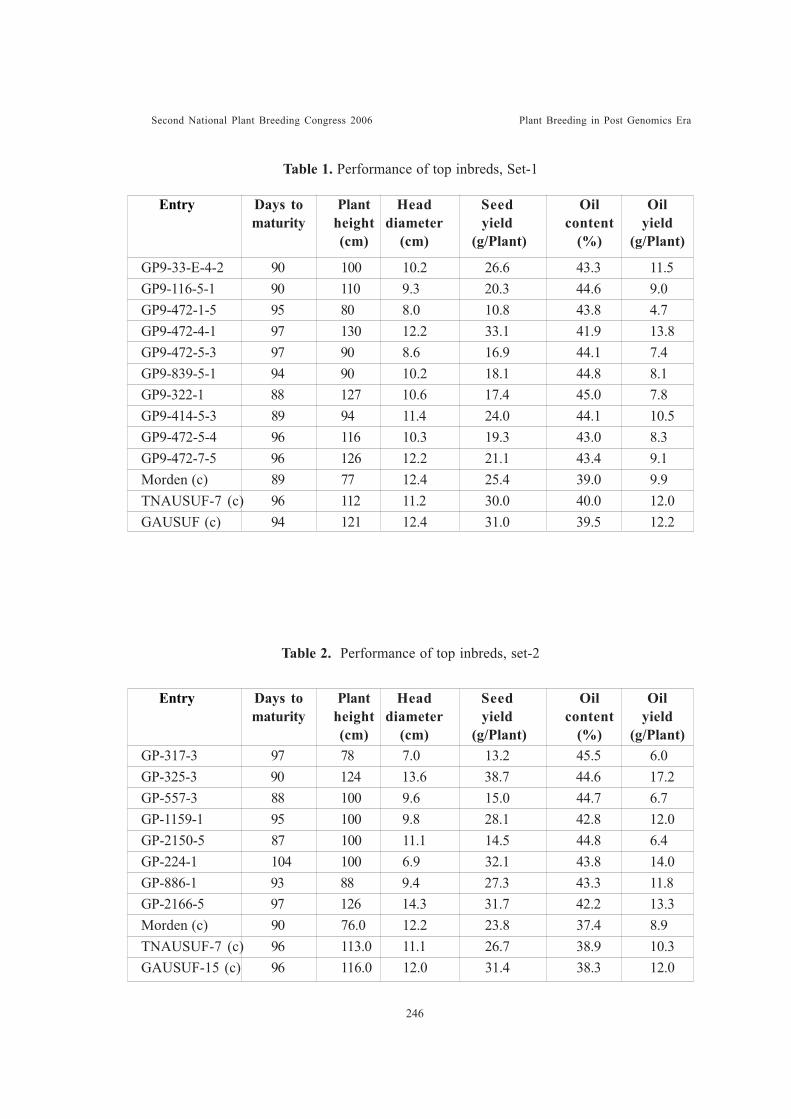
Second National Plant Breeding Congress 2006 Plant Breeding in Post Genomics Era
Table 1. Performance of top inbreds, Set-1
Table 2. Performance of top inbreds, set-2
GP9-33-E-4-2 90 100 10.2 26.6 43.3 11.5GP9-116-5-1 90 110 9.3 20.3 44.6 9.0GP9-472-1-5 95 80 8.0 10.8 43.8 4.7GP9-472-4-1 97 130 12.2 33.1 41.9 13.8GP9-472-5-3 97 90 8.6 16.9 44.1 7.4GP9-839-5-1 94 90 10.2 18.1 44.8 8.1GP9-322-1 88 127 10.6 17.4 45.0 7.8GP9-414-5-3 89 94 11.4 24.0 44.1 10.5GP9-472-5-4 96 116 10.3 19.3 43.0 8.3GP9-472-7-5 96 126 12.2 21.1 43.4 9.1Morden (c) 89 77 12.4 25.4 39.0 9.9TNAUSUF-7 (c) 96 112 11.2 30.0 40.0 12.0GAUSUF (c) 94 121 12.4 31.0 39.5 12.2
Entry Days to Plant Head Seed Oil Oilmaturity height diameter yield content yield
(cm) (cm) (g/Plant) (%) (g/Plant)
Entry Days to Plant Head Seed Oil Oilmaturity height diameter yield content yield
(cm) (cm) (g/Plant) (%) (g/Plant)GP-317-3 97 78 7.0 13.2 45.5 6.0GP-325-3 90 124 13.6 38.7 44.6 17.2GP-557-3 88 100 9.6 15.0 44.7 6.7GP-1159-1 95 100 9.8 28.1 42.8 12.0GP-2150-5 87 100 11.1 14.5 44.8 6.4GP-224-1 104 100 6.9 32.1 43.8 14.0GP-886-1 93 88 9.4 27.3 43.3 11.8GP-2166-5 97 126 14.3 31.7 42.2 13.3Morden (c) 90 76.0 12.2 23.8 37.4 8.9TNAUSUF-7 (c) 96 113.0 11.1 26.7 38.9 10.3GAUSUF-15 (c) 96 116.0 12.0 31.4 38.3 12.0
246
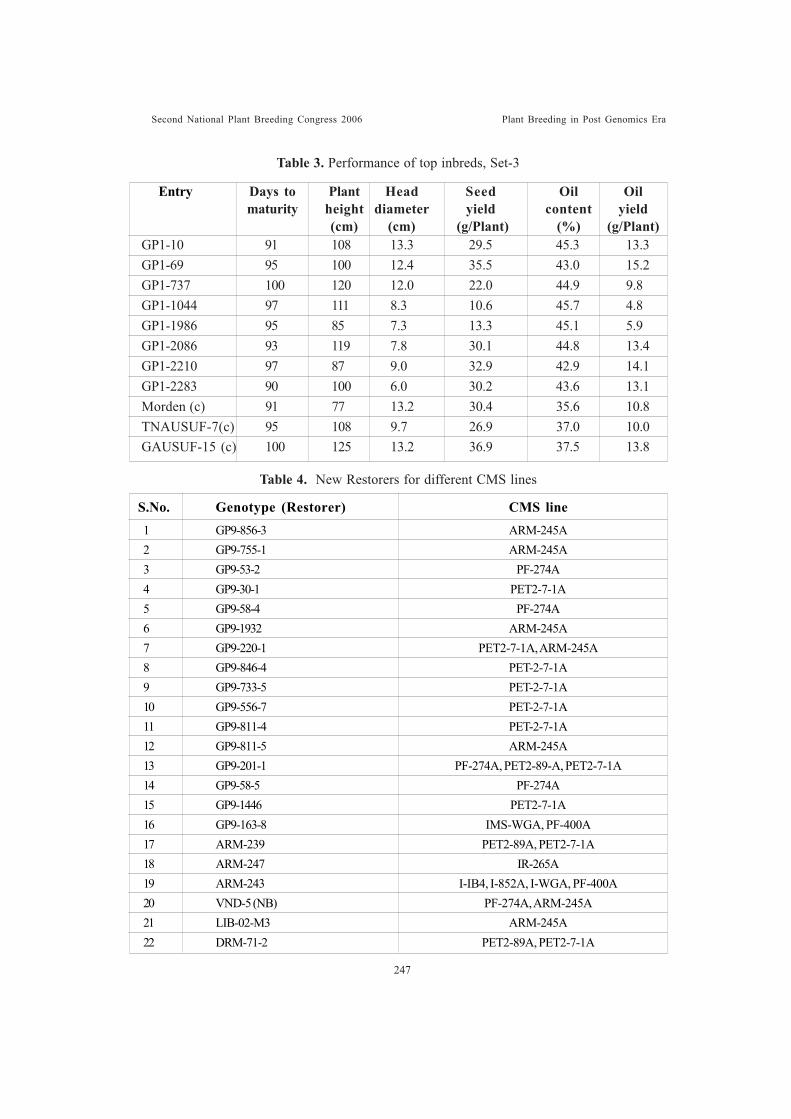
Second National Plant Breeding Congress 2006 Plant Breeding in Post Genomics Era
Table 3. Performance of top inbreds, Set-3
Table 4. New Restorers for different CMS lines
GP1-10 91 108 13.3 29.5 45.3 13.3GP1-69 95 100 12.4 35.5 43.0 15.2GP1-737 100 120 12.0 22.0 44.9 9.8GP1-1044 97 111 8.3 10.6 45.7 4.8GP1-1986 95 85 7.3 13.3 45.1 5.9GP1-2086 93 119 7.8 30.1 44.8 13.4GP1-2210 97 87 9.0 32.9 42.9 14.1GP1-2283 90 100 6.0 30.2 43.6 13.1Morden (c) 91 77 13.2 30.4 35.6 10.8TNAUSUF-7(c) 95 108 9.7 26.9 37.0 10.0GAUSUF-15 (c) 100 125 13.2 36.9 37.5 13.8
Entry Days to Plant Head Seed Oil Oilmaturity height diameter yield content yield
(cm) (cm) (g/Plant) (%) (g/Plant)
1 GP9-856-3 ARM-245A2 GP9-755-1 ARM-245A3 GP9-53-2 PF-274A4 GP9-30-1 PET2-7-1A5 GP9-58-4 PF-274A6 GP9-1932 ARM-245A7 GP9-220-1 PET2-7-1A, ARM-245A8 GP9-846-4 PET-2-7-1A9 GP9-733-5 PET-2-7-1A10 GP9-556-7 PET-2-7-1A11 GP9-811-4 PET-2-7-1A12 GP9-811-5 ARM-245A13 GP9-201-1 PF-274A, PET2-89-A, PET2-7-1A14 GP9-58-5 PF-274A15 GP9-1446 PET2-7-1A16 GP9-163-8 IMS-WGA, PF-400A17 ARM-239 PET2-89A, PET2-7-1A18 ARM-247 IR-265A19 ARM-243 I-IB4, I-852A, I-WGA, PF-400A20 VND-5 (NB) PF-274A, ARM-245A21 LIB-02-M3 ARM-245A22 DRM-71-2 PET2-89A, PET2-7-1A
S.No. Genotype (Restorer) CMS line
247
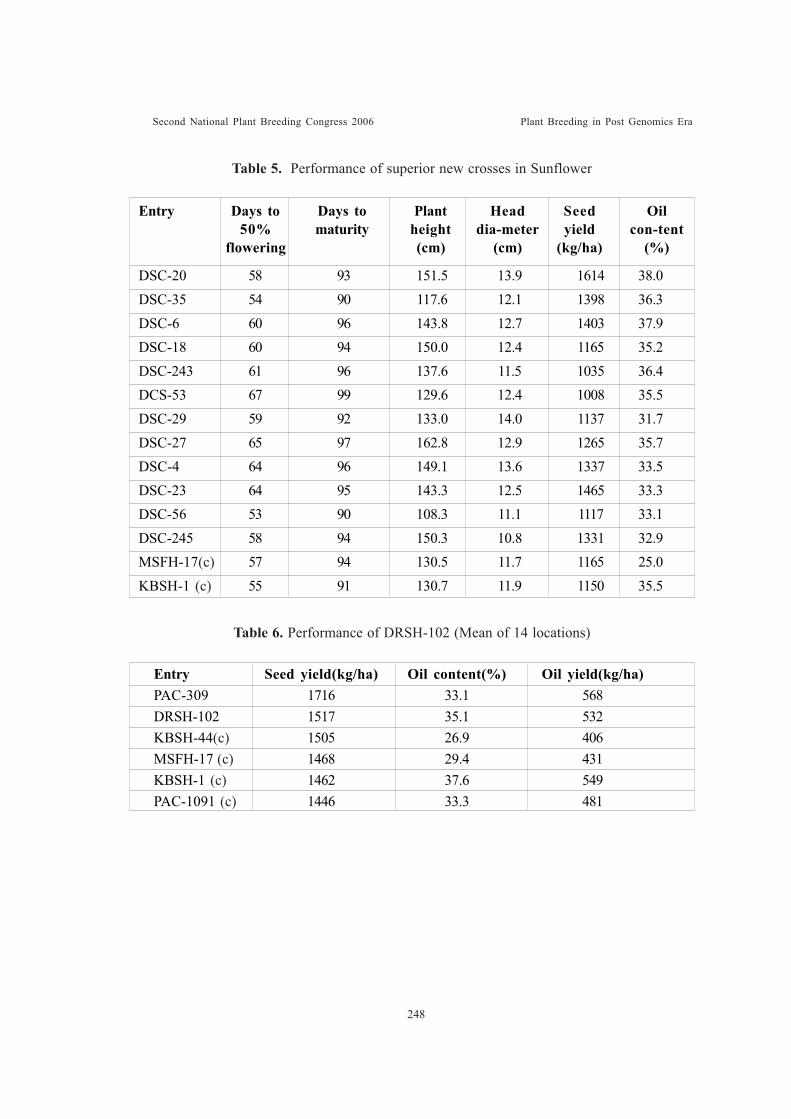
Second National Plant Breeding Congress 2006 Plant Breeding in Post Genomics Era
Table 6. Performance of DRSH-102 (Mean of 14 locations)
Table 5. Performance of superior new crosses in Sunflower
DSC-20 58 93 151.5 13.9 1614 38.0DSC-35 54 90 117.6 12.1 1398 36.3DSC-6 60 96 143.8 12.7 1403 37.9DSC-18 60 94 150.0 12.4 1165 35.2DSC-243 61 96 137.6 11.5 1035 36.4DCS-53 67 99 129.6 12.4 1008 35.5DSC-29 59 92 133.0 14.0 1137 31.7DSC-27 65 97 162.8 12.9 1265 35.7DSC-4 64 96 149.1 13.6 1337 33.5DSC-23 64 95 143.3 12.5 1465 33.3DSC-56 53 90 108.3 11.1 1117 33.1DSC-245 58 94 150.3 10.8 1331 32.9MSFH-17(c) 57 94 130.5 11.7 1165 25.0KBSH-1 (c) 55 91 130.7 11.9 1150 35.5
Entry Days to Days to Plant Head Seed Oil50% maturity height dia-meter yield con-tent
flowering (cm) (cm) (kg/ha) (%)
Entry Seed yield(kg/ha) Oil content(%) Oil yield(kg/ha)PAC-309 1716 33.1 568DRSH-102 1517 35.1 532KBSH-44(c) 1505 26.9 406MSFH-17 (c) 1468 29.4 431KBSH-1 (c) 1462 37.6 549PAC-1091 (c) 1446 33.3 481
248
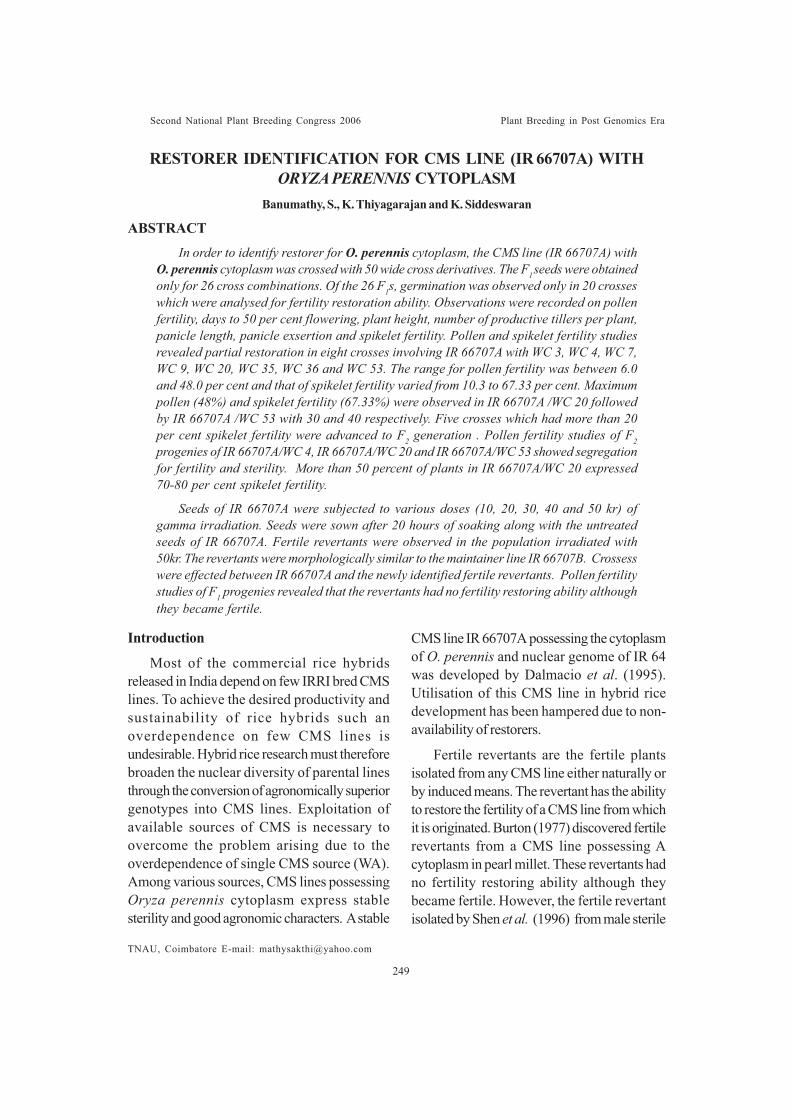
Second National Plant Breeding Congress 2006 Plant Breeding in Post Genomics Era
RESTORER IDENTIFICATION FOR CMS LINE (IR 66707A) WITHORYZA PERENNIS CYTOPLASM
Banumathy, S., K. Thiyagarajan and K. Siddeswaran
ABSTRACTIn order to identify restorer for O. perennis cytoplasm, the CMS line (IR 66707A) with
O. perennis cytoplasm was crossed with 50 wide cross derivatives. The F1seeds were obtainedonly for 26 cross combinations. Of the 26 F1s, germination was observed only in 20 crosseswhich were analysed for fertility restoration ability. Observations were recorded on pollenfertility, days to 50 per cent flowering, plant height, number of productive tillers per plant,panicle length, panicle exsertion and spikelet fertility. Pollen and spikelet fertility studiesrevealed partial restoration in eight crosses involving IR 66707A with WC 3, WC 4, WC 7,WC 9, WC 20, WC 35, WC 36 and WC 53. The range for pollen fertility was between 6.0and 48.0 per cent and that of spikelet fertility varied from 10.3 to 67.33 per cent. Maximumpollen (48%) and spikelet fertility (67.33%) were observed in IR 66707A /WC 20 followedby IR 66707A /WC 53 with 30 and 40 respectively. Five crosses which had more than 20per cent spikelet fertility were advanced to F2 generation . Pollen fertility studies of F2progenies of IR 66707A/WC 4, IR 66707A/WC 20 and IR 66707A/WC 53 showed segregationfor fertility and sterility. More than 50 percent of plants in IR 66707A/WC 20 expressed70-80 per cent spikelet fertility.
Seeds of IR 66707A were subjected to various doses (10, 20, 30, 40 and 50 kr) ofgamma irradiation. Seeds were sown after 20 hours of soaking along with the untreatedseeds of IR 66707A. Fertile revertants were observed in the population irradiated with50kr. The revertants were morphologically similar to the maintainer line IR 66707B. Crossesswere effected between IR 66707A and the newly identified fertile revertants. Pollen fertilitystudies of F1 progenies revealed that the revertants had no fertility restoring ability althoughthey became fertile.
TNAU, Coimbatore E-mail: [email protected]
Introduction
Most of the commercial rice hybridsreleased in India depend on few IRRI bred CMSlines. To achieve the desired productivity andsustainability of rice hybrids such anoverdependence on few CMS lines isundesirable. Hybrid rice research must thereforebroaden the nuclear diversity of parental linesthrough the conversion of agronomically superiorgenotypes into CMS lines. Exploitation ofavailable sources of CMS is necessary toovercome the problem arising due to theoverdependence of single CMS source (WA).Among various sources, CMS lines possessingOryza perennis cytoplasm express stablesterility and good agronomic characters. A stable
CMS line IR 66707A possessing the cytoplasmof O. perennis and nuclear genome of IR 64was developed by Dalmacio et al. (1995).Utilisation of this CMS line in hybrid ricedevelopment has been hampered due to non-availability of restorers.
Fertile revertants are the fertile plantsisolated from any CMS line either naturally orby induced means. The revertant has the abilityto restore the fertility of a CMS line from whichit is originated. Burton (1977) discovered fertilerevertants from a CMS line possessing Acytoplasm in pearl millet. These revertants hadno fertility restoring ability although theybecame fertile. However, the fertile revertantisolated by Shen et al. (1996) from male sterile
249
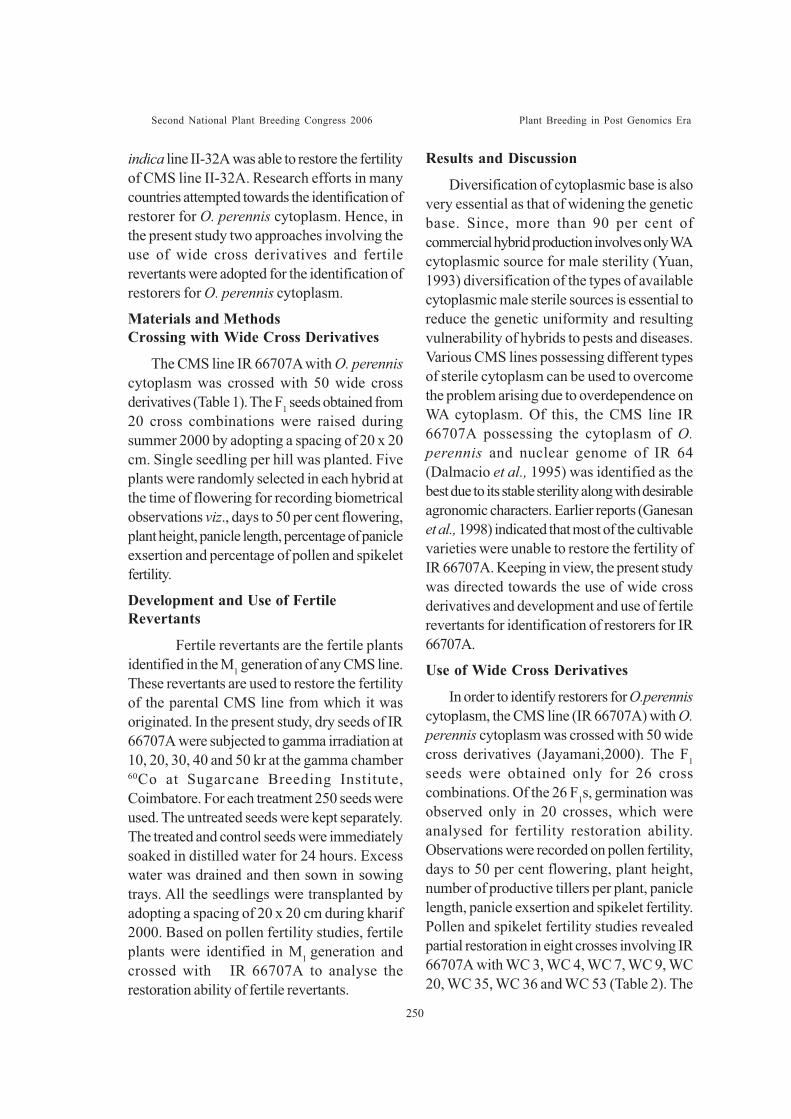
Second National Plant Breeding Congress 2006 Plant Breeding in Post Genomics Era
indica line II-32A was able to restore the fertilityof CMS line II-32A. Research efforts in manycountries attempted towards the identification ofrestorer for O. perennis cytoplasm. Hence, inthe present study two approaches involving theuse of wide cross derivatives and fertilerevertants were adopted for the identification ofrestorers for O. perennis cytoplasm.
Materials and MethodsCrossing with Wide Cross Derivatives
The CMS line IR 66707A with O. perenniscytoplasm was crossed with 50 wide crossderivatives (Table 1). The F1 seeds obtained from20 cross combinations were raised duringsummer 2000 by adopting a spacing of 20 x 20cm. Single seedling per hill was planted. Fiveplants were randomly selected in each hybrid atthe time of flowering for recording biometricalobservations viz., days to 50 per cent flowering,plant height, panicle length, percentage of panicleexsertion and percentage of pollen and spikeletfertility.
Development and Use of FertileRevertants
Fertile revertants are the fertile plantsidentified in the M1 generation of any CMS line.These revertants are used to restore the fertilityof the parental CMS line from which it wasoriginated. In the present study, dry seeds of IR66707A were subjected to gamma irradiation at10, 20, 30, 40 and 50 kr at the gamma chamber60Co at Sugarcane Breeding Institute,Coimbatore. For each treatment 250 seeds wereused. The untreated seeds were kept separately.The treated and control seeds were immediatelysoaked in distilled water for 24 hours. Excesswater was drained and then sown in sowingtrays. All the seedlings were transplanted byadopting a spacing of 20 x 20 cm during kharif2000. Based on pollen fertility studies, fertileplants were identified in M1 generation andcrossed with IR 66707A to analyse therestoration ability of fertile revertants.
Results and Discussion
Diversification of cytoplasmic base is alsovery essential as that of widening the geneticbase. Since, more than 90 per cent ofcommercial hybrid production involves only WAcytoplasmic source for male sterility (Yuan,1993) diversification of the types of availablecytoplasmic male sterile sources is essential toreduce the genetic uniformity and resultingvulnerability of hybrids to pests and diseases.Various CMS lines possessing different typesof sterile cytoplasm can be used to overcomethe problem arising due to overdependence onWA cytoplasm. Of this, the CMS line IR66707A possessing the cytoplasm of O.perennis and nuclear genome of IR 64(Dalmacio et al., 1995) was identified as thebest due to its stable sterility along with desirableagronomic characters. Earlier reports (Ganesanet al., 1998) indicated that most of the cultivablevarieties were unable to restore the fertility ofIR 66707A. Keeping in view, the present studywas directed towards the use of wide crossderivatives and development and use of fertilerevertants for identification of restorers for IR66707A.
Use of Wide Cross Derivatives
In order to identify restorers for O.perenniscytoplasm, the CMS line (IR 66707A) with O.perennis cytoplasm was crossed with 50 widecross derivatives (Jayamani,2000). The F1seeds were obtained only for 26 crosscombinations. Of the 26 F1s, germination wasobserved only in 20 crosses, which wereanalysed for fertility restoration ability.Observations were recorded on pollen fertility,days to 50 per cent flowering, plant height,number of productive tillers per plant, paniclelength, panicle exsertion and spikelet fertility.Pollen and spikelet fertility studies revealedpartial restoration in eight crosses involving IR66707A with WC 3, WC 4, WC 7, WC 9, WC20, WC 35, WC 36 and WC 53 (Table 2). The
250
Second National Plant Breeding Congress 2006 Plant Breeding in Post Genomics Era
range for pollen fertility was between 6.00 (IR66706A/WC 3) and 48.00 per cent (IR 66707A/WC 20) and that of spikelet fertility varied from10.30 to 67.33 per cent. Maximum pollen (48%) and spikelet fertility (67.33 %) wereobserved in IR 66707A/WC 20 followed by IR66707A/WC 53 with 30 and 40 per centrespectively. The pedigree of WC 20 (IR 64/O.longistaminata 101221) and WC 53 (CO 43/O. longistaminata 101221) revealed that thewild species O. longistaminata might havepossessed the restoring gene which in turnresulted in partial restoration of IR 66707A.
Five crosses viz., IR 66707A/WC 4, IR66707A/WC 7, IR 66707A/WC 20, IR 66707A/WC 35 and IR 66707A/WC 53 had more than20 per cent spikelet fertility. The selfed seeds ofthese crosses were advanced to F2 generationin order to identify and select plants with highpercentage (>80%) of spikelet fertility. The F2progenies of IR 66707A/WC 4, IR 66707A/WC7 and IR 66707A/WC 35 did not exhibit plantswith high spikelet fertility. However, F2 progeniesof crosses IR 66707A/WC 20 and IR 66707A/WC 53 showed segregation for fertility andsterility. Pollen and spikelet fertility studies of F2progenies of the cross involving WC 20 as maleparent showed that 70 per cent of plants recorded70-80 per cent fertility indicating theimprovement of fertility in advanced generation.After 2-3 selfings the fertile lines obtained maybe used as restorer parents for the restorationof fertility of IR 66707A. The F2 progenies ofIR 66707A/WC 53 segregated for fertility andsterility and the fertile plants recorded 40-50 percent spikelet fertility. This implies that there wasa slow progress in fertility improvement ascompared to the other F2 progenies of IR 66707A/WC 20. As compared to these F2 populations,the advanced generation progenies of the crossinvolving IR 66707A and WC 20 may havebetter chance to restore fertility of O. perennis.
Development and Use of FertileRevertants
Fertile revertants are the fertileprogenies obtained from any CMS line eitherspontaneously or by induced means. Fertilerevertants were isolated successfully fromCMS lines in a number of crops (Burton, 1977;Umbeck and Gangenbech, 1983; Nawa et al.,1987; He et al., 1989). Radiation and chemicalmutation are the suitable ways to produce fertilerevertants especially in the case whererestoration for certain types of CMS lines isdifficult to obtain, as suggested by Shen et al.(1996). These revertants were classified intoB and R types, in terms of their fertilityrestoration ability. The B type was similar tomaintainer and R was similar to restorer.
Seeds of IR 66707A were subjected tovarious doses (10, 20, 30, 40 and 50 kr) ofgamma irradiation. Seeds were sown after 24hours of soaking along with the untreated seedsof IR 66707A. Fertile revertants were observedin M1 generation of the population irradiatedwith 50 kr. The revertants were morphologicallysimilar to the maintainer line IR 66707B andrecorded more than 70 per cent pollen andspikelet fertility. These revertants were crossedwith IR 66707A to identify the restorationability. The study of pollen and spikelet fertilityof F1 progenies showed that the revertants hadno fertility restoration ability, although theybecame fertile. Similar results were alsoobserved by Nawa et al. (1987). They obtainedfertile revertants from BT CMS line whentreated with ethyl methane sulphonate. Theserevertants had no fertility restoration ability.
Studies of Rottmann et al. (1987), Nawaet al. (1987) and Smith (1987) showed that thistype of reversion might have resulted fromrecombination and or deletion of mitochondrialDNA. Shen et al. (1996) isolated a fertile
251
Second National Plant Breeding Congress 2006 Plant Breeding in Post Genomics Era
revertant from the male sterile indica line II-32Awhen treated with 60Co gamma rays at a doseof 290 GY. The acquired revertant, T 24 wasmorphologically and agronomically similar to II-32B, the maintainer of II-32A. The revertant wasable to restore the fertility of a number of CMSlines besides II-32A and was identified as a nearisogenic line with II-32A for restorer gene.
REFERENCES
Burton, G.W. 1977. Fertility sterility maintainermutants in cytoplasmic male sterile pearlmillet. Crop Sci. 17: 635-637.
Dalmacio, R.D., Brar, D.S., Ishii, T., Sitch, L.A.,Virmani, S.S., Khush, S. 1995. Identificationand transfer of a new cytoplasmic malesterility source from Oryza perennis intoindica rice (O. sativa). Euphytica. 82: 221-225.
Ganesan, K.N., Thiyagarajan, K., Amarlal, M.K.,Rangaswamy, M. 1998. Restorers andmaintainers for CMS lines of rice. Oryza.35: 163-164.
He P, Li Z, Li T. 1989. Fertility restoring mutantsin T type wheat cytoplasmic male sterile lineirradiated with 60Co gamma rays. ActaGenet. Sinica. 16: 1-6.
Jayamani ,P. 2000. Wide hybridisation to transfercytoplasm and floral traits in rice (Oryzasativa L.). Ph. D. Thesis submitted to TamilNadu Agricultural University, Coimbatore(Unpublished).
Nawa, S., Sano, Y., Yamada, M., Fuji, T. 1987.Cloning of the plasmids in CMS rice andchanges of organisation of mitochondrialand nuclear DNA in cytoplasmic reversion.Jpn. J. Genet, 62: 301-314.Rottmann WH,Brears T,
Hodge, T.P. 1987. The mitochondrial gene islost via homologous recombination duringreversion of CMS-T maize to fertility.EMBO J. 6: 1541-1546.
Shen, Y., Cai, Q., Gao, M., Wang, X. 1996.Isolation and genetic characterisation offertility restoring revertant induced fromcytoplasmic male sterile rice. Euphytica90: 17-23.
Smith, R.K. 1987. Mitochontrial DNArearrangements in Pennisetum associatedwith reversion from CMS to fertility. PlantMol. Biol. 9: 277-286.
Umbeck, P.F., Gangenbach, B.G. 1983.Reversion of male sterile T-cytoplasmmaize to male fertility in tissue culture. CropSci. 23: 583-588.
Yuan, L.P. 1993. Advances and constraints inthe use of hybrid rice varieties. In: WilsonKJ, editor.International workshop onApomixis in rice, 13-15 Jan 1992, HunanHybrid Rice Research Centre, Changsha,Peoples’ republic of China. p 1-4.
252
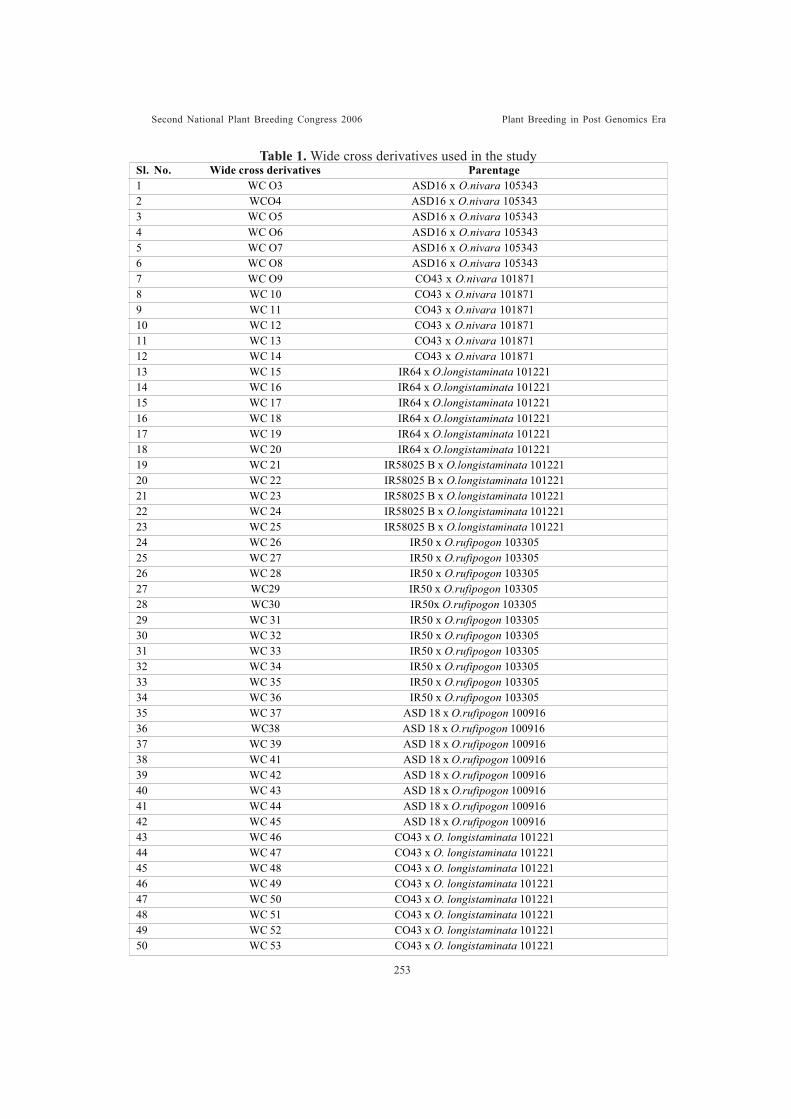
Second National Plant Breeding Congress 2006 Plant Breeding in Post Genomics Era
Sl. No. Wide cross derivatives Parentage1 WC O3 ASD16 x O.nivara 1053432 WCO4 ASD16 x O.nivara 1053433 WC O5 ASD16 x O.nivara 1053434 WC O6 ASD16 x O.nivara 1053435 WC O7 ASD16 x O.nivara 1053436 WC O8 ASD16 x O.nivara 1053437 WC O9 CO43 x O.nivara 1018718 WC 10 CO43 x O.nivara 1018719 WC 11 CO43 x O.nivara 10187110 WC 12 CO43 x O.nivara 10187111 WC 13 CO43 x O.nivara 10187112 WC 14 CO43 x O.nivara 10187113 WC 15 IR64 x O.longistaminata 10122114 WC 16 IR64 x O.longistaminata 10122115 WC 17 IR64 x O.longistaminata 10122116 WC 18 IR64 x O.longistaminata 10122117 WC 19 IR64 x O.longistaminata 10122118 WC 20 IR64 x O.longistaminata 10122119 WC 21 IR58025 B x O.longistaminata 10122120 WC 22 IR58025 B x O.longistaminata 10122121 WC 23 IR58025 B x O.longistaminata 10122122 WC 24 IR58025 B x O.longistaminata 10122123 WC 25 IR58025 B x O.longistaminata 10122124 WC 26 IR50 x O.rufipogon 10330525 WC 27 IR50 x O.rufipogon 10330526 WC 28 IR50 x O.rufipogon 10330527 WC29 IR50 x O.rufipogon 10330528 WC30 IR50x O.rufipogon 10330529 WC 31 IR50 x O.rufipogon 10330530 WC 32 IR50 x O.rufipogon 10330531 WC 33 IR50 x O.rufipogon 10330532 WC 34 IR50 x O.rufipogon 10330533 WC 35 IR50 x O.rufipogon 10330534 WC 36 IR50 x O.rufipogon 10330535 WC 37 ASD 18 x O.rufipogon 10091636 WC38 ASD 18 x O.rufipogon 10091637 WC 39 ASD 18 x O.rufipogon 10091638 WC 41 ASD 18 x O.rufipogon 10091639 WC 42 ASD 18 x O.rufipogon 10091640 WC 43 ASD 18 x O.rufipogon 10091641 WC 44 ASD 18 x O.rufipogon 10091642 WC 45 ASD 18 x O.rufipogon 10091643 WC 46 CO43 x O. longistaminata 10122144 WC 47 CO43 x O. longistaminata 10122145 WC 48 CO43 x O. longistaminata 10122146 WC 49 CO43 x O. longistaminata 10122147 WC 50 CO43 x O. longistaminata 10122148 WC 51 CO43 x O. longistaminata 10122149 WC 52 CO43 x O. longistaminata 10122150 WC 53 CO43 x O. longistaminata 101221
Table 1. Wide cross derivatives used in the study
253
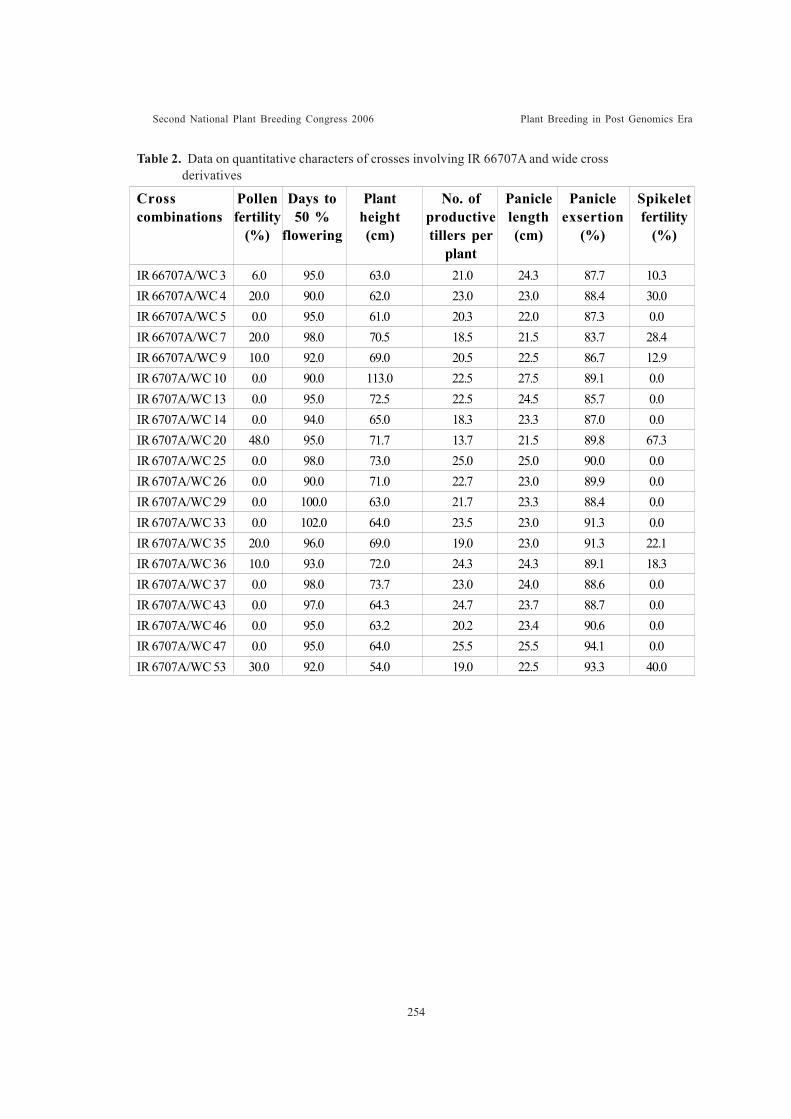
Second National Plant Breeding Congress 2006 Plant Breeding in Post Genomics Era
IR 66707A/WC 3 6.0 95.0 63.0 21.0 24.3 87.7 10.3IR 66707A/WC 4 20.0 90.0 62.0 23.0 23.0 88.4 30.0IR 66707A/WC 5 0.0 95.0 61.0 20.3 22.0 87.3 0.0IR 66707A/WC 7 20.0 98.0 70.5 18.5 21.5 83.7 28.4IR 66707A/WC 9 10.0 92.0 69.0 20.5 22.5 86.7 12.9IR 6707A/WC 10 0.0 90.0 113.0 22.5 27.5 89.1 0.0IR 6707A/WC 13 0.0 95.0 72.5 22.5 24.5 85.7 0.0IR 6707A/WC 14 0.0 94.0 65.0 18.3 23.3 87.0 0.0IR 6707A/WC 20 48.0 95.0 71.7 13.7 21.5 89.8 67.3IR 6707A/WC 25 0.0 98.0 73.0 25.0 25.0 90.0 0.0IR 6707A/WC 26 0.0 90.0 71.0 22.7 23.0 89.9 0.0IR 6707A/WC 29 0.0 100.0 63.0 21.7 23.3 88.4 0.0IR 6707A/WC 33 0.0 102.0 64.0 23.5 23.0 91.3 0.0IR 6707A/WC 35 20.0 96.0 69.0 19.0 23.0 91.3 22.1IR 6707A/WC 36 10.0 93.0 72.0 24.3 24.3 89.1 18.3IR 6707A/WC 37 0.0 98.0 73.7 23.0 24.0 88.6 0.0IR 6707A/WC 43 0.0 97.0 64.3 24.7 23.7 88.7 0.0IR 6707A/WC 46 0.0 95.0 63.2 20.2 23.4 90.6 0.0IR 6707A/WC 47 0.0 95.0 64.0 25.5 25.5 94.1 0.0IR 6707A/WC 53 30.0 92.0 54.0 19.0 22.5 93.3 40.0
Table 2. Data on quantitative characters of crosses involving IR 66707A and wide crossderivatives
Cross Pollen Days to Plant No. of Panicle Panicle Spikeletcombinations fertility 50 % height productive length exsertion fertility
(%) flowering (cm) tillers per (cm) (%) (%)plant
254
Second National Plant Breeding Congress 2006 Plant Breeding in Post Genomics Era
EVALUATION OF ISONUCLEAR ALL OPLASMIC HYBRIDS INCHILLI (Capsicum annuum L)
Nanda, C1., A. Mohan Rao, S. Ramesh and R. S. Kulkarni
ABSTRACT
Chilli is, one of the major spice cum vegetable crops, specially consumed as foodadditives for its unique color, pungency and aroma. Most of the cultivars in chilli areconventional hybrids. CMS based hybrids were of little success in the hands of the privateseed companies. Exploitation of CGMS in any crop species needs high nicking parentswith perfect restoration which could be one of the limitations in chilli. In this background,80 hybrids, synthesized using two CMS lines and their corresponding maintainers (as lines/females) and 20 testers (as males) were evaluated along with their parents and commercialcheck (NS 1101) in RBD with two replications during summer 2005 at the experimentalplots of the Department of Genetics & Plant Breeding, Main Research Station, UAS,Hebbal, Bangalore.
Combined analysis of variance of isonuclear-alloplasmic lines and their hybrids revealedsignificant mean sum of squares due to and within cytoplasm for days to flowering, plantspread, fruit length and green fruit yield per plant suggesting the involvement of cytoplasmin the expression of these traits. Variance between cytoplasms was found to be significantfor days to flowering, plant spread, fruit length, number of seeds per fruit and green fruityield per plant. Significant mean sum of squares due to interaction between cytoplasm andmale lines for all the traits studied was indicative of interaction of cytoplasm and thenucleus in the inheritance of these traits.
Of the 80 hybrids, more number of hybrids which were based on sterile cytoplasmexpressed significant sca effects in the desired direction compared to hybrids based on theirfertile counterparts for days to flowering (18,14), plant height (14,8), green fruit yield perplant (7,5) and red fruit weight per plant (12, 6). Similar results were also obtained withrespect to standard heterosis for days to flowering (12, 7), plant height (14 8) plant spread(7, 2) and number of green fruits per plant (3,2). However, more number of hybrids basedon fertile cytoplasm expressed positive standard heterosis for green fruit yield per plant (2,0), number of seeds per fruit (2, 1), red fruit number (3,1) and red fruit yield per plant(9,7) than hybrids based on sterile cytoplasm. The results revealed favourable effect ofsterile cytoplasm on specific combining ability and standard heterosis for many traitssuggesting the need to exploit CGMS system to develop heterotic hybrids in chilli.
1. Department of Genetics & Plant Breeding, Agriculture College, UAS, GKVK, Bangalore
255
Second National Plant Breeding Congress 2006 Plant Breeding in Post Genomics Era
COMBINING ABILITY STUDIES FOR QUALITY TRAITS IN INDIANMUSTARD
Mahak Singh1 and R.K.Dixit
ABSTRACT
Indian mustard (Brassica juncea) is an important oilseed crop and important sourceof edible oil in the country. The mustard oil is preferred in the kitchen in entire northernbelt of the country. Not only oil but fat free meal is an important source of protein. Fat freemeal is an important ingredient not only for internal consumption but also a good sourceof protein for export and earning of foreign exchange. Genetical studies on seed yield/plant, 1000 seed weight, oil content and protein content were conducted with 9 parentaldiallel excluding reciprocals. 36 F’IS, 36Ff2 s and 9 parents viz., Varuna, KR5610, RK1467,KRV-tall, T6342, RLM198, YRT-3, RC781 and PR-15 were evaluated in RandomizedComplete Block Design with three replications at Oilseed Research Farm, Kalyanpur, Kanpur.General combining ability and specific combining ability variances were highly significantfor almost all the traits. On the basis of gca effects, parents KRV-tall and RLM-198 forseed yield/plant, Varuna, KRV-tall and PR-15 for 1000 seed weight, KRV-tall, PR-15 andvaruna for oil content and KR-5610 and RLM-198 for protein content were found goodgeneral combiners. However, on the basis of sca effects, out of 36 crosses only eightcrosses (KR5610xPR-15, YRT-3xPR-15, RK1467x T6342, VarunaxYRT-3, KRV-tallxT6342,RLM-198xYRT-3, Varuna x RLM-198 and KR5610xKRV-tall) were significant for seedyield/plant. Two crosses (YRT-3xPR-15 and Varuna x YRT-3) for 1000-seed weight, threecrosses (YRT-3xPR-15, RK1467xT6342 and Varunax RLM 198) for oil content and onlyone cross (KR5610 x PR-15) for protein content were the best crosses on the basis ofspecific combining ability effects. The above study suggested that these lines/crosses canbe successfully utilized for improving particular traits in Indian mustard.
Introduction
Rapeseed-mustard are important oil seedscrops and are next to groundnut in the country.Among the different state, Uttar Pradesh is oneof the leading state covering an area of 1.12million hectares with the production of 1.07million tonnes. There are several species of rapeseed-mustard viz. Brassica campestris,Brassica juncea, Brassica napus, Brassicacarinata and Brassica nigra but Indian mustard[Brassica juncea (L.) Czern and Coss] is widelycultivated. It has higher yield potential and issuitable for sole cropping as well asintercropping. In planning of an efficientbreeding programme in any crop, selection ofparents plays a crucial role and combining abilityanalysis serves as a very handy tool for the
1. Department of Genetics and Plant Breeding, C.S.AzadUniversity of Agriculture & Technology Kanpur- 208 002 (UP)
selection of parents. Information on the relativeimportance of general and specific combiningabilities are also helpful in the analysis andinterpretation of the genetic basis of importanttraits. The present study was therefore,undertaken to gather such informations in Indianmustard regarding seed yield and its componenttraits.
Materials and Methods
Nine strains of Indian mustard [Brassicajuncea (L.) Czern and Coss] namely, Varuna,KR-5610, KR-1467, KRV-Tall, T-6342, RLM-198, YRT-3, RC-781 and PR-15 were crossedin a diallel fashion (excluding reciprocalcrosses) to obtain 36 F1 hybrids. The F1’s weregrown at Oilseed Research Farm, Kalyanpur
256
Second National Plant Breeding Congress 2006 Plant Breeding in Post Genomics Era
of C.S.Azad University of Agriculture andTechnology, Kanpur to obtain F2 progenies. Theparents were maintained by selfing. Theexperimental material comprising eightyone viz.,9 parents, 36 Ffs and 36 F2’s were grown in arandomized complete block design with threereplications in rabi. The parents and F1s weregrown in one row and F2’s in four rows of five-meter length and 45 cm apart and 15 cm distancefrom plant to plants within a row was maintainedby thinning. All treatments were given equaldoses of fertilizers @ 80 kg N, 40 kg P2O5 and40 kg K2O per hectare with two irrigations.Spraying of Ekatin and Dithane M-45 was donefor protecting the crop from aphids and Alternariablight respectively. Recommended agronomicpractices were followed for raising a good crop.
Data were recorded on 5 competitive plantsin each of parents and F1s and 20 plants in F2’sfor each replication selected at random in all thethree replications. Days to maturity wererecorded by counting the days from seedling toturning of the plant yellowish i.e. at physiologicalmaturity. The oil content was estimated byN.M.R. and protein content analysis was donein cake. The oil was removed and residue leftwas taken for protein analysis. The proteinanalysis was done by biuret method of Williams(1961). Data were analyzed for randomizedcomplete block design and mean squares due togeneral combining ability (GCA) and specificcombining ability (SCA) was calculated byGriffing’s (1956) model I, method IV used fordiallel analysis.
Results and Discussion
Combining ability studies help in selection ofbest combiners and provide opportunity for theuse of these combiners in hybridizationprogramme. General combining ability is primarilya function of additive gene action and additive xadditive inter action whereas specific combiningability is due to non-allelic gene interaction. Theanalysis of variance for general combining ability
was found significant for all the characters inboth the generations except 1000-seed weightin F2 generation. The results are presented inTable-1. The estimate of variance due to gcaand sca indicated that magnitude of s2s washigher than s2g for all the traits in both thegeneration. The ratio of s2g/s2s were less thanunity for all the characters in both thegenerations except for number of secondarybranches, length of main raceme, number ofsiliquae on main raceme and oil content in F1generation.
The average degree of dominanceexpressed as (s2s/s2g) suggested overdominance for all the traits in both thegenerations except primary branches and yieldper plant in both the generations and proteincontent in F1 which indicated no dominance. Theyield per plant was found to be controlled bynon-additive gene effects. The findings werein conformity with findings of Singh andSrivastava (1986) and Jain et al. (1988).
General Combining Ability
The estimate of gca effects of the parentsfor all the characters are presented in table 2.It is revealed from the table that the parentswhich had good per se performance were alsogood general combiners for yield and its mainyield components. Ranking of desirable parentsin order of merit, on the basis of gca effects inF1 and F2 generations are presented in table 3.Based on this, promising combiners for earlinesare YRT-3 and KRV-Tall and for dwarfhessPR-15 and Varuna as they had desirable gcaeffects. Parents RC-781, Varuna and PR-15for primary branches; RC-781 for secondarybranches, RK-1467 and KR 5610 for length ofmain raceme; RC-781 for number of siliquaeon main raceme; RLM-198, PR-15 and T-6342for early maturity; RC-781, KRV-Tall andRLM-198 for yield per plant appeared to begood general combiners. Parents Varuna,KRV-Tall and PR-15 for 1000-seed weight and
257
Second National Plant Breeding Congress 2006 Plant Breeding in Post Genomics Era
KRV-Tall, T-6342, PR-15 and Varuna for oilcontent were most desirable combiners in boththe generations. However, Varuna, KR 5610 andRLM-198 are good combiners for proteincontent. These lines can be successfully utilizedfor improving particular characters for whichimprovement is desired because these parentshad high general combining ability effects andthus has fixable components of variance likeadditive and additive x additive epitasis. Theselines may be utilized for producing the intermatingpopulation in order to get desirable recombinantsof Indian mustard. The findings were inconformity with findings of Dixit et al (1983),Thakral and Singh (1995) and Sachan et al.(1996).
Specific Combining Ability Effects
The estimates of sca effects of crosses forall the characters are presented in table 4. Thespecific combining ability is the importantparameter for judging the specific combinationsfor exploiting it through heterosis breeding. Thegood and promising cross combiners for seedyield are presented in table 5. A perusal of thetable indicated that out of 36 crosses only eightcrosses KR-5610 x PR-15; YRT-3 x PR-15;RK-1467 x T.6342; Varuna x YRT-3; KRV-Tallx T.6243; RLM-198 x YRT-3, Varuna x RLM-198 and KR-5610 x KRV-Tall had desirablespecific combining ability effects for yield andthe same crosses had desirable sca effects in F2generation also. These crosses involved all thethree possible combinations between the parentsof high and low gca effects i.e. high x high, highx low and low x low. Poor inbred parents althoughlacked the additive effects of the good inbredyet they were highly responsible to heterozygosityin the way of non-additive effects (Darrah andHallauer, 1972). Crosses involving high x highand high x low combiners may give risetransgressive segregants in the next generation(Langhum, 1961). In general, additive and non-additive type of gene action were predominant
in the population for all the traits. Therefore,for harnessing the maximum yield potential, acertain degree of heterozygosity should bemaintained in the population. The reciprocalrecurrent selection will be most suitablebreeding procedure for mopping up the desirableadditive gene actions through selection ofdesirable segregants. Breeding methods suchas biparental mating followed by reciprocalrecurrent selection may increase frequency ofgenetic recombination and hasten the rate ofgenetic improvement. Mass selection withconcurrent random mating would be anotherbreeding methodology for breaking the bottleneck of seed and oil yield in Indian mustard.
From practical point of view, high scaeffects of crosses alone will not lead to muchimprovement unless it is coupled with high perse performance. Therefore, selection ofcrosses for further breeding programme maybe based on higher values of both of theseparameters. In the present investigation crosses(KR 5610 x PR-15; YRT-3 x PR-15; RK-1467x T. 6342; Varuna x YRT-3; KRV-Tall x T-6342;RLM-198 x YRT-3, Varuna x RLM-198 andKR-5610 x KRV-Tall) apart from having highsca effects and per se performance for variousyield components also had both the parents asgood general combiners. Hence, these crossesare expected to throw transgressive segregantsin the later generations.
Formation of a new heterotic group
It has now become established that thereis a good association between sca effects andmean performance of crosses. However, a fewcrosses appeared to have high mean value butnon-significant sca effects and vice-versa.Keeping these facts in view, eight best crosseswere composited to form a new heterotic groupfor grain yield. It is obvious from the data thatthe ranking of crosses based on the meanperformance and sca effects was not always
258
Second National Plant Breeding Congress 2006 Plant Breeding in Post Genomics Era
the same; however, there was a significantassociation between these two criteria of ranking.This new group of crosses justifies thedevelopment of commercial hybrids in Indianmustard. In order to exploit hybrid vigour atcommercial level attempts should be made toconvert high heterotic parents into cytoplasmicmale sterile lines and search for fertility restorerlines in the germplasm to develop mustardhybrids.
REFERENCES
Darrah, L.L. and Hallauer,A.R. (1972). Geneticeffect estimates from generation mean infour diallel set of maize in breeds. Crop Sci.12 : 615-621.
Dixit, R.K. Prasad, K. and Srivastava, A.N.(1983). Combining ability for qualitycharacter in Indian mustard. Indian J. Agric.Sci. 53 : 776-778. ‘
Griffing, B. (1956). Concept of general andspecific combing ability in relation to diallelcrossing systems. Australian J. Biol. Sci.9 : 463-493.
Jain, A.K. Tiwari, A.S.; Kushwaha, V.S. andHirve, CD. (1988). Genetics of Quantitativetraits in Indian mustard. Indian J. Genet.48: 117-119.
Langhum, D.C. (1961). The high-low methodof improvement. Crop Sci. 276-378.
Singh, R.N. and Srivastava, A.N. (1986).Combining ability for yield and itscomponents in Indian mustard. Farm Sci.J. 1 : 52-57.
Sachan, S.P., Srivastava, A.N. and Singh, P.(1996). Combining ability studies in Indianrapeseed.Farm Sci.J.6: 31-35.
Thakral, N.K. and Singh, H. (1995). Combiningability for yield components and oil contentover saline environment in Indian mustard.J.Oilseeds Res. 12: 74-82.
Williams, P.C. (1961). The determination ofprotein in whole wheat meal and flour bythe biuret procedure. J. Sci. Food.Agric.12: 59-60.
259
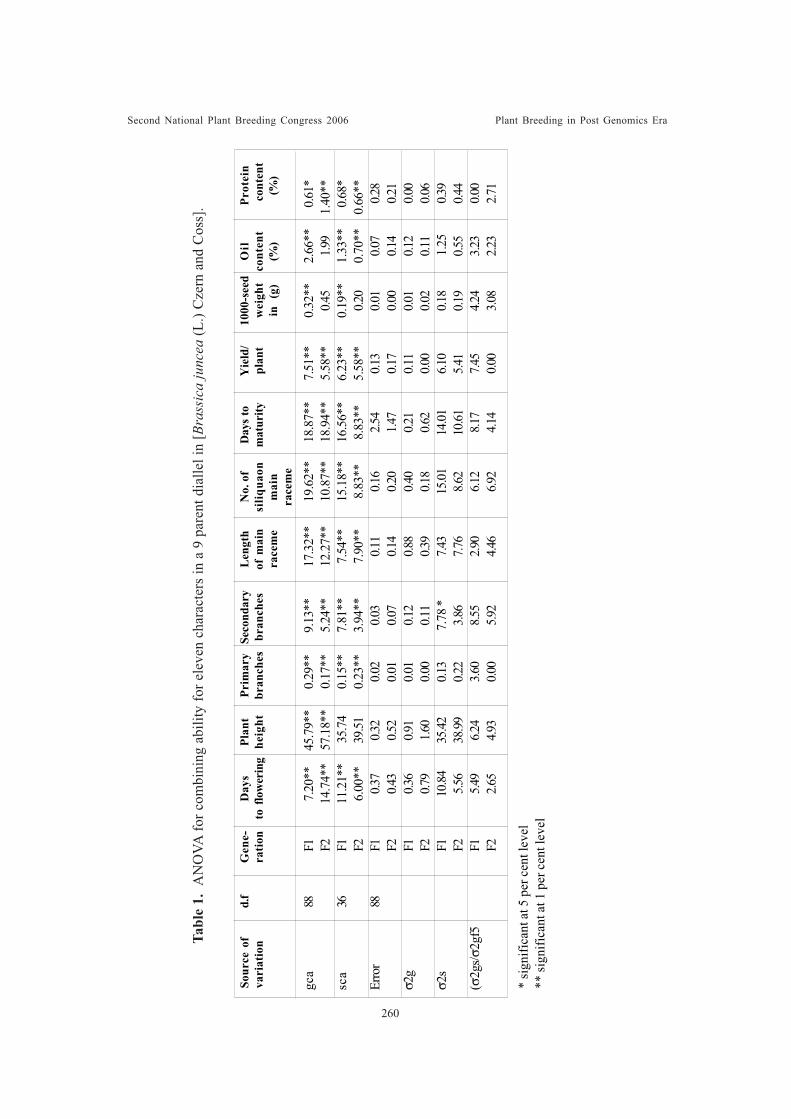
Second National Plant Breeding Congress 2006 Plant Breeding in Post Genomics Era
Tabl
e 1.
AN
OVA
for c
ombi
ning
abi
lity
for e
leve
n ch
arac
ters
in a
9 p
aren
t dia
llel i
n [B
rass
ica
junc
ea (L
.) C
zern
and
Cos
s].
* si
gnifi
cant
at 5
per
cen
t lev
el**
sign
ifica
nt a
t 1 p
er c
ent l
evel
gca
88F1
7.20
**45
.79*
*0.
29**
9.13
**17
.32*
*19
.62*
*18
.87*
*7.
51**
0.32
**2.
66**
0.61
*F2
14.7
4**
57.1
8**
0.17
**5.
24**
12.2
7**
10.8
7**
18.9
4**
5.58
**0.4
51.9
91.
40**
sca
36F1
11.2
1**
35.7
40.
15**
7.81
**7.
54**
15.1
8**
16.5
6**
6.23
**0.
19**
1.33
**0.
68*
F26.
00**
39.51
0.23
**3.
94**
7.90
**8.
83**
8.83
**5.
58**
0.20
0.70
**0.
66**
Erro
r88
F10.3
70.3
20.0
20.0
30.1
10.1
62.5
40.1
30.0
10.0
70.2
8F2
0.43
0.52
0.01
0.07
0.14
0.20
1.47
0.17
0.00
0.14
0.21
�2g
F10.3
60.9
10.0
10.1
20.8
80.4
00.2
10.1
10.0
10.1
20.0
0F2
0.79
1.60
0.00
0.11
0.39
0.18
0.62
0.00
0.02
0.11
0.06
�2s
F110
.8435
.420.1
37.
78 *
7.43
15.01
14.01
6.10
0.18
1.25
0.39
F25.5
638
.990.2
23.8
67.7
68.6
210
.615.4
10.1
90.5
50.4
4(�
2gs/�
2gf5
F15.4
96.2
43.6
08.5
52.9
06.1
28.1
77.4
54.2
43.2
30.0
0F2
2.65
4.93
0.00
5.92
4.46
6.92
4.14
0.00
3.08
2.23
2.71
Sour
ce o
fd.
fG
ene-
Day
sPl
ant
Prim
ary
Seco
ndar
yL
engt
hN
o. o
fD
ays t
oY
ield
/10
00-s
eed
Oil
Prot
ein
vari
atio
nra
tion
to f
low
erin
ghe
ight
bran
ches
bran
ches
of m
ain
siliq
uaon
mat
urity
plan
tw
eigh
tco
nten
t c
onte
ntra
cem
em
ain
in (
g)(%
)(%
)ra
cem
e
260
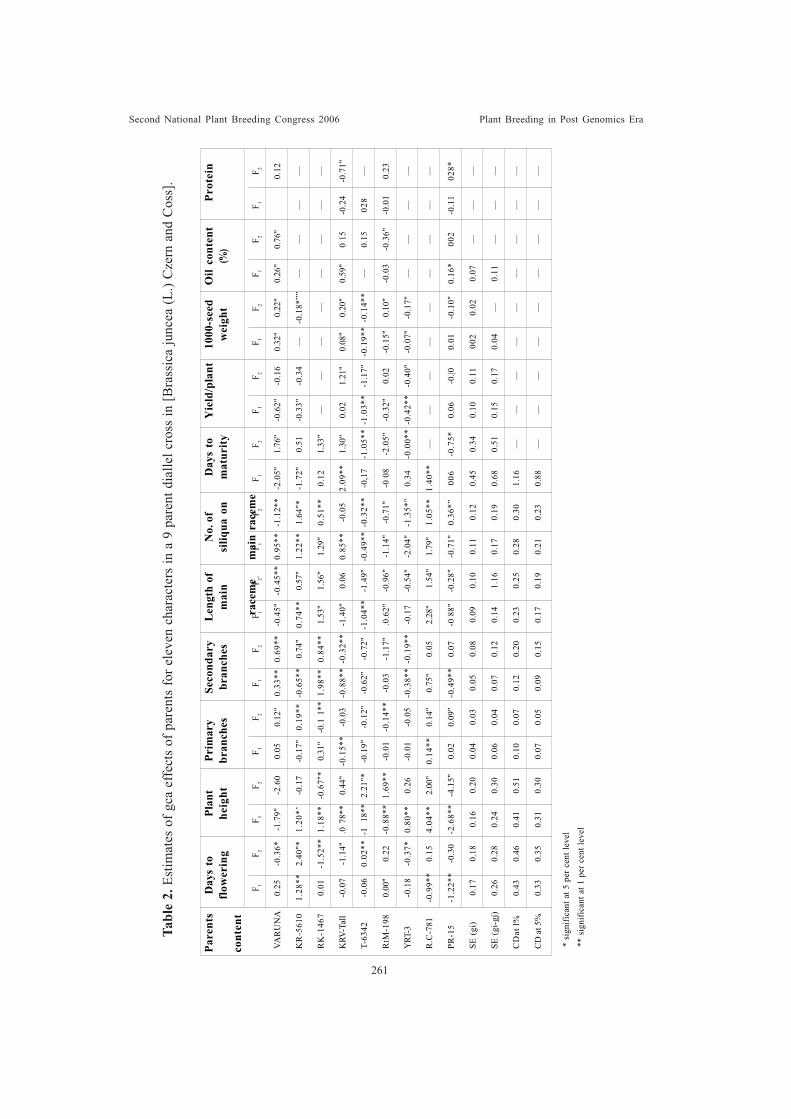
Second National Plant Breeding Congress 2006 Plant Breeding in Post Genomics Era
Tabl
e 2.
Est
imat
es o
f gca
eff
ects
of p
aren
ts fo
r ele
ven
char
acte
rs in
a 9
par
ent d
ialle
l cro
ss in
[Bra
ssic
a ju
ncea
(L.)
Cze
rn a
nd C
oss]
.
* si
gnifi
cant
at 5
per
cen
t lev
el
** s
igni
fican
t at 1
per
cen
t lev
el
F 1F 2
F 1F 2
F 1F 2
F 1F 2
F 1F 2.
F 1F 2
F 1F 2
F 1F 2
F 1F 2
F 1F 2
F 1F 2
VAR
UN
A0.
25-0
.36*
-1.7
9"-2
.60
0.05
0.12
"0.
33**
0.69
**-0
.45"
-0.4
5**
0.95
**-1
.12*
*-2
.05"
1.76
"-0
.62"
-0.1
60.
32"
0.22
"0.
26"
0.76
"0.
12
KR
-561
01.
28**
2.40
"*1.
20*’
-0.1
7-0
.17"
0.19
**-0
.65*
*0.
74"
0.74
**0.
57"
1.22
**1.
64"*
-1.7
2"0.
51-0
.33"
-0.3
4—
-0.1
8*””
——
——
RK
-146
70.
01-1
.52*
*1.
18**
-0.6
7"*
0.31
"-0
.1 1
**1.
98**
0.84
**1.
53"
1.56
"1.
29"
0.51
**0.
121.
33"
——
——
——
——
KRV
-Tal
l-0
.07
-1.1
4".0
78*
*0.
44"
-0.1
5**
-0.0
3-0
.88*
*-0
.32*
*-1
.40"
0.06
0.85
**-0
.05
2.09
**1.
30"
0.02
1.21
"0.
08"
0.20
"0.
59"
0 15
-0.2
4-0
.71"
T-63
42-0
.06
0.02
**-1
18*
*2.
21"*
-0.1
9"-0
.12"
-0.6
2"-0
.72"
-1.0
4**
-1.4
9"-0
.49*
*-0
.32*
*-0
,17
-1.0
5**
-1.0
3**
-1.1
7"-0
.19*
*-0
.14*
*—
0.15
028
—
RtM
-198
0.00
"0.
22-0
.88*
*1.
69**
-0.0
1-0
.14*
*-0
.03
-1.1
7".0
.62"
-0.9
6"-1
.14"
-0.7
1"-0
08
-2.0
5"-0
.32"
0.02
-0.1
5"0.
10"
-0.0
3-0
.36"
-0.0
10.
23
YRT
-3-0
.18
-0.3
7*0.
80**
0.26
-0.0
1-0
.05
-0.3
8**
-0.1
9**
-0.1
7-0
.54"
-2.0
4"-1
.35*
”0.
34-0
.00*
*-0
.42*
*-0
.40"
-0.0
7"-0
.17"
——
——
R.C
-781
-0.9
9**
0.15
4.04
**2.
00"
0.14
**0.
14"
0.75
"0.
052.
28"
1.5
4"1.
79"
1.05
**1.
40**
——
——
——
——
—
PR-1
5-1
.22*
*-0
.30
-2.6
8**
-4.1
5"0.
020.
09"
-0.4
9**
0.07
-0 8
8"-0
.28"
-0.7
1"0.
36*”
006
-0.7
5*0.
06-0
.|00.
01-0
.10"
0.16
*00
2-0
.11
028*
SE (
gi)
0.17
0.18
0.16
0.20
0.04
0.03
0.05
0.08
0.09
0.10
0.11
0.12
0.45
0.34
0.10
0.11
002
0.02
0.07
——
—
SE (
gi-g
j)0.
260.
280.
240.
300.
060.
040.
070.
120.
141.
160.
170.
190.
680.
510.
150.
170.
04—
0.11
——
—
CD
at l%
0.43
0.46
0.41
0.51
0.10
0.07
0.12
0.20
0.23
0.25
0.28
0.30
1.16
——
——
——
——
—
CD
at 5
%0.
330.
350.
310.
300.
070.
050.
090.
150.
170.
190.
210.
230.
88—
——
——
——
——
Pare
nts
Day
s to
Plan
tPr
imar
ySe
cond
ary
Len
gth
ofN
o. o
fD
ays
toY
ield
/pla
nt10
00-s
eed
Oil
cont
ent
Prot
ein
flow
erin
ghe
ight
bran
ches
bran
ches
mai
nsi
liqua
on
mat
urity
wei
ght
(%)
cont
ent
race
me
mai
n ra
cem
e
261
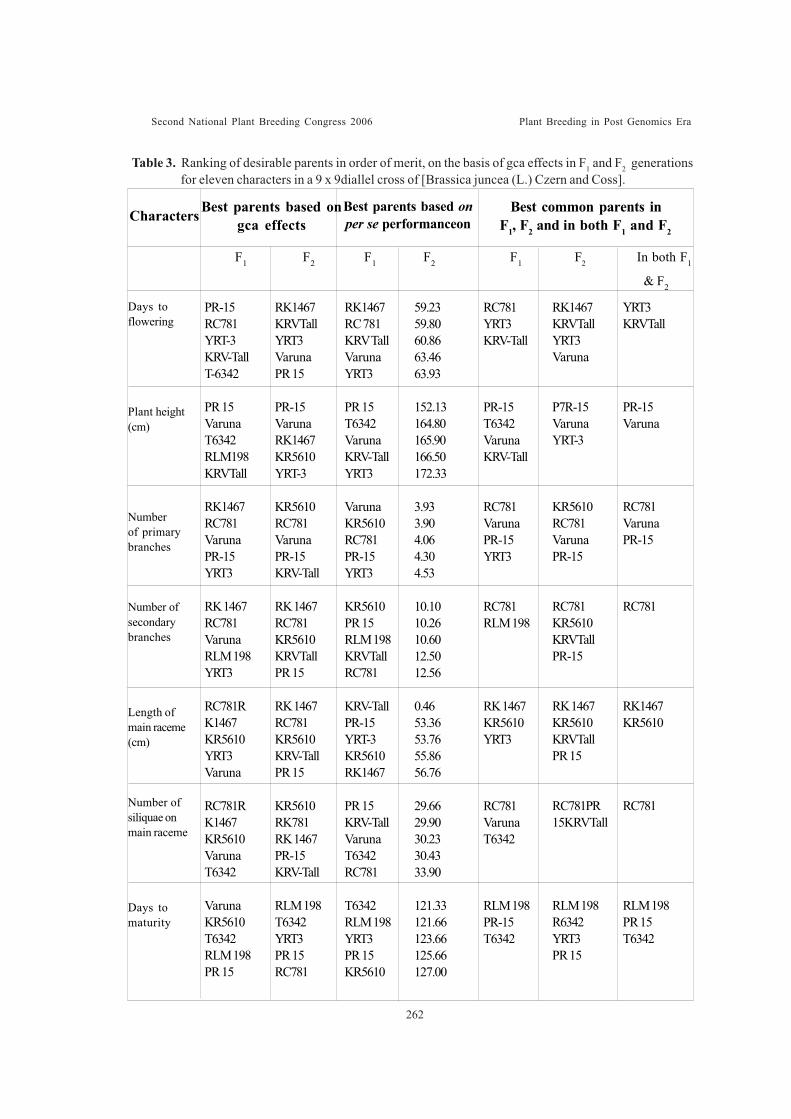
Second National Plant Breeding Congress 2006 Plant Breeding in Post Genomics Era
Table 3. Ranking of desirable parents in order of merit, on the basis of gca effects in F1 and F2 generationsfor eleven characters in a 9 x 9diallel cross of [Brassica juncea (L.) Czern and Coss].
Days toflowering
Plant height(cm)
Numberof primarybranches
Number ofsecondarybranches
Length ofmain raceme(cm)
Number ofsiliquae onmain raceme
Days tomaturity
PR-15RC781YRT-3KRV-TallT-6342
PR 15VarunaT6342RLM198KRVTall
RK1467RC781VarunaPR-15YRT3
RK 1467RC781VarunaRLM 198YRT3
RC781RK1467KR5610YRT3Varuna
RC781RK1467KR5610VarunaT6342
VarunaKR5610T6342RLM 198PR 15
RK1467KRVTallYRT3VarunaPR 15
PR-15VarunaRK1467KR5610YRT-3
KR5610RC781VarunaPR-15KRV-Tall
RK 1467RC781KR5610KRVTallPR 15
RK 1467RC781KR5610KRV-TallPR 15
KR5610RK781RK 1467PR-15KRV-Tall
RLM 198T6342YRT3PR 15RC781
RK1467RC 781KRV TallVarunaYRT3
PR 15T6342VarunaKRV-TallYRT3
VarunaKR5610RC781PR-15YRT3
KR5610PR 15RLM 198KRVTallRC781
KRV-TallPR-15YRT-3KR5610RK1467
PR 15KRV-TallVarunaT6342RC781
T6342RLM 198YRT3PR 15KR5610
59.2359.8060.8663.4663.93
152.13164.80165.90166.50172.33
3.933.904.064.304.53
10.1010.2610.6012.5012.56
0.4653.3653.7655.8656.76
29.6629.9030.2330.4333.90
121.33121.66123.66125.66127.00
RC781YRT3KRV-Tall
PR-15T6342VarunaKRV-Tall
RC781VarunaPR-15YRT3
RC781RLM 198
RK 1467KR5610YRT3
RC781VarunaT6342
RLM 198PR-15T6342
RK1467KRVTallYRT3Varuna
P7R-15VarunaYRT-3
KR5610RC781VarunaPR-15
RC781KR5610KRVTallPR-15
RK 1467KR5610KRVTallPR 15
RC781PR15KRVTall
RLM 198R6342YRT3PR 15
YRT3KRVTall
PR-15Varuna
RC781VarunaPR-15
RC781
RK1467KR5610
RC781
RLM 198PR 15T6342
Characters Best parents based ongca effects
Best parents based onper se performanceon
Best common parents in F1, F2 and in both F1 and F2
F1 F2 F1 F2 F1 F2 In both F1
& F2
262
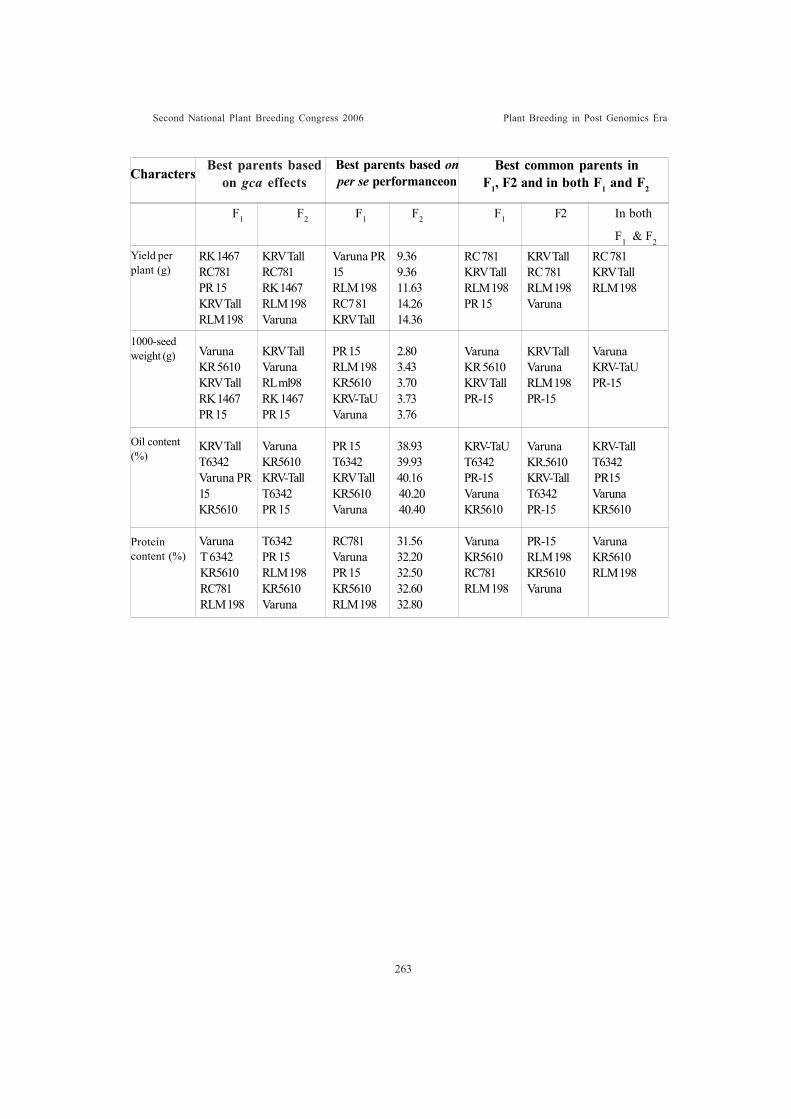
Second National Plant Breeding Congress 2006 Plant Breeding in Post Genomics Era
Characters Best parents basedon gca effects
Best parents based onper se performanceon
Best common parents in F1, F2 and in both F1 and F2
F1 F2 F1 F2 F1 F2 In both
F1 & F2
Yield perplant (g)
1000-seedweight (g)
Oil content(%)
Proteincontent (%)
RK 1467RC781PR 15KRV TallRLM 198
VarunaKR 5610KRV TallRK 1467PR 15
KRV TallT6342Varuna PR15KR5610
VarunaT 6342KR5610RC781RLM 198
KRV TallRC781RK 1467RLM 198Varuna
KRV TallVarunaRL ml98RK 1467PR 15
VarunaKR5610KRV-TallT6342PR 15
T6342PR 15RLM 198KR5610Varuna
Varuna PR15RLM 198RC7 81KRV Tall
PR 15RLM 198KR5610KRV-TaUVaruna
PR 15T6342KRV TallKR5610Varuna
RC781VarunaPR 15KR5610RLM 198
9.369.3611.6314.2614.36
2.803.433.703.733.76
38.9339.9340.16 40.20 40.40
31.5632.2032.5032.6032.80
RC 781KRV TallRLM 198PR 15
VarunaKR 5610KRV TallPR-15
KRV-TaUT6342PR-15VarunaKR5610
VarunaKR5610RC781RLM 198
KRV TallRC 781RLM 198Varuna
KRV TallVarunaRLM 198PR-15
VarunaKR.5610KRV-TallT6342PR-15
PR-15RLM 198KR5610Varuna
RC 781KRV TallRLM 198
VarunaKRV-TaUPR-15
KRV-TallT6342 PR15VarunaKR5610
VarunaKR5610RLM 198
263
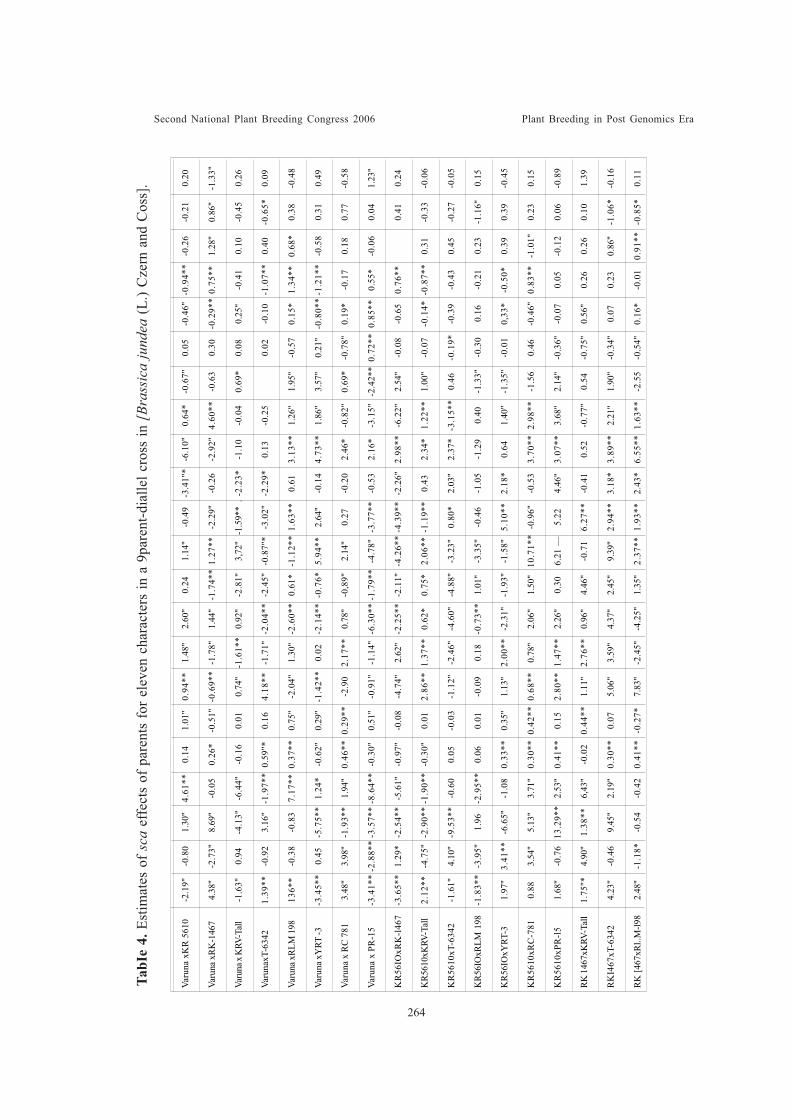
Second National Plant Breeding Congress 2006 Plant Breeding in Post Genomics Era
Varu
na x
KR
561
0-2
.19"
-0.8
01.
30"
4.61
**0.
141.
01"
0.94
**1.
48"
2.60
"0.
241.
14"
-0.4
9-3
.41"
*-6
.10"
0.64
*-0
.67"
0.05
-0.4
6"-0
.94*
*-0
.26
-0.2
10.
20
Varu
na x
RK
-146
74.
38"
-2.7
3"8.
69"
-0.0
50.
26*
-0.5
1"-0
.69*
*-1
.78"
1.44
"-1
.74*
*1.
27**
-2.2
9"-0
.26
-2.9
2"4.
60**
-0.6
30.
30-0
.29*
*0.
75**
1.28
"0.
86"
-1.3
3"
Varu
na x
KRV
-Tal
l-1
.63"
0.94
-4.1
3"-6
.44"
-0.1
60.
010.
74"
-1.6
1**
0.92
"-2
.81"
3,72
"-1
.59*
* .
-2.2
3*-1
.10
-0.0
40.
69*
0.08
0.25
"-0
.41
0.10
-0.4
50.
26
Varu
naxT
-634
21.
39**
-0.9
23.
16"
-1.9
7**
0.59
"*0.
164.
18**
-1.7
1"-2
.04*
*-2
.45"
-0.8
7"*
-3.0
2"-2
.29*
0.13
-0.2
50.
02-0
.10
-1.0
7**
0.40
-0.6
5*0.
09
Varu
na x
RLM
198
136*
*-0
.38
-0.8
37.
17**
0.37
**0.
75"
-2.0
4"1.
30"
-2.6
0**
0.61
*-1
.12*
*1.
63**
0.61
3.13
**1.
26"
1.95
"-0
.57
0.15
*1.
34**
0.68
*0.
38-0
.48
Varu
na x
YRT
-3-3
.45*
*0.
45-5
.75*
*1.
24*
-0.6
2"0.
29"
-1.4
2**
0.02
-2.1
4**
-0.7
6*5.
94**
2.64
"-0
.14
4.73
**1.
86"
3.57
"0.
21"
-0.8
0**
-1.2
1**
-0.5
80.
310.
49
Varu
na x
RC
781
3.48
"3.
98"
-1.9
3**
1.94
"0.
46**
0.29
**-2
.90
2.17
**0.
78"
-0,8
9"2.
14"
0.27
-0.2
02.
46*
-0.8
2"0.
69*
-0.7
8"0.
19*
-0.1
70.
180.
77-0
.58
Varu
na x
PR
-15
-3.4
1**
-2.8
8**
-3.5
7**
-8.6
4**
-0.3
0"0.
51"
-0.9
1"-1
.14"
-6.3
0**
-1.7
9**
-4.7
8"-3
.77*
*-0
.53
2.16
*-3
.15"
-2.4
2**
0.72
**0.
85**
0.55
*-0
.06
0.04
1.23
"
KR
56IO
xRK
-l46
7-3
.65*
*1.
29*
-2.5
4**
-5.6
1"-0
.97"
-0.0
8-4
.74"
2.62
"-2
.25*
*-2
.11"
-4.2
6**
-4.3
9**
-2.2
6"2.
98**
-6.2
2"2.
54"
-0.0
8-0
.65
0.76
**0.
410.
24
KR5
610x
KRV
-Tal
l2.
12**
-4.7
5"-2
.90*
*-1
.90*
*-0
.30"
0.01
2.86
**1.
37**
0.62
*0.
75*
2.06
**-1
.19*
*0.
432.
34*
1.22
**1.
00"
-0.0
7-0
.14*
-0.8
7**
0.31
-0.3
3-0
.06
KR
5610
xT-6
342
-1.6
1"4.
10"
-9.5
3**
-0.6
00.
05-0
.03
-1.1
2"-2
.46"
-4.6
0"-4
.88"
-3.2
3"0.
80*
2.03
"2.
37*
-3.1
5**
0.46
-0.1
9*-0
.39
-0.4
30.
45-0
.27
-0.0
5
KR
56IO
xRLM
198
-1.8
3**
-3.9
5"1.
96-2
.95*
*0.
060.
01-0
.09
0.18
-0.7
3**
1.01
"-3
.35"
-0.4
6-1
.05
-1.2
90.
40-1
.33"
-0.3
00.
16-0
.21
0.23
-1.1
6"0.
15
KR
56IO
xYRT
-31.
97"
3.41
**-6
.65"
-1.0
80.
33**
0.35
"1.
13"
2.00
**-2
.31"
-1.9
3"-1
.58"
5.10
**2.
18*
0.64
1.40
"-1
.35"
-0.0
10,
33*
-0.5
0*0.
390.
39-0
.45
KR
5610
xRC
-781
0.88
3.54
"5.
13"
3.71
"0.
30**
0.42
**0.
68**
0.78
"2.
06"
1.50
"10
.71*
*-0
.96"
-0.5
33.
70**
2.98
**-1
.56
0.46
-0.4
6"0.
83**
-1.0
1"0.
230.
15
KR
5610
xPR
-l5
1.68
"-0
.76
13.2
9**
2.53
"0.
41**
0.15
2.80
**1.
47**
2.26
"0.
306.
21 —
5.22
4.46
"3.
07**
3.68
"2.
14"
-0.3
6"-0
.07
0.05
-0.1
20.
06-0
.89
RK 1
467x
KRV
-Tal
l1.
75"*
4.90
"1.
38**
6,43
"-0
.02
0.44
**1.
11"
2.76
**0.
96"
4.46
"-0
.71
6.27
**-0
.41
0.52
-0.7
7"0.
54-0
.75"
0.56
"0.
260.
260.
101.
39
RK
I467
xT-6
342
4.23
"-0
.46
9.45
"2.
19"
0.30
**0.
075.
06"
3.59
"4.
37"
2.45
"9.
39"
2.94
**3.
18*
3.89
**2.
21"
1.90
"-0
.34"
0.07
0.23
0.86
"-1
.06*
-0.1
6
RK
[467
xRl..
M-l9
82.
48"
-1.1
8*-0
.54
-0.4
20.
41**
-0.2
7*7.
83"
-2.4
5"-4
.25"
1.35
"2.
37**
1.93
**2.
43*
6.55
**1.
63**
-2.5
5-0
.54"
0.16
*-0
.01
0.91
**-0
.85*
0.11
TabI
e 4.
Est
imat
es o
f sca
eff
ects
of p
aren
ts fo
r ele
ven
char
acte
rs in
a 9
pare
nt-d
ialle
l cro
ss in
[Br
assi
ca ju
ndea
(L.)
Cze
rn a
nd C
oss]
.
264
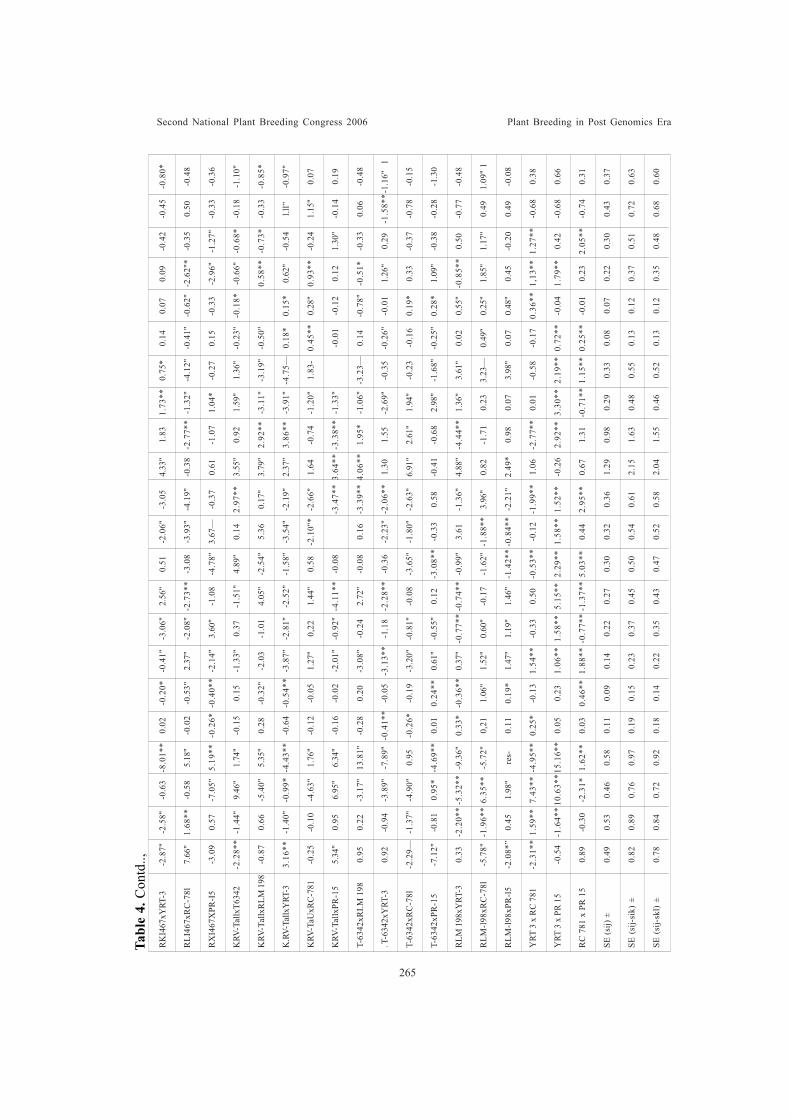
Second National Plant Breeding Congress 2006 Plant Breeding in Post Genomics Era
RK
I467
xYRT
-3-2
.87"
-2.5
8"-0
.63
-8.0
1**
0.02
-0.2
0*-0
.41"
-3.0
6"2.
56"
0.51
-2.0
6"-3
.05
4.33
"1.
831.
73**
0.75
*0.
140.
070.
09-0
.42
-0.4
5-0
.80*
RLI
467x
RC
-78l
7.66
"1.
68**
-0.5
85.
18"
-0.0
2-0
.53"
2.37
"-2
.08"
-2.7
3**
-3.0
8-3
.93"
-4.1
9"-0
.38
-2.7
7**
-1.3
2"-4
.12"
-0.4
1"-0
.62"
-2.6
2"*
-0.3
50.
50-0
.48
RX
I467
XPR
-I5
-3.0
90.
57-7
.05"
5.19
**-0
.26*
-0.4
0**
-2.1
4"3.
60"
-1.0
8-4
.78"
3.67
—-0
.37
0.61
-1.0
71.
04*
-0.2
70.
15-0
.33
-2.9
6"-1
.27"
-0.3
3-0
.36
KRV
-Tal
lxT6
342
-2.2
8**
-1.4
4"9.
46"
1.74
"-0
.15
0.15
-1.3
3"0.
37-1
.51"
4.89
"0.
142.
97**
3.55
"0.
921.
59"
1.36
"-0
.23"
-0.1
8*-0
.66"
-0.6
8*-0
.18
-1.1
0"
KRV
-Tal
lxR
LM 1
98-0
.87
0.66
-5.4
0"5.
35"
0.28
-0.3
2"-2
.03
-1.0
14.
05"
-2.5
4"5.
360.
17"
3.79
"2.
92**
-3.1
1"-3
.19"
-0.5
0"0.
58**
-0.7
3*-0
.33
-0.8
5*
K.R
V-Ta
llxY
RT-3
3.16
**-1
.40"
-0.9
9*-4
.43*
*-0
.64
-0.5
4**
-3.8
7"-2
.81"
-2.5
2"-1
.58"
-3.5
4"-2
.19"
2.37
"3.
86**
-3.9
1"-4
.75—
0.18
*0.
15*
0.62
"-0
.54
l.ll”
-0.9
7"
KRV
-TaU
xRC
-781
-0.2
5-0
.10
-4.6
3"1.
76"
-0.1
2-0
.05
1.27
"0,
221.
44"
0.58
-2.1
0"*
-2.6
6"1.
64-0
.74
-1.2
0"1.
83-
0.45
**0.
28"
0.93
**-0
.24
1.15
"0.
07
KRV
-Tal
lxPR
-15
5.34
"0.
956.
95"
6.34
"-0
.16
-0.0
2-2
.01"
-0.9
2"-4
.11*
*-0
.08
-3.4
7**
3.64
**-3
.38*
*-1
.33"
-0.0
1-0
.12
0.12
1.30
"-0
.14
0.19
T-63
42xR
I.M 1
980.
950.
22-3
.17"
13.8
1"-0
.28
0.20
-3.0
8"-0
.24
2.72
"-0
.08
0.16
-3.3
9**
4.06
**1.
95*
-1.0
6"-3
.23—
0.14
-0.7
8"-0
.51*
-0.3
30.
06-0
.48
. T-6
342x
YRT
-30.
92-0
.94
-3.8
9"-7
.89"
-0.4
1**
-0.0
5-3
.13*
*-1
.18
-2.2
8**
-0.3
6-2
.23"
-2.0
6**
1.30
1.55
-2.6
9"-0
.35
-0.2
6"-0
.01
1.26
"0.
29-1
.58*
*-1.
16"
1
T-63
42xR
C-7
8l-2
.29—
-1.3
7"-4
.90"
0.95
-0.2
6*-0
.19
-3.2
0"-0
.81"
-0.0
8-3
.65"
-1.8
0"-2
.63"
6.91
"2.
61"
1.94
"-0
.23
-0.1
60.
19*
0.33
-0.3
7-0
.78
-0.1
5
T-63
42xP
R-1
5-7
.12"
-0.8
10.
95*
-4.6
9**
0.01
0.24
**0.
61"
-0.5
5"0.
12-3
.08*
*-0
.33
0.58
-0.4
1-0
.68
2.98
"-1
.68"
-0.2
5"0.
28*
1.09
"-0
.38
-0.2
8-1
.30
RLM
198
xYRT
-30.
33-2
.20*
*-5
.32*
*-9
.36"
0.33
*-0
.36*
*0.
37"
-0.7
7**
-0.7
4**
-0.9
9"3.
61-1
.36"
4.88
"-4
.44*
*1.
36"
3.61
"0.
020.
55"
-0.8
5**
0.50
-0.7
7-0
.48
RLM
-l98x
RC
-78l
-5.7
8"-1
.96*
*6.
35**
-5.7
2"0,
211.
06"
1.52
"0.
60"
-0.1
7-1
.62"
-1.8
8**
3.96
"0.
82-1
.71
0.23
3.23
—0.
49"
0.25
"1.
85"
1.17
"0.
491.
09"
1
RLM
-l98x
PR-l5
-2.0
8*”
0.45
1.98
"re
s-0.
110.
19*
1.47
"1.
19"
1.46
"-1
.42*
*-0
.84*
*-2
.21"
2.49
*0.
980.
073.
98"
0.07
0.48
"0.
45-0
.20
0.49
-0.0
8
YRT
3 x
RC
781
-2.3
1**
1.59
**7.
43**
-4.9
5**
0.25
*-0
.13
1.54
**-0
.33
0.50
-0.5
3**
-0.1
2-1
.99*
*1.
06-2
.77*
*0.
01-0
.58
-0.1
70.
36**
1,13
**1.
27**
-0.6
80.
38
YRT
3 x
PR
15
-0.5
4-1
.64*
*10
.63*
*15.
16**
0.05
0.23
1.06
**1.
58**
5.15
**2.
29**
1.58
**1.
52**
-0.2
62.
92**
3.30
**2.
19**
0.72
**-0
.04
1.79
**0.
42-0
.68
0.66
RC
781
x P
R 1
50.
89-0
.30
-2.3
1*1.
62**
0.03
0.46
**1.
88**
-0.7
7**
-1.3
7**
5.03
**0.
442.
95**
0.67
1.31
-0.7
1**
1.15
**0.
25**
-0.0
10.
232.
05**
-0.7
40.
31
SE (s
ij) ±
0.49
0.53
0.46
0.58
0.11
0.09
0.14
0.22
0.27
0.30
0.32
0.36
1.29
0.98
0.29
0.33
0.08
0.07
0.22
0.30
0.43
0.37
SE (
sij-s
ik)
±0.
820.
890.
760.
970.
190.
150.
230.
370.
450.
500.
540.
612.
151.
630.
480.
550.
130.
120.
370.
510.
720.
63
SE (
sij-s
kl)
±0.
780.
840.
720.
920.
180.
140.
220.
350.
430.
470.
520.
582.
041.
550.
460.
520.
130.
120.
350.
480.
680.
60
Tabl
e 4.
Con
td..,
265
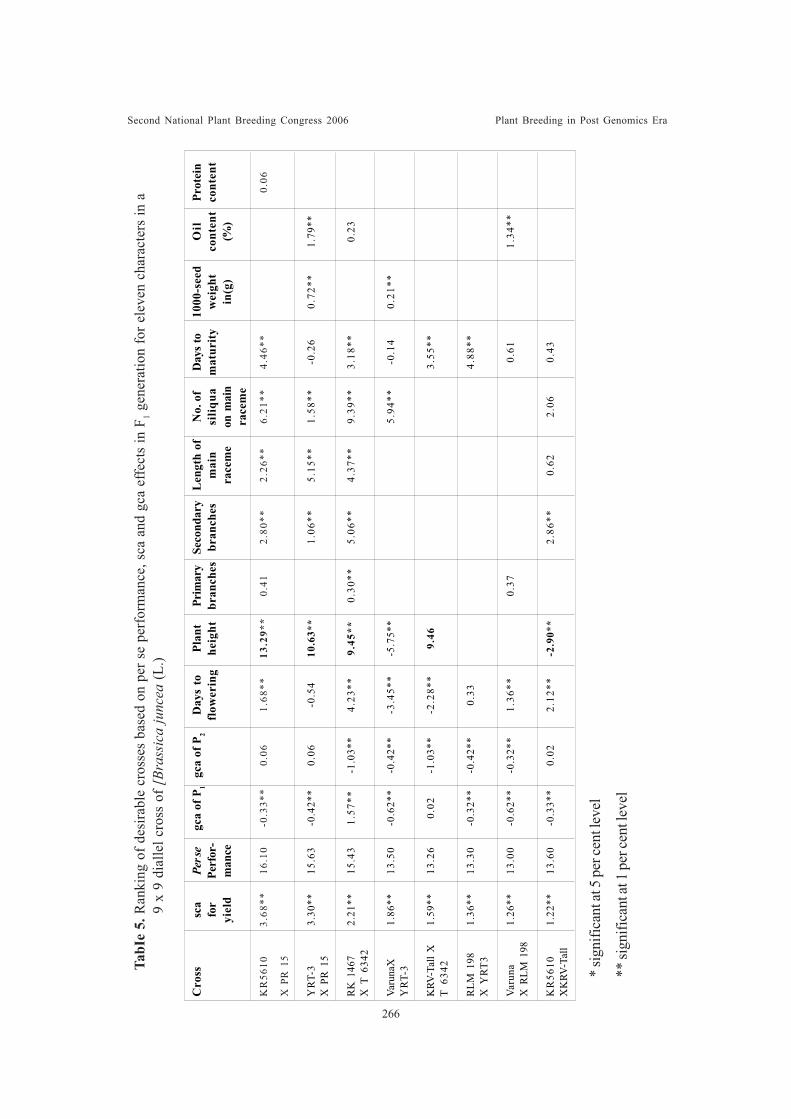
Second National Plant Breeding Congress 2006 Plant Breeding in Post Genomics Era
TabI
e 5.
Ran
king
of d
esira
ble
cros
ses
base
d on
per
se
perf
orm
ance
, sca
and
gca
effe
cts
in F
1 gen
erat
ion
for e
leve
n ch
arac
ters
in a
9 x
9 di
alle
l cro
ss o
f [Br
assi
ca ju
ncea
(L.)
* sig
nific
ant a
t 5 p
er ce
nt le
vel
** si
gnifi
cant
at 1
per
cent
leve
l
Cro
sssc
aPe
r se
gca
of P
1gc
a of
P2
Day
s to
Plan
tPr
imar
ySe
cond
ary
Len
gth
ofN
o. o
fD
ays t
o10
00-s
eed
Oil
Prot
ein
for
Perf
or-
flow
erin
ghe
ight
bran
ches
bran
ches
mai
nsi
liqua
mat
urity
wei
ght
cont
ent
cont
ent
yiel
dm
ance
race
me
on m
ain
in(g
)(%
)ra
cem
e
KR
5610
3.68
**16
.10
-0.3
3**
0.06
1.68
**13
.29*
*0.
412.
80**
2.26
**6.
21**
4.46
**0.
06
X P
R 1
5
YR
T-3
3.30
**15
.63
-0.4
2**
0.06
-0.5
410
.63*
*1.
06**
5.15
**1.
58**
-0.2
60.
72**
1.79
**X
PR
15
RK
146
72.
21**
15.4
31.
57**
-1.0
3**
4.23
**9.
45**
0.30
**5.
06**
4.37
**9.
39**
3.18
**0.
23X
T 6
342
Varu
naX
1.86
**13
.50
-0.6
2**
-0.4
2**
-3.4
5**
-5.7
5**
5.94
**-0
.14
0.21
**Y
RT-
3
KRV
-Tal
l X1.
59**
13.2
60.
02-1
.03*
*-2
.28*
*9.
463.
55**
T 6
342
RLM
198
1.36
**13
.30
-0.3
2**
-0.4
2**
0.33
4.88
**X
YRT
3
Varu
na1.
26**
13.0
0-0
.62*
*-0
.32*
*1.
36**
0.37
0.61
1.34
**X
RLM
198
KR
5610
1.22
**13
.60
-0.3
3**
0.02
2.12
**-2
.90*
*2.
86**
0.62
2.06
0.43
XK
RV-T
all
266

Second National Plant Breeding Congress 2006 Plant Breeding in Post Genomics Era
Second National Plant Breeding Congress 2006 Plant Breeding in Post Genomics Era
TECHNICAL SESSION V
IN VITRO BREEDING TOOLS IN GENETICENHANCEMENT OF CROPS
Second National Plant Breeding Congress 2006 Plant Breeding in Post Genomics Era
COMBINED EXPRESSION OF CHITINASE AND Â-1,3 - GLUCANASEGENERATES HIGH LEVELS OF SHEATH BLIGHT RESISTANCE IN
HOMOZYGOUS TRANSGENIC RICE LINESSridevi, G1., C. Parmeswari, N. Sabapathy and K. Veluthambi
ABSTRACTSheath blight disease caused by Rhizoctonia solani is the second major fungal disease
in rice next to blast. A major limitation in the management of sheath blight disease is thelack of complete resistance in the known cultivars of rice. Many plant genetic engineeringefforts to develop fungal resistance involve PR (pathogenesis-related) protein genes. Amongthe PR proteins, chitinase (PR-3) and b-1,3-glucanase (PR-2) are efficient in the lysis ofchitin and glucan polymers in the fungal cell wall. Agrobacterium-mediated transformationof rice was performed using a binary vector (pNSP3), harbouring rice chitinase (chi11)gene under maize ubiquitin promoter and tobacco b-1,3-glucanase gene under CaMV 35Spromoter. Nine transgenic rice plants harbouring both the chitinase and b-1,3-glucanasegenes were generated. Five T0 plants carried single T-DNA copies, one had two linked T-DNA copies and a long-transfer event, one had a head-to-head dimer and the remainingtwo had complex integration patterns. Seven T0 lines showed a segregation pattern of 3:1.Northern and western analysis of T1 plants of single copy lines showed constitutive expressionand accumulation of chitinase and b-1,3-glucanase. All the single copy lines, which weremade homozygous, showed 10-fold higher chitinase enzyme activity as compared to non-transgenic control rice plants. Interestingly, two T1 plants of T0 line 57 (a head-to-headdimer) expressed chitinase constitutively but showed silencing of the b-1,3-glucanase gene.Bioassay of homozygous T2 plants of three single copy transgenic lines against Rhizoctoniasolani revealed a 60% reduction of sheath blight disease index. By combining the geneticanalysis by segregation and molecular analysis by semi-quantitative Southern hybridization,a method was developed to achieve genetic separation of two unlinked transgenic loci andto identify homozygous transgenic lines in the T1 generation.
1. School of Biotechnology, Madurai Kamaraj University, Madurai 625021
267
Second National Plant Breeding Congress 2006 Plant Breeding in Post Genomics Era
TRANSFORMATION OF THREE ANTIOXIDANT GENES FROM AHIGHLY SALT TOLERANT GRAY MANGROVE, AVICENNIA MARINA
FORSK. (VIER H.) IN INDICA RICEAjay Parida, S. R. Prashanth, M.N. Jithesh and KR. Sivaprakash
ABSTRACTSalinity is one of the major threats in decreasing crop productivity worldwide. It leads
to a reduction in photosynthesis and the unused excess light energy results in over-reductionof molecular oxygen. The transfer of electrons to molecular oxygen results in the productionof reactive oxygen species (ROS). Under high light and CO2 limiting conditions caused byenvironmental stress like salinity, the antioxidative enzymes (SOD, CAT and FER) play animportant role in scavenging toxic radicals in different organelles of the plant such aschloroplasts, cytosol, mitochondria and peroxisomes. To investigate the functions ofantioxidative enzymes in the abiotic stress responses in a mangrove plant, we isolated threecDNAs encoding cytosolic Cu/Zn SOD (Sod1), catalase (Cat1) and ferritin (Fer1) fromAvicennia marina cDNA library. We studied the expression of these antioxidant genes inresponse to different abiotic stress factors like salt, iron, and light stress, an osmoticum-mannitol and direct oxidative stress factor-hydrogen peroxide by mRNA expression analysis.Cat1, Fer1 showed short-term induction while Sod1 transcript was found to be unalteredin response to NaCI stress. A decrease in mRNA levels owas observed for Sod1, Cat1 whileFer1 mRNA levels remained unaltered with osmotic stress treatment. Sod1, Cat1 and Fer1mRNA levels were induced by iron, light stress and by direct H2O2 stress treatment. Theseresults reveal the importance of these three genes in abiotic stress responses. All the threegenes have been cloned in binary constructs for transformation in indica rice usingAgrobacterium and particle bombardment methods
M.S.Swaminathan Research Foundation, Chennai - 600 113
268
Second National Plant Breeding Congress 2006 Plant Breeding in Post Genomics Era
IN VITRO GENETIC TRANSFORMATION FOR THE HELICOVERPARESISTANCE USING CRY1 A(B) IN PIGEON PEA
( CAJANUS CAJAN L. CV MARUTI)Sandhyarani.N1, Mukund Shiragur. Sumangala Bhat and M.S.Kuruvinshetti
ABSTRACT
The present study was undertaken to standardize in vitro plant regeneration andAgrobacterium mediated transformation procedure for pigeonpea (Cajanus cajan L. cvMaruti). A direct regeneration protocol was employed using cotyledonary node (CN),half cotyledon with cotyledonary node (1/2 CNC) and cotyledon with cotyledonary node(CNC). These were cultured on various levels of benzyl amino purine (BAP) viz., 1,2,3and 4 mg/l and thidiazuron (TDZ) 0.01,0.05,0.1,0.5 mg/l. CNC was found to producehighest average of 1.69 shoots per explant, and average of 3.5 buds per explant. Amongdifferent levels of cytokinin, BAP 2 mg/l was found to be better for the multiple shoot andshoot bud induction . Elongation of shoot buds was achieved at reduced level of thecytokinins and among all the cytokinins tested TDZ (0.05 mg/l) showed better response.Sufficiently elongated shoots were rooted on the half strength of MS medium with variouslevels of IBA of which 0.2 mg/l gave the good healthy roots. Rooted plants were transferredto pots for acclimatization in the green house before sending to field .
For transformation, Agrobacterium strain EHA105 harboring pBIN bt1 plasmid withnptII as selectable marker, which confers kanamycin resistance was used. Initially kanamycinsensitivity of the control explants was tested at different growth stages. Inhibitory levels atdifferent stages were used for selection of the transformants. Precultivation of the explantson MS with 2 mg/l BAP for two days prior to cocultivation resulted in increasedtransformation frequency. PCR with nptII specific primer revealed that approx. 1.4%transformants were obtained. This protocol can be further used to transfer many otheruseful genes in pigeonpea for genetic improvement.
Introduction
The importance of the grain legume ismultipurpose as source of protein for both humanand animal consumption. Nutritionally they arericher in proteins than cereals. Pigeonpeapopularly known as redgram ( Cajanus cajanL. Millsp) is one of the major grain legumes oftropics and subtropics, where it provides a largeproportion of the dietary protein requirements.It also improves soil fertility by fixing atmosphericnitrogen. In Karnataka, it is grown in an area of4.4 lakh hectares with a production of 2.2 lakhtonnes. In the northern part of Karnataka,especially in Gulbarga, it is grown as acommercial crop. However in Gulbarga so called
1. Institute of Agri Biotechnology, UAS Dharwad –580005 Coffee Board CRS,CCRI,Chikmagalur [email protected]
redgram bowl of Karnataka, it is grown in anarea of 1.67 lakh hectares with a production of0.57 lakh tonnes and an average productivityof 359 kg ha-1 which is very low (Singhal, 1999),compared to the overall productivity ofKarnataka state (494 kg/ha) and the country(500 kg/ha). However, pigeonpea or redgramproduction is threatened by many insects,diseases and weeds. Pigeonpea cv ICPL 8863(Maruti), a popular variety of Karnataka is ofmedium duration and wilt resistant, but highlysusceptible to pod borer. The lower productivityof pigeonpea is mainly because of wilt diseaseand pod borer damage by lepidopteran insectHelicoverpa armigera which causes yield
269
Second National Plant Breeding Congress 2006 Plant Breeding in Post Genomics Era
losses to the extent of 46.6 to 63.6 per cent (Anon,1978). Attempts to obtain pest resistantgenotypes of pigeonpea species by conventionalbreeding methods have not been successfulbecause of the limited available genetic variationamong cultivated species and presence ofincompatibility with wild , pest resistant species( Nene et al., 1990). Because of its usefulnessfor human and animal consumption in Karnataka,we were interested in biotechnological methodsto improve this important variety. With the adventof the genetic engineering techniques , it is nowpossible to transfer the useful genes acrossspecies (Nayak et al., 1997). High frequency invitro regeneration compatible with gene deliveryis a prerequisite for genetic transformation. Asin vitro regeneration in pigeonpea is highlygenotype dependent , an attempt has been madeto induce shoot buds and regeneration ofcomplete plants from different explants of pigeonpea cv ICPL 8863 ( Maruti) and a genetictransformation protocol is described.
Materials and methods Plant material
Uniform seeds of pigeonpea cv ICPL-8863(Maruti) were obtained from National seedproject and Breeders Seed Project BSP- NSPunit University Of Agricultural Sciences,Dharwad, Karnataka, India. The seeds weresurface sterilized in 70% ethanol, followed by0.1% aqueous mercuric chloride solution for 10min and then rinsed five times with sterile distilledwater. Thereafter, they were cultured in testtubes/ culture bottles containing germinationmedium. The seed germination medium consistedof half strength of mineral salts and vitamins ofMurashige and Skoog (1962), 3% sucrose and0.9% agar pH 5.7 supplementsd with 2 mg/l 6-benzylaminopurine (BAP). Seeds weregerminated in dark for six days. Shoot apices(ST), cotyledonary nodes(CN), cotyledonarynode with cotyledon (CNC) cotyledonary nodewith half cotyledon (1/2 CNC) were used asexplants for regeneration.
The culture medium used for direct shootorganogenesis consisted of MS basal medium(Murashige and Skoog, 1962) containing 3%sucrose, 0.9 % agar (Hi media,Bombay) andsupplemented with either 6-benzyl amino purine(BAP) (1.0,2.0,3.0,4.0mg /l) or Thidiazuron(TDZ)(0.01,0.05,0.1 and 0.5 mg/l) at variousconcentrations . All media were adjusted to pH5.7 before autoclaving at 1210C (1kg/sq.cm)for 15-20 min. All the cultures were incubatedat 25_+ 20 C with light intensity of ca 1000 luxprovided by fluorescent tubes ( 7200 0 K) overa light/dark cycle of 16/8 hours. Explantsobtained with ½ MS with or without 2mg / lBAP were used in studies on shoot regenerationfor 30 days. Each regeneration treatment had20 replications and each replication with 2cultures were arranged in a completelyrandomized block design.
Observations on cultures showingregeneration and number of shoot buds andshoots per responding culture were recordedafter 3 weeks at each sub culture. Shoots andshoot buds were subcultured on medium withlower levels of cytokinins for shoot elongation.
To promote rooting, excised shoots werecultured on MS and half strength MS mediumwith 3% sucrose, 0.8% agar and supplementedwith either naphthalene acetic acid (NAA) orIndole butyric acid (IBA) at 0.0, 0.1, 0.2 and0.5 mg /l.
Significance was determined by analysisof variance (ANOVA) using the randomizedblock design. Differences between means werecompared by Duncan’s multiple range test usingMSTAT-C computer program (Michigan StateUniversity). Data given in percentages weresubjected to arcsine(sin –1 p) transformation(Gomez and Gomez, 1984) for statisticalanalysis and analysed as factorial experiment.
Bacterial strain and vector
The disarmed and hyper virulent
270
Second National Plant Breeding Congress 2006 Plant Breeding in Post Genomics Era
Agrobacterium tumefaciens strain EHA 105(Hood et al., 1993) harboring binary vectorpBinBt1 was used for transformationexperiments. This construct contains thecry1A(b) gene linked to the cauliflower mosaicvirus (CaMV) 35 S promoter, pAOcs terminatorand neomycin phosphotransferase (npt II) geneunder the control of nopaline synthase (nos)promoter and terminator. npt II was used as aselectable marker (Fig.1).The AgrobacteriumEHA 105 containing pBinBt1 culture wasmaintained on solid MSY medium containing 100mg l-1 of kanamycin. Single Agrobacteriumcolony was taken from the LB plate andinoculated into 100 ml LB liquid mediumcontaining 100 mg l-1 kanamycin and wasincubated on shaker for 48 hrs at 280Cand at200rpm( Sambrook et al.,1989) and fresh culturewas used for transformation.
Transformation
Kanamycin sensitivity test was carried outto find out the concentration of kanamycinrequired to be used for the selection of thetransformed plants and was carried at 0, 25, 50,75 and 100 mg l-1 concentration and lethal dosagewas identified at different growth stages.Further, to know the minimum level of cefotaximethat will completely eliminate the excess bacteriaafter cocultivation, experiment was conductedat 100 mg l-1, 200 mg l-1, 300 mg l-1 and 400 mg l-
1 cefotaxime along with control.
Cocultivation was done just before theformation of shoot buds. Injury was made nearthe place of bud formation with a sterile scalpelblade and the following protocol was followed.Six to eight days old seedlings were taken fromin vitro germinated seeds for explantpreparation. Cotyledonary nodes with cotyledon(CNC) were put on regeneration medium forpreculturing for two days. Precultured explantswere immersed in Agrobacterium suspensionfor 15 minutes with gentle shaking. The explantswere taken out of bacterial suspension and
excess bacteria were blotted dry using sterileblotting paper. Explants were placed onregeneration medium for different days i.e. 1,2, 3, and 4 in dark for cocultivation. Aftercocultivation, explants were regenerated andshoots were transferred to selection mediumafter thorough washing with MS broth alongwith 100 mg l-1 kanamycin and cefotaxime (300 mg/l) and blotting with sterile blotting paper.Subculturing was done at every 15 days onsame medium to avoid escapes. The resistantshoots obtained were separated and transferredindividually to rooting medium (MS+0.2 mg l-1
IBA + 25 mg l-1 kanamycin).
Confirmation of the transformants usingspecific PCR
To confirm the transformation, plasmidDNA was extracted according to Sambrooket al., (1989). and plant DNA was extractedaccording to Edwards et al., (1991). DNA wasquantified using saranwrap method ofquantification ( Sambrook et al., 1989) To testthe integration of npt II) gene in transformedplants, PCR amplification of npt II gene wascarried out using specific primers. Forward 51
GAG GCT ATT CGG CTA TGA CTG31Reverse 51 ATC GGG AGG GGC GAT ACCGTA 31. PCR was performed in 25 mL solutionmix containing Taq pol 1U , 1XTaq assaybuffer, 100mM dNTP mix , 0.3 M of eachforward and reverse primer. 50ng of thetemplate DNA in a Hybaid omn-E thermalcycler according to Geetha et al., (1999).Separation of amplified products was done on1.2 per cent agarose gel using 1 x TAE bufferand amplified products were photographedusing gel documentation system (UVI-TecCambridge, England).
Results and Discussion
Regeneration
Pulses in general are recalcitrant toregeneration under in vitro conditions and
271
Second National Plant Breeding Congress 2006 Plant Breeding in Post Genomics Era
response is highly genotype specific. Thus thereis a need to develop an efficient regenerationprotocol for a given genotype. Initially shoots andshoot buds derived from seedlings germinatedon half strength MS were used, but explantsderived from seedlings germinated on halfstrength MS supplemented with 2 mg/l BAPproduced more number of shoots and shoot buds.Bulged nodal region was seen in the laterseedlings.(Fig A.) Thus differences in thegermination medium influences multiple shootproduction from explants. These findings are inagreement with previous investigations ofShivaprakash et al., (1994). Thus in the presentinvestigation seeds were germinated on half MSwith 2mg/l BAP for further analysis. Thispretreatment with BAP during seed germinationis also practiced in micropropagation ofsugarbeet cultivars (Grieve et al., 1997, Zhonget al., 1993 and Zhang et al., 2001)
Pigeonpea seeds germinated within six daysand attained the explant extractable stage on bothplant growth regulator free and BAPsupplemented MS media. There were noapparent deviations in either the rate or frequencyof seed germination attributable to with orwithout growth regulator. However, the growthof the seedlings was significantly altered in thepresence of BAP. Seedlings grown on BAPsupplemented media showed poor rootdevelopment with enlarged cotyledons, thickstout stem and bulged node region. A limitedelongation and development of the shoot apexwas observed and subsequently many axillarybuds developed on this. When explants weredetached from BAP treated seedlings andcultured on fresh regeneration medium (MSsupplemented with BAP or TDZ) shoots wereinitiated 15 days after the incubation. Explantsderived from seedlings grown on plant growthregulator free medium produced very fewshoots.(Data not shown). Identification of mostsuitable growth regulator and its concentrationis crucical for morphogenesis. Shivaprakash
et al. (1994) compared the relativeeffectiveness of cytokinins for multiple shootformation and the order of effectiveness wasBAP> Kinetin> Zeatin>Adenine in pigeonpea.Superiority of BAP over Kinetin was alsodemonstrated by Geetha et al. (1998). In thepresent investigation, comparison was madebetween different levels of BAP and TDZ.BAP was found to give better response tomultiple shoot organogenesis, in Maruti cultivar.Among the four different levels of BAP, 2mgl-1 BAP induced highest mean number ofmultiple shoot (1.47) and at higher levels ofBAP, shoot numbers decrease significantly.When CNC was cultured on MS+2 mg l-1 BAP,both per cent explant responding (100%) andmean number of shoots (3.0) and shoot buds(6.225) per explants were higher (Table 1 andFig b,c,d).
In general lower levels of cytokinins in themedium supplemented with auxins enhancesshoot elongation (Franklin et al. 1998,Geethaet al. 1998). In the present investigation, explantcontaining shootbuds were subcultured on MSsupplemented with 2 levels of BAP (0.1 mgand 0.2 mg l-1) and 2 levels of TDZ (0.01 mgand 0.05 mg l-1) for shoot elongation. MSsupplemented with 0.2 mg l-1 BAP was foundto be better in terms of per cent explantresponding (94%). However, when meannumber of shoots elongated per explant wasconsidered MS with 0.05 mg l-1 TDZ was (5.4)found better. Therefore MS+0.05 mg l-1 TDZwas considered for shoot bud elongation infurther experiments (Table2 and Fig e). Further,when shoot initials were cultured withoutcotyledon on elongation medium, callus wasobserved at the cut end and shoot elongationwas very slow. On the other hand when shootinitial were cultured along with cotyledon, shootelongation was faster and callus was notobserved.
In the present study, MS medium wasfound more responsive for rooting (88%) but
272
Second National Plant Breeding Congress 2006 Plant Breeding in Post Genomics Era
shoots had less number of roots and no rootlets.Thus various levels of indole butyric acid (IBA)or naphthalene acetic acid (NAA) (0.1, 0.2, 0.5mg l-1) were tried with MS basal (Table 3).Among the various levels of IBA and NAA used0.2 mg l-1 IBA was found better in inducing roots(75% response with well developed roots androotlets). The roots produced on MSsupplemented with NAA were short, thick butper cent response was very low (25 to 35%).The roots were often associated with the callus.In contrast to this when IBA was used in themedium roots were thin, long and with manyrootlets. Superiority of IBA over NAA and IAAwas also reported by Geetha et al. (1998) andLawrence and Koundal (2001).
Transformation
Development of Agrobacterium mediatedin vitro transformation protocol required efficientregeneration protocol. In our laboratory it hasbeen noticed that routine protocols standardizedfor multiple shoot regeneration in pigeonpea donot work as such when explants are coculturedwith A. tumefaciens. Therefore, modification inthe standardized regeneration protocol isnecessary. In view of this certain modificationare usually made in the standardized regenerationmedium to have efficient regeneration aftercocultivation (Geetha et al., 1999; Lawrence andKoundal, 2001).
Cocultivated CNC cultured on MS+2 mg l-1
BAP+300 mg l-1 cefotaxime produced meannumber of 2.55 shoots and 3.4 shoot buds perexplant. However non cocultivated CNCproduced mean number of 3.44 shoots and 6.225shoot buds. Trend of CNC producing moremultiple shoots and shoot buds on MS+2 mg l-1
BAP remained same in both conditions.Therefore, this combination was chosen forcocultivation. The test was conducted to knowthe effective lethal level of kanamycin ondifferent explants during shoot bud initiation andfurther growth stages (Table 4). This will allow
preferential growth of the transformed tissuescontaining nptII gene.
The sensitivity to kanamycin differs withgenotypes (Geetha et al. 1999; Lawrence andKoundal, 2001) and levels ranged from 25 to100 mg l-1. In the present study shoots and shootbuds were transferred to selection mediacontaining 50 mg l-1 kanamycin and 75 mg l-1
kanamycin, respectively. The surviving shootsin the first step were subcultured on the samemedium and elongated shoot buds were shiftedto 50 mg l-1 kanamycin for second level ofselection. The level of kanamycin was reducedaccording to growth stage of explant. Repeatedselection on kanamycin was done to eliminateescapes and resistant shoots were analysedfurther. Among four levels of cefotaxime tested(100, 200, 300 and 400 mg l-1) , 300 mg l-1 wasthe minimum level to control Agrobacteriumeffectively. This finding is in agreement withGeetha et al. (1999), Arundhati (1999) andLawrence and Koundal (2001), who observedeffective inhibition of Agrobacterium at 300mg/l in all the explants. Although cefotaxime issupposed to be non toxic to plant tissues itinhibited root growth in the present study. Thus,in the rooting media cefotaxime was eliminated.This finding is in accordance with Geethaet al. (1999) and Lawrence and Koundal (2001)who used selective rooting media (MS + 25mg l-1 kanamycin + 0.2 mg l-1 IBA) withoutcefotaxime.
Coculviation period influences survivabilityof explants. In the present investigation,survival of cocultivated explants withAgrobacterium was maximum upto two daysbeyond which explants did not survive becauseof excessive growth of Agrobacterium. Inpigeonpea, Arundhati (1999) reportedincreased frequency of transformation from 4day cocultivated leaf discs (47.8%) over 2 daycocultivated leaf discs. Pre-culture of explantson regeneration medium prior to cocultivation
273
Second National Plant Breeding Congress 2006 Plant Breeding in Post Genomics Era
may play an important role in transformation.Preincubation for 24 hr was followed inpigeonpea (Geetha et al., 1999; Lawrence andKoundal, 2001), chickpea (Kar et al., 1996). Inthe present investigation preculturing of explantsincreased the survivability after cocultivationover direct cocultivated explants. Explants aftercocultivation were cultured on MS along with 2mg l-1 BAP and 300 mg l-1 cefotaxime withoutkanamycin for 15 days. Such regenerated shootand shootbuds were transferred to selection mediaviz., MS supplemented with 0.2 mg l-1 BAP, 75mg l-1 kanamycin and 300 mg l-1 cefotaxime forshootbuds and only 50 mg l-1 kanamycin forshoots in two sub cultures(Table 5 and Fig. J).Surviving shoots in first selection were selectedonce again in the second sub culture to avoidescapes
Several technique are being used to confirmthe presence of transgene viz., Southern blotting,Dot bloting, Northern blotting, Immuno blottingPCR etc. Of these PCR based techniques withtransgene specific primers are the easiestmethods to detect the presence of transgene.Survived shoots were kept for rooting and DNAextracted from leaf sample at this stage was usedfor PCR analysis. Shoots were selected onelongation medium at 75 mg l-1 kanamycin (Fig .I) (Table5). In two cycles of subculture only twoshoots survived and were transferred to rootingmedium (MS + 0.2 mg l-1 IBA + 50 mg l-1
kanamycin) (Fig . k). Leaf samples from theseshoots were used for DNA extraction and PCRanalysis. Presence of the npt II specific band700bp in transformants, positive control and itsabsence in negative control and in untransformedplant confirmed the presence of transgene in thetested plants(Fig. L).Frequency of transformantswas more among tested plants when selectionstarted at bud initiation stage, (66%) followedby only at elongation stage (50%). And in totaltranformation efficiency is 1.4% (Table 6).
The authors thank Dr. M. K. Mishra, Seedproduction officer Coffee Board, and Dr.
Jayarama DR Coffee Board, Dr. Santharama,HDB, Coffee Board for their encouragementand critical evaluation of the manuscript.
REFERENCES
Anonymous. 1978. The pulse pigeonpea. InAnnual Report for 1978-79, InternationalCrop Research Institute for Semi AridTropics, Patancheru, Hyderabad, AndhraPradesh, India, pp.105
Arundhati, A. 1999. Agrobacterium mediatedtransformation of pigeonpea (Cajanuscajan L. Millsp.) by using leaf disks.International Chickpea and PigeonpeaNewsletter. 6: 62-64.
Edwards, K., Johnstone, C., Thompson, C.1991. A simple and rapid method for thepreparation of plant genomic DNA for PCRanalysis. Nucleic Acids Research. 19:1349
Franklin, G., Jeychandran, R., Melchias, G.,Ignacimuthu, S. 1998. Multiple shootinduction and regeneration of pigeonpea(Cajanus cajan (L.) Millsp) Cv. Vamban1 from apical and axillary meristem.Current Science. 74: 936-937.
Geetha, N., Venkatachalam, P., Prakash, V.,Lakshmisita, G. 1998. High frequencyinduction of multiple shoots and plantregeneration from seedling explants ofpigeonpea (Cajanus cajan L.). CurrentScience. 75: 1036-1041.
Geetha, N., Venkatachalam, P., Lakshmisita, G.1999. Agrobacterium-mediated genetictransformation of pigeonpea (Cajanuscajan L.) and development of transgenicplants via direct organogenesis. PlantBiotechnology. 16: 213-218.
Gomez, K.A., Gomez, A.A. 1984. StatisticalProcedures for Rice Research Workers.Publication by International Rice ResearchInstitute, Manila, Philippines, pp.196-211.
274
Second National Plant Breeding Congress 2006 Plant Breeding in Post Genomics Era
Grieve,T.M., Gartland,K.M.A, Elliot, M.C.1997. Micropropagation of commerciallyimportant sugarbeet cultivars. Plant growthReg. 22: 15-18.
Hood, E.E., Gelvin, S.B., Melchers, L.S.,Hoekema, A. 1993. Agrobacterium helperplasmid for gene transfer to plants.Transgenic Research. 2: 203-289.
Kar, S., Johnson, T.M., Nayak, P., Sen, S.K.1996. Efficient transgenic plant regenerationthrough Agrobacterium mediatedtransformation of chickpea (Cicer arietinumL.). Plant Cell Reports. 16: 32-37.
Lawrence,P.K., Koundal, K.R. 2001Agrobacterium tumefaciens mediatedtransformation of pigeonpea (Cajanuscajan L. Millsp) and molecular analysis ofregenerated plants. Current Science. 80:1428-1432.
Murashige, T., Skoog, F. 1962. A revised mediumfor rapid growth and bioassays with tobaccocultures. Physiologia Plantarum. 15: 473-479.
Nayak, P., Basu, D., Das, S., Basu, A., Ghosh,D., Ramakrishan, N.A., Ghosh, M., Sen, S.K.1997. Transgenic elite indica rice plantexpressing cry1A(c) AC-endotoxin ofBacillus thuringiensis are resistant againstyellow stem borer (Seripophagaintertulou). In Proceedings of NationalAcademy of Science. 94: 2111-2116.
Nene, Y.L., Hall, S.D., Sheela, V.K. 1990. ThePigeonpea. CAB International,Cambridge, United Kingdom, pp.120-130.
Sambrook, J., Fritsch, E.F., Maniatis, T. 1989.Molecular Cloning A Laboratory Manual,Second Edition. Cold Spring, HarborLaboratory Press, pp.103-107
Singhal, V. 1999. Handbook of IndianAgriculture. Vikas Publishing HousePrivate Limited, New Delhi, p.10.
Shivaprakash, N., Pental, D., Sarin, N.B. 1994.Regeneration of pigeonpea (Cajanuscajan) from cotyledonary node via multipleshoot formation. Plant Cell Reports. 13:623-627.
Zhong, Z., Smith, H.G., Thomas, T.H. 1993. Invitro culture of petioles and intact leavesof sugarbeet ( Beta vulgaris) Plantgrowth Reg. 12: 59-66.
Zhang, C. L ., Chen, D.F., Elliot, M .C. andSlater, A. 2001, Thidiazuron –inducedorganogenis and somatic embryogenesis insugarbeet ( Beta vulgaris.L) In vitro cell.Dev. Boil-plant. 37: 305-310.
275
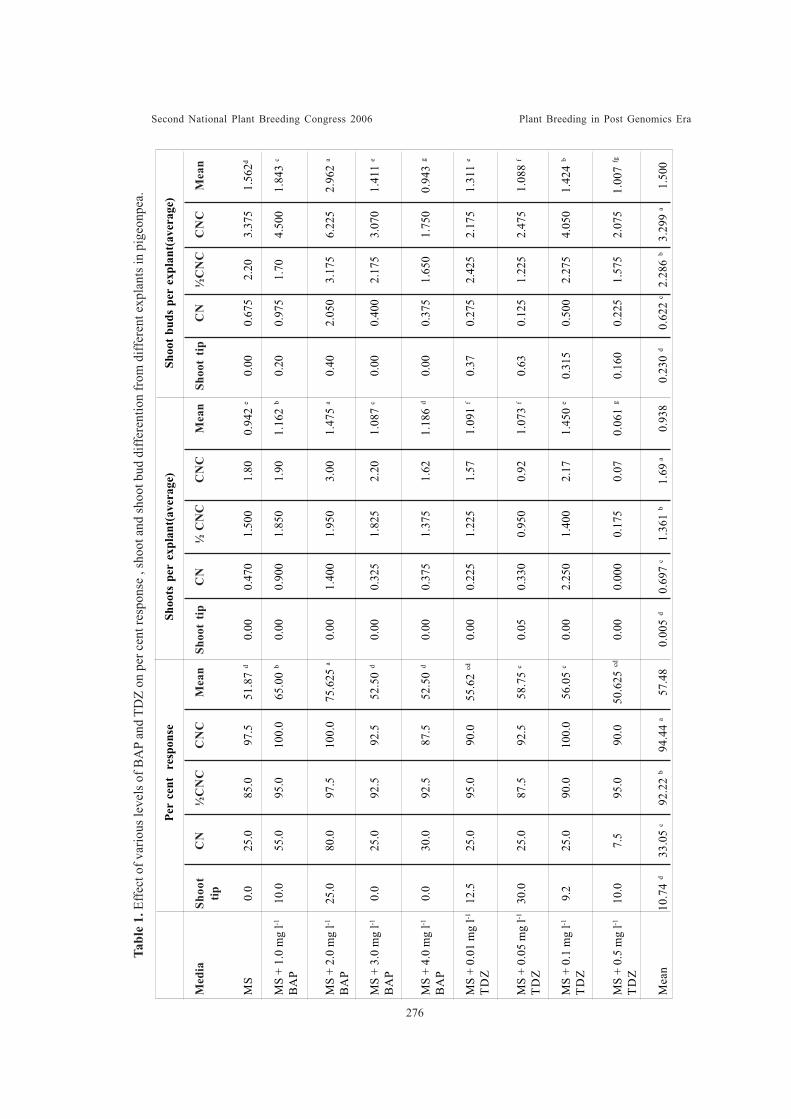
Second National Plant Breeding Congress 2006 Plant Breeding in Post Genomics Era
Med
iaSh
oot
CN
½C
NC
CN
CM
ean
Shoo
t tip
CN
½ C
NC
CN
CM
ean
Shoo
t tip
CN
½C
NC
CN
CM
ean
tip
MS
0.0
25.0
85.0
97.5
51.8
7 d
0.00
0.47
01.
500
1.80
0.94
2 e
0.00
0.67
52.
203.
375
1.56
2d
MS
+ 1.
0 m
g l-1
10.0
55.0
95.0
100.
065
.00
b0.
000.
900
1.85
01.
901.
162
b0.
200.
975
1.70
4.50
01.
843
c
BA
P
MS
+ 2.
0 m
g l-1
25.0
80.0
97.5
100.
075
.625
a0.
001.
400
1.95
03.
001.
475
a0.
402.
050
3.17
56.
225
2.96
2 a
BA
P
MS
+ 3.
0 m
g l-1
0.0
25.0
92.5
92.5
52.5
0 d
0.00
0.32
51.
825
2.20
1.08
7 c
0.00
0.40
02.
175
3.07
01.
411
e
BA
P
MS
+ 4.
0 m
g l-1
0.0
30.0
92.5
87.5
52.5
0 d
0.00
0.37
51.
375
1.62
1.18
6 d
0.00
0.37
51.
650
1.75
00.
943
g
BA
P
MS
+ 0.
01 m
g l-1
12.5
25.0
95.0
90.0
55.6
2 cd
0.00
0.22
51.
225
1.57
1.09
1 f
0.37
0.27
52.
425
2.17
51.
311
e
TD
Z
MS
+ 0.
05 m
g l-1
30.0
25.0
87.5
92.5
58.7
5 c
0.05
0.33
00.
950
0.92
1.07
3 f
0.63
0.12
51.
225
2.47
51.
088
f
TD
Z
MS
+ 0.
1 m
g l-1
9.2
25.0
90.0
100.
056
.05
c0.
002.
250
1.40
02.
171.
450
e0.
315
0.50
02.
275
4.05
01.
424
b
TD
Z
MS
+ 0.
5 m
g l-1
10.0
7.5
95.0
90.0
50.6
25 cd
0.00
0.00
00.
175
0.07
0.06
1 g
0.16
00.
225
1.57
52.
075
1.00
7 fg
TD
Z
Mea
n10
.74
d33
.05
c92
.22
b94
.44
a57
.48
0.00
5 d
0.69
7 c
1.36
1 b
1.69
a0.
938
0.23
0 d
0.62
2 c
2.28
6 b
3.29
9 a
1.50
0
Tabl
e 1.
Effe
ct o
f var
ious
leve
ls o
f BA
P an
d TD
Z on
per
cen
t res
pons
e , s
hoot
and
shoo
t bud
diff
eren
tion
from
diff
eren
t exp
lant
s in
pige
onpe
a.
Per
cent
res
pons
eSh
oots
per
exp
lant
(ave
rage
)Sh
oot b
uds
per
expl
ant(
aver
age)
276
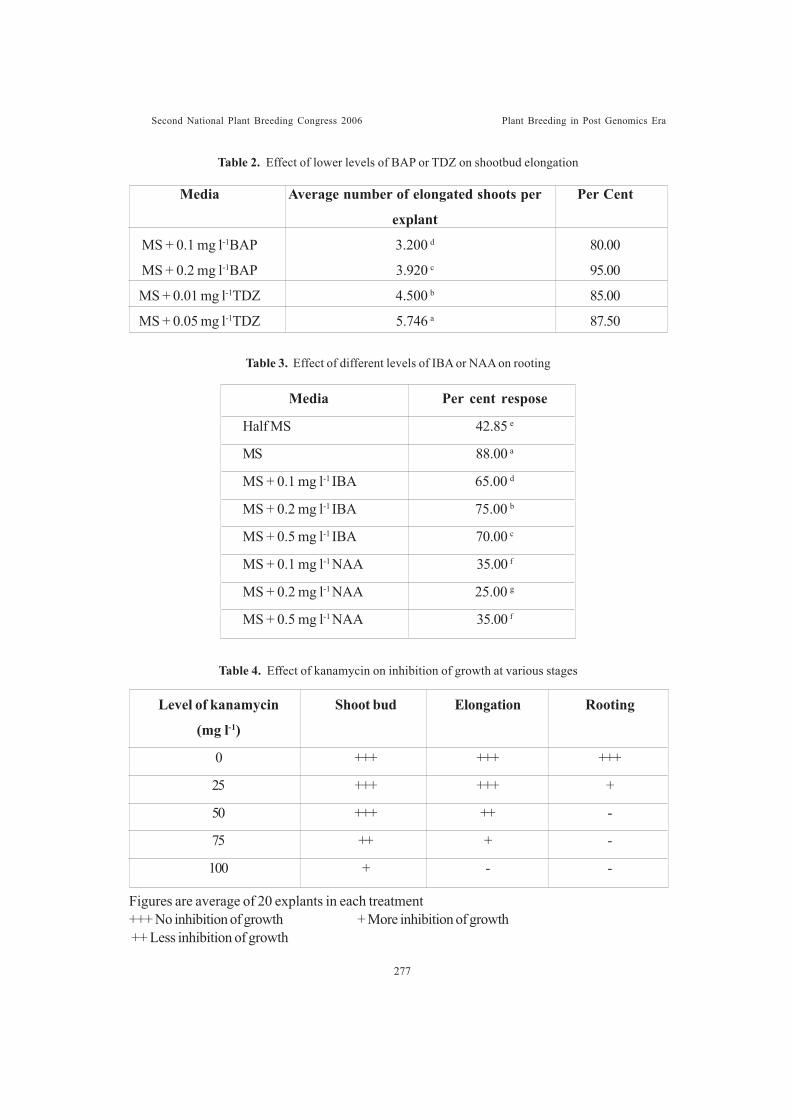
Second National Plant Breeding Congress 2006 Plant Breeding in Post Genomics Era
Table 2. Effect of lower levels of BAP or TDZ on shootbud elongation
Media Average number of elongated shoots per Per Cent
explant
MS + 0.1 mg l-1BAP 3.200 d 80.00
MS + 0.2 mg l-1BAP 3.920 c 95.00
MS + 0.01 mg l-1TDZ 4.500 b 85.00
MS + 0.05 mg l-1TDZ 5.746 a 87.50
Media Per cent respose
Half MS 42.85 e
MS 88.00 a
MS + 0.1 mg l-1 IBA 65.00 d
MS + 0.2 mg l-1 IBA 75.00 b
MS + 0.5 mg l-1 IBA 70.00 c
MS + 0.1 mg l-1 NAA 35.00 f
MS + 0.2 mg l-1 NAA 25.00 g
MS + 0.5 mg l-1 NAA 35.00 f
Table 3. Effect of different levels of IBA or NAA on rooting
Table 4. Effect of kanamycin on inhibition of growth at various stages
Figures are average of 20 explants in each treatment+++ No inhibition of growth + More inhibition of growth ++ Less inhibition of growth
Level of kanamycin Shoot bud Elongation Rooting
(mg l-1)
0 +++ +++ +++
25 +++ +++ +
50 +++ ++ -
75 ++ + -
100 + - -
277
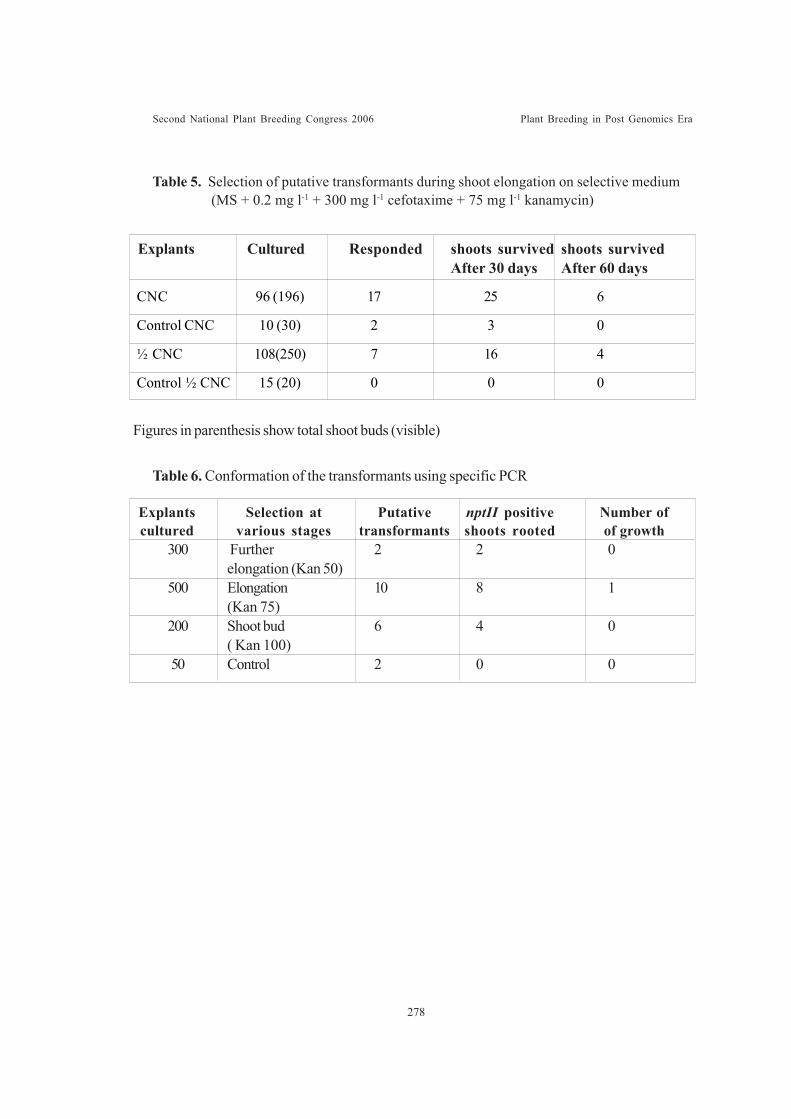
Second National Plant Breeding Congress 2006 Plant Breeding in Post Genomics Era
Table 5. Selection of putative transformants during shoot elongation on selective medium (MS + 0.2 mg l-1 + 300 mg l-1 cefotaxime + 75 mg l-1 kanamycin)
CNC 96 (196) 17 25 6
Control CNC 10 (30) 2 3 0
½ CNC 108(250) 7 16 4
Control ½ CNC 15 (20) 0 0 0
Explants Cultured Responded shoots survived shoots survivedAfter 30 days After 60 days
Figures in parenthesis show total shoot buds (visible)
Table 6. Conformation of the transformants using specific PCR
Explants Selection at Putative nptII positive Number ofcultured various stages transformants shoots rooted of growth
300 Further 2 2 0elongation (Kan 50)
500 Elongation 10 8 1(Kan 75)
200 Shoot bud 6 4 0( Kan 100)
50 Control 2 0 0
278
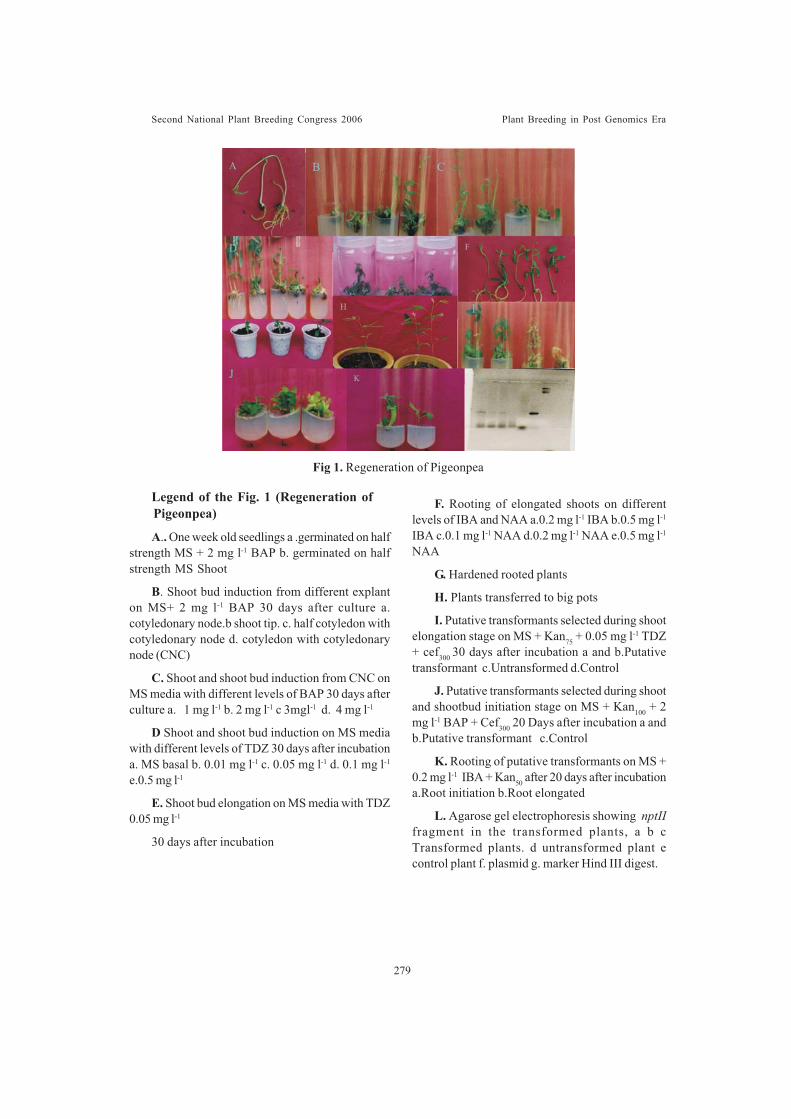
Second National Plant Breeding Congress 2006 Plant Breeding in Post Genomics Era
Legend of the Fig. 1 (Regeneration of Pigeonpea)
A.. One week old seedlings a .germinated on halfstrength MS + 2 mg l-1 BAP b. germinated on halfstrength MS Shoot
B. Shoot bud induction from different explanton MS+ 2 mg l-1 BAP 30 days after culture a.cotyledonary node.b shoot tip. c. half cotyledon withcotyledonary node d. cotyledon with cotyledonarynode (CNC)
C. Shoot and shoot bud induction from CNC onMS media with different levels of BAP 30 days afterculture a. 1 mg l-1 b. 2 mg l-1 c 3mgl-1 d. 4 mg l-1
D Shoot and shoot bud induction on MS mediawith different levels of TDZ 30 days after incubationa. MS basal b. 0.01 mg l-1 c. 0.05 mg l-1 d. 0.1 mg l-1
e.0.5 mg l-1
E. Shoot bud elongation on MS media with TDZ0.05 mg l-1
30 days after incubation
Fig 1. Regeneration of Pigeonpea
F. Rooting of elongated shoots on differentlevels of IBA and NAA a.0.2 mg l-1 IBA b.0.5 mg l-1
IBA c.0.1 mg l-1 NAA d.0.2 mg l-1 NAA e.0.5 mg l-1
NAA
G. Hardened rooted plants
H. Plants transferred to big pots
I. Putative transformants selected during shootelongation stage on MS + Kan75 + 0.05 mg l-1 TDZ+ cef300 30 days after incubation a and b.Putativetransformant c.Untransformed d.Control
J. Putative transformants selected during shootand shootbud initiation stage on MS + Kan100 + 2mg l-1 BAP + Cef300 20 Days after incubation a andb.Putative transformant c.Control
K. Rooting of putative transformants on MS +0.2 mg l-1 IBA + Kan50 after 20 days after incubationa.Root initiation b.Root elongated
L. Agarose gel electrophoresis showing nptIIfragment in the transformed plants, a b cTransformed plants. d untransformed plant econtrol plant f. plasmid g. marker Hind III digest.
279
Second National Plant Breeding Congress 2006 Plant Breeding in Post Genomics Era
DIRECT ORGANOGENESIS AND SOMATIC EMBRYOGENESIS INPIGEONPEA (CAJANUS CAJAN L. MILLSP.)
Josnamol Kurian, K Ramakrishnan, R Gnanam and A Manickam
ABSTRACT
Pigeonpea (Cajanus cajan L. Millsp.) is an important grain legume crop, and a goodsource of dietary protein in the tropics and subtropics. One of the major problems inpigeonpea cultivation is pod borer (Helicoverpa armigera) which causes extensive damageto the crop. Attempts to obtain pest-resistant genotypes of pigeonpea by conventionalbreeding methods have given limited success due to narrow genetic variation, and sexualincompatibility with wild relatives. The availability of a reliable in vitro regenerationprotocol is a pre-requisite for the application of most biotechnological techniques such asproduction of transgenic plants with suitable gene(s). Attempts were made to developprotocols through somatic embryogenesis and organogenesis pathways. In directorganogenesis approach, mature, aseptic seeds showed numerous green adventitious shootinitials from the swollen cotyledonary nodal region within 3 days of culturing. The presenceof seed coat, in both imbibed and non-imbibed seeds, drastically affected the differentiationof shoot-buds. Seedlings developed from imbibed or non-imbibed decoated seeds exhibitedstout seedlings but with stunted growth. Seedlings raised from non-imbibed seed, with seedcoat intact, failed to produce multiple shoot-initials; instead, differentiated clusters ofleafy structures appeared which suppressed further morphogenesis. However, imbibed seedwith intact seed coat differentiated to form maximal adventitious shoot buds in the cytokinin-supplemented medium. For callus induction, different combinations of hormones weretried with 2, 4-D (1.0, 1. 5, 2.0 mg/l), NAA (1.0, 1.5, 2.0 mg/l), TDZ (1.0, 1.5, 2.0 mg/l)etc. Application of 2, 4-D (2.0 mg/l) alone was found ideal. Suspension cultures of calliderived from10-day-old primary leaves of in vitro grown Cajanus cajan L. (var. Vamban 2)produced somatic embryos. The highest embryogenesis frequency was observed on MS+B5medium supplemented with 2, 4-D 2mg/l, casein hydrolysate 100mg/l and L-Glutamine50mg/l. Maximum somatic embryogenesis was observed when this callus was transferredto MS liquid medium supplemented with reduced amount of 2, 4-D (0.5mg/l). Studies onontogeny of somatic embryos showed that the cells determined to become somatic embryosdivided into spherical proembryos. Subsequent divisions in the proembryo led to globular,heart and torpedo-shaped somatic embryos.
Tamil Nadu Agricultural University, Coimbatore 641003
280
Second National Plant Breeding Congress 2006 Plant Breeding in Post Genomics Era
SOMATIC EMBRYOGENESIS AND PLANT REGENERATION FROMIMMATURE INFLORESCENCE AND LEAF EXPLANTS
OF SORGHUM CULTIVARSKumaravadivel, N1., M.Umadevi1 and Susan Eapen2
ABSTRACTSorghum is one of the important grain and fodder crops in many parts of the world. In
the present study, in vitro response of immature inflorescence and young leaf in sorghumgenotypes was evaluated. The basal medium used for callus induction and regenerationwas MS with different levels of auxins and cytokinins. Two types of calli were identifiedafter 15 days of inoculation. One was white, compact, embryogenic nodular callus andanother one was yellow, non-embryogenic unorganized callus. Out of the different levelsof 2,4 -D and kinetin used for callus induction, the combination of 2,4-D 2.0 mg/l andkinetin 0.5 mg/l was found to be suitable for callus induction. The callus induction frequencywas up to 80% for immature inflorescence and was up to 86% for young leaf explant whencultured in vitro. The percentage regeneration efficiency of embryogenic calli from Co 27was found to be greater (85%) than that of calli derived from other genotypes. Forregeneration, MS medium with NAA 0.1 mg/l, BAP 2.0 mg/l and casein hydrolysate levelsof 500 mg/l was found to be the best combination. The effect of various factors such asgrowth regulators, charcoal, iron, proline, nitrogen source, etc., were also studied. Theregenerated plants were transferred to green house condition.
1. Tamil Nadu Agricultural University, Coimbatore 641 0032. Bhabha Atomic research centre, Mumbai 400 085
Introduction
Sorghum ‘the great millet’ is an importantcrop, which has a special agronomic importancebecause of its multi product and diversified usageas food, feed and fuel. It is well adapted to awide range of soil types and environmentalconditions, especially drought. Usingconventional breeding techniques, much progresshas been made in developing superior cultivars(Smith and Bhaskaran, 1986). To supplementthese efforts, tissue culture in four sorghumcultivars (CO 25, CO 26, CO 27 and COS 28)including both grain and fodder sorghum has beeninitiated. High frequency plant regeneration fromcultured tissues is a pre-requisite for successfulapplication of in vitro culture for cropimprovement. In vitro derived plants will beuseful to generate somaclonal variation. Thedifferent hormonal combinations, the type ofexplants, effect of activated charcoal, proline andtype of genotypes are the critical factors thatinfluence the in vitro plant regeneration. Wen et
al. (1991) and Cai and Butler (1990) usedimmature inflorescence as explants. Youngshoot was used as explants for plantregeneration by Devi and Sticklen (2001). Thepresent investigation was therefore undertaken(i) to assess the comparative performance ofthe hormonal combination and levels, (ii) to findout the suitable explant size and age, (iii) to studythe effect of activated charcoal and prolineand (iv) to find out the genotype showingmaximum frequency of callus induction andregeneration.
Materials and MethodsSelection of expla]nts and surfacesterilization
Immature inflorescence and young leaf ofsorghum genotypes Co.25, Co 26, Co 27 andCoS 28 were used for callus induction andregeneration. The explants were collected from60 – 70 day old plants. After all the outer leaveswere removed, the explants were surfacesterilized with 0.1% (v/v) HgCl2 for 2-3 min
281
Second National Plant Breeding Congress 2006 Plant Breeding in Post Genomics Era
and then rinsed thrice with sterile double distilledwater. The surface sterilization steps were doneaseptically.
Experiments conducted
Effect of hormonal levels, explants andgenotypes
Five different hormonal combinations wereused for callus induction and three differenthormonal combinations were tried for plantregeneration. Different expants (young leaf andimmature inflorescence) of genotypes viz., Co25, Co 26, Co 27 and CoS 28 were cultured forcallus induction on Murashige and Skoog (1962)medium and incubated in darkness at 26oC forcallus induction. They were subcultured everytwo weeks and maintained at 26oC for callusinduction. For initiation of callus, the explantswere cultured on MS medium with 2,4-D (1.0,2.0, 2.5, 3.0 and 4.0 mg/l) and kinetin (1.0 mg/l).For regeneration of plants, the MS medium wassupplemented with a combination of 6-benzylaminopurine (1.5, 2.0 and 2.5 mg/l) + 0.01mg/l NAA and incubated in the light under a 16h photoperiod under white fluorescent light.
Effect of activated charcoal and Fe –EDTA
Activated charcoal is a well knownabsorption agent. The positive effect of activatedcharcoal includes: 1. absorbing phytotoxinsreleased by the tissue in culture (Brettell et al.,1980) and 2. absorbing inhibitory substances inthe media and 3. absorbing gases such asethylene that is present in cultures. Sorghumsomaclones generally have a low establishmentrate due to their underdeveloped root systems.Considering these effects, media have beendeveloped for routine use with the incorporationof activated charcoal. Immature inflorescencewas cultured on MS medium supplemented with2 mg/l 2,4-D, 1 mg/l kin with differentconcentrations of activated charcoal (0.0, 0.1,0.2, 0.3, 0.4 and 0.5 g/l) and double the doses ofFe-EDTA.
Effect of proline and nitrogen source
The development of tissue culture protocolsfor embryogenic callus induction and plantregeneration is imperative for successfulapplication of tissue culture technology for cropimprovement. In the present study, we haveinvestigated the influence of proline on plantregeneration from immature inflorescence oftwo different genotypes of sorghum namely Co26 and Co 27. The various levels of praline (1g,2g and 3g/l) were tried to find out the optimumconcentration for callus induction andregeneration.
Immature inflorescence was cultured onMS (four different levels) and ratios of NH4
+
(370, 1130 mg/l) and NO-3 (2500, 4500 mg/l),ions with without organic nitrogen (proline 2 mg/l). The differences in NH4
+ and NO3-
concentrations were obtained by changing theconc. of KNO3 and NH4NO3 in the basal MSmedium.
Result and Discussion
Callus induction
The immature inflorescence and young leafsegments showed a general expansion followedby appearance of visible callus within 10-15 daysof culture (Table 1). In all sorghum genotypes,callus induction was found to be high with youngleaf in all treatments. Nature of the embryogeniccalli is highly dependent on explant age, sizeand medium composition. The immatureinflorescence was collected from plants beforethe emergence of the inflorescence at the bootleaf stage. The immature inflorescence wasdissected and those less than 2 cm long wereselected and cut into 3-5 mm, 5-10 mm and 10-15 mm segments. Embryogenic callus formedafter 25-40 days of culture. The callus inductionwas very much dependent on age of immatureinflorescence. The callus was creamy white andcompact in the initial stage and became verynodular in later stage.
282
Second National Plant Breeding Congress 2006 Plant Breeding in Post Genomics Era
When the length of the inflorescence rangedfrom 3-5 mm, callusing was extremely poor(Table 1). When inflorescence length variedbetween 5-10 mm, maximum callus wasobtained. Inflorescence of 10-15 mm producednon-embryogenic, friable callus from the cut endof rachis. Somatic embryogenis was strictlydependent on the age of the inflorescence andembryos were induced only when inflorescencelength ranged from 5-10 mm. No somaticembryogenesis was observed when infloresce-nce was younger or older (Brettel et al., 1980).
Regeneration
The experiments conducted to study thehormonal levels on regeneration are presentedin Table 3. MS medium with NAA (0.1 mg/l),BAP (2.0 mg/l) and casein hydrolysate (500mg/l) showed the highest per cent of shootregeneration. In the medium supplemented withBAP, embryoids turned green and produced ahuge clump of shoots and roots. The highestfrequency of regeneration was obtained fromCo 27 immature inflorescence (86%) than theother genotypes. The rooted plantlets grewsatisfactorily in soil in paper cups and also inglass house condition. Forty out of 83transplanted plants were transferred to fieldcondition and regenerants were successfullyestablished.
Table 2. Influence of inflorescence length on callusinduction, somatic embryogenesis andplant regeneration in sorghum
3-5 - 0 0
5-10 *** 15-20 5
10-15 ** 5 0
Averagenumber of
plants/culture
No. ofculturesshowingsomaticembryog-enesis
Intensityof
callusing
Length ofthe
inflorescence(mm)
*** Excellent callus initiation** Moderate callus initiation - No callus initiation
Table 1. Effect of various levels of 2,4-D and kin (0.5 mg/l) on callus induction (%)
L – Young leafI – Immature inflorescence
Effect of charcoal and Fe-EDTA
Immature inflorescence of sorghumvarieties viz., CO 26, CO 27 were used as thesource material. The explant showed signs ofcallusing after 15 days after incubation on MSmedium supplemented with 2,4-D 2.0 mg/l and
Co 25 RGM 1 67Co 26 RGM 1 75
Co 27 RGM 2 83Co 25 RGM 2 70
Immature inflorescenceCo 25 RGM 1 67Co 26 RGM 2 60Co 27 RGM 2 85Co 28 RGM 1 75
Young leaf callus
ExplantsRegene-
rationmedium
% ofregene-ration
Growthresponse
Green plantletswere noticed
after 20 – 25 aysGreen plants
were observedalong with
rooting
Complete plantswere derivedfrom compact
calli
Table 3. Response of calli for regeneration in various combination of media
L 20 45 65 30 40
I 10 39 72 15 43
L 50 70 50 48 40
I 50 76 70 50 50
L 60 86 71 25 12
I 68 80 73 60 47
L 15 40 20 35 13
I 20 35 35 40 10
2,4-D (mg/l)Genotypes Explant
1.0 2.0 2.5 3.0 4.0
CO 25
CO 26
CO 27
CO 28
283
Second National Plant Breeding Congress 2006 Plant Breeding in Post Genomics Era
kinetin 1.0 mg/l. The addition of activatedcharcoal to the callus induction mediumincreased the percentage of callus in twogenotypes. The per cent of callus was maximumat 0.4 g/l activated charcoal and double dose ofFe-EDTA in CO 26 inflorescence explant (Table4). Regeneration was achieved by incubating callion MS medium with 0.1 mg/l NAA, 2 mg/l BAPwith 0.4 g/l activated charcoal. The maximumregeneration (80%) was observed both thegenotypes of immature inflorescence calli.
Influence of nitrogen sources on callusinduction
We found that addition of amino acidsto basal MS medium was more effective thanincreasing the concentration of inorganic nitrogenfor embryogenic callus induction (Table 5).Compared with MS, the medium with double theconcentration of NO3
- (4500 mg/l), treble theconcentration of NH4
+ (1130 mg/l) and theaddition of organic nitrogen (proline 2 g/l) wasmore effective in stimulating embryogenic calligrowth. The increase in concentration of NH4
+
(or) NO3- in the media supplemented with organic
nitrogen was also less effective. This shows thatboth sources of inorganic nitrogen and optimalNH4
+ : NO3- ratio are important. The necessity
of an optimal NH4+ : NO3
- ratio for the inductionand growth of embryogenic calli has also beenshown in the tissue culture of other plant species(Mordhorst and Cortz, 1993).
The above study clearly indicated the scopeof in vitro culture in sorghum towards successfulregeneration of plants and establishment in the
Geno-Explant 0.1 0.2 0.3 0.4 0.5 Single Doubletypes dose dose
Co 26 Immature 50 72 80 88 66 48 86inflorescence
Co 27 inflorescence 60 80 83 80 60 50 85
Activated charcoal (g/l) Fe-EDTA
field. The effect of various factors viz.,genotype, explant and tannin exudation shouldbe taken utmost care. In vitro culture studieswill enable the generation of somaclones, basicgenetic studies, in vitro selection and in vitromutagenesis. In vitro studies enhance geneticdiversity and helps in the development oftransgenic plants.
REFERENCES
Brettell, R.I.S., Wernicke, W. and Thomas, E.1980. Embryogenesis from culturedimmature inflorescence of Sorghumbicolor. Protoplasma. 104: 141-148.
Cai,T., and Butler, L. 1990. Plant regenerationfrom embryogenic callus initiated fromimmature inflorescence of several hightannin sorghums. Plant Cell Tissue OrganCulture. 20: 101-110.
Devi, P.B. and Sticklen, M.B. 2001. Culturingshoot tip clumps of Sorghum bicolor andoptimal microprojectile bombardmentparameters for transient expression. J.Cytol. Genet. 2: 89-96.
Mordhorst, A.P. and Cortz, H. 1993.Embryogenesis and development ofisolated barley microspore are influencedby the amount and composition of nitrogensources in culture media. Journal of PlantPhysiology. 142: 485-492.
Murashige, T. and Skoog, F. 1962. A revisedmedium for rapid growth and bioassayswith tissue cultures. Physiol. Plant. 15:473-497.
MS 1 370 2500 1 25.02
MS 2 370 2500 1 29.42
MS 3 1130 4500 2 45.42
MS 4 1130 4500 2 51,58
Medium NH4+ NO3
- Organic C a l l u s(mg/l) (mg/l) nitrogen induction
g/l (%)(Proline)
Table 4. Effect of activated charcoal and Fe-EDTAon callus induction (%)
Table 5. Influence / Effect of nitrogen sources on callus induction (%)
284
Second National Plant Breeding Congress 2006 Plant Breeding in Post Genomics Era
Smith, R.H. and Bhaskaran, S. 1986. Sorghum(Sorghum bicolor K. Moench). In:Biotechnology in agriculture and forestry.(ed.) Y.P.S.Bajaj (Berlin: Springer Verlag),Vol.2, pp.220-233.
Wen, F.S., Sorensen, E.L., Barnett, F. and Liang,G.H. 1991. Callus induction and plantregeneration from anther and inflorescenceculture of sorghum. Euphytic. 52: 177-181.
285
Second National Plant Breeding Congress 2006 Plant Breeding in Post Genomics Era
ENGINEERING SHEATH ROT RESISTANCE IN RICERajesh,T., K. Kalpana, S. Maruthasalam, K. Poovannan, R. Samiyappan, D. Sudhakar and P.
Balasubramanian
ABSTRACT
The study was aimed at engineering resistance against sheath rot (ShR) caused bySarocladium oryzae Gams and Hawksworth in a local elite indica rice cultivar, ASD16,using a rice chitinase (chi11) gene. Transgenic rice lines were generated usingAgrobacterium-mediated transformation. In T2 generation, three homozygous lines viz.,KL-ASD16-4-1-1, KL-ASD16-5-2-1 and KL-ASD16-6-1-1 expressing chitinase wereidentified through western blotting analysis. These homozygous lines were evaluated forShR resistance in T2 generation. A small lesion surrounding the brown border was observedafter three days of inoculation (D AI) in non-transgenic ASD16 control plants. Theselesions slowly spread and developed into characteristic large size oblong greyish lesionswithin 12 D AI. In the above three lines, no such lesions formed on the third day and smallbrownish lesions started appearing only on six DAI. These brownish lesions enlarged insize and irregular extensive browning was observed within 12 D AI. A sudden and extensivebrowning was noticed only in transgenic plants whereas the characteristic oblong greyishlesions were produced in non-transgenic control plants without brownish lesions. Thesignificant reduction of per cent sheath infection was observed in three homozygous lines(2.48, 2.71 and 2.95) over non-transgenic control (18.56). Among the three homozygousASD16 lines tested, KL-ASD16-4-1-1 performed better and gave an enhanced protectionagainst ShR than the other two lines. The present study suggested that these lines could beutilized as a resistance source against ShR pathogen in rice breeding programmes.
Tamil Nadu Agricultural University, Coimbatore - 641 003
286

Second National Plant Breeding Congress 2006 Plant Breeding in Post Genomics Era
Second National Plant Breeding Congress 2006 Plant Breeding in Post Genomics Era
TECHNICAL SESSION VI
CONTRIBUTIONS OF GENOMIC TOOLS IN CROPIMPROVEMENT
Second National Plant Breeding Congress 2006 Plant Breeding in Post Genomics Era
MOLECULAR BREEDING FOR BROWN PLANTHOPPER (BPH) ANDBLAST RESISTANCE IN RICE
Kshirod K. Jena and David J. Mackill
ABSTRACTThe last three decades of the twentieth century have made significant progress in
developing semi dwarf, high yielding rice cultivars and have achieved food security inmany countries of Asia. However, brown planthopper (BPH) and blast (Bl) disease of riceare a continuous threat to rice production due to changes in biotypes of BPH and pathotypesof Bl. The plant breeders of the 21st century have to combine modern tools of biotechnologywith conventional plant breeding tools to identify novel genes that can express broadspectrum of resistance to BPH and Bl. We have identified new sources of BPH resistancein the breeding line, IR65482-7-216-1-2 and Bl resistance in the breeding line, IR65482-4-136-2-2 using the Korean biotype of BPH and pathotypes of Bl. The new BPH resistancegene, Bph18(t) has been tagged to STS marker through e-landing and high-resolutionmapping approach using Nipponbare genome sequence information and BPH bioassay. Amajor blast resistance gene, Pizau(t) has been identified using e-landing and high-resolutionmapping and bio-informatics tools. We have developed advanced breeding lines usingmarker-assisted backcross (MAB) breeding. The breeding lines possessing resistance toBPH and Bl combining high yielding and superior grain quality traits would be valuablebreeding materials for rice improvement.
International Rice Research Institute, Los Banos,4031 Laguna, Philippines
287
Second National Plant Breeding Congress 2006 Plant Breeding in Post Genomics Era
QUANTITATIVE TRAIT LOCI, DNA MARKERS AND CANDIDATE GENES- WHAT DO WE DO WITH THESE?
Shashidhar, H.E.
ABSTRACT
QTL mapping has been a very popular activity among molecular biologists. Hundredsof papers deal with this subject across crops and traits. There are innumerable quantitativetrait loci (QTLs) reported for different traits on different chromosomes. Hundreds ofmolecular maps are being developed in certain crops and thousands of markers beingdiscovered or added. Several of simple sequence repeats, expressed sequence tags andcandidate genes are being added to the databases. This is mind boggling to a breeder whois committed to improve the traits he handles. The magnitude of situation is explored andanalysed to propose a way out to maximize utility of all these new tools in biology andpractical plant breeding.
University of Agricultural Science, GKVK Campus, Bangalore - 560 065
288
Second National Plant Breeding Congress 2006 Plant Breeding in Post Genomics Era
MICROSATELLITE AND ISOZYME BASED GENETIC DIVERSITYMEASURES FOR DECIDING PRODUCTIVE CROSS COMBINATIONS
IN SUGARCANE IMPROVEMENTHemaprabha, G1., U.S. Natarajan1, N. Balasundaram1 and N.K.Singh2
ABSTRACT
Genetic diversity in sugarcane parental clones used directly in varietal improvementprogrammes was estimated based on microsatellites and isozyme markers. Forty nine parentswere analysed for three isozyme systems viz. esterase, peroxidase and diaphorase, while 24parents were analysed with 39 GenBank derived sugarcane specific sequence taggedmicrosatellite site (STMS) primers. Similarity indices estimated using STMS primers werelower than those estimated using isozymes. A higher proportion of combinations showedsimilarity index values between 0.60 to 0.70, revealing the existence of moderate geneticdiversity among the parents and explained the continuous success of varietal evolution inIndia utilizing the available variability.
Cross performance quantified in terms of selection percent of progenies derived from14 crosses involving 16 parents taken for isozyme analysis and 16 crosses involving 18parents taken for STMS analysis was estimated based on three economically importanttraits in the first clonal stage. Selection percent was correlated with genetic similarityestimates of the parents. Observation of significant negative correlation (-0.6221 basedon isozymes and -0.6033 based on STMS markers) demonstrated the usefulness of molecularmarker based selection of parental combinations for deriving more number of elite types.Similarity indices could be more appropriately used to prevent close breeding by eliminatinggenetically close parental combinations. STMS primers detected more amount ofpolymorphism to aid in sugarcane breeding and generated clear fingerprints for varietaldistinction to serve as ideal markers for analysing the complex genome of sugarcane.
1.Sugarcane Breeding Institute, Coimbatore - 641 0072. National Research Centre on Plant Biotechnology, IARI, New Delhi
289
Second National Plant Breeding Congress 2006 Plant Breeding in Post Genomics Era
SEQUENCE CHARACTERIZED AMPLIFIED REGION (SCAR) MARKERFOR THE IDENTIFICATION OF CYTOPLASMIC GENIC-MALE
STERILE (CGMS) LINES IN PIGEONPEA ( CAJANUS CAJAN (L.)MILLSP.)
Souframanien,J1., A. Joshi Saha, J.G. Manjaya and T. Gopalakrishna
ABSTRACTTo achieve breakthrough in pigeonpea productivity, heterosis is being exploited using
the male sterility system based on cytoplasmic nuclear interactions. Production of hybridsusing a cytoplasmic male sterility (CMS) system involves the use of a male sterile line (Aline), a maintainer line (B line) and a restorer line (R line). However, maintaining thepurity of the parental lines is a major problem in hybrid seed production. DNA basedmarkers have obvious advantages in maintaining genetic purity and identification process.In the present study a sequence characterized amplified region (SCAR) marker was developedfor the identification of two A lines 288A and 67A derived from crosses between wildspecies C. scarabaeoides and C. sericeus respectively. A random amplified polymorphicDNA (RAPD) marker OPC11600 unique to A line was identified, cloned and sequenced toconvert it into a SCAR marker. The SCAR primers designed amplified a 400 bp ampliconfrom the male sterile lines and not from the B and R lines studied. This SCAR marker canalso be used as a marker for the diversification of the CMS genetic background in pigeonpea
hybrid breeding programme.
Introduction
Pigeonpea (Cajanus cajan (L.) Millsp.) isone of the important grain legume crops in thetropics and subtropics. It ranks second amongstthe grain legumes in India. In order to break theyield plateau and to incorporate resistance tobiotic stresses, approaches like heterosisbreeding and distant hybridization wereattempted (Reddy and Faris, 1981). Productionof pigeonpea hybrids using genetic male sterileline poses the problem of rouging fertile plantsfrom the female parent plots. Cytoplasmic malesterile (CMS) lines and availability of restorerswould effectively circumvent these constraintsand make a major impact on commercial hybridseed production. Stable CMS lines have beenreported in pigeonpea. These are (i) A1cytoplasm, derived from C. sericeus(Ariyanayagam et al., 1993); (ii) A2 cytoplasmderived from C. scarabaeoides (Tikka et al.,
1. Nuclear Agriculture & Biotechnology Division,Bhabha Atomic Research Centre, Trombay, Mumbai 400085, India. email: [email protected]
1997; Saxena and Kumar, 2003); (iii) A3cytoplasm derived from C. volubilis (Wanjariet al., 2001) and (iv) A4 cytoplasm, derived fromC. cajanifolius (Saxena et al., 2005).
Cytoplasmic male-sterility (CMS) is amaternally inherited trait with plants remainingfertile but with no viable pollen formation. Thisresults from incompatible nuclear mitochondrialinteraction due to rearrangements in themitochondrial genome (Lonsdale,1987).Genetic and molecular methods have been usedto study the differences in the organization andexpression of the mitochondrial genes in thefertile / sterile phenotypes. Restriction fragmentlength polymorphism (RFLP) of themitochondrial DNA (mt DNA) has been usedas an efficient tool to look at rearrangementsin the mt DNA of male sterile plants of manycrop species (Boeshore et al., 1983). Akagi etal. (1995) showed that the unique sequence
290
Second National Plant Breeding Congress 2006 Plant Breeding in Post Genomics Era
downstream from the mitochondrial atp6 genewas specifically amplified in the sterile cybridplants by PCR in rice. In maize a single seed,multiplex PCR protocol was utilized todifferentiate three types of CMS (CMS-T, C,and S) and normal cytoplasm using primerscorresponding to chimeric regions ofmitochondrial DNA sequences (Liu et al., 2002).The RFLP and RAPD (Random Amplifiedpolymorphic DNA) analyses have been used toarrive at the phylogenetic relationships amongthe cultivated and wild species of pigeonpea(Nadimpalli et al., 1993; Ratnaparkhe et al,1995). Souframanien et al. (2003) reported theability of RAPD markers to differentiate malesterile lines derived from C. scarabaeoides andC. sericeus. Further, the amplification productof 600bp amplified by primer OPC-11 wasobserved in both the cytoplasmic male sterilelines (288A and 67A), which was absent in themaintainer and restorer lines studied. In thepresent study, a sequence characterizedamplification region (SCAR) marker wasdeveloped from RAPD marker OPC-11600 andwas utilized to study the differences betweenthe male sterile and fertile lines of pigeonpea.
Materials and methodsPlant materials and DNA extraction
The pigeonpea CMS lines 288 A, 67 A, 290A, 100 A and their respective maintainer (B) lineswere obtained from Dr. Tikka, GujaratAgricultural University, Gujarat India and Dr.K.B. Wanjari, Dr. PDKV, Akola India. TTR1and TTR2 are the putative restorer linesmaintained at NABTD, BARC, Mumbai. DNAwas extracted from seeds using the methoddescribed by Dellaporta et al. (1983) with littlemodifications. Pigeonpea seeds were soakedovernight at room temperature in distilled water.Two seeds were crushed using a metal rod inthe 500 mll extraction buffer (Tris-Hcl 100 mM,EDTA 50 mM and NaCl 500 mM). To the slurry,100 ml of 20 % SDS was added and was
incubated at 650 C for 15 min. Chilled 5 Mpotassium acetate (500 ml) was added. Thecontents of the tube were mixed by tapping andincubated on ice for 20 min. After centrifugationat 10,000 rpm for 20 min, the supernatant wastransferred to another sterile eppendorf tube.The nucleic acids were precipitated by addingequal volume of isopropanol and ammoniumacetate (2.5 M) and centrifuged at 40 C for 20min at 12,000 rpm. The pellet was washed with70 % ethanol, air dried and dissolved in TEbuffer. DNA concentration was determined ina Hoefer DNA Fluorometer using Hoechst dyeand the DNA samples were diluted to 25 ng�l-1 for PCR amplification.
Isolation, purification and reamplificationof RAPD fragments
The selected A-line specific bands from288A and 67A were excised from the agarosegel and transferred to a 1.5 ml microcentrifugetube containing 50 ml TE buffer. The tube wasincubated at 650 C for 10 min. The PCR productwas purified using Geneispin gel extraction kit(Bangalore Genei Pvt. Ltd. Bangalore, India.)following instructions given in the manual.Reamplification was carried out using 2 ml ofthe purified product as template in a 25 mlreaction volume containing 10 mM Tris-HCl(pH 8.3), 50 mM KCl, 2.5 mM MgCl2, 0.01%gelatin, 0.2 mM each of dNTP, 20 pmoles ofRAPD primer (Operon Technologies Inc.,Almeda, CA, USA.) and 0.5 units of Taq DNApolymerase (Bangalore Genei Pvt. Ltd.Bangalore, India). Amplifications wereperformed in an Eppendorf Master cyclergradient (Eppendorf Netheler-Hinz GMBH,Hamburg, Germany). Amplification conditionswere an initial denaturation at 940 C for 4 minand 45 cycles at 940 C for 1 min, 370 C for1min, 720 C for 2 min followed by 5 min at 720
C. Amplified products were separated on 1.5% agarose gel in 1X TBE buffer (100 mM Tris-HCl, pH 8.3, 83 mM boric acid, 1mM EDTA)
291
Second National Plant Breeding Congress 2006 Plant Breeding in Post Genomics Era
at 75 V. The gels were stained with 0.5 �g/mlethidium bromide solution and viewed under UVlight. The size of the amplification products wasdetermined in comparison to EcoR I and HindIII digested Lambda DNA.
Cloning and sequencing of the RAPDproducts
The PCR products were cloned into a bluntended, dephosphorylated pUC 18 Sma I / BAPusing SureClone ligation kit (Pharmacia Biotech,USA), following the manufacturers instructions.The cloned DNA samples were sequencedbidirectionally in an automated DNA sequencer(Applied Biosystems) using T7 and SP6 promoterspecific primers (Bangalore Genei Pvt. Ltd.,Bangalore, India). The DNA sequences wereused to search GenBank using BLAST analysis(http://www.ncbi.nlm.nih.gov/blast). SCARprimers were designed using the Primer 3software (Rozen and Skaletsky 2000) using thefollowing criteria: Length of 16-25 nucleotideswith GC content of about 40%. The Tm of theprimers should be between 450 C and 650 C. Thesequence of the SCAR primers were as follows:PMS2F 5’- CATAGCCTTCTTCGCGGTAG-3’and PMS2R 5’-GATCGTTGGTGAGGACCATT-3’.
SCAR amplification
DNA sample extracted from male sterile andfertile lines were amplified essentially asdescribed for the RAPD amplification exceptthat 5 ìM of SCAR primer pair was used. Thethermocycler was programmed for an initialdenaturation step of 940 C for 4 min followed by35 cycles of 940 C for 30 sec, 640 C for 1 min,720 C for 1 min and a final extension step at 720
C for 7 min. The amplified products wereanalyzed as described earlier.
Multiplex PCR
For amplifying the rDNA internal transcribedspacers (ITS) region primers were designed from
the conserved sequences of mungbean(Schiebel and Hemleben 1989). The primersequences were as follows: ITS1F (5’-AAGTCGTAACAAGGTTTCCGTAG-3’)and ITS2R (5’-GTTAGTTTCTTTTCCTCC-3’). The primers were synthesized by Boardof Radiation and Isotope Technology (BRIT),Mumbai, India. Multiplex PCR reactions wereset up using ITS1F and ITS2R (to amplify theentire ITS region) along with SCAR primers.Amplification condition was same as for SCARamplification as described earlier.
Results and discussion
In our earlier study RAPD markerOPC11600 was found to be unique to both CMSlines 288A and 67A. This marker was absentin the respective maintainer (B) lines andrestorer (R) lines studied (Souframanien et al.2003). These markers were cloned andsequenced to convert it to sequencecharacterized amplified region (SCAR) marker.A set of forward and reverse primers (PMS2Fand PMS2R) were designed based on theinternal sequence of RAPD marker(OPC11600) derived from 67 A. This primerpair amplified a fragment of 400 bp which wasfound to be polymorphic between all the A andB lines used in the present study (Fig. 1).
RAPD markers need to be converted intosimple SCAR markers for large-scaleapplication in marker assisted breeding. RAPDis known to be more sensitive to reactionconditions (e.g., template quality, rampingspeed, type of instrument used) than standardPCR performed with two longer specificprimers. For this reason it is advisable toconvert RAPD markers into SCAR markersfor reliability and reproducibility. This involvesthe characterization of the linked RAPD markerand the design of locus specific primers (Paranand Michelmore, 1993). SCARs have severaladvantages over RAPDs like highreproducibility resulting from longer primer,
292
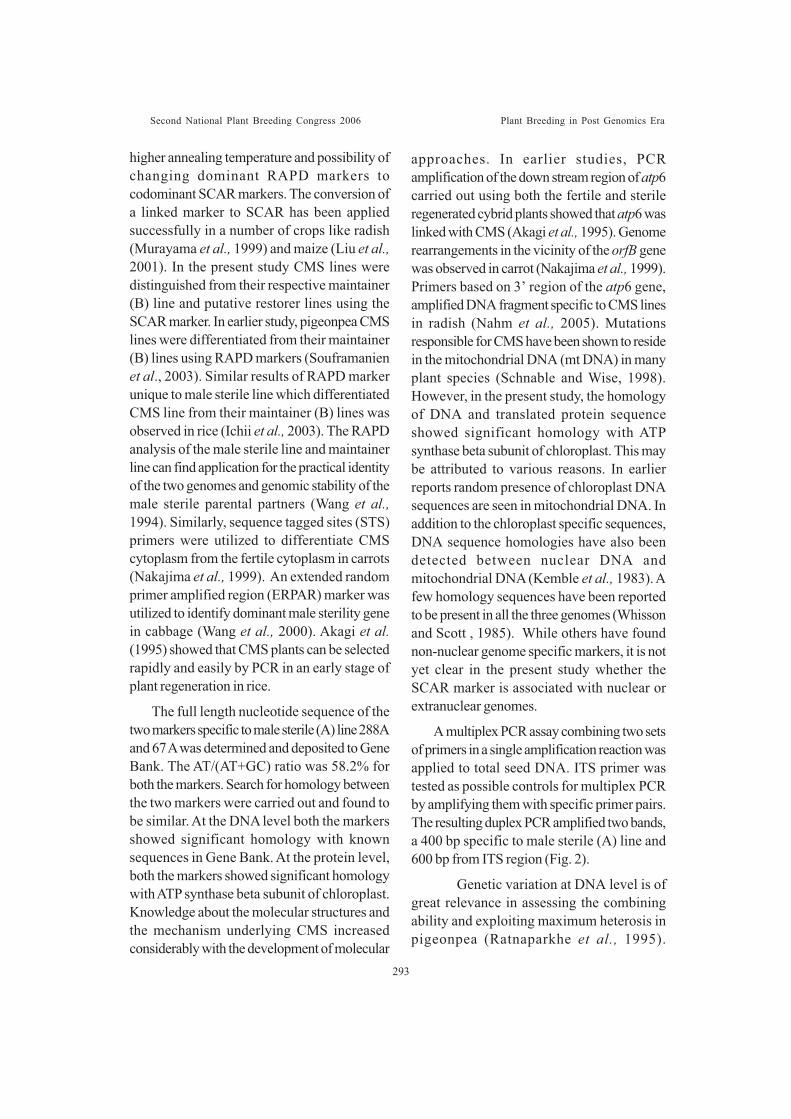
Second National Plant Breeding Congress 2006 Plant Breeding in Post Genomics Era
higher annealing temperature and possibility ofchanging dominant RAPD markers tocodominant SCAR markers. The conversion ofa linked marker to SCAR has been appliedsuccessfully in a number of crops like radish(Murayama et al., 1999) and maize (Liu et al.,2001). In the present study CMS lines weredistinguished from their respective maintainer(B) line and putative restorer lines using theSCAR marker. In earlier study, pigeonpea CMSlines were differentiated from their maintainer(B) lines using RAPD markers (Souframanienet al., 2003). Similar results of RAPD markerunique to male sterile line which differentiatedCMS line from their maintainer (B) lines wasobserved in rice (Ichii et al., 2003). The RAPDanalysis of the male sterile line and maintainerline can find application for the practical identityof the two genomes and genomic stability of themale sterile parental partners (Wang et al.,1994). Similarly, sequence tagged sites (STS)primers were utilized to differentiate CMScytoplasm from the fertile cytoplasm in carrots(Nakajima et al., 1999). An extended randomprimer amplified region (ERPAR) marker wasutilized to identify dominant male sterility genein cabbage (Wang et al., 2000). Akagi et al.(1995) showed that CMS plants can be selectedrapidly and easily by PCR in an early stage ofplant regeneration in rice.
The full length nucleotide sequence of thetwo markers specific to male sterile (A) line 288Aand 67 A was determined and deposited to GeneBank. The AT/(AT+GC) ratio was 58.2% forboth the markers. Search for homology betweenthe two markers were carried out and found tobe similar. At the DNA level both the markersshowed significant homology with knownsequences in Gene Bank. At the protein level,both the markers showed significant homologywith ATP synthase beta subunit of chloroplast.Knowledge about the molecular structures andthe mechanism underlying CMS increasedconsiderably with the development of molecular
approaches. In earlier studies, PCRamplification of the down stream region of atp6carried out using both the fertile and sterileregenerated cybrid plants showed that atp6 waslinked with CMS (Akagi et al., 1995). Genomerearrangements in the vicinity of the orfB genewas observed in carrot (Nakajima et al., 1999).Primers based on 3’ region of the atp6 gene,amplified DNA fragment specific to CMS linesin radish (Nahm et al., 2005). Mutationsresponsible for CMS have been shown to residein the mitochondrial DNA (mt DNA) in manyplant species (Schnable and Wise, 1998).However, in the present study, the homologyof DNA and translated protein sequenceshowed significant homology with ATPsynthase beta subunit of chloroplast. This maybe attributed to various reasons. In earlierreports random presence of chloroplast DNAsequences are seen in mitochondrial DNA. Inaddition to the chloroplast specific sequences,DNA sequence homologies have also beendetected between nuclear DNA andmitochondrial DNA (Kemble et al., 1983). Afew homology sequences have been reportedto be present in all the three genomes (Whissonand Scott , 1985). While others have foundnon-nuclear genome specific markers, it is notyet clear in the present study whether theSCAR marker is associated with nuclear orextranuclear genomes.
A multiplex PCR assay combining two setsof primers in a single amplification reaction wasapplied to total seed DNA. ITS primer wastested as possible controls for multiplex PCRby amplifying them with specific primer pairs.The resulting duplex PCR amplified two bands,a 400 bp specific to male sterile (A) line and600 bp from ITS region (Fig. 2).
Genetic variation at DNA level is ofgreat relevance in assessing the combiningability and exploiting maximum heterosis inpigeonpea (Ratnaparkhe et al., 1995).
293
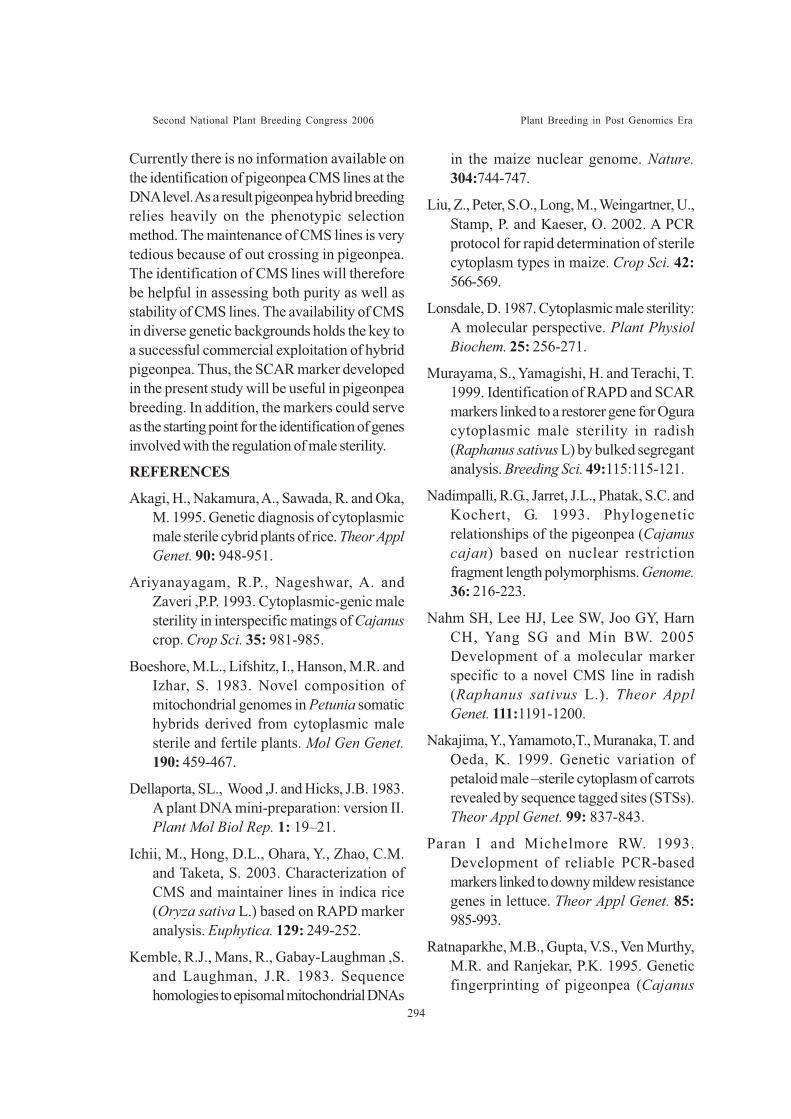
Second National Plant Breeding Congress 2006 Plant Breeding in Post Genomics Era
Currently there is no information available onthe identification of pigeonpea CMS lines at theDNA level. As a result pigeonpea hybrid breedingrelies heavily on the phenotypic selectionmethod. The maintenance of CMS lines is verytedious because of out crossing in pigeonpea.The identification of CMS lines will thereforebe helpful in assessing both purity as well asstability of CMS lines. The availability of CMSin diverse genetic backgrounds holds the key toa successful commercial exploitation of hybridpigeonpea. Thus, the SCAR marker developedin the present study will be useful in pigeonpeabreeding. In addition, the markers could serveas the starting point for the identification of genesinvolved with the regulation of male sterility.
REFERENCES
Akagi, H., Nakamura, A., Sawada, R. and Oka,M. 1995. Genetic diagnosis of cytoplasmicmale sterile cybrid plants of rice. Theor ApplGenet. 90: 948-951.
Ariyanayagam, R.P., Nageshwar, A. andZaveri ,P.P. 1993. Cytoplasmic-genic malesterility in interspecific matings of Cajanuscrop. Crop Sci. 35: 981-985.
Boeshore, M.L., Lifshitz, I., Hanson, M.R. andIzhar, S. 1983. Novel composition ofmitochondrial genomes in Petunia somatichybrids derived from cytoplasmic malesterile and fertile plants. Mol Gen Genet.190: 459-467.
Dellaporta, SL., Wood ,J. and Hicks, J.B. 1983.A plant DNA mini-preparation: version II.Plant Mol Biol Rep. 1: 19–21.
Ichii, M., Hong, D.L., Ohara, Y., Zhao, C.M.and Taketa, S. 2003. Characterization ofCMS and maintainer lines in indica rice(Oryza sativa L.) based on RAPD markeranalysis. Euphytica. 129: 249-252.
Kemble, R.J., Mans, R., Gabay-Laughman ,S.and Laughman, J.R. 1983. Sequencehomologies to episomal mitochondrial DNAs
in the maize nuclear genome. Nature.304:744-747.
Liu, Z., Peter, S.O., Long, M., Weingartner, U.,Stamp, P. and Kaeser, O. 2002. A PCRprotocol for rapid determination of sterilecytoplasm types in maize. Crop Sci. 42:566-569.
Lonsdale, D. 1987. Cytoplasmic male sterility:A molecular perspective. Plant PhysiolBiochem. 25: 256-271.
Murayama, S., Yamagishi, H. and Terachi, T.1999. Identification of RAPD and SCARmarkers linked to a restorer gene for Oguracytoplasmic male sterility in radish(Raphanus sativus L) by bulked segregantanalysis. Breeding Sci. 49:115:115-121.
Nadimpalli, R.G., Jarret, J.L., Phatak, S.C. andKochert, G. 1993. Phylogeneticrelationships of the pigeonpea (Cajanuscajan) based on nuclear restrictionfragment length polymorphisms. Genome.36: 216-223.
Nahm SH, Lee HJ, Lee SW, Joo GY, HarnCH, Yang SG and Min BW. 2005Development of a molecular markerspecific to a novel CMS line in radish(Raphanus sativus L.). Theor ApplGenet. 111:1191-1200.
Nakajima, Y., Yamamoto,T., Muranaka, T. andOeda, K. 1999. Genetic variation ofpetaloid male –sterile cytoplasm of carrotsrevealed by sequence tagged sites (STSs).Theor Appl Genet. 99: 837-843.
Paran I and Michelmore RW. 1993.Development of reliable PCR-basedmarkers linked to downy mildew resistancegenes in lettuce. Theor Appl Genet. 85:985-993.
Ratnaparkhe, M.B., Gupta, V.S., Ven Murthy,M.R. and Ranjekar, P.K. 1995. Geneticfingerprinting of pigeonpea (Cajanus
294
Second National Plant Breeding Congress 2006 Plant Breeding in Post Genomics Era
cajan (L.) Millsp.) and wild relatives usingRAPD markers. Theor Appl Genet. 91:893-898.
Reddy, B.V.S. and Faris, D.J. 1981. Acytoplasmic male sterile line in pigeo-npea.Int. Pigeonpea Newsl. 1:16-17.
Rozen, S. and Skaletsky, H.J. 2000. Primer3 onthe WWW for general users and for biologistprogrammers. In: Krawetz S, Misener S(eds) Bioinformatics Methods andProtocols: Methods in Molecular Biology.Humana Press, Totowa, NJ, p. 365-386.
Saxena, K.B., Kumar, R.V., Srivastava, N. andShiying, B. 2005. A cytoplasmic–nuclearmale sterility system derived from a crossbetween Cajanus cajanifolius andCajanus cajan. Euphytica. 145: 289-294.
Saxena, K.B. and Kumar, R.V. 2003.Development of cytoplasmic nuclear male-sterility system in pigeonpea using C.scarabaeoides (L.) Thouars. Ind. J Genet.63: 225-229.
Schiebel, K. and Hemleben, V. 1989. NucleotideSequence of the 18s–25s spacer region fromrDNA of mungbean. Nucl Acids Res. 17:2852.
Schnable, P.S. and Wise, R.P. 1998. Themolecular basis of cytoplasmic male sterilityand fertility restoration. Trends Plant Sci.3:175-180.
Souframanien, J., Manjaya ,J.G., Krishna, T.G.and Pawar, S.E. 2003. Random amplifiedpolymorphic DNA analyses of cytoplasmicmale sterile and fertile pigeonpea (Cajanuscajan (L.) Millsp.). Euphytica. 129: 293-299.
Tikka, S.B.S., Parmar, L.D. and Chauhan,R.M. 1997. First record of cytoplasmic-genic male-sterility system in pigeonpea(Cajanus cajan (L.) Millsp.) through widehybridization. Gujarat Agric. Univ Res J.22: 160-162.
Wang,G., Castiglione, S., Jhang, J., Fu, R., Ma,J., Li, W., Sun, Y. and Sala, F. 1994. Hybridrice (Oryza sativa L.): identification andparentage determination by RAPD finger-printing. Plant Cell Rep. 14: 122-115.
Wang, X., Fang, Z., Huang, S., Sun, P., Liu, Y.,Yang, L., Zhuang, M. and Qu, D. 2000. Anextended random primer amplified region(ERPAR) marker linked to a dominantmarker linked to dominant male sterilitygene in cabbage (Brassica oleracea var.capitata). Euphytica. 112: 267-273.
Wanjari, K.B., Patil, A.N., Manapure, P.,Manjaya, J.G. and Manish, P. 2001.Cytoplasmic male–sterility in pigeonpeawith cytoplasm from Cajanus volubilis.Ann Plant Physiol. 13: 170-174.
Whisson, D.L. and Scott, N.S. 1985. Nuclearand mitochondrial DNA have sequencehomology with a chloroplast gene. PlantMol Biol. 4: 267-273.
Williams, J.G.K., Kubelik, A.R., Livak, K.J.,Rafalaski, J.A. and Tingey, S.V. 1990.DNA polymorphisms amplified by arbitraryprimers are useful as genetic markers. NuclAcids Res. 18: 6531 – 6535.
295
Second National Plant Breeding Congress 2006 Plant Breeding in Post Genomics Era
Fig.1. Amplification profile of the male sterile (A)line specific marker obtained using the SCAR primerPMS2F and PMS2R in pigeonpea. Lane M - ë EcoR-I Hind III double digest marker. Lanes are markedwith respective male sterile (A), fertile (B) restorerand (R ) lines.
Fig.2. Amplification profile of the male sterile (A)line specific marker obtained using the SCAR primerPMS2F and PMS2R and ITS primer ITS1F andITS2R in pigeonpea. Lane M – 100 bp ladder marker.Lanes are marked with respective male sterile (A),maintainer (B) and restorer (R ) lines.
296
M 288A
�28
8B67
A67
B�
100A
�10
0BA
�
A 290A
290B
TT
R1 �
TT
R2�
M 288A
288B
67A
67B
100A
100B
TT
R1
TT
R2
Second National Plant Breeding Congress 2006 Plant Breeding in Post Genomics Era
MOLECULAR TAGGING OF FERTILITY RESTORER GENE INCOTTON
Amudha, J., G.Balasubramani, Suman.B.Singh, P.Singh and B.M.Khadi
ABSTRACT
India is the pioneer country in the world for cultivation of hybrid cotton on commercialscale. Cotton is an important fibre crop and India has the largest growing area in theglobal scenario. Hybrids have played an important role in cotton improvement and Indianeconomy. Cultivation of cotton hybrids has resulted in significant changes in quality andproduction. Since 1965 in the world, CMS system is available and utilization of the systemhas become difficult because of non availability of genetic basis of fertility restoration. Inthis study, G. harknessii (D2) cytoplasm and the genetics of CMS (D2) fertility restorationwas studied by the RAPD analysis. F2 lines of the cross between the CMS and fertilityrestorer lines were amplified with random decamer primers. DNA from the male sterile line(JCMSK2) and restorer line (976R), F1 hybrid and F2 lines were amplified by using “Operon”primers. The primer OPD20 has produced three polymorphic fragments in restorer line(976R) when compared with the CMS line (JCMSK2). These three polymorphic fragmentswere also observed in F2 lines which possessed fertility restoration gene (Rf1) in them. Thethree fragments are of 1100 bp, 1000 bp and 800 bp in size and designated as OPD 201100,OPD 201000, and OPD 20800. All the three RAPD markers identified could consistentlydistinguish between male sterile and fertile lines and they were tightly linked with Rf1locus. These fragments will enable us to dissect the corresponding introgressed chromosomalsegment carrying the fertility restorer gene.
Introduction
Cotton belongs to the genus Gossypium thatis one among eight genera under tribeGossypieae and family Malvaceae. Cultivationof cotton hybrids has resulted in significantchanges in quality and production. Dr. C. T. Patelreleased the world’s first cotton hybrid H4 forcommon cultivation in 1970 for the Central zoneand Varalaxmi in 1972 for the South zone byB.H. Katarki. In India cultivation of hybrids hasmade tremendous impact on cotton production,convening nearly 9 million hectares of land andproducing 240 Lac bales of cotton lint. In Indiathe most popular hybrids are H8, H10, LHH 144,CSHH198, JKHY-1 and NHH-44 in intrahirsutum group and Varalaxmi, DCH-32 andTCHB-213 are interspecific (G. hirsutum X G.barbadense) hybrids, which have played animportant role in cotton improvement and Indianeconomy. So far, about 50 hybrids by
Government organizations and Private SeedCompanies have been released in India. Now,cotton hybrids cover about 45% of total cottonarea and contribute 55% to the national cottonproduction.
Since 1965 in the world, several CMS lineshave been developed with G.aridum,G.harknessii, G.sturtianum and G.trilobumcytoplasms. Cytoplasmic genic male sterility(CGMS) was first reported by Meyer (1975)and she has also identified a source for fertilityrestoration. The fertility is restored by a singledominant gene (Rf). The cytoplasmic genicmale sterility is highly stable because it is notinfluenced by environmental factors. In cotton,two practically usable sources of cytoplasmicgenic male sterility have been identified. Thefirst source is wild diploid species i.e. G.harknessii which was identified in USA. The
Central Institute for Cotton Research, Nagpur, Maharashtra, India
297
Second National Plant Breeding Congress 2006 Plant Breeding in Post Genomics Era
second source is again a diploid species whichwas identified in India by Meshram et al. (1994)i.e., G. aridum (D4). Weaver and Weaver (1977)studied the inheritance of pollen fertilityrestoration in cytoplasmic male sterile uplandcotton and inferred that a single gene probablyexpressing partial dominance control fertilityrestoration. Zhang and Zhang (1995) reportedmale sterility and fertility restoration wascontrolled by single recessive gene. Later, Zhangand Stewart (2001a), Liu et al (2003), Zhangand Stewart (2004) reported that one dominantgene controls the CMS fertility restoration incotton. In the present study, we have used G.harknessii (D2) cytoplasm and the fertilityrestoration was studied by the RAPD analysis.
Materials and Methods
Plant materials: The cross between the CMSline and restorer line, JCMSK2 (CMS) X 976R(Restorer), F1 hybrid and F2 lines were used inthe present investigation.
Genomic DNA from fresh leaves of parentsi.e., cytoplasmic male sterile line (JCMSK2) andrestorer line (976R) and their F1 and F2 lineswas isolated following the protocol of Patersonet al. (1994). The quality and quantity of theDNA were checked by running on a 0.8%agarose gel electrophoresis before diluting theDNA to about 50-100 mg/ml for PCR analysis.DNA isolation chemicals were obtained fromSigma, USA; Hi media Ltd., Mumbai, India andthe DNA Amplification kit from Bangalore GeneiLtd., Bangalore, India; and oligonucleotideprimers from Operon technology Alameda,California, USA.
Polymerase Chain Reaction
The DNA from the cytoplasmic male sterileline (JCMSK2) and restorer line (976R) and theirF1 and F2 lines was used as a template for PCRamplifications. For RAPD analysis, the PCRreaction mixture contained 2 mI (12.5 ng) ofDNA, 0.02 M MgCl2, 0.05 M KCl, 0.2 mM
primer, 100 mM dNTPs (Bangalore Genei Ltd.,Bangalore, India), 1.0 unit of Taq DNApolymerase (Bangalore Genei Ltd., Bangalore,India) and amplified in Bio-Metra Thermalcycler for 45 cycles of 1 min at 940 C, 1 min at350 C and 2 min at 720 C, with an initialdenaturation step of 4 min at 940 C and a finalsynthesis step of 10 min at 720 C and then heldat 40 C. The amplified products were resolvedon 1.5%(w/v) agarose gel electrophoresis andrun in 1XTBE buffer, stained with ethidiumbromide and the gels were photographed.
Results and Discussion
Fertility restoration gene could belinked with molecular markers using RAPDanalysis. DNA from the male sterile line(JCMSK2) and restorer line (976R), F1 hybridand F2 lines was amplified by using “Operon”primers of OPA, OPC, OPD and OPF series.Out of 60 primers used, one primer OPD 20could produce reproducible polymorphismamong the CMS and restorer lines. F2 lines ofthe cross between the CMS and fertilityrestoring lines were also amplified with thesame random decamer primer i.e., OPD 20.Eleven primers could not produce scorablepolymorphic bands whereas 20 primersproduced monomorphic products. Nine primersdid not amplify any of the DNA samples.However, with 10 primers the amplified productsdid not show any uniform amplification. Nineprimers amplified the products but smearing ofthe DNA fragments was seen.
The primer OPD 20 has produced threepolymorphic fragments in restorer line (976R)which were not produced in the CMS line(JCMSK2) as shown in Plate 1. These threepolymorphic fragments were also found in F2fertile lines being introgressed from R linerestoring the fertility in them. The threefragments are of 1100 bp, 1000bp and 800 bpsizes and designated as OPD201100, OPD201000,
298
Second National Plant Breeding Congress 2006 Plant Breeding in Post Genomics Era
and OPD20800. All the three RAPD markersidentified could consistently distinguish betweenmale sterile and fertile lines and they were tightlylinked with Rf1 locus. These markers arerestorer-specific and should be useful in marker-based selection for developing restorer parentallines and constructing a high-resolution linkagemap containing Rf1.
This fragment will enableus to dissect the corresponding introgressedchromosomal segment carrying the fertilityrestorer gene. The inheritance of the restorergene in the F2 was in 3:1 Mendelian inheritanceas the G.harknessii (D2) cytoplasm has beenrestored by the restorer gene in the F2 generation.
RAPD markers have been used asalternatives to cumbersome grow out test (GOT)in the identification of parents and F1 hybridcotton (Krishna, 1998). Zhang et al. (1999)experimented on molecular mapping of CMS-D8 restoration and gene cloning specific to D8restorer in cotton. They reported that restorergene Rf2 from the D8 restorer and the restorergene Rf1 from the D2 restorer are tightly linkedto their respective DNA markers and they havecloned 26 cDNA fragments specific to the D8restorer. Pillai and Amirthadevarathinam (1998)had observed the combining ability for economictraits using CMS system in cotton. Lan et al.,(1994) reported RAPD marker linked to malefertility restorer gene for CMS associated withthe cytoplasm of G. harknessii in Gossypiumhirsutum L. at a distance of 2.3 cM. Liu et al.(2003) reported one dominant gene that controlsthe CMS fertility restoration in cotton. Theyreported two RAPD and three SSR markersclosely linked to the Rf1 gene and located on thelong arm of chromosome 4.
Zhang and Stewart (2001a) reported thatCMS-D8 restoration in cotton is conditioned byone dominant gene (Rf2). They reportedgenotypes of A, B and D8R lines in the CMS-D8 system are designated as for A (rf2 rf2), B(rf2 rf2), D8R (Rf2 Rf2). They could get 3:1
Mendelian ratio when restored F1 plants withD8 cytoplasm were pollinated by theirreciprocal F1’s with normal cytoplasm. Zhangand Stewart (2001b) studied the inheritance andgenetic relationships of the D8R and D2Rgenes and reported that the Rf1 gene of D2functioned sporophytically and Rf2 gene of D8gene gametophytically and these two geneswere linked with an average genetic distanceof 0.93 cM.
Our results coincide with Zhang andStewart (2004) who has developed molecularmarkers closely linked to the restorer genes ofthe two independent dominant restorer genes,Rf1 from the D2 restorer line transferred fromG. harknessii Brandegee (D2 genome) and Rf2from the D8 restorer line by Bulk segregantanalysis. They reported one STS marker UBC188500 linked with the restorer gene Rf1 andtwo markers UBC 169700 and UBC 6591500 withRf2. The parental analysis of the nucleargenome has revealed Mendelian inheritance forRAPD products reported by Welsh et al. (1991)and the segregation of the fertility restorationshows the expected dominant nature of theRAPD markers (Michelmore et al., 1991). Themolecular markers identified in the present studywill enable the development of the elite restoringlines in cotton by marker-assisted selection.
Molecular tagging of fertility restorer genein restorer lines enables the transfer of therestorer gene to a variety with desirableagronomic background without involving asterile cytoplasm, extensive test crossing,development of restorers with normalcytoplasm, pyramiding of restorer genes,identification of plants with restorer genes atearly seedling stage and germplasm lines byemploying marker assisted selection. Suchprocedure which is independent ofenvironmental influence on restoration,identification of closely linked markers wouldhelp in map based cloning of fertility restorer
299
Second National Plant Breeding Congress 2006 Plant Breeding in Post Genomics Era
gene, to understand the molecular nature offertility restorer gene (Gyan et al., 2001).
REFERENCES
Krishna, T.G. 1998. DNA based markers foridentification of inbred and hybrids in cotton.Paper presented in Hybrid crops workshopheld at Pantnagar (UP) India. p: 1 - 3.
Gyan, P. M., Singh, R. K., Mohapatra, T., Singh,A. K., Prabhu, K. V. and Zaman, F. U.2001.Molecular mapping of a fertility restorergene in basmati rice using microsatellitemarkers. Indian J. Genet.61 : 348-349.
Lan, T. H., Cook, C. G. and Paterson A H. 1994.RAPD tagging of male fertility restorationgene in cotton. Abstract from Internationalplant genome Conference, Town andcountry conference center, SanDiego,California, USA.
Liu, L., Guo, W., Zhu, X., Zhang, T. 2003.Inheritance and fine mapping of fertilityrestoration for cytoplasmic male sterility inGossypium hirsutum L. Theo. Appl.Genetics. 106: 461-469.
Meshram, L. D., Ghongade, R. A. and Marawar,M. W.1994. Development of male sterilesystem from various sources in cotton. PKVRes.J.18: 83-86.
Meyer, V.G.1975. Male sterility fromGossypium harknessii. J. Heredity. 66: 23-27.
Michelmore, R. W., Paran, I. and Kesseli, R.V.1991.Identification of markers linked todisease resistance genes by bulkedsegregant analysis: A rapid method to detectmarkers in specific genomic regions by usingsegregation population. Proc. Natl. Acad.Sci. USA.88: 9828-9832.
Paterson, A. H., Brubaker, C. L. and Wendel, J.F. 1994. A rapid method for extraction ofcotton (Gossypium spp.) genomic DNAsuitable for RFLP or PCR analysis. Plant
Mol. Biol. Rep. 11: 122-127.
Pillai, M. A. and Amirthadevarathinam, A.1998. Combining ability for economic traitsusing CMS system in cotton. AgriculturalScience Digest. Karnal. 18: 54-58.
Weaver, D. B. and Weaver, Jr. J. B. 1977.Inheritance of pollen fertility restoration incytoplasmic male sterile upland cotton.Crop Sci. 17: 497-499.
Welsh, J., Honeycutt, R. J., McClelland, M. andS o b r a i , B . W. S . 1 9 9 1 . P a r e n t a g edetermination in maize hybrids using thearbitrarily primed polymerase chainreaction(AP-PCR). Theor. Appl. Genet.82: 473-476.
Zhang, T. Z. and Zhang, T. Z. 1995. Adiscussion of the inheritance of Dong-Agenetic male sterility and its fertilitymaintaining line (MB) in Upland cotton.Hereditas-Beijing. 17: 30-33.
Zhang, J. F., Stewart, J. M. and Turley, R.B.1999. Molecular mapping of CMS-D8restoration and gene expression specific toD8 restoration. Proc. Beltwide CottonConf., National Cotton Council, Memphis,TN. p448.
Zhang, J. F. and Stewart, J. M. 2001a.Inheritance and genetic relationships of theD8 and D2-2 restorer genes for cottoncytoplasmic male sterility. Crop Breeding,genetics and cytology. 41: 289-294.
Zhang, J. F. and Stewart, J. M. 2001b. CMS-D8 restoration in cotton is conditioned byone dominant gene. Crop Breeding,genetics and cytology. 41: 283 - 288.
Zhang, J. F. and Stewart, J. M. 2004.Identification of molecular markers linkedto the fertility restorer gene for CMS-D8.Crop Sci. 44: 1209 - 1217.
300
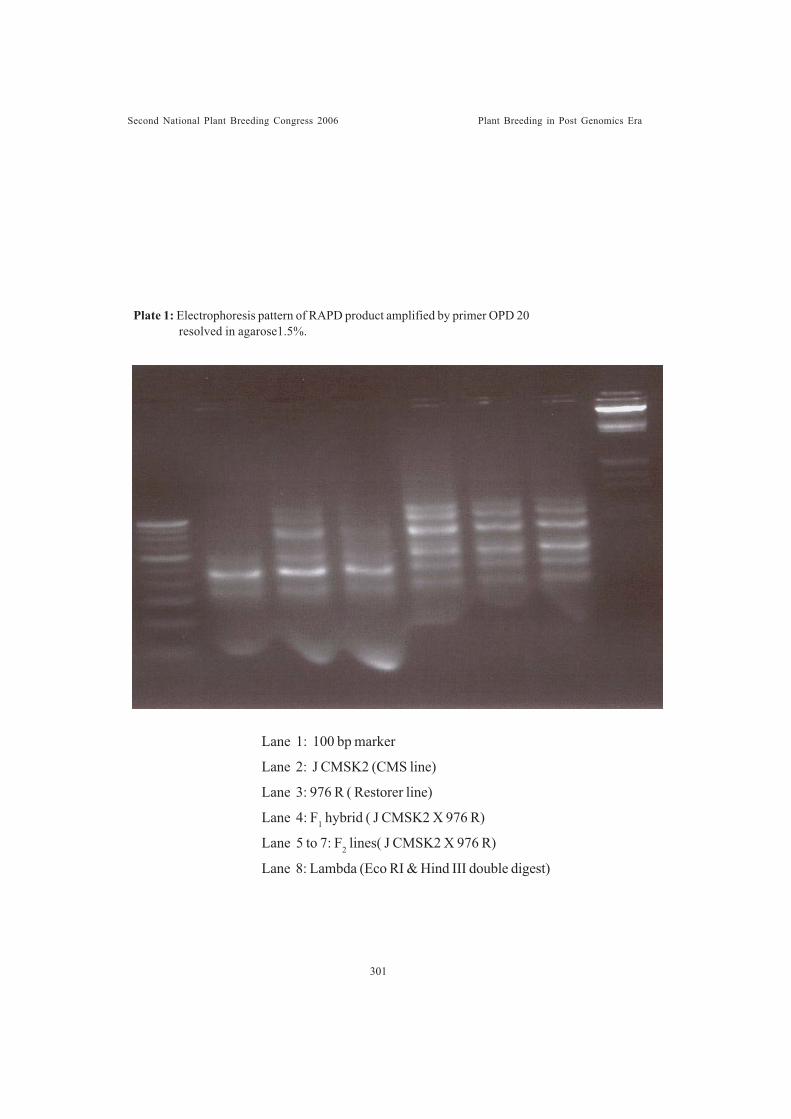
Second National Plant Breeding Congress 2006 Plant Breeding in Post Genomics Era
Plate 1: Electrophoresis pattern of RAPD product amplified by primer OPD 20 resolved in agarose1.5%.
Lane 1: 100 bp marker
Lane 2: J CMSK2 (CMS line)
Lane 3: 976 R ( Restorer line)
Lane 4: F1 hybrid ( J CMSK2 X 976 R)
Lane 5 to 7: F2 lines( J CMSK2 X 976 R)
Lane 8: Lambda (Eco RI & Hind III double digest)
301
Second National Plant Breeding Congress 2006 Plant Breeding in Post Genomics Era
ASSESSMENT OF GENETIC DIVERSITY AND INTERRELATIONSHIPAMONG WILD MULBERRY (MORUS LAEVIGATA AND M. SERRATA)
COLLECTIONS OF INDIA THROUGH DNA MARKER ANALYSISGirish Naik , M. V., B. Mathi Thumilan, Bhaskar Roy and S. B. Dandin
ABSTRACTWild species of the crop plants serve as sources for novel traits/genes in crop improvement
programme. Two wild species of mulberry are known to occur naturally in India, viz.,Morus laevigata and M. serrata. M. laevigata has a wider distribution and occur throughout the sub-Himalayan region to Andaman group of Islands. However, this species isintroduced to Central India for its edible fruits and grown as shade trees in coffee/teaestates of South India. Some collections of the species are resistant to termite/diseases andtolerant to salinity. In contrast, M. serrata is restricted to foothills of Himalayas up to anelevation of 3000 m in North-Western India. The species is known to be frost tolerant. Thesurvival of both the species is under threat due to extensive deforestation and naturalcalamities. Hence, there is a need to reliably assess the genetic diversity existing in thesewild mulberry populations for appropriate conservation measures. Nine collections ofeach of the two wild mulberry species from different geographical locations were assembledfor assessment of DNA marker based genetic diversity. RAPD analysis using ten informativearbitrary sequence decamer primers generated 143 discrete markers ranging from 300-3400 bp. Among them, 135 were polymorphic (94.4 %) with an average of 14.3 markersper primer. The ISSR screening carried out with four anchored primers which generated atotal of 60 markers of which 51 were polymorphic (85.0%). The combined genetic analysisof RAPD and ISSR markers based on Dice similarity coefficient shows the wide geneticvariability between the two wild species collections ranging from 0.951 to 0.422. Thepopulation of M. laevigata namely Jowai and Badodhi were closest with maximum similarityof 0.951 and Jowai (M. laevigata) and Bowali Farm (M. serrata) were most distant witha least similarity of 0.422. UPGMA clustering analysis based on combined DNA markeranalysis separated these 18 collections into two distinct groups in accordance with theirtaxonomic status. Based on the analysis of genetic and phenotypic variability of two wildspecies, immediate effort towards the conservation of wild mulberry species is urgentlyneeded and more so in case of M. serrata through ex-situ and in-situ approach.
Central Sericultural Research and Training Institute, Mysore – 570 008, India.
Introduction
Mulberry (Morus spp.) is the only naturalfood source of the domesticated silkworm(Bombyx mori L.). Mulberry is a group of treespecies belongs to the family Moraceae,distributed in the temperate and subtropicalregions of northern hemisphere. Indo-Himalayanregion along with Sino-Korean and Japan isconsidered to be the centers of origin of mulberryspecies (Mukherjee 1898; Sanchez 2000).According to Watt (1873) certain species of
Morus (M. laevigata and M. serrata) aretruly wild in India. Hooker (1885) reported thedistribution of four mulberry species in India,viz., M. alba, M. indica, M. laevigata andM. serrata. The first two species are cultivatedfor silkworm rearing for the production of silkand widely grown in India. Of the two wildmulberry species, M. laevigata is availablethroughout India, but naturally occur in thevicinity of Himalayas and Northeastern states.M. laevigata also occurs naturally in the forest
302
Second National Plant Breeding Congress 2006 Plant Breeding in Post Genomics Era
of Andaman group of Islands (Parkinson, 1923).
M. laevigata show high phenotypicvariability and interesting morphological traits.M. laevigata collections of Andaman Island aresaline tolerant (Chakraborti, 1999) and termiteresistant. M. serrata is comparatively restrictedin distribution and confined to foothills ofHimalayas. Due to environmental inconsistencyand loss of natural habitats, the species is underthreat and therefore there is an urgent need totake up conservation measures both by in situas well as ex situ approaches. This necessitatessystematic studies pertaining to their distributionand diversity available in these two wild mulberryspecies. Morphological characterization has beenwidely employed for assessment of diversity andgenetic relationship but is affected byenvironmental factors. Today, DNA markers(Lerceteau et al., 1997) have gained popularityamong conservationists, geneticists and breedersbecause of its stability and easy generation ofmaximum information comparatively in a shorterperiod. PCR based markers such as RAPD’s(Williams et al., 1990) and ISSR’s (Zietkiewiczet al., 1994) have the potential to screen largenumber of samples rapidly and provide aconvenient and quick assessment of differencesin the genetic composition of the relatedindividuals and have largely overcome theproblems that are associated with phenotypebased grouping. In mulberry RAPD’s and ISSR’shave been proved successful in DNAfingerprinting of mulberry cultivars (Naik et al.,2002), assessment of genetic diversity andinterrelationship among the cultivated forms andspecies (Awasthi et al., 2004; Vijayan andChatterjee, 2003; Bhattacharya and Ranade,2001; Vijayan et al., 2004). The presentinvestigation is an attempt to study representativecollections of two wild mulberry species of Indiafor assessment of their genetic structure,diversity and interrelationship which is veryimportant from the point of view of their
utilization in crop improvement programme andconservation of these endangered species.
Materials and Methods
Plant materials
Nine collections each of wild mulberry –M. laevigata and M. serrata were assembledfrom the gene banks at Central SericulturalResearch & Training Institute, (CSRTI),Mysore and Central Sericultural GermplasmResources Center, (CSGRC), Hosur. Thesecollections were originally obtained throughexploration by the two Institutes, and are fromgeographically diverse source so as torepresent the entire diversity available in thesespecies. The list of the wild mulberry collectionsalong their source and place of collection isshown in Table 1. The plant materials arecollected from the field gene bank in the formof fresh young leaves and stored at - 860 Cuntil further use in DNA isolation.
Mulberry Genomic DNA isolation,purification and quantification
Genomic DNA was isolated using NucleonPhytopure Kit method (AmershamBiosciences, UK). The DNA was quantifiedon 0.8% agarose gel after staining withethidium bromide solution. The stock solutionwas diluted to uniform concentration of 10ng/�l for PCR amplification.
RAPD amplification
PCR reactions were performed accordingto the protocols of Williams et al. (1990). ThePCR amplification was carried in a 0.2 ml PCRtube in PTC-200 DNA engine (MJ Research,U.S.A.) with 20ìl reaction volumes containing20mM Tris-HCl (pH 8.4), 50mM KCl, 2.0 mMMgCl2, 0.2 ìM primer, 0.1 mM of each dNTPs,0.5 U of Taq DNA polymerase (Genei,Bangalore) and 20ng of template DNA. Therandom primers (Table 2) were obtained fromOperon Technologies Inc., Almeda, USA.
303
Second National Plant Breeding Congress 2006 Plant Breeding in Post Genomics Era
Amplification reactions were carried out byfollowing cycle profiles: initial denaturing cycleat 930C for 2 min followed by 40 cycles at 930 Cfor 1min, 350 C for 1min, 720 C for 2 min and afinal 7 min extension at 720 C. PCR productswere electrophoresed on 1.5% agarose gel(Sambrook et al., 1989) in 1x TAE, stained inethidium bromide and the gel image was recordedusing the gel documentation system (Syngene,U.K.).
ISSR Amplification
The ISSR amplification was also carried outin a 0.2 ml PCR tube in PTC-200 DNA engine(MJ Research, USA) with 20ìl reaction volumecontaining 20 mM Tris-HCl (pH 8.4), 50 mMKCl, 1.5 mM MgCl2, 0.2ìM primer, 0.1 mM eachdNTPs, 0.5 U of Taq DNA polymerase (Genei,Bangalore) and 20ng of template DNA. TheISSR primers (Table 3) were obtained fromUniversity of British Columbia, Vancouver,Canada. Amplification reactions were carriedout by following cycle profiles: initial denaturationat 940 C for 5 min followed by 35 cycles at 940 Cfor 1min, 480 C for 1min, 720 C for 2 min and afinal 5 min extension at 720 C. PCR productswere electrophoresed on 2.0% agarose gelstained with ethidium bromide and the gel imagewas recorded using the gel documentationsystem (Syngene, U.K).
Data analysis
DNA banding patterns generated by RAPDand ISSR were scored as ‘1’ for the presenceof marker and ‘0’ for the absence. All RAPDand ISSR reactions were performed twice andonly reproducible bands in the range of 3500 to300 bp were scored. Dice similarity matrix wasgenerated using the equation, s =2Nxy/ (Nx+Ny), where Nxy is the number of sharedmarkers between ‘x’ and ‘y’ entries. Nx is thetotal number of markers in ‘x’ entry and Ny isthe total number of markers in ‘y’ entry (Neiand Li, 1979). Genetic distance (1-s) wascalculated and a dendrogram was constructed
based on the similarity matrix data set byapplying un-weighted pair group method ofarithmetic averages (UPGMA). RAPD andISSR markers were identified by the source ofprimers (OP for Operon and UBC forUniversity of British Columbia), kit letter, theprimer number and its approximate size in basepairs.
Results
Nine collections each of two wild speciesof mulberry, is naturally distributed in India, arefrom diverse origin and possibly represent thegenetic diversity existing in the species.Morphologically, these two species are distinctand show significant diversity within the species.However, M. laevigata collections showedmore variability in phenotypic traits and alsoadaptable to varied eco-climatic conditions.
RAPD analysis
The random primers amplified differentgenomic DNA segments of different wildmulberry collections and generated 143 markersin the size range of 400 – 3400 bp. The numberof markers obtained per primer ranging from11 – 18 with an average of 14.3. A total of 135markers were polymorphic (94.4%) and therest 8 were monomorphic. The completeamplification details are presented in Table 2.DNA profiles generated by OPA-16 and OPC-08 were shown in Fig.1. Four M. laevigataand seven M. serrata species-specific RAPDmarkers have been identified (Table 4).
ISSR analysis:
A total of four ISSR primers belonging toUBC series (Table 3) were employed forscreening the nine collections each of the twowild mulberry species. PCR amplificationgenerated clear profiles (Fig. 2) in whichnumber of markers amplified ranged from 8-19 with an average of 15 per primer. Theseprimers produced the amplification products inthe size range of 400 – 2800 bp. Out of the
304
Second National Plant Breeding Congress 2006 Plant Breeding in Post Genomics Era
total of 60 markers generated, 51 were (85.0%)polymorphic and the rest 9 were monomorphic.The percentage of polymorphism generated byISSR primers was slightly less compared to thatof RAPD (94.4%). A total of two M. laevigataand three M. serrata species-specific markerswere found (Table 4) and two of the collectionspecific ISSR markers were identified.
RAPD+ISSR analysis
The combined genetic analysis of RAPDand ISSR markers based on Dice similaritycoefficient showed the wide genetic variabilityamong the collections of the two species. Thecollections of M. laevigata namely, Jowai andBadodhi were closest with maximum similarity(95.1%) and Jowai (M. laevigata) and B farm(M.serrata) were most distant (1-s=0.422).UPGMA clustering based on both RAPD andISSR marker data showed clear separation ofcollections into distinct species group’s viz., M.laevigata and M. serrata (Fig. 3).
Discussion
Mulberry is a cross pollinating, heterogenousperennial tree species of wide phenotypicvariability (Alizade et al., 1970). The presentstudy has made an attempt to assess the geneticdiversity among nine collections each of M.laevigata and M. serrata from differentlocations of India. As morphological traits aregreatly influenced by the environment, it has beenalways problem to assess accurate geneticdiversity information and interrelationship amongmulberry species (Awasthi et al., 2004). DNAmarkers like RAPD and ISSR have become ahandy tool for quick and reliable estimates ofdiversity for crop improvement and conservationprogramme in mulberry (Sharma et al., 2000).Based on the combined analysis of both markersystems, the Dice coefficient of similarity amongthe M. laevigata collection was maximum(0.951) between Jowai and Badodhi and least(0.613) in case of Lamia Bay and Dhar local.In case of M. serrata, the maximum similarity
was (0.894) obtained between Kothapuraand Urgam-3 and minimum (0.644) in caseof Ramtura and Serrata. The mean geneticsimilarity was less in case of M. laevigatacollections compared to that of M. serrataindicating a diverse genetic background ofthe former. This conclusion is also supportedby the large variability exhibited inmorphological traits in the M. laevigatacollections. When the collections of twospecies were compared simultaneously, thecollections of M. laevigata viz., Jowai andBadodhi have high similarity coefficientvalue and minimum similarity (0.422) wasobserved in case of Bowali Farm (M.serrata) and Jowai (M. laevigata). That isto say that the last two are the most diversecollections among all. UPGMA clusteringbased on the RAPD and ISSR marker dataseparates the species into two distinct groupsconfirming their taxonomic statusunambiguously and these two aregeographically isolated and thriving incomparatively different habitat (Thormannet al., 1994).
Due to high heterozygosity and dioeciousnature of the species, it is not possible toconserve the seeds under ex situ conditionand are maintained in the vegetative form inthe field gene bank. Most of the primers usedfor DNA profiling of the wild mulberrycollections generated high markerpolymorphism and as many as six RAPDprimers revealed 100% polymorphism.RAPD primers revealed morepolymorphism (94.4%) in comparison withISSR primers (85.0%). The averagepercentage polymorphism was (91.6) whenboth the primers were computed together.These variations between RAPD and ISSRmay be due to the fact that the PCR profilesin the two marker assays originated fromdifferent repetitive and non-repetitive regions
305
Second National Plant Breeding Congress 2006 Plant Breeding in Post Genomics Era
of the genome (Daiya et al., 2002; Wu andTanksley, 1993). The ISSR profiles generatedby anchored primers revealed that these repeatsare abundant in the Morus genome (Vijayanand Chatterjee, 2003).
A total of six M. laevigata (OPA-071450,OPA-15650, OPC-052900, OPC–08750, UBC–8112300 and UBC–8111450) and ten M. serrataspecies-specific markers (OPA–092000, OPA–12750, OPA–162800, OPA–16650, OPA–16550,OPC–081600, OPC–101500, UBC–8101200, UBC–8111500 and UBC–8121500) were identifiedbetween these two species which can be usedfor quick identification of the materials
The present study even though hasconsidered somewhat limited number ofspecies samples, gives an insight into the broadgenetic structure of these two wild species. ThePCR based techniques RAPD and ISSR areinformative for evaluating the extent of geneticdiversity as well as to determine the nature ofgenetic relationship between different speciesof Morus with polymorphism levels sufficientto establish informative profiles with relativelyfewer primer sets. These two species, whichare truly wild, harbors some of the importantgenes for diseases (powdery mildew and leafspot) and pest (termite) resistance (M.laevigata collections), saline tolerance (M.laevigata collections of Andaman Islands) andfrost tolerance (M. serrata), which can beexploited in mulberry improvement programme.The information generated from the study willbe useful for further in depth analysis of theseendangered species towards utilization inmulberry improvement and conservationprogramme.
REFERENCES
Alizade, M.A., Hundova, A.K. 1970. Thevariation in the DNA content of the celland chromosome at polyploidy forms ofmulberry, Morus (L). Caryologia. 23: 317– 320.
Awasthi, A.K., Nagaraja, G.M., Naik, V.G.,Kanginakudru, S., Thangavelu, K.,Nagarajau, J . 2004. Genetic Diversity andrelationships in mulberry (genus Morus) asrevealed by RAPD and ISSR markerassays. BMC Genetics. 5: 1-9.
Bhattacharya, E., Ranade, S.A. 2001.Molecular distinction among varieties ofmulberry using RAPD and DAMD profiles.BMC plant Biology. 3: 1471– 2229
Chakraborti, S. P. .1999. Mulberry cultivationin coastal saline soil of West Bengal.Indian silk. 38: 5-7.
Daiya, K.K., Archak, S., Karihaloo, J.L. 2002.DNA fingerprinting of guava (Psidiumguajava L.) cultivars using RAPDmarkers. Indian Gent. Resou. 15: 112-115.
Hooker, J.D .1885. Flora of British India V. L.Reev & Co.Ltd., The East House Book,Ashford, Kent, UK. 91-493 p.
Lerceteau, E., Robert, T., Petiard ,V., Crouzillat,D. 1997. Evaluation at the extent at geneticvariability among Theobroma cacaoaccessions using RAPD and RFLPmarkers, Theor Appl Genet. 95: 10 –19.
Mukherjee, N.G. 1898. Handbook ofSericulture. Thacker Spink & Co., Calcutta,India. p: 298
Naik, V.G., Sarkar, A., Sathayanarayana, N.2002. DNA fingerprinting of Mysore localand V-1 Cultivars of mulberry (Morus sp.)with RAPD markers. Indian J Genet. 62:193–196.
Nei, M., Li, W.H. 1979. Mathematical modelfor studying genetic variation in terms ofrestriction endonucleases. Proc Natl AcadSci. 76: 5269-5273.
Parkinson, C.E. 1923. A Forest Flora ofAndaman Islands. Edited by Bishen Singh& Mahindra Pal Singh, Dhera Dun 155 p.
306
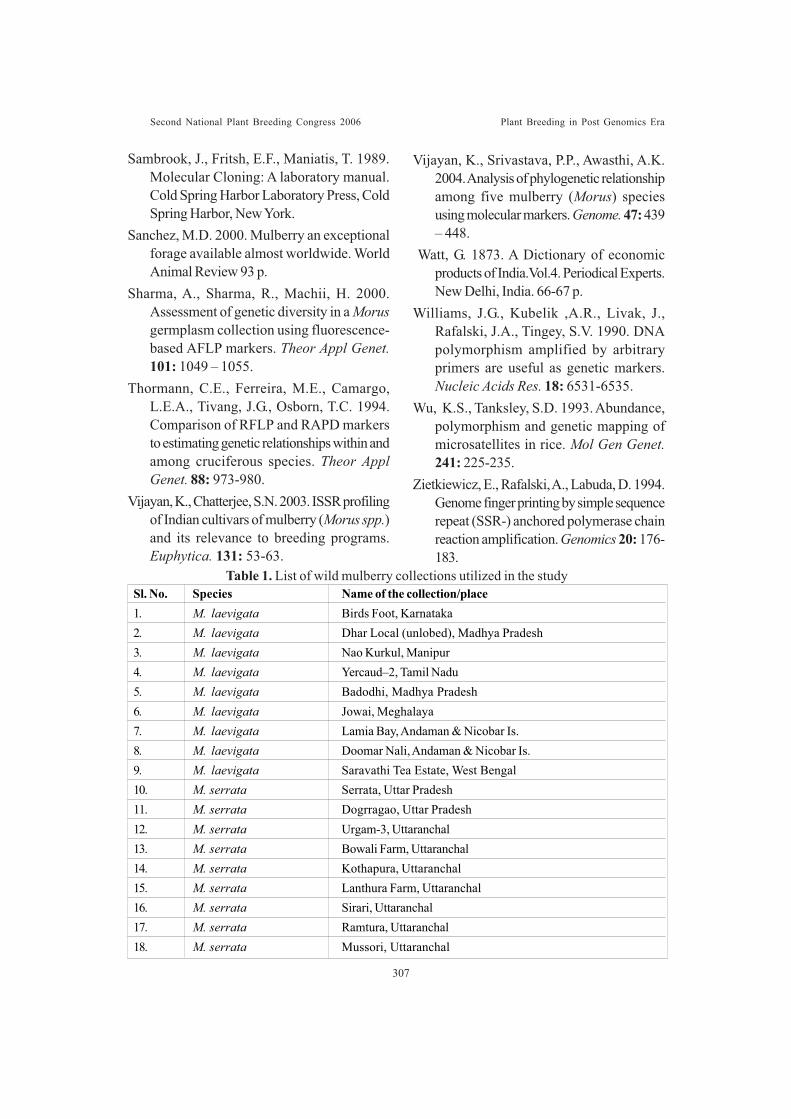
Second National Plant Breeding Congress 2006 Plant Breeding in Post Genomics Era
Sambrook, J., Fritsh, E.F., Maniatis, T. 1989.Molecular Cloning: A laboratory manual.Cold Spring Harbor Laboratory Press, ColdSpring Harbor, New York.
Sanchez, M.D. 2000. Mulberry an exceptionalforage available almost worldwide. WorldAnimal Review 93 p.
Sharma, A., Sharma, R., Machii, H. 2000.Assessment of genetic diversity in a Morusgermplasm collection using fluorescence-based AFLP markers. Theor Appl Genet.101: 1049 – 1055.
Thormann, C.E., Ferreira, M.E., Camargo,L.E.A., Tivang, J.G., Osborn, T.C. 1994.Comparison of RFLP and RAPD markersto estimating genetic relationships within andamong cruciferous species. Theor ApplGenet. 88: 973-980.
Vijayan, K., Chatterjee, S.N. 2003. ISSR profilingof Indian cultivars of mulberry (Morus spp.)and its relevance to breeding programs.Euphytica. 131: 53-63.
Vijayan, K., Srivastava, P.P., Awasthi, A.K.2004. Analysis of phylogenetic relationshipamong five mulberry (Morus) speciesusing molecular markers. Genome. 47: 439– 448.
Watt, G. 1873. A Dictionary of economicproducts of India.Vol.4. Periodical Experts.New Delhi, India. 66-67 p.
Williams, J.G., Kubelik ,A.R., Livak, J.,Rafalski, J.A., Tingey, S.V. 1990. DNApolymorphism amplified by arbitraryprimers are useful as genetic markers.Nucleic Acids Res. 18: 6531-6535.
Wu, K.S., Tanksley, S.D. 1993. Abundance,polymorphism and genetic mapping ofmicrosatellites in rice. Mol Gen Genet.241: 225-235.
Zietkiewicz, E., Rafalski, A., Labuda, D. 1994.Genome finger printing by simple sequencerepeat (SSR-) anchored polymerase chainreaction amplification. Genomics 20: 176-183.
Table 1. List of wild mulberry collections utilized in the studySl. No. Species Name of the collection/place1. M. laevigata Birds Foot, Karnataka2. M. laevigata Dhar Local (unlobed), Madhya Pradesh3. M. laevigata Nao Kurkul, Manipur4. M. laevigata Yercaud–2, Tamil Nadu5. M. laevigata Badodhi, Madhya Pradesh6. M. laevigata Jowai, Meghalaya7. M. laevigata Lamia Bay, Andaman & Nicobar Is.8. M. laevigata Doomar Nali, Andaman & Nicobar Is.9. M. laevigata Saravathi Tea Estate, West Bengal10. M. serrata Serrata, Uttar Pradesh11. M. serrata Dogrragao, Uttar Pradesh12. M. serrata Urgam-3, Uttaranchal13. M. serrata Bowali Farm, Uttaranchal14. M. serrata Kothapura, Uttaranchal15. M. serrata Lanthura Farm, Uttaranchal16. M. serrata Sirari, Uttaranchal17. M. serrata Ramtura, Uttaranchal18. M. serrata Mussori, Uttaranchal
307
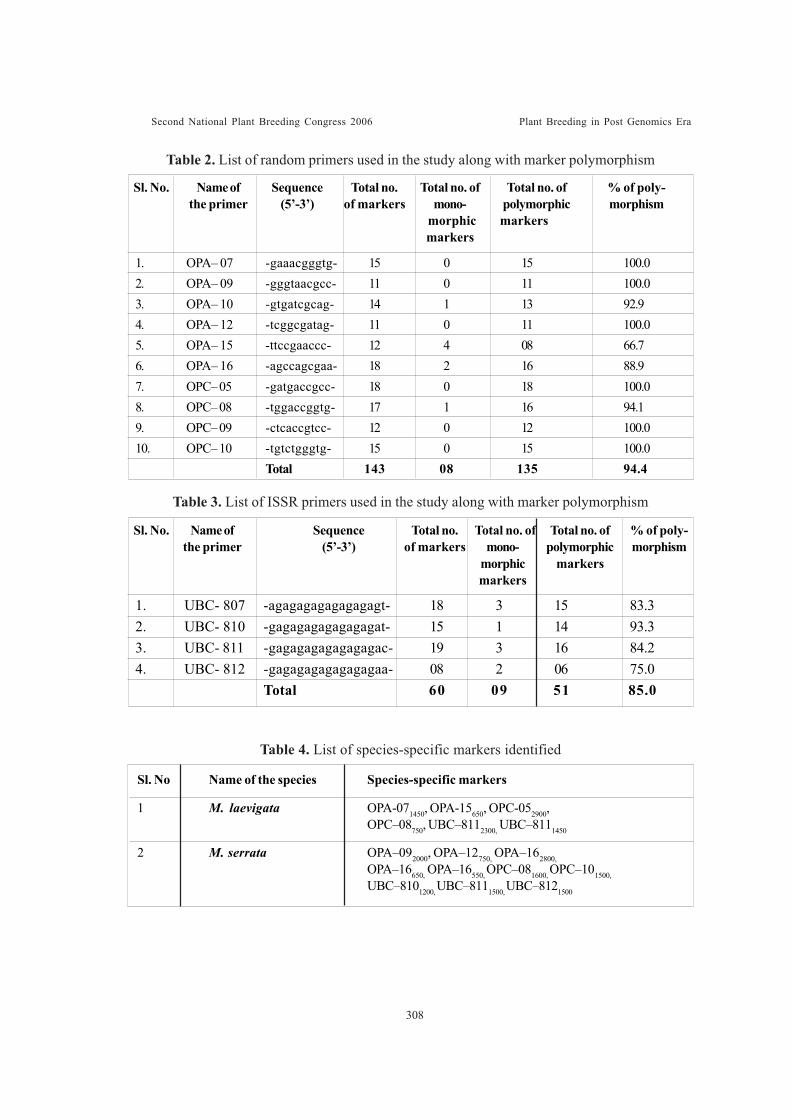
Second National Plant Breeding Congress 2006 Plant Breeding in Post Genomics Era
Table 2. List of random primers used in the study along with marker polymorphism
Table 3. List of ISSR primers used in the study along with marker polymorphism
Sl. No Name of the species Species-specific markers
1 M. laevigata OPA-071450, OPA-15650, OPC-052900,OPC–08750, UBC–8112300, UBC–8111450
2 M. serrata OPA–092000, OPA–12750, OPA–162800,OPA–16650, OPA–16550, OPC–081600, OPC–101500,UBC–8101200, UBC–8111500, UBC–8121500
Table 4. List of species-specific markers identified
Sl. No. Name of Sequence Total no. Total no. of Total no. of % of poly-the primer (5’-3’) of markers mono- polymorphic morphism
morphic markersmarkers
1. OPA– 07 -gaaacgggtg- 15 0 15 100.02. OPA– 09 -gggtaacgcc- 11 0 11 100.03. OPA– 10 -gtgatcgcag- 14 1 13 92.94. OPA– 12 -tcggcgatag- 11 0 11 100.05. OPA– 15 -ttccgaaccc- 12 4 08 66.76. OPA– 16 -agccagcgaa- 18 2 16 88.97. OPC– 05 -gatgaccgcc- 18 0 18 100.08. OPC– 08 -tggaccggtg- 17 1 16 94.19. OPC– 09 -ctcaccgtcc- 12 0 12 100.010. OPC– 10 -tgtctgggtg- 15 0 15 100.0
Total 143 08 135 94.4
Sl. No. Name of Sequence Total no. Total no. of Total no. of % of poly-the primer (5’-3’) of markers mono- polymorphic morphism
morphic markersmarkers
1. UBC- 807 -agagagagagagagagt- 18 3 15 83.32. UBC- 810 -gagagagagagagagat- 15 1 14 93.33. UBC- 811 -gagagagagagagagac- 19 3 16 84.24. UBC- 812 -gagagagagagagagaa- 08 2 06 75.0
Total 60 09 51 85.0
308

Second National Plant Breeding Congress 2006 Plant Breeding in Post Genomics Era
309
Second National Plant Breeding Congress 2006 Plant Breeding in Post Genomics Era
USE OF SSR MARKERS FOR THE IDENTIFICATION OFINTERSPECIFIC AND INTERGENERIC HYBRIDS OF SACCHARUM
Vijayan Nair, N., A. Selvi, S. Suresh Ramraj and K. Sundaravel Pandian
ABSTRACTThe use of the wild species and the related genera of Saccharum in sugarcane varietal
improvement have been well recognised. Genetic improvement in Sugarcane has beeninitially brought about through interspecific hybridization involving the cultivated(S.officinarum and S.barberi) and the wild species (S.spontaneum and S.robustum) ofSaccharum. Saccharum is crossable with several of the related genera and intergenerichybrids of Saccharum with Erianthus, Miscanthus, Narenga and Sclerostachya had beenproduced in the past. The wild species of Saccharum and the related genera are consideredto be potential sources for genes conferring high productivity and resistance to biotic andabiotic stresses. Consequently considerable efforts are being made to introgress the genesof importance from the wild sources to sugarcane through interspecific and intergenerichybridisation. Though there are no crossability barriers among the different species ofSaccharum and also between Saccharum and the related genera, interspecific andintergeneric crosses are relatively difficult to perform and very often it is difficult todistinguish the true hybrids from the selfs among the progeny arising from such crosses.The hybrids largely resemble the sugarcane parent in gross morphology and it will bepractically difficult to distinguish the hybrids based on their morphological attributes. Inthis context, the use of species and genus-specific molecular markers have been found tobe useful in identifying genuine hybrids among the progeny of interspecific and intergenerichybrids of Saccharum. In the present study, the potential of SSR markers to identifygenuine hybrids of Saccharum from interspecific and intergeneric crosses was examined.Fifty putative hybrids from S.robustum x Erianthus and S.officinarum x Erianthuscrosses, 30 progenies from S.robustum x S.spontaneum crosses, one progeny each fromSclerostachya x S.officinarum and Sclerostachya x S.spontaneum crosses were screenedusing 10 sugarcane and 5 Sorghum microsatellite markers. Parental polymorphism wasstudied with respect to the markers generated and compared with that of the progenies.Forty six of the Saccharum x Erianthus progenies showed markers specific to Erianthus,confirming their hybridity. Among the 30 progenies of S.robustum x S.spontaneum, 21showed markers specific to the spontaneum parent and were found to be genuine hybrids.The hybridity of the Sclerostachya x S.officinarum hybrid was also confirmed based onthe presence of the markers representing both parents. The study clearly establishes thepotential application of SSR markers in the identification of interspecific and intergenerichybrids of Saccharum.
Introduction
Sugarcane, a highly heterozygouspolyploid plant with an estimated genome sizeof 10,000 Mbp, remains the most complex andleast characterized of the crop plants. Modernsugarcane cultivars (Saccharum spp. 2n = 110- 130) have been evolved through interspecifichybridisations involving Saccharum officinarum
L. and Saccharum spontaneum L. Only fewparental clones have been used in the originalcrosses and recent studies indicate a narrowgenetic base of the present day cultivars.Genetic improvement of this complex crop isprincipally through introgression of wild speciesand related genera, grouped under theSaccharum complex (Daniels et al., 1975).
Biotechnology Laboratory, Crop Improvement Division, Sugarcane Breeding Institute, Coimbatore.
310
Second National Plant Breeding Congress 2006 Plant Breeding in Post Genomics Era
The Saccharum complex constituted by fivegenera viz., Saccharum L., Erianthus SectRipidium Henrad, Sclerostachya A.Camus,Narenga Bor and Miscanthus Andress form aclosely related inbreeding group. Differentspecies of Saccharum include three cultivatedspecies viz., S. officinarum L., S. barberiJeswiet, S. sinense Roxb. and the wild speciesof S. spontaneum L., S. robustum Brandes andJeswiet ex Grassl and S. edule Hassk.
Different species of Saccharum areintercrossable and they are also crossable withother genera of Saccharum complex.Saccharum officinarum, the noble cane, is richin sucrose but poor in yield and also lacksadaptability to adverse environment. In contrastthe wild species are important sources forproductivity and adaptability though they lacksucrose. The progress in sugarcaneimprovement had been achieved by introgressingthe genes contributing high productivity andadaptability into the genetic background ofSaccharum officinarum.
Several interspecific and intergenerichybridisations involving Saccharum and othergenera had been carried out in the past (Bremer1961, Price, 1968a, Price 1968b, Li et al., 1948,Janakiammal, 1941). Selfing is common insugarcane crosses and it is particularly so ininterspecific and intergeneric combination. Asthe hybrids and selfs are similar in morphology(Gill and Grassl, 1986) it becomes difficult toidentify the genuine hybrids among the progeniesof such crosses. Molecular markers have beenfound to be useful in this context. Different typesof markers, like the 5S-rDNA spacers (D’Hontet al., 1995, Pan et al., 2001), AFLPs (Selviet al, 2006), RAPDs (Nair et al., 2004) andmicrosatellites (Pan et al., 2004) that are specificto individual species and genera of Saccharumcomplex have been developed for characterisingintergeneric and interspecific hybrids ofSaccharum. The present study was carried out
with the objective of developing microsatellitemarkers and to assess their suitability inidentifying intergeneric and interspecific hybridsof Saccharum.
Materials and methods
A set of intergeneric and interspecifichybrids from crosses involving S. officinarumX Erianthus, Erianthus X S. officinarum, S.robustum X Erianthus, Erianthus X S.robustum, Sclerostachya X S. officinarum,Sclerostachya X S. spontaneum, S. robustumX S. spontaneum formed the material for thestudy. The details of the hybrids and theirparentages are listed in Table 1.
DNA extraction and microsatelliteamplification
DNA was extracted from the youngleaves of the plants grown in field as per Walbotet al. (1988), and quantified on 0.8% agarosegels. Ten microsatellite primers developed fromgenomic libraries of sugarcane (Rossi et al.,2003) and five sorghum microsatellite primers(Brown et al., 1996) were used for the study(Table 2). PCR reactions were conducted ona PTC 100 programmable thermal cycler (MJResearch, Inc). Amplifications were carried outin a 15�l reaction mixture containing, 20 ngof DNA, 1.5 mM dNTPs, 10mM Tris- HCl (pH9.0 at 25°C), 1.5mM MgCl2, 50mM KCl, 0.01%gelatin, 10ng each of forward and reverseprimers, 1 unit of Taq DNA polymerase(Bangalore Genei) with an overlay of one dropof mineral oil. The thermal cycler wasprogrammed for initial denaturation of 94OC for5 min, followed by 30 cycles of 94OC for 1min,54OC for 1 min, 72OC for 1 min with a finalprimer extension at 720C for 5min. Five �l ofthe amplified product was loaded on a 5%polyacrylamide gel and electrophoresed in 1XTBE buffer at 150 V for 2 hrs. The gels weresilver stained (Sanguinetti et al., 1994) anddocumented in Syngene bio imaging using the
311
Second National Plant Breeding Congress 2006 Plant Breeding in Post Genomics Era
Gene snap software.
Identification of species and genusspecific markers
In cross combinations involving SaccharumX Erianthus and Saccharum X Sclerostachyathe Saccharum derivation of the progenies isnever in doubt, since all of them resembleSaccharum in gross morphology. The hybridsin these crosses have to be differentiated basedon the presence of Erianthus or Saccharumcharacteristics. Two sets of DNA bulks wereconstituted for initial screening of the two genus.Erianthus bulks was constituted by DNA fromfive clones of Erianthus spp while Saccharumbulks was constituted by DNA from five clonesof S. robustum and five clones of S.officinarum. The two sets of bulks werescreened with 10 Sugarcane and 5 Sorghummicrosatellite primers. Primers showing bulkspecific amplifications with respect to Erianthuswere further confirmed on individual DNAs thatconstituted the DNA bulks. Details of the primersused are listed in table 2. For identifyingSclerostachya specific markers initially two setsof DNA bulks were constituted. DNA from fiveclones of Sclerostachya formed the bulk DNAof the genus while DNA from two clones of S.officinarum and two clones of S. spontaneumformed the bulk DNA of Saccharum. TheseDNA bulks were amplified with 10 sugarcanemicrosatellite primers. Primers that amplifiedSclerostachya specific fragments in the bulkswere validated on the individuals that constitutedthe respective bulks.
Result and Discussion
Genus and species specific markers
To identify Erianthus specific markers threeDNA bulks were constituted with five individualseach of Erianthus, S. officinarum and S.robustum. Ten sugarcane microsatellite primersand five Sorghum microsatellite primers wereused to screen the bulks. Of the fifteen primers
used all of them amplified the S. officinarumand S. spontaneum bulks whereas only fourprimers Viz., Sb6-57, Sb6-84, MSSCIR43 andMSSCIR57 amplified the Erianthus bulks.Complex profiles were observed in theSaccharum bulks whereas Erianthus amplifiedlesser number of fragments. An average of 7.02and 7.20 fragments per primer was observedin S. officinarum and S. robustum whereasErianthus amplified an average of 1.75fragments per primer. Similar results wereobtained in earlier studies where EST derivedsugarcane and maize microsatellite primerswere found to amplify lesser number offragments, that too monomorphic, in Erianthuscompared to Saccharum (Cordeiro et al., 2001,Selvi et al., 2003). The bulk profiles of the twoSaccharum species were compared with theErianthus bulks to identify markers specific tothe genus. A single primer Sb6-84 amplified amarker of the size 140 bp that was present inErianthus and absent in the Saccharum bulks.The Erianthus specific marker was furthervalidated in the bulk individuals. The five clonesof Erianthus that were used to constitute thebulks showed the presence of the fragmentwhereas the Saccharum clones did not amplifythe marker confirming its specificity toErianthus (Fig.1). Several Erianthus specificmarkers have been identified using low andmedium copy repeat sequences (Besse andMcIntyre 1998), Satellite DNA sequence (Alixet al., 1998), 5S rDNA spacers (Besseet al .,1996, Piperidis et al., 2000), Inter-Alusequences (Alix et al., 1999), maizemicrosatellites (Selvi et al., 2003), RAPD andISSR markers (Nair et al., 2004) and AFLPmarkers (Selvi et al., 2006).
In order to identify markers specific to thegenus Sclerostachya ten sugarcanemicrosatellite primers were used to screen theDNA bulks of Scelrostachya, S. officinarumand S. spontaneum. Unlike in Erianthus allthe primers used showed amplifications in
312
Second National Plant Breeding Congress 2006 Plant Breeding in Post Genomics Era
Sclerostachya. The total number of fragmentsamplified in Sclerostachya was 52 with anaverage of 5.2 fragments per primer. S.officinarum and S. spontaneum amplified a totalof 63 and 51 fragments with an average of 6.3and 5.1 fragments per primer respectively.Among the related genera Sclerostachya,Narenga and Miscanthus are closely related toSaccharum and they form a monophyletic group(Sobral et al., 1994 and Nair et al., 1999).Erianthus is considered to be highly divergentfrom this group. This could explain for thecomplete cross transferability of sugarcanemicrosatellites in Sclerostachya, when comparedto 20% cross transferability in Erianthus.
Of the ten primers used to screen thebulks, a single primer MSSCIR-57 amplified afragment of 100 bp length that was specific toSclerostachya. In addition, the same primer alsoamplified a 50 bp fragment specific to bothSaccharum sp and absent in Sclerostachya.Validation of these markers on individuals thatconstituted the respective bulks showed that theyare specific to the respective genera.Identification of genus and species specificmarkers would greatly facilitate the identificationof interspecific and intergeneric hybrids andcould be effectively used in the introgression ofwild species in sugarcane improvement program.(Alix et al., 1999 and Nair et al., 2004).
Characterization of Intergeneric hybrids
Fifty putative intergeneric hybrids viz., 26 S.officinarum X Erianthus hybrids, 12 S.robustum X Erianthus hybrids, 3 Erianthus XS. officinarum hybrids and 9 Erianthus X S.robustum hybrids were screened along with theirrespective parents using the primer Sb6-84. Ofthe fifty putative hybrids, 46 hybrids amplifiedthe Erianthus specific fragment of 140 bp. Aset of eight Erianthus X S. robustum hybridsamplifying the Erianthus specific fragment isshown in Fig. 2. Four hybrids from the S.officinarum X Erianthus cross did not amplify
the Erianthus fragment and they could be selfs.In an early study of four Saccharum XErianthus hybrids using RAPD markers, it wasreported that no single primer can effectivelyidentify all the Saccharum X Erianthus hybrids(Nair et al., 2004). In the present study, it wasfound that a single microsatellite primer couldidentify 46 out of 50 suspected hybrids, and thiscould be used as a more efficient marker foridentifying intergeneric hybrids of Saccharum.
Intergeneric hybrids, one each fromSclerostachya X S. officinarum andSclerostachya X S. spontaneum crosses werescreened with sugarcane microsatellite primerMSSCIR 57 which showed Sclerostachyaspecific amplification in the bulk DNA. TheSclerostachya X S. officinarum hybrid wasmorphologically closer to sugarcane and henceits S. officinarum origin was not in doubt. Thishybrid amplified a Sclerostachya specificfragment of 100 bp and a 50 bp fragment of S.officinarum thus confirming its hybridity(Fig. 3). The progeny from Sclerostachya XS. officinarum cross, amplified a 50 bpfragment from S. spontaneum. Since S.spontaneum is the male parent in this crossthe presence of Saccharum specific fragmentin the hybrid confirmed its hybridity.
Characterisation of interspecific hybrids
Thirty interspecific hybrids developed froma cross between S. robustum and S.spontaneum (PIR 00 1188 X IND 99 904) werescreened with ten sugarcane microsatelliteprimer and two sorghum microsatellite primers(Sb1-10 and Sb6-84). The primer MSSCIR 66identified a 750 bp fragment in S. spontaneum(IND 99 904) and three fragments of 400 bp,350 bp and 250 bp in S. robustum (PIR 001188). Of the two sorghum microsatelliteprimers used Sb1-10 amplified a 700 bpfragment in S. spontaneum (IND 99 904) andfour fragments of sizes 500, 450, 400 and 300bp in S. robustum (PIR00 1188). Both these
313
Second National Plant Breeding Congress 2006 Plant Breeding in Post Genomics Era
primers were used to screen the thrity hybridsalong with the parents. Primer MSSCIR 66amplified the S. spontaneum specific fragment(750 bp) in 21 hybrids. Since S. robustum wasused as the female parent in the cross, thepresence of S. spontaneum (male parent)fragments in 21 progenies indicate that they aregenuine hybrids. The primer Sb1-10 amplifiedthe S. spontaneum specific fragment 700 bp)only in 9 clones and has less specificity. Panet al., (2004) used RAPD markers incharacterizing hybrids involving S. spontaneumand showed that 37.5% and 52.1% of theprogenies from two crosses inherited the S.spontaneum specific markers.
The present study reveals the potential useof microsatellite markers in the characterizationof intergeneric and interspecific hybrids ofSaccharum. These markers could identify 92%of the hybrids involving Erianthus, both thehybrids of Sclerostachya and 70% of the hybridsinvolving S. robustum X S. spontaneum.Evidently microsatellite markers can beeffectively used in monitoring the introgressionof wild species and related genera in sugarcaneimprovement.
Acknowledgements
This research was carried out with thefinancial support from the Department ofBiotechnology, Government of India, which isgratefully acknowledged. Thanks are due toDirector, Sugarcane Breeding Institute forproviding the facilities.
REFERENCES
Alix, K., Baurens, F.C., Paulet, F., Glaszmann,J.C. & D’Hont, A. 1998. Isolation andcharacterization of a satellite DNA familyin the Saccharum complex. Genome 41:854-864.
Alix, K., Paulet, F., Glaszmann, J.C., D’Hont,A. 1999. Inter-Alu like sequences inSaccharum complex. Theor Appl Genet.
99: 962-968.
Besse, P.M.c., Intyre, C.L., Berding, N. 1996.Ribosomal DNA variations in Erianthus, awild sugarcane relative (Andropogonae- Saccharinae). Theor Appl Genet. 92:733-743.
Besse, P.M.c., Intyre, C. L. 1998. Isolation andcharacterization of repeated DNA seque-nces from Erianthus spp. (Saccharinae :Andropogonae). Genome. 41: 408-416.
Bremer, G. 1961. Problems in breeding andcytology of sugarcane.II.The sugarcanebreeding from a cytological viewpoint.Euphytica. 10: 121-243.
Brown, S.M., Hopkins, M.S., Mitchell, S.E.,Senior, M.L.,Wang, T.Y., Duncan, R.R.,Gonzalez-Candelas, F., Kresovich, S. 1996.Multiple methods for the identification ofpolymorphic simple sequence repeats(SSRs) in sorghum [sorghum bicolor (L.)Moench]. Theor Appl Genet. 96: 190-198.
Cordeiro, G.M, Casu R, McIntyre C.L,Manners, J.M, Henry R.J. 2001.Microsatellite markers from sugarcane(Saccharum spp.) ESTs cross transferableto Erianthus and sorghum. Plant Science.160: 1115-1123
Daniels, J., Smith, P., Paton, N., Williams, C.A.1975. The origin of the genus Saccharum.Sugarcane Breed. Newsl. 36: 24-39
D’Hont ,A., Rao, P.S., Feldman, P., Grivet, L.,Islam-Faridi, N., Taylor, P. & Glaszmann,J.C. (1995). Identification andcharacterization of sugarcane intergenerichybrids, Saccharum officinarum XErianthus arundinaceus, with molecularmarkers and DNA in situ hybridization.Theor. Appl. Genet. 91: 320-326.
Gill, B.S., Grassl, C.O. 1986. Pathways ofgenetic transfer in intergeneric hybrids ofsugarcane. Sugar cane. 2-7
314
Second National Plant Breeding Congress 2006 Plant Breeding in Post Genomics Era
Janaki Ammal, E.K. 1941. Intergeneric hybridsof Saccharum. J. genet. 41: 217-253
Li H, W., Loh, C.S., Lee, C.L. 1948. Cytologicalstudies of sugarcane and its relatives. I.Hybrids between Saccharum offici narum,Miscanthus japonicus and Saccharumspontaneum. Bot. Bull.Acad.sin.(Taipei).2: 147-160.
Nair, N.V., Nair, S., Sreenivasan, T.V. & Mohan,M. 1999. Analysis of genetic diversity andphylogeny in Saccharum and related generausing RAPD markers. Genetic Resourcesand Crop Evolution. 46: 73-79.
Nair, N.V., Selvi, A., Sreenivasan, T.V.,Pushpalatha, K.N., Sheji Mary, 2004.Charecterization of intergeneric hybrids ofSaccharum using molecular markers.Genetic resourses and crop evolution. 1-7.
Pan, Y.B., Burner, D.M., Wei, Q. 2001.Developing species-specific DNA markersto assist in sugarcane breeding.Proc.int.soc.Sugar cane Technol. 24: 337-342
Pan Y.B, Burner D.M, Wei Q, Cordeiro G.M,Legendre B.L, Henry R.J. 2004. NewSaccharum hybrids in S.spontaneumcytoplasm developed through a combinationof conventional and molecular breedingapproaches. Plant Genetic Resources. 2:131-139.
Piperidis, G., Christopher, M.J., Carroll, B.J.,Berding, N., D’Hont, A. 2000. Molecularcontribution to selection of intergenerichybrids between sugarcane and the wildspecies Erianthus arundinaceus. Genome43: 1033-1037.
Price, S., 1968a. Chromosome transmission of
Saccharum robustum in interspecificcrosses. J.Hered. 59: 245-247.
Price, S., 1968 b. Cytology of Chinese andnorth Indian sugarcanes. Econ.Bot.22:155-164.
Rossi, P., Araujo, P.G., Paulet, F., Garsmeur,Dias, V.M., Chen, H., Van sluys, M.A.,D’Hont, A. 2003. Genomic distribution andcharecterization of EST-derived resistancegene analogs (RGAs) in sugarcane. MolGen Genomics. 269: 406-419
Sanguinetti, C.J., Dias Neto, E., Simpson, A.J.G.1994. Rapid silver staining and recoveryof PCR products separated onpolyacrylamide gels. Biotechniques.17:915-202.
Selvi ,A., Nair, N.V., Balasundaram, N.,ohapatra, T. 2003. Evaluation of maizemicrosatellite markers for genetic diversityanalysis and fingerprinting in sugarcane.Genome. 46: 394 - 403.
Selvi, A., Nair, N., Noyer, J.L., Singh, N.K.,Balasundaram, N., Bansal, K.C., Koundal,K.R. and Mohapatra, T. 2006. AFLPanalysis of the phenetic organization andgenetic diversity in the sugarcane complex,Saccharum and Erianthus. Geneticresources and crop evolution. In press.
Sobral, B.W.S., Braga, D.P.V., Lahood, E.S.,Keim, P. 1994. Phylogenetic analysis ofchloroplast restriction enzyme sitemutations in the Saccharinae Griseb.subtribe of the Andropogoneae Dumort.tribe. Theor. Appl. Genet. 87: 843-853.
Walbot, V.1988. Preparation of DNA fromsingle rice seedlings. Rice Genet.News.5:149-151
315
Second National Plant Breeding Congress 2006 Plant Breeding in Post Genomics Era
Table 1. Details of the Hybrids used in the study
Sugarcane Microsatellite primersMSSCIR 43 ATTCAACGATTTTCACGAGAACCTAGCAATTTACAAGAGMSSCIR 44 TCCCTCCTCATCACTCTGAAAATAAGCACCAAAAGCMSSCIR 50 GGTCCTCTACTTTGCTTTATGTCCAATGAGCCTAATCTATMSSCIR 57 CTTCTTCTTCTCCTGGTAATGATCGGTAATATAATGGCMSSCIR 58 CTCACTCAGGCACAAGAATTGGGGTCTAACAATCAACTMSSCIR 61 CCCCATTTCTCCGTTACCGCCACCACCAACCTCATCTCCMSSCIR 63 AGACCATGTTTGCTACGGTCACTAATCGGGAGAGACGMSSCIR 66 AGGTGATTTAGCAGCATACACAAATAAACCCAATGAMSSCIR 68 CGTCTCTATGCACCCTATCGCCTTCTTTTGTTTTCCTCMSSCIR 71 GATTGGATTTGTGATGTAACCTTCCTGATTTCTGATTSorghum microsatellite primersSb1-10 GTGCCGCTTTGCTCGCATGCTATGTTGTTTGCTTCTCCCTTCTCSb4 -32 CTCGGCGGTTAGCACAGTCACGCCCATAGACAGACAGCAAAGCCSb5-236 GCCAAGAGAAACACAAACAAAGCAATGTATTTAGGCAACAACACASb6-57 ACAGGGCTTTAGGGAAATCGCCATCACCGTCGGCATCTSb6-84 CGCTCTCGGGATGAATGATAACGGACCACTAACAAATGATT
Primer Name Sequences
Table 2. Details of the microsatellite primers used in the study
Intergeneric / Interspecific Parentage No of hybridsCrosses
S.robustum X Erianthus PIR 00 1188 X IK 76 91 12Erianthus X S.robustum IND 90 772 X PIR 98 937 4
IND 90 772 X PIR 00 1044 2IND 90 776X PIR 00 1044 2IND 90 776 X PIR 96 435 1
S.officinarum X Erianthus PIO 96 443 X ERI 2385 1PIO 98 297 X IK 76 91 1PIO98 1115 X IK 76 93 2PIO 96 436 X IK 76 91 7PIO 88 1715 X IMP 1547 1CoC 671 X IMP 1547 7Co 7201 X IK 76 91 2CoC 671 X IK 76 91 2Co 87009 X IK 76 48 1Gu 98 1640 X IK 76 91 1
Erianthus X S.officinarum IND 90 776 X PIO 96 435 1IND 90 828 X PIO 00 847 1
Sclerostachya X S.officinarum Sclerostachya X PIO 00 444 1Sclerostachya X S.spontaneum Sclerostachya X IND 99 904 1S.robustum X S.spontaneum PIR 00 1188 X IND 99 904 30
316
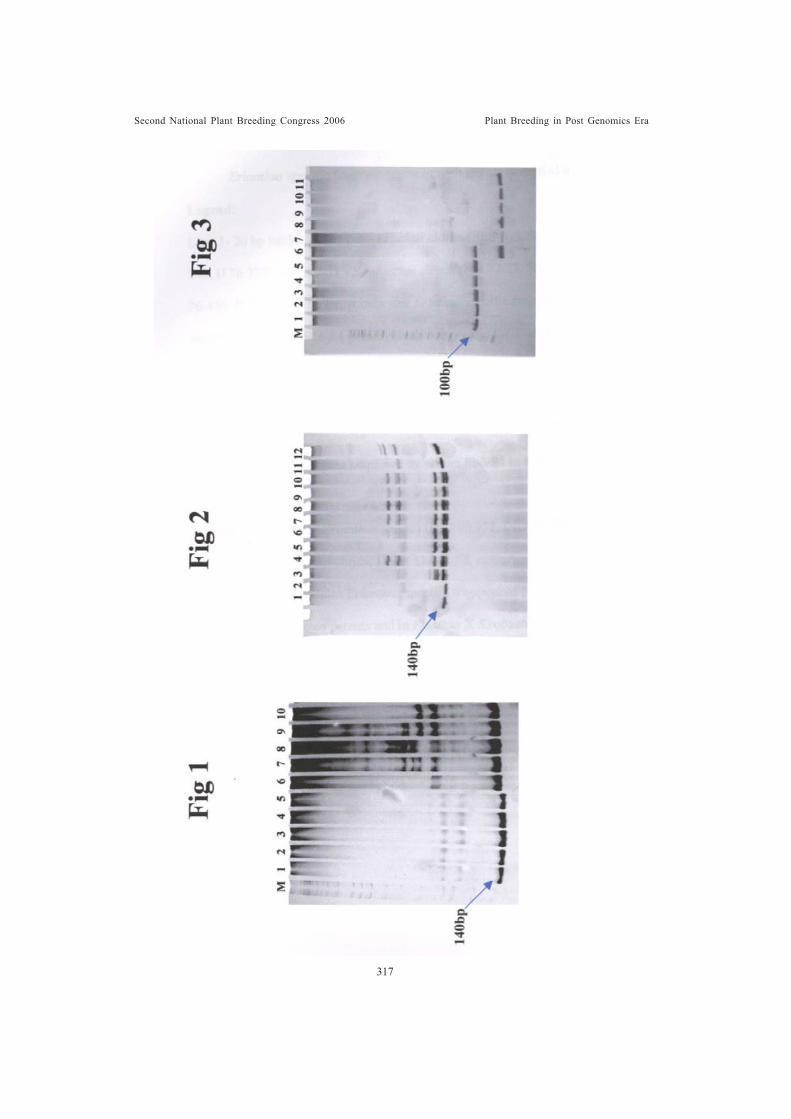
Second National Plant Breeding Congress 2006 Plant Breeding in Post Genomics Era
317
Second National Plant Breeding Congress 2006 Plant Breeding in Post Genomics Era
Figure :1Caption:Erianthus specific fragment (marked with arrow) amplified by Primer Sb6-84Legend:Lane 1- 20 bp ladder, Lanes 2-6 - Eriathus clones (SES 003, SES 228, SES 342, SES 240, IJ 76 327),Lanes 7-11 - S.robustum clones (NG 77-23, NG 77-24, NG 77-57, NG 76-436, IJ 76-414). The arrowindicates Eriathus specific fragment of 140bp size amplified by primer Sb6-84 in individualsconsituting the Erianthus bulk.
Figure:2Caption:Erianthus specific fragment amplified by primer Sb6-84 in 8 of the Eriathus X S. robustumhybridsLegends: Lanes 1&2 - Erianthus parents (IND 90 772, IND 90 776), Lanes 3-10 - Eriathus X S.robustum hybrids, Lanes 11&12 - S. robustum parents (PIR 98 937, PIR 00 1044). The arrowindicates Erianthus specific fragment of 140bp amplified by primer Sb6-84 in the Erianthusparents and in Eriathus X S.robustum hybrids.
Figure:3Caption:Sclerostachya specific fragment amplified by primer MSSCIR 57 in Sclerostachya and inSclerostachya X S.officinarum hybrid.Legends:Lanes 1-5 - Sclerostachya (Sclerostachya 1, Sclerostachya 2, Sclerostachya 3, IND 01 1100,IND 01 1096), Lane 6 - Sclerostachya X S. officinarum hybrid, Lane 7 - Sclerostachya X S.spontaneum hybrid, Lanes 8&9 - S.officinarum (PIO 00 444, Tofuna fal), Lanes 10&11- S.spontaneum (IND 99 904, IND 99 928). The arrow indicates Sclerostachya specific fragment of100bp amplified by primer MSSCIR 57 in Sclerostachya and Sclerostachya X S.officinarumhybrid
318
Second National Plant Breeding Congress 2006 Plant Breeding in Post Genomics Era
QTL PYRAMIDING FOR RICE ROOT MORPHOLOGICAL TRAITSAND ITS EFFECT ON GRAIN YIELD, ROOTS AND PLANT
CHARACTERS UNDER SUBMERGED, AEROBIC AND DROUGHTSITUATIONS
Shailaja Hittalmani, Grace Arul Selvi and Pavana J Hiremath
ABSTRACTIn this study, four QTLs were pyramided on 1, 2, 7 and 9 chromosomes. The 2 and 3
QTL pyramids were evaluated under aerobic and anaerobic conditions in the field andunder non-stress (well-watered) and stress (50% FC) conditions. Under each of the location,the pyramids showed significant increase in root length, root volume, root thickness, plantheight over IR64 (female parent of the introgression line) but showed lower performancethan Azucena (donor for QTL for all these traits). There is a significant delay in floweringin the pyramids under submerged conditions with significant increase in grain yield. Thereis also a significant increase in root length and thickness under low moisture stress in thepyramids and varying levels of effect on grain yield per plant. The 3 QTL pyramid in apreliminary investigation with single plant performance showed no significant change infield performance in grain yield. However, the plants are high tillering, with less numberof panicles and are late in maturity.
The results indicated a variety of interaction effects between the QTLs that have beenpyramided. The increase in plant height, tiller number, number of panicles per plant withno increase in dry matter accumulation indicated the partitioning of the biomass towardsthe below ground parts.
The mRNAs of a QTL introgression line upon stress induction were cloned and sequencedbetween the flanking markers. The sequences indicated that the region harbour a host ofgenes that confer drought tolerance and disease resistance. Some genes are unique tocertain QTL regions, while some are present in more than one QTL regions. Importantgenes identified in the QTL regions are C-Repeat Binding Factors, MYB transcriptionfactors, expansins, dehydrins, protein kinases, S-adenosyl methyl synthetase, auxinresponsive proteins, 14-3-3 proteins, osmotins and water stress induced WS118 proteins.The method of RNA differential display was also done to identify the genes though thegenomics approach. Initial analyses confirm the genes identified through the in silicoanalyses. The genes identified include di-acyl glycerol kinase, calcium dependant phospho-kinase and a host of hypothetical proteins. QTL specific genes have been identified.
University of Agricultural Science, Gandhi Krishi Vigyan Kendra, Bangalore - 560 065
319
Second National Plant Breeding Congress 2006 Plant Breeding in Post Genomics Era
TRACING QUANTITATIVE TRAIT LOCI - THE BEST AND REST WITHREFERENCE TO BROWN PLANT HOPPER RESISTANCE AND
NITROGEN UPTAKE IN RICEMaheswaran,M., S Geethanjali, K K Vinod, P Meenakshisundaram, T Elaiyabharathi,P Kadirvel,
S. Senthilvel, P. Govindaraj, S .Arumugachamy, P. Shanmugasundaram, P. Malarvizhi andK .Gunathilagaraj
ABSTRACT
In plants, next to Arabidopsis, rice remains as a model plant for many of the molecularbiological studies. The wealth of information generated from these two model plants isenormous. Tracing quantitative trait loci (QTLs) governing several complex traits wasachieved with the availability of saturated genetic maps of DNA markers in rice. Theinitial work on QTL mapping for resistance to brown planthopper (BPH) and nitrogenuptake involving the doubled haploid population of IR64/Azucena resulted in the detectionof several genomic regions associated with these complex traits. Based on the success wehad with IR64/Azucena population, a mapping population of recombinant inbred lines(RILs) involving Basamti370 (more towards japonica) and ASD16 (indica) was developed.A total of 247 RILs (F9) was subject to phenotyping to assess the level resistance to BPH,grain yield and nitrogen uptake. All the screening experiments to assess the level of resistanceto BPH were conducted under greenhouse conditions. The phenotyping for various agronomictraits, grain yield, biomass and nitrogen uptake was carried out under field conditionswith two different nitrogen regimes. The ongoing genetic map construction involving the247 RILs of Basmati370/ASD16 using the available simple sequence repeat loci gaveclear indication that a saturated genetic map could be possible very soon. Our attempts toestablish ways and means to understand the variation for various component and correlatedparameters with resistance to BPH and nitrogen uptake indicated that a better resolution isneeded in understanding the biology of phenotypic parameters. We are in the process ofapplying various genomic tools to associate the components of phenotype with specificgenotypes. The population of RILs available with us is with enormous variation for manyof the yield and yield components, resistance to planthoppers and grain quality parameters.These homozygous lines are available for field evaluation by the rice breeders.
Tamil Nadu Agricultural University, Coimbatore - 641 003
320
Second National Plant Breeding Congress 2006 Plant Breeding in Post Genomics Era
SECOND NATIONAL PLANT BREEDING CONGRESS
PLANT BREEDING IN POST GENOMICS ERA
Thursday 2, March 2006
Technical Session I – Evaluation and utilization of Crop Biodiversity
Chair : Dr. H.D. Upadhyaya
Co-Chair : Dr. M. Kadambavanasundaram
Rapporteurs : Dr. J.R.Kannan Bapu
Dr. S. Ganesh Ram
One lead paper and six oral presentations were made during the technical session one.
Dr. H.D. Upadhyaya from ICRISAT in his lead paper entitled “Enhanced utilization of genetic
resources in crop improvement” stressed the importance of germplasm conservation and utilization
for all the crop plants. The International germplasm collections are very huge and the numbers are
intimidating at the utilization point of view. Hence, he stressed the need for making core collections
which should represent maximum diversity of the base collection. He also emphasized the need
for mini core collections when the number in the core collection exceeds thousand. He presented
the details of mini core collections made by his group in crops like Groundnut, Pearl Millet, Chickpea
and Pigeonpea. He also highlighted the use of molecular markers such as SSRs in germplasm
characterization.
In the first oral presentation by Dr. M. Subramaniam on “Biodiversity in Rice” many
useful information on the collection and conservation of germplasm at the National and International
level was presented. He also touched upon the utilization on wild species for various novel characters
like vertical resistance to several diseases and pests, early maturity, photo period insensitivity,
drought resistance and tolerance to certain adverse soil conditions into cultivated rice. He
emphasized to bestow more efforts in continuing the good work of conservation of particularly
land races for enhancing biodiversity in rice.
In the second oral paper Dr. A. Santa Ram from Central Coffee Research Institute
presented how wild species of coffee can be utilized for transferring durable resistance to leaf rust
caused by Hemileia vastatrix. The cultivated species Coffea arabica which is a tetraploid is
susceptible to this disease but the diploid species are resistant. The authors have developed many
321
Second National Plant Breeding Congress 2006 Plant Breeding in Post Genomics Era
arabicoids using species like C. liberica possessing many resistant genes. Many selections with
desirable attributes have been made by this group with durable resistance and will be useful for
crop improvement in coffee.
The third oral presentation was made by Dr. Santha V. Pillai from Central Tuber Crops
Research Institute, Trivandrum. Their group had collected 1600 germplasm accession of cassava,
consisting of both indigenous and exotic lines. They have isolated Cassava Mosaic Disease tolerant
accessions and characterized them for morphological and biochemical characters. They have
identified high tuber yielding accessions with high amylose as well as with high amylopectine
content for various purposes. These lines were also test verified for their agronomic suitability in
the farmers field.
Ms. S. Preetha, Ph.D. scholar from Centre for Plant Breeding and Genetics, Tamil Nadu
Agricultural University, Coimbatore described the “Characterization of cotton (Gossypium
hirsutum) genotypes and evaluation of genetic divergence”. In this study, she grouped 150 genotypes
into three morpho types in cotton viz., robust, semi-compact and compact types of Gossypium
hirsutum and studied each group for yield components and quality attributes. Based on the
Mahalanobis D2 analysis, the 150 accessions could be grouped into robust, semi-compact and
compact with 67, 66 and 17 accessions respectively. Breeding implications of different plant types
were highlighted.
Dr. P. Govindaraj, Sugarcane Breeding Institute on “Interfamily variation and family selection
in intervarietal crosses in sugarcane under excess water stress conditions”. Based on his study
involving eight families of intervarietal crosses using biometrical estmates, suggested early generation
family selection followed by individual plant selection would improve efficiency of selection.
Dr. P. Chandrasekaran narrated the development of high yielding rice varieties suitable
for Kerala using the land races Thavalakannan. He stressed the importance of transferring high
grain number per panical from land races for developing high yielding varieties in rice.
322
Second National Plant Breeding Congress 2006 Plant Breeding in Post Genomics Era
Recommendations
1. It is high time to strengthen germplasm collections and characterize them all in the crops.
Different centres may be identified for explorations and characterization. Funding may be
provided by ICAR for the identified centres.
2. A separate Department of Plant Genetic resources has to be established in all the SAUs.
3. Free exchange of core and mini core collections from CGIAR network to ICAR institutes
and SAUs may be promoted.
4. All the available germplasm accessions have to be characterized for novel traits to promote
their utility in crop improvement.
Technical Session II – Quantitative Genetics and analysis of genotype x environment interaction
Chair : Dr. V. Arunachalam
Co-Chair : Dr. M. Stephen Durairaj
Rapporteurs : Dr. N. Nadarajan
Dr. S. Arumugachamy
The chairman Dr. V. Arunachalam initiated the proceedings with his lead paper on “
Quantitative Genetics – where are we today?”. With anguish he expressed that quantitative
genetics is becoming a vanishing field. He highlighted the salient aspects of Mendelian genetics,
quantitative genetics and molecular genetics. The lead paper was followed by seven oral
presentations one each on coconut, blackgram, rice, cotton, maize and sugarcane. Five papers
dealt with the inheritance and gene action and two were on variability analysis.
The following are the recommendations emerged out of the session discussions.
1. Introduction of basic statistics, probability and elements of mathematics as full paper in
undergraduate lower level is a must in view of recent development of science such as
bioinformatics.
2. Elevation of the subject considerably during undergraduate higher level with introduction
of quantitative genetics as full paper.
323
Second National Plant Breeding Congress 2006 Plant Breeding in Post Genomics Era
3. Elevation of the subject on quantitative genetics to higher level with new analytical tools
and field oriented practical examples as full paper at M.Sc. level.
4. Enlist the experts on quantitative genetics across institutions, to teach and interact with
the students. Modern teaching aids like teleconferencing may be utilized purposefully,
with sufficient allocation of funds
5. Open evaluation of students performance
6. Encouraging teachers to move across institutions for capacity building.
7. New analytical methods should be justified by sufficient theories.
8. Mendelian, molecular and participatory approaches should be integrated in Plant breeding
process to realize better results from crop improvement programs.
Technical Session III Utilization of ploidy breeding in crop improvement
Chair : Dr. Dalmir Singh
Co-Chair : Dr. P. Vaidyanathan
Rapporteurs : Dr. A. Gopalan
Dr. M. Kumar
The subject of erstwhile interest cytogenetics, its utilization in improving the crop
productivity had been discussed during this session mostly by the emerging scientists which
leaves a hope of this grey area of science to come back in picture. The lead speaker Dr. Amala
Joseph Prabakaran, Senior Scientist, IARI – RS, Wellington focussed on the utilization of wild
relatives of Sunflower, creation of alien lines having the wild genome, pre breeding programmes
being undertaken and its extension to other crops. He suggested altering the ploidy utilizing the
colchiploid route and generation of dihaploids as probable methods to achieve to objectives.
The other two lead presentations were on the creation and utilization of higher ploids in
wheat and cotton and the utilization of wild species in introgression programme. There was a
total of six oral presentations of one paper each in safflower, coffee, sugarcane and wide crosses
in Vigna sp. and two in cotton.
General recommendations:
1. Identification of a School of Cytogenetics to retouch the science to exploit the rich gene
pool for the benefit of farming.
324
Second National Plant Breeding Congress 2006 Plant Breeding in Post Genomics Era
2. Utilization of molecular cytogenetics to understand the present day biotechnological
concepts.
3. Conservation of wild species in the crops of interest and establishing the series of aneuploids
in the field crops at the identified centres.
4. Amalgamation of the field of cytogenetics with the tissue culture in the identified centres
to focus on the post fertilization barriers in wide hybridization attempts and for the rescue
of embryos.
5. Extending provisions for employing retired cytogeneticists in the academic programmes.
Technical Session IV – Hybrid Breeding in Crops
Chair : Dr. S.R. Sree Rangasamy
Co-Chair : Dr. N. Balasundaram
Rapporteurs : Dr.V.Muralidharan
Dr.R.Ravikesavan
The first lead paper was presented by Dr.S.S. Narayanan, J.K. Agri Genetics Limited,
Hyderabad on transgene technology in cotton. He explained the advantages of transgenic hybrid
cotton in enhancing the yield and effective bollworm control. The second lead paper by Dr.S.R.
Sree Rangasamy, presented a paper on the expression of brix in tomato inter varietal hybrids. He
expressed that brix showed a continuous variation in tomato. He elucidated the different kinds of
gene action governing brix in the inter-varetial hybrids.
The lead papers were followed by four oral presentations on the development of male
sterile lines having resistance to wilt in castor, identification of inbreds and restorers in sunflower,
identification of restorer in rice for O.perennis cytoplasm and the performance of CMS based
hybrids in chillies in comparison with normal cytoplasm.
The following are the recommendations emerged out of session discussions
1. Transgenic cotton technology should be extended to varieties also along with hybrids.
Transgenics in varieties of G.barbadense need to be also developed for getting extra long
staple varieties.
2. Public Institutions should be more active in the transgene technology.
3. Public Institutes should concentrate more on basic research including new gene identification
and functional analysis.
325
Second National Plant Breeding Congress 2006 Plant Breeding in Post Genomics Era
4. There should be an effective linkage between National Institutes, SAUs and private
sector.
5. Active genetic enhancement of parental lines is advocated to develop value added hybrids
in field and vegetable crops.
Technical Session V -In vitro breeding tools in genetic enhancement of crops
Chair : Dr.K.Veluthambi
Co-Chair : Dr.Ajay Parida
Rapporteurs : Dr. M.Maheswaran
Dr.R.Gnanam
Dr. Veluthambi presented the lead paper on combined expression of chitinase and 1-3-
glucanase in rice resulting in enhanced level of resistance to sheath blight. The molecular analysis
to detect single event homozygous lines presented by him should be very helpful in detecting right
transgenics and their utility in crop breeding. Dr. Ajay Parida reported the cloning of a number of
useful genes from the mangrove plant, Avicennia. The genes can be used by other groups toengineer crop plant for achieving drought and salt tolerance. The ferritin gene that he has clonedcan be introduced into crop plants in various bio-fortification programmes.
Ms. N. Sandyarani has standardized the protocol for multiple shoot production in pigeonpea. She found that cotyledonary nodes with cotyledons as suitable explants. Josna Mol Kurianused leaf explants for callus induction and established both organogenesis and somaticembryogenesis in pigeon pea. Both these works should be helpful for transformation in pigeonpea. Dr.N. Kumaravadivel used immature inflorescences and young leaves of sorghum for callusinduction. The regeneration of plantlets was possible from the calli of both inflorescence andleaf. The regenerants exhibited variations for many agronomic traits indicating the possibilities ofusing them in sorghum breeding. Dr.T.Rajesh presented the details of pyramiding genes involvingtransgenics. Using the transgenics of ASD16 for Xa21, tlp and gna were used for crossing,
plants with Xa21+ gna and tlp + gna could be developed. Isolating homozygous progenies for
both the combinations of genes will have value in rice breeding.
The following are the general recommendations emanating from the discussions.
� Suitable in vitro regeneration protocols with quantitative data should be established and
the established protocols should be validated for routine adoptation by the scientists.
326
Second National Plant Breeding Congress 2006 Plant Breeding in Post Genomics Era
� When the genes to be introduced in crop systems for specific traits are made available,
their positive and negative effects should also be indicated.
� Wherever possible, the genetic analysis of transgenics should be done using a large
segregating population and association of transgenes with phenotypes should be established.
Technical Session VI – Contributions of genomic tools to crop improvement
Chair : Dr. K. K. Jena
Co-Chair : Dr. P. Shanmuga sundaram
Rapporteurs : Dr. S. Robin
Dr. Soframanian
The session had one lead paper presented by Dr. K.K. Jena on molecular breeding for BPH
and blast resistance in rice followed by seven oral presentations. The oral presentations had a
wide coverage of crops, objectives and approaches. Two papers were presented on rice molecular
breeding, two on diversity and interspecific hybrid identification in sugarcane, one each on diversity
among mulberry species studied through DNA markers, molecular tagging fertility restoration
gene in cotton and development of DNA markers linked to cytolplasmic genic male sterility in
pigeon pea. All the oral presentations generated in-depth discussions on the papers and the following
recommendations crystallized at the end.
The marker assisted breeding for resistance against major biotic and abiotic stress can be
achieved with more precision if the information generated through structural genomics
can be well complimented with the on-line database information available in the public
domain.
The transition from linked markers to gene based markers with respect to major agronomic
traits will hasten up the advantages aimed through marker assisted breeding.
There should not be any compromise on the phenotyping as this forms the most significant
basis for mapping, validating and applying the results obtained through QTL analysis.
Molecular tagging of traits should be taken up with repeatable markers.
327
Second National Plant Breeding Congress 2006 Plant Breeding in Post Genomics Era
Marker diversity analysis for predicting the genetic gain from the hybridization may be a
forward step while dealing with crops with germplasm of narrow genetic basis.
The validation of QTLs or genes through candidate gene analysis should be perused by
utilizing the bioinformatics tools available. The markers identified through fine characterization of traits such as BPH and blast
resistance in rice, fertility restoration in cotton and CGMS in pigeon should be furthervalidated in the breeders’ populations with broad genetic base.
To maximize the benefits out of biotechnological tools, a synergy with the basic knowledge
of genetics and applied breeding programmes should be encouraged.
328
Second National Plant Breeding Congress 2006 Plant Breeding in Post Genomics Era
VARIOUS COMMITTEES
Organizing Committee
Chairman
Dr. T.S. Raveendran
Secretary
Dr. N. Sivasamy
Members
Dr. M. RangasamyDr. C. SurendranDr. P. VaidyanathanDr. N.M. RamasamyDr. N. BalasundaramDr. AR. MuthiahDr. K. ThiyagarajanDr. S. RajarathinamDr. J.R. Kannan BapuDr. M. MaheswaranDr. M. KumarDr. S. Ganeshram
Finance Committee
Convenor
Dr. AR. Muthiah
Members
Dr. A. GopalanDr. P. ShanmugasundaramDr. S. ManonmaniDr. S. SivakumarDr. P. Amala Balu
Programme Committee
Convenor
Dr. M. MaheswaranMembers
Dr. M. KumarDr. S. ArumugachamyDr. P. GovindarajDr. K.K. VinodMrs. S. GeethanjaliDr. V. Thiruvengedam
Accommodation and TransportCommittee
Convenor
Dr. K. Thiyagarajan
Members
Dr. S. RajarathinamDr. G. VijayakumarDr. P. NagarajanDr. K. GaneshamoorthyDr. R. RavikesavanDr. N. Manivannan
Food Committee
Convenor
Dr. V. Muralidharan
Members
Dr. K. MohanasundaramDr. P. VeerabadhiranDr. N. KumaravadivelDr. K. Iyanar
329
Second National Plant Breeding Congress 2006 Plant Breeding in Post Genomics Era
Registration and Reception Committee
Convenor
Dr. B. SubbalakshmiMembers
Dr. A. KalamaniDr. B. SelviDr. A. NirmalakumariDr. T. KalaimagalDr. S. RajeswariMr. D. Arunprabhu
Media and Publicity Committee
Convenor
Dr. A. John Joel
Members
Dr. C. BabuDr. M. VaithilingamMrs. B. Meenakumari
Publication Committee
Convenor
Dr. J.R. Kannan Bapu
Members
Dr. M. ParamathmaDr. R. GnanamDr. S. GaneshramDr. M. ShanmuganathanMr. K. SundaravelpandianMr. P. Senguttuvel
Poster Session Committee
Convenor
Dr. L.D. Vijendra Das
Members
Dr. S. RobinDr. J. RamalingamDr. P. Sumathi
Editorial Committee
Convenor
Dr. T.S. Raveendran
Members
Dr. S.R. Sree RangasamyDr. M. KadambavanasundaramDr. N. NadarajanDr. P. Vindhiya varmanDr. P.SumathiDr. J.R.Kannan BapuDr. S.Ganesh RamDr. M.KumarDr. K.K.Vinod
330
Second National Plant Breeding Congress 2006 Plant Breeding in Post Genomics Era
1. M/s. Nuziveedu Seeds Ltd.
183, Kompally
Quthbullapur Mandal
Secunderabad – 500 014
2. M/s. Krishidhan Seeds Ltd.
Bhokardan Road
Ghanewadi
Jalna, Maharashtra
3. M/s. JK Agri Genetics Ltd.
1-10-177, 4th Floor,
Varun Towers
Begumpet,
Hyderabad – 500 016
4. M/s. Rasi Seeds (P) Ltd.
273, Kamarajanar Road
Attur, Salem – 636 102
5. M/s. Ajeet Seeds Ltd.
2nd Floor, Tapadia Terracos
Adalat Road
Aurangabad – 431 001
6. M/s. Sri Sai Scientific Company
K.M. & Sons Complex
38, Maruthamalai Main Road
P.N. Pudur,
Coimbatore – 41
7. M/s. Balaji Paper Stores
Unit No.58 SIDCO
Industrial Estate
Kurichi
Coimbatore – 21.
8. Pelican Instruments
Private Limited
2nd Floor, # 38 Burkit Road
T.Nagar,
Chennai – 600 017.
9. Idhayam Food Products
Viruthunagar.
LIST OF SPONSORS
The society thank the above contributors
331

Second National Plant Breeding Congress 2006 Plant Breeding in Post Genomics Era
Ms. Aananthi M. Student, CPBG, TNAU, Coimbatore.Mr. Abdel Mahmoud Osman, Student, CPBG, TNAU, Coimbatore.Ms. Abirami S. Senior Research Fellow, Department of Rice,CPBG, TNAU, Coimbatore.Dr. Ajay Parida M. SSRF, Chennai.Ms. Akila T. PG Student, 108c, Ashok Nagar, Chennai.Dr. Alarmelu S. Sr.Scientist, Sugarcane Breeding Institute, Coimbatore.Dr. Amala Balu P. Associate Professor, Department of Cotton, CPBG, TNAU, Coimbatore.Dr. Amala J. Prabhakaran, Sr. Scientist, Indian Agricultural Research Institute, Wellington.Dr. Amudha J. Scientist(Biotechnology), Central Institute for Cotton Research, Nagpur.Ms. Amudha K. Ph.D. Scholar, 5A, Thendral Nagar, Coimbatore.Mr. Anand, M. Student, HC & RI, Coimbatore.Dr. Anantharaju P. Senior Research Fellow, CPBG, TNAU, Coimbatore.Ms. Anbumalarmathi J. Student, Department of Plant Breeding and Genetics, Madurai.Dr. Anil Sirohi, Associate Professor, Dept. of GPB, SVBP Univ Agrl & Tech., Meerut – 250110 (UP).Dr. Anup Kumar Misra, Scientist, National Reseach Centre on Rapeseed Mustard.Dr. Anirban Maji, Research scholarbidhan chandra krishi viswavidyalaya, Nadia.Dr. Arumugachamy S. Associate Professor, Department of Millets, TNAU, Coimbatore.Ms. Arulselvi S. Ph.D. Scholar, CPBG, TNAU, Coimbatore.Dr. Arunachalam V. MSSRF, Taramani, Chennai.Dr. Arun Kant Holkar, Professor, JNKVV, Jabalpur, Indore.Mr. Arun Prabhu D. Ph.D. Scholar, CPBG, TNAU, Coimbatore.Dr. Arvindbhai Desaibhai Patel, Assoc.Res.Scientist, Main Veg.Res.Station, Anand Agrl. Univ., Anand.Dr. Arutchenthil, Assistant Professor, ADAC & RI, Trichy.Mr. Asish K. Binodh, Ph.D. Scholar, CPBG, TNAU, Coimbatore.Mr. Ashok Kumar K. Student, CPBG, TNAU, Coimbatore.Ms. Aslin Joshi J. Student, CPBG, TNAU, Coimbatore.Dr. Asish Patel, Syngenta India Limited.Dr. Babu C. Associate Professor, Department of Forage Crops, Coimbatore.Dr. Asokan G. Associate Professor (Entomology), ARS, Bhavanisagar.Dr. Bala Ravi, MSSRF, Taramani, Chennai.Dr. Babu Shareef, Senior Plant Breeder, UPASI - Tea Research Instiutte, Valparai.Dr. Balasundaram N. Sugarcane Breeding Institute, Coimbatore.Dr. Balasaraswathi R. Professor, TNAU, Coimbatore.Mr. Baskaran D. Student, CPBG, TNAU, Coimbatore.Dr. Banumathy S. Asst. Professor (PB&G), Rice Research Station, Thiruvallur.Dr. Bhagyalakshmi K.V. Principal Scientist (Breeding), Sugarcane Breeding Institute, Coimbatore.Dr. Bentur J.S. Principal Scientist, Directorate of Rice Research, Hyderabad.Dr. Biju Sidharthan, Research Associate, Department of Rice, Coimbatore.Ms. Bharathi A. Ph.D. Scholar, CPBG, Coimbatore.Dr. Chandra Gupta, Senior Scientist, Sugarcane Breeding Institute, Coimbatore.Dr. Chandirakala R. Teaching Assistant (PBG), TamilNadu Rice Research Institute, Aduthurai.Ms. Chitra K. Student, CPBG, TNAU, Coimbatore.Dr. Chandrasekharan P. Former Dean (Retd.), PB&G Kothaneth House, CRD Menon Colony, Palakkad.Ms. CHITRA S. Ph.D. Scholar, Agricultural College and Research Institute, Madurai.Dr. Dalmir Singh, IARI, New Delhi.Ms. Dhanalakshmi, Student, TNAU, Coimbatore.Mr. Devaraja Achar A.M. Ph.D. student, PG hostel, Univercity of Agricultural Sciences, Bangalore.Ms. Doncia, Student, CPBG, TNAU, Coimbatore.Dr. Dhananjaya M.V. Scientist (Sr. scale), Division of Ornamental Crops, Hessarghatta lake, Bangalore.Mr. Eradasappa E. Student, UAS, Bangalore.Dr. Elangovan M. Scientist (Senior Scale), National Research Centre for Sorghum, Hyderabad.Mr. Ganapathy S. Student, Department of Plant Breeding and Genetics, AC & RI Maduari.Mr. Ezhil maran K. Senior Research Fellow, Department of Plant Breeding and Genetics, Karaikal.Dr. Ganesan K.N. Assistant Professor (PB&G), Agricultural Research Station, TNAU, Erode.
LIST OF REGISTERED PARTICIPANTS
332
Second National Plant Breeding Congress 2006 Plant Breeding in Post Genomics Era
Dr. Ganesamurthy K. Associate Professor, Department of Millets, Coimbatore.Dr. Gangappa E. Associate Professor, UAS, Bangalore.Dr. Ganesh Ram S. Associate Professor, Centre for Plant Breeding and Genetics, Coimbatore.Dr. Geetha S. Associate Professor (PB&G), ADAC&RI, Trichy.Ms. Gayathri S. Student, HC&RI, Coimbatore.Dr. Gupta, P.K. CSAUA & T, Kanpur .Ms. Geethanjali S. Student, CPBG, TNAU, Coimbatore.Dr. Gnanam R. Professor, CPMB, TNAU, Coimbatore.Dr. Gireesh T. Scientist S2, Division of Botany, Rubber Research Institute of India, Kottayam – 9, Kerala.Mr. Gnanasekaran M. Ph.D. Scholar, Department of PB&G AC&RI, Madurai.Dr. Gnanamalar R.P. Assistant Professor, AC &RI, Madurai.Dr. Gokulakrishnan J. Lecturer, GPB, Faculty of Agrl., Annamalai University, Annamalai Nagar – 608 002.Ms. Gnanasoundari A. SRF, Dept. of Millets, CPBG, TNAU, Coimbotore.Mr. Govindaraj M. Student, Centre for Plant Breeding and Genetics, Coimbotore.Dr. Gopalan A. Professor, Department of Forage Crops, Coimbatore.Dr. Govindaraj P. Senior Scientist (Plant Breeding), Sugarcane Breeding Institute,Coimbatore.Dr. Gowri M. Sajjanar, Assistant Breeder (Sorghum), Regional Agricultural Research Station.Dr. Gunasekaran M. Assistant Professor, Dept. of Plant Breeding and Genetics, Madurai.Dr. Gupta C. Rubber Research Institute, Orissa.Dr. Gupta R.R. Professor cum CPO, Department of Genetics and Plant Breeding, Kanpur.Mr. Hari Ramakrishnan, S Ph.D. Scholar, Centre for Plant Breeding and Genetics, Coimbatore.Dr. Haribhai Ramsangbhai Kher, Associate Research Scientist, Anand Agricultural University, Anand.Dr. Hemalatha P. Assistant Professor (Bio Technology), TamilNadu Rice Research Institute, Aduthurai.Dr. Hemant Kumar Yadav, Senior Research Fellow, National Botanical Research Institite, Lucknow.Dr. Hemaprabha G. Senior Scientist (Breeding), Sugarcane Breeding Institute, Coimbatore.Smt Hima Bindu K. Scientist (SS), Indian Institute of Horticultural Research, Bangalore.Mr. Ilavarasu S. Managing Director, Selvam Seeds (P) Ltd, P.B. No. 29 Attur.Mr. Immanuel Selavaraj, PhD Scholar,CPBG, TNAU, Coimbatore.Ms. IndhuBala M. Student, CPBG, TNAU, Coimbatore.Ms. Indumathi T. Student, 5/147 A, Cuddalore Main Road (Opp. toRRS), VirudhachalamDr. Immanuel Selvaraj C. Student, TNAU, Coimbatore.Dr. Iyanar K. Assistant Professor, Department of Cotton, Coimbatore.Dr. Jagadeesan S. Research Associate, Department of Cotton, Coimbatore.Mr. Jathish P. Student, University of Agricultural Sciences, Bangalore.Ms. Jayashree P. PG Student, TNAU, Coimbatore.Dr. Jebaraj S. Dean, ADAC&RI, Trichy.Dr. Jethabhai Ambalal Patel, Associate Research Scientist, Anand Agricultural University, Anand.Dr. Jeyaprakash P. Assistant professor, Agricultural Research Station, Paramakudi.Dr. Jiji Joseph Assistant Professor ,Regional Agricultural Research Station, Palakkad.Dr. John Joel. A. Asociate Professor, Tamil Nadu Agricultural University, Coimbatore.Ms. Josnamol Kurian. Student, Centre for Plant Molecular Biology, Coimbatore.Dr. Juliet Hepziba S. Assistant Professor, AC & RI, Madurai.Dr. Kadambavanasundaram M. Professor (Retd.), CPBG, TNAU, Coimbatore.Dr. Kadirvel P . Scientist, Barwale Foundation Jalna, Maharastra.Dr. Kalaimagal T. Associate Professor, Department of Pulses, Coimbatore.Dr. Kalaiyarasi R. Assistant Professor, TNAU, Tiruvallur.Mr. Kalmeshwer Gouda Patil, Ph.D. Student, Department of Genetics and Plant Breeding, Bangalore.Dr. Kammili Anjani, Senior Scientist, Directorate of Oilseeds Research, Hyderabad.Mr. Kanala Basha, Research Scholar, Sri Krishnadevaraya University, Ananthapur.Ms. KanchanaraniPhD, Student, Centre for Plant Breeding and Genetics, Coimbatore.Dr. Kandasamy G Professor (Retd.), CPBG, TNAU, Coimbatore .Dr. Kannan Bapu J.R. Professor (Genetics) ,Centre for Plant Breeding and Genetics, Coimbatore.Mr. Kannan S. PG Student, Centre for Plant Breeding and Genetics, Coimbatore.Dr. Kanti Kumar Pradhan Professor, Dept.of Genetics, Bidhan Chandra Krishi Viswavidyalaya, Nadia.Ms. Karthika R. SRF, Department of Oilseeds, Coimbatore.
333
Second National Plant Breeding Congress 2006 Plant Breeding in Post Genomics Era
Dr. Khadi B, MCICR, Nagpur.Mr. Kingshuk Poddar, Final Year MSc Student University of Agricultural Sciences Bangalore.Ms. Kota Suneetha Student, Directorate of Rice Research, Hyderabad.Dr. Krishnan V. ASSISTANT PROFESSOR, Plant Breeding, PAJANCOA & RI, Karaikal.Dr. Kshirod K. Jena Senior Scientist (Plant Breeding), International Rice Research, Institute.Dr. Kulkarni R. SUAS, GKVK, Bangalore.Dr. Kumar M. Associate Professor, CPBG, Tamil Nadu Agricultural University, Coimbatore.Mr. Kumarakurubaran, Student, CPBG, TNAU, Coimbatore.Dr. Kumaravadivel N. Associate Proffessor, Department of Pulses, Coimbatore.Ms. Kumari Vinodana, Student, CPBG, TNAU, Coimbatore.Dr. Lal Ahamed Mohammad, Assistant Professor, College of Agriculture, Sopore.Mr. Lalit Kumar Upadhayay, Ph.D. Student, Central Potato Research, Institute Campus, Meerut.Dr. Latha .R Assistant Professor, Department of Plant Breeding and Genetics, Pajancoa.Dr. Lavanya C. Senior Scientist (Plant Breeding), Directorate of Oilseeds Research, Hyderabad.Dr. Mahadevamurthy M. Assistant Professor, University of Agricultural Sciences, GKVK, Bangalore.Dr. Maheswaran M. Professor, Centre for Plant Molecular Biology, TNAU, Coimbatore.Dr. Malarvizhi D. Teaching Assistant (Plant Breeding), Forest College And Research Institute, Coimbatore.Ms. Malini N. Senior Research Fellow, Department of Pulses, Coimbatore.Dr Manimaran R. Teaching Assistant, Hybrid Rice Evaluation Centre, Gudalur.Dr. Manivannan N. Associate Professor, TNAU, Coimbatore.Mr. Manjunath S. Patil Student, I Ph.D. Hort PG Hostel, Bangalore.Mr. Manjunatha K. Consultant Mansanto Research Center, Bangalore. Hebbal, Bangalore.Mr. Manjunatha Y.S. Student, UAS, Bangalore.Dr. Manoharan V. Professot (PB&G), Oilseeds Research, Station.Dr Manonmani S. Associate Professor, Departmant of Rice, TamilNadu Agri. University, Coimbatore.Mr. Mathi Thumilan B. Junior Research fellow, Central Sericultural Research And Training Institute,Mysore.Mr. Md. Nasim Ali, Research Scholar, Dept. of Genetics Bidhan Chandra Krishi, Viswavidyalayakalyani.Mr. Meenakshisundaram P. Ph.D. Scholar Centre for Plant Moleculaar Biology, Coimbatore.Dr. Mohan K.S. Function Lead, Biotech Product Support Monsanto Research Center, Bangalore Bangalore.Dr. Mohanasundram K. Professor and Head (Rice), CPBG, TNAU, Coimbatore.Dr Mohanraj K. Agricultural Officer, C/o Department of Forage Crops, Coimbatore.Dr. Mohd Nisarkhan, Senior Scientist, Sher-e-Kashmir, University of Agricultural Sciences and Technology,of Kashmir, Srinagar.Dr Mukesh Kumar, Saxena Technical Assistant, Soghum Improvement Project, Indore.Mr. Mukeshbhai Jerajbhai, Patel Senior Research, Assistant Main Vegetable Research Station, Anand.Agricultural University, Anand.Dr Muralidharan V. Professor (Oilseeds), CPBG, TNAU, Coimbatore.Mr. Murugan A. Felicon Equipments, Ltd. Coimbatore.Dr Murugan E. Asst. Professor, Deparment of Plant Breeding and Genetics, Madurai.Mr. Murugan R. Student, CPBG, TNAU, Coimbatore.Dr Muthiah A.R. Professor, CPBG, TNAU, Coimbatore.Mr. Muthuramu S. Ph.D. Scholar (PBG), Agri College & Research Institute, Madurai.Dr NaemIARI, Wellington.Dr. Nagarajan P. Professor (Biotechnology), Department of Plant Molecular Biology and Biotechnology,CPMB, Coimbatore.Dr. Nagarajan R. Principal Scientist (Breeding), Sugarcane Breeding Institute, Coimbatore.Ms. Nanda C. Ph.D. Scholar (I year), University of Agricultural Sciences, Bangalore.Dr Narayanan S.S. Research Advisor - JK Agri Genetics LtdFlat No. 102, H.No. 33-63, VictoryApartments, Secunderabad.Dr. Nadarajan N. Professor and Head (Pulses), CPBG, TNAU,Coimbatore.Ms. Neeraj, Student, CPBG, TNAU, Coimbatore.Dr. Nirmalakumari A. Associate Professor, Department of Millets, CPBG, Coimbatore.Dr. Om Prakash Varma, Assistant Professor, Dept. of Genetics & Plant Breeding, MDUA & Tech,Kumarcanj, Faizabad, UP 224 229.Dr. Pandiyan M. Associate Professor, NPRC, Vamban.
334
Second National Plant Breeding Congress 2006 Plant Breeding in Post Genomics Era
Dr Paramasivam K. Professor and Head Department of Plant Breeding and Genetics, Karaikal.Dr. Parthiban S. Associate Professor and Head Horticultural Research Station, Perumbarai.Ms Parvathi G. PG Student, Centre for Plant Breeding and Genetics, Coimbatore.Dr. Patil F BAnand, Agricultural University, Anand.Dr Peter K.V. Vice-Chancellor, KAU, Kerala.Dr. Prabhakar, Senior Scientist Centre on Rabi Sorghum (NRCS), NH 9 Byepass Road, Solapur.Mr. Prabhakara Rao G. Botanist Germplasm Division, Rubber Research Institute of India, Kottayam.Mr. Prabhu R. Student, CPBG, TNAU, Coimbatore.Dr. Prasada Rao U. Principal Scientist (Retd.) DRR, Hyderabad.Mr. Praveen Mahendrakar, Student, PG Hostel Bangalore.Ms Praveena M. Senior Research Fellow, Department of Forages, TNAU Coimbatore.Ms. Preetha S. Ph.D. Scholar Centre for Plant Breeding and Genetics Coimbatore.Ms Premalatha N. Senior Research Fellow Department of Rice Coimbatore.Ms. Premlatha M. D/o A.Muthusamy, 224, Nehru Nagar, Salem.Dr. Punitha D. Assistant Professor, Tamilnadu Agricultural University, Bhavani Sagar.Ms. Pushpa R. Senior Research Fellow, Centre for Plant Molecular Biology, Tamil Nadu AgriculturalUniversity, Coimbatore.Dr. Pushpam R. Assistant Professor, Agricultural Research Station, Tamil Nadu Agricultural UniversityErode.Mr. Raja Raja Cholan, Student, CPBG, TNAU, Coimbatore.Dr Raja Rathnam S. Professor, CPBG, TNAU, Coimbatore.Mr. Raja Srinivas Student, CPBG, TNAU, Coimbatore.Ms Rajalakshmi S. SRF, CPMB, TNAU, Coimbatore.Dr. Rajamanickam C. Teaching Assistant (Hort) Horticultural Research Station Perumbarai.Mr Rajesh Student, CPBG, TNAU, Coimbatore.Dr. Rajeswari S. Assistant Professor, Department of Rice, Coimbatore.Mr Ram Naresh JRF, Kanpur.Mr. Rama Prashat G. Junior Research Fellow, Karasur.Dr Ramana M.V. Senior Scientist (Plant Breeding), Regional Agricultural Research Station, Guntur.Dr. Ramaswamy C. Vice-Chancellor, TNAU, Coimbatore.Mr Ramaswamy M. Managing Director, Rasi Seeds.Dr. Ramaswamy N. M.Founder Chairman, NMRFRD Prof. NMR Foundation for R&D, PPG EducationalInstitutions Campus, Coimbatore.Dr Rangaiah S. Associate Professor, University of Agrl. Sciences, Bangalore.Dr. Ranganatha A.R.G. Senior Scientist (Plant Breeding), Directorate of Oilseeds Research, Hyderabad.Ms. Rashmi J.A. Senior Research Fellow, CPBG, TNAU, Coimbatore.Dr. Raveendran T.S. Director Centre for Plant Breeding and Genetics, Coimbatore.Dr. Ravikesavan R. Associate Professor (Cotton) CPBG, TNAU, Coimbatore.Dr. Ravishankar C.R. Breeder, University of Agricultural Sciences, Bangalore. ZARS, VC, FARM , Mandya.Dr. Rizwana Banu M. Plant Breeding and Genetics, Tamilnadu Agricultural University, Bhavani Sagar.Dr. Robin S. Associate Professor, Department of Rice, Coimbatore.Mr. Sabesan T. Lecturer, Department of Agricultural Botany, Faculty of Agriculture, Annamalai Nagar.Mr. Sahi V.P. Student, CPBG, TNAU, Coimbatore.Mr. Sai Ram Felicon Equipments, Coimbatore.Ms. Sakthi A.R. PG Student, Mother Teresa Hostel, Coimbatore.Ms. Shobana, V.G. Student, AC & RI, Madurai.Mrs. Sandhyarani Nishani, Research Assistant, IIi Central Coffee Research Institute, Coffee ResearchStation.Dr. Santa Ram A. Head, Division of Botany, Central Coffee Research Institute,Coffee Research Station.Dr. Santha V. Pillai Principal, Scientist, Central Tuber Crops Research Institute,Trivandrum.Ms. Santha Lakshmi S. Student, CPBG, TNAU, Coimbatore.Mrs. Santha S. Teaching Assistant (PBG),Tamil Nadu, Rice Research Institute, Aduthurai.Dr. Santhanam, VFAO, Consultant.Dr. Saraswathy R. Assistant Professor, Tamil Nadu, Rice Research Institute, Aduthurai.Dr. Saravanan K. Reader, Department of Agricultural Botany, Faculty of Agriculture, Annamalai Nagar.Dr. Saravanan N.A. Research Associate, Dept. of Cotton, CPBG, TNAU, Coimbatore.
335
Second National Plant Breeding Congress 2006 Plant Breeding in Post Genomics Era
Mr. Saravanan R. Student, Centre for Plant Breeding and Genetics, Coimbotore.Dr. Saravanan S. Research Associate,Department of Cotton, Coimbatore.Prof. Sarkar H.K. HeadBidhan, Chandra Krishi Viswavidyalaya, Nadia.Dr. Sathyanarayana A. Regional Agricultural Research Station, Lam Guntur.Dr. Selva Kumar R. Senior Breeder121, Sridhis Nivas, Veenus Building, Railway Station Road Salem (Dt)Ms. Selva Rani E. Student, CPBG, TNAU,Coimbatore.Dr. Selvaraju K. Senior Research Fellow, Centre for Plant Molecular Biology, Coimbatore.Dr. Selvi A. Senior Scientist (Plant Biotechnology), Sugarcane Breeding Institute, Coimbatore.Dr. Selvi B. Professor and Head Department of Millets, Coimbatore.Mr. Senguttuvel P. Student, CPBG, TNAU, Coimbatore.Mr. Senthil Kumar K. Student, CPBG, TNAU, Coimbatore.Dr. Senthil Kumar N. Senior Lecturer in GPB, Dept. of Agrl. Botany, Faculty of Agriculture, AnnamalaiUniversity, Annamalai nagar – 608 002.Dr. Senthil Kumar P. Reader in Genetics and Plant BreedingFaculty of agriculture, Annamalai University,Chidambaram.Mr. Senthil R. Senior Research Fellow, CPBG, TNAU Coimbatore.Dr. Shailaja Hittalmani, Associate Professor, Genetics and Plant Breeding, University of AgriculturalSciences, Banglaore.1Dr. Shanmugam T.R. Professor, CARDS, TNAU, Coimbatore.Dr. Shanmuganathan M. SRFCPBG, Coimbatore.Dr. Shanmugasundaram P. Professor, Centre for Plant Molecular Biology, Coimbatore.Ms. Shanthi P. Student, CPBG, TNAU, Coimbatore.Dr. Shanthi R.M. Senior Scientist, Sugarcane Breeding Institute, Coimbatore.Mr. Sharanappa S.D. Student, CPBG, TNAU, Coimbatore.Ms. Sharmila V. SRF, Department of Pulses, CPBG, Coimbatore.Dr. Sheeba A. Sr. Research Fellow, Department of Plant Breeding and Genetics, Madurai.Ms. Sheela Mary, Senior Research Fellow, Department of Cotton, Coimbatore.Ms. Shimna Bhaskaran, Ph.D Student, GKVK, Bangalore.Mr. S. Sivakumar, Assistant Professor, CPBG, TNAU, Coimbatore.Mr. Shivbachan S. Kushwaha, Sr. Scientist, Monsant o Research Centre, Bangalore.Dr. Shobha Rani N. Principal Scientist, Crop improvement Section, Directorate of Rice Research,Hyderabad.Ms. Shobhana V.G. Student, No. 25, Senthur Xerox, Rajaji Street, Madurai.Dr. Shrivastava D.K. Technical Assistant, JNKVV, Jabalpur, Madyapradesh.Mr. Sidhartha Mishra, Junior Research Fellow, Central Sericultural Research And Training Institute,Mysore.Dr. Singh P.K. Oil seeds Section,C.S. Azad University of Agric. & Technology, Kanpur.Dr. Sivakumar S. Associate Professor, Directorate of Research, Tamil Nadu Agri. University, Coimbatore.Dr. Sivasamy N. Professor and Head Department of Cotton, CPBG, TNAU, Coimbatore.Dr. Sobhakumari V.P. Scientist (SS), Sugarcane Breeding Institute, Coimbatore.Dr. Souframanien J. Scientific Officer - DNABTD, Bhabha Atomic Research Centre, Mumbai.Dr. Sree Rangaswamy S.R. Director (Retd.), CPBG, TNAU, Coimbatore.Dr. Stephen Durairaj M. Professor (Retd.), TNAU, Coimbatore.Dr. Subba Rao L.V. Senior Scientist, Directorate of Rice Research, Hyderabad.Dr. Subba Rao M. Associate Professor, Department of Genetics & Plant Breeding, Agricultural College, MCFarm Nandyal R.S.Ms. Subha L. Ph.D. student, Department of Plant Breeding and Genetics, Madurai.Dr. Subramanian M. Professor (Retd), Plot #9, Srinivasan Street, Madurai.Dr. Sudhagar D. Associate Professor, Centre for Plant Molecualr Biology, Coimbatore.Mr. Sudhakaran M. Trivandrum.Dr. Sudhir Shukla Senior Scientist, National Botanical Research Institute, Lucknow.Mr. Sukumar M. Junior Research fellow, Central Sericultural Research And Training Institute, Mysore.Dr. Sumathi P. Associate Professor, Department of millets, CPBG, Coimbatore.Ms. Sumathi K. Student, CPBG, TNAU, Coimbatore.Ms. Sumathi T. Student, HC&RIP, eriyakulam.Ms. Sunayana Rathi, Senior Research Fellow, Assam Agricultural University, Jorhat-13, Assam Jorhat.
336
Second National Plant Breeding Congress 2006 Plant Breeding in Post Genomics Era
Mr. Sundaravel pandian K. Student Room, # 180, PG Hostel, Coimbatore.Dr. Sunil Kumar B. Lecturer, College of Agriculture, Annamalai University, Annamalainagar.Mr. Suresh R. Student, CPBG, TNAU, Coimbatore.Dr. Suresh Ramalingam Senior, Research Fellow, Tamil Nadu Agricultural University, Coimbatore.Mr. Suvendu Mondal, Scientific Officer, Bhabha Atomic Research Centre, Mumbai.Ms. Tamilarasi P.M. PG student, CPBG, Coimbatore.Dr. Thanga Hemavathy A. SRFCPMB, CoimbatoreDr. Thangapandian R. Assistant Professor (Genetics), Krishi Vigyan Kendra, Sikkal.Nagapattinam.Dr. Thangaraj K. Teaching Assistant Department of Agrl. Botany, Madurai.Dr. Thati Srinivas Scientist (Plant Breeding), Acharya N.G. Ranga Agricultural University, Hyderabad.Dr. Thiagarajan C. CP Rasi Seeds, Salem.Mr. Tamaraiselvan Student, TNAU, Coimbatore.Mr. Thiruvengedam V. PhD Scholar, Centre for Plant Breeding and Genetics, Coimbatore.Dr. Thiyagarajan K. Professor Dept of Rice, Tamil Nadu Agricultural University, Coimbatore.Mr. Thiyagu K. Senior Research Fellow, Departmant of Rice, Coimbatore.Mr. Tirthankar Biswas Research Scholar, Department of Genetics Bidhan Chandra Krishi ViswavidyalayaNadia.Mr. Tirthartha Chattopadhyay Final Year Student, M.Sc.(Agriculture), in the Department of GeneticsBidhan. Chandra Krishi Viswavidyalaya Nadia.Dr. Tiwari S.P. Director, NAARM.Ms. Uma Devi M. Student, CPBG, TNAU, Coimbatore.Dr. Uma Maheswari D.S RF Department of Pulses, CPBG Coimbatore.Dr. Umakanth A.V. Scientist (Senior Scale), National Research Centre for Sorghum, Hyderabad.Mr. Umashankar P. Breeder, SPIC Ltd, Kelamangalam Road, Hosur.Dr. Upadhyaaya H. DICRISAT, Patencheru, AP.Dr. Vaithilingam R. Professor Soil & Water Management, Research Institute.Dr. Veerabhdran P. Professor CPBG, TNAU, Coimbatore.Mr. Veeresh Gowda Student, Dept. of Genetics and Plant Breeding, Dharward.Mr. Velmurugan M. Student, HC&RI Coimbatore.Dr. Veluthambi K. Professor, Department of Millets, TNAU, Coimbatore.Mr. Vengadesan V. Student, CPBG, TNAU, Coimbatore.Mr. Vengadessan Ph.D scholar, 305, Pearl Millet building, ICRISAT, Hyderabad.Mr. Venkata Sadasiva Rao K. Research Scholar, Bangalore University, Bangalore.Mr. Vetriventhan M. Student ,Centre for Plant Breeding and Genetics, coimbatore.Dr. Vijaya Kumar L. Gawande Assistant Professor of Agrl. Botany, Botany Section, College of Agriculture,Nagpur (MS).Dr. Vijayakumar G. Professor and HeadDepartment of Forage Crops, CPBG,Coimbatore.Dr. Vijayan Nair N. Director Sugarcane Breeding Institute, Coimbatore.Mr. Vijayaraghavan V. Student, TNAU, Coimbatore.Dr. Vijendra Das L. Former Director of Publications, TNAU, Coimbatore.Dr. Vindhyavarman P. Professor and Head Department of Oilseeds, TNAU, Coimbatore.Dr. Vinod K.K. Plant Breeder Centre for Plant Breeding and Genetics, Coimbatore.Ms. Vinothini S. SRF Centre for Plant Breeding and Genetics, Coimbatore.Mr. Viswanath S.K. Student, CPBG, TNAU, Coimbatore.Dr. Vivekanandan P. Professor and Head, Department of Plant Breeding and Genetics, MaduraiDr. Wilson D. Associate Professor, College Of Agriculture, Vellayani Kerala Agri. UniversityThiruvananthapuram.Dr. Yadla Suneetha, Research Scholar Gujarat Agricultural University, Anand.Ms. Yazhini student, Centre for Plant Breeding and Genetics, Coimbatore.Ms. Yogameenakshi Student, Department of Plant Breeding and Genetics, Madurai.Mr. Yogeesh. L.N. Student, UAS, GKVK, Bangalore.
337

Second National Plant Breeding Congress 2006 Plant Breeding in Post Genomics Era
Pla
nt
Bre
ed
ing
In
Po
st
Ge
no
mic
s E
ra
Plant Breeding In Post Genomics Era
Jointly organized by
Indian Society of Plant Breeders &
Tamil Nadu Agricultural University Coimbatore 641 003, India
Jointly organized by Indian Society of Plant Breeders
&
Tamil Nadu Agricultural University
Coimbatore - 641 003, India.


