Embed Size (px)
Citation preview
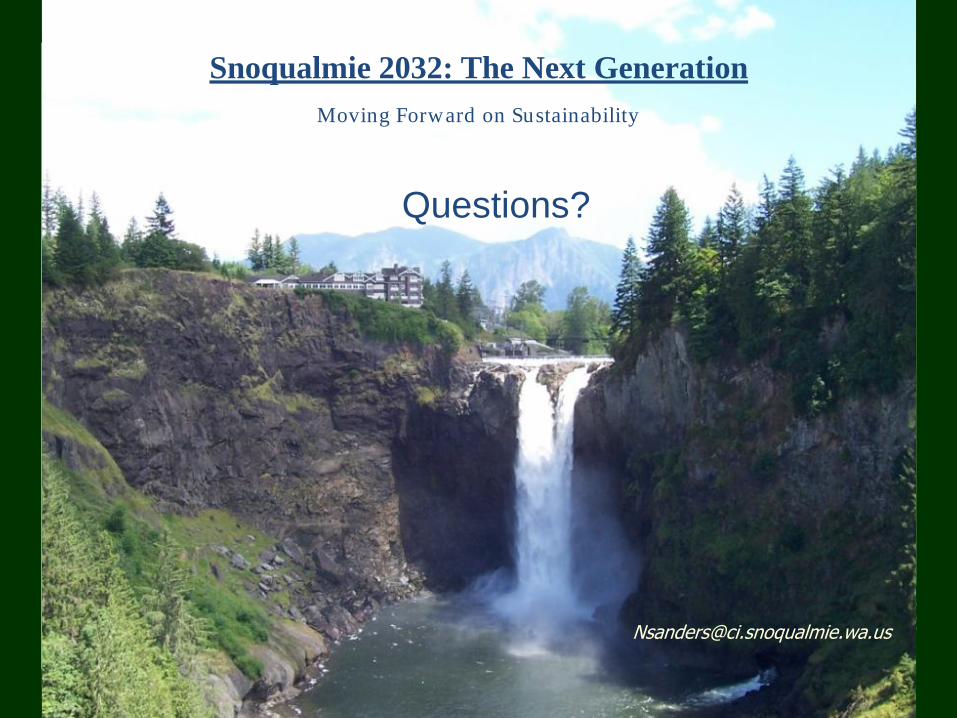
Snoqualmie 2032: The Next Generation
Moving Forward on Sustainability
Nicole Sanders
Associate Planner
September 13,2011
• Snoqualmie History
• Snoqualmie Sustainability Strategy
• Introduction to ICLEI
• Other GHG Tools
Overview
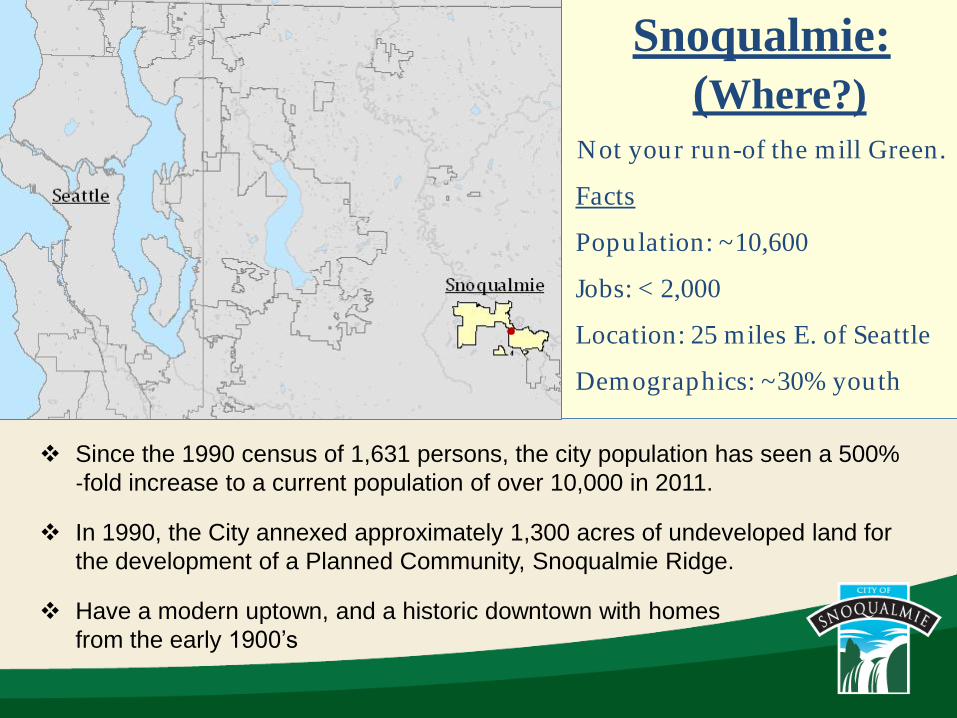
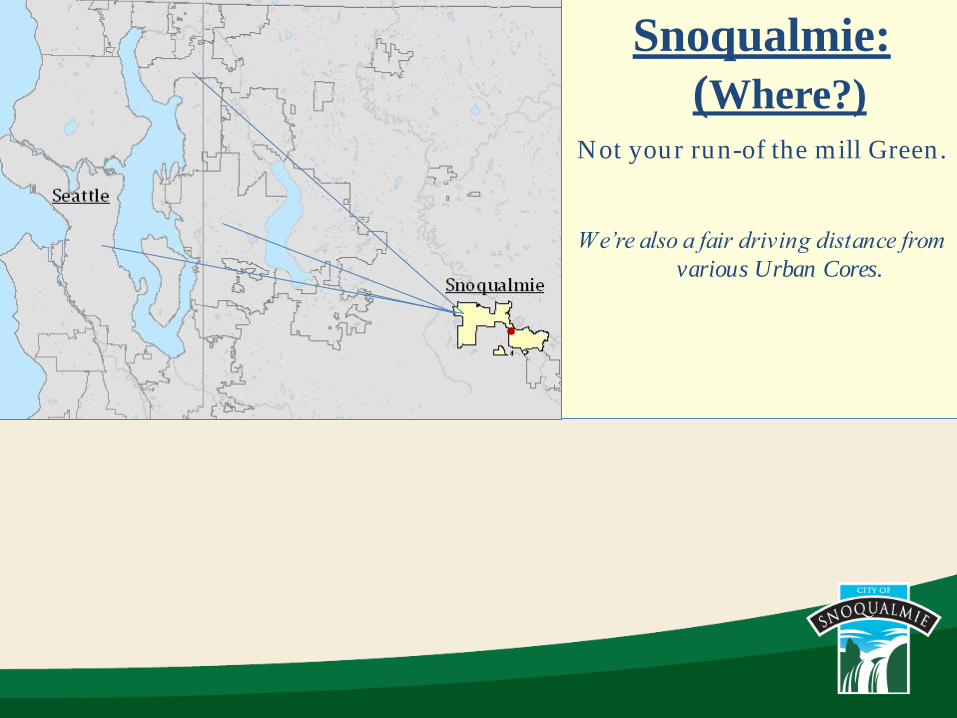
Snoqualmie:
(Where?)
Not your run-of the mill Green.
Facts
Population: ~10,600
Jobs: < 2,000
Location: 25 miles E. of Seattle
Demographics: ~30% youth
Since the 1990 census of 1,631 persons, the city population has seen a 500%
‐fold increase to a current population of over 10,000 in 2011.
In 1990, the City annexed approximately 1,300 acres of undeveloped land for
the development of a Planned Community, Snoqualmie Ridge.
Have a modern uptown, and a historic downtown with homes
from the early 1900’s
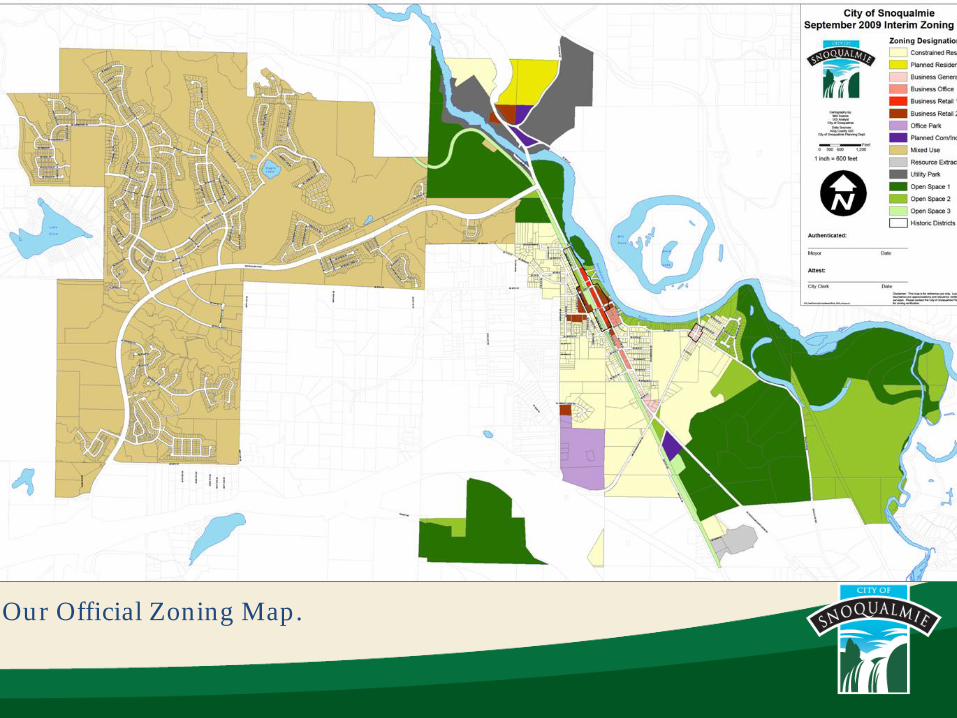
Our Official Zoning Map.
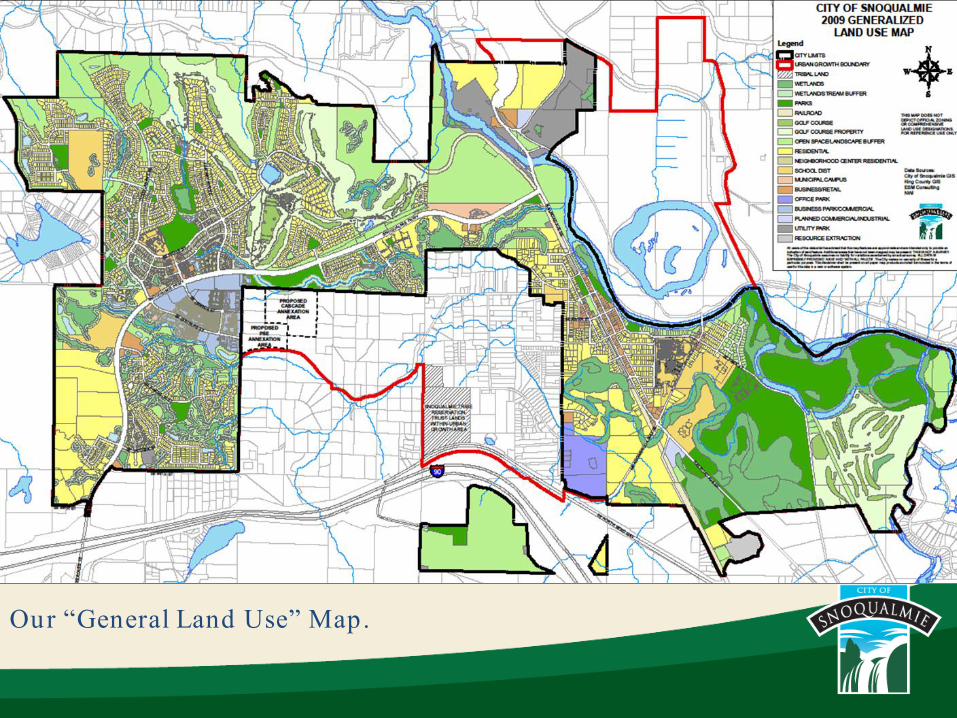
Our ―General Land Use‖ Map.
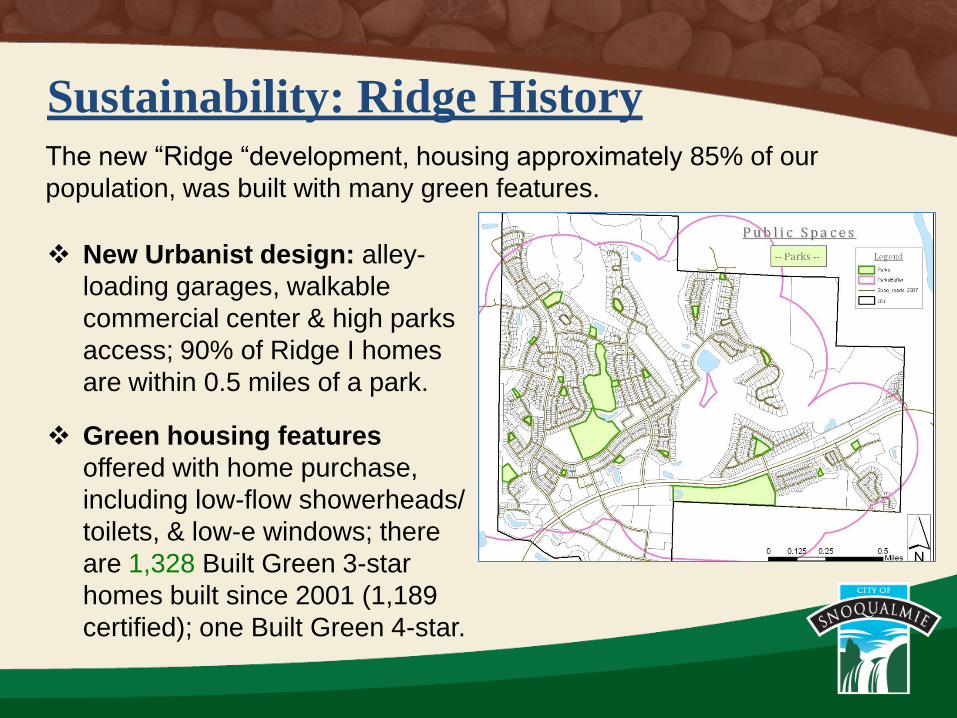
Sustainability: Ridge History
New Urbanist design: alley-
loading garages, walkable
commercial center & high parks
access; 90% of Ridge I homes
are within 0.5 miles of a park.
Green housing features
offered with home purchase,
including low-flow showerheads/
toilets, & low-e windows; there
are 1,328 Built Green 3-star
homes built since 2001 (1,189
certified); one Built Green 4-star.
The new “Ridge “development, housing approximately 85% of our
population, was built with many green features.
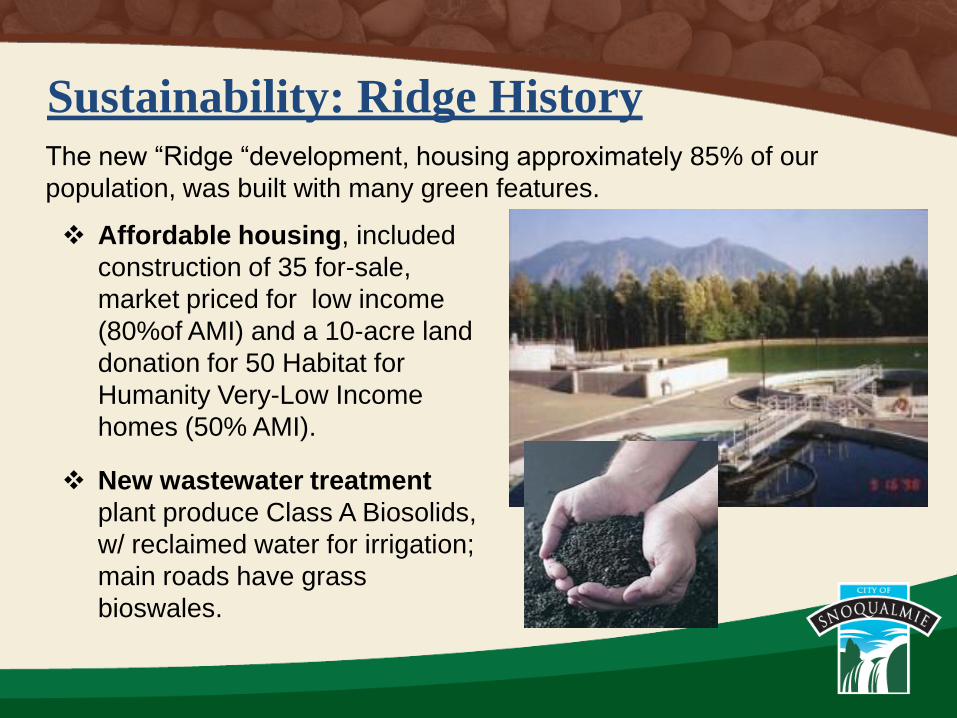
Sustainability: Ridge History
Affordable housing, included
construction of 35 for-sale,
market priced for low income
(80%of AMI) and a 10-acre land
donation for 50 Habitat for
Humanity Very-Low Income
homes (50% AMI).
New wastewater treatment
plant produce Class A Biosolids,
w/ reclaimed water for irrigation;
main roads have grass
bioswales.
The new “Ridge “development, housing approximately 85% of our
population, was built with many green features.
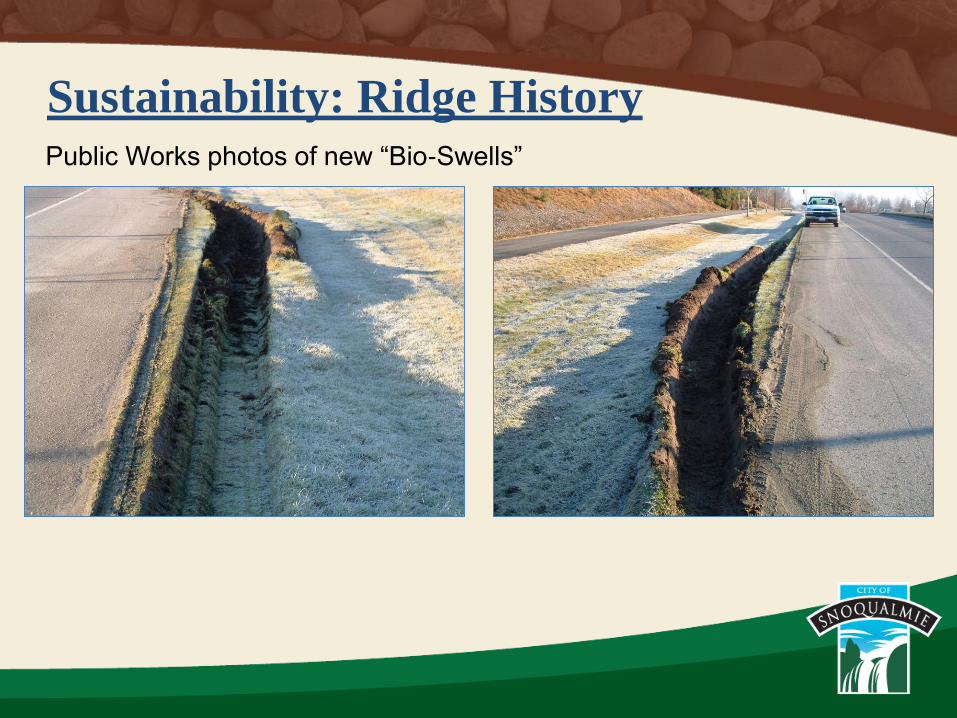
Sustainability: Ridge History Public Works photos of new “Bio-Swells”
Snoqualmie: Where are we now?
About 8,000 people live in
newer homes; but ~1,600 live
in homes built before 1985 or
even 1950.
A suburban ex-urb, where a
majority of citizens commute
out of the City to work.
Small cities, by their nature,
have fewer staff hours to
pursue green items.
The City has continued its work on sustainability in other ways:
Work with student groups and
volunteers more.
Work with partnerships more.
Rely on your relationships with
other staff & electeds more.
Have become more project-
specific.
Challenges
Ways to Mitigate…
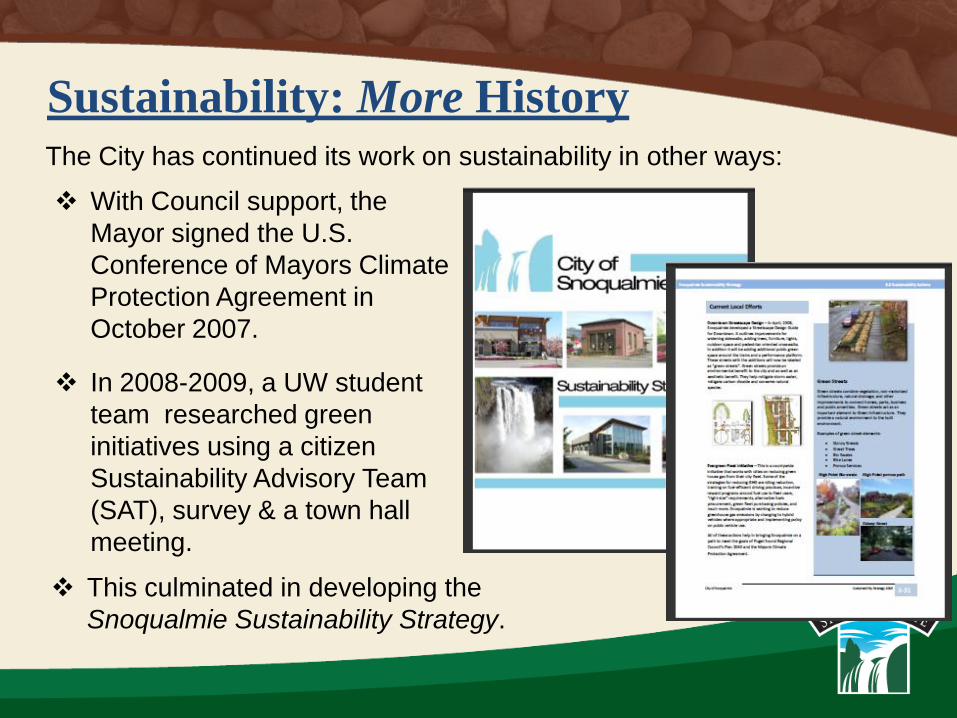
Sustainability: More History
With Council support, the
Mayor signed the U.S.
Conference of Mayors Climate
Protection Agreement in
October 2007.
In 2008-2009, a UW student
team researched green
initiatives using a citizen
Sustainability Advisory Team
(SAT), survey & a town hall
meeting.
The City has continued its work on sustainability in other ways:
This culminated in developing the
Snoqualmie Sustainability Strategy.
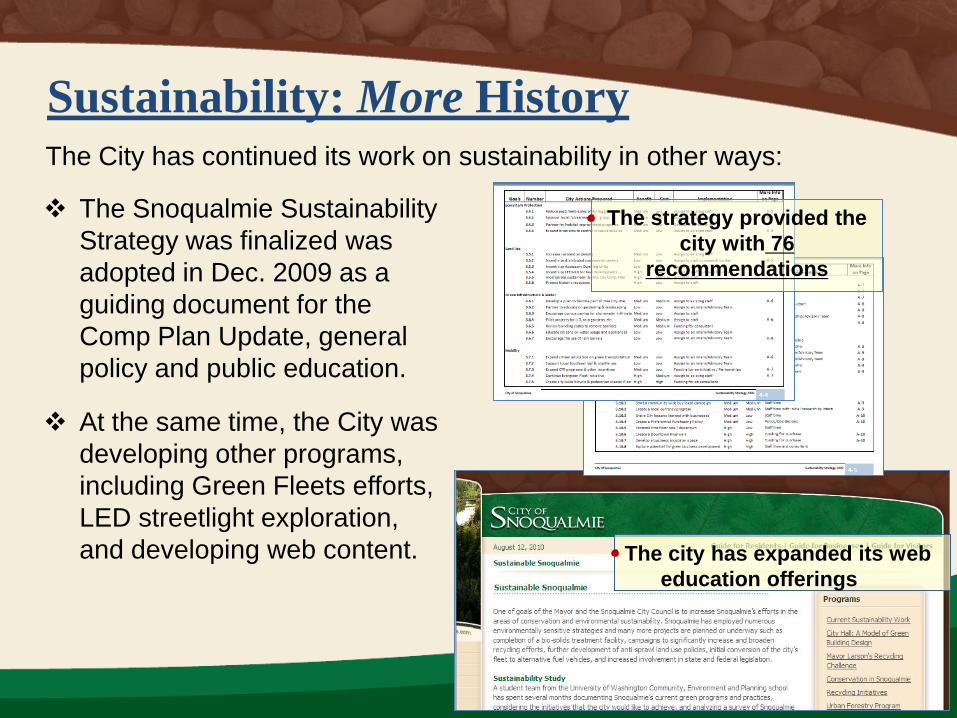
Sustainability: More History
The Snoqualmie Sustainability
Strategy was finalized was
adopted in Dec. 2009 as a
guiding document for the
Comp Plan Update, general
policy and public education.
At the same time, the City was
developing other programs,
including Green Fleets efforts,
LED streetlight exploration,
and developing web content.
The City has continued its work on sustainability in other ways:
The strategy provided the
city with 76
recommendations
The city has expanded its web
education offerings
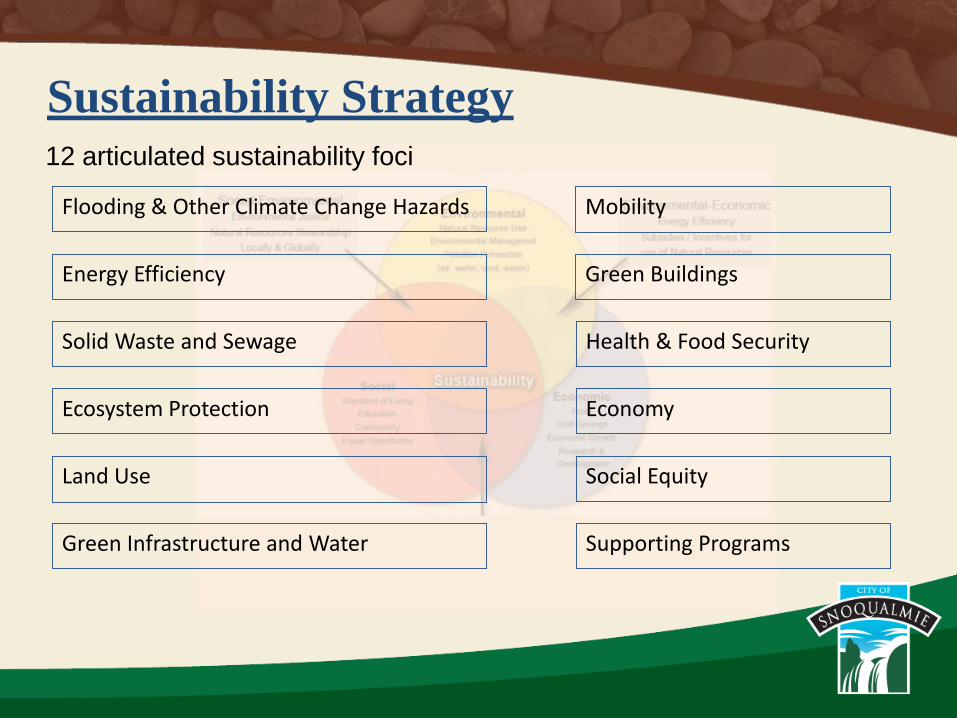
Sustainability Strategy
Flooding & Other Climate Change Hazards
12 articulated sustainability foci
Social Equity
Energy Efficiency
Solid Waste and Sewage
Ecosystem Protection
Land Use
Green Infrastructure and Water
Mobility
Green Buildings
Health & Food Security
Economy
Supporting Programs
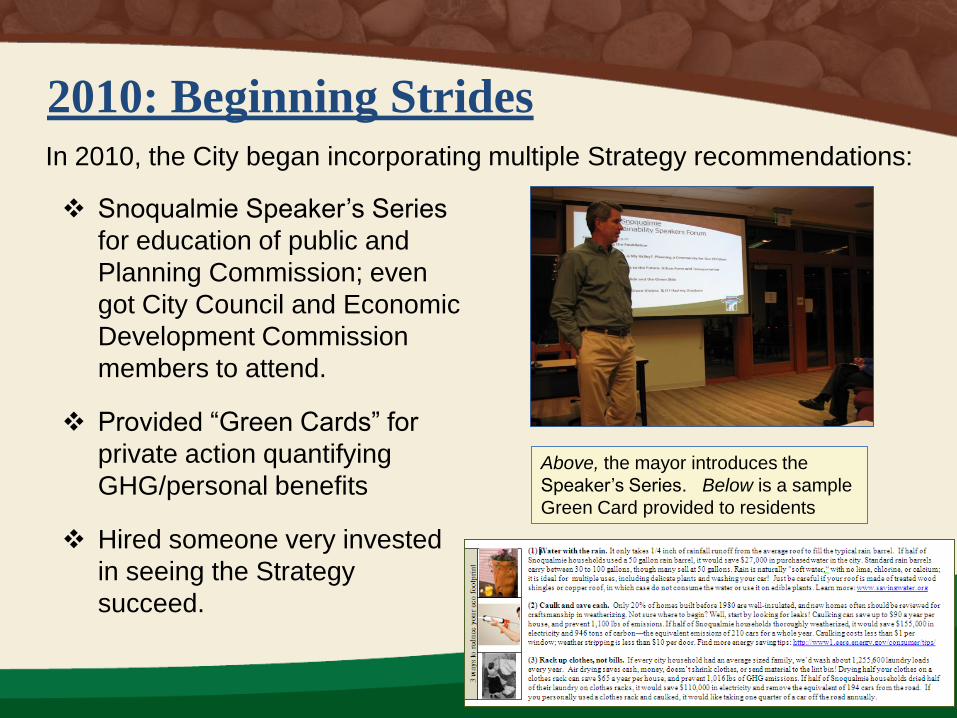
2010: Beginning Strides
Snoqualmie Speaker’s Series
for education of public and
Planning Commission; even
got City Council and Economic
Development Commission
members to attend.
Provided “Green Cards” for
private action quantifying
GHG/personal benefits
Hired someone very invested
in seeing the Strategy
succeed.
In 2010, the City began incorporating multiple Strategy recommendations:
Above, the mayor introduces the
Speaker’s Series. Below is a sample
Green Card provided to residents
2010: Beginning Strides
Front lines = GHG inventory
Recycling efforts & the
Mayor’s Recycling Challenge
Grant application for rain
garden demonstration projects
Meetings on Community Solar
Grant application for a walking
school bus;
Tree City USA membership
In 2010, the City began incorporating multiple Strategy recommendations:
√
√
Project Difficulties
GHG inventory: review delays
Rain garden demonstration
projects: implementation
delays
Community Solar: momentum
delays
Several grants not awarded,
including
• A walking school bus;
• An LID improvement project
• Feasibility study of renewable
energy on a brownfield
Some project delays slowed…
2011:Current Activity
FINISH the GHG inventory
Implement rain garden
demonstration projects
Community Solar: Build
momentum
New Solid waste contract;
more green content
New Energy Efficiency
Outreach program
New Master Bike/Ped Plan
development
In 2011, Plans to finish this year/early 2012
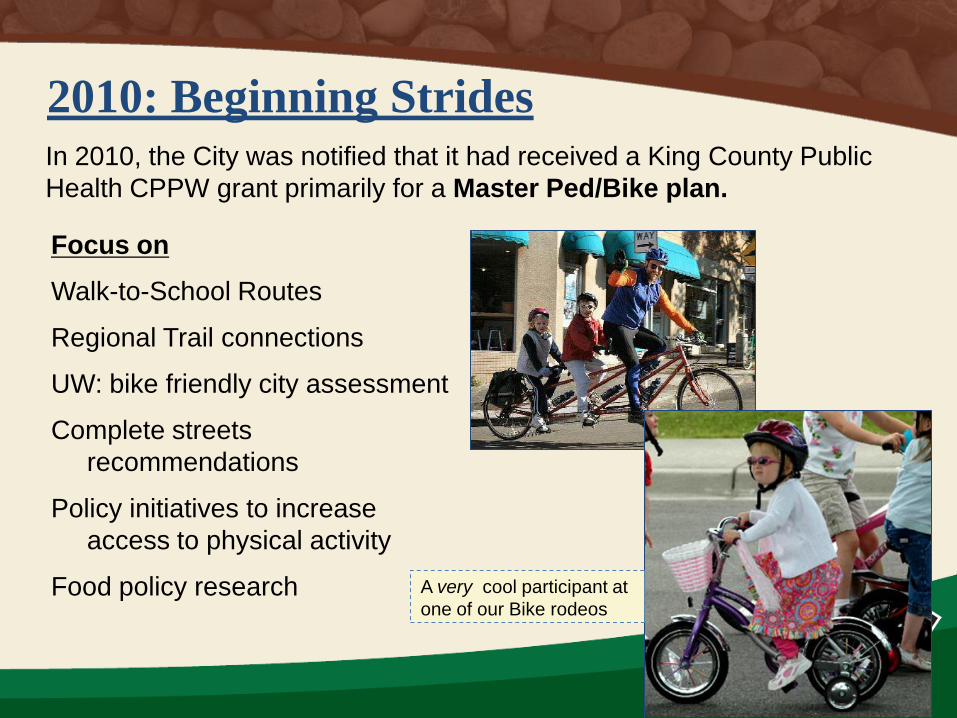
2010: Beginning Strides
Focus on
Walk-to-School Routes
Regional Trail connections
UW: bike friendly city assessment
Complete streets
recommendations
Policy initiatives to increase
access to physical activity
Food policy research
In 2010, the City was notified that it had received a King County Public
Health CPPW grant primarily for a Master Ped/Bike plan.
A very cool participant at
one of our Bike rodeos
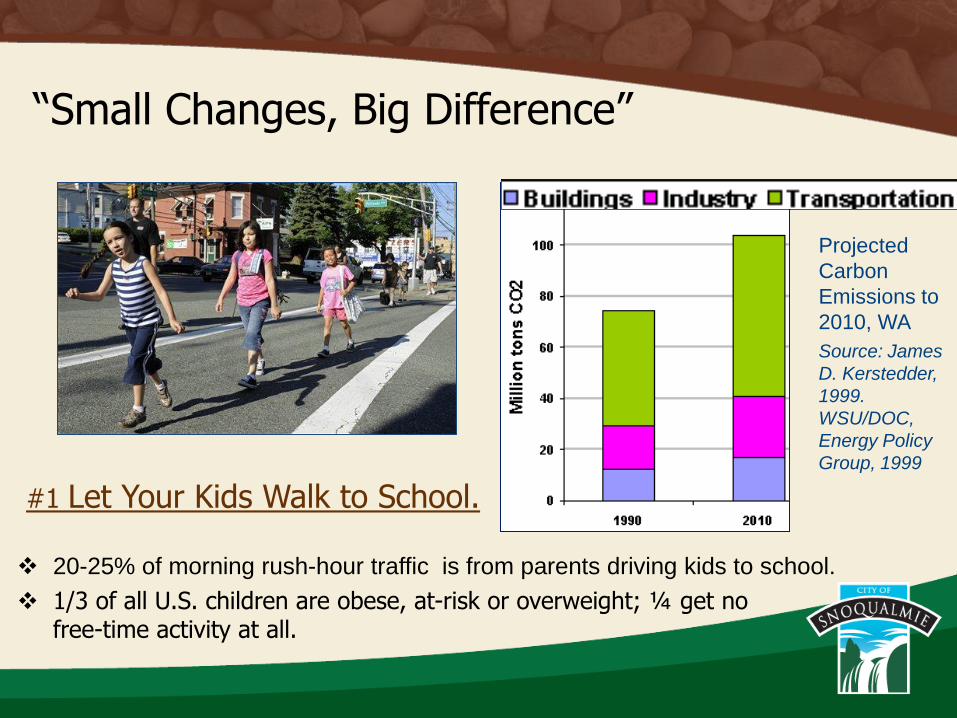
“Small Changes, Big Difference”
#1 Let Your Kids Walk to School.
20-25% of morning rush-hour traffic is from parents driving kids to school.
1/3 of all U.S. children are obese, at-risk or overweight; ¼ get no free-time activity at all.
Projected
Carbon
Emissions to
2010, WA
Source: James
D. Kerstedder,
1999.
WSU/DOC,
Energy Policy
Group, 1999
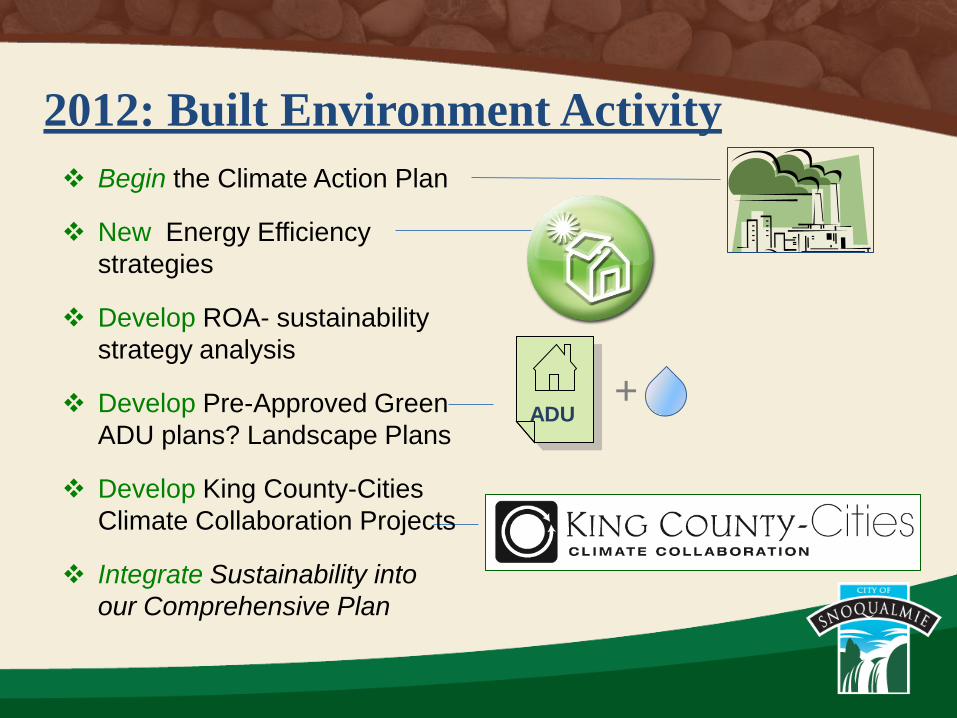
2012: Built Environment Activity
ADU
Begin the Climate Action Plan
New Energy Efficiency
strategies
Develop ROA- sustainability
strategy analysis
Develop Pre-Approved Green
ADU plans? Landscape Plans
Develop King County-Cities
Climate Collaboration Projects
Integrate Sustainability into
our Comprehensive Plan
+
1) Advise a Sustainability Plan before GHG Inventory?
Probably not– your strategy will be less strategic
Inventories help inform your different policy/program alternatives.
Maybe not. GHG inventories usually required some paid staff time;
the City needed to build momentum.
You can also shoot from the hip and get some solid results.
If your interim projects are low-risk, it may be better to do something
now than not do anything at all.
2) If you had to do it over, would you do it differently?
3) Why did you choose ICLEI for your software?
Well…
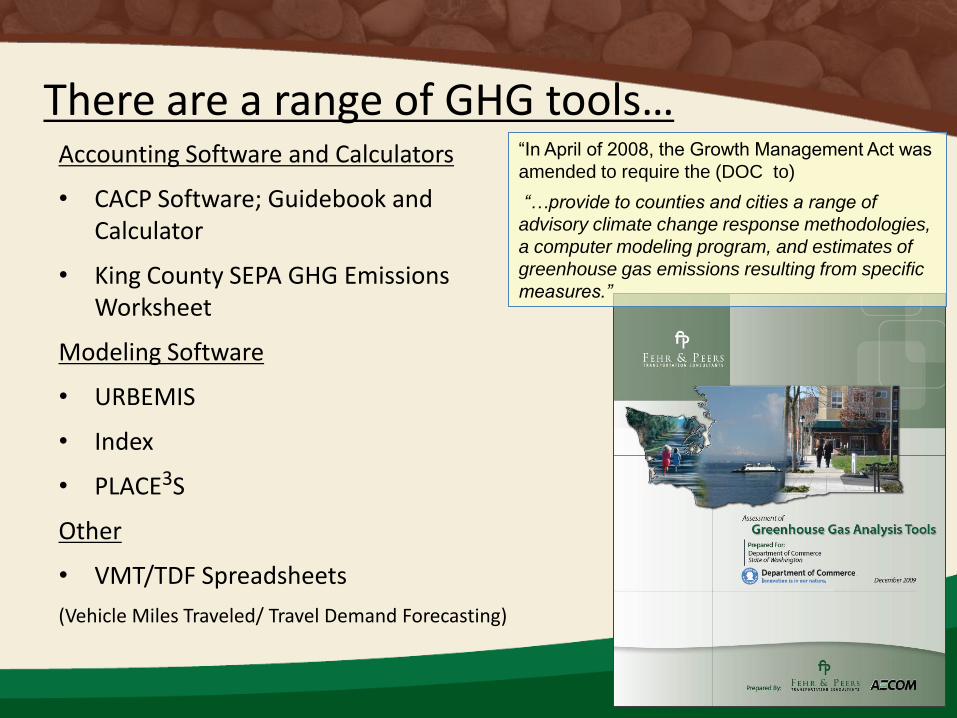
There are a range of GHG tools… Accounting Software and Calculators
• CACP Software; Guidebook and Calculator
• King County SEPA GHG Emissions Worksheet
Modeling Software
• URBEMIS
• Index
• PLACE3S
Other
• VMT/TDF Spreadsheets
(Vehicle Miles Traveled/ Travel Demand Forecasting)
“In April of 2008, the Growth Management Act was
amended to require the (DOC to)
“…provide to counties and cities a range of
advisory climate change response methodologies,
a computer modeling program, and estimates of
greenhouse gas emissions resulting from specific
measures.”
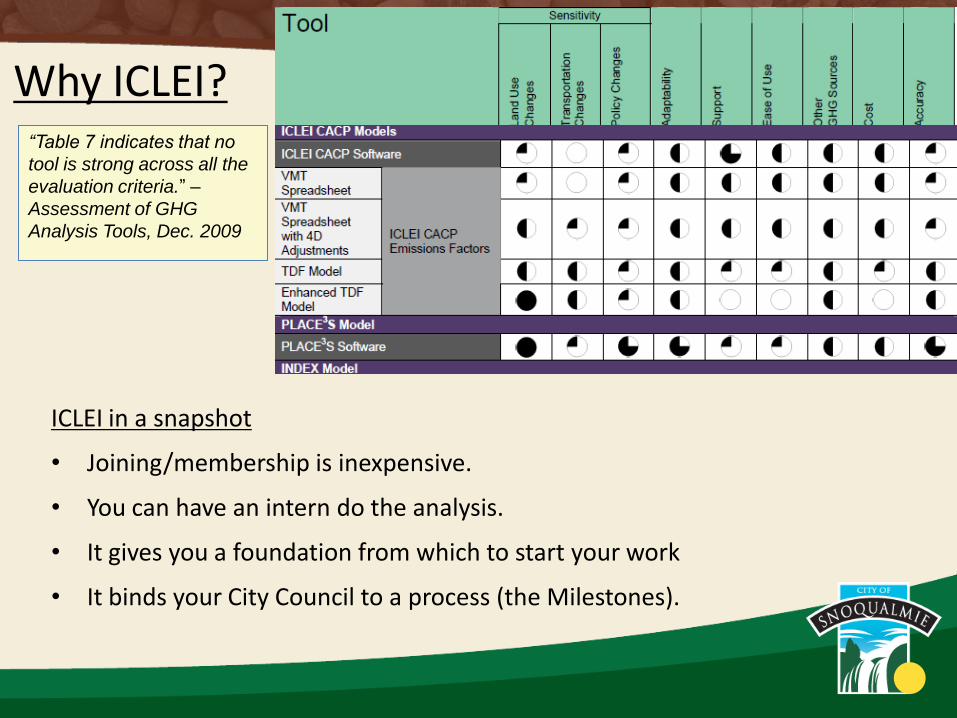
Why ICLEI?
ICLEI in a snapshot
• Joining/membership is inexpensive.
• You can have an intern do the analysis.
• It gives you a foundation from which to start your work
• It binds your City Council to a process (the Milestones).
“Table 7 indicates that no
tool is strong across all the
evaluation criteria.” –
Assessment of GHG
Analysis Tools, Dec. 2009
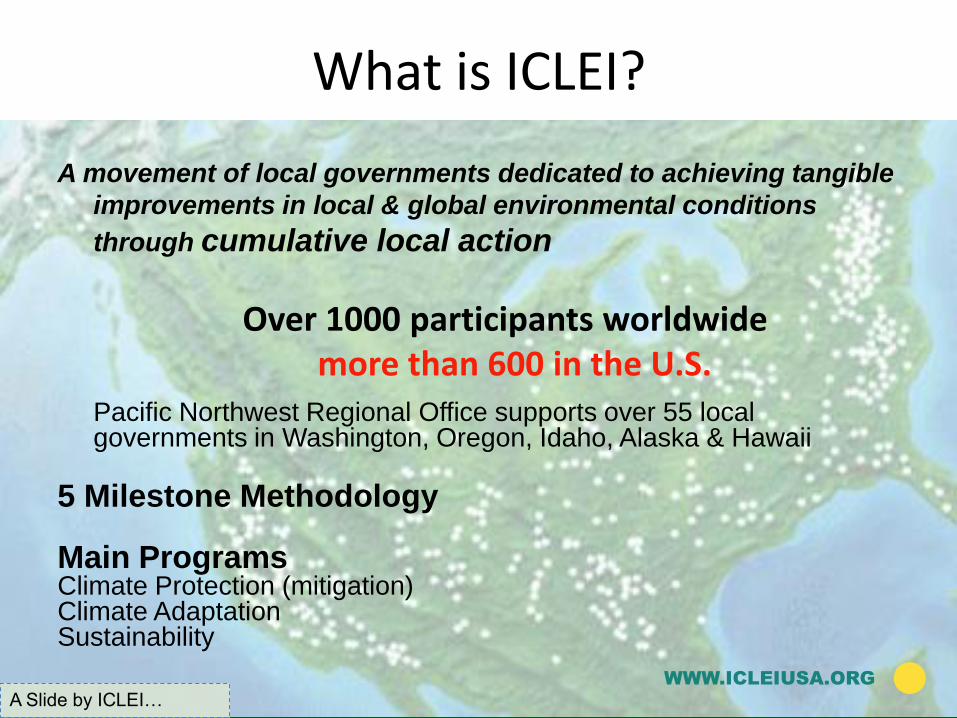
What is ICLEI?
Over 1000 participants worldwide more than 600 in the U.S.
A movement of local governments dedicated to achieving tangible
improvements in local & global environmental conditions
through cumulative local action
WWW.ICLEIUSA.ORG
Pacific Northwest Regional Office supports over 55 local governments in Washington, Oregon, Idaho, Alaska & Hawaii
5 Milestone Methodology Main Programs Climate Protection (mitigation) Climate Adaptation Sustainability
A Slide by ICLEI…
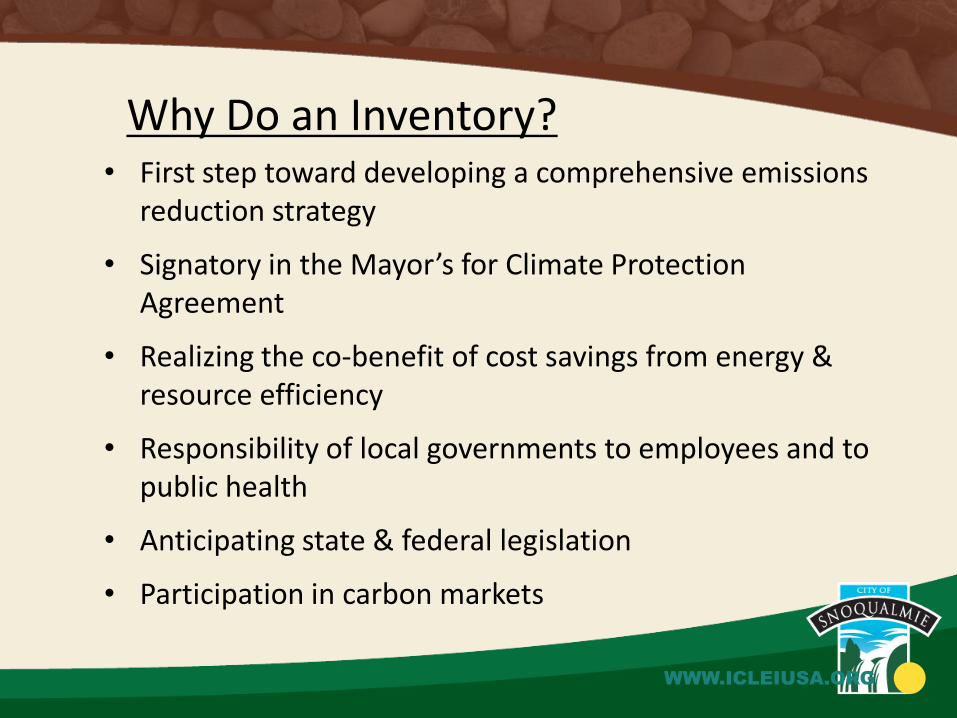
Why Do an Inventory? • First step toward developing a comprehensive emissions
reduction strategy
• Signatory in the Mayor’s for Climate Protection Agreement
• Realizing the co-benefit of cost savings from energy & resource efficiency
• Responsibility of local governments to employees and to public health
• Anticipating state & federal legislation
• Participation in carbon markets
WWW.ICLEIUSA.ORG
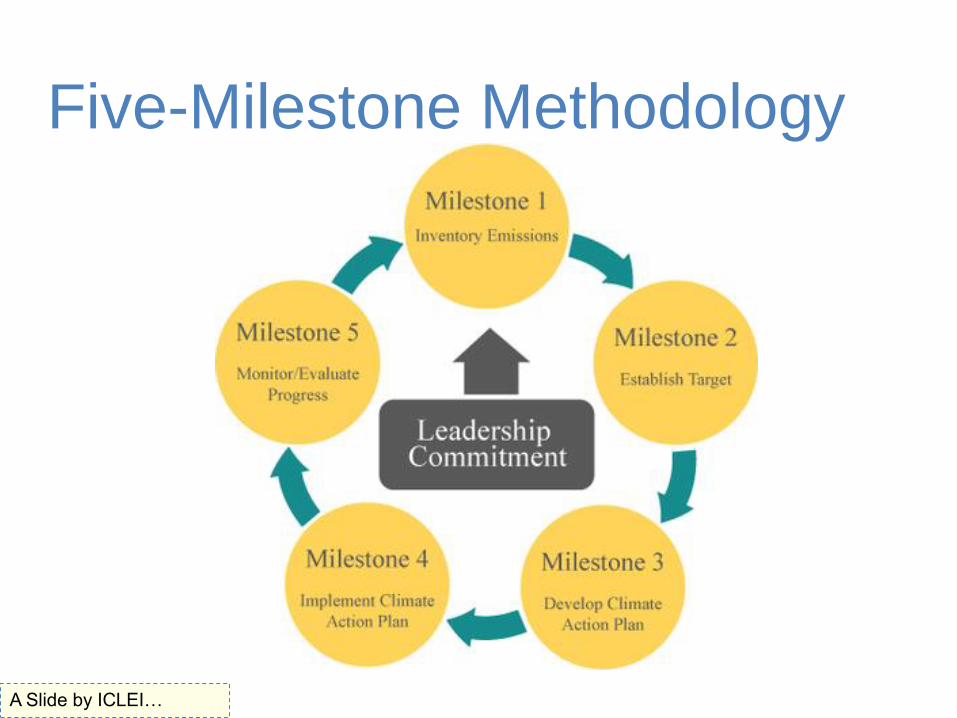
Five-Milestone Methodology
A Slide by ICLEI…
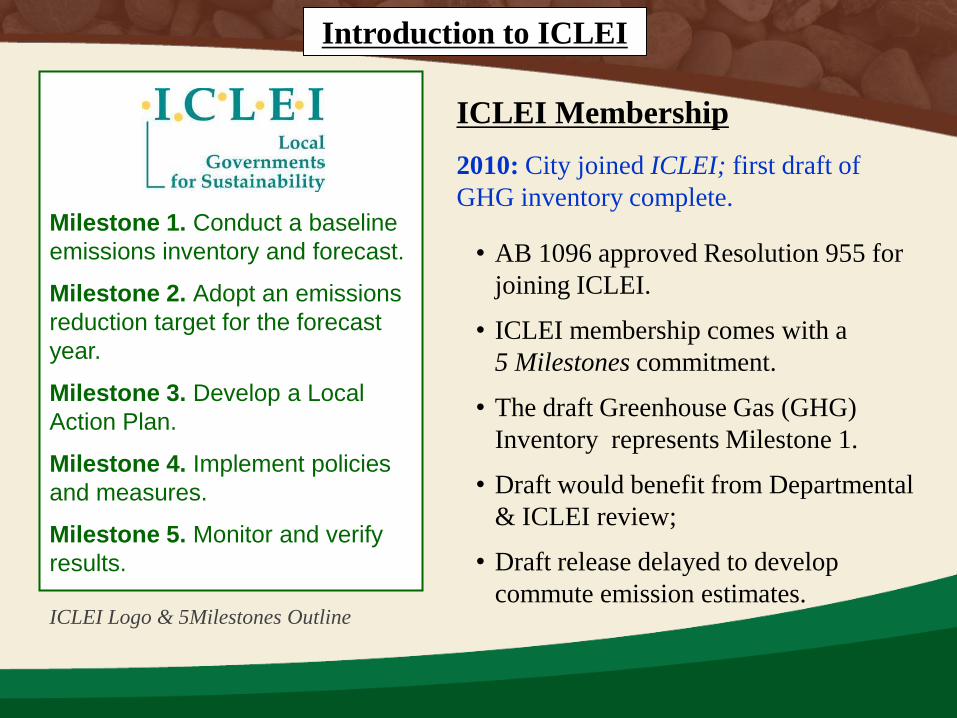
2010: City joined ICLEI; first draft of
GHG inventory complete.
• AB 1096 approved Resolution 955 for
joining ICLEI.
• ICLEI membership comes with a
5 Milestones commitment.
• The draft Greenhouse Gas (GHG)
Inventory represents Milestone 1.
• Draft would benefit from Departmental
& ICLEI review;
• Draft release delayed to develop
commute emission estimates.
Introduction to ICLEI
ICLEI Membership
ICLEI Logo & 5Milestones Outline
Milestone 1. Conduct a baseline
emissions inventory and forecast.
Milestone 2. Adopt an emissions
reduction target for the forecast
year.
Milestone 3. Develop a Local
Action Plan.
Milestone 4. Implement policies
and measures.
Milestone 5. Monitor and verify
results.
ICLEI Methodology is commonly used for
city GHG inventories.
• Methodology was developed to ensure
no overlap of emissions; derived from
business methods in Carbon Credits.
• However, the fact that it is
geographically discrete means
commuting emissions are not well-
accounted for.
• Staff has developed a separate
methodology for commuting emissions
consideration.
Introduction to ICLEI
ICLEI Methodology
ICLEI Logo & 1st Milestone
Milestone 1. Conduct a baseline
emissions inventory and forecast.
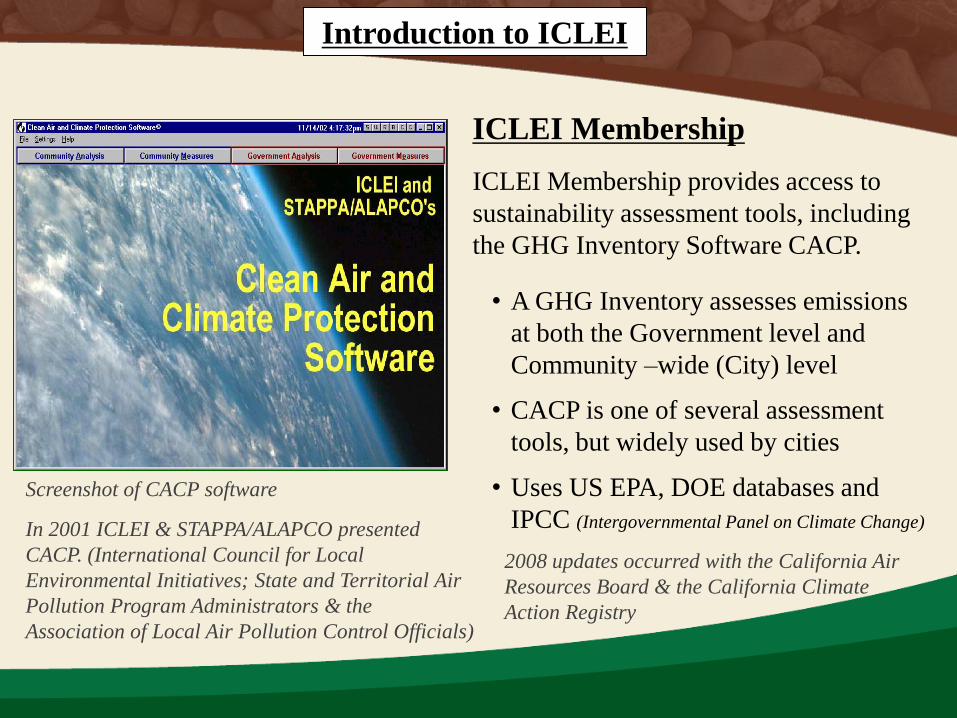
ICLEI Membership provides access to
sustainability assessment tools, including
the GHG Inventory Software CACP.
• A GHG Inventory assesses emissions
at both the Government level and
Community –wide (City) level
• CACP is one of several assessment
tools, but widely used by cities
• Uses US EPA, DOE databases and
IPCC (Intergovernmental Panel on Climate Change)
Introduction to ICLEI
ICLEI Membership
Screenshot of CACP software
In 2001 ICLEI & STAPPA/ALAPCO presented
CACP. (International Council for Local
Environmental Initiatives; State and Territorial Air
Pollution Program Administrators & the
Association of Local Air Pollution Control Officials)
2008 updates occurred with the California Air
Resources Board & the California Climate
Action Registry
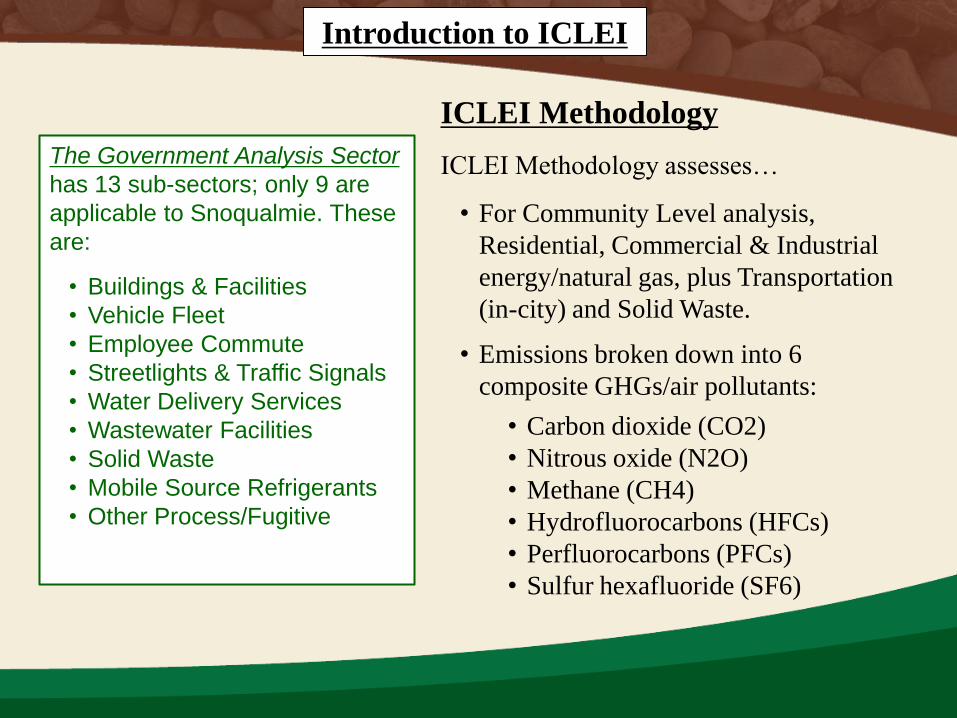
ICLEI Methodology assesses…
• For Community Level analysis,
Residential, Commercial & Industrial
energy/natural gas, plus Transportation
(in-city) and Solid Waste.
• Emissions broken down into 6
composite GHGs/air pollutants:
• Carbon dioxide (CO2)
• Nitrous oxide (N2O)
• Methane (CH4)
• Hydrofluorocarbons (HFCs)
• Perfluorocarbons (PFCs)
• Sulfur hexafluoride (SF6)
Introduction to ICLEI
ICLEI Methodology
ICLEI Logo & 1st Milestone
The Government Analysis Sector
has 13 sub-sectors; only 9 are
applicable to Snoqualmie. These
are:
• Buildings & Facilities
• Vehicle Fleet
• Employee Commute
• Streetlights & Traffic Signals
• Water Delivery Services
• Wastewater Facilities
• Solid Waste
• Mobile Source Refrigerants
• Other Process/Fugitive
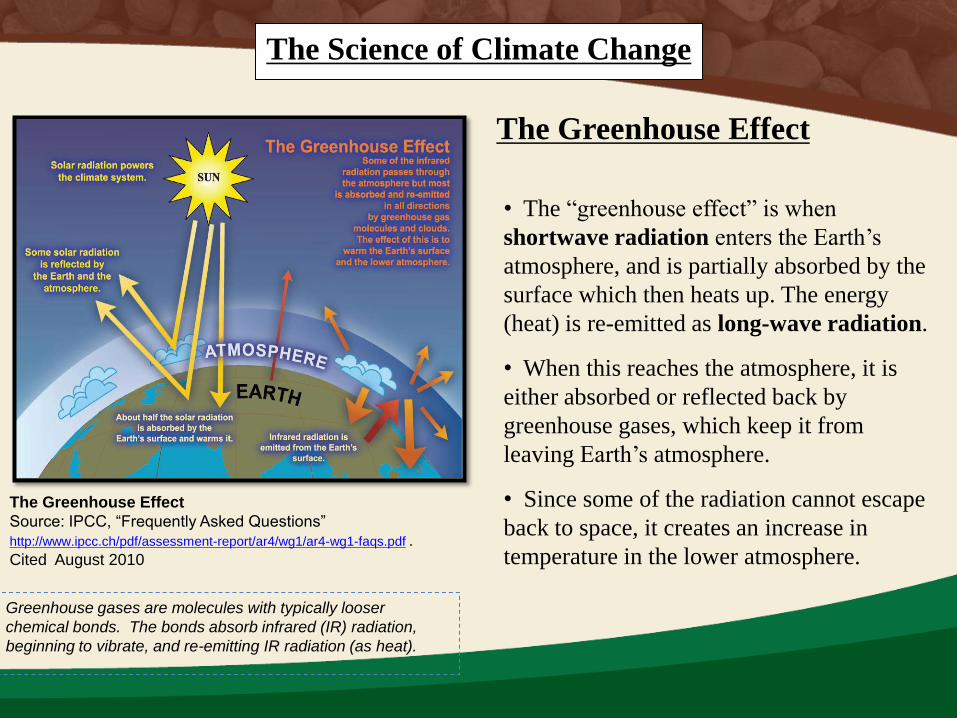
• The ―greenhouse effect‖ is when
shortwave radiation enters the Earth’s
atmosphere, and is partially absorbed by the
surface which then heats up. The energy
(heat) is re-emitted as long-wave radiation.
• When this reaches the atmosphere, it is
either absorbed or reflected back by
greenhouse gases, which keep it from
leaving Earth’s atmosphere.
• Since some of the radiation cannot escape
back to space, it creates an increase in
temperature in the lower atmosphere.
The Greenhouse Effect
The Greenhouse Effect
Source: IPCC, “Frequently Asked Questions”
http://www.ipcc.ch/pdf/assessment-report/ar4/wg1/ar4-wg1-faqs.pdf .
Cited August 2010
The Science of Climate Change
Greenhouse gases are molecules with typically looser
chemical bonds. The bonds absorb infrared (IR) radiation,
beginning to vibrate, and re-emitting IR radiation (as heat).
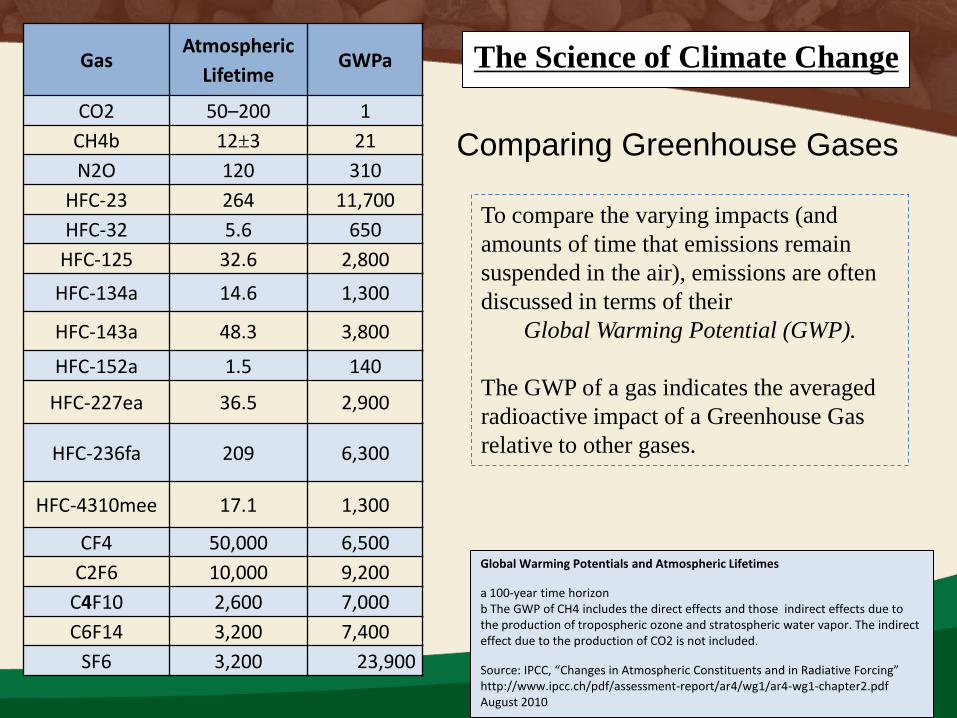
To compare the varying impacts (and
amounts of time that emissions remain
suspended in the air), emissions are often
discussed in terms of their
Global Warming Potential (GWP).
The GWP of a gas indicates the averaged
radioactive impact of a Greenhouse Gas
relative to other gases.
Gas Atmospheric
Lifetime GWPa
CO2 50–200 1
CH4b 12±3 21
N2O 120 310
HFC-23 264 11,700
HFC-32 5.6 650
HFC-125 32.6 2,800
HFC-134a 14.6 1,300
HFC-143a 48.3 3,800
HFC-152a 1.5 140
HFC-227ea 36.5 2,900
HFC-236fa 209 6,300
HFC-4310mee 17.1 1,300
CF4 50,000 6,500
C2F6 10,000 9,200
C4F10 2,600 7,000
C6F14 3,200 7,400
SF6 3,200 23,900
Global Warming Potentials and Atmospheric Lifetimes
a 100-year time horizon b The GWP of CH4 includes the direct effects and those indirect effects due to the production of tropospheric ozone and stratospheric water vapor. The indirect effect due to the production of CO2 is not included.
Source: IPCC, “Changes in Atmospheric Constituents and in Radiative Forcing” http://www.ipcc.ch/pdf/assessment-report/ar4/wg1/ar4-wg1-chapter2.pdf August 2010
Comparing Greenhouse Gases
The Science of Climate Change
Snoqualmie:
(Where?)
Not your run-of the mill Green.
We’re also a fair driving distance from
various Urban Cores.
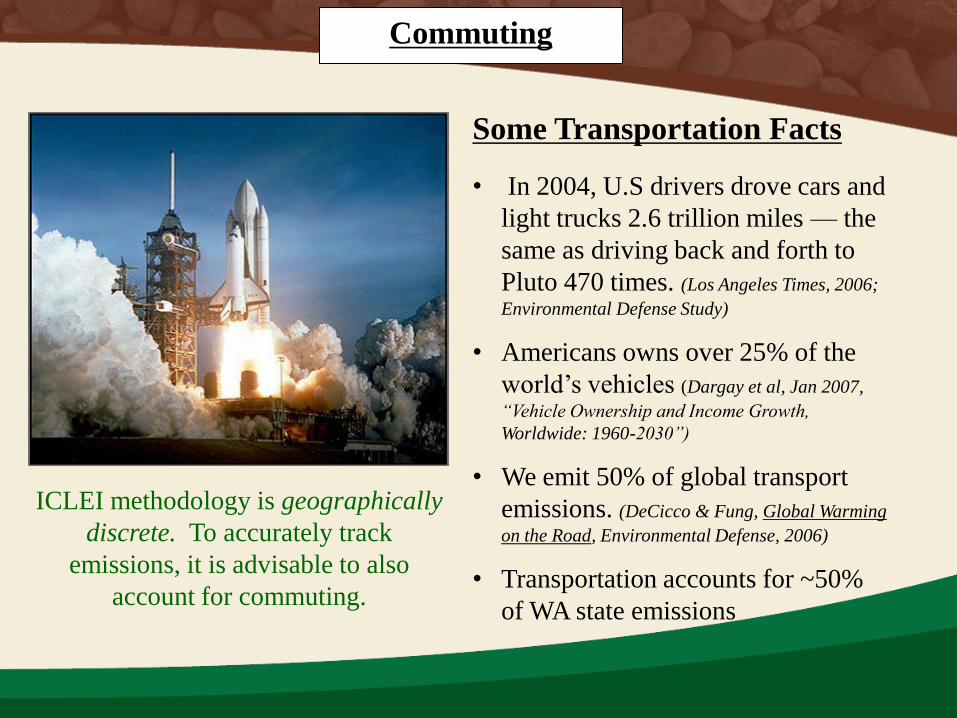
• In 2004, U.S drivers drove cars and
light trucks 2.6 trillion miles — the
same as driving back and forth to
Pluto 470 times. (Los Angeles Times, 2006;
Environmental Defense Study)
• Americans owns over 25% of the
world’s vehicles (Dargay et al, Jan 2007,
“Vehicle Ownership and Income Growth,
Worldwide: 1960-2030”)
• We emit 50% of global transport
emissions. (DeCicco & Fung, Global Warming
on the Road, Environmental Defense, 2006)
• Transportation accounts for ~50%
of WA state emissions
Commuting
Some Transportation Facts
ICLEI methodology is geographically
discrete. To accurately track
emissions, it is advisable to also
account for commuting.
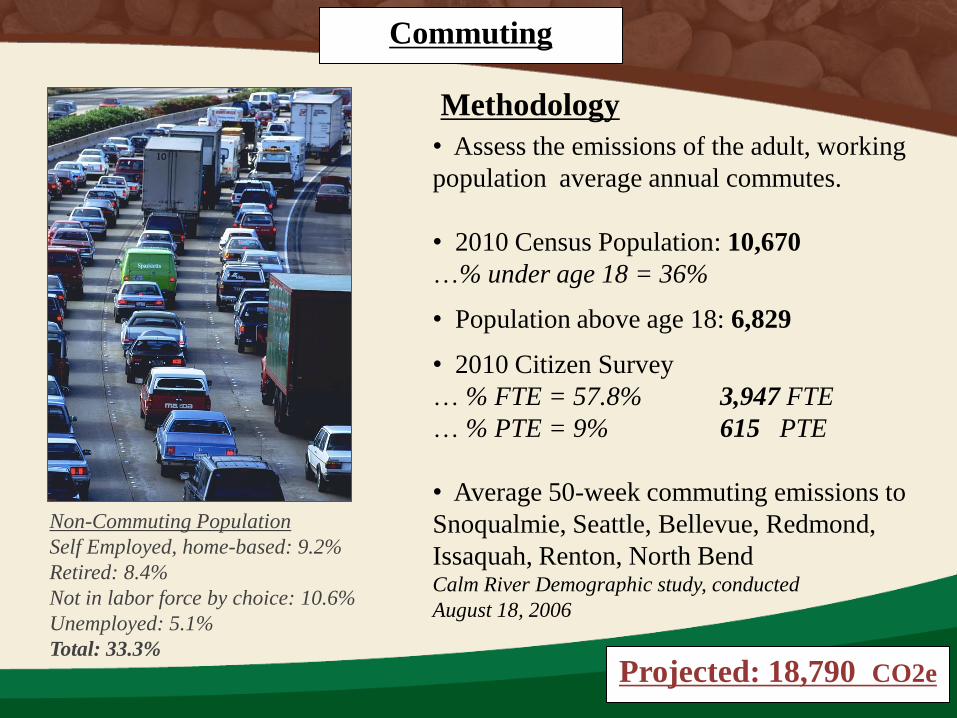
• Assess the emissions of the adult, working
population average annual commutes.
• 2010 Census Population: 10,670
…% under age 18 = 36%
• Population above age 18: 6,829
• 2010 Citizen Survey
… % FTE = 57.8% 3,947 FTE
… % PTE = 9% 615 PTE
• Average 50-week commuting emissions to
Snoqualmie, Seattle, Bellevue, Redmond,
Issaquah, Renton, North Bend Calm River Demographic study, conducted
August 18, 2006
Commuting
Methodology
Non-Commuting Population
Self Employed, home-based: 9.2%
Retired: 8.4%
Not in labor force by choice: 10.6%
Unemployed: 5.1%
Total: 33.3% Projected: 18,790 CO2e
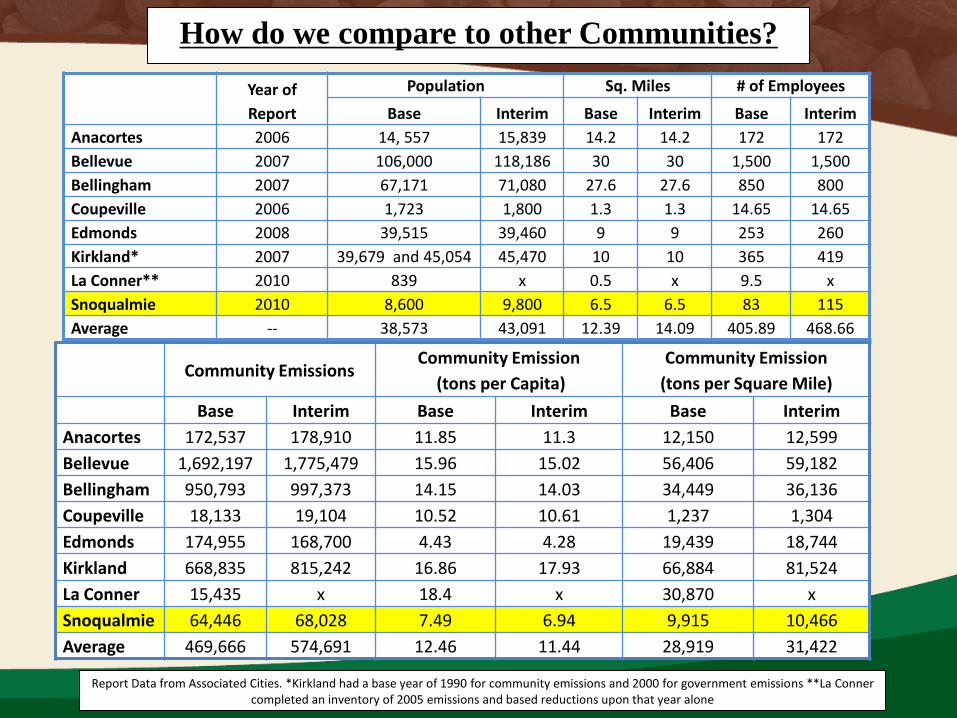
How do we compare to other Communities?
Year of
Report
Population Sq. Miles # of Employees
Base Interim Base Interim Base Interim
Anacortes 2006 14, 557 15,839 14.2 14.2 172 172
Bellevue 2007 106,000 118,186 30 30 1,500 1,500
Bellingham 2007 67,171 71,080 27.6 27.6 850 800
Coupeville 2006 1,723 1,800 1.3 1.3 14.65 14.65
Edmonds 2008 39,515 39,460 9 9 253 260
Kirkland* 2007 39,679 and 45,054 45,470 10 10 365 419
La Conner** 2010 839 x 0.5 x 9.5 x
Snoqualmie 2010 8,600 9,800 6.5 6.5 83 115
Average -- 38,573 43,091 12.39 14.09 405.89 468.66
Community Emissions
Community Emission
(tons per Capita)
Community Emission
(tons per Square Mile)
Base Interim Base Interim Base Interim
Anacortes 172,537 178,910 11.85 11.3 12,150 12,599
Bellevue 1,692,197 1,775,479 15.96 15.02 56,406 59,182
Bellingham 950,793 997,373 14.15 14.03 34,449 36,136
Coupeville 18,133 19,104 10.52 10.61 1,237 1,304
Edmonds 174,955 168,700 4.43 4.28 19,439 18,744
Kirkland 668,835 815,242 16.86 17.93 66,884 81,524
La Conner 15,435 x 18.4 x 30,870 x
Snoqualmie 64,446 68,028 7.49 6.94 9,915 10,466
Average 469,666 574,691 12.46 11.44 28,919 31,422
Report Data from Associated Cities. *Kirkland had a base year of 1990 for community emissions and 2000 for government emissions **La Conner completed an inventory of 2005 emissions and based reductions upon that year alone
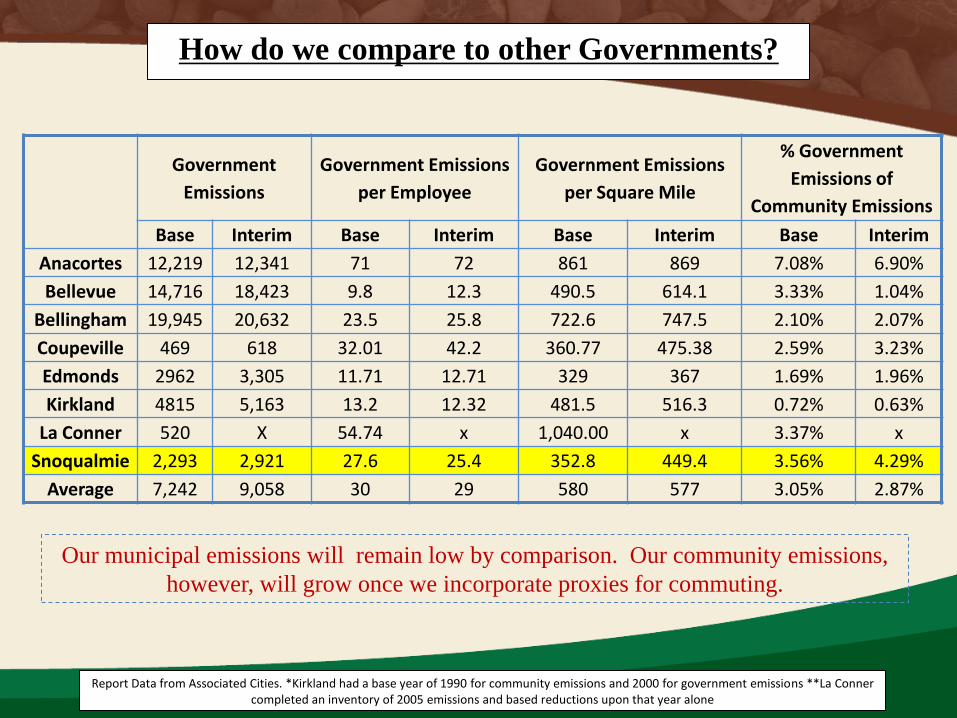
How do we compare to other Governments?
Report Data from Associated Cities. *Kirkland had a base year of 1990 for community emissions and 2000 for government emissions **La Conner completed an inventory of 2005 emissions and based reductions upon that year alone
Government
Emissions
Government Emissions
per Employee
Government Emissions
per Square Mile
% Government
Emissions of
Community Emissions
Base Interim Base Interim Base Interim Base Interim
Anacortes 12,219 12,341 71 72 861 869 7.08% 6.90%
Bellevue 14,716 18,423 9.8 12.3 490.5 614.1 3.33% 1.04%
Bellingham 19,945 20,632 23.5 25.8 722.6 747.5 2.10% 2.07%
Coupeville 469 618 32.01 42.2 360.77 475.38 2.59% 3.23%
Edmonds 2962 3,305 11.71 12.71 329 367 1.69% 1.96%
Kirkland 4815 5,163 13.2 12.32 481.5 516.3 0.72% 0.63%
La Conner 520 X 54.74 x 1,040.00 x 3.37% x
Snoqualmie 2,293 2,921 27.6 25.4 352.8 449.4 3.56% 4.29%
Average 7,242 9,058 30 29 580 577 3.05% 2.87%
Our municipal emissions will remain low by comparison. Our community emissions,
however, will grow once we incorporate proxies for commuting.
• Complete incorporation of
commuting emissions
•Allow for Departmental & ICLEI
review of draft; adopt as official if
warranted.
• Establish a process for developing
and adopting an emissions reduction
target.
• Develop a Climate Action Plan (also sustainability strategy 3.12.6)
• Considering interim reduction
GHG strategies
Next Steps
Moving Forward
Milestone 1. Conduct a baseline
emissions inventory and forecast.
Milestone 2. Adopt an emissions
reduction target for the forecast
year.
Milestone 3. Develop a Local
Action Plan.
Milestone 4. Implement policies
and measures.
Milestone 5. Monitor and verify
results.
ICLEI Logo & 5Milestones Outline