Embed Size (px)
Citation preview

2021Snapshot of Race and Home Buying in AmericaNational Association of REALTORS® Research Group

Lawrence Yun, Ph.D.Chief Economist and Senior Vice President
Jessica Lautz, Dr. of Real EstateVice President, Demographics and Behavioral Insights
Nadia EvangelouSenior Economist and Director of Forecasting
Brandi SnowdenDirector, Member and Consumer Survey Research
Meredith DunnResearch Manager
CARE: Community Aid and Real Estate
NAR Research Staff
2
©2021 National Association of REALTORS®All Rights Reserved.May not be reprinted in whole or in part without permission of the National Association of REALTORS®.For reprint information, contact [email protected] 2021

CARE: Community Aid and Real Estate
Table of Contents
Homeownership Trends and Affordability by Race 4
Methodology: Section One 18
Home Buyer Demographics from the 2020 Profile 19of Home Buyers and Sellers
Home Buyers and Fair Housing 31
Methodology: Section Two and Three 35
3

Homeownership Trends and Affordability by Race
4

Owning a home is associated with better educational performancein children, higher participation in civic and volunteering activity,better health care outcomes and lower crime rates in thecommunities.
Nevertheless, not all families have the same opportunities forhomeownership, with many facing more constraints in their effortto achieve the American Dream. Indeed, there are sizeabledifferences in the homeownership rate across racial groups, withthe rate of homeownership for minority families lagging behind thenational average. Given that homeownership contributes to wealthaccumulation and that the homeownership rate is lower in minoritygroups, data shows that the net worth for these groups is also lower.At $188,200, the net worth of a typical White family was nearly eighttimes greater than that of a Black family ($24,100) in 2019.
This report examines the homeownership trends among each racialgroup in the last 10 years. Since all real estate is local,homeownership opportunities vary by area. Thus, the report alsoexamines where most of minority homeowners are located andwhich areas are more affordable for these households. Finally, usingthe National Association of REALTORS® Profile of Home Buyers andSellers data from 2020, the report looks into the characteristics ofwho purchases homes, why they purchase, what they purchase,and the financial background for buyers based on race.
IntroductionThe 2020-2021 coronavirus pandemic caused severe economicturmoil last year as households and businesses had to adoptvarious social-distancing measures. Millions of people lost theirjobs due to the shutdown orders while many of them are stillunemployed. Unfortunately, job losses have beendisproportionately seen among African-American/BlackAmericans and Hispanic/Latino Americans. Ultimately, theeconomy will improve later this year as the COVID-19 vaccinebecomes available to more Americans and a new stimuluspackage is under negotiations.
The booming housing market was a welcome surprise amid thepandemic. In fact, home sales activity rose to its highest in 14years in 2020, contributing significantly to the recovery of theU.S. economy. Excepting the importance of the housing sectoron the economy, research has consistently shown thathomeownership is associated with multiple economic andsocial benefits to individual homeowners. Homeownership hasalways been an important way to build wealth. According to theFederal Reserve, the net worth of a homeowner was $255,000while that of renter’s was $6,300, as of 2019. That being said, thenet worth of a typical homeowner is 40 times the net worth of arenter. In addition to tangible financial benefits, homeownershipbrings substantial social benefits for families, communities, andthe country as a whole.
52021 Snapshot of Race and Home Buying in America

Homeownership Trends in the Past Decade
Today, Americans are less likely to own their own homes compared to 10 years earlier. Although thehomeownership rate has continuously risen since 2015, it remains lower than in 2009. Specifically, thehomeownership rate was 64.2% in 2019 compared to 66.0% in 2009.
However, more households became homeowners in 2019 from a year earlier. In fact, the homeownership raterose 0.2% in 2019. This translates to nearly 1 million more homeowners across the country.
However, the overall homeownership rate does not tell the full story.
62021 Snapshot of Race and Home Buying in America

The homeownership rate for White Americans has been consistently near 70% since 2017. In the same period, the homeownership rate for Black Americans has been nearly 30 percentage points lower than those of White Americans – above 41% from 2017 on. For Hispanic Americans, the homeownership rate has held above 47%, and for Asian Americans it has been above 59% over the same time period.
In the last 10 years, the homeownership rate rose only for Asians to 60.7% in 2019 from 59.5% in 2009. However, the homeownership rate for Black Americans dropped in 2019 compared to 2009, the group most affected by declines in homeownership rates before, during and after the Great Recession.
72021 Snapshot of Race and Home Buying in America

Delaware (78%), South Carolina (78%) and Mississippi (78%) were the states with the highest homeownership rates for White Americans in 2019.
In contrast, the District of Columbia (49%), Hawaii (56%) and California (59%) had the lowest homeownership rates.
The homeownership rate for White Americans varied from 49% to 78% across the country. Among 52 states including Puerto Rico and the District of Columbia, 36 states had a homeownership rate for White Americans higher than 69.8% –the national rate - in 2019.
Homeownership Rate for White Americansby state
82021 Snapshot of Race and Home Buying in America

Homeownership Rate for Black Americansby state
Puerto Rico (70%), South Carolina (52%) and Maryland (52%) were the states with the highest homeownership rates for Black Americans in 2019.
In contrast, North Dakota (5%), Wyoming (18%) and Montana (20%) had the lowest homeownership rates.
Homeownership rate for Black Americans varied from 5% to 70% across the country. Among 52 states including Puerto Rico and the District of Columbia, 18 states had a homeownership rate for Black Americans higher than 42.0% -the national rate - in 2019.
92021 Snapshot of Race and Home Buying in America
Homeownership Rate for Asian Americansby state
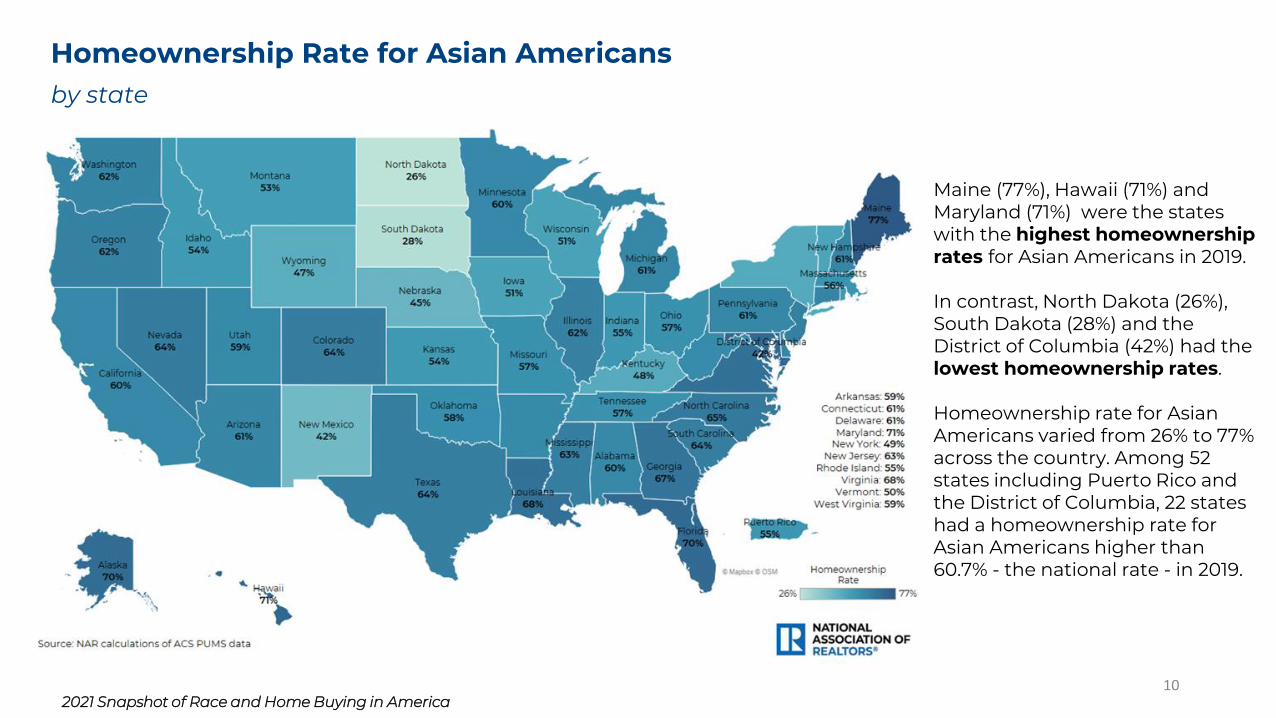
Maine (77%), Hawaii (71%) and Maryland (71%) were the states with the highest homeownership rates for Asian Americans in 2019.
In contrast, North Dakota (26%), South Dakota (28%) and the District of Columbia (42%) had the lowest homeownership rates.
Homeownership rate for Asian Americans varied from 26% to 77% across the country. Among 52 states including Puerto Rico and the District of Columbia, 22 states had a homeownership rate for Asian Americans higher than 60.7% - the national rate - in 2019.
102021 Snapshot of Race and Home Buying in America

Homeownership Rate for Hispanic Americansby state
West Virginia (71%), Puerto Rico (69%) and New Mexico (67%) were the states with the highest homeownership rates for Hispanic Americans in 2019.
In contrast, North Dakota (23%), New York (26%) and Massachusetts (28%) had the lowest homeownership rates.
Homeownership rate for Hispanic Americans varied from 23% to 71% across the country. Among 52 states including Puerto Rico and the District of Columbia, 46 states had a homeownership rate for Hispanic Americans higher than 48.1% - the national rate - in 2019.
112021 Snapshot of Race and Home Buying in America

However, affordability conditions vary by area. Fast-risinghome prices seem to be eroding the benefits of thecurrent low rates in some areas, making it more difficult forsome Americans to accomplish their home buying dream.
In South Dakota (75%) and Alaska (73%), more than 70% ofBlack Americans can afford to buy a home. In contrast,fewer than 20% of Black Americans can afford to buy ahome in the District of Columbia, Wyoming and Hawaii.
Respectively, most Hispanic Americans can afford to buy ahome in Maine (81%), Arkansas (76%) and West Virginia(76%).
Read further to see how many households of every raceand ethnicity can afford to buy the typical home in the 50states and the District of Columbia.
Affordability by Race
During the pandemic, demand has far surpassed supplyacross the nation and home prices continue to increase,eroding affordability. Specifically, inventory continues todrop, reaching record lows. In fact, the supply of homeshas been underproduced for the past decade. InDecember, the inventory of existing single-family homesfor sale dropped below two months’ supply, the lowest inthe history of the data, while six months’ supply is neededfor more reasonable affordability and a more balancedmarket.
With only a couple of months of available inventory andhomes selling in a median of three weeks, it’s no surprisethat home prices are continuing to rise across the country.In fact, home prices have continuously risen for the lastnine years, since February 2012. The median existing-homeprice rose to nearly $309,800 in December 2020; 13% morethan a year earlier; 40% more than five years earlier.
Nationwide, 43% of Black Americans can afford to buythe typical home compared to 63% of White Americans.Respectively, 71% of Asian Americans and 54% ofHispanic Americans can afford to buy the typical home.
122021 Snapshot of Race and Home Buying in America

132021 Snapshot of Race and Home Buying in America
Data shows that African-American/Black and Hispanic/Latino home buyers and would-be home buyers face extra challenges in getting a mortgage. According to NAR’s Profile of Home Buyers and Sellers, 10% of Black home buyers and 6% of Hispanic home buyers were denied mortgages, compared with about 4% of White and Asian applicants.
While the main reason the mortgage lender rejected their application is their debt-to-income ratio, Black and Hispanic/Latino home buyers reported that they were denied for having a lower credit score.
However, according to ACS PUMS data, Black home buyers are more likely to finance their home purchase. Nationwide, 76% of White home buyers financed their home purchase in 2019 compared to 81% of Black home buyers. In the meantime, Black home buyers earn less than White home buyers. In fact, the median income for Black home buyers was nearly $70,000 compared to $90,000 for White home buyers in 2019.
Financing the Home Purchase for Black Home Buyers
At the local level, in the following nine states, all Blackhome buyers were able to finance their homepurchase in 2019: Delaware, Hawaii, Iowa, Montana,New Hampshire, Utah, Vermont, West Virginia andWyoming.
However, the share of Black home buyers whofinanced their home purchase was lower than 60% inthe following states: New Mexico (0%), Maine (29%),Oklahoma (53%), Connecticut (56%) and Michigan(60%). This also means that more than 40% of Blackhome buyers paid all cash for their home purchase inthese areas. Based on the data, all Black home buyerspaid all cash for their home purchase in New Mexico.While the data doesn’t provide any information aboutthe reason that they didn’t get a home loan, the smallvalue of their purchased homes may be one of thereasons. In fact, the median home value of the homespurchased by Black Americans was $35,000 in 2019.
142021 Snapshot of Race and Home Buying in America

152021 Snapshot of Race and Home Buying in America
Distribution of Home Sales by Race
According to ACS data, nationwide, 81% of the homesales in 2019 were purchased by Whites compared to7% for Black home buyers. Respectively, the share ofhome sales for Asian Americans was 6% and 11% forHispanic Americans.
The next chart shows you how many of the homesthat were sold in 2019 were bought by race.
Maryland (23%), the District of Columbia (23%) andDelaware had the highest share of homes thatwere purchased by Black home buyers across thecountry.
162021 Snapshot of Race and Home Buying in America

172021 Snapshot of Race and Home Buying in America

Methodology: Section One
Using the ACS Public Microdata Sample (PUMS) data, NAR was able to compute homeownership rates and affordability by race at the state level. The American Community Survey releases the Public Use Microdata Sample (PUMS) files every year, which include population and housing unit records with individual response information.
Regarding affordability, qualifying income for a 30-year fixed rate mortgage was computed assuming 10% down payment. Monthly principal and interest was limited to 25% of income. After defining the qualifying income for each state, NAR calculated the percent of households for each race/ethnicity that have an income higher than the qualifying income for that specific area.
182021 Snapshot of Race and Home Buying in America

Home Buyer Demographics from the 2020 Profile of Home Buyers and Sellers
19

Using data from the 2020 Profile of Home Buyers and Sellers report we can look into the characteristics of recent home buyers, their reasons for purchasing, the steps they took in the home buying process, and the ways buyers financed their home purchase based on race.
Among all home buyers, White/Caucasian home buyers made up the largest share at 82% after April 2020, followed by Hispanic/Latino (9%), Asian/Pacific Islander (8%) and Black/African-American home buyers (5%), and Other at 2%.
Among Asian/Pacific Islander home buyers, we see the largest share of married couples at 70%. Single female home buyers were most common among Black/African-American home buyers (31%). Fifty-two percent of Asian/Pacific Islanders, and 50% of Hispanic/Latinos were first-time home buyers. While the plurality of all buyers had two-income households, the highest share of Black/African American households had one-income households.
Twenty-three percent of Asian/Pacific Islanders, and 18% of Hispanic/Latinos purchased multi-generational homes. Among those groups, they primarily purchased a multi-generational home to spend more time with aging parents, health/caretaking of aging parents/relatives, wanting a larger home that multiple incomes could afford together, and cost savings. The share of multi-generational buyers was only 15% among Black/African-American buyers and 10% among White/Caucasian buyers.
Family can help buyers in enter the buying market. Fifteen percent
Home Buyer Demographics by Race/Ethnicity
2021 Snapshot of Race and Home Buying in America 20
of Asian/Pacific Islanders, and 9% of Black/African-American,Hispanic/Latino, White/Caucasian buyers used a gift fromrelative or friend towards their downpayment for their home.Another way to help family is living at home before buying.Seventeen percent of Hispanic/Latino home buyers, 16% ofAsian/Pacific Islander home buyers, and 15% of Black/African-American buyers lived with parents, relatives, or friends prior topurchasing their home compared to only 10% ofWhite/Caucasian buyers.
Black/African-American home buyers reported the highestshare of student loan debt at 43%, with a median amount of$40,000. Asian/Pacific Islander home buyers reported the largestmedian student loan debt amount at $42,600, with 16% sayingthey had student loan debt. Black/African-American andAsian/Pacific Islander buyers had the highest share of buyerswith at least some college education.
Ten percent of Black/African-American home buyers, and 6% ofboth Hispanic/Latino and Asian/Pacific Islander buyers have hada mortgage application denied, compared with just 4% ofWhite/Caucasian buyers. While the main reason forBlack/African-American, Asian/Pacific Islander, andWhite/Caucasian buyers for being rejected by a mortgagelender was their debt to income ratio, the main reason forHispanic/Latino buyers was due to low credit score.
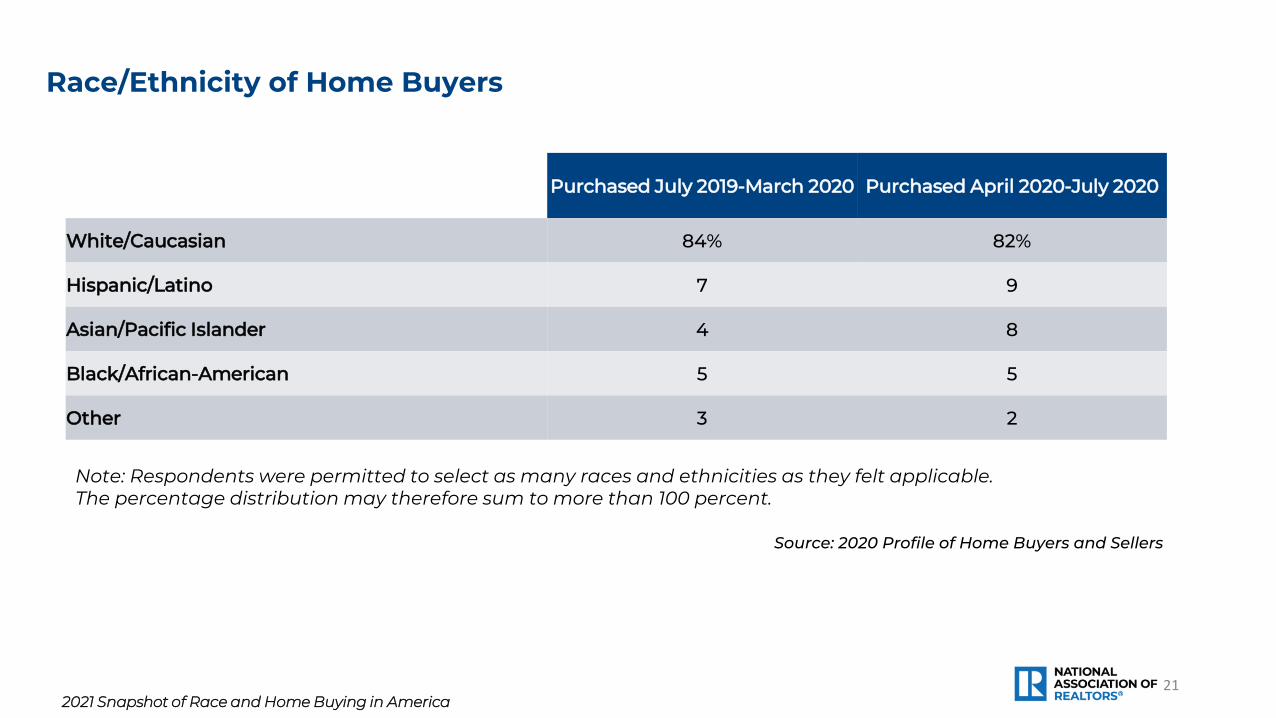
Purchased July 2019-March 2020 Purchased April 2020-July 2020
White/Caucasian 84% 82%
Hispanic/Latino 7 9
Asian/Pacific Islander 4 8
Black/African-American 5 5
Other 3 2
Note: Respondents were permitted to select as many races and ethnicities as they felt applicable.The percentage distribution may therefore sum to more than 100 percent.
Race/Ethnicity of Home Buyers
Source: 2020 Profile of Home Buyers and Sellers
212021 Snapshot of Race and Home Buying in America

Racial and Ethnic Distribution
Black/African-American
Asian/Pacific Islander Hispanic/Latino White/Caucasian
Married couple 50% 70% 59% 63%
Single female 31 10 16 17
Single male 10 8 10 10
Unmarried couple 7 10 11 9
Other 2 2 4 2
Household Composition by Race/Ethnicity
Source: 2020 Profile of Home Buyers and Sellers
222021 Snapshot of Race and Home Buying in America

Racial and Ethnic Distribution
Black/African-American
Asian/Pacific Islander Hispanic/Latino White/Caucasian
First-time buyers 48% 52% 50% 28%
Repeat buyers 52 48 50 72
Median age 48 39 40 49
Median household income $84,200 $112,500 $88,300 $97,000
Income earners in household
None 3% 2% 4% 7%
One 41 34 37 36
Two 49 58 51 53
Three or more 7 7 8 4
Buyer Demographics by Race/Ethnicity
Source: 2020 Profile of Home Buyers and Sellers
232021 Snapshot of Race and Home Buying in America
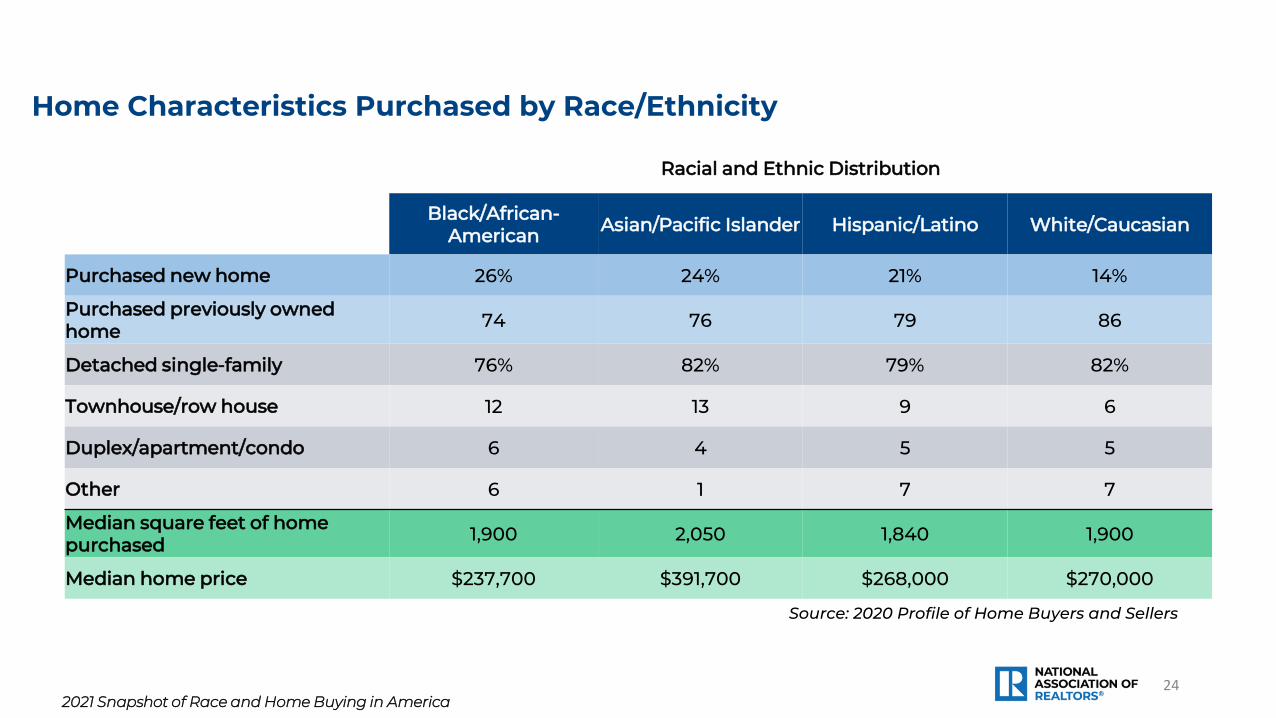
Racial and Ethnic Distribution
Black/African-American Asian/Pacific Islander Hispanic/Latino White/Caucasian
Purchased new home 26% 24% 21% 14%
Purchased previously owned home 74 76 79 86
Detached single-family 76% 82% 79% 82%
Townhouse/row house 12 13 9 6
Duplex/apartment/condo 6 4 5 5
Other 6 1 7 7
Median square feet of home purchased 1,900 2,050 1,840 1,900
Median home price $237,700 $391,700 $268,000 $270,000
Home Characteristics Purchased by Race/Ethnicity
Source: 2020 Profile of Home Buyers and Sellers
242021 Snapshot of Race and Home Buying in America

Racial and Ethnic Distribution
Black/African-American Asian/Pacific Islander Hispanic/Latino White/Caucasian
Purchased through a real estate agent or broker 87% 86% 87% 88%
Primary reason for purchasing a homeDesire to own home of own 41% 39% 39% 25%
Desire for larger home 10 7 7 10
Job-related relocation or move 5 7 5 6Change in family situation (e.g. marriage, birth of child, divorce, etc.)
6 5 7 8
Desire to be closer to family/friends/relatives 3 5 4 10
Desire for a home in a better area 4 5 5 6
Desire to be closer to job/school/transit 2 9 4 3
Purchased Through Real Estate Agent/Broker, and Reasons For Purchase by Race/Ethnicity
Source: 2020 Profile of Home Buyers and Sellers
252021 Snapshot of Race and Home Buying in America

Racial and Ethnic DistributionBlack/African-
American Asian/Pacific Islander Hispanic/Latino White/Caucasian
Multi-generationalhousehold 15% 23% 18% 10%
Reasons for purchaseChildren/relatives over18 moving back into thehouse
18% 14% 15% 21%
Wanted a larger homethat multiple incomescould afford together
18 30 11 10
Health/caretakingof aging parents/relatives 16 26 21 27
To spend more timewith aging parents 15 37 23 13
Cost savings 13 27 24 14Children/relatives over18 never left home 10 11 17 15
None of the above 33 19 21 25
Other 10 3 6 8
Purchased Multi-Generational Home by Race/Ethnicity
Source: 2020 Profile of Home Buyers and Sellers
262021 Snapshot of Race and Home Buying in America
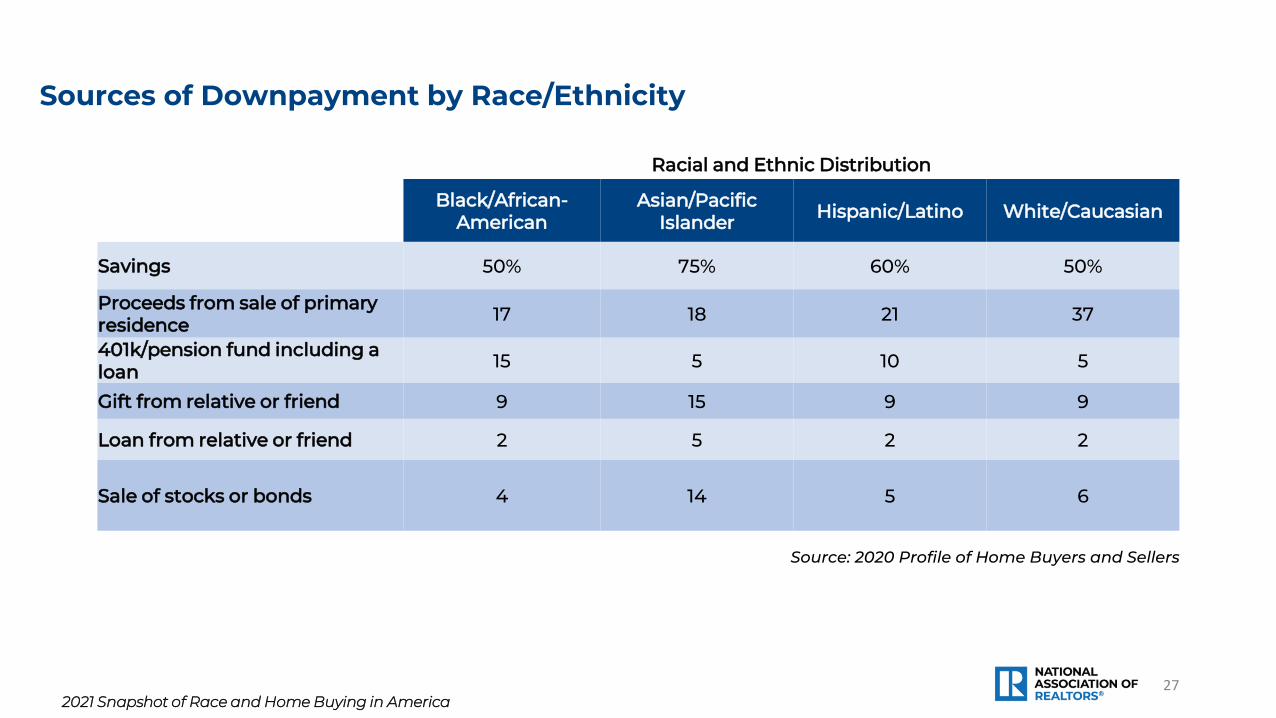
Racial and Ethnic Distribution
Black/African-American
Asian/Pacific Islander Hispanic/Latino White/Caucasian
Savings 50% 75% 60% 50%
Proceeds from sale of primary residence 17 18 21 37
401k/pension fund including a loan 15 5 10 5
Gift from relative or friend 9 15 9 9
Loan from relative or friend 2 5 2 2
Sale of stocks or bonds 4 14 5 6
Sources of Downpayment by Race/Ethnicity
Source: 2020 Profile of Home Buyers and Sellers
272021 Snapshot of Race and Home Buying in America

Racial and Ethnic DistributionBlack/African-
American Asian/Pacific Islander Hispanic/Latino White/Caucasian
Previous living arrangement
Rented an apartment or house 52% 49% 48% 35%
Owned previous home 31 34 34 54
Lived with parents/relatives/friends, paid rent 9 8 9 5
Lived with parents/relatives/friends, did not pay rent
6 8 8 5
Rented the home ultimately purchased 2 1 1 1
Prior Living Arrangement by Race/Ethnicity
Source: 2020 Profile of Home Buyers and Sellers
282021 Snapshot of Race and Home Buying in America

Racial and Ethnic Distribution
Black/African-American
Asian/Pacific Islander Hispanic/Latino White/Caucasian
Less than high school * 1% 3% 1%
High School diploma 16 7 20 18
Associates degree 16 6 16 13
Bachelor's degree 26 32 28 31
Some graduate work 5 1 6 7
Master's degree/MBA/law degree 30 33 22 24
Doctoral degree 7 20 5 7
Have student loan debt 43% 16% 24% 21%
Median student loan debt amount $40,000 $42,600 $20,000 $30,000
Education Level of Household Head and Student Debt by Race/Ethnicity
* Less than 1 percent Source: 2020 Profile of Home Buyers and Sellers
292021 Snapshot of Race and Home Buying in America

Racial and Ethnic DistributionBlack/African-
American Asian/Pacific Islander Hispanic/Latino White/Caucasian
Have had application denied 10% 6% 6% 4%
Median number of times application was denied 1 2 1 1
Reason for being rejected by mortgage lenderDebt to income ratio 59% 18% 31% 32%
Low credit score 48 9 35 22
Income was unable to be verified 5 9 14 16
Not enough money in reserves 5 9 6 10
Insufficient downpayment 3 9 3 6
Too soon after refinancing another property * * * 2
Don't know 5 14 6 8
Other 18 50 26 29
Buyer Mortgage Application Had Been Rejected From Mortgage Lender by Race/Ethnicity
* Less than 1 percent Source: 2020 Profile of Home Buyers and Sellers
302021 Snapshot of Race and Home Buying in America

31
Home Buyers and Fair Housing

In addition to being asked about their recent home buyingexperience, recent home buyers were also asked if they hadexperienced or witnessed discrimination during their realestate transaction. When asked about their neighborhood andif the majority of residents are the same race as them, 64% ofAsian/Pacific Islander, 63% of Black/African-American, and 55%of Hispanic/Latino home buyers said that the majority of theirneighborhood is not the same race as them. This is comparedto only 14% of White/Caucasian home buyers saying that themajority of their neighborhood is not the same race as them.Seventy-one percent of White/Caucasian home buyers saidthat the majority of the neighborhood was the same race asthem. In comparison, 26% of Hispanic/Latino, 24% ofBlack/African-American, and 23% of Asian/Pacific Islanderhome buyers said that the majority of their neighborhood wasthe same race as them.
Looking at ways recent home buyers witnessed or experienceddiscrimination in a real estate transaction, the most commondiscrimination was steering towards or away from specificneighborhoods with 34% of both Hispanic/Latino andWhite/Caucasian home buyers experienced this. Black/African-American and Asian/Pacific Islander home buyers were morelikely to report witnessing or experiencing discrimination withmore strict requirements for themselves, the type of loanproduct offered, and purchase offers being denied for possiblydiscriminatory reasons.
Home Buyers and Fair Housing
2021 Snapshot of Race and Home Buying in America 32
When recent home buyers were asked whether theyexperienced discrimination in a real estate transaction, 7% ofBlack/African-American, 5% of Asian/Pacific Islander, and 1% ofHispanic/Latino home buyers experienced discrimination basedon race. Three percent of Black/African-American, and 2% ofAsian/Pacific Islander home buyers experienced discriminationbased on color. Forty-five percent of Black/African-American,35% of Asian/Pacific Islander, 32% of Hispanic/Latino, and 26%of White/Caucasian home buyers did not experiencediscrimination in their real estate transaction, but believe that itexists. Nine percent of Black/African-American, and 1% ofWhite/Caucasian home buyers reported the discriminationagainst them to a government agency.

Racial and Ethnic Distribution
Black/African-American Asian/Pacific Islander Hispanic/Latino White/Caucasian
The majority of residents in your neighborhood are the same race as you
Yes, majority are same race 24% 23% 26% 71%
No, majority are not same race 63 64 55 14
Don’t know 12 13 19 14Ways you witnessed or experienced discrimination in a real estate transaction
More strict requirements for myself 41% 27% 19% 16%
Type of loan product offered 34 25 12 14Purchase offer denied for possibly discriminatory reasons 31 20 * 11
Steering towards or away from specific neighborhoods 30 28 34 34
Refusal of home owner or agent to show property to particular classes 11 16 9 9
Other 31 39 39 36
Neighborhood Residents and Discrimination in Transactions by Race/Ethnicity
* Less than 1 percent Source: 2020 Profile of Home Buyers and Sellers
332021 Snapshot of Race and Home Buying in America

Racial and Ethnic Distribution
Black/African-American Asian/Pacific Islander Hispanic/Latino White/Caucasian
Experienced discrimination in a real estate transaction against any of the followingRace 7% 5% 1% *Color 3 2 * *Religion * 1 * *Sex * 1 1 1Disability * 1 * *Familial status (including marriage or parental status) * 1 * *
National Origin * 2 * *Sexual orientation * 1 * *Not sure 6 9 3 1No, but I believe it exists 45 35 32 26No 43 54 65 73Reported the discrimination to a government agencyYes, reported 9% * * 1%No, did not report 91 100 100 99
Discrimination in Home Search and Reporting Discrimination by Race/Ethnicity
* Less than 1 percent Source: 2020 Profile of Home Buyers and Sellers
342021 Snapshot of Race and Home Buying in America

Methodology: Section Two and ThreeIn July 2020, NAR mailed out a 131-question survey using a random sample weighted to be representative of sales on a geographic basis to 132,550 recent home buyers. The recent home buyers had to have purchased a primary residence home between July of 2019 and June of 2020. A total 8,212 responses were received from primary residence buyers. After accounting for undeliverable questionnaires, the survey had an adjusted response rate of 6.2 percent.
Respondents had the option to fill out the survey via hard copy or online. The online survey was available in English and Spanish.
Consumer names and addresses were obtained from Experian, a firm that maintains an extensive database of recent home buyers derived from county records. Information about sellers comes from those buyers who also sold a home.
All information in this Profile is characteristic of the 12-month period ending June 2020, with the exception of income data, which are reported for 2019. In some sections comparisons are also given for results obtained in previous surveys. Not all results are directly comparable due to changes in questionnaire design and sample size. Some results are presented for the four U.S. Census regions: Northeast, Midwest, South, and West. The median is the primary statistical measure used throughout this report. Due to rounding and omissions for space, percentage distributions may not add to 100 percent.
Data gathered in the report is based on primary residence home buyers. From the Realtors Confidence Index, 85 percent of home buyers were primary residence buyers in 2019, which accounts for 5,270,000 homes sold in 2019 (accounting for new and existing homes). Using that calculation, the sample at the 95 percent confidence level has a confidence interval of plus-or-minus 1.08%.
352021 Snapshot of Race and Home Buying in America

The National Association of REALTORS® is America’s largest trade association, representing more than 1.4 million members, including NAR’s institutes, societies and councils,
involved in all aspects of the real estate industry. NAR membership includes brokers, salespeople, property managers, appraisers, counselors and others engaged in both
residential and commercial real estate.
The term REALTOR® is a registered collective membership mark that identifies a real estate professional who is a member of the National Association of REALTORS® and
subscribes to its strict Code of Ethics.
Working for America’s property owners, the National Association provides a facility for professional development, research and exchange of information among its members and
to the public and government for the purpose of preserving the free enterprise system and the right to own real property.
NATIONAL ASSOCIATION OF REALTORS®
RESEARCH GROUP
The Mission of the NATIONAL ASSOCIATION OF REALTORS® Research Group is to
produce timely, data-driven market analysis and authoritative business intelligence to serve
members, and inform consumers, policymakers and the media in a professional and accessible
manner.
To find out about other products from NAR’s Research Group, visit
nar.realtor/research-and-statistics
NATIONAL ASSOCIATION OF REALTORS®
Research Group
500 New Jersey Avenue, NW
Washington, DC 20001
202-383-1000
362021 Snapshot of Race and Home Buying in America