Embed Size (px)
Citation preview
International Markets Bureau
MARKET ANALYSIS REPORT | SEPTEMBER 2013
Snack, Cereal and Nutrition Bars
in the United States
Source: Mintel GNPD. Source: Mintel GNPD.
EXECUTIVE SUMMARY INSIDE THIS ISSUE
PAGE 2
Snack, Cereal and Nutrition Bars in the United States
Executive Summary 2
Market Snapshot 3
Snack Bars Market Sizes 4
Health and Wellness Snack Bars Market
5
Organic Snack Bars 6
Energy and Nutrition Bars 7
Consumer Trends 8
Claims Analysis 11
Distribution Channels 13
Examples of Product Innovation
19
References 21
Market Shares by Brand and Company
12
Snack Bar Product Trends 15
Total health and wellness food and beverage sales in the United States are on the rebound, growing by 2% from 2011 to 2012 (and 6% from 2010 to 2012), despite the economic slowdown that the U.S. experienced these past 5 years. It now appears that with a recovering economy, Americans are again receptive to buying health foods. However, future growth may be hampered by the frugality that American consumers have adopted, meaning that consumers may be more price-sensitive in shopping for healthy options. U.S. packaged food as a whole is recovering from the economic downturn; U.S. organic packaged food sales are also recovering. Organic products are sub-category of the health and wellness sector. Organic products carry a higher price than their conventional counterparts, so it is not surprising that sales were affected by the economic slowdown. Before the recession of 2008, organic packaged food value sales enjoyed double-digit growth before plunging. Now organic packaged food value sales are recovering again; they increased by 2.1% between 2011 and 2012, to reach US$12.2 billion. Snack, cereal and nutrition bars continued their growth in 2012, with an ever-expanding array of flavours and healthy varieties. After jumping by 5.7% in 2011, value sales increased by another 6% in 2012, putting the entire category at around US$6 billion sales. Not long ago, products like organic cereal, energy and nutrition bars were niche products used largely by athletes and dieters as a workout aid and meal supplement. These health benefits proved to be the foundation for the category’s rapid transformation in the 2000s, as organic bars moved from the gym bag to the handbag and desk drawer. Today, many consumers are reaching for energy and nutrition bars to supplement their regular eating habits, while some time-pressed consumers even substitute a bar or two for an a breakfast on the go or an entire meal. Please note, the definition of snack, cereal and nutrition bars can be subjective, and manufacturers can market brands for a variety of eating occasions. Consumers know that the same product can be used as a snack, a meal replacement, a supplement, or as part of a special diet or weight-loss program.
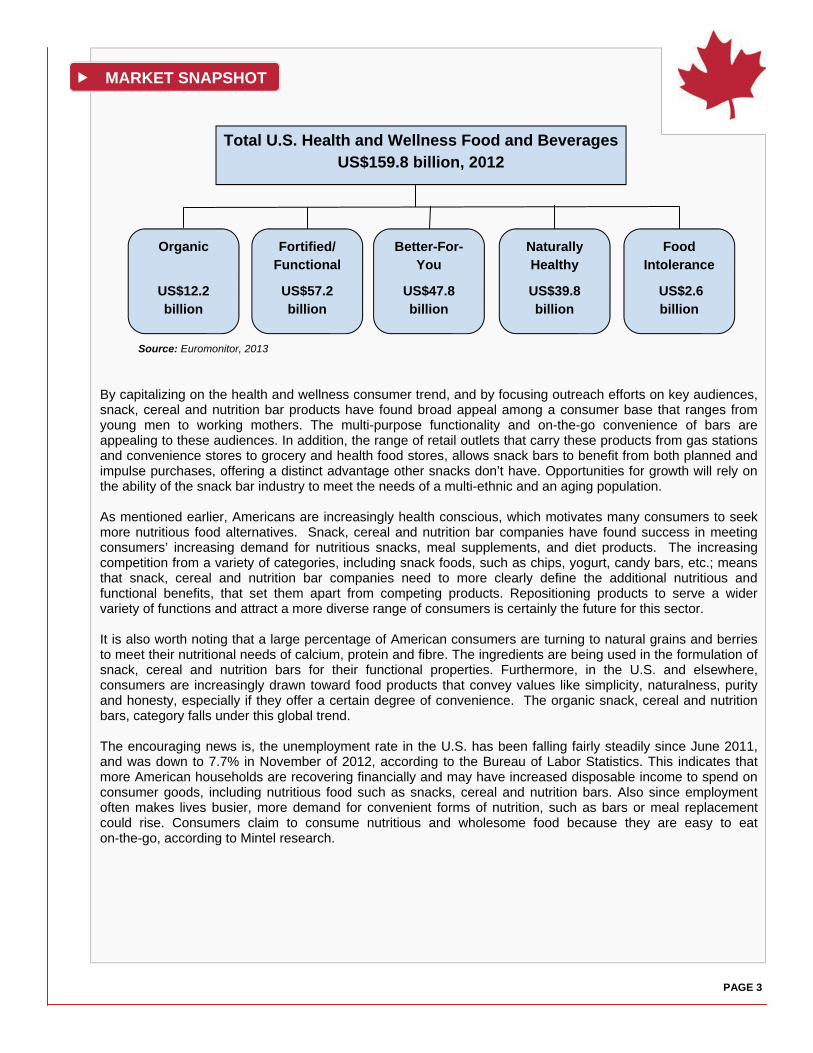
Organic
US$12.2 billion
Fortified/Functional
US$57.2 billion
Better-For- You
US$47.8 billion
Naturally Healthy
US$39.8 billion
Food Intolerance
US$2.6 billion
Total U.S. Health and Wellness Food and Beverages US$159.8 billion, 2012
Source: Euromonitor, 2013
MARKET SNAPSHOT
By capitalizing on the health and wellness consumer trend, and by focusing outreach efforts on key audiences, snack, cereal and nutrition bar products have found broad appeal among a consumer base that ranges from young men to working mothers. The multi-purpose functionality and on-the-go convenience of bars are appealing to these audiences. In addition, the range of retail outlets that carry these products from gas stations and convenience stores to grocery and health food stores, allows snack bars to benefit from both planned and impulse purchases, offering a distinct advantage other snacks don’t have. Opportunities for growth will rely on the ability of the snack bar industry to meet the needs of a multi-ethnic and an aging population. As mentioned earlier, Americans are increasingly health conscious, which motivates many consumers to seek more nutritious food alternatives. Snack, cereal and nutrition bar companies have found success in meeting consumers’ increasing demand for nutritious snacks, meal supplements, and diet products. The increasing competition from a variety of categories, including snack foods, such as chips, yogurt, candy bars, etc.; means that snack, cereal and nutrition bar companies need to more clearly define the additional nutritious and functional benefits, that set them apart from competing products. Repositioning products to serve a wider variety of functions and attract a more diverse range of consumers is certainly the future for this sector. It is also worth noting that a large percentage of American consumers are turning to natural grains and berries to meet their nutritional needs of calcium, protein and fibre. The ingredients are being used in the formulation of snack, cereal and nutrition bars for their functional properties. Furthermore, in the U.S. and elsewhere, consumers are increasingly drawn toward food products that convey values like simplicity, naturalness, purity and honesty, especially if they offer a certain degree of convenience. The organic snack, cereal and nutrition bars, category falls under this global trend. The encouraging news is, the unemployment rate in the U.S. has been falling fairly steadily since June 2011, and was down to 7.7% in November of 2012, according to the Bureau of Labor Statistics. This indicates that more American households are recovering financially and may have increased disposable income to spend on consumer goods, including nutritious food such as snacks, cereal and nutrition bars. Also since employment often makes lives busier, more demand for convenient forms of nutrition, such as bars or meal replacement could rise. Consumers claim to consume nutritious and wholesome food because they are easy to eat on-the-go, according to Mintel research.
PAGE 3
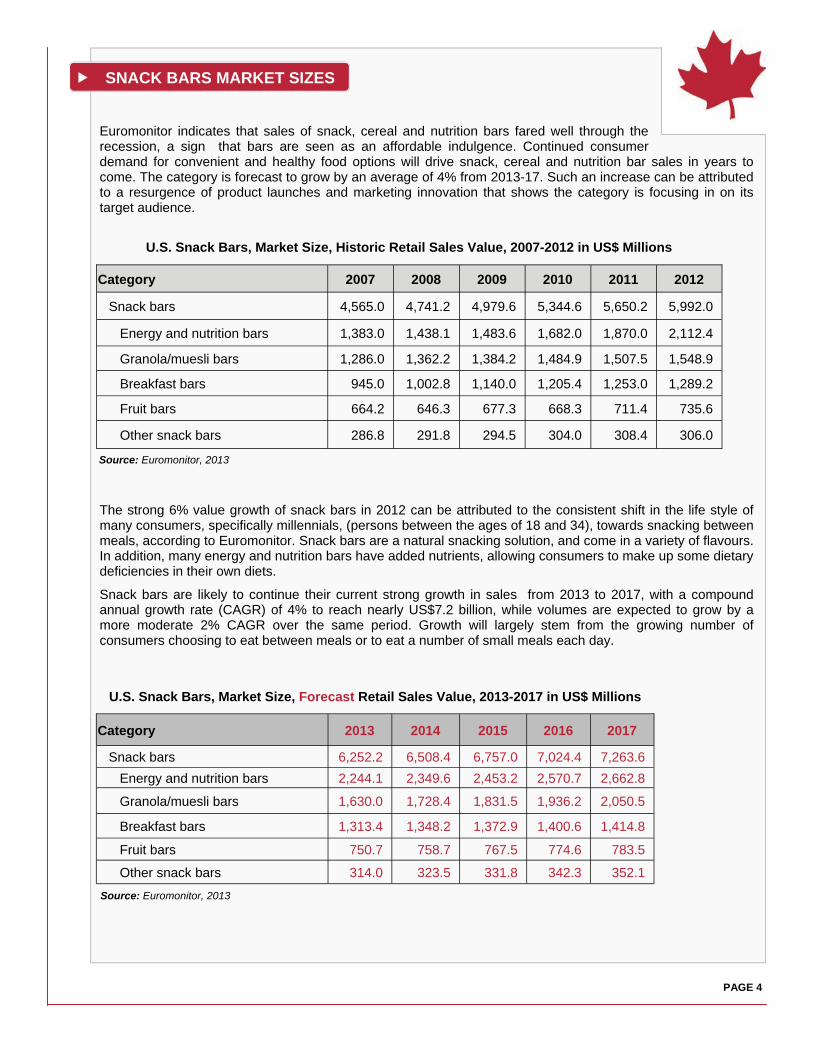
Category 2007 2008 2009 2010 2011 2012
Snack bars 4,565.0 4,741.2 4,979.6 5,344.6 5,650.2 5,992.0
Energy and nutrition bars 1,383.0 1,438.1 1,483.6 1,682.0 1,870.0 2,112.4
Granola/muesli bars 1,286.0 1,362.2 1,384.2 1,484.9 1,507.5 1,548.9
Breakfast bars 945.0 1,002.8 1,140.0 1,205.4 1,253.0 1,289.2
Fruit bars 664.2 646.3 677.3 668.3 711.4 735.6
Other snack bars 286.8 291.8 294.5 304.0 308.4 306.0
Euromonitor indicates that sales of snack, cereal and nutrition bars fared well through the recession, a sign that bars are seen as an affordable indulgence. Continued consumer demand for convenient and healthy food options will drive snack, cereal and nutrition bar sales in years to come. The category is forecast to grow by an average of 4% from 2013-17. Such an increase can be attributed to a resurgence of product launches and marketing innovation that shows the category is focusing in on its target audience.
The strong 6% value growth of snack bars in 2012 can be attributed to the consistent shift in the life style of many consumers, specifically millennials, (persons between the ages of 18 and 34), towards snacking between meals, according to Euromonitor. Snack bars are a natural snacking solution, and come in a variety of flavours. In addition, many energy and nutrition bars have added nutrients, allowing consumers to make up some dietary deficiencies in their own diets.
Snack bars are likely to continue their current strong growth in sales from 2013 to 2017, with a compound annual growth rate (CAGR) of 4% to reach nearly US$7.2 billion, while volumes are expected to grow by a more moderate 2% CAGR over the same period. Growth will largely stem from the growing number of consumers choosing to eat between meals or to eat a number of small meals each day.
U.S. Snack Bars, Market Size, Historic Retail Sales Value, 2007-2012 in US$ Millions
Category 2013 2014 2015 2016 2017
Snack bars 6,252.2 6,508.4 6,757.0 7,024.4 7,263.6 Energy and nutrition bars 2,244.1 2,349.6 2,453.2 2,570.7 2,662.8
Granola/muesli bars 1,630.0 1,728.4 1,831.5 1,936.2 2,050.5
Breakfast bars 1,313.4 1,348.2 1,372.9 1,400.6 1,414.8
Fruit bars 750.7 758.7 767.5 774.6 783.5
Other snack bars 314.0 323.5 331.8 342.3 352.1
U.S. Snack Bars, Market Size, Forecast Retail Sales Value, 2013-2017 in US$ Millions
Source: Euromonitor, 2013
Source: Euromonitor, 2013
SNACK BARS MARKET SIZES
PAGE 4
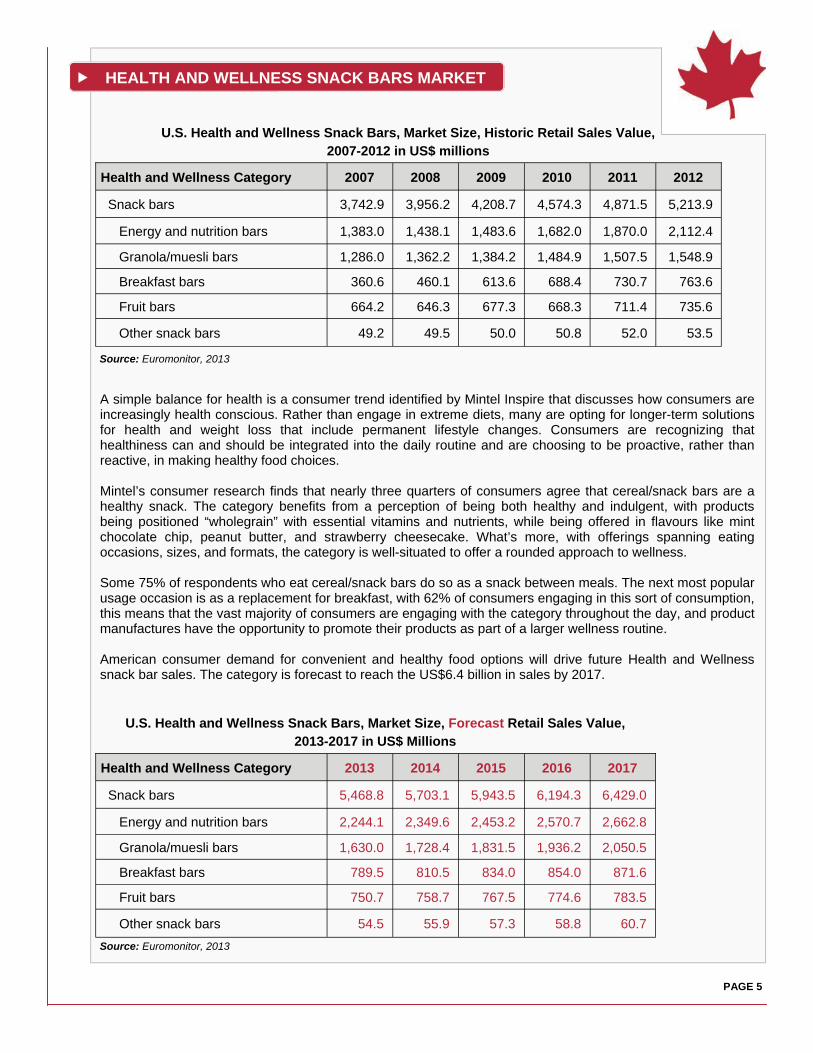
U.S. Health and Wellness Snack Bars, Market Size, Historic Retail Sales Value, 2007-2012 in US$ millions
Source: Euromonitor, 2013
A simple balance for health is a consumer trend identified by Mintel Inspire that discusses how consumers are increasingly health conscious. Rather than engage in extreme diets, many are opting for longer-term solutions for health and weight loss that include permanent lifestyle changes. Consumers are recognizing that healthiness can and should be integrated into the daily routine and are choosing to be proactive, rather than reactive, in making healthy food choices. Mintel’s consumer research finds that nearly three quarters of consumers agree that cereal/snack bars are a healthy snack. The category benefits from a perception of being both healthy and indulgent, with products being positioned “wholegrain” with essential vitamins and nutrients, while being offered in flavours like mint chocolate chip, peanut butter, and strawberry cheesecake. What’s more, with offerings spanning eating occasions, sizes, and formats, the category is well-situated to offer a rounded approach to wellness. Some 75% of respondents who eat cereal/snack bars do so as a snack between meals. The next most popular usage occasion is as a replacement for breakfast, with 62% of consumers engaging in this sort of consumption, this means that the vast majority of consumers are engaging with the category throughout the day, and product manufactures have the opportunity to promote their products as part of a larger wellness routine. American consumer demand for convenient and healthy food options will drive future Health and Wellness snack bar sales. The category is forecast to reach the US$6.4 billion in sales by 2017.
U.S. Health and Wellness Snack Bars, Market Size, Forecast Retail Sales Value, 2013-2017 in US$ Millions
PAGE 5
HEALTH AND WELLNESS SNACK BARS MARKET
Health and Wellness Category 2007 2008 2009 2010 2011 2012
Snack bars 3,742.9 3,956.2 4,208.7 4,574.3 4,871.5 5,213.9
Energy and nutrition bars 1,383.0 1,438.1 1,483.6 1,682.0 1,870.0 2,112.4
Granola/muesli bars 1,286.0 1,362.2 1,384.2 1,484.9 1,507.5 1,548.9
Breakfast bars 360.6 460.1 613.6 688.4 730.7 763.6
Fruit bars 664.2 646.3 677.3 668.3 711.4 735.6
Other snack bars 49.2 49.5 50.0 50.8 52.0 53.5
Health and Wellness Category 2013 2014 2015 2016 2017
Snack bars 5,468.8 5,703.1 5,943.5 6,194.3 6,429.0
Energy and nutrition bars 2,244.1 2,349.6 2,453.2 2,570.7 2,662.8
Granola/muesli bars 1,630.0 1,728.4 1,831.5 1,936.2 2,050.5
Breakfast bars 789.5 810.5 834.0 854.0 871.6
Fruit bars 750.7 758.7 767.5 774.6 783.5
Other snack bars 54.5 55.9 57.3 58.8 60.7 Source: Euromonitor, 2013
PAGE 6
The majority of American consumers, over 200 million people, eat breakfast on weekdays and weekends, according to Mintel’s report, “Breakfast Cereal — U.S., February 2012.” This suggests that breakfast is still an important eating occasion for most people. However, the report indicates that breakfast cereal sales are in decline. One reason is that consumers are turning to cereal bars as a quick alternative to the traditional bowl of cereal. Increased cereal bar sales over the same time period confirm this.
Furthermore, Mintel’s consumer research in 2012 shows that, among those who eat cereal bars, 83% have them for breakfast. Manufacturers can widen the market for cereal bars by downplaying the connection with breakfast cereals and highlighting their role as an anytime snack.
As a result, much of the growth in the cereal bar market is a direct result of shoppers reaching out for better-for-you alternatives to morning pastries or afternoon candy bars. This is a positive cue that consumers see cereal bars as compatible with leading a healthy lifestyle.
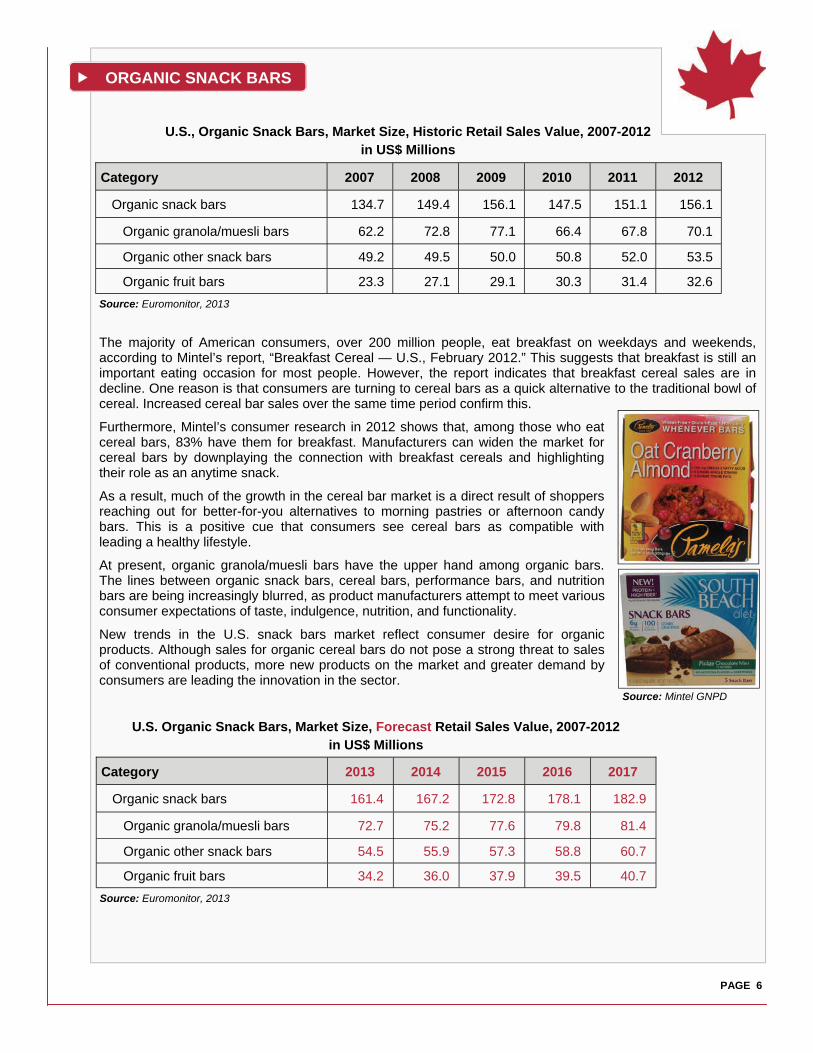
At present, organic granola/muesli bars have the upper hand among organic bars. The lines between organic snack bars, cereal bars, performance bars, and nutrition bars are being increasingly blurred, as product manufacturers attempt to meet various consumer expectations of taste, indulgence, nutrition, and functionality.
New trends in the U.S. snack bars market reflect consumer desire for organic products. Although sales for organic cereal bars do not pose a strong threat to sales of conventional products, more new products on the market and greater demand by consumers are leading the innovation in the sector.
Source: Euromonitor, 2013
U.S., Organic Snack Bars, Market Size, Historic Retail Sales Value, 2007-2012 in US$ Millions
Source: Euromonitor, 2013
U.S. Organic Snack Bars, Market Size, Forecast Retail Sales Value, 2007-2012 in US$ Millions
Source: Mintel GNPD
ORGANIC SNACK BARS
Category 2007 2008 2009 2010 2011 2012
Organic snack bars 134.7 149.4 156.1 147.5 151.1 156.1
Organic granola/muesli bars 62.2 72.8 77.1 66.4 67.8 70.1
Organic other snack bars 49.2 49.5 50.0 50.8 52.0 53.5
Organic fruit bars 23.3 27.1 29.1 30.3 31.4 32.6
Category 2013 2014 2015 2016 2017
Organic snack bars 161.4 167.2 172.8 178.1 182.9
Organic granola/muesli bars 72.7 75.2 77.6 79.8 81.4
Organic other snack bars 54.5 55.9 57.3 58.8 60.7
Organic fruit bars 34.2 36.0 37.9 39.5 40.7
U.S. Nutrition Bars, Market Size, Historic Retail Sales Value, 2007-2012 in US$ Millions
Energy and nutrition bars are significantly more appealing to consumers aged 18-44 than they are to those aged 45 and older, with Mintel research, showing a steady decline in the consumption of nutrition bar use as consumers get older. This trend can be explained, in large part, by the perception that older consumers have regarding nutrition bars. Competition may also play a role, as consumers aged 65 and older are more likely than those aged 18-24 to say they prefer cereal and snack bars to nutrition bars, according to a Mintel survey on consumer attitude toward energy and cereal bars. The survey also pointed out that in order to consolidate their potential market share and avoid losing sales to traditional snack bars, nutrition bar makers need to ensure that consumers understand what sets nutrition bars apart, including all of the added nutritious benefits. Consumers who are dieting, watching their weight or exercising have a higher tendency to look for nutritious food, according to Mintel custom research. In particular consumers who are currently dieting are more likely than the rest of the population to consume nutrition bars. In addition, consumers who exercise are at least twice as likely to eat nutrition bars. These results indicate that nutrition and diet bars and meal replacements are used by health-minded consumers to manage weight, balance nutrition and supplement active lifestyles. Between 2007 and 2012, total retail sales increased in the energy and nutrition bar segments. In the five-year period from 2007 to 2012, the segment grew by 52.7% to reach US$2.1 billion in retail sales. Energy boosting bars account for 79% of the market and grew by 55% to US$1.6 billion in 2012. Endurance bars is the smallest segment, with 21% market share and $448 million in retail sales it saw growth of 45% in the same five period. The strong growth of the nutrition bar segment, despite tough economic times, is a strong indication of U.S. consumer willingness to spend money on nutrition bars among other nutritious products. This willingness to spend is driven in large part by a consumer base that is increasingly aware of the benefits of nutritious eating and who is demanding convenient forms of nutrition to cater to their busy lifestyles.
U.S. Nutrition Bars, Market Size, Forecast Retail Sales Value, 2013-2017 in US$ millions
PAGE 7
ENERGY AND NUTRITION BARS
Category 2007 2008 2009 2010 2011 2012
Energy and nutrition bars 1,383.0 1,438.1 1,483.6 1,682.0 1,870.0 2,112.4
Energy boosting snack bars 1,074.0 1,114.2 1,138.5 1,310.4 1,467.7 1,664.3
Endurance snack bars 309.0 323.9 345.1 371.6 402.3 448.1 Source: Euromonitor, 2013
Source: Euromonitor, 2013
Category 2013 2014 2015 2016 2017
Energy and nutrition bars 2,293.5 2,451.7 2,613.6 2,796.3 2,957.2
Energy boosting snack bars 1,796.6 1,903.8 2,011.7 2,136.5 2,242.1
Endurance snack bars 496.9 547.9 602.0 659.8 715.2
Any
consumption
Cereal or breakfast
bars
Chewy granola
bars
Crunchy granola
bars
Base: Internet users aged 18+ who eat cereal/snack bars 1,368 1,068 957 950 Consumption as a snack/meal part/dessert 94 89 93 93 As part of breakfast 46 45 34 30 As part of lunch 33 22 30 29 As part of dinner 14 11 9 8 As a snack between meals 75 60 72 69 As a dessert after lunch or dinner 29 22 26 24 As a snack/fuel before, during, or after exercising/ a gym workout 40 32 38 35
Consumption as a meal replacement 66 67 55 52 As a meal replacement for breakfast 62 62 46 43 As a meal replacement for lunch 28 21 22 21 As a meal replacement for dinner 14 12 8 8 Other occasion 17 12 15 14
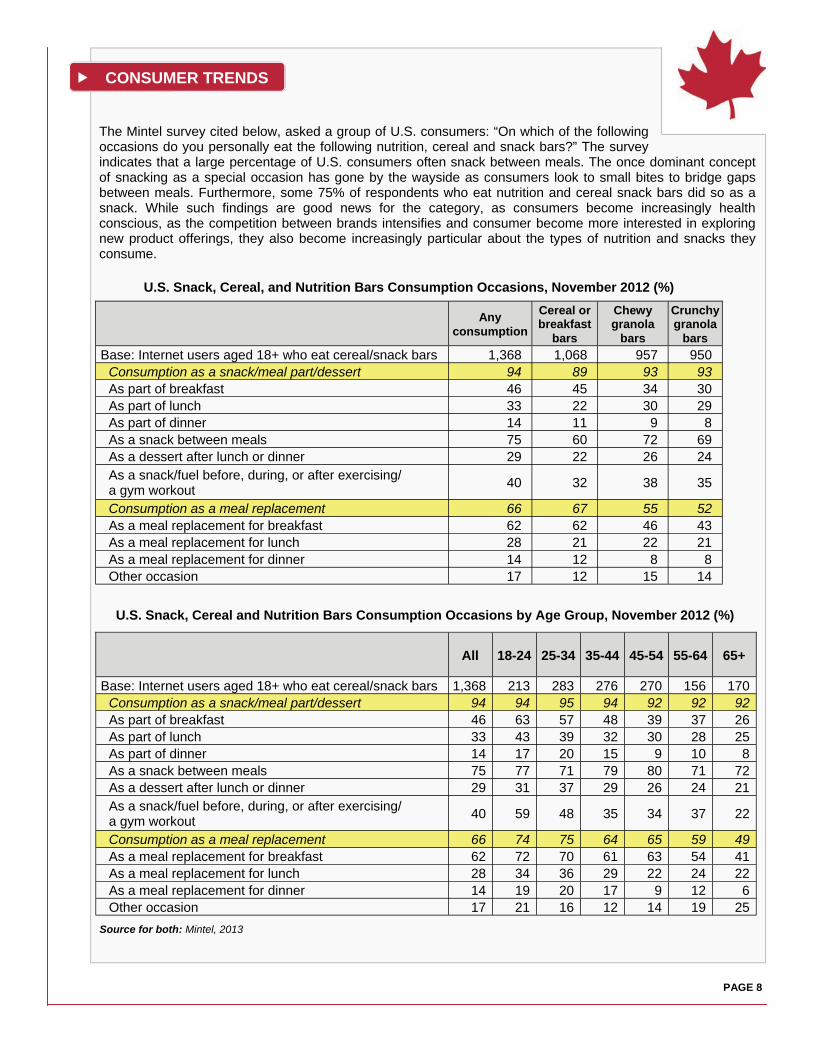
U.S. Snack, Cereal, and Nutrition Bars Consumption Occasions, November 2012 (%)
U.S. Snack, Cereal and Nutrition Bars Consumption Occasions by Age Group, November 2012 (%)
Source for both: Mintel, 2013
CONSUMER TRENDS
The Mintel survey cited below, asked a group of U.S. consumers: “On which of the following occasions do you personally eat the following nutrition, cereal and snack bars?” The survey indicates that a large percentage of U.S. consumers often snack between meals. The once dominant concept of snacking as a special occasion has gone by the wayside as consumers look to small bites to bridge gaps between meals. Furthermore, some 75% of respondents who eat nutrition and cereal snack bars did so as a snack. While such findings are good news for the category, as consumers become increasingly health conscious, as the competition between brands intensifies and consumer become more interested in exploring new product offerings, they also become increasingly particular about the types of nutrition and snacks they consume.
All 18-24 25-34 35-44 45-54 55-64 65+
Base: Internet users aged 18+ who eat cereal/snack bars 1,368 213 283 276 270 156 170 Consumption as a snack/meal part/dessert 94 94 95 94 92 92 92 As part of breakfast 46 63 57 48 39 37 26 As part of lunch 33 43 39 32 30 28 25 As part of dinner 14 17 20 15 9 10 8 As a snack between meals 75 77 71 79 80 71 72 As a dessert after lunch or dinner 29 31 37 29 26 24 21 As a snack/fuel before, during, or after exercising/ a gym workout 40 59 48 35 34 37 22
Consumption as a meal replacement 66 74 75 64 65 59 49 As a meal replacement for breakfast 62 72 70 61 63 54 41 As a meal replacement for lunch 28 34 36 29 22 24 22 As a meal replacement for dinner 14 19 20 17 9 12 6 Other occasion 17 21 16 12 14 19 25
PAGE 8
The survey also revealed that young consumers appear highly engaged in the cereal/snack bars organic category. They are attracted to inherent and added benefits of organic nutrition bar products, as a source of energy and protein, to practical benefits such as time-saving and value for money.
The survey also reveals that growing support among older consumers may come from developing and promoting products that meet the specific health needs of these users. Respondents aged 55-64 are more likely than average to indicate turning to the category for fibre, as well as for blood-sugar maintenance. Among the leading health issues experienced by seniors, as promoted by the National Institutes of Health, are bone and joint care, heart health, memory loss, and vision care. Product manufacturers may explore formulations, that have added nutrients that could assist in combating these ailments and position their bars as being part of a larger wellness routine that contributes to a healthy lifestyle.
Furthermore, the obesity epidemic in the U.S. brought the health and nutrition to the forefront of consumers’ minds, influencing their diet and exercise routines. Some 29% of today’s American consumers are currently dieting, while another 55% have dieted in the past year or are watching what they eat, according to Mintel data. The same data reveals that 69% of consumers exercise at least once a week.
Those who diet and exercise drive the nutritious food and drink market, as they are more likely than those who do not diet or exercise to consume nutritious food products. Indeed, 70% of those who are currently dieting use nutritious food, while only 30% of those who don’t diet or watch their weight do the same, says Mintel research. Similarly, those who exercise are more than twice as likely to use nutritious food as those who don’t exercise.
Source: Mintel, 2013
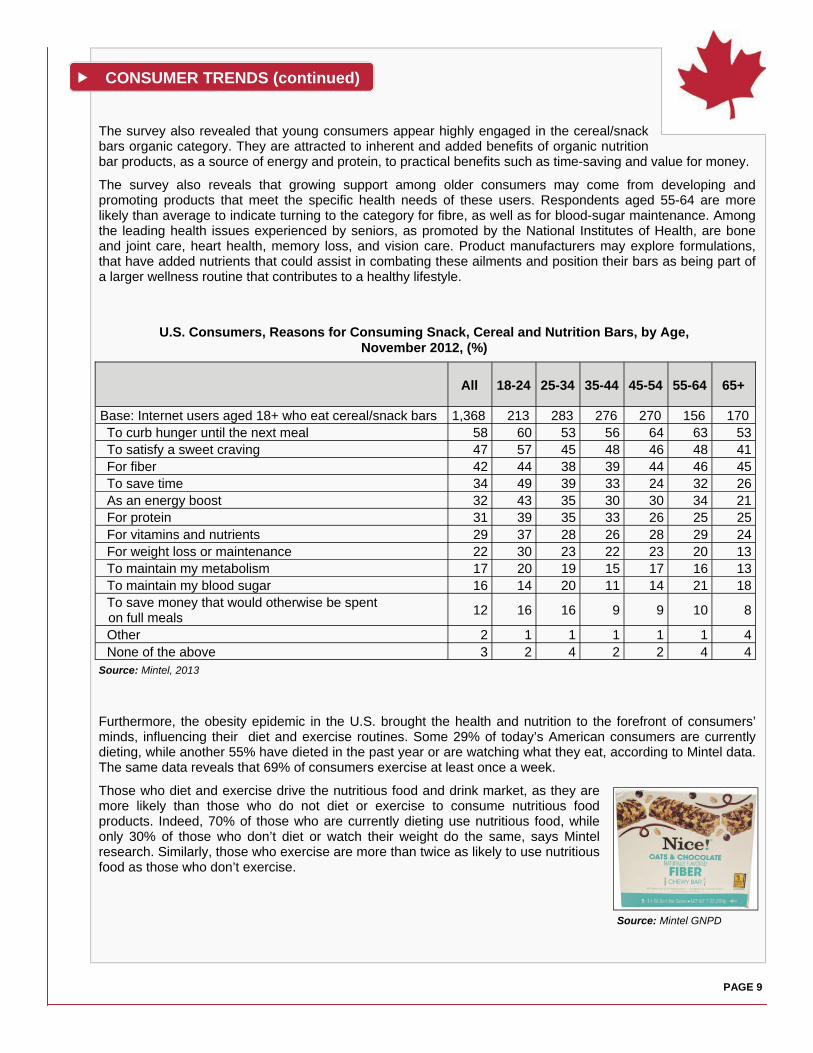
U.S. Consumers, Reasons for Consuming Snack, Cereal and Nutrition Bars, by Age, November 2012, (%)
PAGE 9
Source: Mintel GNPD
CONSUMER TRENDS (continued)
All 18-24 25-34 35-44 45-54 55-64 65+
Base: Internet users aged 18+ who eat cereal/snack bars 1,368 213 283 276 270 156 170 To curb hunger until the next meal 58 60 53 56 64 63 53 To satisfy a sweet craving 47 57 45 48 46 48 41 For fiber 42 44 38 39 44 46 45 To save time 34 49 39 33 24 32 26 As an energy boost 32 43 35 30 30 34 21 For protein 31 39 35 33 26 25 25 For vitamins and nutrients 29 37 28 26 28 29 24 For weight loss or maintenance 22 30 23 22 23 20 13 To maintain my metabolism 17 20 19 15 17 16 13 To maintain my blood sugar 16 14 20 11 14 21 18 To save money that would otherwise be spent on full meals 12 16 16 9 9 10 8
Other 2 1 1 1 1 1 4 None of the above 3 2 4 2 2 4 4
All White Black
Asian or
Pacific Islander
Other race
Hispanic Not
Hispanic
Base: internet users aged 18+ who eat cereal/snack bars 1,368 956 243 75* 94* 230 1,138
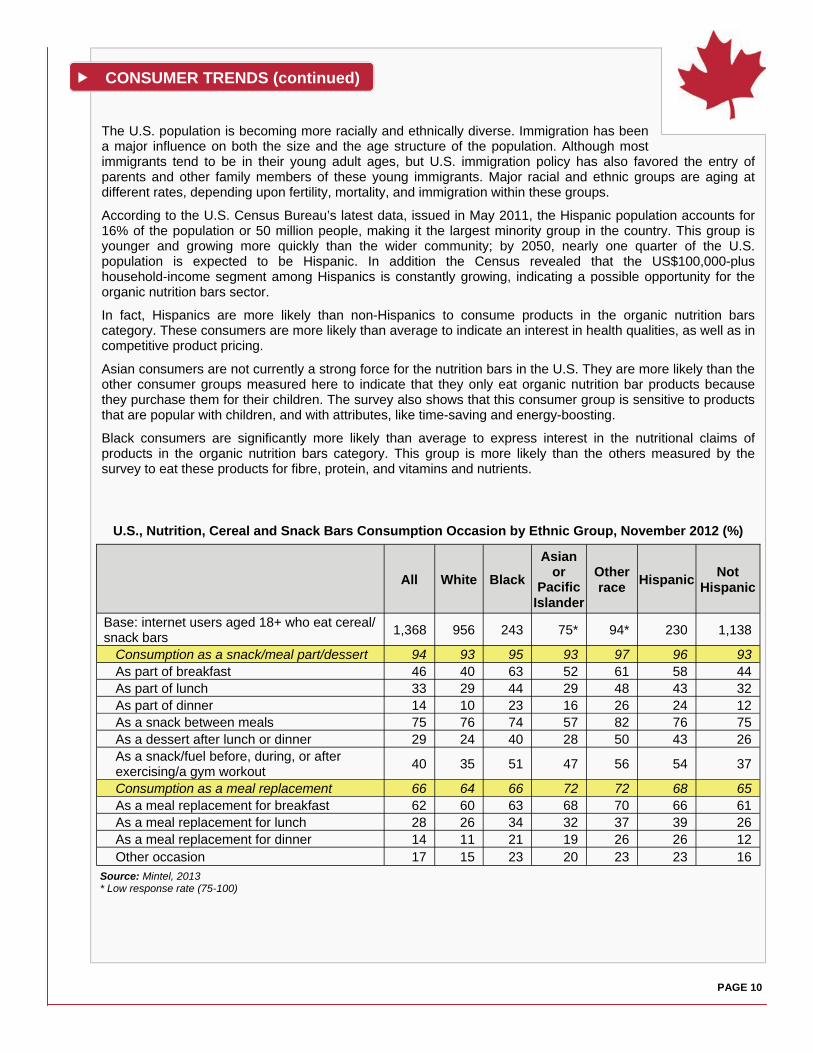
Consumption as a snack/meal part/dessert 94 93 95 93 97 96 93 As part of breakfast 46 40 63 52 61 58 44 As part of lunch 33 29 44 29 48 43 32 As part of dinner 14 10 23 16 26 24 12 As a snack between meals 75 76 74 57 82 76 75 As a dessert after lunch or dinner 29 24 40 28 50 43 26 As a snack/fuel before, during, or after exercising/a gym workout 40 35 51 47 56 54 37
Consumption as a meal replacement 66 64 66 72 72 68 65 As a meal replacement for breakfast 62 60 63 68 70 66 61 As a meal replacement for lunch 28 26 34 32 37 39 26 As a meal replacement for dinner 14 11 21 19 26 26 12 Other occasion 17 15 23 20 23 23 16
Source: Mintel, 2013 * Low response rate (75-100)
U.S., Nutrition, Cereal and Snack Bars Consumption Occasion by Ethnic Group, November 2012 (%)
The U.S. population is becoming more racially and ethnically diverse. Immigration has been a major influence on both the size and the age structure of the population. Although most immigrants tend to be in their young adult ages, but U.S. immigration policy has also favored the entry of parents and other family members of these young immigrants. Major racial and ethnic groups are aging at different rates, depending upon fertility, mortality, and immigration within these groups.
According to the U.S. Census Bureau’s latest data, issued in May 2011, the Hispanic population accounts for 16% of the population or 50 million people, making it the largest minority group in the country. This group is younger and growing more quickly than the wider community; by 2050, nearly one quarter of the U.S. population is expected to be Hispanic. In addition the Census revealed that the US$100,000-plus household-income segment among Hispanics is constantly growing, indicating a possible opportunity for the organic nutrition bars sector.
In fact, Hispanics are more likely than non-Hispanics to consume products in the organic nutrition bars category. These consumers are more likely than average to indicate an interest in health qualities, as well as in competitive product pricing.
Asian consumers are not currently a strong force for the nutrition bars in the U.S. They are more likely than the other consumer groups measured here to indicate that they only eat organic nutrition bar products because they purchase them for their children. The survey also shows that this consumer group is sensitive to products that are popular with children, and with attributes, like time-saving and energy-boosting.
Black consumers are significantly more likely than average to express interest in the nutritional claims of products in the organic nutrition bars category. This group is more likely than the others measured by the survey to eat these products for fibre, protein, and vitamins and nutrients.
CONSUMER TRENDS (continued)
PAGE 10
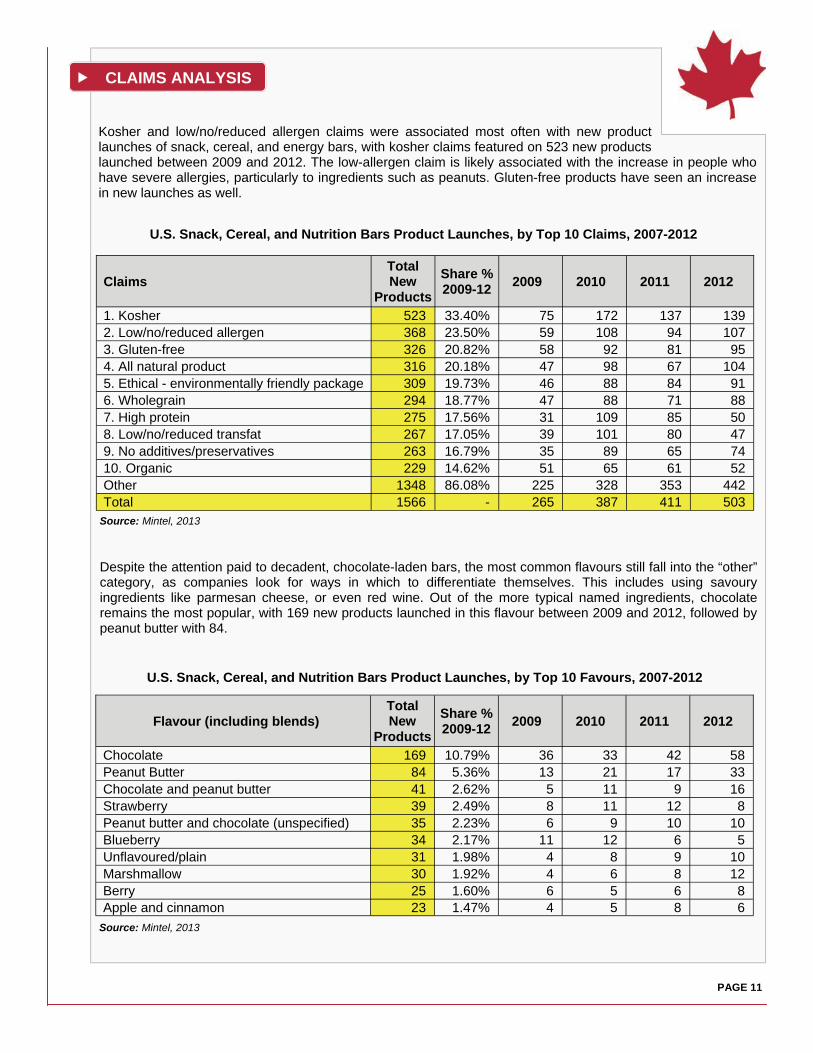
Kosher and low/no/reduced allergen claims were associated most often with new product launches of snack, cereal, and energy bars, with kosher claims featured on 523 new products launched between 2009 and 2012. The low-allergen claim is likely associated with the increase in people who have severe allergies, particularly to ingredients such as peanuts. Gluten-free products have seen an increase in new launches as well.
Claims Total New
Products
Share % 2009-12
2009 2010 2011 2012
1. Kosher 523 33.40% 75 172 137 139 2. Low/no/reduced allergen 368 23.50% 59 108 94 107 3. Gluten-free 326 20.82% 58 92 81 95 4. All natural product 316 20.18% 47 98 67 104 5. Ethical - environmentally friendly package 309 19.73% 46 88 84 91 6. Wholegrain 294 18.77% 47 88 71 88 7. High protein 275 17.56% 31 109 85 50 8. Low/no/reduced transfat 267 17.05% 39 101 80 47 9. No additives/preservatives 263 16.79% 35 89 65 74 10. Organic 229 14.62% 51 65 61 52 Other 1348 86.08% 225 328 353 442 Total 1566 - 265 387 411 503
U.S. Snack, Cereal, and Nutrition Bars Product Launches, by Top 10 Claims, 2007-2012
Source: Mintel, 2013
U.S. Snack, Cereal, and Nutrition Bars Product Launches, by Top 10 Favours, 2007-2012
Despite the attention paid to decadent, chocolate-laden bars, the most common flavours still fall into the “other” category, as companies look for ways in which to differentiate themselves. This includes using savoury ingredients like parmesan cheese, or even red wine. Out of the more typical named ingredients, chocolate remains the most popular, with 169 new products launched in this flavour between 2009 and 2012, followed by peanut butter with 84.
Source: Mintel, 2013
CLAIMS ANALYSIS
PAGE 11
Flavour (including blends) Total New
Products
Share % 2009-12
2009 2010 2011 2012
Chocolate 169 10.79% 36 33 42 58 Peanut Butter 84 5.36% 13 21 17 33 Chocolate and peanut butter 41 2.62% 5 11 9 16 Strawberry 39 2.49% 8 11 12 8 Peanut butter and chocolate (unspecified) 35 2.23% 6 9 10 10 Blueberry 34 2.17% 11 12 6 5 Unflavoured/plain 31 1.98% 4 8 9 10 Marshmallow 30 1.92% 4 6 8 12 Berry 25 1.60% 6 5 6 8 Apple and cinnamon 23 1.47% 4 5 8 6
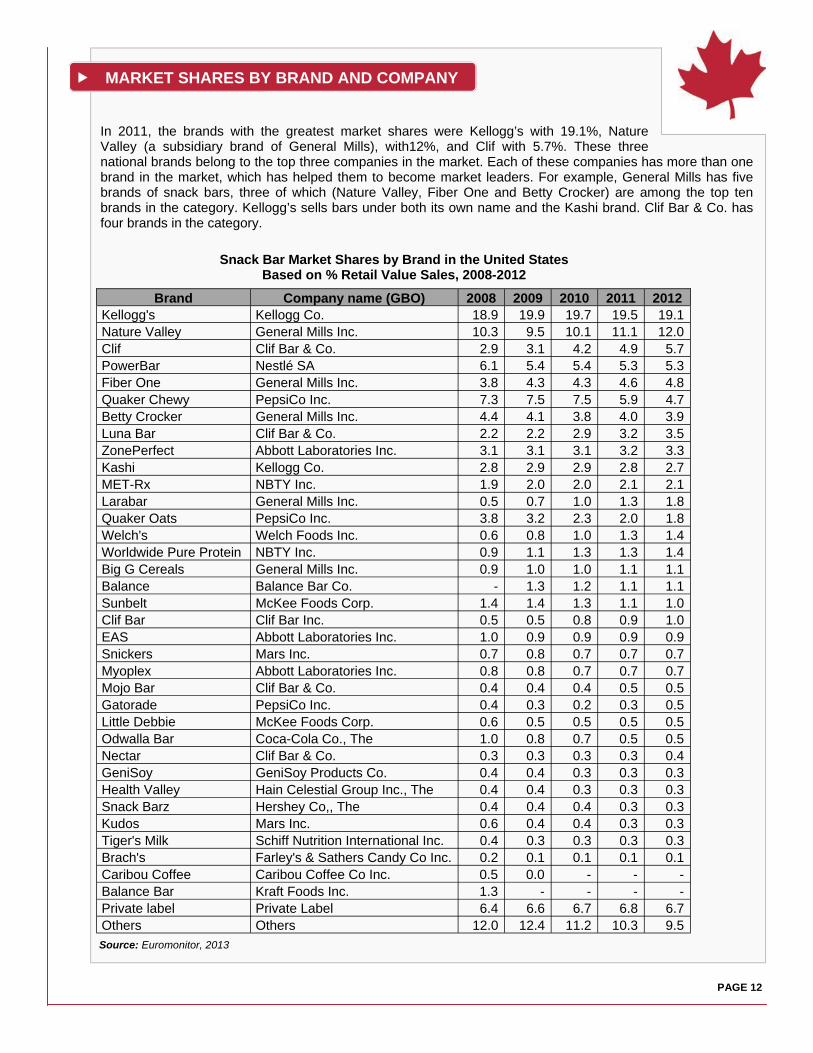
Snack Bar Market Shares by Brand in the United States Based on % Retail Value Sales, 2008-2012
Source: Euromonitor, 2013
Brand Company name (GBO) 2008 2009 2010 2011 2012 Kellogg's Kellogg Co. 18.9 19.9 19.7 19.5 19.1 Nature Valley General Mills Inc. 10.3 9.5 10.1 11.1 12.0 Clif Clif Bar & Co. 2.9 3.1 4.2 4.9 5.7 PowerBar Nestlé SA 6.1 5.4 5.4 5.3 5.3 Fiber One General Mills Inc. 3.8 4.3 4.3 4.6 4.8 Quaker Chewy PepsiCo Inc. 7.3 7.5 7.5 5.9 4.7 Betty Crocker General Mills Inc. 4.4 4.1 3.8 4.0 3.9 Luna Bar Clif Bar & Co. 2.2 2.2 2.9 3.2 3.5 ZonePerfect Abbott Laboratories Inc. 3.1 3.1 3.1 3.2 3.3 Kashi Kellogg Co. 2.8 2.9 2.9 2.8 2.7 MET-Rx NBTY Inc. 1.9 2.0 2.0 2.1 2.1 Larabar General Mills Inc. 0.5 0.7 1.0 1.3 1.8 Quaker Oats PepsiCo Inc. 3.8 3.2 2.3 2.0 1.8 Welch's Welch Foods Inc. 0.6 0.8 1.0 1.3 1.4 Worldwide Pure Protein NBTY Inc. 0.9 1.1 1.3 1.3 1.4 Big G Cereals General Mills Inc. 0.9 1.0 1.0 1.1 1.1 Balance Balance Bar Co. - 1.3 1.2 1.1 1.1 Sunbelt McKee Foods Corp. 1.4 1.4 1.3 1.1 1.0 Clif Bar Clif Bar Inc. 0.5 0.5 0.8 0.9 1.0 EAS Abbott Laboratories Inc. 1.0 0.9 0.9 0.9 0.9 Snickers Mars Inc. 0.7 0.8 0.7 0.7 0.7 Myoplex Abbott Laboratories Inc. 0.8 0.8 0.7 0.7 0.7 Mojo Bar Clif Bar & Co. 0.4 0.4 0.4 0.5 0.5 Gatorade PepsiCo Inc. 0.4 0.3 0.2 0.3 0.5 Little Debbie McKee Foods Corp. 0.6 0.5 0.5 0.5 0.5 Odwalla Bar Coca-Cola Co., The 1.0 0.8 0.7 0.5 0.5 Nectar Clif Bar & Co. 0.3 0.3 0.3 0.3 0.4 GeniSoy GeniSoy Products Co. 0.4 0.4 0.3 0.3 0.3 Health Valley Hain Celestial Group Inc., The 0.4 0.4 0.3 0.3 0.3 Snack Barz Hershey Co,, The 0.4 0.4 0.4 0.3 0.3 Kudos Mars Inc. 0.6 0.4 0.4 0.3 0.3 Tiger's Milk Schiff Nutrition International Inc. 0.4 0.3 0.3 0.3 0.3 Brach's Farley's & Sathers Candy Co Inc. 0.2 0.1 0.1 0.1 0.1 Caribou Coffee Caribou Coffee Co Inc. 0.5 0.0 - - - Balance Bar Kraft Foods Inc. 1.3 - - - - Private label Private Label 6.4 6.6 6.7 6.8 6.7 Others Others 12.0 12.4 11.2 10.3 9.5
In 2011, the brands with the greatest market shares were Kellogg’s with 19.1%, Nature Valley (a subsidiary brand of General Mills), with12%, and Clif with 5.7%. These three national brands belong to the top three companies in the market. Each of these companies has more than one brand in the market, which has helped them to become market leaders. For example, General Mills has five brands of snack bars, three of which (Nature Valley, Fiber One and Betty Crocker) are among the top ten brands in the category. Kellogg’s sells bars under both its own name and the Kashi brand. Clif Bar & Co. has four brands in the category.
MARKET SHARES BY BRAND AND COMPANY
PAGE 12
DISTRIBUTION CHANNELS
PAGE 13
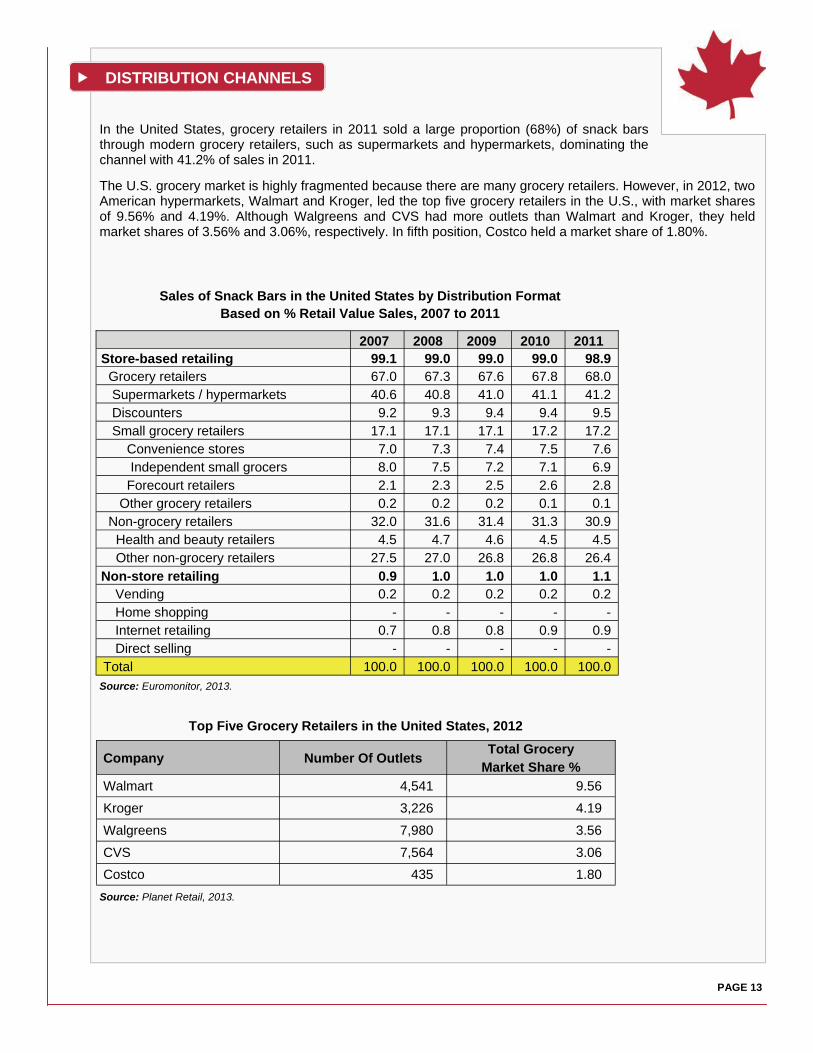
In the United States, grocery retailers in 2011 sold a large proportion (68%) of snack bars through modern grocery retailers, such as supermarkets and hypermarkets, dominating the channel with 41.2% of sales in 2011. The U.S. grocery market is highly fragmented because there are many grocery retailers. However, in 2012, two American hypermarkets, Walmart and Kroger, led the top five grocery retailers in the U.S., with market shares of 9.56% and 4.19%. Although Walgreens and CVS had more outlets than Walmart and Kroger, they held market shares of 3.56% and 3.06%, respectively. In fifth position, Costco held a market share of 1.80%.
Sales of Snack Bars in the United States by Distribution Format Based on % Retail Value Sales, 2007 to 2011
Source: Euromonitor, 2013.
Company Number Of Outlets Total Grocery
Market Share %
Walmart 4,541 9.56 Kroger 3,226 4.19
Walgreens 7,980 3.56
CVS 7,564 3.06 Costco 435 1.80
Top Five Grocery Retailers in the United States, 2012
Source: Planet Retail, 2013.
2007 2008 2009 2010 2011 Store-based retailing 99.1 99.0 99.0 99.0 98.9 Grocery retailers 67.0 67.3 67.6 67.8 68.0 Supermarkets / hypermarkets 40.6 40.8 41.0 41.1 41.2 Discounters 9.2 9.3 9.4 9.4 9.5 Small grocery retailers 17.1 17.1 17.1 17.2 17.2 Convenience stores 7.0 7.3 7.4 7.5 7.6 Independent small grocers 8.0 7.5 7.2 7.1 6.9 Forecourt retailers 2.1 2.3 2.5 2.6 2.8 Other grocery retailers 0.2 0.2 0.2 0.1 0.1 Non-grocery retailers 32.0 31.6 31.4 31.3 30.9 Health and beauty retailers 4.5 4.7 4.6 4.5 4.5 Other non-grocery retailers 27.5 27.0 26.8 26.8 26.4 Non-store retailing 0.9 1.0 1.0 1.0 1.1
Vending 0.2 0.2 0.2 0.2 0.2 Home shopping - - - - - Internet retailing 0.7 0.8 0.8 0.9 0.9 Direct selling - - - - -
Total 100.0 100.0 100.0 100.0 100.0
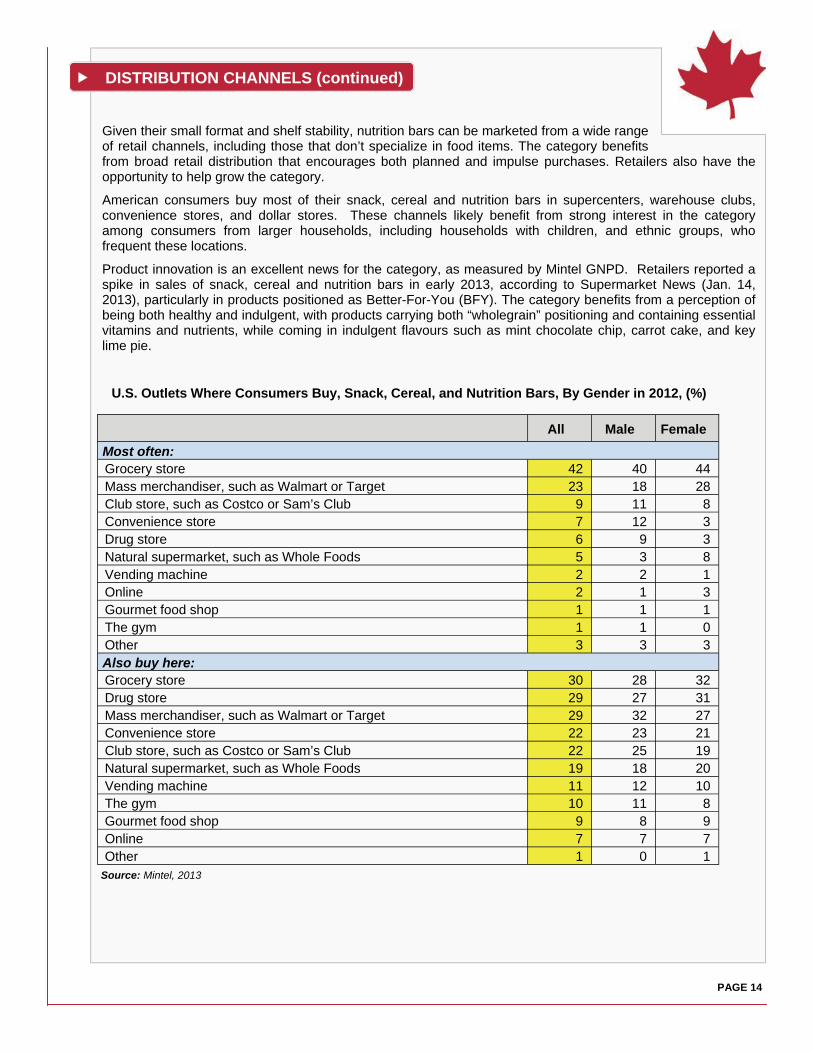
All Male Female
Most often: Grocery store 42 40 44 Mass merchandiser, such as Walmart or Target 23 18 28 Club store, such as Costco or Sam’s Club 9 11 8 Convenience store 7 12 3 Drug store 6 9 3 Natural supermarket, such as Whole Foods 5 3 8 Vending machine 2 2 1 Online 2 1 3 Gourmet food shop 1 1 1 The gym 1 1 0 Other 3 3 3
Grocery store 30 28 32 Drug store 29 27 31 Mass merchandiser, such as Walmart or Target 29 32 27 Convenience store 22 23 21 Club store, such as Costco or Sam’s Club 22 25 19 Natural supermarket, such as Whole Foods 19 18 20 Vending machine 11 12 10 The gym 10 11 8 Gourmet food shop 9 8 9 Online 7 7 7 Other 1 0 1
Also buy here:
U.S. Outlets Where Consumers Buy, Snack, Cereal, and Nutrition Bars, By Gender in 2012, (%)
Source: Mintel, 2013
Given their small format and shelf stability, nutrition bars can be marketed from a wide range of retail channels, including those that don’t specialize in food items. The category benefits from broad retail distribution that encourages both planned and impulse purchases. Retailers also have the opportunity to help grow the category.
American consumers buy most of their snack, cereal and nutrition bars in supercenters, warehouse clubs, convenience stores, and dollar stores. These channels likely benefit from strong interest in the category among consumers from larger households, including households with children, and ethnic groups, who frequent these locations.
Product innovation is an excellent news for the category, as measured by Mintel GNPD. Retailers reported a spike in sales of snack, cereal and nutrition bars in early 2013, according to Supermarket News (Jan. 14, 2013), particularly in products positioned as Better-For-You (BFY). The category benefits from a perception of being both healthy and indulgent, with products carrying both “wholegrain” positioning and containing essential vitamins and nutrients, while coming in indulgent flavours such as mint chocolate chip, carrot cake, and key lime pie.
DISTRIBUTION CHANNELS (continued)
PAGE 14
Health and weight management High fibre content is a predominant feature across the U.S. snack bar market. Brands offer products with a high level of fibre, and claim that they support appetite suppression, weight maintenance, and digestive health. As well, high fibre content is being combined with other healthy ingredients, such as omega 3, vitamins and minerals, to increase the health credentials of bars by offering additional benefits.
The following are examples of products in the U.S.:
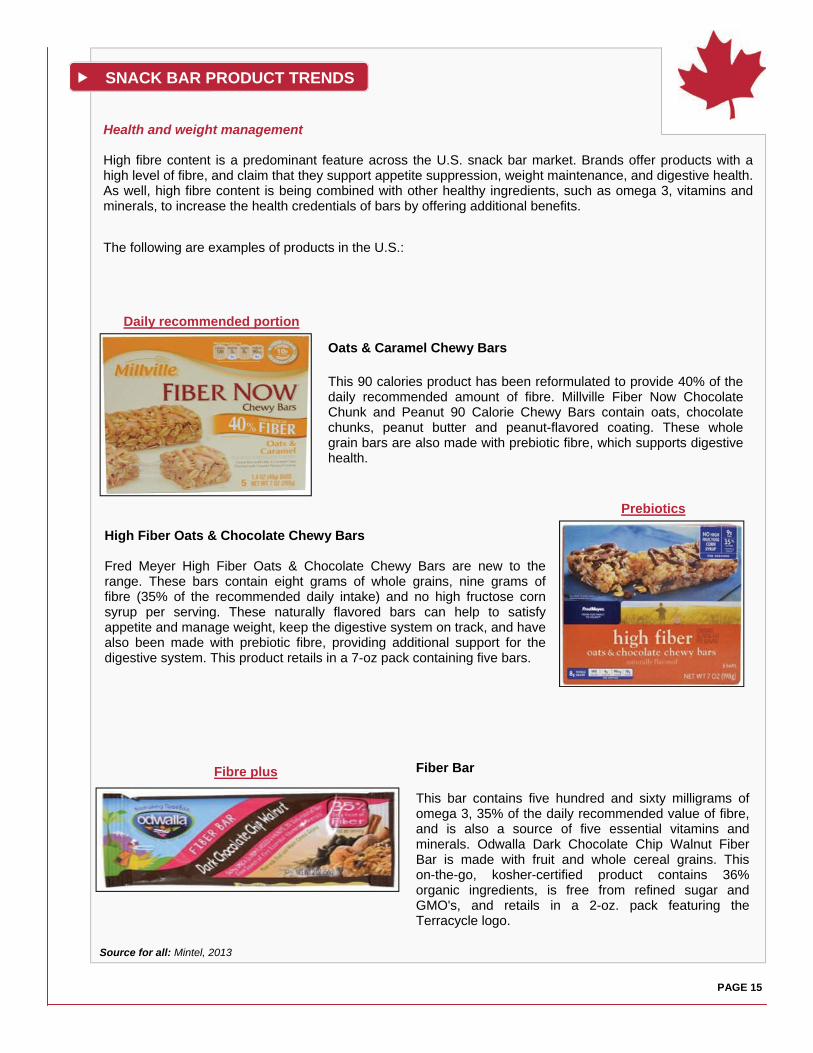
Oats & Caramel Chewy Bars This 90 calories product has been reformulated to provide 40% of the daily recommended amount of fibre. Millville Fiber Now Chocolate Chunk and Peanut 90 Calorie Chewy Bars contain oats, chocolate chunks, peanut butter and peanut-flavored coating. These whole grain bars are also made with prebiotic fibre, which supports digestive health.
Daily recommended portion
Prebiotics
High Fiber Oats & Chocolate Chewy Bars Fred Meyer High Fiber Oats & Chocolate Chewy Bars are new to the range. These bars contain eight grams of whole grains, nine grams of fibre (35% of the recommended daily intake) and no high fructose corn syrup per serving. These naturally flavored bars can help to satisfy appetite and manage weight, keep the digestive system on track, and have also been made with prebiotic fibre, providing additional support for the digestive system. This product retails in a 7-oz pack containing five bars.
Fibre plus Fiber Bar This bar contains five hundred and sixty milligrams of omega 3, 35% of the daily recommended value of fibre, and is also a source of five essential vitamins and minerals. Odwalla Dark Chocolate Chip Walnut Fiber Bar is made with fruit and whole cereal grains. This on-the-go, kosher-certified product contains 36% organic ingredients, is free from refined sugar and GMO's, and retails in a 2-oz. pack featuring the Terracycle logo.
Source for all: Mintel, 2013
SNACK BAR PRODUCT TRENDS
PAGE 15
Antioxidant content Antioxidant content is a very popular trend across the snack bar market. Kellogg’s Nutri-Grain brand, for example, has both created new products and re-launched old ones with more emphasis on fruits and antioxidants. Superfruit formulation plays an important role in determining the antioxidant content of fortifying or functional snack bar products. Antioxidants and fruit content can be delivered to consumers with cocoa and nuts, as well as mixed with other ingredients like protein, vitamins and whole grains. The following are examples of snack bars in the U.S. that have antioxidant and superfruit content:
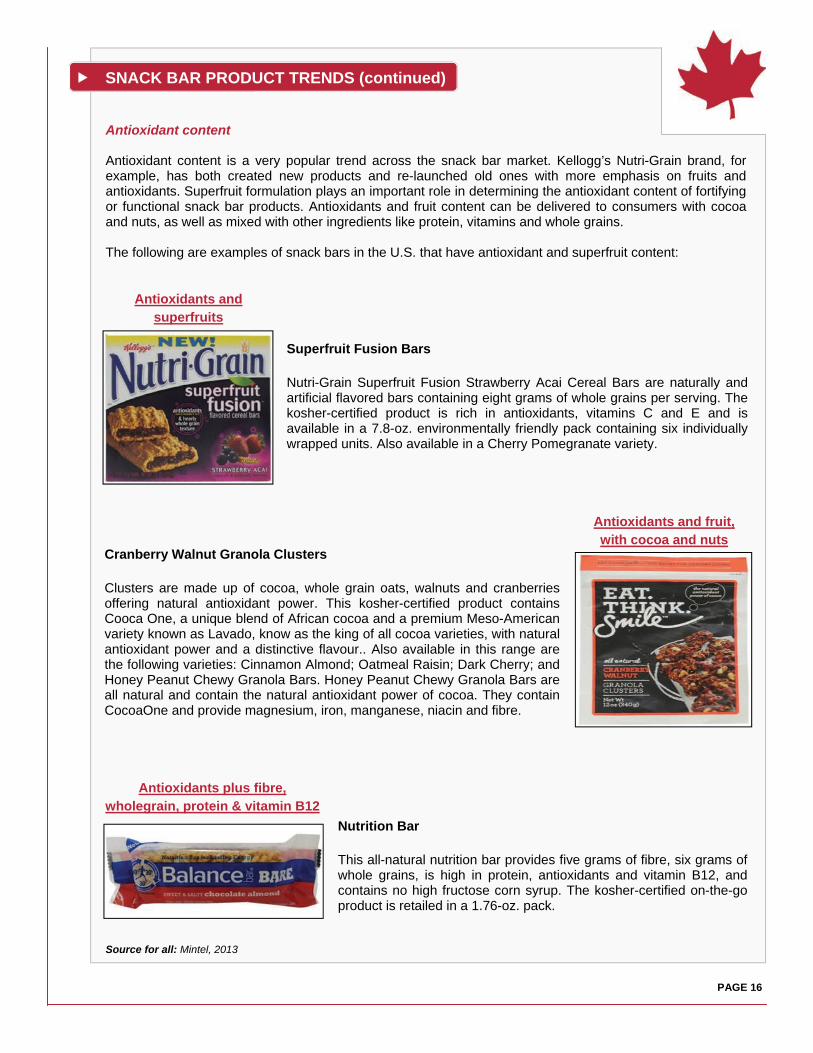
Superfruit Fusion Bars Nutri-Grain Superfruit Fusion Strawberry Acai Cereal Bars are naturally and artificial flavored bars containing eight grams of whole grains per serving. The kosher-certified product is rich in antioxidants, vitamins C and E and is available in a 7.8-oz. environmentally friendly pack containing six individually wrapped units. Also available in a Cherry Pomegranate variety.
Antioxidants and superfruits
Cranberry Walnut Granola Clusters Clusters are made up of cocoa, whole grain oats, walnuts and cranberries offering natural antioxidant power. This kosher-certified product contains Cooca One, a unique blend of African cocoa and a premium Meso-American variety known as Lavado, know as the king of all cocoa varieties, with natural antioxidant power and a distinctive flavour.. Also available in this range are the following varieties: Cinnamon Almond; Oatmeal Raisin; Dark Cherry; and Honey Peanut Chewy Granola Bars. Honey Peanut Chewy Granola Bars are all natural and contain the natural antioxidant power of cocoa. They contain CocoaOne and provide magnesium, iron, manganese, niacin and fibre.
Antioxidants and fruit, with cocoa and nuts
Source for all: Mintel, 2013
Nutrition Bar This all-natural nutrition bar provides five grams of fibre, six grams of whole grains, is high in protein, antioxidants and vitamin B12, and contains no high fructose corn syrup. The kosher-certified on-the-go product is retailed in a 1.76-oz. pack.
Antioxidants plus fibre, wholegrain, protein & vitamin B12
SNACK BAR PRODUCT TRENDS (continued)
PAGE 16
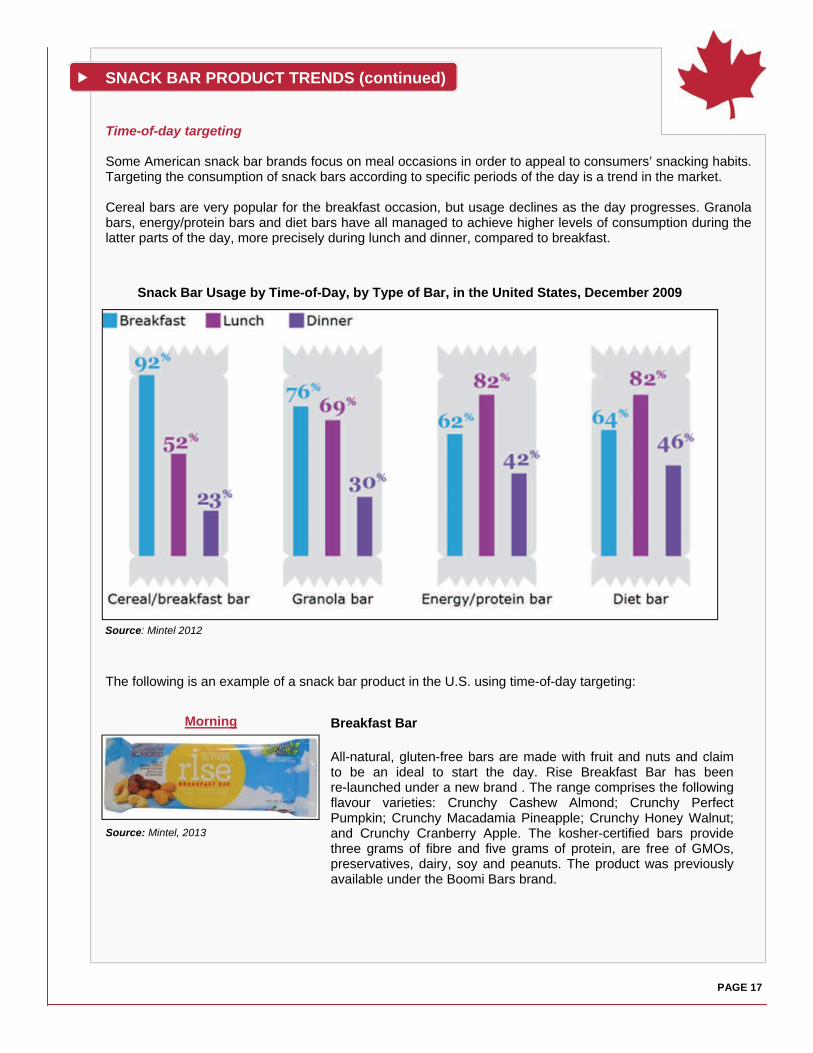
Time-of-day targeting Some American snack bar brands focus on meal occasions in order to appeal to consumers’ snacking habits. Targeting the consumption of snack bars according to specific periods of the day is a trend in the market. Cereal bars are very popular for the breakfast occasion, but usage declines as the day progresses. Granola bars, energy/protein bars and diet bars have all managed to achieve higher levels of consumption during the latter parts of the day, more precisely during lunch and dinner, compared to breakfast.
The following is an example of a snack bar product in the U.S. using time-of-day targeting:
Source: Mintel, 2013
Snack Bar Usage by Time-of-Day, by Type of Bar, in the United States, December 2009
Breakfast Bar All-natural, gluten-free bars are made with fruit and nuts and claim to be an ideal to start the day. Rise Breakfast Bar has been re-launched under a new brand . The range comprises the following flavour varieties: Crunchy Cashew Almond; Crunchy Perfect Pumpkin; Crunchy Macadamia Pineapple; Crunchy Honey Walnut; and Crunchy Cranberry Apple. The kosher-certified bars provide three grams of fibre and five grams of protein, are free of GMOs, preservatives, dairy, soy and peanuts. The product was previously available under the Boomi Bars brand.
Morning
Source: Mintel 2012
SNACK BAR PRODUCT TRENDS (continued)
PAGE 17
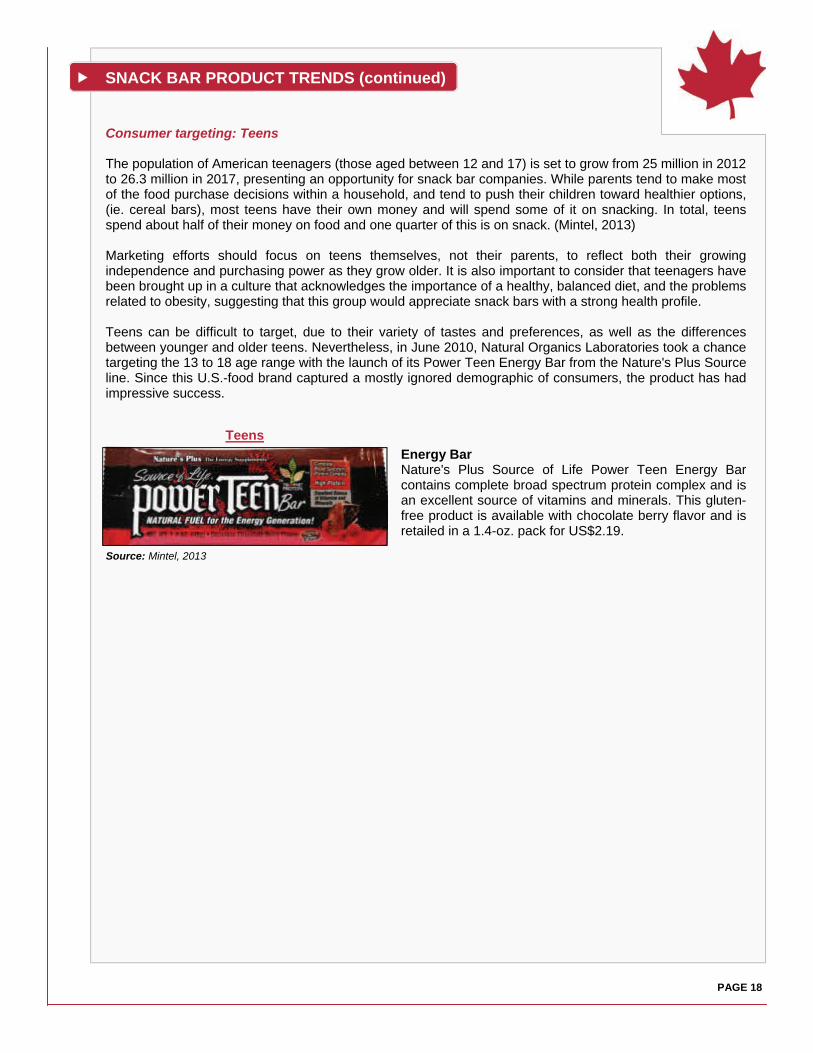
Consumer targeting: Teens The population of American teenagers (those aged between 12 and 17) is set to grow from 25 million in 2012 to 26.3 million in 2017, presenting an opportunity for snack bar companies. While parents tend to make most of the food purchase decisions within a household, and tend to push their children toward healthier options,(ie. cereal bars), most teens have their own money and will spend some of it on snacking. In total, teens spend about half of their money on food and one quarter of this is on snack. (Mintel, 2013) Marketing efforts should focus on teens themselves, not their parents, to reflect both their growing independence and purchasing power as they grow older. It is also important to consider that teenagers have been brought up in a culture that acknowledges the importance of a healthy, balanced diet, and the problems related to obesity, suggesting that this group would appreciate snack bars with a strong health profile. Teens can be difficult to target, due to their variety of tastes and preferences, as well as the differences between younger and older teens. Nevertheless, in June 2010, Natural Organics Laboratories took a chance targeting the 13 to 18 age range with the launch of its Power Teen Energy Bar from the Nature's Plus Source line. Since this U.S.-food brand captured a mostly ignored demographic of consumers, the product has had impressive success.
Energy Bar Nature's Plus Source of Life Power Teen Energy Bar contains complete broad spectrum protein complex and is an excellent source of vitamins and minerals. This gluten-free product is available with chocolate berry flavor and is retailed in a 1.4-oz. pack for US$2.19.
Source: Mintel, 2013
Teens
SNACK BAR PRODUCT TRENDS (continued)
PAGE 18
Unusual flavours are becoming increasingly common among bars, as consumers look for new formulations and flavours. The following are some examples of products that offer consumers innovative flavours.
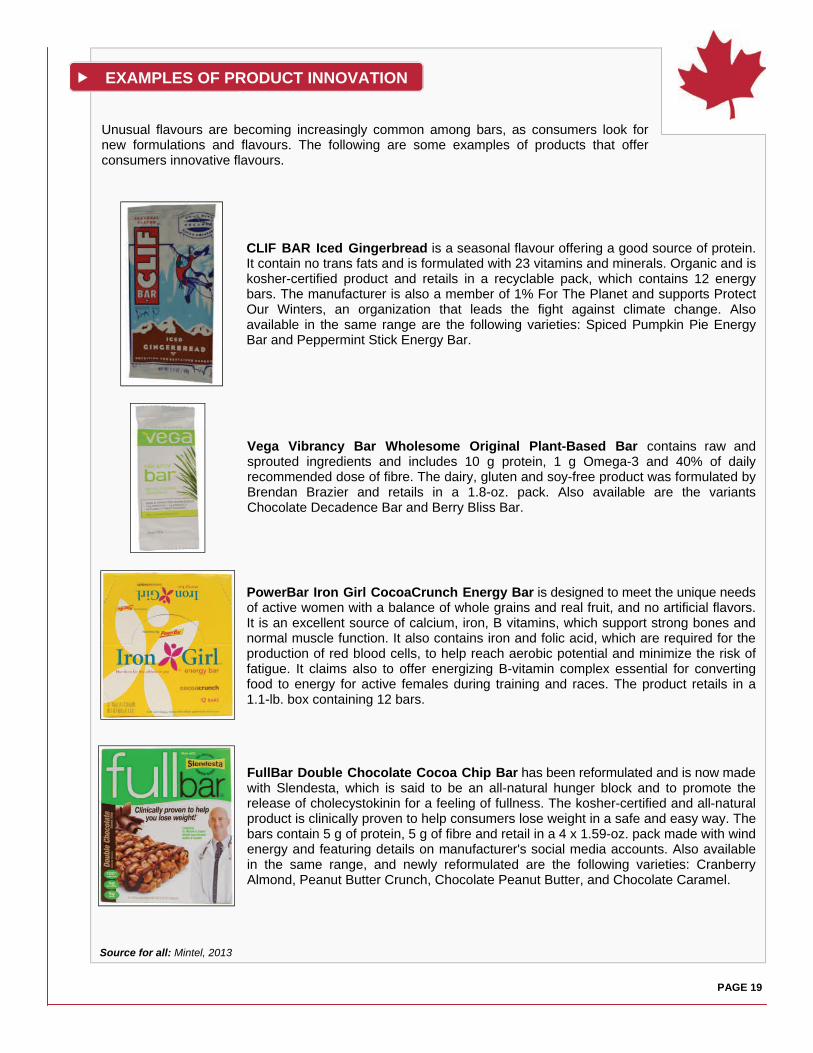
CLIF BAR Iced Gingerbread is a seasonal flavour offering a good source of protein. It contain no trans fats and is formulated with 23 vitamins and minerals. Organic and is kosher-certified product and retails in a recyclable pack, which contains 12 energy bars. The manufacturer is also a member of 1% For The Planet and supports Protect Our Winters, an organization that leads the fight against climate change. Also available in the same range are the following varieties: Spiced Pumpkin Pie Energy Bar and Peppermint Stick Energy Bar.
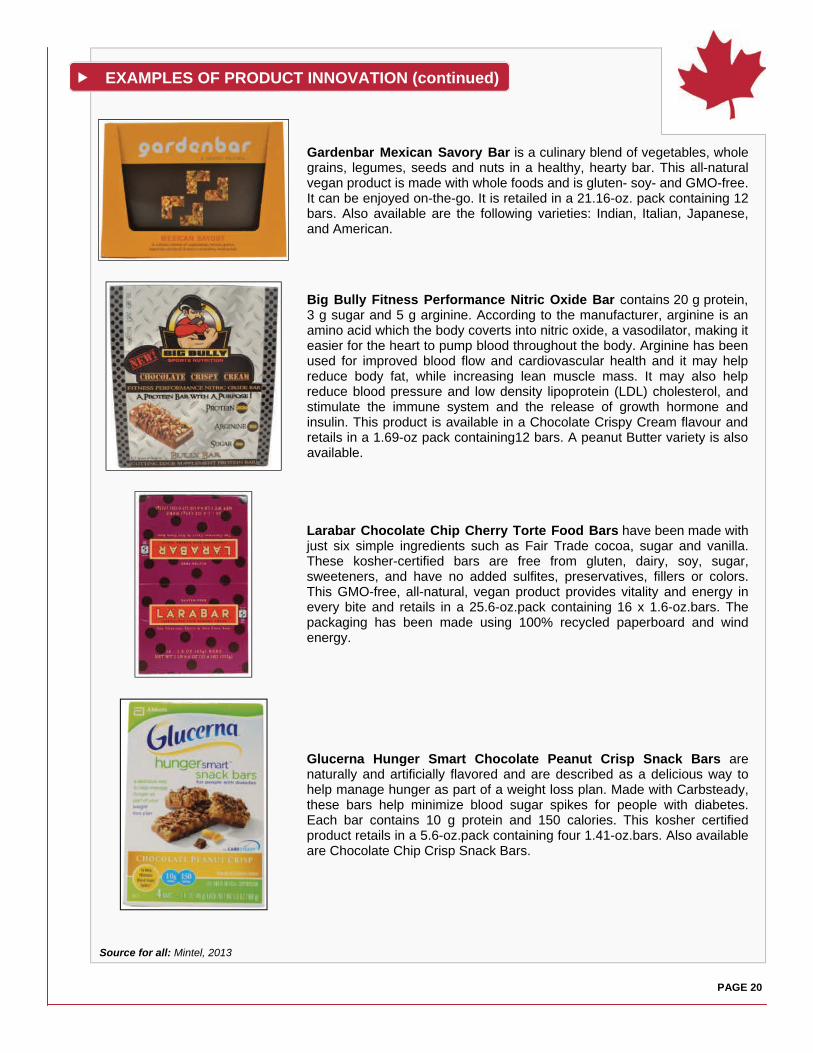
Vega Vibrancy Bar Wholesome Original Plant-Based Bar contains raw and sprouted ingredients and includes 10 g protein, 1 g Omega-3 and 40% of daily recommended dose of fibre. The dairy, gluten and soy-free product was formulated by Brendan Brazier and retails in a 1.8-oz. pack. Also available are the variants Chocolate Decadence Bar and Berry Bliss Bar.
PowerBar Iron Girl CocoaCrunch Energy Bar is designed to meet the unique needs of active women with a balance of whole grains and real fruit, and no artificial flavors. It is an excellent source of calcium, iron, B vitamins, which support strong bones and normal muscle function. It also contains iron and folic acid, which are required for the production of red blood cells, to help reach aerobic potential and minimize the risk of fatigue. It claims also to offer energizing B-vitamin complex essential for converting food to energy for active females during training and races. The product retails in a 1.1-lb. box containing 12 bars.
FullBar Double Chocolate Cocoa Chip Bar has been reformulated and is now made with Slendesta, which is said to be an all-natural hunger block and to promote the release of cholecystokinin for a feeling of fullness. The kosher-certified and all-natural product is clinically proven to help consumers lose weight in a safe and easy way. The bars contain 5 g of protein, 5 g of fibre and retail in a 4 x 1.59-oz. pack made with wind energy and featuring details on manufacturer's social media accounts. Also available in the same range, and newly reformulated are the following varieties: Cranberry Almond, Peanut Butter Crunch, Chocolate Peanut Butter, and Chocolate Caramel.
Source for all: Mintel, 2013
EXAMPLES OF PRODUCT INNOVATION
PAGE 19
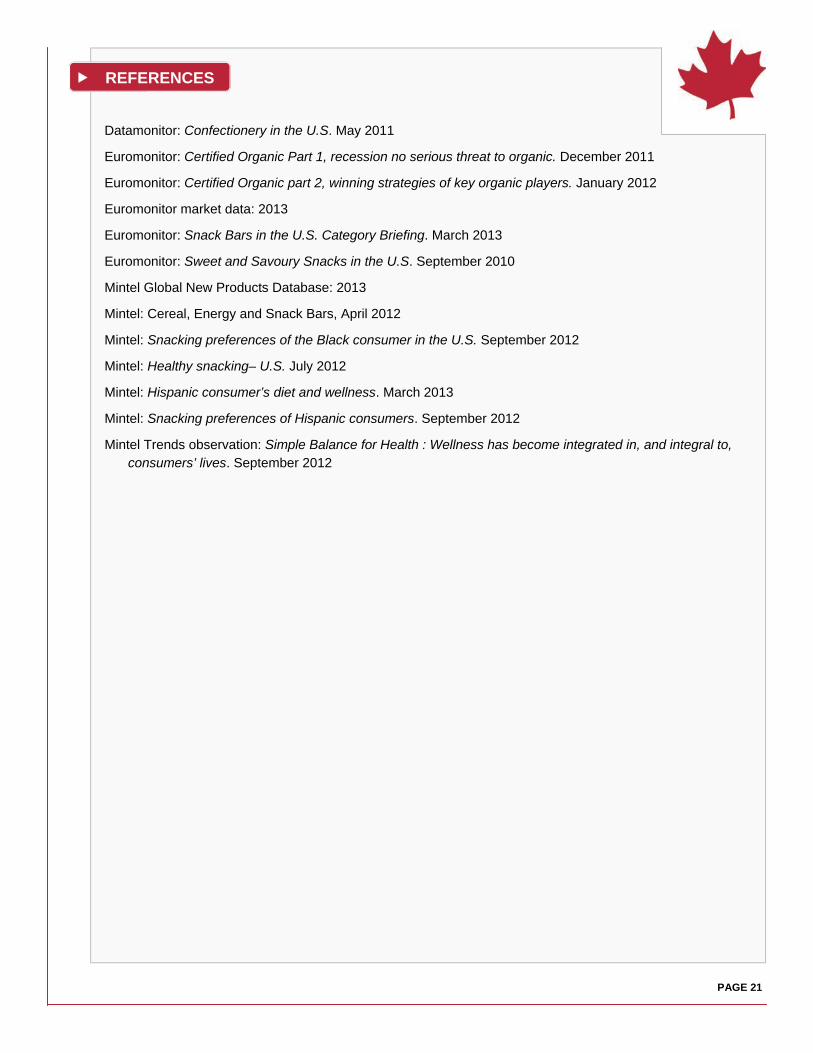
Gardenbar Mexican Savory Bar is a culinary blend of vegetables, whole grains, legumes, seeds and nuts in a healthy, hearty bar. This all-natural vegan product is made with whole foods and is gluten- soy- and GMO-free. It can be enjoyed on-the-go. It is retailed in a 21.16-oz. pack containing 12 bars. Also available are the following varieties: Indian, Italian, Japanese, and American.
Big Bully Fitness Performance Nitric Oxide Bar contains 20 g protein, 3 g sugar and 5 g arginine. According to the manufacturer, arginine is an amino acid which the body coverts into nitric oxide, a vasodilator, making it easier for the heart to pump blood throughout the body. Arginine has been used for improved blood flow and cardiovascular health and it may help reduce body fat, while increasing lean muscle mass. It may also help reduce blood pressure and low density lipoprotein (LDL) cholesterol, and stimulate the immune system and the release of growth hormone and insulin. This product is available in a Chocolate Crispy Cream flavour and retails in a 1.69-oz pack containing12 bars. A peanut Butter variety is also available.
Larabar Chocolate Chip Cherry Torte Food Bars have been made with just six simple ingredients such as Fair Trade cocoa, sugar and vanilla. These kosher-certified bars are free from gluten, dairy, soy, sugar, sweeteners, and have no added sulfites, preservatives, fillers or colors. This GMO-free, all-natural, vegan product provides vitality and energy in every bite and retails in a 25.6-oz.pack containing 16 x 1.6-oz.bars. The packaging has been made using 100% recycled paperboard and wind energy.
Glucerna Hunger Smart Chocolate Peanut Crisp Snack Bars are naturally and artificially flavored and are described as a delicious way to help manage hunger as part of a weight loss plan. Made with Carbsteady, these bars help minimize blood sugar spikes for people with diabetes. Each bar contains 10 g protein and 150 calories. This kosher certified product retails in a 5.6-oz.pack containing four 1.41-oz.bars. Also available are Chocolate Chip Crisp Snack Bars.
Source for all: Mintel, 2013
EXAMPLES OF PRODUCT INNOVATION (continued)
PAGE 20
Datamonitor: Confectionery in the U.S. May 2011
Euromonitor: Certified Organic Part 1, recession no serious threat to organic. December 2011
Euromonitor: Certified Organic part 2, winning strategies of key organic players. January 2012
Euromonitor market data: 2013
Euromonitor: Snack Bars in the U.S. Category Briefing. March 2013
Euromonitor: Sweet and Savoury Snacks in the U.S. September 2010
Mintel Global New Products Database: 2013
Mintel: Cereal, Energy and Snack Bars, April 2012
Mintel: Snacking preferences of the Black consumer in the U.S. September 2012
Mintel: Healthy snacking– U.S. July 2012
Mintel: Hispanic consumer’s diet and wellness. March 2013
Mintel: Snacking preferences of Hispanic consumers. September 2012
Mintel Trends observation: Simple Balance for Health : Wellness has become integrated in, and integral to, consumers’ lives. September 2012
REFERENCES
PAGE 21
Snack, Cereal and Nutrition Bars in the United States © Her Majesty the Queen in Right of Canada, represented by the Minister of Agriculture and Agri-Food (2013). ISSN 1920-6593 AAFC No. 12077E Photo Credits All photographs reproduced in this publication are used by permission of the rights holders. All images, unless otherwise noted, are copyright Her Majesty the Queen in Right of Canada. For additional copies, to request an alternate format, and for all other inquiries regarding this publication, please contact: Agriculture and Agri-Food Canada, Global Analysis Division 1341 Baseline Road, Tower 5, 4th floor Ottawa, ON Canada K1A 0C5 E-mail: [email protected] Aussi disponible en français sous le titre : Barres-collations, barres de céréales et barres nutritionnelles aux États-Unis
The Government of Canada has prepared this report based on primary and secondary sources of information. Although every effort has been made to ensure that the information is accurate, Agriculture and Agri-Food Canada (AAFC) assumes no liability for any actions taken based on the information contained herein.
Reproduction or redistribution of this document, in whole or in part, must include acknowledgement of Agriculture and Agri-Food Canada as the owner of the copyright in the document, through a reference citing AAFC, the title of the document and the year. Where the reproduction or redistribution includes data from this document, it must also include an acknowledgement of the specific data source(s), as noted in this document. Agriculture and Agri-Food Canada provides this document and other report services to agriculture and food industry clients free of charge.