Embed Size (px)
Citation preview

www.saharamutual.com
NAV as on 29.06.2012Growth Option : ` 28.0947 Dividend Option : ` 11.9689
Name Designation Experience (Years)
Naresh Kumar Garg Chief Investment Offi cer 22 yrs (4 yrs in Sahara Banking & FS Fund)
A N Sridhar Fund Manager 22 yrs (4 yrs in Sahara Banking & FS Fund)
An Open-Ended Growth Fund
Industry Security Name % of Industrywise Total Total %EQUITY SHARESPower National Thermal Power Corp Ltd. 4.71 20.09 Power Trading Coporation India Ltd. 3.45 Power Grid Corporation Of India Ltd. 3.35 Orient Green Power Company Ltd. 2.64 Kalpataru Power Transmission Ltd. 2.45 Torrent Power Ltd 1.94 Tata Power Company Ltd. 1.55 Industrial Capital Goods Crompton Greaves Ltd 3.40 13.41 Thermax Ltd. 3.12 Bharat Bijlee Ltd. 3.09 Praj Industries Ltd 2.08 Bharat Heavy Electricals Ltd. 1.72 Construction Projects Lanco Infratech Ltd 2.65 12.22 Larsen and Toubro Limited. 2.48 Voltas Ltd. 2.47 Pratibha Industries Ltd. 2.40 GMR Infrastructure Ltd. 2.22 Finance Aditya Birla Nuvo (Indian Rayon) 3.58 9.58 Power Finance Corporation Ltd. 3.17 Rural Electrifi cation Corporation Ltd. 2.83 Fertilisers Coromandel International Ltd 2.29 7.99 Rashtriya Chemicals & Fertilisers Ltd 2.07 Chambal Fertilisers & Chemicals Ltd. 1.73 Zuari Holdings Ltd 1.38 Zuari Industries Ltd. 0.51 Gas Petronet LNG Ltd 2.33 6.47 Gas Authority of India Ltd. 2.08 Gujarat State Petronet Ltd. 2.07 Oil Cairn India Ltd. 3.18 5.12 Oil & Natural Gas Corp Ltd 1.94 Petroleum Products Castrol India Ltd. 2.26 4.30 Indian Oil Corporation Ltd 2.04 Paper Tamil Nadu Newsprint & Papers Ltd. 3.81 3.81Ferrous Metals Manganese Ore India Ltd. 3.52 3.52Non-Ferrous Metals Hindalco Industries Ltd. 3.19 3.19Minerals/Mining Coal India Ltd. 3.07 3.07Chemicals Tata Chemicals Ltd. 2.57 2.57Consumer Non Durables EID Parry (India) Ltd. 1.04 1.04Equity Total 96.39 96.39Current and Other Assets 3.61 3.61Grand Total 100.00 100.00
Date of Inception: 17/06/2008; Total Expenses Ratio (%) : 2.50; AUM : ` 338.46 Lakhs Holding in TOP 10 scrips : 35.36%; Portfolio Turnover Ratio (%): 150.98
An Open-Ended Sectoral Growth Fund
MINIMUM APPLICATION AMOUNT : ` 5000 and in multiples of ` 1 thereafter. OPTIONS : Dividend including Dividend Re-investment; Growth option
Load Structure SIP/STPEntry Load: NIL ; Entry Load: NIL ;Exit Load: 1%- If redeemed on or before Exit Load: 1%- If redeemed on or before12 months, NIL- If redeemed after 12 months. 1 year from the date of allotment.
Date of Inception: 16/09/2008; Total Expenses Ratio (%) : 2.50; AUM: ̀ 2112.19 Lakhs ; Portfolio Turnover Ratio (%) : 358.73
Dividend Record Date Rate Face Value Cum Div NAV (`)
30.07.2010 ` 2.00 per unit ` 10.00 13.5352
Past performance may or may not be sustained in future
DividendRecord Date Rate Face Value Cum Dividend NAV (`)29.04.11 ` 2.50 Per Unit ` 10.00 15.570203.09.10 ` 4.00 Per Unit ` 10.00 19.736519.01.10 ` 4.00 Per Unit ` 10.00 19.486431.07.09 ` 4.00 Per Unit ` 10.00 19.7059
Past performance may or may not be sustained in future.
The objective of the scheme : The investment objective would be to provide long term capital appreciation through investment in equities and equities related securities of companies whose business comprise of Banking / Financial services, either whole or in part.
sms BANKING to 59090
Portfolio as on 29.06.2012Industry Security Name % of Industrywise Total Total %EQUITY SHARESBanks HDFC Bank Ltd 10.94 77.74
ICICI BANK Ltd. 10.65
State Bank of India 10.12
City Union Bank Limited 4.19
Axis Bank Limited 4.09
Oriental Bank of Commerce 3.83
Bank Of Baroda 3.82
Union Bank of India 3.66
Kotak Mahindra Bank Ltd. 3.65
Canara Bank 3.60
Punjab National Bank 3.25
ING Vysya Bank Ltd. 3.12
Yes Bank Ltd. 2.57
Syndicate Bank 2.28
IndusInd Bank LImited. 2.26
Indian Bank 2.17
The Federal Bank Limited 2.12
Allahabad Bank - EQU 1.42
Finance HDFC Ltd 3.87 19.07
LIC Housing Finance Ltd 3.83
Infrastr.Development Finance Co.Ltd. 2.58
Power Finance Corporation Ltd 2.54
Bajaj Finance Limited 2.16
Bajaj Finserv Ltd 2.11
Mahindra & Mahindra Financial Services Ltd. 1.99
Equity Total 96.81 96.81
Current and Other Assets 3.19 3.19
Grand Total 100.00 100.00
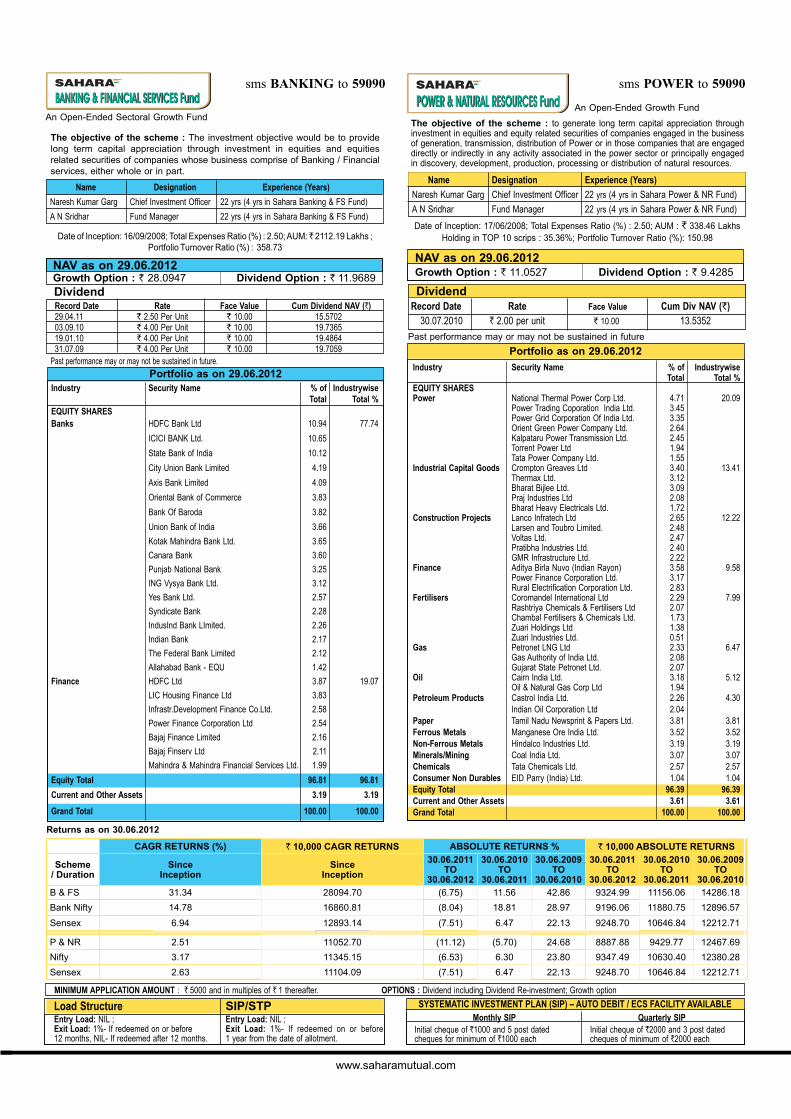
The objective of the scheme : to generate long term capital appreciation through investment in equities and equity related securities of companies engaged in the business of generation, transmission, distribution of Power or in those companies that are engaged directly or indirectly in any activity associated in the power sector or principally engaged in discovery, development, production, processing or distribution of natural resources.
NAV as on 29.06.2012Growth Option : ` 11.0527 Dividend Option : ` 9.4285
Portfolio as on 29.06.2012
Name Designation Experience (Years)
Naresh Kumar Garg Chief Investment Offi cer 22 yrs (4 yrs in Sahara Power & NR Fund)
A N Sridhar Fund Manager 22 yrs (4 yrs in Sahara Power & NR Fund)
sms POWER to 59090
Returns as on 30.06.2012
CAGR RETURNS (%) ` 10,000 CAGR RETURNS ABSOLUTE RETURNS % ` 10,000 ABSOLUTE RETURNS
Scheme/ Duration
SinceInception
SinceInception
30.06.2011TO
30.06.2012
30.06.2010TO
30.06.2011
30.06.2009TO
30.06.2010
30.06.2011TO
30.06.2012
30.06.2010TO
30.06.2011
30.06.2009TO
30.06.2010B & FS 31.34 28094.70 (6.75) 11.56 42.86 9324.99 11156.06 14286.18
Bank Nifty 14.78 16860.81 (8.04) 18.81 28.97 9196.06 11880.75 12896.57
Sensex 6.94 12893.14 (7.51) 6.47 22.13 9248.70 10646.84 12212.71
P & NR 2.51 11052.70 (11.12) (5.70) 24.68 8887.88 9429.77 12467.69
Nifty 3.17 11345.15 (6.53) 6.30 23.80 9347.49 10630.40 12380.28
Sensex 2.63 11104.09 (7.51) 6.47 22.13 9248.70 10646.84 12212.71
SYSTEMATIC INVESTMENT PLAN (SIP) – AUTO DEBIT / ECS FACILITY AVAILABLE Monthly SIP Quarterly SIPInitial cheque of `1000 and 5 post dated Initial cheque of `2000 and 3 post dated cheques for minimum of `1000 each cheques of minimum of `2000 each
www.saharamutual.com
An Open-Ended Equity Linked Saving Scheme (ELSS)
The objective of the scheme : is to provide immediate tax relief and long-term growth of capital by investing in equity and equity related instruments.
Bonus History (Record Date - Aug 29, 2005)
Growth Option: 7:1 Dividend Option: 3:1
Investment Optiona) Growth b) Dividend Payout & Dividend Reinvestment Option.
Name Designation Experience (Yrs)
Mr Naresh Kumar Garg CIO 22 yrs (8 yrs in Sahara Tax-Gain Fund)
Mr A N Sridhar Fund Manager 22 yrs (5 yrs in Sahara Tax-Gain Fund)
sms TAX to 59090
Portfolio as on 29.06.2012
Date of Inception: 01/04/1997; Total Expenses Ratio (%) : 2.50; AUM : `1160.37 lakhs ; Holding in TOP 10 scrips : 24.31%; Portfolio Turnover Ratio (%) : 240.02
Past performance may or may not be sustained in future.
Dividend since 2005 Record Date Rate Face Value Cum Div NAV (`)
01.03.2011 ` 2.50 per unit `10.00 15.81
12.03.2010 ` 4.00 per unit `10.00 18.38
29.03.2008 ` 7.50 per unit `10.00 20.75
24.03.2006 ` 2.50 per unit `10.00 19.40
23.03.2005 ` 20.00 per unit `10.00 66.75
19.01.2005 ` 10.00 per unit `10.00 70.61
NAV as on 29.06.2012Dividend : ` 13.6631 Growth : ` 36.4046
CAGR RETURNS (%) ` 10,000 CAGR RETURNS ABSOLUTE RETURNS % ` 10,000 ABSOLUTE RETURNS
Scheme/ Duration
SinceInception
SinceInception
30.06.2011TO
30.06.2012
30.06.2010TO
30.06.2011
30.06.2009TO
30.06.2010
30.06.2011TO
30.06.2012
30.06.2010TO
30.06.2011
30.06.2009TO
30.06.2010
Tax Gain 24.73 291236.80 (2.17) 4.27 40.80 9783.32 10427.05 14079.89
BSE 200 12.96 64236.14 (7.63) 2.96 27.22 9237.25 10296.21 12721.82
Sensex 11.25 50860.60 (7.51) 6.47 22.13 9248.70 10646.84 12212.71
Minimum application `500 and additional amount in multiples of `500.
SYSTEMATIC INVESTMENT PLAN (SIP) - AUTO DEBIT / ECS FACILITY AVAILABLE
Monthly SIP Quarterly SIP6 post-dated cheques for minimum of `500 each and in multiples of `500 4 post-dated cheques for minimum of `500 each and in multiples of `500
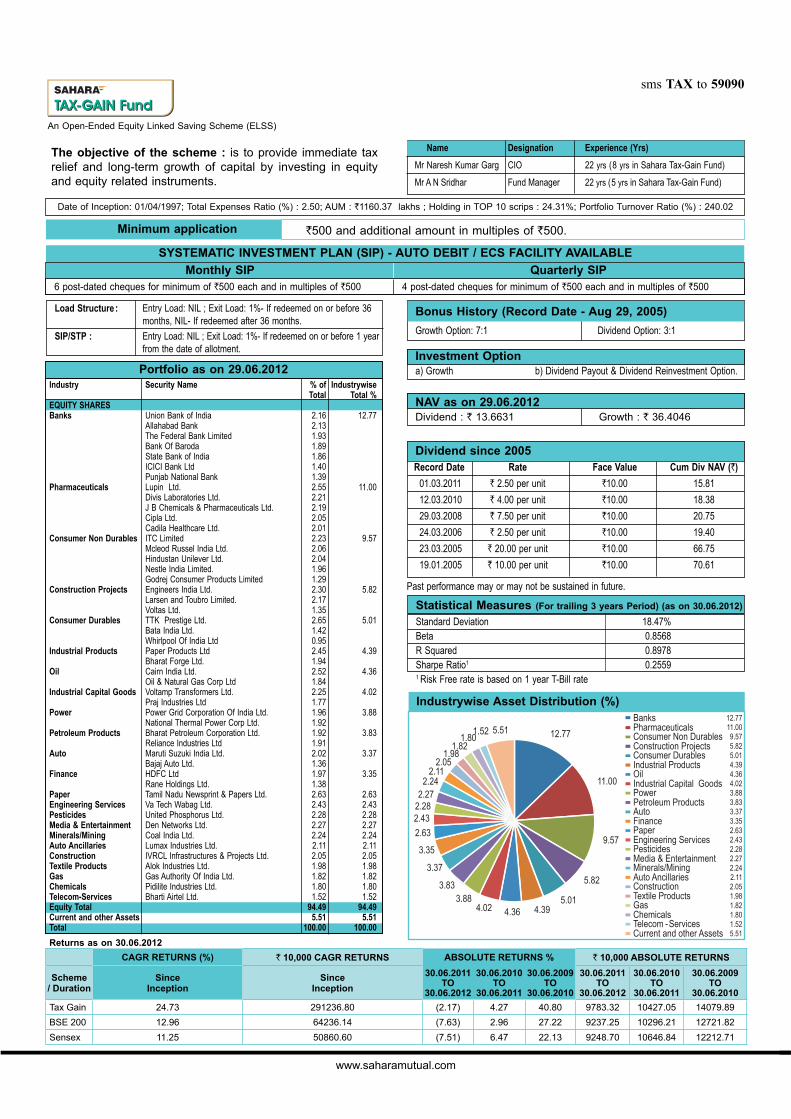
Industrywise Asset Distribution (%)
Returns as on 30.06.2012
Statistical Measures (For trailing 3 years Period) (as on 30.06.2012)
Standard Deviation 18.47%Beta 0.8568R Squared 0.8978Sharpe Ratio1 0.25591 Risk Free rate is based on 1 year T-Bill rate
Industry Security Name % of Industrywise Total Total %EQUITY SHARESBanks Union Bank of India 2.16 12.77 Allahabad Bank 2.13 The Federal Bank Limited 1.93 Bank Of Baroda 1.89 State Bank of India 1.86 ICICI Bank Ltd 1.40 Punjab National Bank 1.39 Pharmaceuticals Lupin Ltd. 2.55 11.00 Divis Laboratories Ltd. 2.21 J B Chemicals & Pharmaceuticals Ltd. 2.19 Cipla Ltd. 2.05 Cadila Healthcare Ltd. 2.01 Consumer Non Durables ITC Limited 2.23 9.57 Mcleod Russel India Ltd. 2.06 Hindustan Unilever Ltd. 2.04 Nestle India Limited. 1.96 Godrej Consumer Products Limited 1.29 Construction Projects Engineers India Ltd. 2.30 5.82 Larsen and Toubro Limited. 2.17 Voltas Ltd. 1.35 Consumer Durables TTK Prestige Ltd. 2.65 5.01 Bata India Ltd. 1.42 Whirlpool Of India Ltd 0.95 Industrial Products Paper Products Ltd 2.45 4.39 Bharat Forge Ltd. 1.94 Oil Cairn India Ltd. 2.52 4.36 Oil & Natural Gas Corp Ltd 1.84 Industrial Capital Goods Voltamp Transformers Ltd. 2.25 4.02 Praj Industries Ltd 1.77 Power Power Grid Corporation Of India Ltd. 1.96 3.88 National Thermal Power Corp Ltd. 1.92 Petroleum Products Bharat Petroleum Corporation Ltd. 1.92 3.83 Reliance Industries Ltd 1.91 Auto Maruti Suzuki India Ltd. 2.02 3.37 Bajaj Auto Ltd. 1.36 Finance HDFC Ltd 1.97 3.35 Rane Holdings Ltd. 1.38 Paper Tamil Nadu Newsprint & Papers Ltd. 2.63 2.63Engineering Services Va Tech Wabag Ltd. 2.43 2.43Pesticides United Phosphorus Ltd. 2.28 2.28Media & Entertainment Den Networks Ltd. 2.27 2.27Minerals/Mining Coal India Ltd. 2.24 2.24Auto Ancillaries Lumax Industries Ltd. 2.11 2.11Construction IVRCL Infrastructures & Projects Ltd. 2.05 2.05Textile Products Alok Industries Ltd. 1.98 1.98Gas Gas Authority Of India Ltd. 1.82 1.82Chemicals Pidilite Industries Ltd. 1.80 1.80Telecom-Services Bharti Airtel Ltd. 1.52 1.52Equity Total 94.49 94.49Current and other Assets 5.51 5.51Total 100.00 100.00
12.7711.009.575.825.014.394.364.023.883.833.373.352.632.432.282.272.242.112.051.981.821.801.525.51
www.saharamutual.com
An Open-Ended Growth Fund
The objective of the scheme : is to achieve capital appreciation by investing in equity and equity related instruments.
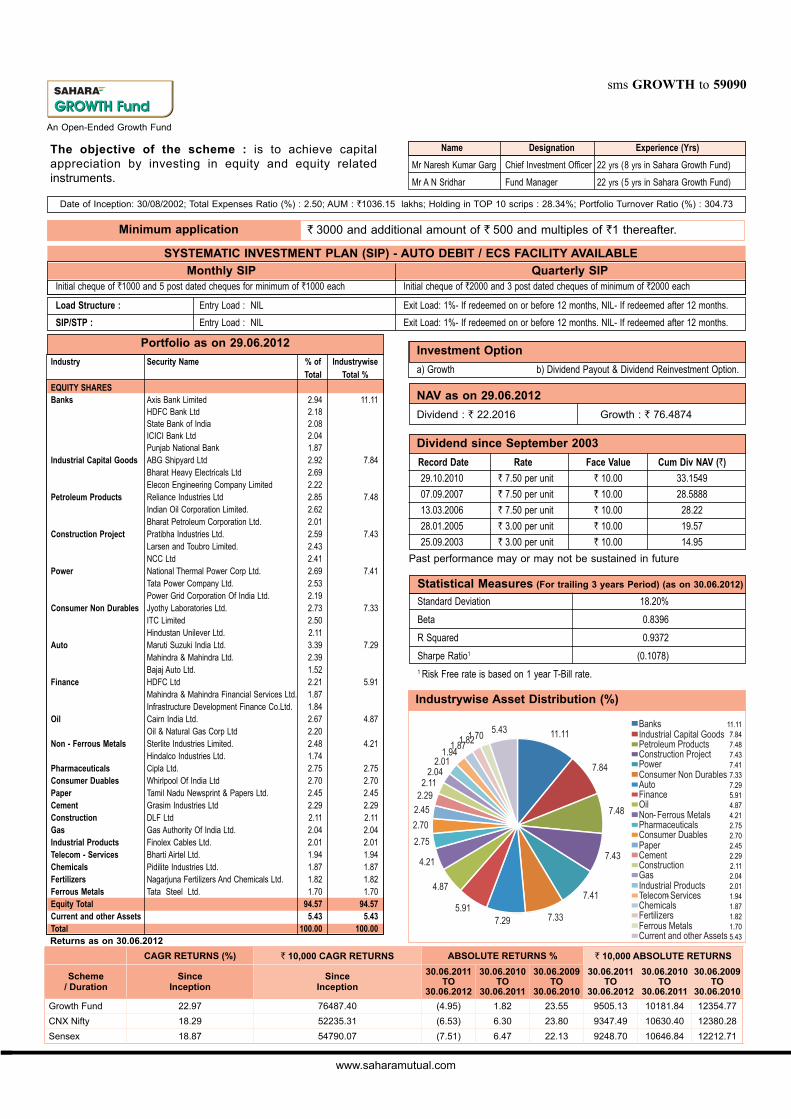
Industrywise Asset Distribution (%)
Investment Option
a) Growth b) Dividend Payout & Dividend Reinvestment Option.
Name Designation Experience (Yrs)
Mr Naresh Kumar Garg Chief Investment Offi cer 22 yrs (8 yrs in Sahara Growth Fund)
Mr A N Sridhar Fund Manager 22 yrs (5 yrs in Sahara Growth Fund)
sms GROWTH to 59090
Portfolio as on 29.06.2012
Statistical Measures (For trailing 3 years Period) (as on 30.06.2012)
Standard Deviation 18.20%
Beta 0.8396
R Squared 0.9372
Sharpe Ratio1 (0.1078)1 Risk Free rate is based on 1 year T-Bill rate.
Date of Inception: 30/08/2002; Total Expenses Ratio (%) : 2.50; AUM : `1036.15 lakhs; Holding in TOP 10 scrips : 28.34%; Portfolio Turnover Ratio (%) : 304.73
Dividend since September 2003
Record Date Rate Face Value Cum Div NAV (`)
29.10.2010 ` 7.50 per unit ` 10.00 33.1549
07.09.2007 ` 7.50 per unit ` 10.00 28.5888
13.03.2006 ` 7.50 per unit ` 10.00 28.22
28.01.2005 ` 3.00 per unit ` 10.00 19.57
25.09.2003 ` 3.00 per unit ` 10.00 14.95
Past performance may or may not be sustained in future
NAV as on 29.06.2012
Dividend : ` 22.2016 Growth : ` 76.4874
Minimum application ` 3000 and additional amount of ` 500 and multiples of `1 thereafter.
SYSTEMATIC INVESTMENT PLAN (SIP) - AUTO DEBIT / ECS FACILITY AVAILABLE
Monthly SIP Quarterly SIPInitial cheque of `1000 and 5 post dated cheques for minimum of `1000 each Initial cheque of `2000 and 3 post dated cheques of minimum of `2000 each
Load Structure : Entry Load : NIL
SIP/STP : Entry Load : NIL
Exit Load: 1%- If redeemed on or before 12 months, NIL- If redeemed after 12 months.
Exit Load: 1%- If redeemed on or before 12 months. NIL- If redeemed after 12 months.
CAGR RETURNS (%) ` 10,000 CAGR RETURNS ABSOLUTE RETURNS % ` 10,000 ABSOLUTE RETURNS
Scheme/ Duration
SinceInception
SinceInception
30.06.2011TO
30.06.2012
30.06.2010TO
30.06.2011
30.06.2009TO
30.06.2010
30.06.2011TO
30.06.2012
30.06.2010TO
30.06.2011
30.06.2009TO
30.06.2010
Growth Fund 22.97 76487.40 (4.95) 1.82 23.55 9505.13 10181.84 12354.77
CNX Nifty 18.29 52235.31 (6.53) 6.30 23.80 9347.49 10630.40 12380.28
Sensex 18.87 54790.07 (7.51) 6.47 22.13 9248.70 10646.84 12212.71
Returns as on 30.06.2012
Industry Security Name % of Industrywise Total Total %EQUITY SHARESBanks Axis Bank Limited 2.94 11.11 HDFC Bank Ltd 2.18 State Bank of India 2.08 ICICI Bank Ltd 2.04 Punjab National Bank 1.87 Industrial Capital Goods ABG Shipyard Ltd 2.92 7.84 Bharat Heavy Electricals Ltd 2.69 Elecon Engineering Company Limited 2.22 Petroleum Products Reliance Industries Ltd 2.85 7.48 Indian Oil Corporation Limited. 2.62 Bharat Petroleum Corporation Ltd. 2.01 Construction Project Pratibha Industries Ltd. 2.59 7.43 Larsen and Toubro Limited. 2.43 NCC Ltd 2.41 Power National Thermal Power Corp Ltd. 2.69 7.41 Tata Power Company Ltd. 2.53 Power Grid Corporation Of India Ltd. 2.19 Consumer Non Durables Jyothy Laboratories Ltd. 2.73 7.33 ITC Limited 2.50 Hindustan Unilever Ltd. 2.11 Auto Maruti Suzuki India Ltd. 3.39 7.29 Mahindra & Mahindra Ltd. 2.39 Bajaj Auto Ltd. 1.52 Finance HDFC Ltd 2.21 5.91 Mahindra & Mahindra Financial Services Ltd. 1.87 Infrastructure Development Finance Co.Ltd. 1.84 Oil Cairn India Ltd. 2.67 4.87 Oil & Natural Gas Corp Ltd 2.20 Non - Ferrous Metals Sterlite Industries Limited. 2.48 4.21 Hindalco Industries Ltd. 1.74 Pharmaceuticals Cipla Ltd. 2.75 2.75Consumer Duables Whirlpool Of India Ltd 2.70 2.70Paper Tamil Nadu Newsprint & Papers Ltd. 2.45 2.45Cement Grasim Industries Ltd 2.29 2.29Construction DLF Ltd 2.11 2.11Gas Gas Authority Of India Ltd. 2.04 2.04Industrial Products Finolex Cables Ltd. 2.01 2.01Telecom - Services Bharti Airtel Ltd. 1.94 1.94Chemicals Pidilite Industries Ltd. 1.87 1.87Fertilizers Nagarjuna Fertilizers And Chemicals Ltd. 1.82 1.82Ferrous Metals Tata Steel Ltd. 1.70 1.70Equity Total 94.57 94.57Current and other Assets 5.43 5.43Total 100.00 100.00
11.117.847.487.437.417.337.295.914.874.212.752.702.452.292.112.042.011.941.871.821.705.43
www.saharamutual.com
Industrywise Asset Distribution (%)
An Open-Ended Growth Fund
sms WEALTH to 59090
Portfolio as on 29.06.2012
Past Performance may or may not be sustained in future.
Dividend Record Date Rate Face Value Cum Div NAV (`) Fixed Variable
5.10.2010 ` 4.00 per unit ` 10.00 22.6938 23.5222
Load StructureEntry Load :NIL Exit Load: 1%- If redeemed on or before 12 months, NIL- If redeemed after 12 months.
SIP/STPEntry Load: NIL Exit Load: 1%- If redeemed on or before 1 year from the date of allotment. NIL- If redeemed after 12 months.
Investment Option (Fixed Pricing Option / Variable Pricing Option)
Dividend Option incl. Dividend RI Option Growth Option
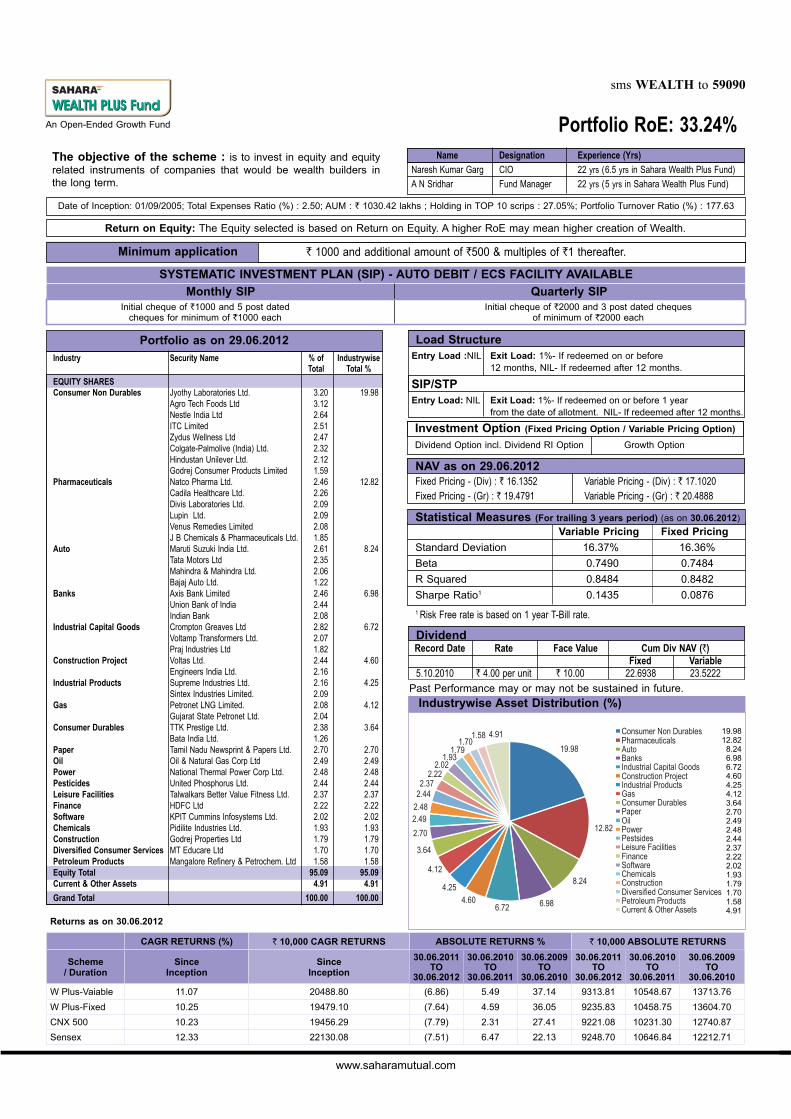
NAV as on 29.06.2012Fixed Pricing - (Div) : ` 16.1352 Variable Pricing - (Div) : ` 17.1020Fixed Pricing - (Gr) : ` 19.4791 Variable Pricing - (Gr) : ` 20.4888
Name Designation Experience (Yrs)
Naresh Kumar Garg CIO 22 yrs (6.5 yrs in Sahara Wealth Plus Fund)
A N Sridhar Fund Manager 22 yrs (5 yrs in Sahara Wealth Plus Fund)
Portfolio RoE: 33.24%
CAGR RETURNS (%) ` 10,000 CAGR RETURNS ABSOLUTE RETURNS % ` 10,000 ABSOLUTE RETURNS
Scheme/ Duration
SinceInception
SinceInception
30.06.2011TO
30.06.2012
30.06.2010TO
30.06.2011
30.06.2009TO
30.06.2010
30.06.2011TO
30.06.2012
30.06.2010TO
30.06.2011
30.06.2009TO
30.06.2010
W Plus-Vaiable 11.07 20488.80 (6.86) 5.49 37.14 9313.81 10548.67 13713.76
W Plus-Fixed 10.25 19479.10 (7.64) 4.59 36.05 9235.83 10458.75 13604.70
CNX 500 10.23 19456.29 (7.79) 2.31 27.41 9221.08 10231.30 12740.87
Sensex 12.33 22130.08 (7.51) 6.47 22.13 9248.70 10646.84 12212.71
Industry Security Name % of Industrywise Total Total %EQUITY SHARES Consumer Non Durables Jyothy Laboratories Ltd. 3.20 19.98 Agro Tech Foods Ltd 3.12 Nestle India Ltd 2.64 ITC Limited 2.51 Zydus Wellness Ltd 2.47 Colgate-Palmolive (India) Ltd. 2.32 Hindustan Unilever Ltd. 2.12 Godrej Consumer Products Limited 1.59 Pharmaceuticals Natco Pharma Ltd. 2.46 12.82 Cadila Healthcare Ltd. 2.26 Divis Laboratories Ltd. 2.09 Lupin Ltd. 2.09 Venus Remedies Limited 2.08 J B Chemicals & Pharmaceuticals Ltd. 1.85 Auto Maruti Suzuki India Ltd. 2.61 8.24 Tata Motors Ltd 2.35 Mahindra & Mahindra Ltd. 2.06 Bajaj Auto Ltd. 1.22 Banks Axis Bank Limited 2.46 6.98 Union Bank of India 2.44 Indian Bank 2.08 Industrial Capital Goods Crompton Greaves Ltd 2.82 6.72 Voltamp Transformers Ltd. 2.07 Praj Industries Ltd 1.82 Construction Project Voltas Ltd. 2.44 4.60 Engineers India Ltd. 2.16 Industrial Products Supreme Industries Ltd. 2.16 4.25 Sintex Industries Limited. 2.09 Gas Petronet LNG Limited. 2.08 4.12 Gujarat State Petronet Ltd. 2.04 Consumer Durables TTK Prestige Ltd. 2.38 3.64 Bata India Ltd. 1.26 Paper Tamil Nadu Newsprint & Papers Ltd. 2.70 2.70Oil Oil & Natural Gas Corp Ltd 2.49 2.49Power National Thermal Power Corp Ltd. 2.48 2.48Pesticides United Phosphorus Ltd. 2.44 2.44Leisure Facilities Talwalkars Better Value Fitness Ltd. 2.37 2.37Finance HDFC Ltd 2.22 2.22Software KPIT Cummins Infosystems Ltd. 2.02 2.02Chemicals Pidilite Industries Ltd. 1.93 1.93Construction Godrej Properties Ltd 1.79 1.79Diversifi ed Consumer Services MT Educare Ltd 1.70 1.70Petroleum Products Mangalore Refi nery & Petrochem. Ltd 1.58 1.58Equity Total 95.09 95.09Current & Other Assets 4.91 4.91
Grand Total 100.00 100.00
Returns as on 30.06.2012
The objective of the scheme : is to invest in equity and equity related instruments of companies that would be wealth builders in the long term.
Quarterly SIP
SYSTEMATIC INVESTMENT PLAN (SIP) - AUTO DEBIT / ECS FACILITY AVAILABLE
Monthly SIP
Return on Equity: The Equity selected is based on Return on Equity. A higher RoE may mean higher creation of Wealth.
Date of Inception: 01/09/2005; Total Expenses Ratio (%) : 2.50; AUM : ` 1030.42 lakhs ; Holding in TOP 10 scrips : 27.05%; Portfolio Turnover Ratio (%) : 177.63
Minimum application ` 1000 and additional amount of `500 & multiples of `1 thereafter.
Statistical Measures (For trailing 3 years period) (as on 30.06.2012)
Variable Pricing Fixed Pricing
Standard Deviation 16.37% 16.36%
Beta 0.7490 0.7484
R Squared 0.8484 0.8482
Sharpe Ratio1 0.1435 0.0876
1 Risk Free rate is based on 1 year T-Bill rate.
19.9812.82
8.246.986.724.604.254.123.642.702.492.482.442.372.222.021.931.791.701.584.91
Initial cheque of `1000 and 5 post dated Initial cheque of `2000 and 3 post dated cheques cheques for minimum of `1000 each of minimum of `2000 each
www.saharamutual.com
An Open-Ended Growth Fund
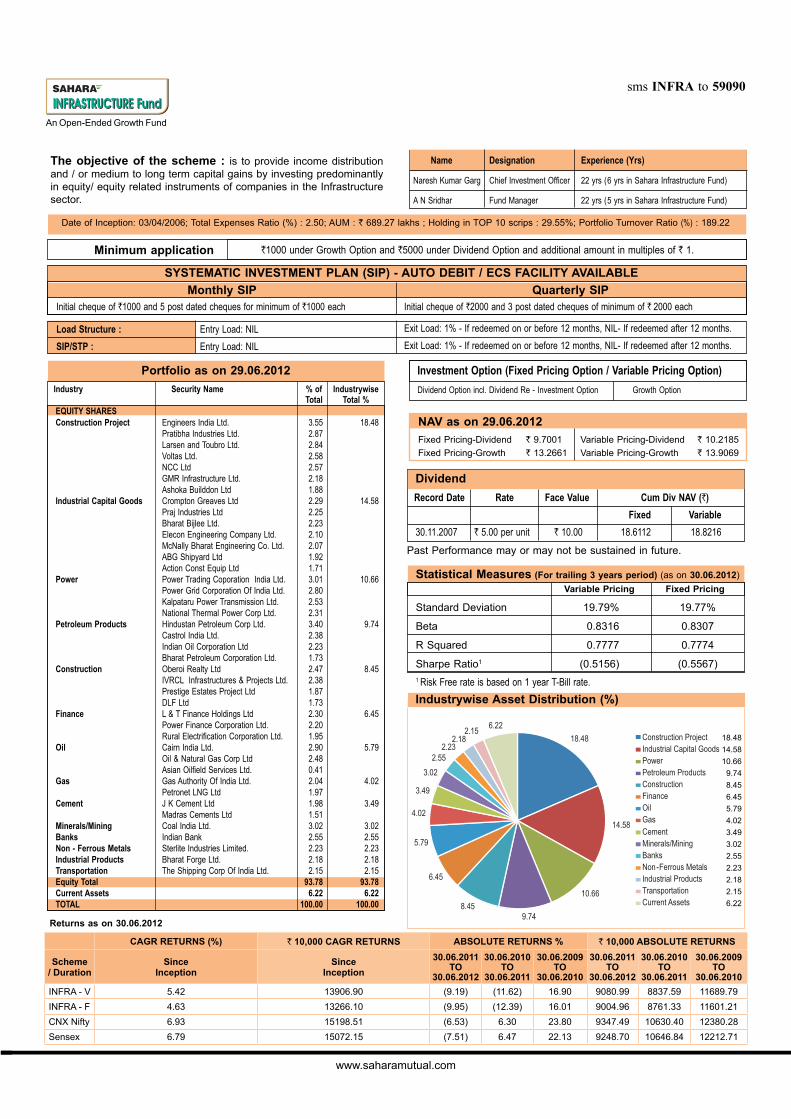
The objective of the scheme : is to provide income distribution and / or medium to long term capital gains by investing predominantly in equity/ equity related instruments of companies in the Infrastructure sector.
Industrywise Asset Distribution (%)
Past Performance may or may not be sustained in future.
Dividend
Record Date Rate Face Value Cum Div NAV (`)
Fixed Variable
30.11.2007 ` 5.00 per unit ` 10.00 18.6112 18.8216
sms INFRA to 59090
Statistical Measures (For trailing 3 years period) (as on 30.06.2012)
Variable Pricing Fixed Pricing
Standard Deviation 19.79% 19.77%
Beta 0.8316 0.8307
R Squared 0.7777 0.7774
Sharpe Ratio1 (0.5156) (0.5567)1 Risk Free rate is based on 1 year T-Bill rate.
Investment Option (Fixed Pricing Option / Variable Pricing Option)
Dividend Option incl. Dividend Re - Investment Option Growth Option
NAV as on 29.06.2012
Fixed Pricing-Dividend ` 9.7001 Variable Pricing-Dividend ` 10.2185
Fixed Pricing-Growth ` 13.2661 Variable Pricing-Growth ` 13.9069
Portfolio as on 29.06.2012
Minimum application `1000 under Growth Option and `5000 under Dividend Option and additional amount in multiples of ` 1.
SYSTEMATIC INVESTMENT PLAN (SIP) - AUTO DEBIT / ECS FACILITY AVAILABLE
Monthly SIP Quarterly SIPInitial cheque of `1000 and 5 post dated cheques for minimum of `1000 each Initial cheque of `2000 and 3 post dated cheques of minimum of ` 2000 each
Load Structure : Entry Load: NIL
SIP/STP : Entry Load: NIL
Exit Load: 1% - If redeemed on or before 12 months, NIL- If redeemed after 12 months.
Exit Load: 1% - If redeemed on or before 12 months, NIL- If redeemed after 12 months.
Name Designation Experience (Yrs)
Naresh Kumar Garg Chief Investment Offi cer 22 yrs (6 yrs in Sahara Infrastructure Fund)
A N Sridhar Fund Manager 22 yrs (5 yrs in Sahara Infrastructure Fund)
CAGR RETURNS (%) ` 10,000 CAGR RETURNS ABSOLUTE RETURNS % ` 10,000 ABSOLUTE RETURNS
Scheme/ Duration
SinceInception
SinceInception
30.06.2011TO
30.06.2012
30.06.2010TO
30.06.2011
30.06.2009TO
30.06.2010
30.06.2011TO
30.06.2012
30.06.2010TO
30.06.2011
30.06.2009TO
30.06.2010
INFRA - V 5.42 13906.90 (9.19) (11.62) 16.90 9080.99 8837.59 11689.79
INFRA - F 4.63 13266.10 (9.95) (12.39) 16.01 9004.96 8761.33 11601.21
CNX Nifty 6.93 15198.51 (6.53) 6.30 23.80 9347.49 10630.40 12380.28
Sensex 6.79 15072.15 (7.51) 6.47 22.13 9248.70 10646.84 12212.71
Returns as on 30.06.2012
Date of Inception: 03/04/2006; Total Expenses Ratio (%) : 2.50; AUM : ` 689.27 lakhs ; Holding in TOP 10 scrips : 29.55%; Portfolio Turnover Ratio (%) : 189.22
Industry Security Name % of Industrywise Total Total %EQUITY SHARESConstruction Project Engineers India Ltd. 3.55 18.48 Pratibha Industries Ltd. 2.87 Larsen and Toubro Ltd. 2.84 Voltas Ltd. 2.58 NCC Ltd 2.57 GMR Infrastructure Ltd. 2.18 Ashoka Builddon Ltd 1.88 Industrial Capital Goods Crompton Greaves Ltd 2.29 14.58 Praj Industries Ltd 2.25 Bharat Bijlee Ltd. 2.23 Elecon Engineering Company Ltd. 2.10 McNally Bharat Engineering Co. Ltd. 2.07 ABG Shipyard Ltd 1.92 Action Const Equip Ltd 1.71 Power Power Trading Coporation India Ltd. 3.01 10.66 Power Grid Corporation Of India Ltd. 2.80 Kalpataru Power Transmission Ltd. 2.53 National Thermal Power Corp Ltd. 2.31 Petroleum Products Hindustan Petroleum Corp Ltd. 3.40 9.74 Castrol India Ltd. 2.38 Indian Oil Corporation Ltd 2.23 Bharat Petroleum Corporation Ltd. 1.73 Construction Oberoi Realty Ltd 2.47 8.45 IVRCL Infrastructures & Projects Ltd. 2.38 Prestige Estates Project Ltd 1.87 DLF Ltd 1.73 Finance L & T Finance Holdings Ltd 2.30 6.45 Power Finance Corporation Ltd. 2.20 Rural Electrifi cation Corporation Ltd. 1.95 Oil Cairn India Ltd. 2.90 5.79 Oil & Natural Gas Corp Ltd 2.48 Asian Oilfi eld Services Ltd. 0.41 Gas Gas Authority Of India Ltd. 2.04 4.02 Petronet LNG Ltd 1.97 Cement J K Cement Ltd 1.98 3.49 Madras Cements Ltd 1.51 Minerals/Mining Coal India Ltd. 3.02 3.02Banks Indian Bank 2.55 2.55Non - Ferrous Metals Sterlite Industries Limited. 2.23 2.23Industrial Products Bharat Forge Ltd. 2.18 2.18Transportation The Shipping Corp Of India Ltd. 2.15 2.15Equity Total 93.78 93.78Current Assets 6.22 6.22TOTAL 100.00 100.00
18.48
14.58
10.66
9.74
8.45
6.45
5.79
4.02
3.49
3.02
2.55
2.23
2.18
2.15
6.22
www.saharamutual.com
sms MIDCAP to 59090
An Open-Ended Growth Fund
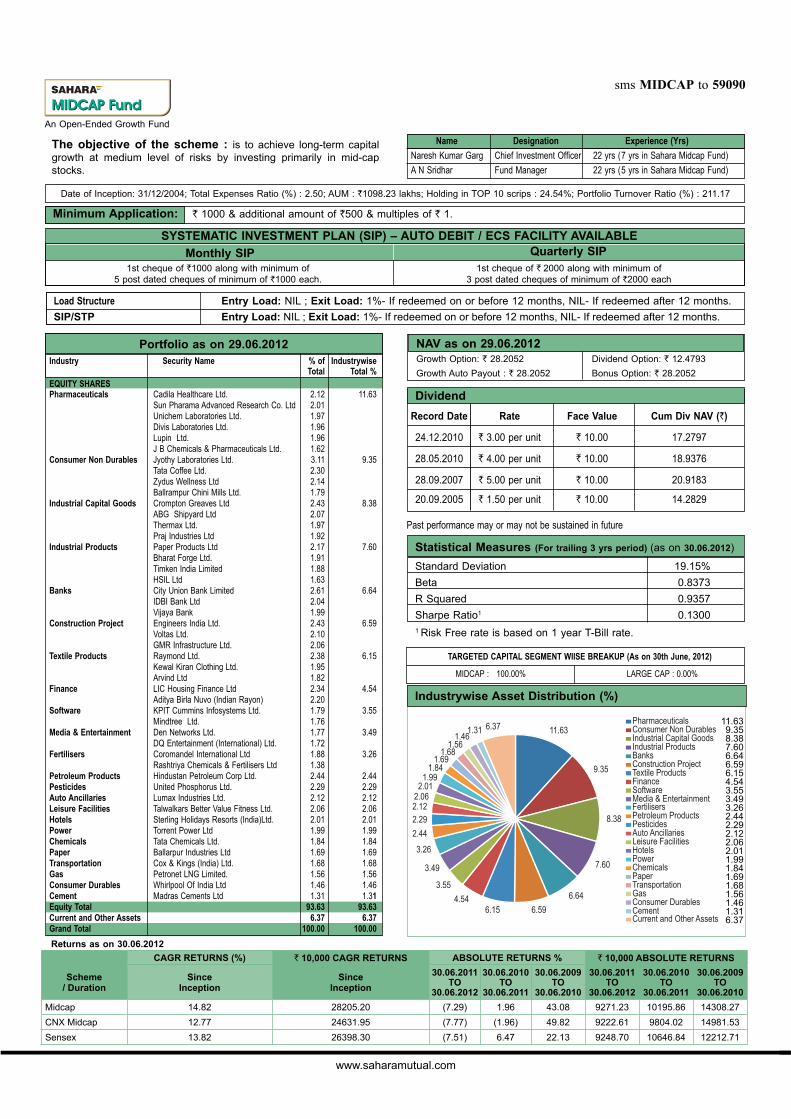
The objective of the scheme : is to achieve long-term capital growth at medium level of risks by investing primarily in mid-cap stocks.
Past performance may or may not be sustained in future
Load Structure Entry Load: NIL ; Exit Load: 1%- If redeemed on or before 12 months, NIL- If redeemed after 12 months.
SIP/STP Entry Load: NIL ; Exit Load: 1%- If redeemed on or before 12 months, NIL- If redeemed after 12 months.
Statistical Measures (For trailing 3 yrs period) (as on 30.06.2012)
Standard Deviation 19.15%
Beta 0.8373
R Squared 0.9357
Sharpe Ratio1 0.13001 Risk Free rate is based on 1 year T-Bill rate.
NAV as on 29.06.2012Growth Option: ` 28.2052 Dividend Option: ` 12.4793
Growth Auto Payout : ` 28.2052 Bonus Option: ` 28.2052
Date of Inception: 31/12/2004; Total Expenses Ratio (%) : 2.50; AUM : `1098.23 lakhs; Holding in TOP 10 scrips : 24.54%; Portfolio Turnover Ratio (%) : 211.17
TARGETED CAPITAL SEGMENT WIISE BREAKUP (As on 30th June, 2012)
MIDCAP : 100.00% LARGE CAP : 0.00%
Name Designation Experience (Yrs)
Naresh Kumar Garg Chief Investment Offi cer 22 yrs (7 yrs in Sahara Midcap Fund)
A N Sridhar Fund Manager 22 yrs (5 yrs in Sahara Midcap Fund)
SYSTEMATIC INVESTMENT PLAN (SIP) – AUTO DEBIT / ECS FACILITY AVAILABLE
Monthly SIP Quarterly SIP1st cheque of `1000 along with minimum of
5 post dated cheques of minimum of `1000 each.1st cheque of ` 2000 along with minimum of
3 post dated cheques of minimum of `2000 each
Minimum Application: ` 1000 & additional amount of `500 & multiples of ` 1.
Portfolio as on 29.06.2012
CAGR RETURNS (%) ` 10,000 CAGR RETURNS ABSOLUTE RETURNS % ` 10,000 ABSOLUTE RETURNS
Scheme/ Duration
SinceInception
SinceInception
30.06.2011TO
30.06.2012
30.06.2010TO
30.06.2011
30.06.2009TO
30.06.2010
30.06.2011TO
30.06.2012
30.06.2010TO
30.06.2011
30.06.2009TO
30.06.2010
Midcap 14.82 28205.20 (7.29) 1.96 43.08 9271.23 10195.86 14308.27
CNX Midcap 12.77 24631.95 (7.77) (1.96) 49.82 9222.61 9804.02 14981.53
Sensex 13.82 26398.30 (7.51) 6.47 22.13 9248.70 10646.84 12212.71
Returns as on 30.06.2012
Dividend
Record Date Rate Face Value Cum Div NAV (`)
24.12.2010 ` 3.00 per unit ` 10.00 17.2797
28.05.2010 ` 4.00 per unit ` 10.00 18.9376
28.09.2007 ` 5.00 per unit ` 10.00 20.9183
20.09.2005 ` 1.50 per unit ` 10.00 14.2829
Industrywise Asset Distribution (%)
Industry Security Name % of Industrywise Total Total %EQUITY SHARESPharmaceuticals Cadila Healthcare Ltd. 2.12 11.63 Sun Pharama Advanced Research Co. Ltd 2.01 Unichem Laboratories Ltd. 1.97 Divis Laboratories Ltd. 1.96 Lupin Ltd. 1.96 J B Chemicals & Pharmaceuticals Ltd. 1.62 Consumer Non Durables Jyothy Laboratories Ltd. 3.11 9.35 Tata Coffee Ltd. 2.30 Zydus Wellness Ltd 2.14 Ballrampur Chini Mills Ltd. 1.79 Industrial Capital Goods Crompton Greaves Ltd 2.43 8.38 ABG Shipyard Ltd 2.07 Thermax Ltd. 1.97 Praj Industries Ltd 1.92 Industrial Products Paper Products Ltd 2.17 7.60 Bharat Forge Ltd. 1.91 Timken India Limited 1.88 HSIL Ltd 1.63 Banks City Union Bank Limited 2.61 6.64 IDBI Bank Ltd 2.04 Vijaya Bank 1.99 Construction Project Engineers India Ltd. 2.43 6.59 Voltas Ltd. 2.10 GMR Infrastructure Ltd. 2.06 Textile Products Raymond Ltd. 2.38 6.15 Kewal Kiran Clothing Ltd. 1.95 Arvind Ltd 1.82 Finance LIC Housing Finance Ltd 2.34 4.54 Aditya Birla Nuvo (Indian Rayon) 2.20 Software KPIT Cummins Infosystems Ltd. 1.79 3.55 Mindtree Ltd. 1.76 Media & Entertainment Den Networks Ltd. 1.77 3.49 DQ Entertainment (International) Ltd. 1.72 Fertilisers Coromandel International Ltd 1.88 3.26 Rashtriya Chemicals & Fertilisers Ltd 1.38 Petroleum Products Hindustan Petroleum Corp Ltd. 2.44 2.44Pesticides United Phosphorus Ltd. 2.29 2.29Auto Ancillaries Lumax Industries Ltd. 2.12 2.12Leisure Facilities Talwalkars Better Value Fitness Ltd. 2.06 2.06Hotels Sterling Holidays Resorts (India)Ltd. 2.01 2.01Power Torrent Power Ltd 1.99 1.99Chemicals Tata Chemicals Ltd. 1.84 1.84Paper Ballarpur Industries Ltd 1.69 1.69Transportation Cox & Kings (India) Ltd. 1.68 1.68Gas Petronet LNG Limited. 1.56 1.56Consumer Durables Whirlpool Of India Ltd 1.46 1.46Cement Madras Cements Ltd 1.31 1.31Equity Total 93.63 93.63Current and Other Assets 6.37 6.37Grand Total 100.00 100.00
11.639.358.387.606.646.596.154.543.553.493.262.442.292.122.062.011.991.841.691.681.561.461.316.37
www.saharamutual.com
Portfolio as on 29.06.2012
An Open-Ended Growth Fund
sms STAR to 59090
NAV as on 29.06.2012Growth Option: ` 11.1051 Dividend Option: ` 10.1599
Portfolio as on 29.06.2012
An Open-Ended Growth Fund
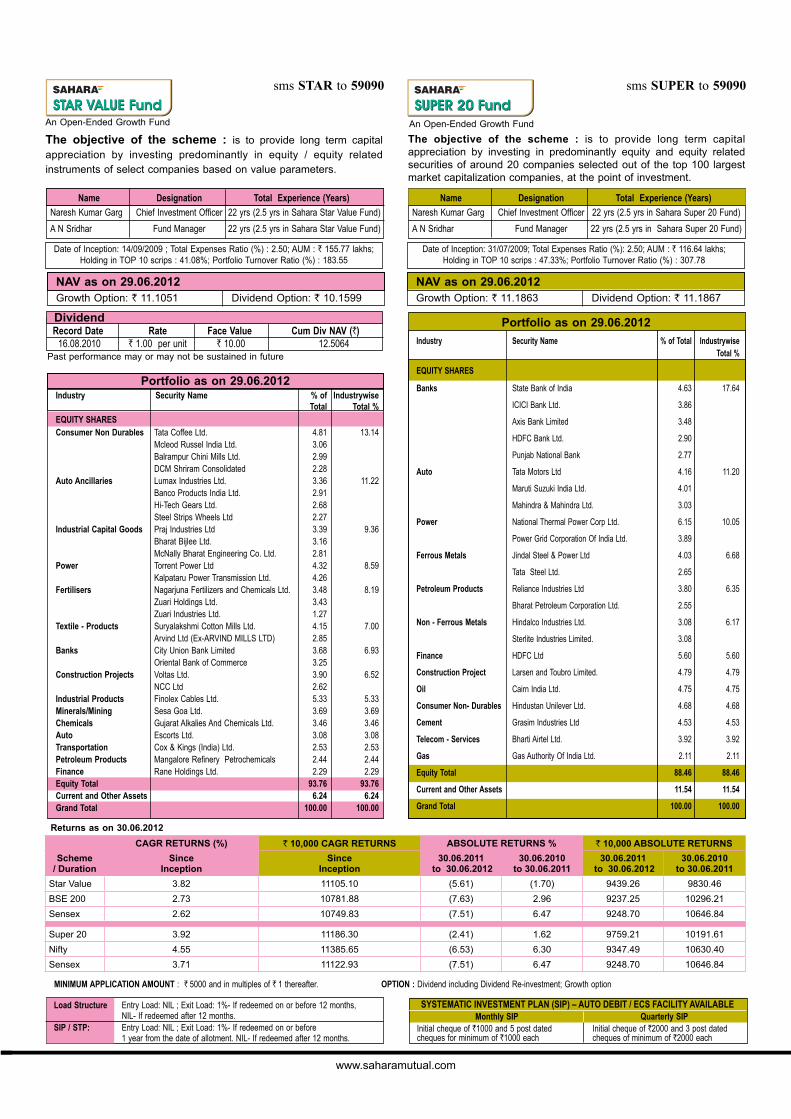
The objective of the scheme : is to provide long term capital appreciation by investing in predominantly equity and equity related securities of around 20 companies selected out of the top 100 largest market capitalization companies, at the point of investment.
Dividend Record Date Rate Face Value Cum Div NAV (`)
16.08.2010 ` 1.00 per unit ` 10.00 12.5064Past performance may or may not be sustained in future
Date of Inception: 14/09/2009 ; Total Expenses Ratio (%) : 2.50; AUM : ` 155.77 lakhs; Holding in TOP 10 scrips : 41.08%; Portfolio Turnover Ratio (%) : 183.55
Date of Inception: 31/07/2009; Total Expenses Ratio (%): 2.50; AUM : ` 116.64 lakhs; Holding in TOP 10 scrips : 47.33%; Portfolio Turnover Ratio (%) : 307.78
Name Designation Total Experience (Years)
Naresh Kumar Garg Chief Investment Offi cer 22 yrs (2.5 yrs in Sahara Star Value Fund)
A N Sridhar Fund Manager 22 yrs (2.5 yrs in Sahara Star Value Fund)
Load Structure Entry Load: NIL ; Exit Load: 1%- If redeemed on or before 12 months, NIL- If redeemed after 12 months.SIP / STP: Entry Load: NIL ; Exit Load: 1%- If redeemed on or before 1 year from the date of allotment. NIL- If redeemed after 12 months.
SYSTEMATIC INVESTMENT PLAN (SIP) – AUTO DEBIT / ECS FACILITY AVAILABLE Monthly SIP Quarterly SIPInitial cheque of `1000 and 5 post dated Initial cheque of `2000 and 3 post dated cheques for minimum of `1000 each cheques of minimum of `2000 each
CAGR RETURNS (%) ` 10,000 CAGR RETURNS ABSOLUTE RETURNS % ` 10,000 ABSOLUTE RETURNS
Scheme/ Duration
SinceInception
SinceInception
30.06.2011 to 30.06.2012
30.06.2010to 30.06.2011
30.06.2011 to 30.06.2012
30.06.2010to 30.06.2011
Star Value 3.82 11105.10 (5.61) (1.70) 9439.26 9830.46
BSE 200 2.73 10781.88 (7.63) 2.96 9237.25 10296.21
Sensex 2.62 10749.83 (7.51) 6.47 9248.70 10646.84
Super 20 3.92 11186.30 (2.41) 1.62 9759.21 10191.61
Nifty 4.55 11385.65 (6.53) 6.30 9347.49 10630.40
Sensex 3.71 11122.93 (7.51) 6.47 9248.70 10646.84
MINIMUM APPLICATION AMOUNT : ` 5000 and in multiples of ` 1 thereafter. OPTION : Dividend including Dividend Re-investment; Growth option
Name Designation Total Experience (Years)
Naresh Kumar Garg Chief Investment Offi cer 22 yrs (2.5 yrs in Sahara Super 20 Fund)
A N Sridhar Fund Manager 22 yrs (2.5 yrs in Sahara Super 20 Fund)
sms SUPER to 59090
NAV as on 29.06.2012Growth Option: ` 11.1863 Dividend Option: ` 11.1867
Industry Security Name % of Industrywise Total Total %
EQUITY SHARESConsumer Non Durables Tata Coffee Ltd. 4.81 13.14 Mcleod Russel India Ltd. 3.06 Balrampur Chini Mills Ltd. 2.99 DCM Shriram Consolidated 2.28 Auto Ancillaries Lumax Industries Ltd. 3.36 11.22 Banco Products India Ltd. 2.91 Hi-Tech Gears Ltd. 2.68 Steel Strips Wheels Ltd 2.27 Industrial Capital Goods Praj Industries Ltd 3.39 9.36 Bharat Bijlee Ltd. 3.16 McNally Bharat Engineering Co. Ltd. 2.81 Power Torrent Power Ltd 4.32 8.59 Kalpataru Power Transmission Ltd. 4.26 Fertilisers Nagarjuna Fertilizers and Chemicals Ltd. 3.48 8.19 Zuari Holdings Ltd. 3.43 Zuari Industries Ltd. 1.27 Textile - Products Suryalakshmi Cotton Mills Ltd. 4.15 7.00 Arvind Ltd (Ex-ARVIND MILLS LTD) 2.85 Banks City Union Bank Limited 3.68 6.93 Oriental Bank of Commerce 3.25 Construction Projects Voltas Ltd. 3.90 6.52 NCC Ltd 2.62 Industrial Products Finolex Cables Ltd. 5.33 5.33Minerals/Mining Sesa Goa Ltd. 3.69 3.69Chemicals Gujarat Alkalies And Chemicals Ltd. 3.46 3.46Auto Escorts Ltd. 3.08 3.08Transportation Cox & Kings (India) Ltd. 2.53 2.53Petroleum Products Mangalore Refi nery Petrochemicals 2.44 2.44Finance Rane Holdings Ltd. 2.29 2.29Equity Total 93.76 93.76Current and Other Assets 6.24 6.24Grand Total 100.00 100.00
Returns as on 30.06.2012
The objective of the scheme : is to provide long term capital appreciation by investing predominantly in equity / equity related instruments of select companies based on value parameters.
Industry Security Name % of Total Industrywise Total %
EQUITY SHARES
Banks State Bank of India 4.63 17.64
ICICI Bank Ltd. 3.86
Axis Bank Limited 3.48
HDFC Bank Ltd. 2.90
Punjab National Bank 2.77
Auto Tata Motors Ltd 4.16 11.20
Maruti Suzuki India Ltd. 4.01
Mahindra & Mahindra Ltd. 3.03
Power National Thermal Power Corp Ltd. 6.15 10.05
Power Grid Corporation Of India Ltd. 3.89
Ferrous Metals Jindal Steel & Power Ltd 4.03 6.68
Tata Steel Ltd. 2.65
Petroleum Products Reliance Industries Ltd 3.80 6.35
Bharat Petroleum Corporation Ltd. 2.55
Non - Ferrous Metals Hindalco Industries Ltd. 3.08 6.17
Sterlite Industries Limited. 3.08
Finance HDFC Ltd 5.60 5.60
Construction Project Larsen and Toubro Limited. 4.79 4.79
Oil Cairn India Ltd. 4.75 4.75
Consumer Non- Durables Hindustan Unilever Ltd. 4.68 4.68
Cement Grasim Industries Ltd 4.53 4.53
Telecom - Services Bharti Airtel Ltd. 3.92 3.92
Gas Gas Authority Of India Ltd. 2.11 2.11
Equity Total 88.46 88.46
Current and Other Assets 11.54 11.54
Grand Total 100.00 100.00
www.saharamutual.com
sms REAL to 59090
An Open Ended Equity Scheme
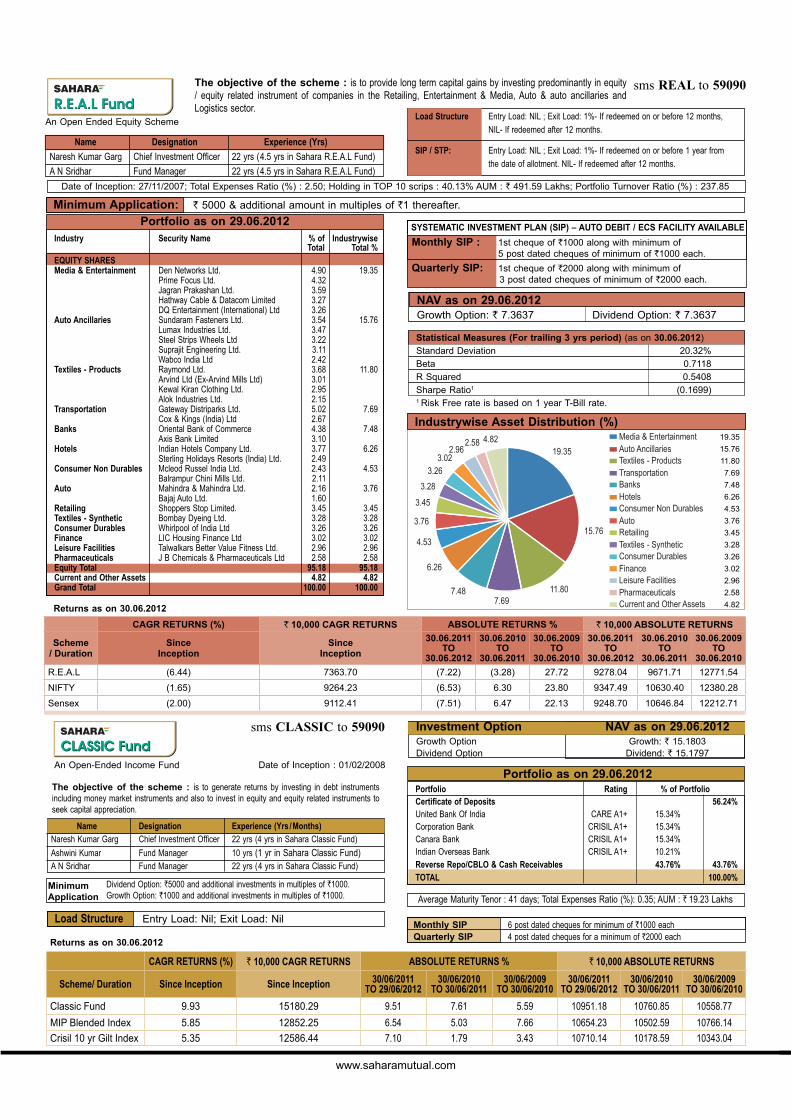
The objective of the scheme : is to provide long term capital gains by investing predominantly in equity / equity related instrument of companies in the Retailing, Entertainment & Media, Auto & auto ancillaries and Logistics sector.
Minimum Application: ` 5000 & additional amount in multiples of `1 thereafter.
Statistical Measures (For trailing 3 yrs period) (as on 30.06.2012)
Standard Deviation 20.32%
Beta 0.7118
R Squared 0.5408
Sharpe Ratio1 (0.1699)1 Risk Free rate is based on 1 year T-Bill rate.
NAV as on 29.06.2012Growth Option: ` 7.3637 Dividend Option: ` 7.3637
Date of Inception: 27/11/2007; Total Expenses Ratio (%) : 2.50; Holding in TOP 10 scrips : 40.13% AUM : ` 491.59 Lakhs; Portfolio Turnover Ratio (%) : 237.85
SYSTEMATIC INVESTMENT PLAN (SIP) – AUTO DEBIT / ECS FACILITY AVAILABLE
Industrywise Asset Distribution (%)
Name Designation Experience (Yrs)
Naresh Kumar Garg Chief Investment Offi cer 22 yrs (4.5 yrs in Sahara R.E.A.L Fund)
A N Sridhar Fund Manager 22 yrs (4.5 yrs in Sahara R.E.A.L Fund)
CAGR RETURNS (%) ` 10,000 CAGR RETURNS ABSOLUTE RETURNS % ` 10,000 ABSOLUTE RETURNS
Scheme/ Duration
SinceInception
SinceInception
30.06.2011TO
30.06.2012
30.06.2010TO
30.06.2011
30.06.2009TO
30.06.2010
30.06.2011TO
30.06.2012
30.06.2010TO
30.06.2011
30.06.2009TO
30.06.2010
R.E.A.L (6.44) 7363.70 (7.22) (3.28) 27.72 9278.04 9671.71 12771.54
NIFTY (1.65) 9264.23 (6.53) 6.30 23.80 9347.49 10630.40 12380.28
Sensex (2.00) 9112.41 (7.51) 6.47 22.13 9248.70 10646.84 12212.71
Portfolio as on 29.06.2012Industry Security Name % of Industrywise Total Total %EQUITY SHARESMedia & Entertainment Den Networks Ltd. 4.90 19.35 Prime Focus Ltd. 4.32 Jagran Prakashan Ltd. 3.59 Hathway Cable & Datacom Limited 3.27 DQ Entertainment (International) Ltd 3.26 Auto Ancillaries Sundaram Fasteners Ltd. 3.54 15.76 Lumax Industries Ltd. 3.47 Steel Strips Wheels Ltd 3.22 Suprajit Engineering Ltd. 3.11 Wabco India Ltd 2.42 Textiles - Products Raymond Ltd. 3.68 11.80 Arvind Ltd (Ex-Arvind Mills Ltd) 3.01 Kewal Kiran Clothing Ltd. 2.95 Alok Industries Ltd. 2.15 Transportation Gateway Distriparks Ltd. 5.02 7.69 Cox & Kings (India) Ltd 2.67 Banks Oriental Bank of Commerce 4.38 7.48 Axis Bank Limited 3.10 Hotels Indian Hotels Company Ltd. 3.77 6.26 Sterling Holidays Resorts (India) Ltd. 2.49 Consumer Non Durables Mcleod Russel India Ltd. 2.43 4.53 Balrampur Chini Mills Ltd. 2.11 Auto Mahindra & Mahindra Ltd. 2.16 3.76 Bajaj Auto Ltd. 1.60 Retailing Shoppers Stop Limited. 3.45 3.45Textiles - Synthetic Bombay Dyeing Ltd. 3.28 3.28Consumer Durables Whirlpool of India Ltd 3.26 3.26Finance LIC Housing Finance Ltd 3.02 3.02Leisure Facilities Talwalkars Better Value Fitness Ltd. 2.96 2.96Pharmaceuticals J B Chemicals & Pharmaceuticals Ltd 2.58 2.58Equity Total 95.18 95.18Current and Other Assets 4.82 4.82Grand Total 100.00 100.00
Load Structure Entry Load: NIL ; Exit Load: 1%- If redeemed on or before 12 months,
NIL- If redeemed after 12 months.
SIP / STP: Entry Load: NIL ; Exit Load: 1%- If redeemed on or before 1 year from
the date of allotment. NIL- If redeemed after 12 months.
sms CLASSIC to 59090
An Open-Ended Income Fund
The objective of the scheme : is to generate returns by investing in debt instruments including money market instruments and also to invest in equity and equity related instruments to seek capital appreciation.
Monthly SIP 6 post dated cheques for minimum of `1000 each Quarterly SIP 4 post dated cheques for a minimum of `2000 each
Portfolio as on 29.06.2012
Average Maturity Tenor : 41 days; Total Expenses Ratio (%): 0.35; AUM : ` 19.23 Lakhs
Date of Inception : 01/02/2008
Load Structure Entry Load: Nil; Exit Load: Nil
Name Designation Experience (Yrs / Months)
Naresh Kumar Garg Chief Investment Offi cer 22 yrs (4 yrs in Sahara Classic Fund)
Ashwini Kumar Fund Manager 10 yrs (1 yr in Sahara Classic Fund)A N Sridhar Fund Manager 22 yrs (4 yrs in Sahara Classic Fund)
Minimum Application
Dividend Option: `5000 and additional investments in multiples of `1000.Growth Option: `1000 and additional investments in multiples of `1000.
Returns as on 30.06.2012
CAGR RETURNS (%) ` 10,000 CAGR RETURNS ABSOLUTE RETURNS % ` 10,000 ABSOLUTE RETURNS
Scheme/ Duration Since Inception Since Inception 30/06/2011 TO 29/06/2012
30/06/2010 TO 30/06/2011
30/06/2009 TO 30/06/2010
30/06/2011 TO 29/06/2012
30/06/2010 TO 30/06/2011
30/06/2009 TO 30/06/2010
Classic Fund 9.93 15180.29 9.51 7.61 5.59 10951.18 10760.85 10558.77
MIP Blended Index 5.85 12852.25 6.54 5.03 7.66 10654.23 10502.59 10766.14
Crisil 10 yr Gilt Index 5.35 12586.44 7.10 1.79 3.43 10710.14 10178.59 10343.04
Growth Option Growth: ` 15.1803Dividend Option Dividend: ` 15.1797
Monthly SIP : 1st cheque of `1000 along with minimum of 5 post dated cheques of minimum of `1000 each.
Quarterly SIP: 1st cheque of `2000 along with minimum of 3 post dated cheques of minimum of `2000 each.
Returns as on 30.06.2012
19.35
15.76
11.80
7.69
7.48
6.26
4.53
3.76
3.45
3.28
3.26
3.02
2.96
2.58
4.82
Portfolio Rating % of Portfolio Certifi cate of Deposits 56.24%United Bank Of India CARE A1+ 15.34% Corporation Bank CRISIL A1+ 15.34% Canara Bank CRISIL A1+ 15.34% Indian Overseas Bank CRISIL A1+ 10.21% Reverse Repo/CBLO & Cash Receivables 43.76% 43.76%TOTAL 100.00%
Investment Option NAV as on 29.06.2012
www.saharamutual.com
sms LIQUID to 59090
An Open-Ended Liquid Fund
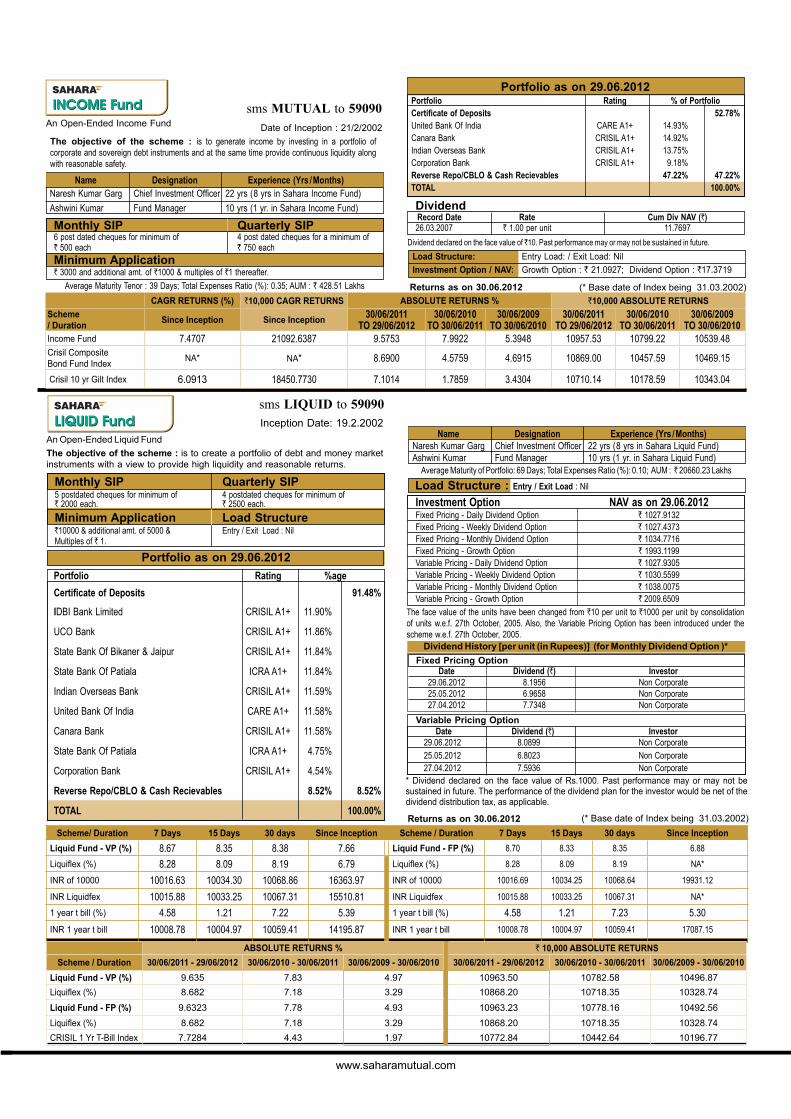
The objective of the scheme : is to create a portfolio of debt and money market instruments with a view to provide high liquidity and reasonable returns.
The face value of the units have been changed from `10 per unit to `1000 per unit by consolidation of units w.e.f. 27th October, 2005. Also, the Variable Pricing Option has been introduced under the scheme w.e.f. 27th October, 2005.
Monthly SIP Quarterly SIP5 postdated cheques for minimum of 4 postdated cheques for minimum of` 2000 each. ` 2500 each.
Minimum Application Load Structure`10000 & additional amt. of 5000 & Entry / Exit Load : Nil Multiples of ` 1.
Portfolio as on 29.06.2012
An Open-Ended Income Fund
Monthly SIP Quarterly SIP6 post dated cheques for minimum of 4 post dated cheques for a minimum of ` 500 each ` 750 each
Minimum Application ` 3000 and additional amt. of `1000 & multiples of `1 thereafter.
Load Structure: Entry Load: / Exit Load: Nil
Investment Option / NAV: Growth Option : ` 21.0927; Dividend Option : `17.3719
Portfolio as on 29.06.2012
Average Maturity Tenor : 39 Days; Total Expenses Ratio (%): 0.35; AUM : ` 428.51 Lakhs
Date of Inception : 21/2/2002
Dividend Record Date Rate Cum Div NAV (`)
26.03.2007 ` 1.00 per unit 11.7697
Dividend declared on the face value of ̀ 10. Past performance may or may not be sustained in future.
sms MUTUAL to 59090
Dividend History [per unit (in Rupees)] (for Monthly Dividend Option )*
Fixed Pricing Option Date Dividend (`) Investor 29.06.2012 8.1956 Non Corporate 25.05.2012 6.9658 Non Corporate 27.04.2012 7.7348 Non Corporate
Name Designation Experience (Yrs / Months)Naresh Kumar Garg Chief Investment Offi cer 22 yrs (8 yrs in Sahara Income Fund)
Ashwini Kumar Fund Manager 10 yrs (1 yr. in Sahara Income Fund)
Inception Date: 19.2.2002
The objective of the scheme : is to generate income by investing in a portfolio of corporate and sovereign debt instruments and at the same time provide continuous liquidity along with reasonable safety.
Investment Option NAV as on 29.06.2012Fixed Pricing - Daily Dividend Option ` 1027.9132Fixed Pricing - Weekly Dividend Option ` 1027.4373Fixed Pricing - Monthly Dividend Option ` 1034.7716Fixed Pricing - Growth Option ` 1993.1199Variable Pricing - Daily Dividend Option ` 1027.9305Variable Pricing - Weekly Dividend Option ` 1030.5599Variable Pricing - Monthly Dividend Option ` 1038.0075Variable Pricing - Growth Option ` 2009.6509
* Dividend declared on the face value of Rs.1000. Past performance may or may not be sustained in future. The performance of the dividend plan for the investor would be net of the dividend distribution tax, as applicable.
(* Base date of Index being 31.03.2002)
CAGR RETURNS (%) `10,000 CAGR RETURNS ABSOLUTE RETURNS % `10,000 ABSOLUTE RETURNS
Scheme/ Duration
Since Inception Since Inception 30/06/2011 TO 29/06/2012
30/06/2010 TO 30/06/2011
30/06/2009 TO 30/06/2010
30/06/2011 TO 29/06/2012
30/06/2010 TO 30/06/2011
30/06/2009 TO 30/06/2010
Income Fund 7.4707 21092.6387 9.5753 7.9922 5.3948 10957.53 10799.22 10539.48Crisil CompositeBond Fund Index
NA* NA* 8.6900 4.5759 4.6915 10869.00 10457.59 10469.15
Crisil 10 yr Gilt Index 6.0913 18450.7730 7.1014 1.7859 3.4304 10710.14 10178.59 10343.04
Scheme/ Duration 7 Days 15 Days 30 days Since Inception Scheme / Duration 7 Days 15 Days 30 days Since Inception
Liquid Fund - VP (%) 8.67 8.35 8.38 7.66 Liquid Fund - FP (%) 8.70 8.33 8.35 6.88
Liquifl ex (%) 8.28 8.09 8.19 6.79 Liquifl ex (%) 8.28 8.09 8.19 NA*
INR of 10000 10016.63 10034.30 10068.86 16363.97 INR of 10000 10016.69 10034.25 10068.64 19931.12
INR Liquidfex 10015.88 10033.25 10067.31 15510.81 INR Liquidfex 10015.88 10033.25 10067.31 NA*
1 year t bill (%) 4.58 1.21 7.22 5.39 1 year t bill (%) 4.58 1.21 7.23 5.30
INR 1 year t bill 10008.78 10004.97 10059.41 14195.87 INR 1 year t bill 10008.78 10004.97 10059.41 17087.15
ABSOLUTE RETURNS % ` 10,000 ABSOLUTE RETURNS
Scheme / Duration 30/06/2011 - 29/06/2012 30/06/2010 - 30/06/2011 30/06/2009 - 30/06/2010 30/06/2011 - 29/06/2012 30/06/2010 - 30/06/2011 30/06/2009 - 30/06/2010
Liquid Fund - VP (%) 9.635 7.83 4.97 10963.50 10782.58 10496.87
Liquifl ex (%) 8.682 7.18 3.29 10868.20 10718.35 10328.74
Liquid Fund - FP (%) 9.6323 7.78 4.93 10963.23 10778.16 10492.56
Liquifl ex (%) 8.682 7.18 3.29 10868.20 10718.35 10328.74
CRISIL 1 Yr T-Bill Index 7.7284 4.43 1.97 10772.84 10442.64 10196.77
Load Structure : Entry / Exit Load : Nil
Average Maturity of Portfolio: 69 Days; Total Expenses Ratio (%): 0.10; AUM : ̀ 20660.23 Lakhs
Name Designation Experience (Yrs / Months)Naresh Kumar Garg Chief Investment Offi cer 22 yrs (8 yrs in Sahara Liquid Fund)Ashwini Kumar Fund Manager 10 yrs (1 yr. in Sahara Liquid Fund)
(* Base date of Index being 31.03.2002)
Returns as on 30.06.2012
Returns as on 30.06.2012
Variable Pricing Option Date Dividend (`) Investor 29.06.2012 8.0899 Non Corporate
25.05.2012 6.8023 Non Corporate 27.04.2012 7.5936 Non Corporate
Portfolio Rating % of Portfolio Certifi cate of Deposits 52.78%United Bank Of India CARE A1+ 14.93% Canara Bank CRISIL A1+ 14.92% Indian Overseas Bank CRISIL A1+ 13.75% Corporation Bank CRISIL A1+ 9.18% Reverse Repo/CBLO & Cash Recievables 47.22% 47.22%TOTAL 100.00%
Portfolio Rating %age
Certifi cate of Deposits 91.48%
IDBI Bank Limited CRISIL A1+ 11.90%
UCO Bank CRISIL A1+ 11.86%
State Bank Of Bikaner & Jaipur CRISIL A1+ 11.84%
State Bank Of Patiala ICRA A1+ 11.84%
Indian Overseas Bank CRISIL A1+ 11.59%
United Bank Of India CARE A1+ 11.58%
Canara Bank CRISIL A1+ 11.58%
State Bank Of Patiala ICRA A1+ 4.75%
Corporation Bank CRISIL A1+ 4.54%
Reverse Repo/CBLO & Cash Recievables 8.52% 8.52%
TOTAL 100.00%
www.saharamutual.com
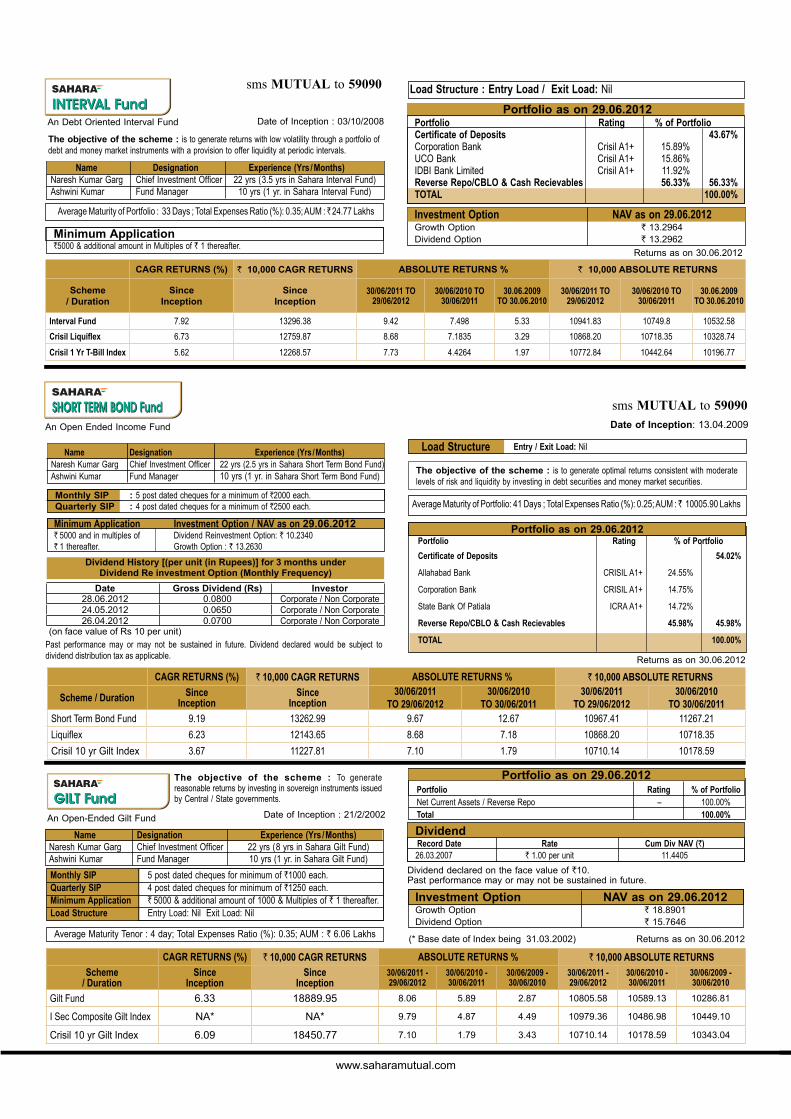
Portfolio Rating % of PortfolioNet Current Assets / Reverse Repo – 100.00% Total 100.00%
An Debt Oriented Interval Fund Date of Inception : 03/10/2008
Average Maturity of Portfolio : 33 Days ; Total Expenses Ratio (%): 0.35; AUM : ̀ 24.77 Lakhs
sms MUTUAL to 59090
An Open-Ended Gilt Fund
The objective of the scheme : To generate reasonable returns by investing in sovereign instruments issued by Central / State governments.
Investment Option NAV as on 29.06.2012Growth Option ` 18.8901Dividend Option ` 15.7646
Average Maturity Tenor : 4 day; Total Expenses Ratio (%): 0.35; AUM : ` 6.06 Lakhs
Date of Inception : 21/2/2002
Monthly SIP 5 post dated cheques for minimum of `1000 each.Quarterly SIP 4 post dated cheques for minimum of `1250 each.Minimum Application ` 5000 & additional amount of 1000 & Multiples of ` 1 thereafter. Load Structure Entry Load: Nil Exit Load: Nil
Name Designation Experience (Yrs / Months)Naresh Kumar Garg Chief Investment Offi cer 22 yrs (8 yrs in Sahara Gilt Fund)Ashwini Kumar Fund Manager 10 yrs (1 yr. in Sahara Gilt Fund)
The objective of the scheme : is to generate returns with low volatility through a portfolio of debt and money market instruments with a provision to offer liquidity at periodic intervals.
Minimum Application`5000 & additional amount in Multiples of ` 1 thereafter.
Load Structure : Entry Load / Exit Load: Nil
Portfolio as on 29.06.2012
Investment Option NAV as on 29.06.2012Growth Option ` 13.2964Dividend Option ` 13.2962
The objective of the scheme : is to generate optimal returns consistent with moderate levels of risk and liquidity by investing in debt securities and money market securities.
Date of Inception: 13.04.2009An Open Ended Income Fund
Average Maturity of Portfolio: 41 Days ; Total Expenses Ratio (%): 0.25; AUM : ̀ 10005.90 Lakhs
Past performance may or may not be sustained in future. Dividend declared would be subject to dividend distribution tax as applicable.
Date Gross Dividend (Rs) Investor28.06.2012 0.0800 Corporate / Non Corporate24.05.2012 0.0650 Corporate / Non Corporate26.04.2012 0.0700 Corporate / Non Corporate
(on face value of Rs 10 per unit)
Dividend History [(per unit (in Rupees)] for 3 months under Dividend Re investment Option (Monthly Frequency)
Entry / Exit Load: NilLoad Structure
Monthly SIP : 5 post dated cheques for a minimum of `2000 each. Quarterly SIP : 4 post dated cheques for a minimum of `2500 each.
Minimum Application Investment Option / NAV as on 29.06.2012` 5000 and in multiples of Dividend Reinvestment Option: ` 10.2340` 1 thereafter. Growth Option : ` 13.2630
Name Designation Experience (Yrs / Months)Naresh Kumar Garg Chief Investment Offi cer 22 yrs (2.5 yrs in Sahara Short Term Bond Fund)Ashwini Kumar Fund Manager 10 yrs (1 yr. in Sahara Short Term Bond Fund)
sms MUTUAL to 59090
Name Designation Experience (Yrs / Months)Naresh Kumar Garg Chief Investment Offi cer 22 yrs (3.5 yrs in Sahara Interval Fund)Ashwini Kumar Fund Manager 10 yrs (1 yr. in Sahara Interval Fund)
CAGR RETURNS (%) ` 10,000 CAGR RETURNS ABSOLUTE RETURNS % ` 10,000 ABSOLUTE RETURNS
Scheme/ Duration
SinceInception
SinceInception
30/06/2011 - 29/06/2012
30/06/2010 - 30/06/2011
30/06/2009 - 30/06/2010
30/06/2011 - 29/06/2012
30/06/2010 - 30/06/2011
30/06/2009 - 30/06/2010
Gilt Fund 6.33 18889.95 8.06 5.89 2.87 10805.58 10589.13 10286.81
I Sec Composite Gilt Index NA* NA* 9.79 4.87 4.49 10979.36 10486.98 10449.10
Crisil 10 yr Gilt Index 6.09 18450.77 7.10 1.79 3.43 10710.14 10178.59 10343.04
(* Base date of Index being 31.03.2002)
Returns as on 30.06.2012
Returns as on 30.06.2012
Returns as on 30.06.2012
CAGR RETURNS (%) ` 10,000 CAGR RETURNS ABSOLUTE RETURNS % ` 10,000 ABSOLUTE RETURNS
Scheme/ Duration
SinceInception
SinceInception
30/06/2011 TO 29/06/2012
30/06/2010 TO 30/06/2011
30.06.2009TO 30.06.2010
30/06/2011 TO 29/06/2012
30/06/2010 TO 30/06/2011
30.06.2009TO 30.06.2010
Interval Fund 7.92 13296.38 9.42 7.498 5.33 10941.83 10749.8 10532.58Crisil Liquifl ex 6.73 12759.87 8.68 7.1835 3.29 10868.20 10718.35 10328.74Crisil 1 Yr T-Bill Index 5.62 12268.57 7.73 4.4264 1.97 10772.84 10442.64 10196.77
CAGR RETURNS (%) ` 10,000 CAGR RETURNS ABSOLUTE RETURNS % ` 10,000 ABSOLUTE RETURNS
Scheme / Duration SinceInception
SinceInception
30/06/2011 TO 29/06/2012
30/06/2010 TO 30/06/2011
30/06/2011 TO 29/06/2012
30/06/2010 TO 30/06/2011
Short Term Bond Fund 9.19 13262.99 9.67 12.67 10967.41 11267.21
Liquifl ex 6.23 12143.65 8.68 7.18 10868.20 10718.35
Crisil 10 yr Gilt Index 3.67 11227.81 7.10 1.79 10710.14 10178.59
Dividend Record Date Rate Cum Div NAV (`)
26.03.2007 ` 1.00 per unit 11.4405
Dividend declared on the face value of `10. Past performance may or may not be sustained in future.
Portfolio Rating % of Portfolio Certifi cate of Deposits 43.67%Corporation Bank Crisil A1+ 15.89% UCO Bank Crisil A1+ 15.86% IDBI Bank Limited Crisil A1+ 11.92% Reverse Repo/CBLO & Cash Recievables 56.33% 56.33%TOTAL 100.00%
Portfolio Rating % of Portfolio
Certifi cate of Deposits 54.02%
Allahabad Bank CRISIL A1+ 24.55%
Corporation Bank CRISIL A1+ 14.75%
State Bank Of Patiala ICRA A1+ 14.72%
Reverse Repo/CBLO & Cash Recievables 45.98% 45.98%
TOTAL 100.00%
Portfolio as on 29.06.2012
Portfolio as on 29.06.2012