Embed Size (px)
Citation preview

NIST Technical Note 1784
Smoke Alarm Performance in Kitchen Fires and Nuisance Alarm Scenarios
Thomas G. Cleary Artur Chernovsky
http://dx.doi.org/10.6028/NIST.TN.1784

NIST Technical Note 1784
Smoke Alarm Performance in Kitchen Fires and Nuisance
Alarm Scenarios
Thomas G. Cleary Artur Chernovsky
Engineering Laboratory
http://dx.doi.org/10.6028/NIST.TN.1784
January, 2013
U.S. Department of Commerce Rebecca M. Blank, Acting Secretary
National Institute of Standards and Technology
Patrick D. Gallagher, Under Secretary of Commerce for Standards and Technology and Director

Certain commercial entities, equipment, or materials may be identified in this
document in order to describe an experimental procedure or concept adequately.
Such identification is not intended to imply recommendation or endorsement by the
National Institute of Standards and Technology, nor is it intended to imply that the
entities, materials, or equipment are necessarily the best available for the purpose.
National Institute of Standards and Technology Technical Note 1784
Natl. Inst. Stand. Technol. Tech. Note 1784, 80 pages (January 2013)
http://dx.doi.org/10.6028/NIST.TN.1784 CODEN: NTNOEF

iii
Abstract
Experiments were conducted to assess the performance of various residential smoke alarms to kitchen
fires and nuisance alarm cooking scenarios. A structure representing a kitchen, living room and hallway
was constructed to conduct the experiments. Eight different residential smoke alarms types, two
photoelectric models (P1 and P2), two ionization models (I1 and I2), two dual sensor
photoelectric/ionization models(D1 and D2), and two multi-sensor, intelligent models (M1 and M2) were
used in this study. The data gathered provided insight into the susceptibility of alarm activation from
exposures to typical cooking events and alarm times for actual kitchen fires. The effects of alarm
technology and installation location on the propensity of an alarm to activate were examined. In the
kitchen fire experiments, all smoke alarms responded before hazardous conditions developed. An
ionization alarm (I1) tended to respond first compared to other co-located alarms. Results show smoke
alarms placed greater than 6 m from the kitchen range may provide less than 120 s of available safe
egress time, which suggests the importance of a more central alarm location closer to the kitchen for this
configuration. Experiments were conducted to determine an alarm’s propensity to activate when exposed
to particulates generated from eight typical cooking activities including toasting, frying, baking and
broiling. In most cases, the propensity to nuisance alarm decreased as the distance from the cooking
source increased. Two alarms, I1 and D2, experienced more nuisance alarm activations across the eight
cooking activities than the other alarms. The remaining alarms experienced about the same combined
nuisance alarm frequency by averaging all cooking events for installation locations outside the kitchen.
Experiments showed combustible materials typically found on a counter top can spread flames to
overhead cabinets, and a single empty 0.6 m wide 1.0 m tall wood-framed, pressboard cabinet can
produce a peak heat release rate nearly sufficient to flashover a small room. Alternatively, protective
metal barrier on the bottom and side facing the range tended to limit the spread of flames to the cabinet
and reduce the heat release rate.
iv
Disclaimer
U. S. Consumer Product Safety Commission
The views expressed in this report are those of the CPSC staff and/or NIST and have not been reviewed
or approved by, and may not necessarily reflect the views of, the Commission.
Acknowledgements
The authors acknowledge Michael Selepak, Anthony Chakalis, Doris Rinehart, Jay McElroy, and
Laurean Delauter for their assistance with the set up and gathering data. We also want to thank the
Montgomery County Fire and Rescue Service for the use of the burn prop building at the Public Safety
Training Academy, and Assistant Chief Mike Clemens and Captain Audrey Deputy for their assistance.
This project was funded by an interagency agreement with the US Consumer Products Safety
Commission. The technical monitor of the contract was Mr. Arthur Lee.

v
Table of Contents
Abstract ............................................................................................................................... iii Disclaimer ............................................................................................................................ iv Acknowledgements .............................................................................................................. iv 1 Introduction ....................................................................................................................... 1 2 Experimental Plan ............................................................................................................. 3 2.1 Smoke Alarm Sensitivity Test Protocol ..................................................................... 3 2.2 Fire Scenario Designs and Heat Release Rate Measurement .................................... 7 2.3 Full-scale Tests ......................................................................................................... 11
2.3.1 Test Structure ................................................................................................... 11 2.3.2 Measurement Equipment.................................................................................. 13 2.3.3 Nuisance Alarm Test Protocols ........................................................................ 14
2.3.4 Kitchen Fire Test Protocols .............................................................................. 19
3 Results and Analysis ....................................................................................................... 20 3.1 Smoke Alarm Sensitivity Measurements ................................................................ 20 3.2 Fire Scenario Heat Release Rates............................................................................ 21 3.3 Nuisance Alarm Performance ................................................................................. 31
3.4 Kitchen Fire Alarm Performance ............................................................................ 55
4 Conclusions ..................................................................................................................... 79 5 References ....................................................................................................................... 80
vi
List of Figures
Figure 1. Schematic of the NIST fire emulator / detector evaluator. .......................................................... 4
Figure 2. Smoke sensitivity test limits for UL217. Data points are measured values from the FE/DE
smoldering cotton smoke. ............................................................................................................................ 5 Figure 3. CO concentration versus MIC current for steady cotton wick burning periods. Open and
closed symbols represent different sets of wicks. ........................................................................................ 5 Figure 4. MIC current and laser transmittance for an ignition sequence of six sets of wicks. ................... 6
Figure 5. An expanded view of the MIC current and laser beam transmittance for the 4th
and 5th
set of
wicks. The interval averages 1 and 2 represent the steady wick smoke concentration levels. ................... 7 Figure 6. Configuration for ignition scenario 1. ......................................................................................... 8 Figure 7. Configuration for ignition scenario 2. ......................................................................................... 9 Figure 8. Sheet metal barrier on bottom and side of wall cabinet............................................................... 9
Figure 9. Kitchen counter and cabinet mockup. The counter level rests on load cells, and the entire
mockup fits under the furniture calorimeter hood...................................................................................... 10
Figure 10. Exterior view of the burn prop building. ................................................................................. 11
Figure 11. Schematic of the living space mock-up. .................................................................................. 12 Figure 12. Picture of the kitchen counter and cabinet mock-up. .............................................................. 12 Figure 13. Picture showing alarm placements, extinction meter and sampling tubes. ............................. 13
Figure 14. Toasting bread configuration and toasted bread exemplars. ................................................... 14 Figure 15. Toasted bread exemplar. .......................................................................................................... 15 Figure 16. Frying bacon configuration and fried bacon exemplar. ........................................................... 15
Figure 17. Frying hamburger configuration and fried hamburger exemplar. ........................................... 16 Figure 18. Broiling hamburger configuration and broiled hamburger exemplar. ..................................... 16
Figure 19. Grilled cheese sandwich configuration and prepared sandwich exemplar. ............................. 17 Figure 20. Stir fry vegetables before and after cooking. ........................................................................... 18
Figure 21. Baking pizza configuration and cooked pizza. ........................................................................ 18 Figure 22. Configuration of kitchen counter and cabinet with ignition scenario 1 shown. ...................... 19
Figure 23. Heat release rate for Test A1 - Oak/pressboard exposed to ignition scenario 1. ..................... 23 Figure 24. Photo sequence for Test A1 - Oak/pressboard exposed to ignition scenario 1. ...................... 23 Figure 25. Heat release rate for Test B1 – Laminated pressboard exposed to ignition scenario 1. .......... 24
Figure 26. Photo sequence for Test B1 - Laminated pressboard exposed to ignition scenario 1. ............ 24 Figure 27. Heat release rate for Test A1B - Oak/pressboard with metal barrier exposed to ignition
scenario 1. .................................................................................................................................................. 25 Figure 28. Photo sequence for Test A1B - Oak/pressboard with metal barrier exposed to ignition
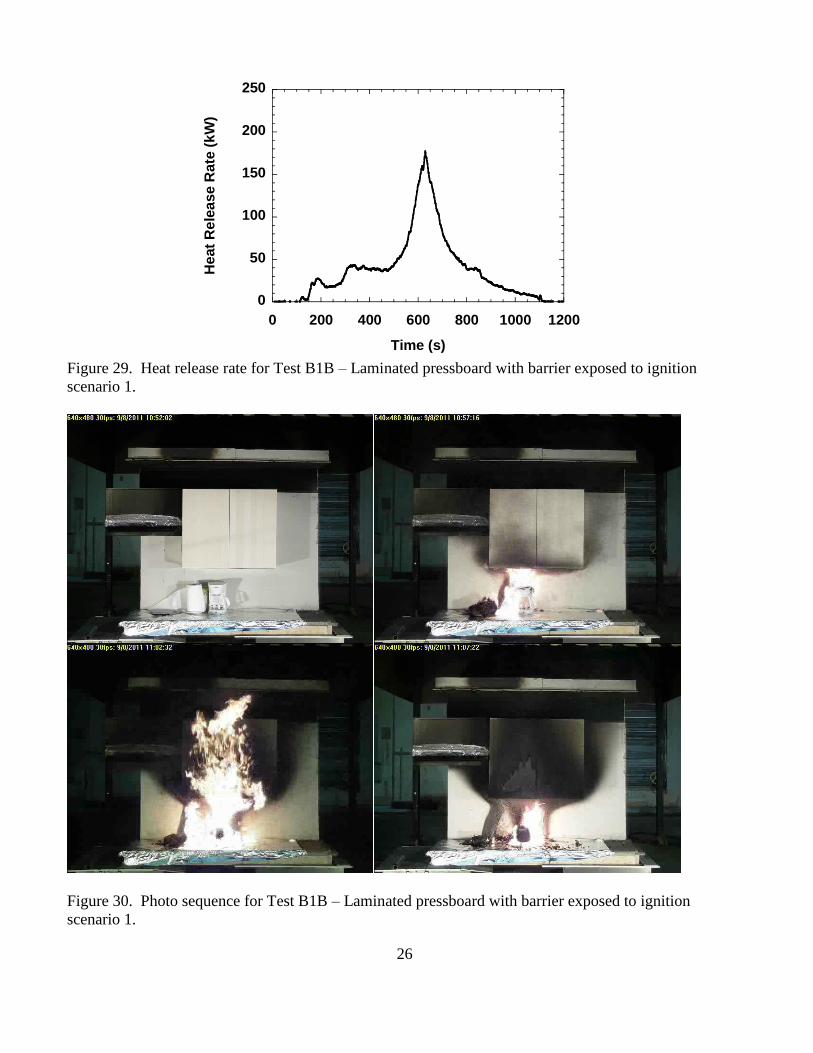
scenario 1 ................................................................................................................................................... 25 Figure 29. Heat release rate for Test B1B – Laminated pressboard with barrier exposed to ignition
scenario 1. .................................................................................................................................................. 26
Figure 30. Photo sequence for Test B1B – Laminated pressboard with barrier exposed to ignition
scenario 1. .................................................................................................................................................. 26
Figure 31. Heat release rate for Test A2 - Oak/pressboard exposed to ignition scenario 2. ..................... 27 Figure 32. Photo sequence for Test A2 - Oak/pressboard exposed to ignition scenario 2. ...................... 27 Figure 33. B2 Heat release rate for Test B2 – Laminated pressboard exposed to ignition scenario 2. .... 28 Figure 34. Photo sequence for Test B2 - Laminated pressboard exposed to ignition scenario 2. ............ 28 Figure 35. Heat release rate for Test CB1 – Cement board exposed to ignition scenario 1. .................... 29 Figure 36. Photo sequence for Test CB1 – Cement board exposed to ignition scenario 1. ...................... 29
vii
Figure 37. Heat release rate for Test CB2 – Cement board exposed to ignition scenario 2. .................... 30 Figure 38. Photo sequence for Test CB2 – Cement board exposed to ignition scenario 2. ...................... 30
Figure 39. Location of alarms. .................................................................................................................. 31 Figure 40. Fraction of smoke alarms that activated during range top cooking events.............................. 52
Figure 41. Fraction of smoke alarms that activated during oven cooking events. .................................... 53 Figure 42. Fraction of smoke alarms that activated during toasting events. ............................................. 54 Figure 43. Alarm activation frequency for equal fractions of range top, oven and toasting activities. .... 54 Figure 44. Photo sequence for experiment A1_1 (Oak/pressboard, scenario 1). ...................................... 56 Figure 45. Post-fire photo of experiment A1_1 (Oak/pressboard, scenario 1). ........................................ 57
Figure 46. OD and FED values for experiment A1_1 (Oak/pressboard, scenario 1). .............................. 57 Figure 47. Photo sequence for experiment A1_2 (Oak/pressboard, scenario 1). ...................................... 58 Figure 48. OD and FED values for experiment A1_2 (Oak/pressboard, scenario 1). .............................. 59 Figure 49. Photo sequence for experiment A2_1 (Oak/pressboard, scenario 2). ...................................... 60 Figure 50. Post-fire photo of experiment A2_1 (Oak/pressboard, scenario 2). ........................................ 61
Figure 51. OD and FED values for experiment A2_1 (Oak/pressboard, scenario 2). .............................. 61
Figure 52. Photo sequence for experiment A2_2 (Oak/pressboard, scenario 2). ...................................... 62
Figure 53. Post-fire photo of experiment A2_2 (Oak/pressboard, scenario 2). ........................................ 63
Figure 54. OD and FED values for experiment A2_2 (Oak/pressboard, scenario 2). .............................. 63 Figure 55. Photo sequence for experiment B1_1 (Laminated pressboard, scenario 1). ............................ 64 Figure 56. Post-fire photo of experiment B1_1 (Laminated pressboard, scenario 1). .............................. 65
Figure 57. OD and FED values for experiment B1_1 (Laminated pressboard, scenario 1). .................... 65 Figure 58. Photo sequence for experiment B1_2 (Laminated pressboard, scenario 1). ............................ 66
Figure 59. Post-fire photo of experiment B1_2 (Laminated pressboard, scenario 1). .............................. 67 Figure 60. OD and FED values for experiment B1_2 (Laminated pressboard, scenario 1). .................... 67 Figure 61. Photo sequence for experiment B2_1 (Laminated pressboard, scenario 2). ............................ 68
Figure 62. OD and FED values for experiment B2_1 (Laminated pressboard, scenario 2). .................... 69 Figure 63. Photo sequence for experiment B2_2 (Laminated pressboard, scenario 2). ............................ 70
Figure 64. Post-fire photo of experiment B2_2 (Laminated pressboard, scenario 2). .............................. 71 Figure 65. OD and FED values for experiment B2_2 (Laminated pressboard, scenario 2). .................... 71
Figure 66. Photo sequence for experiment A3_1 (Oak/pressboard with sheet metal barrier, scenario 1). 72 Figure 67. Post-fire photo of experiment A3_1 (Oak/pressboard with sheet metal barrier, scenario 1). . 73
Figure 68. OD and FED values for experiment A3_1 (Oak/pressboard with sheet metal barrier, scenario
1). ............................................................................................................................................................... 73
Figure 69. Photo sequence for experiment B3_1 (Oak/pressboard with sheet metal barrier, scenario 1). 74 Figure 70. Pre-fire photo of experiment B3_1 (Oak/pressboard with sheet metal barrier, scenario 1). ... 75 Figure 71. OD and FED values for experiment B3_1 (Oak/pressboard with sheet metal barrier, scenario
1). ............................................................................................................................................................... 75 Figure 72. Average alarm time difference between Alarm type and collocated I1 alarm. ....................... 76
Figure 73. ASET computed using first or last alarm activation and time to reach 0.25 m-1
or 0.50 m-1
optical density limit. ................................................................................................................................... 77

viii
List of Tables
Table 1. Alarm technology and identifying notation used in this report. ................................................... 3 Table 2. Tabulated values of average smoke alarm sensitivity. ................................................................ 20 Table 3. Furniture calorimeter results for the scenarios tested. ................................................................ 21 Table 4. Photoelectric alarm activation results – frying bacon. ................................................................ 32
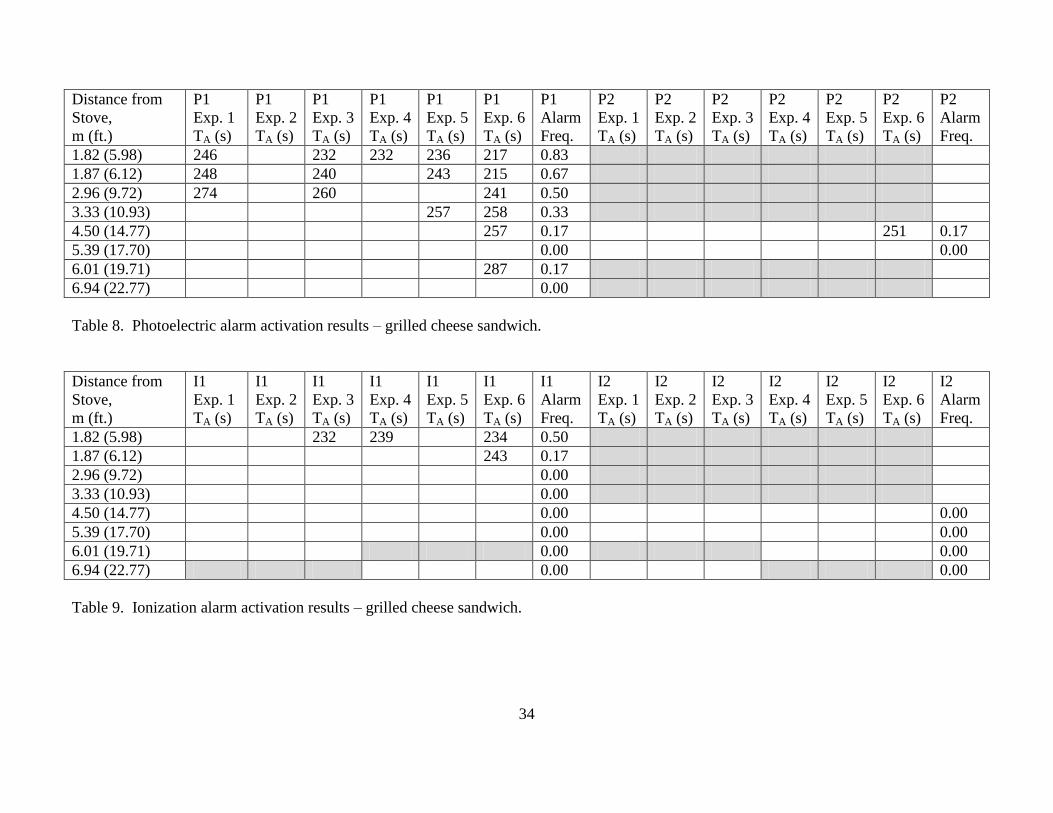
Table 5. Ionization alarm activation results – frying bacon. ..................................................................... 32 Table 6. Dual sensor alarm activation results – frying bacon. .................................................................. 33 Table 7. Intelligent alarm activation results – frying bacon. .................................................................... 33 Table 8. Photoelectric alarm activation results – grilled cheese sandwich. .............................................. 34 Table 9. Ionization alarm activation results – grilled cheese sandwich. ................................................... 34
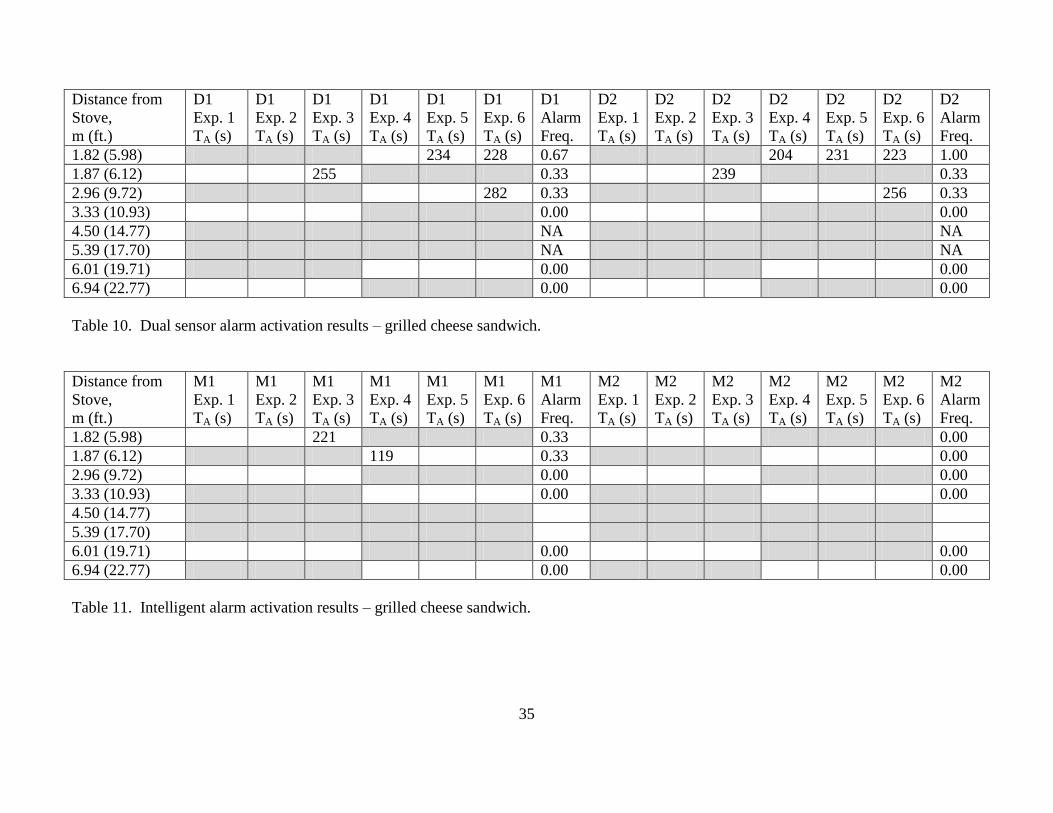
Table 10. Dual sensor alarm activation results – grilled cheese sandwich. .............................................. 35
Table 11. Intelligent alarm activation results – grilled cheese sandwich. ................................................. 35
Table 12. Photoelectric alarm activation results – frying hamburger. ...................................................... 36
Table 13. Ionization alarm activation results – frying hamburger. ........................................................... 36 Table 14. Dual sensor alarm activation results – frying hamburger. ........................................................ 37 Table 15. Intelligent alarm activation results – frying hamburger. ........................................................... 37
Table 16. Photoelectric alarm activation results – stir frying vegetables. ................................................ 38 Table 17. Ionization alarm activation results – stir frying vegetables. ..................................................... 38 Table 18. Dual sensor alarm activation results – stir frying vegetables.................................................... 39
Table 19. Intelligent alarm activation results – stir frying vegetables. ..................................................... 39 Table 20. Photoelectric alarm activation results – broiling hamburger. ................................................... 40
Table 21. Ionization alarm activation results – broiling hamburger. ........................................................ 40 Table 22. Dual sensor alarm activation results – broiling hamburger. ..................................................... 41
Table 23. Intelligent alarm activation results – broiling hamburger. ........................................................ 41 Table 24. Photoelectric alarm activation results – baking pizza. .............................................................. 42
Table 25. Ionization alarm activation results – baking pizza. ................................................................... 42 Table 26. Dual sensor alarm activation results – baking pizza. ................................................................ 43 Table 27. Intelligent alarm activation results – baking pizza. .................................................................. 43
Table 28. Photoelectric alarm activation results – light toast. .................................................................. 44 Table 29. Ionization alarm activation results – light toast. ....................................................................... 44
Table 30. Dual sensor alarm activation results – light toast. .................................................................... 45 Table 31. Intelligent alarm activation results – light toast. ....................................................................... 45 Table 32. Photoelectric alarm activation results – dark toast.................................................................... 46 Table 33. Ionization alarm activation results – dark toast. ....................................................................... 46 Table 34. Dual sensor alarm activation results – dark toast. ..................................................................... 47
Table 35. Intelligent alarm activation results – dark toast. ....................................................................... 47
Table 36. Photoelectric alarm activation results – very dark toast. .......................................................... 48
Table 37. Ionization alarm activation results – very dark toast. ............................................................... 48 Table 38. Dual sensor alarm activation results – very dark toast.............................................................. 49 Table 39. Intelligent alarm activation results – very dark toast. ............................................................... 49 Table 40. Photoelectric alarm activation results – toasting bagel. ............................................................ 50 Table 41. Ionization alarm activation results – toasting bagel. ................................................................. 50 Table 42. Dual sensor alarm activation results – toasting bagel. .............................................................. 51
ix
Table 43. Intelligent alarm activation results – toasting bagel.................................................................. 51 Table 44. Configurations for kitchen fire tests.......................................................................................... 55
Table 45. Alarm times for experiment A1_1 (Oak/pressboard, scenario 1). ............................................ 56 Table 46. Alarm times for Experiment A1_2 (Oak/pressboard, scenario 1). ........................................... 58
Table 47. Alarm times for Experiment A2_1 (Oak/pressboard, scenario 2). ........................................... 60 Table 48. Alarm times for experiment A2_2 (Oak/pressboard, scenario 2). ............................................ 62 Table 49. Alarm times for Experiment B1_1 (Laminated pressboard, scenario 1). ................................. 64 Table 50. Alarm times for Experiment B1_2 (Laminated pressboard, scenario 1). ................................. 66 Table 51. Alarm times for Experiment B2_1 (Laminated pressboard, scenario 2). ................................. 68
Table 52. Alarm times for Experiment B2_2 (Laminated pressboard, scenario 2). ................................. 70 Table 53. Alarm times for Experiment A3_1 (Oak/pressboard with sheet metal barrier, scenario 1). ..... 72 Table 54. Alarm times for Experiment B3_1 (Laminated pressboard with sheet metal barrier, scenario
1). ............................................................................................................................................................... 74 Table 55. Tabulated first and last alarm activation time and time to reach threshold smoke optical
densities. ..................................................................................................................................................... 77
1
1 Introduction
According to the National Fire Protection Association (NFPA), there were 1 451 500 fires reported in the
United States during 2008 [1]. These fires caused 3320 civilian fire deaths, 16 705 civilian fire injuries,
and $15.5 billion in property damage. Homes with working smoke alarms typically had a fire death rate
that is about half the rate for homes with no smoke alarms or with alarms that failed to operate [2]. A
2008 telephone survey found that 96 % of U.S. households reported having at least one smoke alarm [3].
Despite this reported high coverage, between 2003 and 2006 two out of five homes (41 %) in the
reported home fires had no smoke alarms or had smoke alarms that failed to operate properly. Telephone
polling of US households conducted in 2010 for the NFPA reported 52 % of all respondents that had at
least one smoke alarm indicated there was a smoke alarm installed in the kitchen; 43 % of the households
reported a nuisance alarm within the last year; and, of that 43 % about 75 % reported they thought
nuisance alarms were caused by cooking activities [3]. Various studies have previously examined the
likelihood of smoke alarms to remain operational after installation and have identified the type of smoke
alarm (photoelectric or ionization) and the location of smoke alarms to cooking sources [4-6].
Cooking appliances are the leading ignition sources in home fires and cause an average of 150 000 home
structure fires a year, leading to 500 deaths and 4660 injures (2003 to 2006 yearly average) [7]. Fires
caused by un-attended cooking or un-supervised children cooking can grow rapidly; thus, early detection
from working smoke alarms is critical. Further complicating matters, since smoke alarms are prone to
nuisance alarms from cooking particulates they are subject to intentional power disconnection or removal
by consumers. These statistics raise questions for both consumers and smoke alarm experts: What type
of smoke alarm should be installed and how far away from cooking appliances (the origin of the nuisance
aerosols) should an alarm be installed to reduce the frequency of nuisance alarms while still providing a
high detection capability for kitchen fires? To answer these questions, specific information is needed,
such as: How fast do kitchen fires grow? How quickly do hazards develop? What are the
characteristics (primarily particle size distribution and concentration) of nuisance source aerosols for
typical cooking activities? What are the performance characteristics of smoke alarm technologies to
kitchen fires and nuisance aerosol exposures from cooking activities in terms of adequate detection of
fire and acceptably low nuisance alarm activations? Are there any new detection technologies that will
improve the situation, and how will new technologies be evaluated?
There is little information on smoke alarm activation as it relates to fire growth and hazard development
of kitchen fires. A previous NIST smoke alarm study conducted kitchen fire experiments where a pot of
cooking oil was heated on a gas range until it ignited [8]. In the four tests conducted the cooking oil
ignited after between (20 and 30) min of heating. Both photoelectric and ionization smoke alarms
activated at least 10 min prior to ignition of the cooking oil. It was also found that heated oil tended to
fill the house with oil particle aerosols well before igniting. In another study Mealy et al. conducted two
kitchen cabinet fire tests as part of a National Institute of Justice grant [9]. They observed a minimum
available safe egress time of greater than 135 s for each alarm evaluated.
NIST conducted nuisance alarm tests as part of the Home Smoke Alarm study [8]. It was observed that
nuisance alarms in residential settings from typical cooking activities, smoking, or candle flames are
affected by the properties of the aerosol produced and its concentration, the location of an alarm relative
to the source, and the air flow that transports smoke to an alarm. The study provides a detailed set of data
that addresses several issues involving nuisance alarms and that reinforces current suggested alarm
placement practices. The study confirms the practice that alarms not be installed close to cooking

2
appliances if at all possible. The results suggested that nuisance alarms could be substantially reduced by
moving the location of an alarm that frequently experiences nuisance alarms well away from cooking
appliances while at the same time keeping the alarm within the area to be protected. It was also observed
that ionization alarms had a propensity to alarm when exposed to nuisance aerosols produced in the early
stages of some cooking activities, prior to noticeable smoke production. This phenomenon could be
particularly vexing to homeowners who experience such nuisance alarms.
The Consumer Product Safety Commission, CPSC, conducted an experimental study of the frequency
and causes of residential cooking nuisance alarms by monitoring several smoke alarms near kitchens in 9
households for 30 days [10]. Photoelectric, ionization, and dual sensor photoelectric/ionization alarms
with disabled sounders were monitored and alarm times were recorded. Additionally occupants were
instructed to keep a record of cooking activities and any time the existing household alarms activated.
The results showed a considerable reduction in nuisance alarms as the distance from the cooking
appliance increased from 1.5 m to 6.0 m. Dual-sensor alarms tend to alarm more frequently than
photoelectric or ionization alarms. Additionally, certain types of cooking activities like sautéing, pan
frying, and stir frying tended to cause more nuisance alarms than other types of cooking.
The National Fire Alarm and Signaling Code, NFPA 72, addresses the issue of nuisance alarms in
household smoke alarms by specifying alarm location rules within 6 m (20 ft.) of horizontal distance as
measured from a ceiling location above a fixed cooking appliance to the smoke alarm [11]. Simply
stated, according to NFPA 72, no smoke alarms should be located within 3 m (10 ft.) of a ceiling location
above a fixed cooking appliance, and between 3 m and 6 m, smoke alarms must use photoelectric
detection, or have a means of temporarily silencing the alarm. An exception is specified for placement of
photoelectric smoke alarms within 1.8 m (6 ft.) where the 3 m exclusion would prohibit placement of a
smoke alarm required by other sections of the code. These rules were made based upon a limited
amount of research with the overarching premise that some decrease in nuisance alarms and subsequent
decrease in alarm disabling would ultimately improve safety. The efficacy of these location rules on the
balance between reduction of nuisance alarms and adequate detection of kitchen fires needs to be further
studied. Quantitative evaluation of smoke alarm performance in relation to cooking nuisance source
rejection, would verify expected improvement when the location rules are followed. In addition,
advances in smoke alarm technology have led to new products that have been designed to mitigate
detection and nuisance alarm problems. These products have no measured performance history
regarding nuisance alarm rejection. The performance of any new product designed to perform within the
6 m (20 ft.) needs to be studied.
The research presented in this report focuses on alarm performance after exposure to various cooking
nuisance sources and cooking fire scenarios. Existing alarm technologies and newer advanced smoke
alarms were included in the research. To provide some insight into how fast certain kitchen fires grow,
and how quickly hazards develop, the hazard development of kitchen fires that start slowly and grow to
involve an overhead cabinet was studied.

3
2 Experimental Plan
The experimental plan consisted of measuring the sensitivity of various residential smoke alarms inside
the NIST fire emulator/detector evaluator (FE/DE). Each smoke alarm was subjected to nuisance source
exposures from cooking activities and their propensity to nuisance alarm was documented. Each smoke
alarm was also subjected to kitchen fire scenarios to assess their performance in kitchen fires. Nuisance
source exposures and kitchen fire tests were conducted in a small apartment mock-up. While this mock-
up living space simulates only a fraction of households, it provided significant data regarding nuisance
alarms and hazard development during fires due to its relatively small square footage. Additionally, tests
were performed in the furniture calorimeter in NIST’s National Fire Research Laboratory to measure the
heat release rate of two ignition scenarios and various cabinet constructions. These tests were conducted
to characterize the burning behavior of the kitchen fire scenarios in over-ventilated conditions. While the
limited space of the small apartment mock-up will affect the burning behavior after some period of time
due to limited oxygen, these experiments bound expected heat release rate.
The smoke alarms that were tested were selected from current retail stock. A variety of smoke detectors
were used this experiment including those employing photoelectric or ionization single-sensor
technology, and photoelectric and ionization dual-sensor technology, and multi-sensor, intelligent alarm
technology1. Table 1 lists the technology for each alarm and the identifying notation used throughout the
rest of the report. Two separate models of each alarm technology were included in this study, and are
distinguished by the numeral 1 or 2 in the notation.
Technology Notation
Photoelectric P1
Photoelectric P2
Ionization I1
Ionization I2
Dual sensor photoelectric/ionization D1
Dual sensor photoelectric/ionization D2
Multi-sensor, intelligent alarm M1
Multi-sensor, intelligent alarm M2
Table 1. Alarm technology and identifying notation used in this report.
2.1 Smoke Alarm Sensitivity Test Protocol
The NIST fire emulator/detector evaluator, FE/DE, was used to expose smoke alarms to smoldering
cotton wick smoke at various concentration levels. A schematic of the FE/DE is shown in Figure 1. The
cotton wick is the same material used in UL 217 for smoke alarm sensitivity test [12]. The FE/DE
cotton wick igniter was used to provide stepwise concentrations of smoke. At the test section a laser
light extinction beam (635 nm wavelength) located 5 cm below the duct ceiling, traveling the width of
the duct, and reflected off mirrors to increase the path length through the duct smoke, was used to
measure the light extinction of the smoke. A reference measuring ionization chamber (MIC) was
installed on the ceiling of the test section. The MIC responds to smoke in a manner similar to ionization
1 Intelligent alarm technology is distinguished by the use of an algorithm to process sensor signals to determine the alarm
condition. The intelligent alarms currently available pair ionization sensors with carbon monoxide gas or humidity sensors.

4
chambers inside smoke alarms. The MIC output current is reduced when smoke is present, and the
reduction is related to the smoke concentration. The output current is nominally 100 pA in clean air.
Figure 1. Schematic of the NIST fire emulator / detector evaluator (units in cm).
Since the FE/DE is a single-pass flow device, the smoldering smoke does not get a chance to age for a
long time before it reaches the test section. In contrast, the UL217 smoke box has a re-circulating flow
path, thus the smoke is aged to some degree. Aging affects the average smoke particle size which in turn
affects alarm response. The two dashed curves presented in Figure 2 show the smoke sensitivity test
limits specified by the UL 217 Standard in terms of a comparison of the light transmittance through a 1.5
m path length of smoke to the MIC output current. The area between the curves represents expected
smoke characteristics. That is, during a sensitivity test, all measured values of light transmittance and
MIC current must fall within the bounds of the two curves to have a valid test. Typical measures for the
FE/DE cotton wick smoke are shown in Figure 2 as averaged steady smoke values with error bars
representing ± one standard deviation for both transmittance and MIC current averages. The averaged
values fall within the valid region until the MIC value reaches about 50 pA.
The smoldering cotton produces carbon monoxide (CO) in addition to smoke particles. Figure 3 shows
the CO concentration as a function of the MIC current for different steady wick burning periods as
measured at the FE/DE test section. A non-dispersive infrared carbon monoxide gas analyzer was used
to measure the CO concentration from gas samples extracted from the FE/DE test section through a
sampling line. The analyzer has a resolution of 1x10⁻⁶
volume fraction (ppm volume), and an uncertainty
on that order. The plotted error bars represent ± one standard deviation of the fluctuating measurements.
For intelligent multi-sensor smoke alarms that use CO sensing, the CO concentration in the smoke
sensitivity test may impact alarm conditions and thereby the smoke concentration at alarm.

5
0.8
0.85
0.9
0.95
135455565758595
Tra
nm
itta
nc
e (
1.5
m p
ath
len
gth
)
Measuring Ionization Current (pA)
Figure 2. Smoke sensitivity test limits for UL217. Data points are measured values from the FE/DE
smoldering cotton smoke (uncertainty bars are 1 standard deviation).
0
10
20
30
40
50
60
70
80
405060708090100
Carb
on
Mo
no
xid
e C
on
cen
trati
on
(Vo
l. F
rac. X
10
6 , p
pm
Vo
l.)
MIC Current (pA)
Figure 3. CO concentration versus MIC current for steady cotton wick burning periods. Open and
closed symbols represent different sets of wicks (uncertainty bars are 1 standard deviation).
Identical make and model smoke alarms were placed side-by side on the ceiling of the test section, just
behind the extinction beams, and 15 cm in front of the MIC. The sensing chambers of the installed

6
smoke alarms were orientated between the best and worst case orientation for smoke entry. All smoke
alarms were powered by battery, and the smoke alarm battery voltage was used to determine if an alarm
was activated. The alarm state was determined by the smoke alarm battery voltage drop and compared to
the smoke extinction and measuring ionization chamber results.
The mid-point between the non-alarm and alarm smoke extinction or measuring ionization chamber
values is used as the estimate of the alarm sensitivity. For example, Figure 4 shows a typical graph of
MIC current and the laser beam transmittance versus time for an ignition sequence of 6 sets of wicks.
During ignition of a set of wicks, the smoke production is elevated and the MIC current and
transmittance drop sharply. The wicks in the ignited set then approach a steady burning rate and both the
transmittance and the MIC current reach a plateau. Consecutive sets of wicks are ignited and add to the
smoke concentration as the previously ignited wicks continue to burn.
40
50
60
70
80
90
100
0.8
0.85
0.9
0.95
1
0 200 400 600 800 1000 1200 1400
MIC
Laser
Meas
uri
ng
Io
niz
ati
on
Ch
am
ber
MIC
(p
A)
Las
er
Beam
Tra
nm
itta
nce
Time(s)
Figure 4. MIC current and laser transmittance for an ignition sequence of six sets of wicks.
Figure 5 shows an expanded view of the time period illustrated in Figure 4. Assuming an alarm was not
active prior to the ignition of the 5th
set of wicks and was active prior to the ignition of the 6th
set of
wicks, a midpoint value of the MIC current or transmittance between the 4th
and 5th
set of wicks just prior
to ignition of the next set of wicks is used to estimate the alarm sensitivity. Interval 1 (30 s prior to
ignition of the 5th
set of wicks) has an average MIC current of 64.4 pA with a standard deviation of 1.2
pA, and an average transmittance of 0.948 with a standard deviation of 0.001. Interval 2 (30 s prior to
ignition of the 6th
set of wicks) has an average MIC current of 57.6 pA with a standard deviation of 1.5
pA, and an average transmittance of 0.930 with a standard deviation of 0.003. Thus, the average MIC
current is 61.0 pA, and the average transmittance is 0.939. Repeated sensitivity test results are averaged.

7
40
50
60
70
80
90
0.8
0.85
0.9
0.95
1
650 700 750 800 850 900 950 1000
MIC
Laser
Meas
uri
ng
Io
niz
ati
on
Ch
am
ber
MIC
(p
A)
Las
er
Beam
Tra
nm
itta
nce
Time(s)
Interval Average 1 Interval Average 2
4th
set 5th
set 6th
set
Figure 5. An expanded view of the MIC current and laser beam transmittance for the 4
th and 5
th set of
wicks. The interval averages 1 and 2 represent the steady wick smoke concentration levels.
2.2 Fire Scenario Designs and Heat Release Rate Measurement
Range top initiated fires are the most prevalent residential kitchen fires according to the US national fire
loss statistics [7]. Un-attended range top cooking fires can initiate and grow unnoticed prior to a smoke
alarm alert or discovery by an occupant. Food items are the most-likely materials first ignited in a range
top fire, followed by fire spread to adjacent items such cabinets or combustible items on counters.
Extended heating of solid food to the point where it chars and ignites, or heating cooking oil until it
reaches its fire point, are fire initiation events. These types of fire initiations, however, may not represent
significant challenges to smoke alarms because they tend to have an extended production of smoke prior
to ignition. That smoke tends to activate local smoke alarms well before hazardous conditions develop.
A more challenging fire scenario is direct ignition of combustibles from a stove-top heating element,
since smoke production and the fire essentially begin at the same time. The fire scenario used in this
experiment started by the ignition of a roll of paper towels on the counter adjacent to the range heating
element, followed by subsequent ignition of various items on the counter top (such as plastic plates,
boxed cereal, plastic coffee brewer, etc.) and fire spread to an overhead wall cabinet.
Two cabinets and two ignition scenarios were investigated. The two cabinets were identical in size, 61
cm wide by 76 cm high, by 30 cm deep (30 in. x 24 in. x 12 in.) but with different materials of
construction. The first cabinet was unfinished and had a solid oak frame with oak door panels and
pressboard top, bottom, interior shelf and side panels. The second cabinet was constructed from
pressboard with a thin plastic veneer finish. It contained one interior shelf. During all tests, the cabinets
were empty except for the shelf board.
8
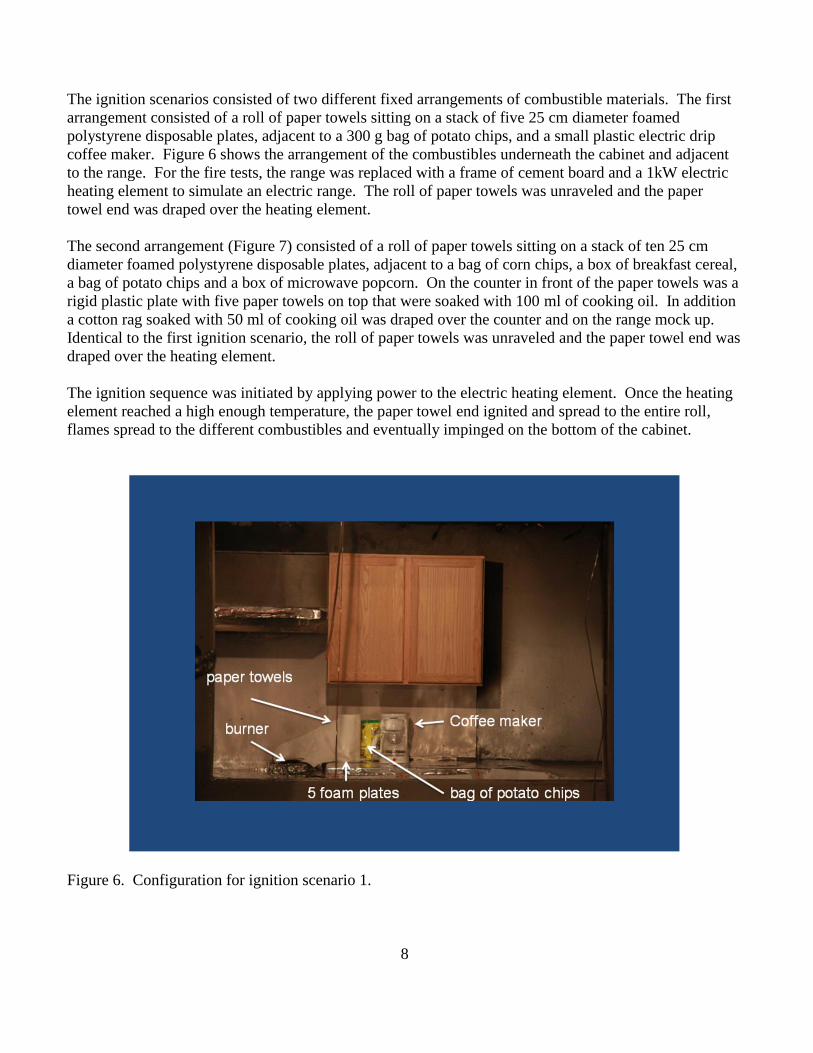
The ignition scenarios consisted of two different fixed arrangements of combustible materials. The first
arrangement consisted of a roll of paper towels sitting on a stack of five 25 cm diameter foamed
polystyrene disposable plates, adjacent to a 300 g bag of potato chips, and a small plastic electric drip
coffee maker. Figure 6 shows the arrangement of the combustibles underneath the cabinet and adjacent
to the range. For the fire tests, the range was replaced with a frame of cement board and a 1kW electric
heating element to simulate an electric range. The roll of paper towels was unraveled and the paper
towel end was draped over the heating element.
The second arrangement (Figure 7) consisted of a roll of paper towels sitting on a stack of ten 25 cm
diameter foamed polystyrene disposable plates, adjacent to a bag of corn chips, a box of breakfast cereal,
a bag of potato chips and a box of microwave popcorn. On the counter in front of the paper towels was a
rigid plastic plate with five paper towels on top that were soaked with 100 ml of cooking oil. In addition
a cotton rag soaked with 50 ml of cooking oil was draped over the counter and on the range mock up.
Identical to the first ignition scenario, the roll of paper towels was unraveled and the paper towel end was
draped over the heating element.
The ignition sequence was initiated by applying power to the electric heating element. Once the heating
element reached a high enough temperature, the paper towel end ignited and spread to the entire roll,
flames spread to the different combustibles and eventually impinged on the bottom of the cabinet.
Figure 6. Configuration for ignition scenario 1.

9
Figure 7. Configuration for ignition scenario 2.
Additional tests were conducted with a sheet metal barrier placed on the bottom and partially up the side
of the cabinet facing the range. The intent of the barrier was to protect the cabinet from impinging
flames in order to slow down or eliminate the ignition of the cabinet. Figure 8 shows how the sheet
metal was installed on the cabinet. This protective layer was intended to simulate an aesthetically
pleasing barrier built into the cabinet. The kitchen fire tests used aluminum sheet metal, while the
furniture calorimeter tests used a galvanized steel sheet metal barrier.
Figure 8. Sheet metal barrier on bottom and side of wall cabinet.

10
A portable mockup of the kitchen section was set up under 3x3 m furniture calorimeter hood in the NIST
National Fire Research Laboratory. The furniture calorimeter has a 1MW capacity and was calibrated
with a natural gas calibration burner prior to each series of tests (4 tests per day) The standard 5 point
natural gas calibration is performed at 75/150/200/350/500 kW fuel flow presets to determine calibration
factors. The combined standard uncertainty of heat release rate for an unspecified fuel was estimated as
± 8 %, and the combined standard uncertainty of the total heat release was estimated as ± 5 % due to the
uncertainty in the heat of combustion of mixed fuel items [13]. Fire resistant cement board panels were
used to create the counter top, the supporting back wall, a simulated range cabinet over the range hood,
and the ceiling section. Gypsum board was attached to the supporting back wall, and the cabinet was
attached to the gypsum board. Figure 9 shows the arrangement. The gypsum board sections were
replaced after each test. Tests were also conducted with a cement board mock-up of the cabinet to assess
the heat release rate without the cabinet.
Figure 9. Kitchen counter and cabinet mockup. The counter level rests on load cells, and the entire
mockup fits under the furniture calorimeter hood.

11
2.3 Full-scale Tests
2.3.1 Test Structure
Full-scale tests were conducted at the Montgomery County Fire and Rescue Service Public Training
Academy. A section of the burn prop building (Figure 10) was used to conduct the experiments.
Figure 10. Exterior view of the burn prop building.
A kitchen, living room, and hallway mock-up was arranged in a section of the first floor of the burn prop
building. Figure 11 is a schematic of the mock-up. In this configuration, the hallway is leads to
additional rooms. The opening on the wall was an access doorway into the structure. There was another
door opening from the kitchen to the outside of the burn prop building that was used to ventilate the
mock-up to the outside after each test. The kitchen has two access openings and a wide window-style
opening looking out into the living room. All three openings had the same soffit depth from the ceiling
(30 cm). The schematic shows the location of thermocouple trees (TC Tree), gas sampling (Gas
Analyzer), and Laser Extinction meters (Laser). Figure 12 is a picture of the kitchen layout looking
through the kitchen/living room opening.

12
Figure 11. Schematic of the living space mock-up.
Figure 12. Picture of the kitchen counter and cabinet mock-up.
13
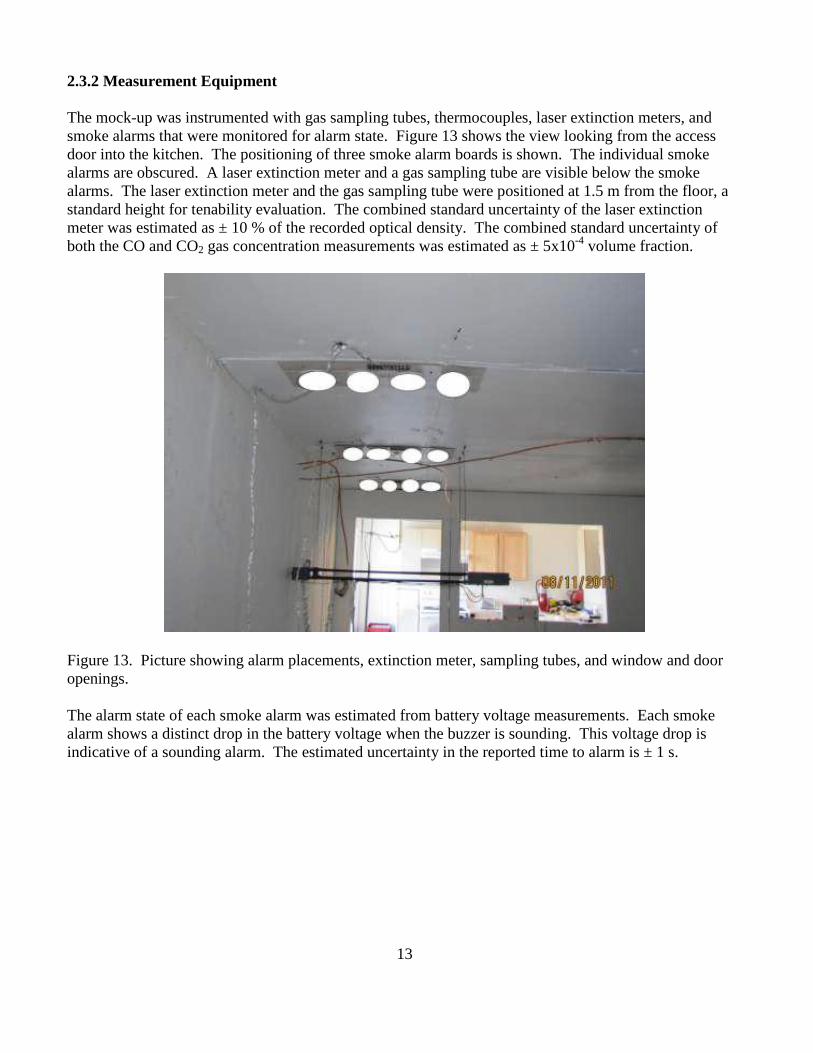
2.3.2 Measurement Equipment
The mock-up was instrumented with gas sampling tubes, thermocouples, laser extinction meters, and
smoke alarms that were monitored for alarm state. Figure 13 shows the view looking from the access
door into the kitchen. The positioning of three smoke alarm boards is shown. The individual smoke
alarms are obscured. A laser extinction meter and a gas sampling tube are visible below the smoke
alarms. The laser extinction meter and the gas sampling tube were positioned at 1.5 m from the floor, a
standard height for tenability evaluation. The combined standard uncertainty of the laser extinction
meter was estimated as ± 10 % of the recorded optical density. The combined standard uncertainty of
both the CO and CO2 gas concentration measurements was estimated as ± 5x10⁻⁴
volume fraction.
Figure 13. Picture showing alarm placements, extinction meter, sampling tubes, and window and door
openings.
The alarm state of each smoke alarm was estimated from battery voltage measurements. Each smoke
alarm shows a distinct drop in the battery voltage when the buzzer is sounding. This voltage drop is
indicative of a sounding alarm. The estimated uncertainty in the reported time to alarm is ± 1 s.

14
2.3.3 Nuisance Alarm Test Protocols
Cooking activities such as toasting, frying, baking and broiling were selected to represent a range of
potential cooking sources that could trigger nuisance alarms. The CPSC study [10] guided the selection
of the sources. These sources were also used in additional cooking source experiments at NIST [14].
Toasting bread
The toasting bread experiment consisted of two slices of white bread placed into a two-slice toaster. The
automatic pop-up function of the toaster was disabled. Two slices of white sandwich bread were placed
in the toaster and 120 s after the start of the data acquisition computer, power was applied to the toaster.
The bread was toasted for a fixed period of time, and then the toaster was powered off. Three separate
toasting times were specified 105 s, 185 s and 220 s representing light, dark, and very dark toast (burnt),
respectively. No one was in the test room during these experiments. Figure 14 shows the location of the
toaster on the counter and the representative toasted bread samples for the three toasting times.
Figure 14. Toasting bread configuration and toasted bread exemplars.
Toasting bagel
15
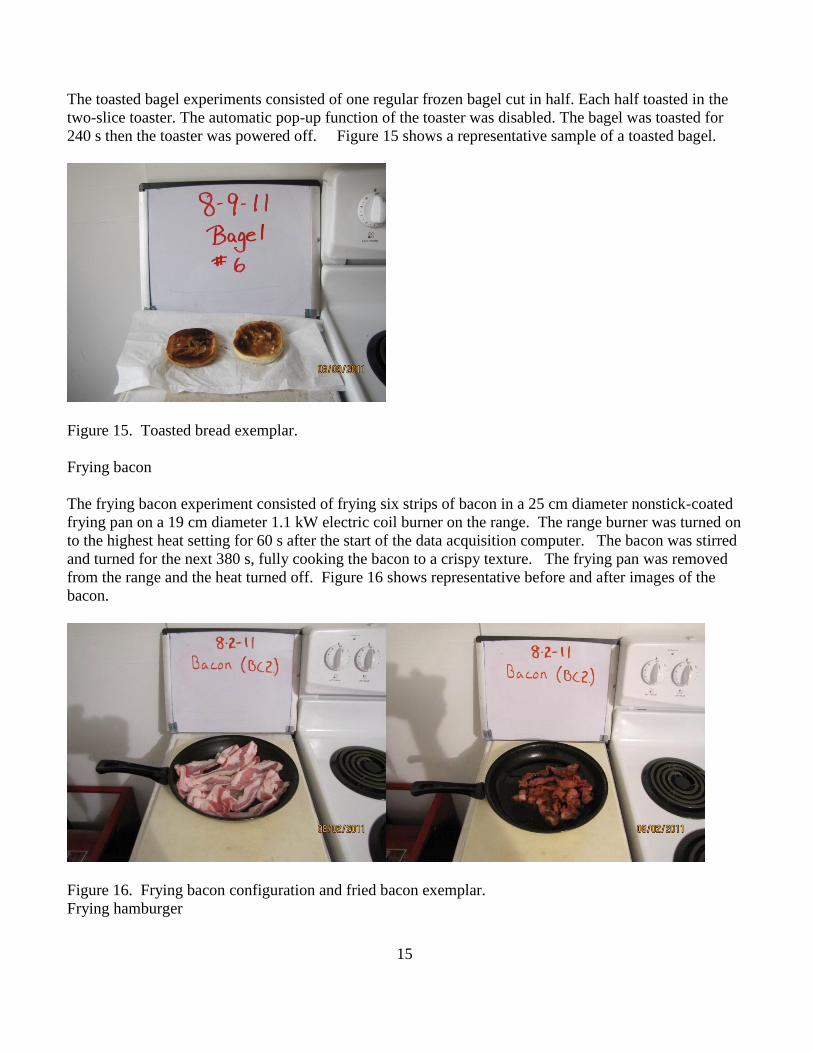
The toasted bagel experiments consisted of one regular frozen bagel cut in half. Each half toasted in the
two-slice toaster. The automatic pop-up function of the toaster was disabled. The bagel was toasted for
240 s then the toaster was powered off. Figure 15 shows a representative sample of a toasted bagel.
Figure 15. Toasted bread exemplar.
Frying bacon
The frying bacon experiment consisted of frying six strips of bacon in a 25 cm diameter nonstick-coated
frying pan on a 19 cm diameter 1.1 kW electric coil burner on the range. The range burner was turned on
to the highest heat setting for 60 s after the start of the data acquisition computer. The bacon was stirred
and turned for the next 380 s, fully cooking the bacon to a crispy texture. The frying pan was removed
from the range and the heat turned off. Figure 16 shows representative before and after images of the
bacon.
Figure 16. Frying bacon configuration and fried bacon exemplar.
Frying hamburger

16
The fried hamburger experiment consisted of one frozen beef hamburger patty placed in a 25 cm fry pan
and heated on a 19 cm diameter 1.1 kW electric coil burner on the range. The coil burner on the range
was set to the high heat setting (10) and the frying pan with the hamburger was placed on the burner.
After 180 s the heat was reduced to a medium setting (6) setting, 150 s later, it was flipped. The
hamburger was allowed to cook for an additional 180 s, at which time the heat was shut off and the
frying pan removed from the range. Figure 17 shows before and after images of the hamburger.
Figure 17. Frying hamburger configuration and fried hamburger exemplar.
Broiling hamburger
The broiling hamburger experiment consisted of broiling a frozen beef hamburger patty using a broiler
pan placed on the top oven rack of an electric range. The broiler pan with the hamburger was placed in
the oven with the oven door was left cracked approximately 11.5 cm and the oven was set to broil. After
600 s the oven door was opened and the hamburger was flipped. The door was then returned to its
cracked open position and the hamburger was left to broil another 240 s. The hamburger and broiler pan
were removed and the broiler turned off. Figure 18 shows before and after images of the patty.
Figure 18. Broiling hamburger configuration and broiled hamburger exemplar.

17
Grilled Cheese Sandwich
The grilled cheese sandwich experiment consisted of two slices of white sandwich bread, buttered
on the outside, with two slices of American cheese inside, placed in a 25 cm diameter frying pan and
heated on a 19 cm 1.1 kW electric coil burner on the range. The coil burner on the stove was set to the
high heat setting (10) and the frying pan with the sandwich in it was placed on the burner. After 180 s the
heat was reduced to a medium high setting (7), and the sandwich was flipped over. The sandwich was
allowed to cook for another 100 s at which time the heat was shut off and the frying pan removed from
the range. Figure 19 shows the set up and the prepared sandwich.
Figure 19. Grilled cheese sandwich configuration and prepared sandwich exemplar.
Vegetable Stir Frying
The vegetable stir frying experiment consisted of chopping-up one carrot, one onion and one celery
stalk and frying them in a 27.5 cm diameter steel wok pan with 10 ml of vegetable oil. After 60 s of data
collection, 15 ml of vegetable oil was poured into the wok pan on the front 19 cm coil burner which was
then set to high heat setting (10). After heating the vegetable oil 140 s the carrots, onions and celery
were stirred together in the wok pan. The vegetables were continuously stirred for 165 s at which time
the heat was turned down to a medium setting (6). Stir frying continued for 140 s longer then the wok
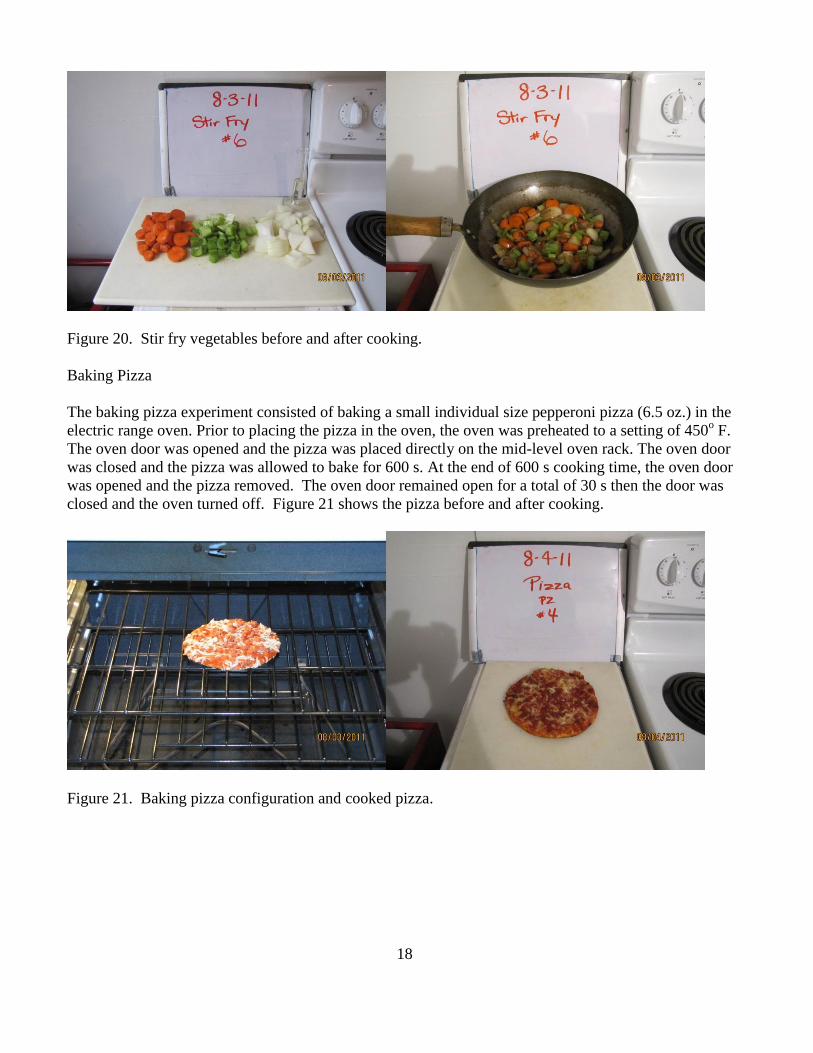
pan was removed from the range. Figure 20 shows the chopped vegetables before and after cooking.
18
Figure 20. Stir fry vegetables before and after cooking.
Baking Pizza
The baking pizza experiment consisted of baking a small individual size pepperoni pizza (6.5 oz.) in the
electric range oven. Prior to placing the pizza in the oven, the oven was preheated to a setting of 450o F.
The oven door was opened and the pizza was placed directly on the mid-level oven rack. The oven door
was closed and the pizza was allowed to bake for 600 s. At the end of 600 s cooking time, the oven door
was opened and the pizza removed. The oven door remained open for a total of 30 s then the door was
closed and the oven turned off. Figure 21 shows the pizza before and after cooking.
Figure 21. Baking pizza configuration and cooked pizza.
19
2.3.4 Kitchen Fire Experimental Protocols
The kitchen fire experiments used the same fire scenarios tested in the furniture calorimeter, namely the
ignition of counter space items from an electric range heating element. The two cabinet designs and two
ignition scenarios were tested twice. Data collected during the kitchen fire tests included the alarm state
of smoke alarms at various locations, the smoke light extinction at three locations at a height of 1.5 m
from the floor, and the temperature measurements from thermocouple trees at three locations, and
combustion gas sampling at two locations at a height of 1.5 m from the floor. Additionally, carbon
dioxide and carbon monoxide were measured in the kitchen at the ceiling location to capture early
combustion gases from the fires.
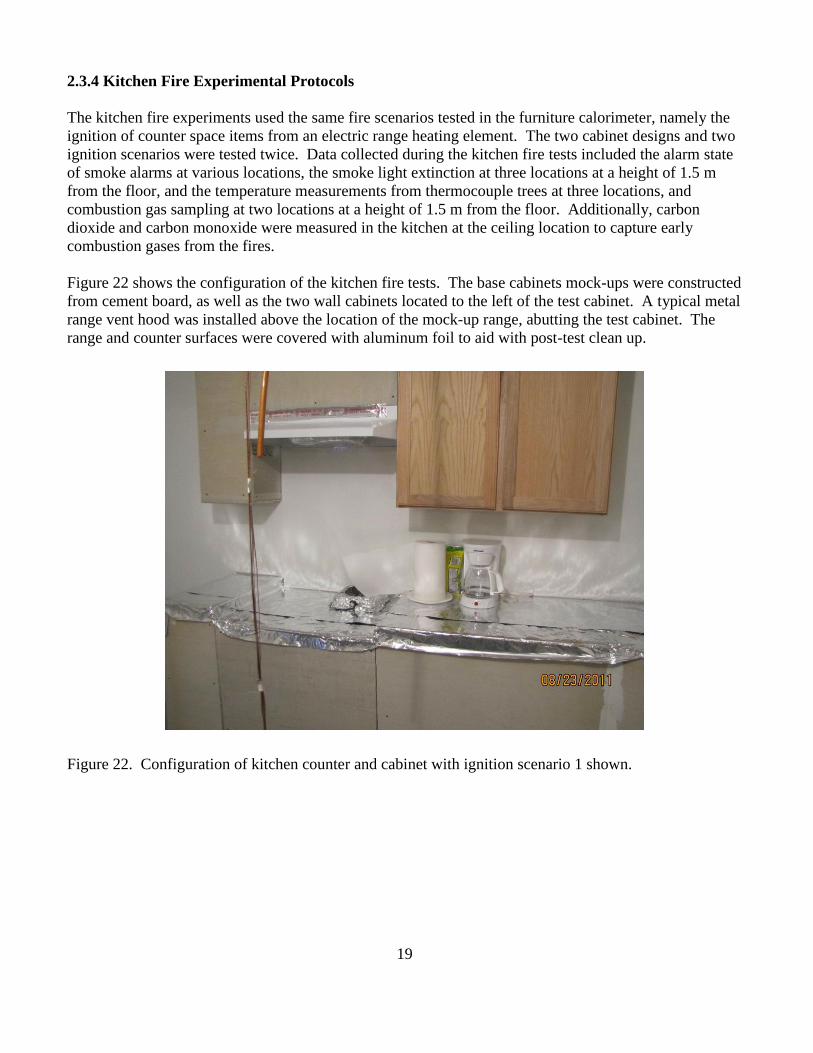
Figure 22 shows the configuration of the kitchen fire tests. The base cabinets mock-ups were constructed
from cement board, as well as the two wall cabinets located to the left of the test cabinet. A typical metal
range vent hood was installed above the location of the mock-up range, abutting the test cabinet. The
range and counter surfaces were covered with aluminum foil to aid with post-test clean up.
Figure 22. Configuration of kitchen counter and cabinet with ignition scenario 1 shown.

20
3 Results and Analysis
3.1 Smoke Alarm Sensitivity Measurements
The smoke alarm sensitivity measurements provide a reference sensitivity range of different smoke alarm
types relative to the cotton smolder smoke experiment. Smoke alarm of the same make and model were
placed side-by-side on the ceiling of the FE/DE test section. The positions were labeled front and back.
The alarm locations were swapped after three tests, and the average results from each location were
computed. While the measuring ionization chamber samples from the centerline of the FE/DE duct, the
extinction measurement across the duct is determined by the average of the smoke across the duct at a
particular height. A persistent concentration gradient in the duct would tend to bias the results based on
location of the smoke alarm.
The results for each smoke alarm type are given in Table 2. Results are provided in terms of MIC current
and smoke obscuration (%/ft. per UL reporting and labeling convention).
Alarm Position MIC
(pA)
Std Dev
(pA)
Avg MIC
(pA)
Std Dev
(pA)
Obsc.
(%/ft.)
Std Dev
(%/ft.)
Avg Obsc.
(%/ft.)
Std Dev
(%/ft.)
I1 front 87.2 1.8 87.6 1.8 0.24 0.02 0.22 0.03
back 87.9 1.9 0.21 0.03
I2 front 82.4 1.2 81.9 1.4 0.32 .06 0.33 0.06
back 81.5 1.5 0.34 0.06
P1 front 52.3 5.6 50.7 4.2 1.42 0.29 1.50 0.23
back 49.2 1.2 1.58 0.12
P2 front 54.3 4.3 54.8 3.8 1.33 0.17 1.29 0.14
back 55.2 3.6 1.26 0.12
D1 front 73.6 4.3 72.6 3.9 0.54 0.10 0.57 0.13
back 71.7 3.7 0.60 0.15
D2 front 80.5 2.1 82.7 2.9 0.35 0.06 0.30 0.08
back 85.0 1.3 0.24 0.05
M1 front 65.4 2.2 65.4 1.7 0.78 0.11 0.78 0.09
back 65.3 1.3 0.78 0.08
M2 front 82.2 3.6 82.5 2.5 0.30 0.07 0.29 0.05
back 82.9 1.0 0.28 0.03
Table 2. Tabulated values of average smoke alarm sensitivity.
It was observed that the difference between the front and back position average MIC current ranged from
0.1 pA to 4.5 pA. In most cases the average front and back MIC current for like alarms fell within the
other position’s standard deviation. An exception is D2 where the difference between the means was
greater than one standard deviation. The average MIC current and obscuration sensitivity including all
front and back alarm position results was computed and are listed in the table. The alarm with the
highest sensitivity to the cotton smolder smoke is I1, and the alarm with the lowest sensitivity is P1. The
relative sensitivities to other smoke sources would vary depending on the smoke characteristics.
21
3.2 Fire Scenario Heat Release Rates
Each fire scenario and cabinet construction was tested in the NIST furniture calorimeter to determine the
heat release rate (HRR) as the fire progressed until it was extinguished, or ceased flaming. In addition to
the cabinet constructions and sheet metal barriers, non-combustible cement board cabinet mock-ups were
tested to determine the heat release rate of the countertop objects by themselves. Each test was
conducted once.
The furniture calorimeter is capable of measuring the heat release rate of furniture-sized objects burning
under its exhaust hood. The details the heat release rate calorimetry can be found in reference [13]. The
combustion environment in the furniture calorimeter differs from those found in room enclosures. In the
free burning conditions of the furniture calorimeter, there is plenty of fresh air entrained into the fire
plume. In a room environment, as a fire progresses, the oxygen concentration decreases creating a
vitiated environment, typically reducing the burning rate. Combustion in the vitiated room environment
leads to increased carbon monoxide concentrations. On the other hand, a hot gas layer that develops in a
room environment will radiate heat and tend to increase the burning rate of objects. The furniture
calorimeter removes the combustion gases via the exhaust flow, eliminating hot gas layer. Thus, the
early fire development in the furniture calorimeter and in a room configuration will tend to match more
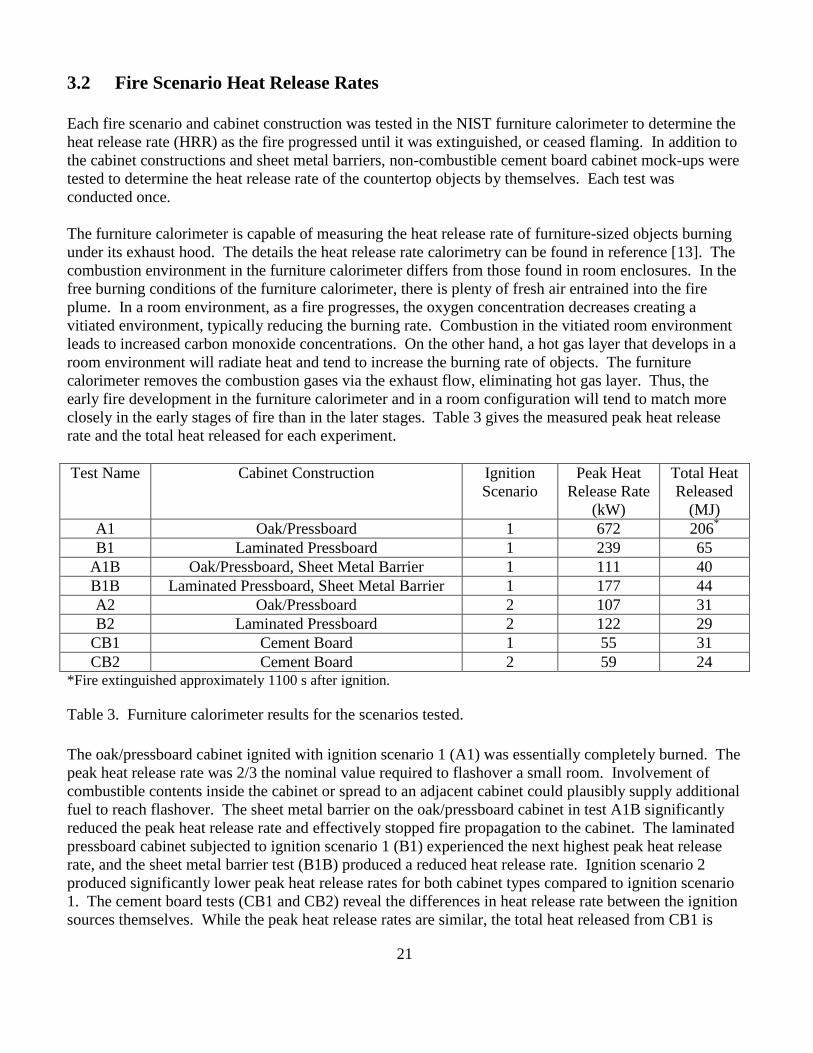
closely in the early stages of fire than in the later stages. Table 3 gives the measured peak heat release
rate and the total heat released for each experiment.
Test Name Cabinet Construction Ignition
Scenario
Peak Heat
Release Rate
(kW)
Total Heat
Released
(MJ)
A1 Oak/Pressboard 1 672 206*
B1 Laminated Pressboard 1 239 65
A1B Oak/Pressboard, Sheet Metal Barrier 1 111 40
B1B Laminated Pressboard, Sheet Metal Barrier 1 177 44
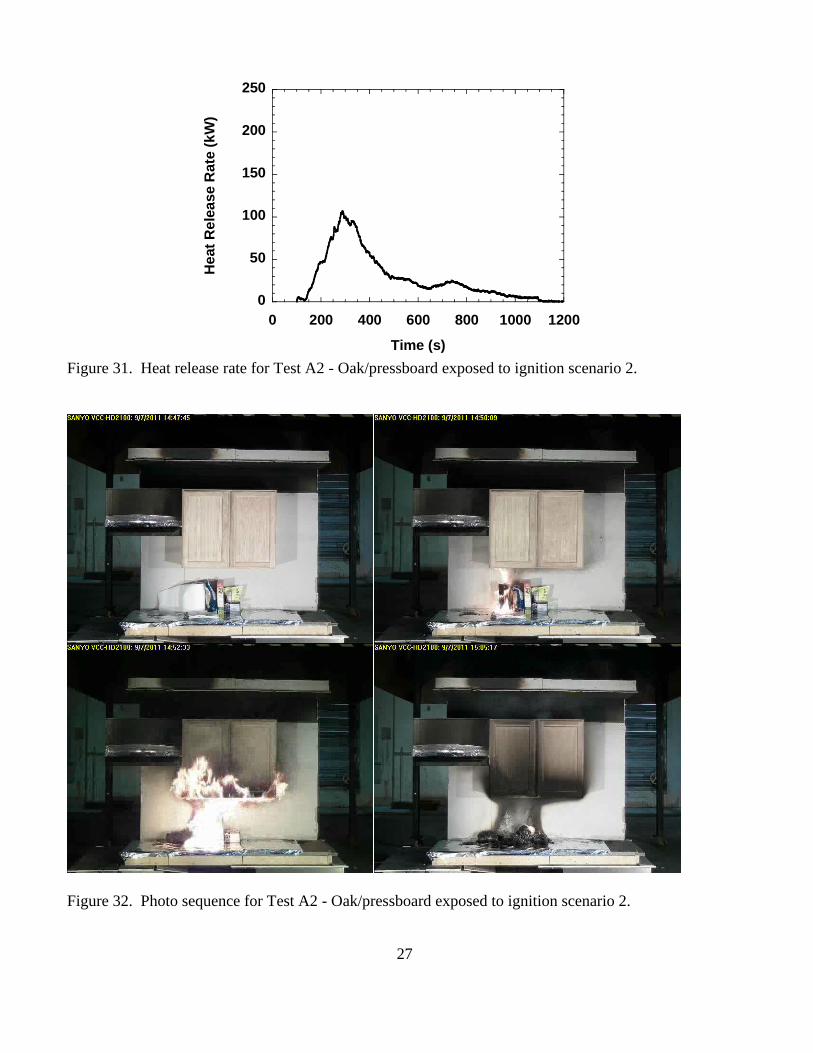
A2 Oak/Pressboard 2 107 31
B2 Laminated Pressboard 2 122 29
CB1 Cement Board 1 55 31
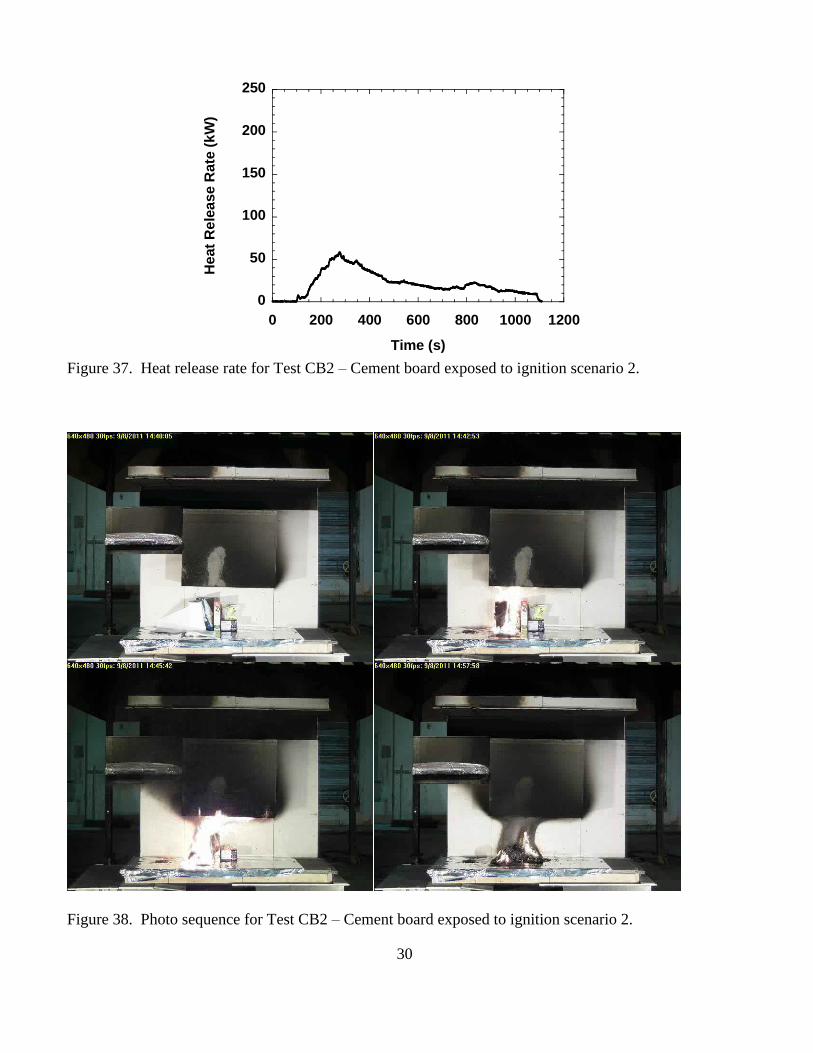
CB2 Cement Board 2 59 24 *Fire extinguished approximately 1100 s after ignition.
Table 3. Furniture calorimeter results for the scenarios tested.
The oak/pressboard cabinet ignited with ignition scenario 1 (A1) was essentially completely burned. The
peak heat release rate was 2/3 the nominal value required to flashover a small room. Involvement of
combustible contents inside the cabinet or spread to an adjacent cabinet could plausibly supply additional
fuel to reach flashover. The sheet metal barrier on the oak/pressboard cabinet in test A1B significantly
reduced the peak heat release rate and effectively stopped fire propagation to the cabinet. The laminated
pressboard cabinet subjected to ignition scenario 1 (B1) experienced the next highest peak heat release
rate, and the sheet metal barrier test (B1B) produced a reduced heat release rate. Ignition scenario 2
produced significantly lower peak heat release rates for both cabinet types compared to ignition scenario
1. The cement board tests (CB1 and CB2) reveal the differences in heat release rate between the ignition
sources themselves. While the peak heat release rates are similar, the total heat released from CB1 is

22
approximately 30% greater than CB2 which reflects the substantial contribution of the plastic coffee
maker to available fuel load.
The heat release rate curve along with a sequence of images showing the fire growth stages are presented
in the following figures (23-38). The start time (time =0) of the heat release rate curve was when the
power was supplied to the electric hot plate. There was approximately a 100 s elapsed time before the
paper towel ignited in each test. Ignition is evident in the initial increase in heat release rate from zero.
The picture sequence represents before ignition in the upper left photo, the fire at the peak heat release
rate value in the lower left photo, the fire progression at ½ the time to reach the peak heat release rate in
the upper right photo, and the end of the test in the lower right photo.

23
0
100
200
300
400
500
600
700
0 200 400 600 800 1000 1200
He
at
Re
lea
se R
ate
(k
W)
Time (s)
Figure 23. Heat release rate for Test A1 - Oak/pressboard exposed to ignition scenario 1. Fire
extinguished with water spray at approximately 1100 s.
Figure 24. Photo sequence for Test A1 - Oak/pressboard exposed to ignition scenario 1.

24
0
50
100
150
200
250
0 200 400 600 800 1000 1200
He
at
Re
lea
se R
ate
(k
W)
Time (s)
Figure 25. Heat release rate for Test B1 – Laminated pressboard exposed to ignition scenario 1.
Figure 26. Photo sequence for Test B1 - Laminated pressboard exposed to ignition scenario 1.

25
0
50
100
150
200
250
0 200 400 600 800 1000 1200
He
at
Re
lea
se R
ate
(k
W)
Time (s)
Figure 27. Heat release rate for Test A1B - Oak/pressboard with barrier exposed to ignition scenario 1.
Figure 28. Photo sequence for Test A1B - Oak/pressboard with barrier exposed to ignition scenario
26
0
50
100
150
200
250
0 200 400 600 800 1000 1200
He
at
Re
lea
se R
ate
(k
W)
Time (s)
Figure 29. Heat release rate for Test B1B – Laminated pressboard with barrier exposed to ignition
scenario 1.
Figure 30. Photo sequence for Test B1B – Laminated pressboard with barrier exposed to ignition
scenario 1.
27
0
50
100
150
200
250
0 200 400 600 800 1000 1200
He
at
Re
lea
se R
ate
(k
W)
Time (s)
Figure 31. Heat release rate for Test A2 - Oak/pressboard exposed to ignition scenario 2.
Figure 32. Photo sequence for Test A2 - Oak/pressboard exposed to ignition scenario 2.

28
0
50
100
150
200
250
0 200 400 600 800 1000 1200
He
at
Re
lea
se R
ate
(k
W)
Time (s)
Figure 33. B2 Heat release rate for Test B2 – Laminated pressboard exposed to ignition scenario 2.
Figure 34. Photo sequence for Test B2 - Laminated pressboard exposed to ignition scenario 2.

29
0
50
100
150
200
250
0 200 400 600 800 1000 1200
He
at
Re
lea
se R
ate
(k
W)
Time (s)
Figure 35. Heat release rate for Test CB1 – Cement board exposed to ignition scenario 1.
Figure 36. Photo sequence for Test CB1 – Cement board exposed to ignition scenario 1.
30
0
50
100
150
200
250
0 200 400 600 800 1000 1200
He
at
Re
lea
se R
ate
(k
W)
Time (s)
Figure 37. Heat release rate for Test CB2 – Cement board exposed to ignition scenario 2.
Figure 38. Photo sequence for Test CB2 – Cement board exposed to ignition scenario 2.

31
3.3 Nuisance Alarm Performance
In the burn prop building, there were eight ceiling locations where up to four smoke alarms could be
positioned. Two sets of four alarms were mounted on 16 test boards. Every test board contained a P1
and I1 alarm, and the other two alarms were chosen to spread the various types of alarms across the
different test boards. One set of alarms was used for the first three tests for each nuisance scenario, and
another set of alarms was used for the next three tests for each nuisance alarm scenario. Figure 39 shows
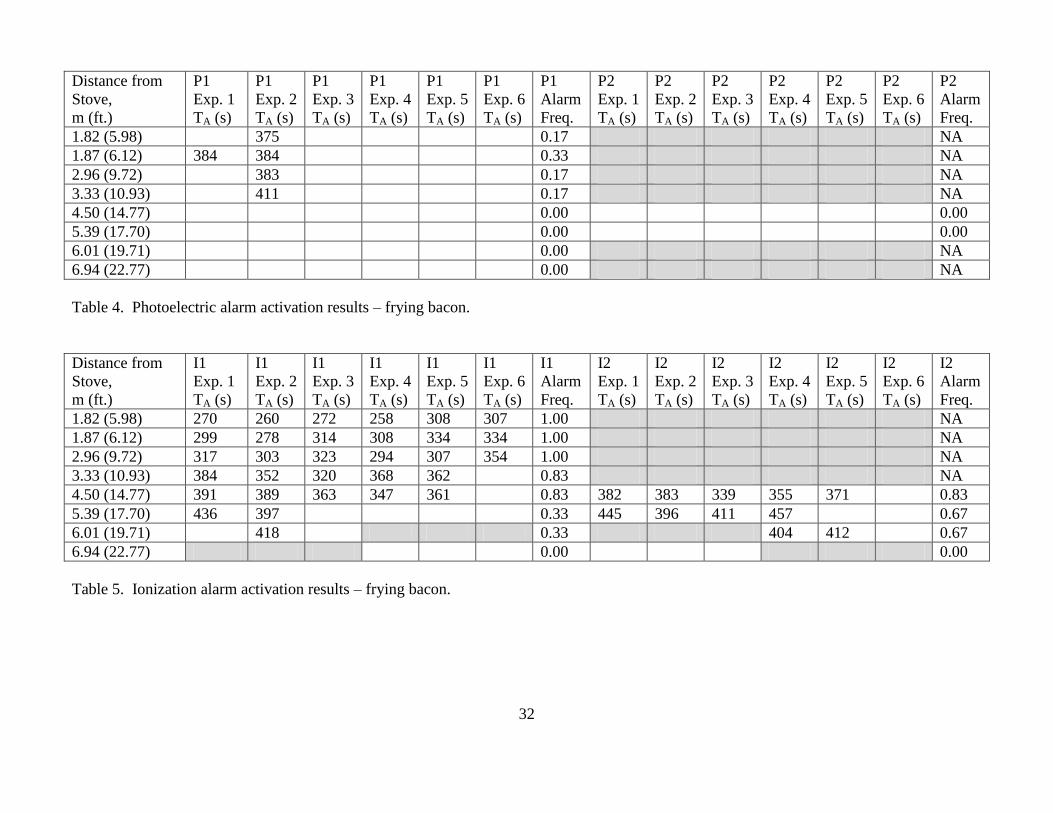
the locations of the smoke alarms. Two sets, Loc 1 and Loc 2, were located inside the kitchen at
horizontal distances of 1.82 m and 1.87 m from the spot indicated on the range top. Loc 3 and Loc 4
were located outside different kitchen doorways at horizontal distances from the range top of 2.96 m and
3.33 m respectively. Loc 5 - 8 were located in the living room at horizontal distances of 4.50 m, 5.39 m,
6.01 m and 6.94 m, respectively.
Figure 39. Location of alarms.
Tables 4 to 43 presents the results for the time to alarm for each installed smoke alarm. If the table entry
is blank, no alarm was recorded during the test. If the table entry is gray, the particular alarm was not
installed during that test.
32
Distance from
Stove,
m (ft.)
P1
Exp. 1
TA (s)
P1
Exp. 2
TA (s)
P1
Exp. 3
TA (s)
P1
Exp. 4
TA (s)
P1
Exp. 5
TA (s)
P1
Exp. 6
TA (s)
P1
Alarm
Freq.
P2
Exp. 1
TA (s)
P2
Exp. 2
TA (s)
P2
Exp. 3
TA (s)
P2
Exp. 4
TA (s)
P2
Exp. 5
TA (s)
P2
Exp. 6
TA (s)
P2
Alarm
Freq.
1.82 (5.98) 375 0.17 NA
1.87 (6.12) 384 384 0.33 NA
2.96 (9.72) 383 0.17 NA
3.33 (10.93) 411 0.17 NA
4.50 (14.77) 0.00 0.00
5.39 (17.70) 0.00 0.00
6.01 (19.71) 0.00 NA
6.94 (22.77) 0.00 NA
Table 4. Photoelectric alarm activation results – frying bacon.
Distance from
Stove,
m (ft.)
I1
Exp. 1
TA (s)
I1
Exp. 2
TA (s)
I1
Exp. 3
TA (s)
I1
Exp. 4
TA (s)
I1
Exp. 5
TA (s)
I1
Exp. 6
TA (s)
I1
Alarm
Freq.
I2
Exp. 1
TA (s)
I2
Exp. 2
TA (s)
I2
Exp. 3
TA (s)
I2
Exp. 4
TA (s)
I2
Exp. 5
TA (s)
I2
Exp. 6
TA (s)
I2
Alarm
Freq.
1.82 (5.98) 270 260 272 258 308 307 1.00 NA
1.87 (6.12) 299 278 314 308 334 334 1.00 NA
2.96 (9.72) 317 303 323 294 307 354 1.00 NA
3.33 (10.93) 384 352 320 368 362 0.83 NA
4.50 (14.77) 391 389 363 347 361 0.83 382 383 339 355 371 0.83
5.39 (17.70) 436 397 0.33 445 396 411 457 0.67
6.01 (19.71) 418 0.33 404 412 0.67
6.94 (22.77) 0.00 0.00
Table 5. Ionization alarm activation results – frying bacon.

33
Distance from
Stove,
m (ft.)
D1
Exp. 1
TA (s)
D1
Exp. 2
TA (s)
D1
Exp. 3
TA (s)
D1
Exp. 4
TA (s)
D1
Exp. 5
TA (s)
D1
Exp. 6
TA (s)
D1
Alarm
Freq.
D2
Exp. 1
TA (s)
D2
Exp. 2
TA (s)
D2
Exp. 3
TA (s)
D2
Exp. 4
TA (s)
D2
Exp. 5
TA (s)
D2
Exp. 6
TA (s)
D2
Alarm
Freq.
1.82 (5.98) 294 315 0.667 259 288 297 1.00
1.87 (6.12) 388 0.333 269 270 274 1.00
2.96 (9.72) 394 0.333 323 337 0.667
3.33 (10.93) 406 0.333 319 330 314 1.00
4.50 (14.77) NA NA
5.39 (17.70) NA NA
6.01 (19.71) 0.00 370 404 0.667
6.94 (22.77) 0.00 0.00
Table 6. Dual sensor alarm activation results – frying bacon.
Distance from
Stove,
m (ft.)
M1
Exp. 1
TA (s)
M1
Exp. 2
TA (s)
M1
Exp. 3
TA (s)
M1
Exp. 4
TA (s)
M1
Exp. 5
TA (s)
M1
Exp. 6
TA (s)
M1
Alarm
Freq.
M2
Exp. 1
TA (s)
M2
Exp. 2
TA (s)
M2
Exp. 3
TA (s)
M2
Exp. 4
TA (s)
M2
Exp. 5
TA (s)
M2
Exp. 6
TA (s)
M2
Alarm
Freq.
1.82 (5.98) 357 343 377 1.00 302 290 327 1.00
1.87 (6.12) 314 334 405 1.00 0.00
2.96 (9.72) 380 363 0.67 356 324 364 1.00
3.33 (10.93) 0.00 381 0.33
4.50 (14.77) NA NA
5.39 (17.70) NA NA
6.01 (19.71) 0.00 0.00
6.94 (22.77) 0.00 0.00
Table 7. Intelligent alarm activation results – frying bacon.
34
Distance from
Stove,
m (ft.)
P1
Exp. 1
TA (s)
P1
Exp. 2
TA (s)
P1
Exp. 3
TA (s)
P1
Exp. 4
TA (s)
P1
Exp. 5
TA (s)
P1
Exp. 6
TA (s)
P1
Alarm
Freq.
P2
Exp. 1
TA (s)
P2
Exp. 2
TA (s)
P2
Exp. 3
TA (s)
P2
Exp. 4
TA (s)
P2
Exp. 5
TA (s)
P2
Exp. 6
TA (s)
P2
Alarm
Freq.
1.82 (5.98) 246 232 232 236 217 0.83
1.87 (6.12) 248 240 243 215 0.67
2.96 (9.72) 274 260 241 0.50
3.33 (10.93) 257 258 0.33
4.50 (14.77) 257 0.17 251 0.17
5.39 (17.70) 0.00 0.00
6.01 (19.71) 287 0.17
6.94 (22.77) 0.00
Table 8. Photoelectric alarm activation results – grilled cheese sandwich.
Distance from
Stove,
m (ft.)
I1
Exp. 1
TA (s)
I1
Exp. 2
TA (s)
I1
Exp. 3
TA (s)
I1
Exp. 4
TA (s)
I1
Exp. 5
TA (s)
I1
Exp. 6
TA (s)
I1
Alarm
Freq.
I2
Exp. 1
TA (s)
I2
Exp. 2
TA (s)
I2
Exp. 3
TA (s)
I2
Exp. 4
TA (s)
I2
Exp. 5
TA (s)
I2
Exp. 6
TA (s)
I2
Alarm
Freq.
1.82 (5.98) 232 239 234 0.50
1.87 (6.12) 243 0.17
2.96 (9.72) 0.00
3.33 (10.93) 0.00
4.50 (14.77) 0.00 0.00
5.39 (17.70) 0.00 0.00
6.01 (19.71) 0.00 0.00
6.94 (22.77) 0.00 0.00
Table 9. Ionization alarm activation results – grilled cheese sandwich.
35
Distance from
Stove,
m (ft.)
D1
Exp. 1
TA (s)
D1
Exp. 2
TA (s)
D1
Exp. 3
TA (s)
D1
Exp. 4
TA (s)
D1
Exp. 5
TA (s)
D1
Exp. 6
TA (s)
D1
Alarm
Freq.
D2
Exp. 1
TA (s)
D2
Exp. 2
TA (s)
D2
Exp. 3
TA (s)
D2
Exp. 4
TA (s)
D2
Exp. 5
TA (s)
D2
Exp. 6
TA (s)
D2
Alarm
Freq.
1.82 (5.98) 234 228 0.67 204 231 223 1.00
1.87 (6.12) 255 0.33 239 0.33
2.96 (9.72) 282 0.33 256 0.33
3.33 (10.93) 0.00 0.00
4.50 (14.77) NA NA
5.39 (17.70) NA NA
6.01 (19.71) 0.00 0.00
6.94 (22.77) 0.00 0.00
Table 10. Dual sensor alarm activation results – grilled cheese sandwich.
Distance from
Stove,
m (ft.)
M1
Exp. 1
TA (s)
M1
Exp. 2
TA (s)
M1
Exp. 3
TA (s)
M1
Exp. 4
TA (s)
M1
Exp. 5
TA (s)
M1
Exp. 6
TA (s)
M1
Alarm
Freq.
M2
Exp. 1
TA (s)
M2
Exp. 2
TA (s)
M2
Exp. 3
TA (s)
M2
Exp. 4
TA (s)
M2
Exp. 5
TA (s)
M2
Exp. 6
TA (s)
M2
Alarm
Freq.
1.82 (5.98) 221 0.33 0.00
1.87 (6.12) 119 0.33 0.00
2.96 (9.72) 0.00 0.00
3.33 (10.93) 0.00 0.00
4.50 (14.77)
5.39 (17.70)
6.01 (19.71) 0.00 0.00
6.94 (22.77) 0.00 0.00
Table 11. Intelligent alarm activation results – grilled cheese sandwich.

36
Distance from
Stove,
m (ft.)
P1
Exp. 1
TA (s)
P1
Exp. 2
TA (s)
P1
Exp. 3
TA (s)
P1
Exp. 4
TA (s)
P1
Exp. 5
TA (s)
P1
Exp. 6
TA (s)
P1
Alarm
Freq.
P2
Exp. 1
TA (s)
P2
Exp. 2
TA (s)
P2
Exp. 3
TA (s)
P2
Exp. 4
TA (s)
P2
Exp. 5
TA (s)
P2
Exp. 6
TA (s)
P2
Alarm
Freq.
1.82 (5.98) 296 196 279 321 239 300 1.00 NA
1.87 (6.12) 287 314 290 323 331 317 1.00 NA
2.96 (9.72) 293 241 309 341 316 316 1.00 NA
3.33 (10.93) 330 335 332 379 345 359 1.00 NA
4.50 (14.77) 535 408 394 387 0.67 358 427 403 363 338 343 1.00
5.39 (17.70) 0.00 442 472 437 448 463 433 1.00
6.01 (19.71) 543 0.17 NA
6.94 (22.77) 558 586 0.33 NA
Table 12. Photoelectric alarm activation results – frying hamburger.
Distance from
Stove,
m (ft.)
I1
Exp. 1
TA (s)
I1
Exp. 2
TA (s)
I1
Exp. 3
TA (s)
I1
Exp. 4
TA (s)
I1
Exp. 5
TA (s)
I1
Exp. 6
TA (s)
I1
Alarm
Freq.
I2
Exp. 1
TA (s)
I2
Exp. 2
TA (s)
I2
Exp. 3
TA (s)
I2
Exp. 4
TA (s)
I2
Exp. 5
TA (s)
I2
Exp. 6
TA (s)
I2
Alarm
Freq.
1.82 (5.98) 271 266 247 196 236 249 1.00 NA
1.87 (6.12) 282 320 285 202 284 324 1.00 NA
2.96 (9.72) 342 357 307 243 261 275 1.00 NA
3.33 (10.93) 318 279 260 360 344 363 1.00 NA
4.50 (14.77) 489 550 404 360 335 344 1.00 480 550 404 365 332 342 1.00
5.39 (17.70) 555 542 0.33 517 564 409 540 581 576 1.00
6.01 (19.71) 0.00 526 526 409 1.00
6.94 (22.77) 544 558 574 1.00 0.00
Table 13. Ionization alarm activation results – frying hamburger.

37
Distance from
Stove,
m (ft.)
D1
Exp. 1
TA (s)
D1
Exp. 2
TA (s)
D1
Exp. 3
TA (s)
D1
Exp. 4
TA (s)
D1
Exp. 5
TA (s)
D1
Exp. 6
TA (s)
D1
Alarm
Freq.
D2
Exp. 1
TA (s)
D2
Exp. 2
TA (s)
D2
Exp. 3
TA (s)
D2
Exp. 4
TA (s)
D2
Exp. 5
TA (s)
D2
Exp. 6
TA (s)
D2
Alarm
Freq.
1.82 (5.98) 315 281 278 1.00 172 191 196 1.00
1.87 (6.12) 315 326 331 1.00 221 210 193 1.00
2.96 (9.72) 337 329 319 1.00 245 300 290 1.00
3.33 (10.93) 377 396 341 1.00 290 330 262 1.00
4.50 (14.77) NA NA
5.39 (17.70) NA NA
6.01 (19.71) 0.00 439 360 368 1.00
6.94 (22.77) 0.00 0.00
Table 14. Dual sensor alarm activation results – frying hamburger.
Distance from
Stove,
m (ft.)
M1
Exp. 1
TA (s)
M1
Exp. 2
TA (s)
M1
Exp. 3
TA (s)
M1
Exp. 4
TA (s)
M1
Exp. 5
TA (s)
M1
Exp. 6
TA (s)
M1
Alarm
Freq.
M2
Exp. 1
TA (s)
M2
Exp. 2
TA (s)
M2
Exp. 3
TA (s)
M2
Exp. 4
TA (s)
M2
Exp. 5
TA (s)
M2
Exp. 6
TA (s)
M2
Alarm
Freq.
1.82 (5.98) 638 504 658 1.00 274 299 275 1.00
1.87 (6.12) 281 369 352 1.00 500 502 0.67
2.96 (9.72) 502 0.33 483 503 488 1.00
3.33 (10.93) 0.00 370 462 366 1.00
4.50 (14.77) NA NA
5.39 (17.70) NA NA
6.01 (19.71) 0.00 0.00
6.94 (22.77) 0.00 0.00
Table 15. Intelligent alarm activation results – frying hamburger.
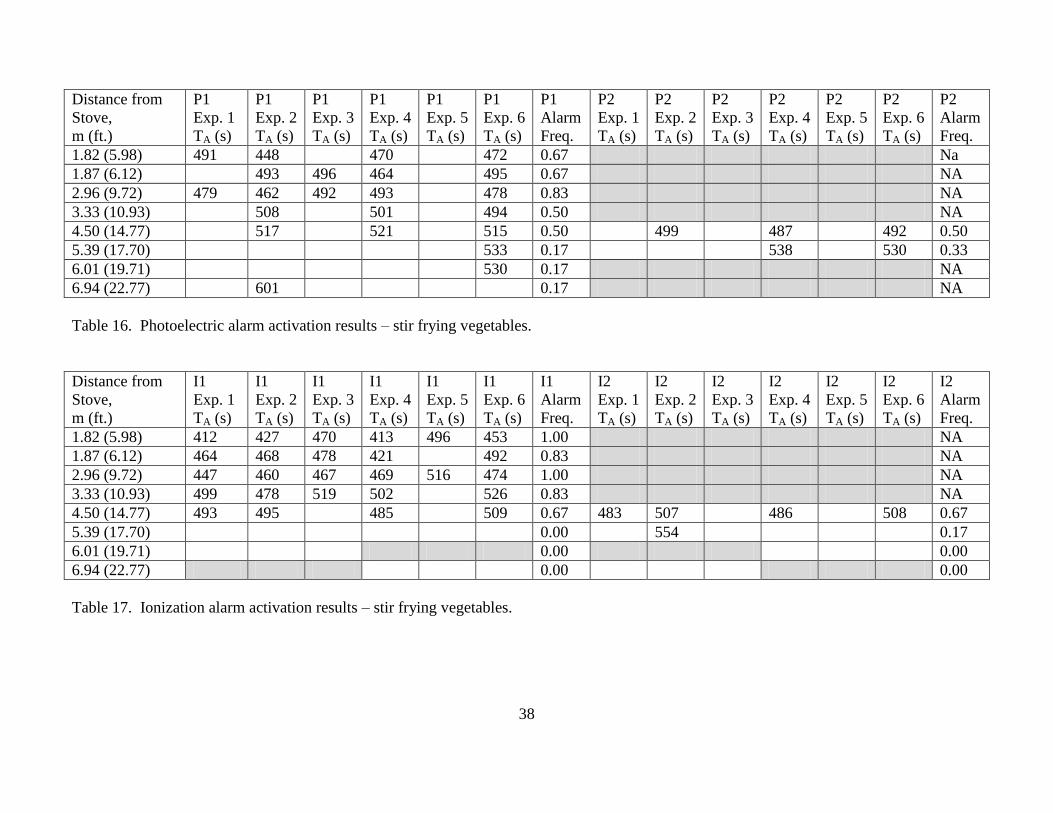
38
Distance from
Stove,
m (ft.)
P1
Exp. 1
TA (s)
P1
Exp. 2
TA (s)
P1
Exp. 3
TA (s)
P1
Exp. 4
TA (s)
P1
Exp. 5
TA (s)
P1
Exp. 6
TA (s)
P1
Alarm
Freq.
P2
Exp. 1
TA (s)
P2
Exp. 2
TA (s)
P2
Exp. 3
TA (s)
P2
Exp. 4
TA (s)
P2
Exp. 5
TA (s)
P2
Exp. 6
TA (s)
P2
Alarm
Freq.
1.82 (5.98) 491 448 470 472 0.67 Na
1.87 (6.12) 493 496 464 495 0.67 NA
2.96 (9.72) 479 462 492 493 478 0.83 NA
3.33 (10.93) 508 501 494 0.50 NA
4.50 (14.77) 517 521 515 0.50 499 487 492 0.50
5.39 (17.70) 533 0.17 538 530 0.33
6.01 (19.71) 530 0.17 NA
6.94 (22.77) 601 0.17 NA
Table 16. Photoelectric alarm activation results – stir frying vegetables.
Distance from
Stove,
m (ft.)
I1
Exp. 1
TA (s)
I1
Exp. 2
TA (s)
I1
Exp. 3
TA (s)
I1
Exp. 4
TA (s)
I1
Exp. 5
TA (s)
I1
Exp. 6
TA (s)
I1
Alarm
Freq.
I2
Exp. 1
TA (s)
I2
Exp. 2
TA (s)
I2
Exp. 3
TA (s)
I2
Exp. 4
TA (s)
I2
Exp. 5
TA (s)
I2
Exp. 6
TA (s)
I2
Alarm
Freq.
1.82 (5.98) 412 427 470 413 496 453 1.00 NA
1.87 (6.12) 464 468 478 421 492 0.83 NA
2.96 (9.72) 447 460 467 469 516 474 1.00 NA
3.33 (10.93) 499 478 519 502 526 0.83 NA
4.50 (14.77) 493 495 485 509 0.67 483 507 486 508 0.67
5.39 (17.70) 0.00 554 0.17
6.01 (19.71) 0.00 0.00
6.94 (22.77) 0.00 0.00
Table 17. Ionization alarm activation results – stir frying vegetables.
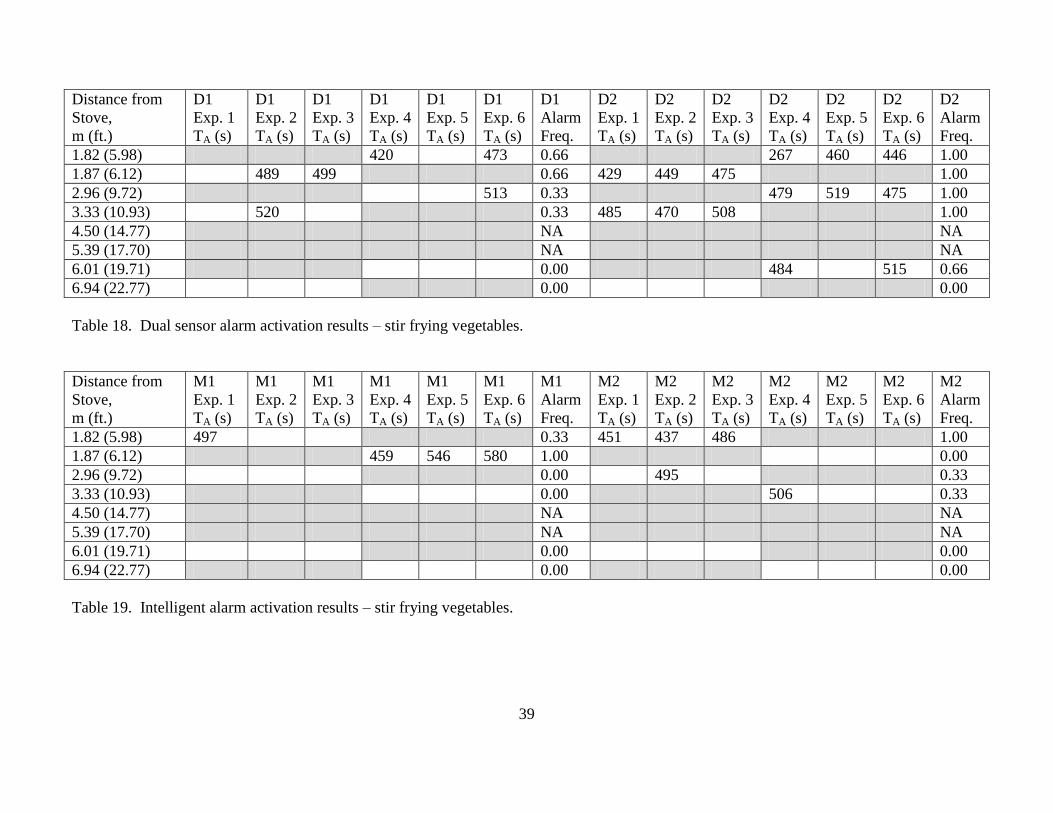
39
Distance from
Stove,
m (ft.)
D1
Exp. 1
TA (s)
D1
Exp. 2
TA (s)
D1
Exp. 3
TA (s)
D1
Exp. 4
TA (s)
D1
Exp. 5
TA (s)
D1
Exp. 6
TA (s)
D1
Alarm
Freq.
D2
Exp. 1
TA (s)
D2
Exp. 2
TA (s)
D2
Exp. 3
TA (s)
D2
Exp. 4
TA (s)
D2
Exp. 5
TA (s)
D2
Exp. 6
TA (s)
D2
Alarm
Freq.
1.82 (5.98) 420 473 0.66 267 460 446 1.00
1.87 (6.12) 489 499 0.66 429 449 475 1.00
2.96 (9.72) 513 0.33 479 519 475 1.00
3.33 (10.93) 520 0.33 485 470 508 1.00
4.50 (14.77) NA NA
5.39 (17.70) NA NA
6.01 (19.71) 0.00 484 515 0.66
6.94 (22.77) 0.00 0.00
Table 18. Dual sensor alarm activation results – stir frying vegetables.
Distance from
Stove,
m (ft.)
M1
Exp. 1
TA (s)
M1
Exp. 2
TA (s)
M1
Exp. 3
TA (s)
M1
Exp. 4
TA (s)
M1
Exp. 5
TA (s)
M1
Exp. 6
TA (s)
M1
Alarm
Freq.
M2
Exp. 1
TA (s)
M2
Exp. 2
TA (s)
M2
Exp. 3
TA (s)
M2
Exp. 4
TA (s)
M2
Exp. 5
TA (s)
M2
Exp. 6
TA (s)
M2
Alarm
Freq.
1.82 (5.98) 497 0.33 451 437 486 1.00
1.87 (6.12) 459 546 580 1.00 0.00
2.96 (9.72) 0.00 495 0.33
3.33 (10.93) 0.00 506 0.33
4.50 (14.77) NA NA
5.39 (17.70) NA NA
6.01 (19.71) 0.00 0.00
6.94 (22.77) 0.00 0.00
Table 19. Intelligent alarm activation results – stir frying vegetables.
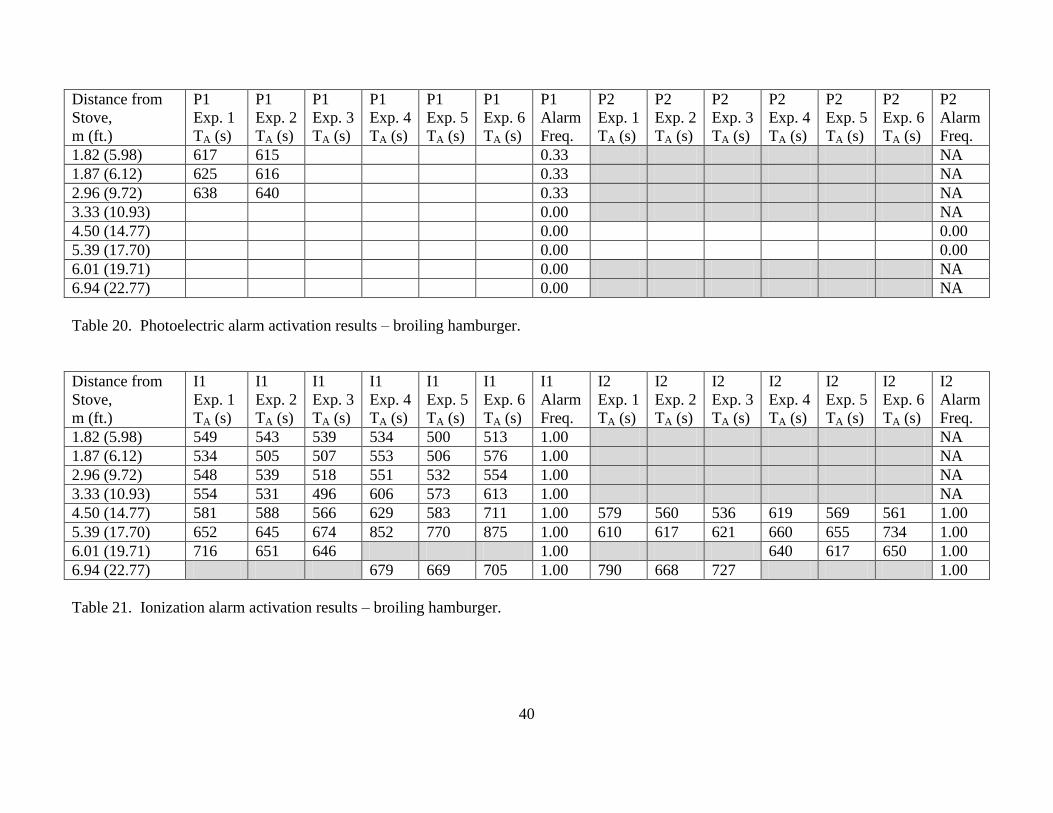
40
Distance from
Stove,
m (ft.)
P1
Exp. 1
TA (s)
P1
Exp. 2
TA (s)
P1
Exp. 3
TA (s)
P1
Exp. 4
TA (s)
P1
Exp. 5
TA (s)
P1
Exp. 6
TA (s)
P1
Alarm
Freq.
P2
Exp. 1
TA (s)
P2
Exp. 2
TA (s)
P2
Exp. 3
TA (s)
P2
Exp. 4
TA (s)
P2
Exp. 5
TA (s)
P2
Exp. 6
TA (s)
P2
Alarm
Freq.
1.82 (5.98) 617 615 0.33 NA
1.87 (6.12) 625 616 0.33 NA
2.96 (9.72) 638 640 0.33 NA
3.33 (10.93) 0.00 NA
4.50 (14.77) 0.00 0.00
5.39 (17.70) 0.00 0.00
6.01 (19.71) 0.00 NA
6.94 (22.77) 0.00 NA
Table 20. Photoelectric alarm activation results – broiling hamburger.
Distance from
Stove,
m (ft.)
I1
Exp. 1
TA (s)
I1
Exp. 2
TA (s)
I1
Exp. 3
TA (s)
I1
Exp. 4
TA (s)
I1
Exp. 5
TA (s)
I1
Exp. 6
TA (s)
I1
Alarm
Freq.
I2
Exp. 1
TA (s)
I2
Exp. 2
TA (s)
I2
Exp. 3
TA (s)
I2
Exp. 4
TA (s)
I2
Exp. 5
TA (s)
I2
Exp. 6
TA (s)
I2
Alarm
Freq.
1.82 (5.98) 549 543 539 534 500 513 1.00 NA
1.87 (6.12) 534 505 507 553 506 576 1.00 NA
2.96 (9.72) 548 539 518 551 532 554 1.00 NA
3.33 (10.93) 554 531 496 606 573 613 1.00 NA
4.50 (14.77) 581 588 566 629 583 711 1.00 579 560 536 619 569 561 1.00
5.39 (17.70) 652 645 674 852 770 875 1.00 610 617 621 660 655 734 1.00
6.01 (19.71) 716 651 646 1.00 640 617 650 1.00
6.94 (22.77) 679 669 705 1.00 790 668 727 1.00
Table 21. Ionization alarm activation results – broiling hamburger.

41
Distance from
Stove,
m (ft.)
D1
Exp. 1
TA (s)
D1
Exp. 2
TA (s)
D1
Exp. 3
TA (s)
D1
Exp. 4
TA (s)
D1
Exp. 5
TA (s)
D1
Exp. 6
TA (s)
D1
Alarm
Freq.
D2
Exp. 1
TA (s)
D2
Exp. 2
TA (s)
D2
Exp. 3
TA (s)
D2
Exp. 4
TA (s)
D2
Exp. 5
TA (s)
D2
Exp. 6
TA (s)
D2
Alarm
Freq.
1.82 (5.98) 613 584 700 1.00 466 463 442 1.00
1.87 (6.12) 869 757 0.67 522 515 508 1.00
2.96 (9.72) 801 0.33 583 574 580 1.00
3.33 (10.93) 626 613 631 1.00 522 501 595 1.00
4.50 (14.77) NA NA
5.39 (17.70) NA NA
6.01 (19.71) 0.00 590 560 606 1.00
6.94 (22.77) 0.00 646 631 653 1.00
Table 22. Dual sensor alarm activation results – broiling hamburger.
Distance from
Stove,
m (ft.)
M1
Exp. 1
TA (s)
M1
Exp. 2
TA (s)
M1
Exp. 3
TA (s)
M1
Exp. 4
TA (s)
M1
Exp. 5
TA (s)
M1
Exp. 6
TA (s)
M1
Alarm
Freq.
M2
Exp. 1
TA (s)
M2
Exp. 2
TA (s)
M2
Exp. 3
TA (s)
M2
Exp. 4
TA (s)
M2
Exp. 5
TA (s)
M2
Exp. 6
TA (s)
M2
Alarm
Freq.
1.82 (5.98) 558 501 741 1.00 574 579 581 1.00
1.87 (6.12) 506 525 360 1.00 841 0.33
2.96 (9.72) 811 795 918 1.00 757 621 0.67
3.33 (10.93) 725 951 950 1.00 810 673 812 1.00
4.50 (14.77) NA NA
5.39 (17.70) NA NA
6.01 (19.71) 553 922 879 1.00 868 881 0.67
6.94 (22.77) 0.00 0.00
Table 23. Intelligent alarm activation results – broiling hamburger.
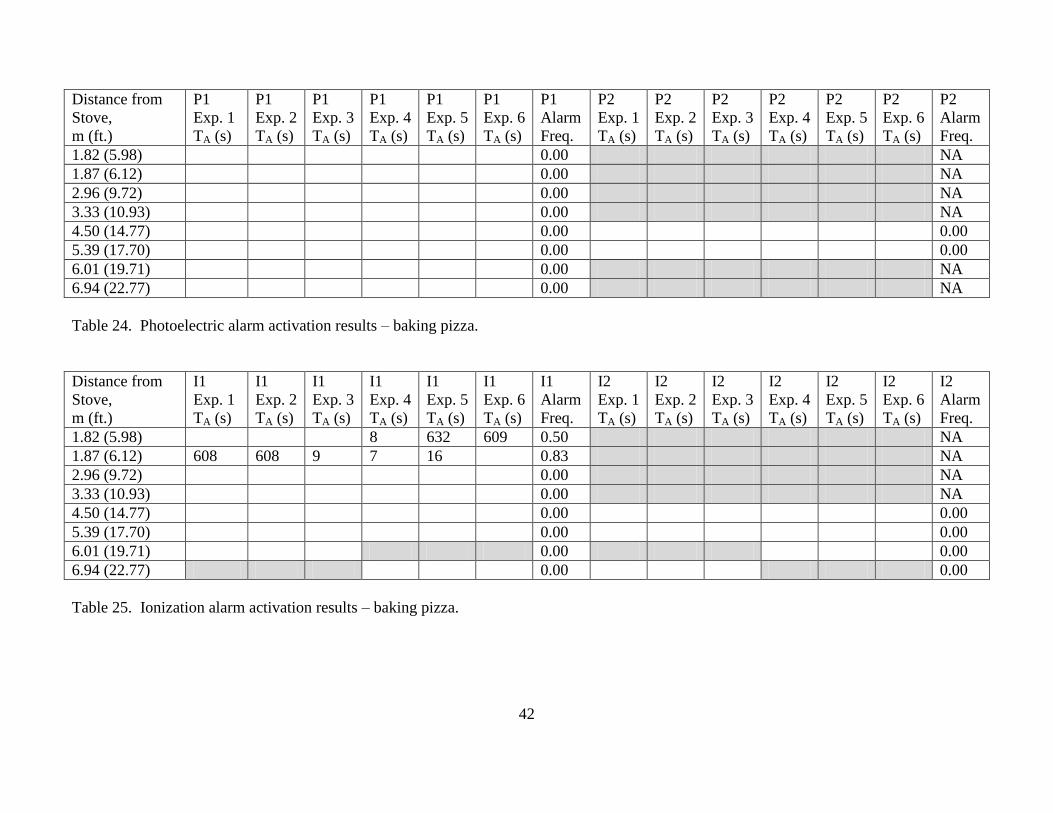
42
Distance from
Stove,
m (ft.)
P1
Exp. 1
TA (s)
P1
Exp. 2
TA (s)
P1
Exp. 3
TA (s)
P1
Exp. 4
TA (s)
P1
Exp. 5
TA (s)
P1
Exp. 6
TA (s)
P1
Alarm
Freq.
P2
Exp. 1
TA (s)
P2
Exp. 2
TA (s)
P2
Exp. 3
TA (s)
P2
Exp. 4
TA (s)
P2
Exp. 5
TA (s)
P2
Exp. 6
TA (s)
P2
Alarm
Freq.
1.82 (5.98) 0.00 NA
1.87 (6.12) 0.00 NA
2.96 (9.72) 0.00 NA
3.33 (10.93) 0.00 NA
4.50 (14.77) 0.00 0.00
5.39 (17.70) 0.00 0.00
6.01 (19.71) 0.00 NA
6.94 (22.77) 0.00 NA
Table 24. Photoelectric alarm activation results – baking pizza.
Distance from
Stove,
m (ft.)
I1
Exp. 1
TA (s)
I1
Exp. 2
TA (s)
I1
Exp. 3
TA (s)
I1
Exp. 4
TA (s)
I1
Exp. 5
TA (s)
I1
Exp. 6
TA (s)
I1
Alarm
Freq.
I2
Exp. 1
TA (s)
I2
Exp. 2
TA (s)
I2
Exp. 3
TA (s)
I2
Exp. 4
TA (s)
I2
Exp. 5
TA (s)
I2
Exp. 6
TA (s)
I2
Alarm
Freq.
1.82 (5.98) 8 632 609 0.50 NA
1.87 (6.12) 608 608 9 7 16 0.83 NA
2.96 (9.72) 0.00 NA
3.33 (10.93) 0.00 NA
4.50 (14.77) 0.00 0.00
5.39 (17.70) 0.00 0.00
6.01 (19.71) 0.00 0.00
6.94 (22.77) 0.00 0.00
Table 25. Ionization alarm activation results – baking pizza.
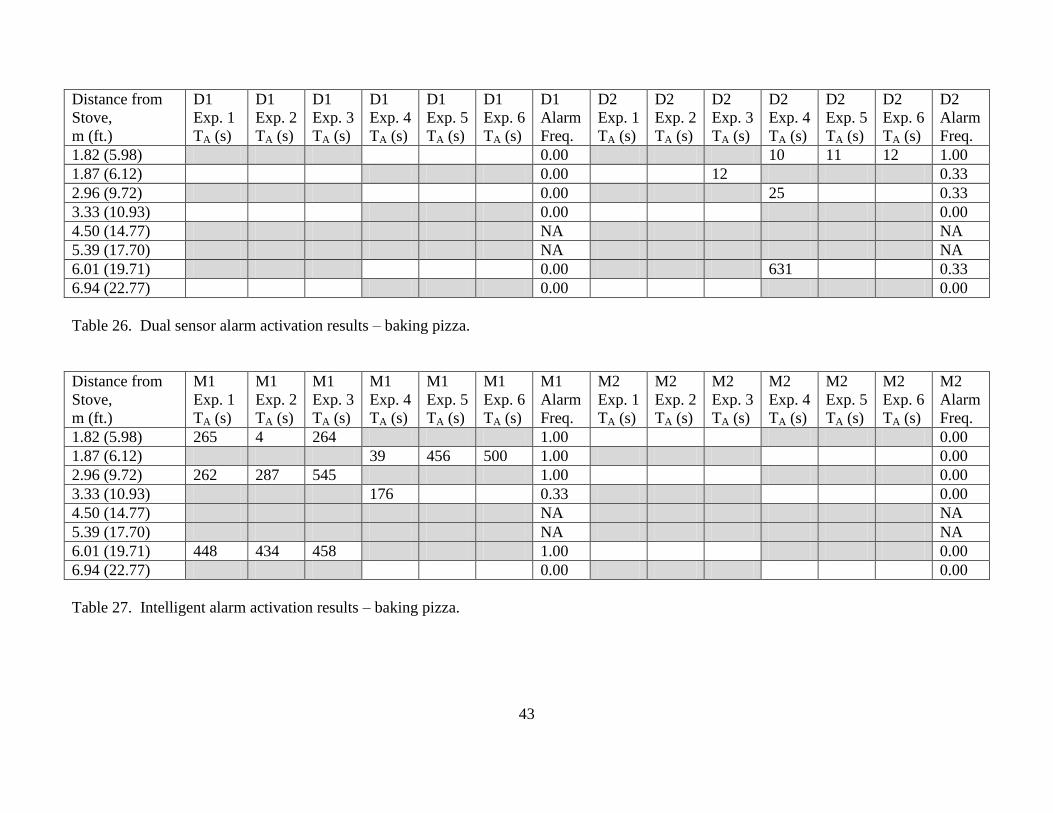
43
Distance from
Stove,
m (ft.)
D1
Exp. 1
TA (s)
D1
Exp. 2
TA (s)
D1
Exp. 3
TA (s)
D1
Exp. 4
TA (s)
D1
Exp. 5
TA (s)
D1
Exp. 6
TA (s)
D1
Alarm
Freq.
D2
Exp. 1
TA (s)
D2
Exp. 2
TA (s)
D2
Exp. 3
TA (s)
D2
Exp. 4
TA (s)
D2
Exp. 5
TA (s)
D2
Exp. 6
TA (s)
D2
Alarm
Freq.
1.82 (5.98) 0.00 10 11 12 1.00
1.87 (6.12) 0.00 12 0.33
2.96 (9.72) 0.00 25 0.33
3.33 (10.93) 0.00 0.00
4.50 (14.77) NA NA
5.39 (17.70) NA NA
6.01 (19.71) 0.00 631 0.33
6.94 (22.77) 0.00 0.00
Table 26. Dual sensor alarm activation results – baking pizza.
Distance from
Stove,
m (ft.)
M1
Exp. 1
TA (s)
M1
Exp. 2
TA (s)
M1
Exp. 3
TA (s)
M1
Exp. 4
TA (s)
M1
Exp. 5
TA (s)
M1
Exp. 6
TA (s)
M1
Alarm
Freq.
M2
Exp. 1
TA (s)
M2
Exp. 2
TA (s)
M2
Exp. 3
TA (s)
M2
Exp. 4
TA (s)
M2
Exp. 5
TA (s)
M2
Exp. 6
TA (s)
M2
Alarm
Freq.
1.82 (5.98) 265 4 264 1.00 0.00
1.87 (6.12) 39 456 500 1.00 0.00
2.96 (9.72) 262 287 545 1.00 0.00
3.33 (10.93) 176 0.33 0.00
4.50 (14.77) NA NA
5.39 (17.70) NA NA
6.01 (19.71) 448 434 458 1.00 0.00
6.94 (22.77) 0.00 0.00
Table 27. Intelligent alarm activation results – baking pizza.

44
Distance from
Stove,
m (ft.)
P1
Exp. 1
TA (s)
P1
Exp. 2
TA (s)
P1
Exp. 3
TA (s)
P1
Exp. 4
TA (s)
P1
Exp. 5
TA (s)
P1
Exp. 6
TA (s)
P1
Alarm
Freq.
P2
Exp. 1
TA (s)
P2
Exp. 2
TA (s)
P2
Exp. 3
TA (s)
P2
Exp. 4
TA (s)
P2
Exp. 5
TA (s)
P2
Exp. 6
TA (s)
P2
Alarm
Freq.
1.82 (5.98) 0.00 NA
1.87 (6.12) 0.00 NA
2.96 (9.72) 0.00 NA
3.33 (10.93) 0.00 NA
4.50 (14.77) 0.00 0.00
5.39 (17.70) 0.00 0.00
6.01 (19.71) 0.00 NA
6.94 (22.77) 0.00 NA
Table 28. Photoelectric alarm activation results – light toast.
Distance from
Stove,
m (ft.)
I1
Exp. 1
TA (s)
I1
Exp. 2
TA (s)
I1
Exp. 3
TA (s)
I1
Exp. 4
TA (s)
I1
Exp. 5
TA (s)
I1
Exp. 6
TA (s)
I1
Alarm
Freq.
I2
Exp. 1
TA (s)
I2
Exp. 2
TA (s)
I2
Exp. 3
TA (s)
I2
Exp. 4
TA (s)
I2
Exp. 5
TA (s)
I2
Exp. 6
TA (s)
I2
Alarm
Freq.
1.82 (5.98) 0.00 NA
1.87 (6.12) 113 0.17 NA
2.96 (9.72) 0.00 NA
3.33 (10.93) 0.00 NA
4.50 (14.77) 0.00 0.00
5.39 (17.70) 0.00 0.00
6.01 (19.71) 0.00 0.00
6.94 (22.77) 0.00 0.00
Table 29. Ionization alarm activation results – light toast.
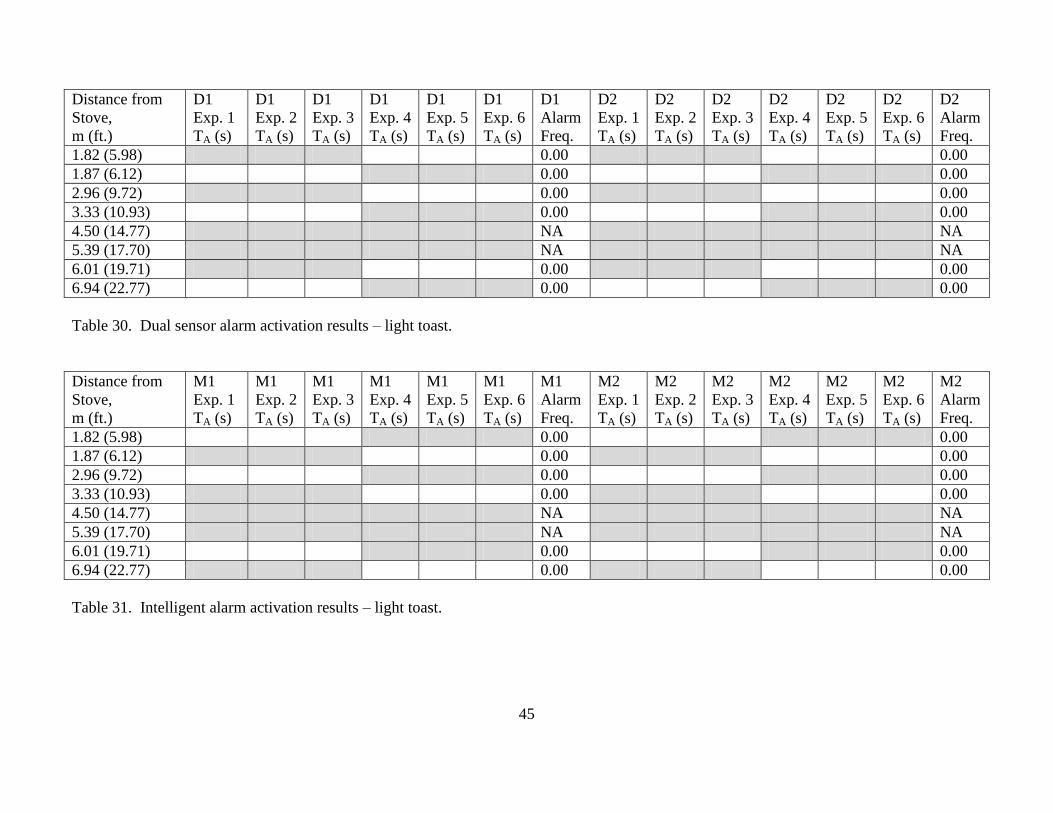
45
Distance from
Stove,
m (ft.)
D1
Exp. 1
TA (s)
D1
Exp. 2
TA (s)
D1
Exp. 3
TA (s)
D1
Exp. 4
TA (s)
D1
Exp. 5
TA (s)
D1
Exp. 6
TA (s)
D1
Alarm
Freq.
D2
Exp. 1
TA (s)
D2
Exp. 2
TA (s)
D2
Exp. 3
TA (s)
D2
Exp. 4
TA (s)
D2
Exp. 5
TA (s)
D2
Exp. 6
TA (s)
D2
Alarm
Freq.
1.82 (5.98) 0.00 0.00
1.87 (6.12) 0.00 0.00
2.96 (9.72) 0.00 0.00
3.33 (10.93) 0.00 0.00
4.50 (14.77) NA NA
5.39 (17.70) NA NA
6.01 (19.71) 0.00 0.00
6.94 (22.77) 0.00 0.00
Table 30. Dual sensor alarm activation results – light toast.
Distance from
Stove,
m (ft.)
M1
Exp. 1
TA (s)
M1
Exp. 2
TA (s)
M1
Exp. 3
TA (s)
M1
Exp. 4
TA (s)
M1
Exp. 5
TA (s)
M1
Exp. 6
TA (s)
M1
Alarm
Freq.
M2
Exp. 1
TA (s)
M2
Exp. 2
TA (s)
M2
Exp. 3
TA (s)
M2
Exp. 4
TA (s)
M2
Exp. 5
TA (s)
M2
Exp. 6
TA (s)
M2
Alarm
Freq.
1.82 (5.98) 0.00 0.00
1.87 (6.12) 0.00 0.00
2.96 (9.72) 0.00 0.00
3.33 (10.93) 0.00 0.00
4.50 (14.77) NA NA
5.39 (17.70) NA NA
6.01 (19.71) 0.00 0.00
6.94 (22.77) 0.00 0.00
Table 31. Intelligent alarm activation results – light toast.

46
Distance from
Stove,
m (ft.)
P1
Exp. 1
TA (s)
P1
Exp. 2
TA (s)
P1
Exp. 3
TA (s)
P1
Exp. 4
TA (s)
P1
Exp. 5
TA (s)
P1
Exp. 6
TA (s)
P1
Alarm
Freq.
P2
Exp. 1
TA (s)
P2
Exp. 2
TA (s)
P2
Exp. 3
TA (s)
P2
Exp. 4
TA (s)
P2
Exp. 5
TA (s)
P2
Exp. 6
TA (s)
P2
Alarm
Freq.
1.82 (5.98) 0.00 NA
1.87 (6.12) 0.00 NA
2.96 (9.72) 0.00 NA
3.33 (10.93) 0.00 NA
4.50 (14.77) 0.00 0.00
5.39 (17.70) 0.00 0.00
6.01 (19.71) 0.00 NA
6.94 (22.77) 0.00 NA
Table 32. Photoelectric alarm activation results – dark toast.
Distance from
Stove,
m (ft.)
I1
Exp. 1
TA (s)
I1
Exp. 2
TA (s)
I1
Exp. 3
TA (s)
I1
Exp. 4
TA (s)
I1
Exp. 5
TA (s)
I1
Exp. 6
TA (s)
I1
Alarm
Freq.
I2
Exp. 1
TA (s)
I2
Exp. 2
TA (s)
I2
Exp. 3
TA (s)
I2
Exp. 4
TA (s)
I2
Exp. 5
TA (s)
I2
Exp. 6
TA (s)
I2
Alarm
Freq.
1.82 (5.98) 164 161 155 192 171 167 1.00 NA
1.87 (6.12) 116 121 129 147 137 156 1.00 NA
2.96 (9.72) 221 237 215 232 204 209 1.00 NA
3.33 (10.93) 0.00 NA
4.50 (14.77) 0.00 0.00
5.39 (17.70) 0.00 0.00
6.01 (19.71) 0.00 0.00
6.94 (22.77) 0.00 0.00
Table 33. Ionization alarm activation results – dark toast.
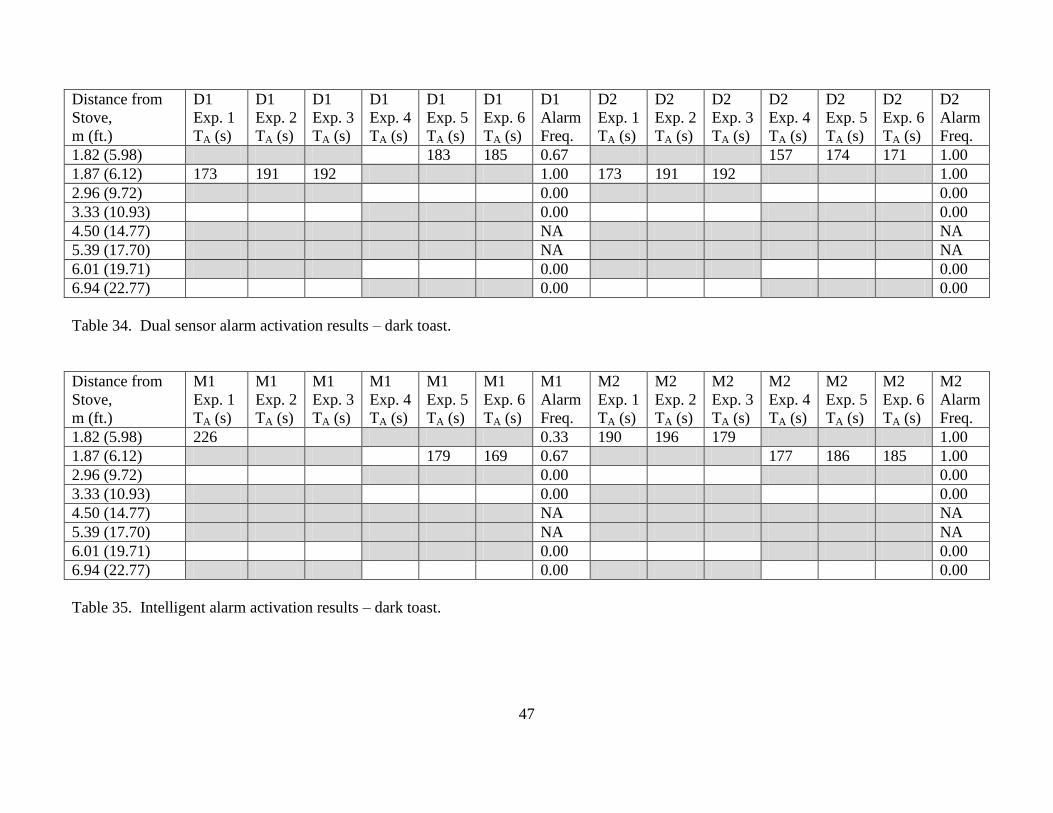
47
Distance from
Stove,
m (ft.)
D1
Exp. 1
TA (s)
D1
Exp. 2
TA (s)
D1
Exp. 3
TA (s)
D1
Exp. 4
TA (s)
D1
Exp. 5
TA (s)
D1
Exp. 6
TA (s)
D1
Alarm
Freq.
D2
Exp. 1
TA (s)
D2
Exp. 2
TA (s)
D2
Exp. 3
TA (s)
D2
Exp. 4
TA (s)
D2
Exp. 5
TA (s)
D2
Exp. 6
TA (s)
D2
Alarm
Freq.
1.82 (5.98) 183 185 0.67 157 174 171 1.00
1.87 (6.12) 173 191 192 1.00 173 191 192 1.00
2.96 (9.72) 0.00 0.00
3.33 (10.93) 0.00 0.00
4.50 (14.77) NA NA
5.39 (17.70) NA NA
6.01 (19.71) 0.00 0.00
6.94 (22.77) 0.00 0.00
Table 34. Dual sensor alarm activation results – dark toast.
Distance from
Stove,
m (ft.)
M1
Exp. 1
TA (s)
M1
Exp. 2
TA (s)
M1
Exp. 3
TA (s)
M1
Exp. 4
TA (s)
M1
Exp. 5
TA (s)
M1
Exp. 6
TA (s)
M1
Alarm
Freq.
M2
Exp. 1
TA (s)
M2
Exp. 2
TA (s)
M2
Exp. 3
TA (s)
M2
Exp. 4
TA (s)
M2
Exp. 5
TA (s)
M2
Exp. 6
TA (s)
M2
Alarm
Freq.
1.82 (5.98) 226 0.33 190 196 179 1.00
1.87 (6.12) 179 169 0.67 177 186 185 1.00
2.96 (9.72) 0.00 0.00
3.33 (10.93) 0.00 0.00
4.50 (14.77) NA NA
5.39 (17.70) NA NA
6.01 (19.71) 0.00 0.00
6.94 (22.77) 0.00 0.00
Table 35. Intelligent alarm activation results – dark toast.
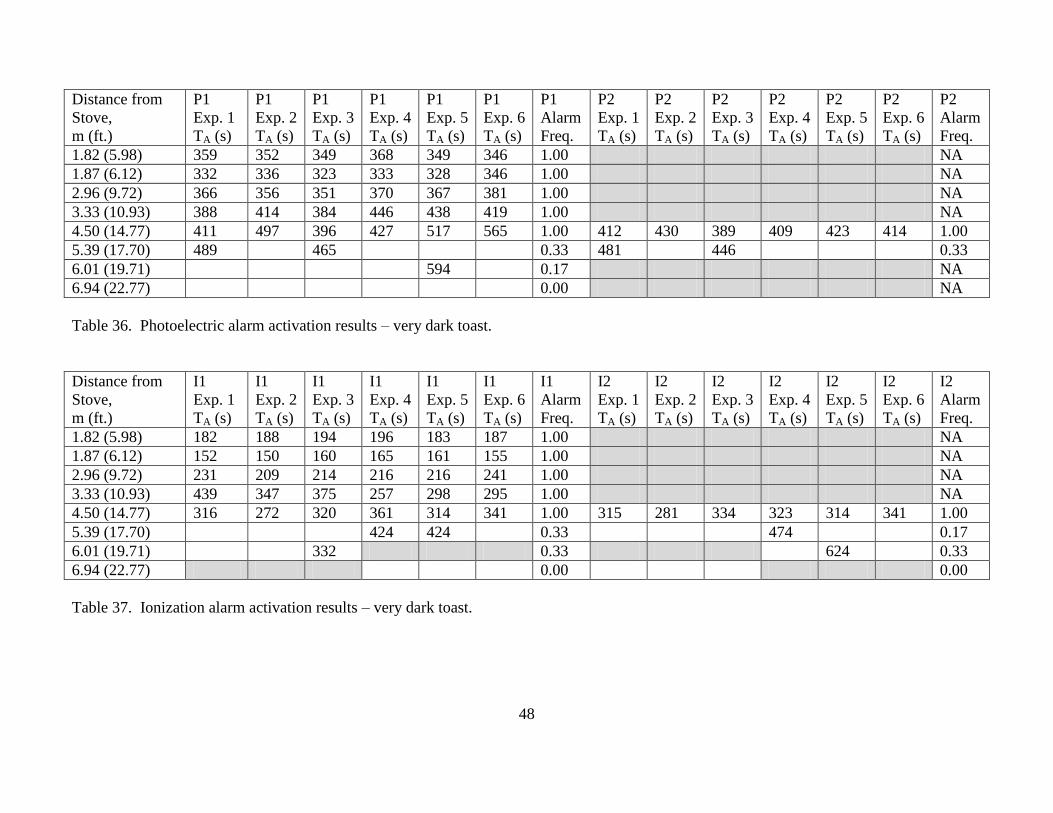
48
Distance from
Stove,
m (ft.)
P1
Exp. 1
TA (s)
P1
Exp. 2
TA (s)
P1
Exp. 3
TA (s)
P1
Exp. 4
TA (s)
P1
Exp. 5
TA (s)
P1
Exp. 6
TA (s)
P1
Alarm
Freq.
P2
Exp. 1
TA (s)
P2
Exp. 2
TA (s)
P2
Exp. 3
TA (s)
P2
Exp. 4
TA (s)
P2
Exp. 5
TA (s)
P2
Exp. 6
TA (s)
P2
Alarm
Freq.
1.82 (5.98) 359 352 349 368 349 346 1.00 NA
1.87 (6.12) 332 336 323 333 328 346 1.00 NA
2.96 (9.72) 366 356 351 370 367 381 1.00 NA
3.33 (10.93) 388 414 384 446 438 419 1.00 NA
4.50 (14.77) 411 497 396 427 517 565 1.00 412 430 389 409 423 414 1.00
5.39 (17.70) 489 465 0.33 481 446 0.33
6.01 (19.71) 594 0.17 NA
6.94 (22.77) 0.00 NA
Table 36. Photoelectric alarm activation results – very dark toast.
Distance from
Stove,
m (ft.)
I1
Exp. 1
TA (s)
I1
Exp. 2
TA (s)
I1
Exp. 3
TA (s)
I1
Exp. 4
TA (s)
I1
Exp. 5
TA (s)
I1
Exp. 6
TA (s)
I1
Alarm
Freq.
I2
Exp. 1
TA (s)
I2
Exp. 2
TA (s)
I2
Exp. 3
TA (s)
I2
Exp. 4
TA (s)
I2
Exp. 5
TA (s)
I2
Exp. 6
TA (s)
I2
Alarm
Freq.
1.82 (5.98) 182 188 194 196 183 187 1.00 NA
1.87 (6.12) 152 150 160 165 161 155 1.00 NA
2.96 (9.72) 231 209 214 216 216 241 1.00 NA
3.33 (10.93) 439 347 375 257 298 295 1.00 NA
4.50 (14.77) 316 272 320 361 314 341 1.00 315 281 334 323 314 341 1.00
5.39 (17.70) 424 424 0.33 474 0.17
6.01 (19.71) 332 0.33 624 0.33
6.94 (22.77) 0.00 0.00
Table 37. Ionization alarm activation results – very dark toast.

49
Distance from
Stove,
m (ft.)
D1
Exp. 1
TA (s)
D1
Exp. 2
TA (s)
D1
Exp. 3
TA (s)
D1
Exp. 4
TA (s)
D1
Exp. 5
TA (s)
D1
Exp. 6
TA (s)
D1
Alarm
Freq.
D2
Exp. 1
TA (s)
D2
Exp. 2
TA (s)
D2
Exp. 3
TA (s)
D2
Exp. 4
TA (s)
D2
Exp. 5
TA (s)
D2
Exp. 6
TA (s)
D2
Alarm
Freq.
1.82 (5.98) 227 218 237 1.00 189 184 173 1.00
1.87 (6.12) 196 206 206 1.00 180 173 177 1.00
2.96 (9.72) 267 266 303 1.00 269 245 235 1.00
3.33 (10.93) 418 385 397 1.00 292 250 263 1.00
4.50 (14.77) NA NA
5.39 (17.70) NA NA
6.01 (19.71) 624 0.33 397 372 0.67
6.94 (22.77) 0.00 0.00
Table 38. Dual sensor alarm activation results – very dark toast.
Distance from
Stove,
m (ft.)
M1
Exp. 1
TA (s)
M1
Exp. 2
TA (s)
M1
Exp. 3
TA (s)
M1
Exp. 4
TA (s)
M1
Exp. 5
TA (s)
M1
Exp. 6
TA (s)
M1
Alarm
Freq.
M2
Exp. 1
TA (s)
M2
Exp. 2
TA (s)
M2
Exp. 3
TA (s)
M2
Exp. 4
TA (s)
M2
Exp. 5
TA (s)
M2
Exp. 6
TA (s)
M2
Alarm
Freq.
1.82 (5.98) 248 236 253 1.00 211 200 194 1.00
1.87 (6.12) 202 191 205 1.00 201 210 204 1.00
2.96 (9.72) 288 268 294 1.00 366 356 351 1.00
3.33 (10.93) 317 382 0.67 329 344 363 1.00
4.50 (14.77)
5.39 (17.70)
6.01 (19.71) 0.00 0.00
6.94 (22.77) 0.00 0.00
Table 39. Intelligent alarm activation results – very dark toast.

50
Distance from
Stove,
m (ft.)
P1
Exp. 1
TA (s)
P1
Exp. 2
TA (s)
P1
Exp. 3
TA (s)
P1
Exp. 4
TA (s)
P1
Exp. 5
TA (s)
P1
Exp. 6
TA (s)
P1
Alarm
Freq.
P2
Exp. 1
TA (s)
P2
Exp. 2
TA (s)
P2
Exp. 3
TA (s)
P2
Exp. 4
TA (s)
P2
Exp. 5
TA (s)
P2
Exp. 6
TA (s)
P2
Alarm
Freq.
1.82 (5.98) 0.00 NA
1.87 (6.12) 0.00 NA
2.96 (9.72) 0.00 NA
3.33 (10.93) 0.00 NA
4.50 (14.77) 0.00 0.00
5.39 (17.70) 0.00 0.00
6.01 (19.71) 0.00 NA
6.94 (22.77) 0.00 NA
Table 40. Photoelectric alarm activation results – toasting bagel.
Distance from
Stove,
m (ft.)
I1
Exp. 1
TA (s)
I1
Exp. 2
TA (s)
I1
Exp. 3
TA (s)
I1
Exp. 4
TA (s)
I1
Exp. 5
TA (s)
I1
Exp. 6
TA (s)
I1
Alarm
Freq.
I2
Exp. 1
TA (s)
I2
Exp. 2
TA (s)
I2
Exp. 3
TA (s)
I2
Exp. 4
TA (s)
I2
Exp. 5
TA (s)
I2
Exp. 6
TA (s)
I2
Alarm
Freq.
1.82 (5.98) 197 201 160 192 178 186 1.00 NA
1.87 (6.12) 149 153 138 178 155 160 1.00 NA
2.96 (9.72) 237 233 229 0.50 NA
3.33 (10.93) 0.00 NA
4.50 (14.77) 0.00 0.00
5.39 (17.70) 0.00 0.00
6.01 (19.71) 0.00 0.00
6.94 (22.77) 0.00 0.00
Table 41. Ionization alarm activation results – toasting bagel.
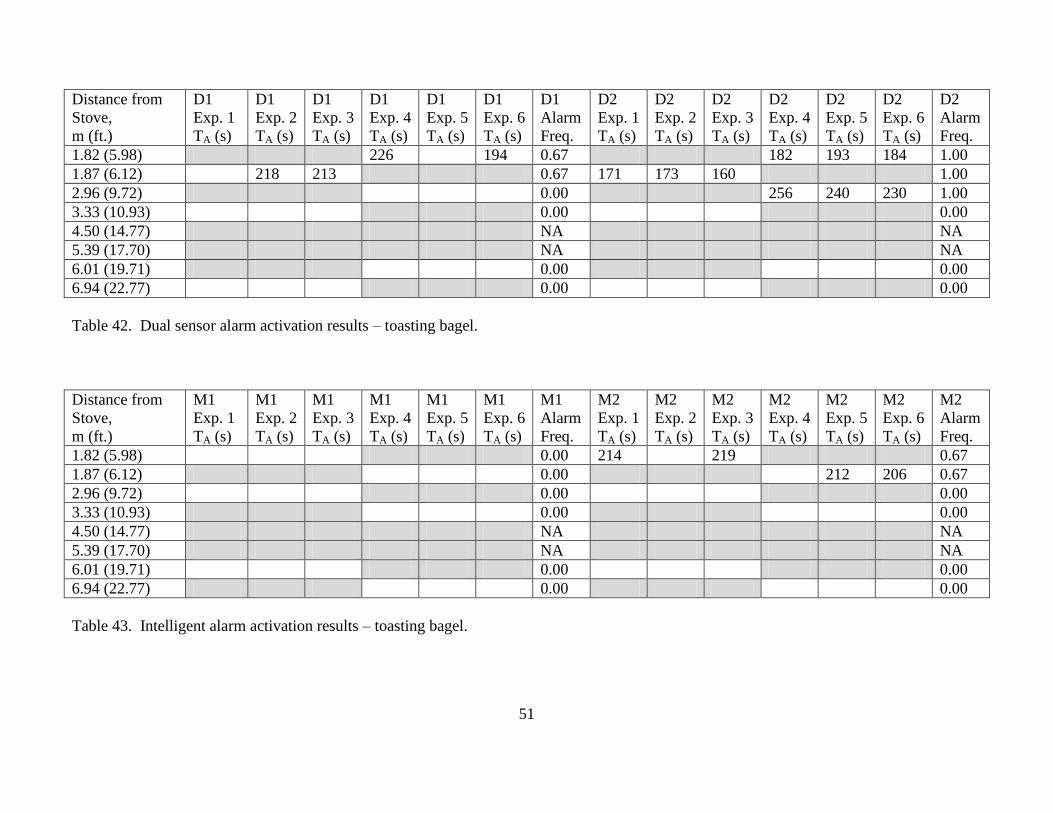
51
Distance from
Stove,
m (ft.)
D1
Exp. 1
TA (s)
D1
Exp. 2
TA (s)
D1
Exp. 3
TA (s)
D1
Exp. 4
TA (s)
D1
Exp. 5
TA (s)
D1
Exp. 6
TA (s)
D1
Alarm
Freq.
D2
Exp. 1
TA (s)
D2
Exp. 2
TA (s)
D2
Exp. 3
TA (s)
D2
Exp. 4
TA (s)
D2
Exp. 5
TA (s)
D2
Exp. 6
TA (s)
D2
Alarm
Freq.
1.82 (5.98) 226 194 0.67 182 193 184 1.00
1.87 (6.12) 218 213 0.67 171 173 160 1.00
2.96 (9.72) 0.00 256 240 230 1.00
3.33 (10.93) 0.00 0.00
4.50 (14.77) NA NA
5.39 (17.70) NA NA
6.01 (19.71) 0.00 0.00
6.94 (22.77) 0.00 0.00
Table 42. Dual sensor alarm activation results – toasting bagel.
Distance from
Stove,
m (ft.)
M1
Exp. 1
TA (s)
M1
Exp. 2
TA (s)
M1
Exp. 3
TA (s)
M1
Exp. 4
TA (s)
M1
Exp. 5
TA (s)
M1
Exp. 6
TA (s)
M1
Alarm
Freq.
M2
Exp. 1
TA (s)
M2
Exp. 2
TA (s)
M2
Exp. 3
TA (s)
M2
Exp. 4
TA (s)
M2
Exp. 5
TA (s)
M2
Exp. 6
TA (s)
M2
Alarm
Freq.
1.82 (5.98) 0.00 214 219 0.67
1.87 (6.12) 0.00 212 206 0.67
2.96 (9.72) 0.00 0.00
3.33 (10.93) 0.00 0.00
4.50 (14.77) NA NA
5.39 (17.70) NA NA
6.01 (19.71) 0.00 0.00
6.94 (22.77) 0.00 0.00
Table 43. Intelligent alarm activation results – toasting bagel.
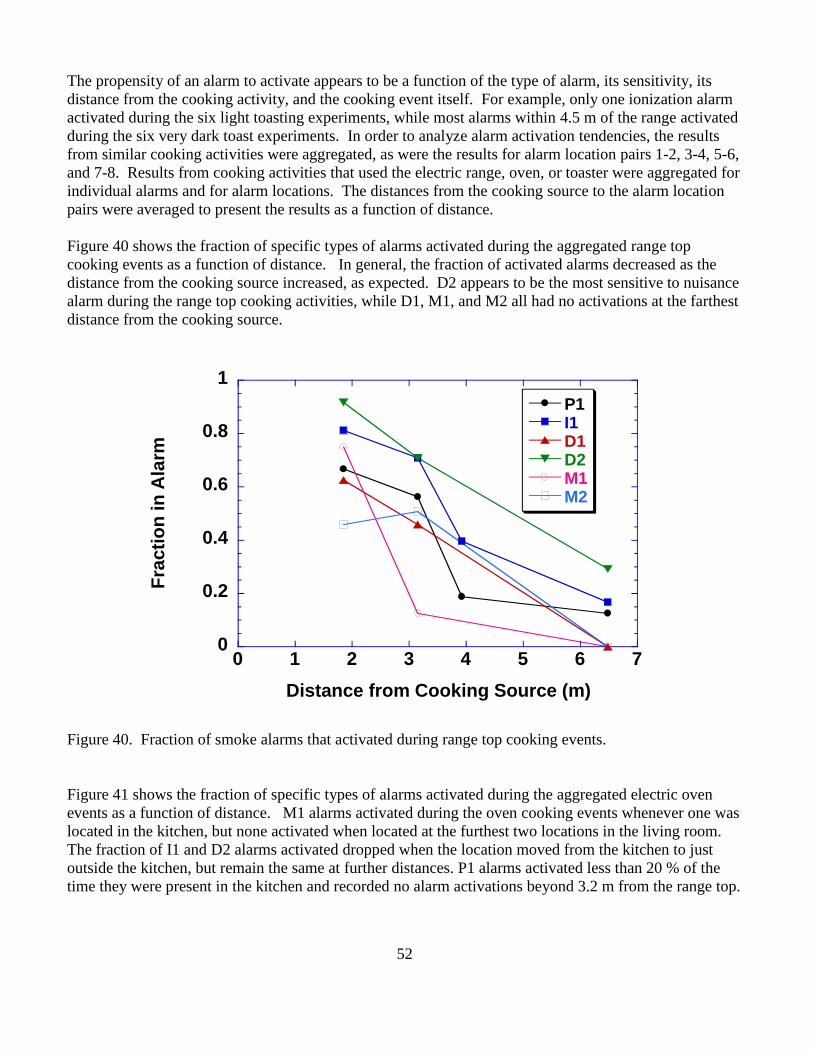
52
The propensity of an alarm to activate appears to be a function of the type of alarm, its sensitivity, its
distance from the cooking activity, and the cooking event itself. For example, only one ionization alarm
activated during the six light toasting experiments, while most alarms within 4.5 m of the range activated
during the six very dark toast experiments. In order to analyze alarm activation tendencies, the results
from similar cooking activities were aggregated, as were the results for alarm location pairs 1-2, 3-4, 5-6,
and 7-8. Results from cooking activities that used the electric range, oven, or toaster were aggregated for
individual alarms and for alarm locations. The distances from the cooking source to the alarm location
pairs were averaged to present the results as a function of distance.
Figure 40 shows the fraction of specific types of alarms activated during the aggregated range top
cooking events as a function of distance. In general, the fraction of activated alarms decreased as the
distance from the cooking source increased, as expected. D2 appears to be the most sensitive to nuisance
alarm during the range top cooking activities, while D1, M1, and M2 all had no activations at the farthest
distance from the cooking source.
0
0.2
0.4
0.6
0.8
1
0 1 2 3 4 5 6 7
P1I1D1D2M1M2
Fra
cti
on
in
Ala
rm
Distance from Cooking Source (m)
Figure 40. Fraction of smoke alarms that activated during range top cooking events.
Figure 41 shows the fraction of specific types of alarms activated during the aggregated electric oven
events as a function of distance. M1 alarms activated during the oven cooking events whenever one was
located in the kitchen, but none activated when located at the furthest two locations in the living room.
The fraction of I1 and D2 alarms activated dropped when the location moved from the kitchen to just
outside the kitchen, but remain the same at further distances. P1 alarms activated less than 20 % of the
time they were present in the kitchen and recorded no alarm activations beyond 3.2 m from the range top.

53
0
0.2
0.4
0.6
0.8
1
0 1 2 3 4 5 6 7
P1I1D1D2M1M2
Fra
cti
on
in
Ala
rm
Distance from Cooking Source (m)
Figure 41. Fraction of smoke alarms that activated during oven cooking events.
Figure 42 shows the fraction of specific types of alarms activated during the aggregated toasting events
as a function of distance. I1 and D2 activated over 75 % of the time they were present in the kitchen,
while P1 activated approximately 25 % of the time. The fraction of alarm activations dropped as the
distance from the cooking source increased for all alarm types.
While the frequency of nuisance alarms in actual usage depends on the frequency of the specific
exposure events, it is still illustrative to present an averaged nuisance alarm response to cooking events.
Instead of aggregating all cooking events, the fraction of alarms activated for the aggregated cooking
activities, electric range, oven, and toasting were averaged so that each activity represented one third of
all events. Figure 43 shows the alarm activation frequency for the three averaged cooking activities.
Inside the kitchen, P1 has the lowest activation frequency, while I1 and D2 are both above 80 %. The
alarm activation frequency drops as the distance from the range top increases. I1 and D2 exhibit higher
activation frequencies than the other four alarms P1, D1, M1, and M2. Outside the kitchen those four
alarm activation frequency values are similar at the different distances. These observations strengthen
the case to keep smoke alarms outside of kitchens if possible, and if necessary, consider photoelectric
type alarms. Outside the kitchen, the nuisance alarm performance of P1, D1, M1, and M2 is similar; they
all appear significantly better than I1 and D2.

54
0
0.2
0.4
0.6
0.8
1
0 1 2 3 4 5 6 7
P1I1D1D2M1M2
Fra
cti
on
in
Ala
rm
Distance from Cooking Source (m)
Figure 42. Fraction of smoke alarms that activated during toasting events.
0
0.2
0.4
0.6
0.8
1
0 1 2 3 4 5 6 7
P1 I1 D1 D2 M1 M2
Ala
rm A
cti
va
tio
n F
req
uen
cy
Distance from Cooking Source (m)
Figure 43. Alarm activation frequency for equal fractions of range top, oven and toasting activities.

55
3.4 Kitchen Fire Alarm Performance
A total of 10 fire tests were conducted, Table 44 identifies the configurations.
Test Name Cabinet Construction Ignition Scenario
A1_1 Oak/Pressboard 1
A1_2 Oak/Pressboard 1
A2_1 Oak/Pressboard 2
A2_2 Oak/Pressboard 2
B1_1 Laminated Pressboard 1
B1_2 Laminated Pressboard 1
B2_1 Laminated Pressboard 2
B2_2 Laminated Pressboard 2
A3_1 Oak/Pressboard, Sheet Metal Barrier 1
B3_1 Laminated Pressboard, Sheet Metal Barrier 1
Table 44. Configurations for kitchen fire tests.
For each test, up to 10 unused smoke alarms were installed on the ceiling of the burn prop building at
various locations. The locations of the different types of smoke alarms were also varied from test-to-test.
However, only photoelectric alarms were placed at Loc 1 and Loc 2 inside the kitchen to limit the
potential for thermal damage of the ionization sensors in the other alarms.
The time to alarm was recorded for every smoke alarm installed in each test. The tenability conditions
were assessed in the hallway, and the living room to determine if any given installed alarm provided
sufficient time for egress. The tenability was assessed by considering the smoke optical density (OD)
and the fractional effective dose (FED) of toxic gases or convected heat. The FED is a non-dimensional,
time-integrated value of the exposure effects to toxic gases or convected and radiated heat that would be
experienced by an occupant. The fractional effective dose (FED) calculation schemes are described in
the standard ISO/FDIS 13751 [15]. A FED of 1.0 is associated with 50 % of exposed persons
experiencing incapacitation and unable to effect escape. While the ISO standard does not include a FED
incapacitation distribution, a FED value of 0.3 has been promoted as an exposure level that assures most
occupants would not become incapacitated [15]. CO and CO2 gas concentrations, and air temperature
measurements at a height 1.5 m from the floor were used to calculate the toxic gas and convected heat
FEDs.
Results for each test are presented in the tables (Table 45-54) and figures (Figure 44-71) that follow.
Each table documents the time to alarm and alarm location for each alarm installed for a particular
experiment. If the table entry is blank, no alarm was recorded during the test. If the table entry is gray,
the particular alarm was not installed during that test. Next, a sequence of four images shows the fire
progression at ignition, 120 s, 240 s, and 360 s after ignition, followed by an end-of-test picture of the
cabinet for most tests. Lastly, the smoke optical density and the heat and toxic gases fractional effective
dose (gases and temperature) for each measurement location are presented. The Y axis is scaled to the
smoke optical density in m-1
and the toxic gas and heat FED which are dimensionless.

56
Distance from Stove,
m (ft.)
P1
Ta (s)
P2
Ta (s)
I1
Ta (s)
I2
Ta (s)
D1
Ta (s)
D2
Ta (s)
M1
Ta (s)
M2
Ta (s)
1.82 (5.98) 241 153
1.87 (6.12)
2.96 (9.72) 243 162 184
3.33 (10.93) 241 214 238
4.50 (14.77) 209 236
5.39 (17.70)
6.01 (19.71)
6.94 (22.77)
Table 45. Alarm times for experiment A1_1 (Oak/pressboard, scenario 1).
Figure 44. Photo sequence for experiment A1_1 (Oak/pressboard, scenario 1).
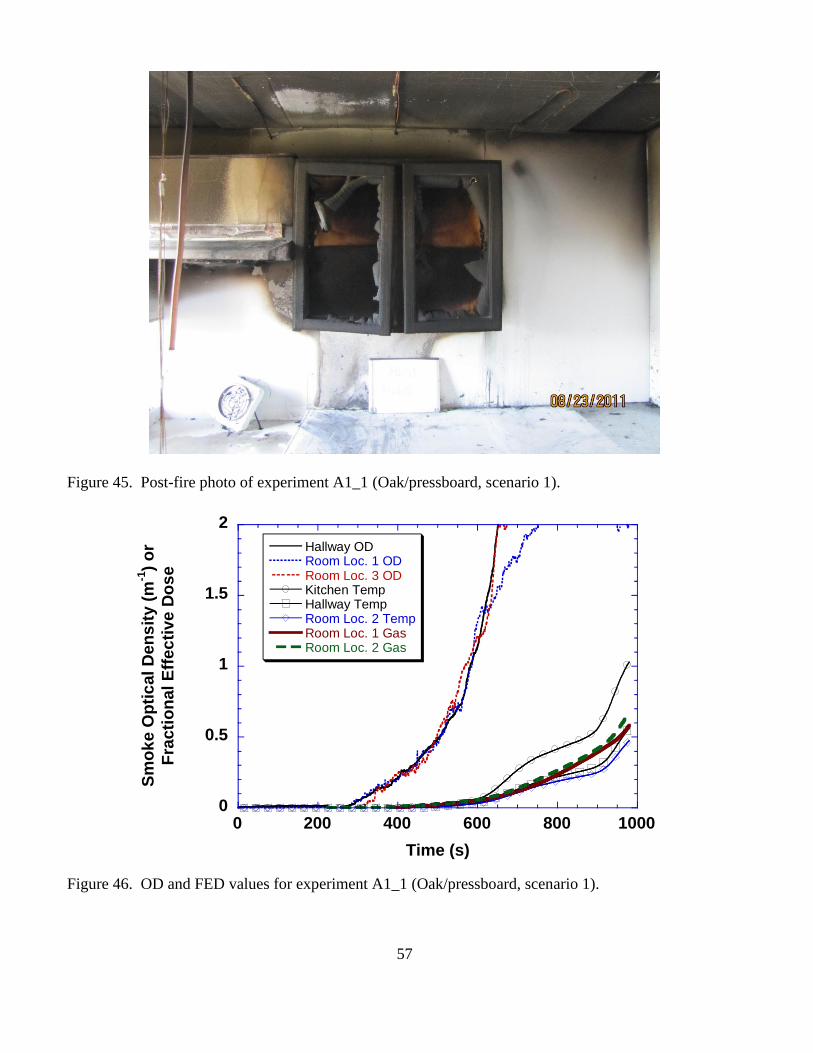
57
Figure 45. Post-fire photo of experiment A1_1 (Oak/pressboard, scenario 1).
0
0.5
1
1.5
2
0 200 400 600 800 1000
Hallway ODRoom Loc. 1 ODRoom Loc. 3 ODKitchen TempHallway TempRoom Loc. 2 TempRoom Loc. 1 GasRoom Loc. 2 Gas
Sm
ok
e O
pti
cal D
en
sit
y (
m-1
) o
r
Fra
cti
on
al E
ffec
tive D
os
e
Time (s)
Figure 46. OD and FED values for experiment A1_1 (Oak/pressboard, scenario 1).

58
Distance from Stove,
m (ft.)
P1
Ta (s)
P2
Ta (s)
I1
Ta (s)
I2
Ta (s)
D1
Ta (s)
D2
Ta (s)
M1
Ta (s)
M2
Ta (s)
1.82 (5.98)
1.87 (6.12) 117 121
2.96 (9.72) 133 127 129
3.33 (10.93)
4.50 (14.77)
5.39 (17.70)
6.01 (19.71)
6.94 (22.77) 247 222 248
Table 46. Alarm times for Experiment A1_2 (Oak/pressboard, scenario 1).
Figure 47. Photo sequence for experiment A1_2 (Oak/pressboard, scenario 1).
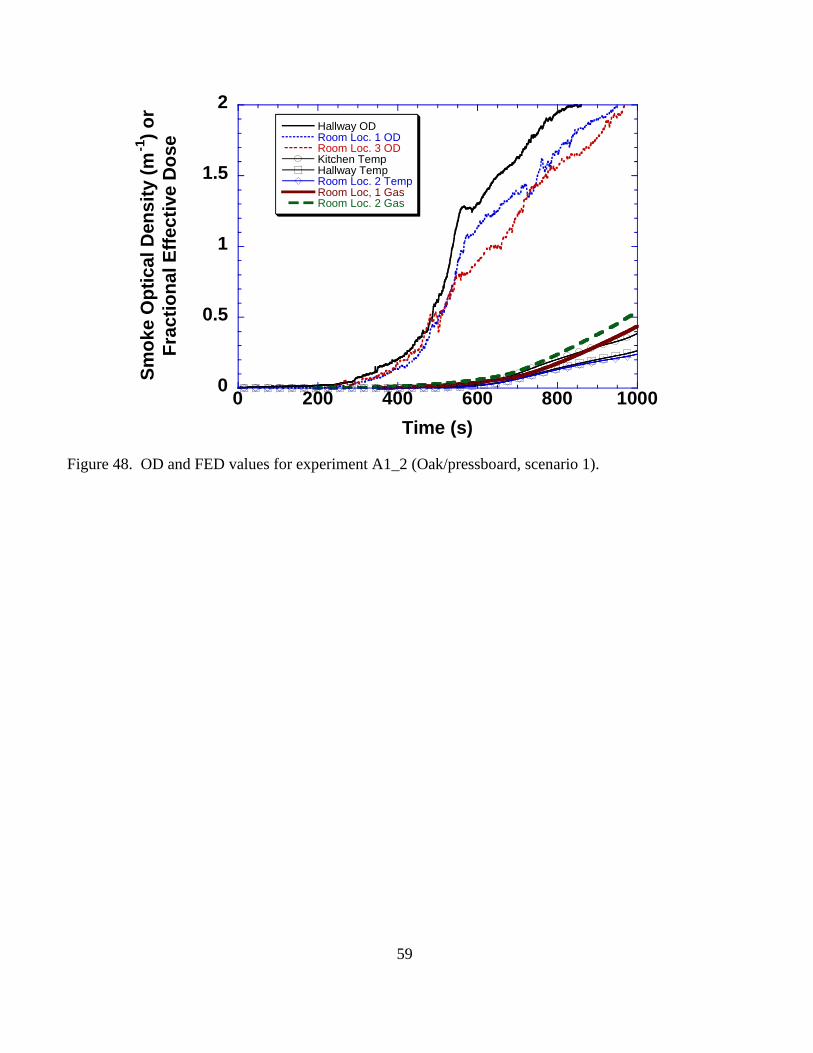
59
0
0.5
1
1.5
2
0 200 400 600 800 1000
Hallway ODRoom Loc. 1 ODRoom Loc. 3 ODKitchen TempHallway TempRoom Loc. 2 TempRoom Loc, 1 GasRoom Loc. 2 Gas
Sm
oke O
pti
ca
l D
en
sit
y (
m-1
) o
r
Fra
cti
on
al E
ffec
tive
Do
se
Time (s)
Figure 48. OD and FED values for experiment A1_2 (Oak/pressboard, scenario 1).

60
Distance from Stove,
m (ft.)
P1
Ta (s)
P2
Ta (s)
I1
Ta (s)
I2
Ta (s)
D1
Ta (s)
D2
Ta (s)
M1
Ta (s)
M2
Ta (s)
1.82 (5.98) 104 98
1.87 (6.12)
2.96 (9.72) 115 115 122
3.33 (10.93)
4.50 (14.77)
5.39 (17.70)
6.01 (19.71)
6.94 (22.77) 190 178 159
Table 47. Alarm times for Experiment A2_1 (Oak/pressboard, scenario 2).
Figure 49. Photo sequence for experiment A2_1 (Oak/pressboard, scenario 2).
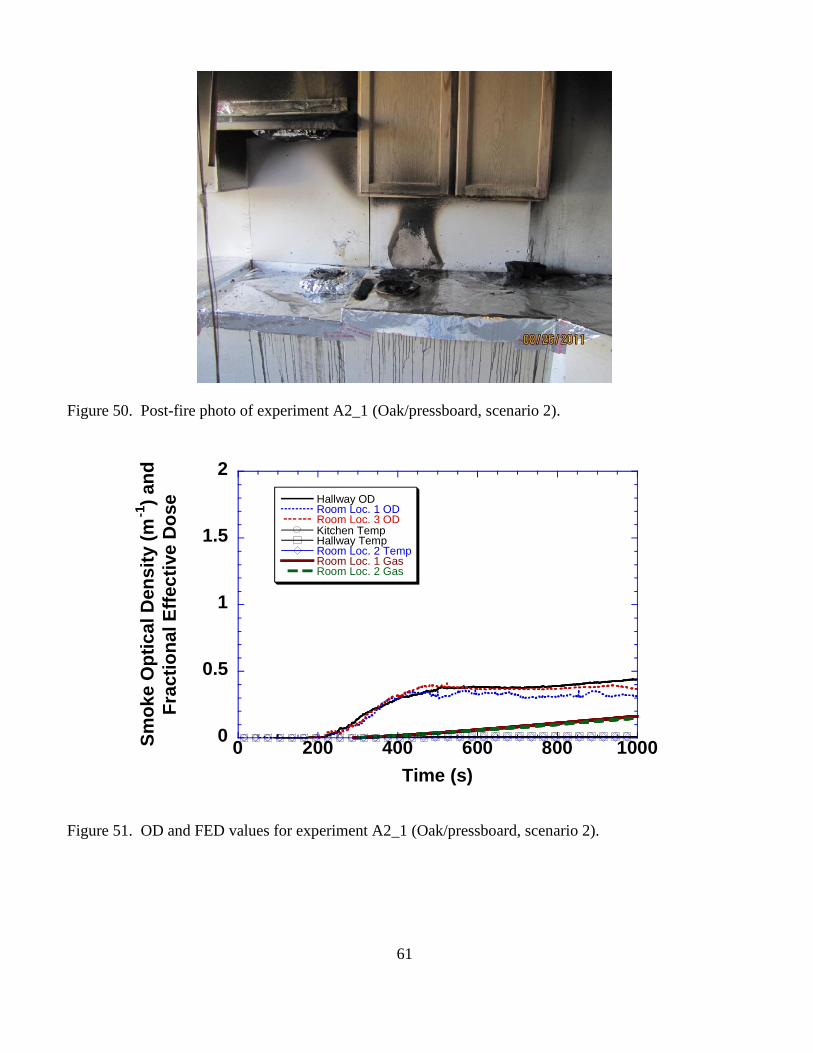
61
Figure 50. Post-fire photo of experiment A2_1 (Oak/pressboard, scenario 2).
0
0.5
1
1.5
2
0 200 400 600 800 1000
Hallway ODRoom Loc. 1 ODRoom Loc. 3 ODKitchen TempHallway TempRoom Loc. 2 TempRoom Loc. 1 GasRoom Loc. 2 Gas
Sm
ok
e O
pti
ca
l D
en
sit
y (
m-1
) an
d
Fra
cti
on
al E
ffec
tive
Do
se
Time (s)
Figure 51. OD and FED values for experiment A2_1 (Oak/pressboard, scenario 2).
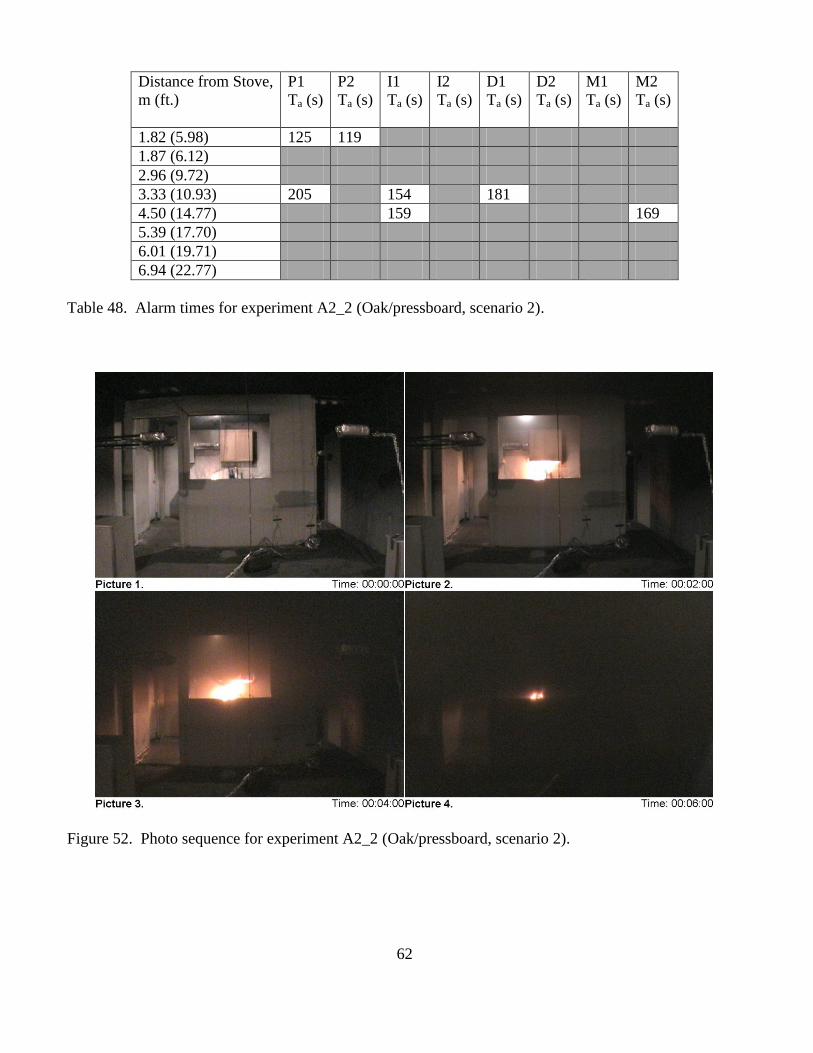
62
Distance from Stove,
m (ft.)
P1
Ta (s)
P2
Ta (s)
I1
Ta (s)
I2
Ta (s)
D1
Ta (s)
D2
Ta (s)
M1
Ta (s)
M2
Ta (s)
1.82 (5.98) 125 119
1.87 (6.12)
2.96 (9.72)
3.33 (10.93) 205 154 181
4.50 (14.77) 159 169
5.39 (17.70)
6.01 (19.71)
6.94 (22.77)
Table 48. Alarm times for experiment A2_2 (Oak/pressboard, scenario 2).
Figure 52. Photo sequence for experiment A2_2 (Oak/pressboard, scenario 2).
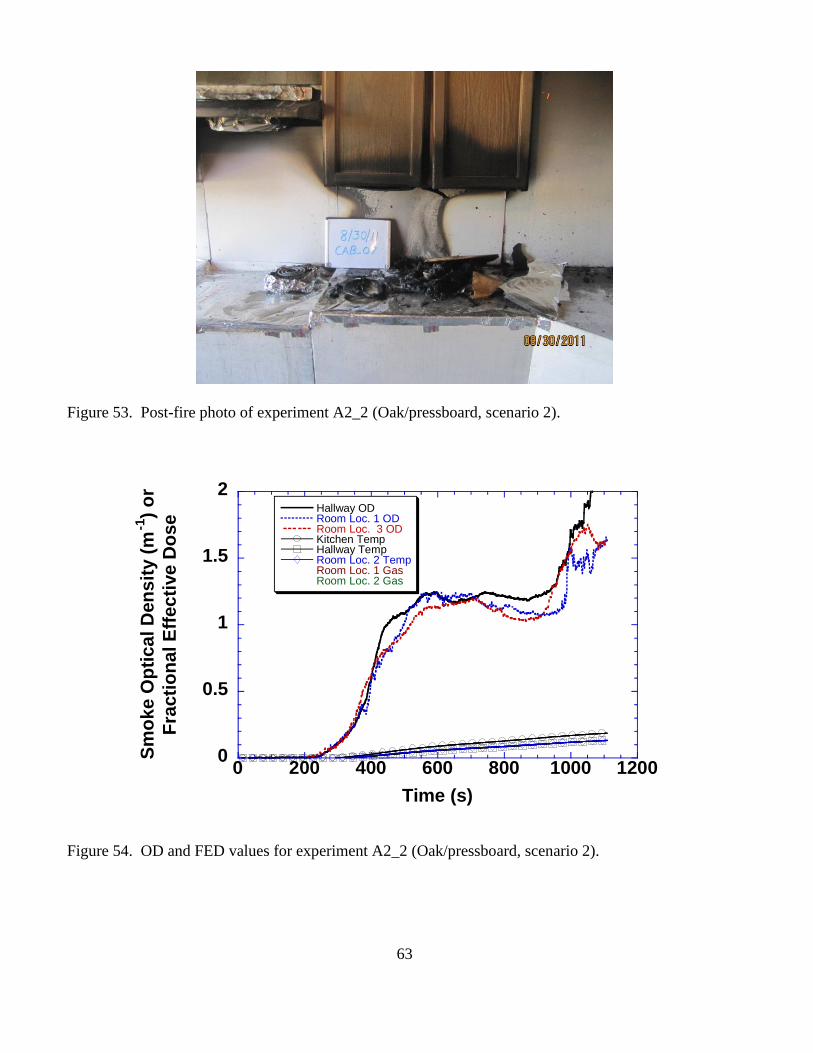
63
Figure 53. Post-fire photo of experiment A2_2 (Oak/pressboard, scenario 2).
0
0.5
1
1.5
2
0 200 400 600 800 1000 1200
Hallway ODRoom Loc. 1 ODRoom Loc. 3 ODKitchen TempHallway TempRoom Loc. 2 TempRoom Loc. 1 GasRoom Loc. 2 Gas
Sm
oke O
pti
ca
l D
en
sit
y (
m-1
) o
r
Fra
cti
on
al E
ffec
tive
Do
se
Time (s)
Figure 54. OD and FED values for experiment A2_2 (Oak/pressboard, scenario 2).

64
Distance from Stove,
m (ft.)
P1
Ta (s)
P2
Ta (s)
I1
Ta (s)
I2
Ta (s)
D1
Ta (s)
D2
Ta (s)
M1
Ta (s)
M2
Ta (s)
1.82 (5.98) 173 167
1.87 (6.12)
2.96 (9.72) 123 128 140
3.33 (10.93) 182 142 180
4.50 (14.77) 145 168
5.39 (17.70)
6.01 (19.71)
6.94 (22.77)
Table 49. Alarm times for Experiment B1_1 (Laminated pressboard, scenario 1).
Figure 55. Photo sequence for experiment B1_1 (Laminated pressboard, scenario 1).

65
Figure 56. Post-fire photo of experiment B1_1 (Laminated pressboard, scenario 1).
0
0.5
1
1.5
2
0 200 400 600 800 1000
Hallway ODRoom Loc. 1 ODRoom Loc.3 ODKitchen TempHallway TempRoom Loc. 2 TempRoom Loc. 1 GasRoom Loc. 2 Gas
Sm
oke O
pti
ca
l D
en
sit
y (
m-1
) o
r
Fra
cti
on
al E
ffec
tive
Do
se
Time (s)
Figure 57. OD and FED values for experiment B1_1 (Laminated pressboard, scenario 1).
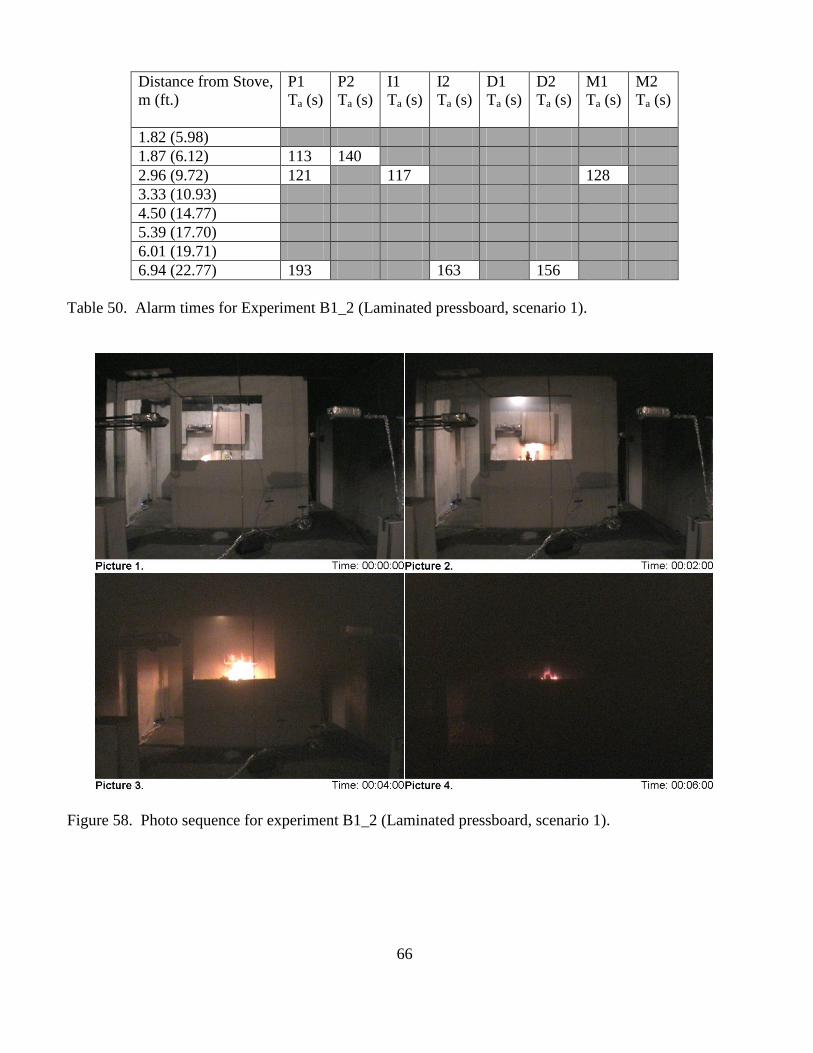
66
Distance from Stove,
m (ft.)
P1
Ta (s)
P2
Ta (s)
I1
Ta (s)
I2
Ta (s)
D1
Ta (s)
D2
Ta (s)
M1
Ta (s)
M2
Ta (s)
1.82 (5.98)
1.87 (6.12) 113 140
2.96 (9.72) 121 117 128
3.33 (10.93)
4.50 (14.77)
5.39 (17.70)
6.01 (19.71)
6.94 (22.77) 193 163 156
Table 50. Alarm times for Experiment B1_2 (Laminated pressboard, scenario 1).
Figure 58. Photo sequence for experiment B1_2 (Laminated pressboard, scenario 1).

67
Figure 59. Post-fire photo of experiment B1_2 (Laminated pressboard, scenario 1).
0
0.5
1
1.5
2
0 200 400 600 800 1000
Hallway ODRoom Loc. 1 ODRoom Loc. 3 ODKitchen TempHallway TempRoom Loc. 2 TempRoom Loc. 1 GasRoom Loc. 2 Gas
Sm
oke O
pti
ca
l D
en
sit
y (
m-1
) o
r
Fra
cti
on
al E
ffec
tive
Do
se
Time (s)
Figure 60. OD and FED values for experiment B1_2 (Laminated pressboard, scenario 1).
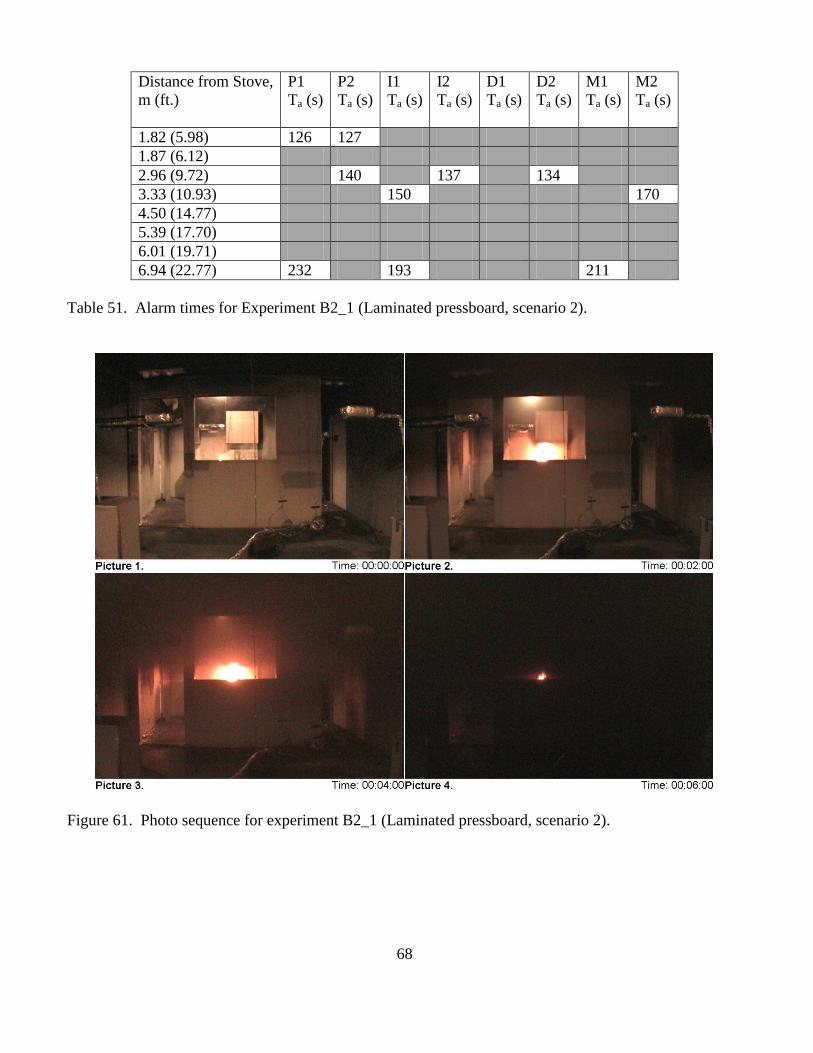
68
Distance from Stove,
m (ft.)
P1
Ta (s)
P2
Ta (s)
I1
Ta (s)
I2
Ta (s)
D1
Ta (s)
D2
Ta (s)
M1
Ta (s)
M2
Ta (s)
1.82 (5.98) 126 127
1.87 (6.12)
2.96 (9.72) 140 137 134
3.33 (10.93) 150 170
4.50 (14.77)
5.39 (17.70)
6.01 (19.71)
6.94 (22.77) 232 193 211
Table 51. Alarm times for Experiment B2_1 (Laminated pressboard, scenario 2).
Figure 61. Photo sequence for experiment B2_1 (Laminated pressboard, scenario 2).
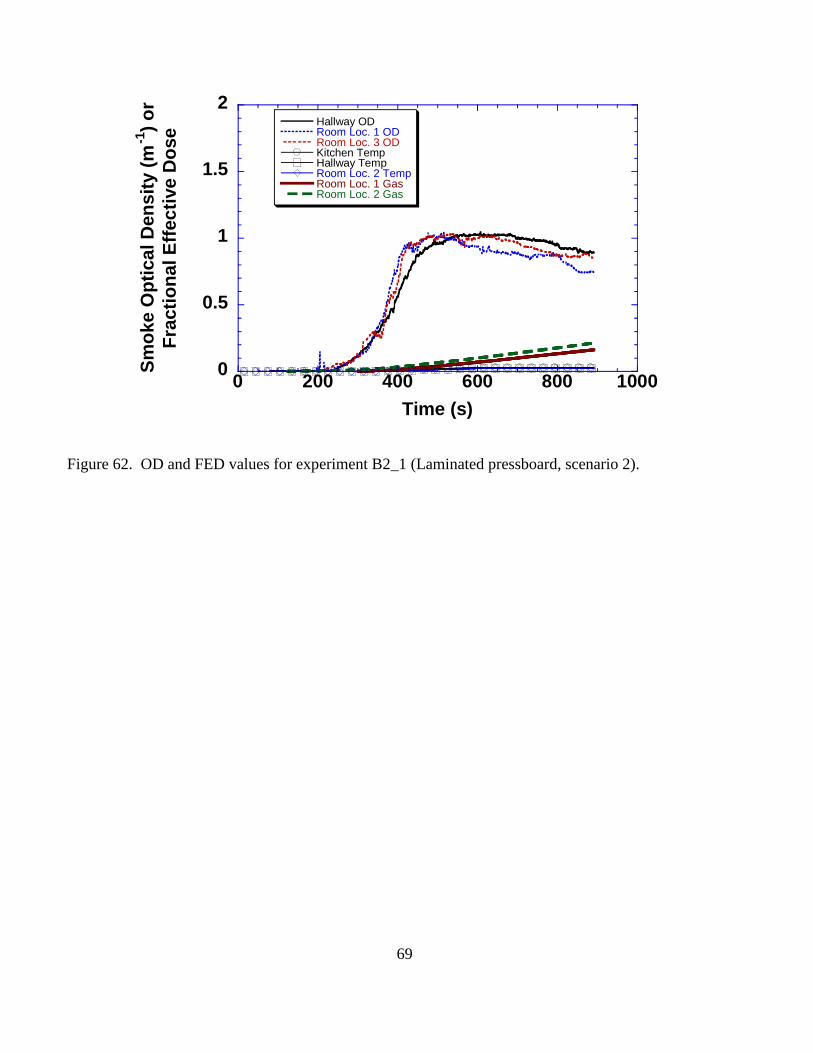
69
0
0.5
1
1.5
2
0 200 400 600 800 1000
Hallway ODRoom Loc. 1 ODRoom Loc. 3 ODKitchen TempHallway TempRoom Loc. 2 TempRoom Loc. 1 GasRoom Loc. 2 Gas
Sm
oke O
pti
ca
l D
en
sit
y (
m-1
) o
r
Fra
cti
on
al E
ffec
tive
Do
se
Time (s)
Figure 62. OD and FED values for experiment B2_1 (Laminated pressboard, scenario 2).

70
Distance from Stove,
m (ft.)
P1
Ta (s)
P2
Ta (s)
I1
Ta (s)
I2
Ta (s)
D1
Ta (s)
D2
Ta (s)
M1
Ta (s)
M2
Ta (s)
1.82 (5.98)
1.87 (6.12) 147 161
2.96 (9.72) 117
3.33 (10.93) 149
4.50 (14.77) 139 145
5.39 (17.70)
6.01 (19.71)
6.94 (22.77) 221
Table 52. Alarm times for Experiment B2_2 (Laminated pressboard, scenario 2).
Figure 63. Photo sequence for experiment B2_2 (Laminated pressboard, scenario 2).
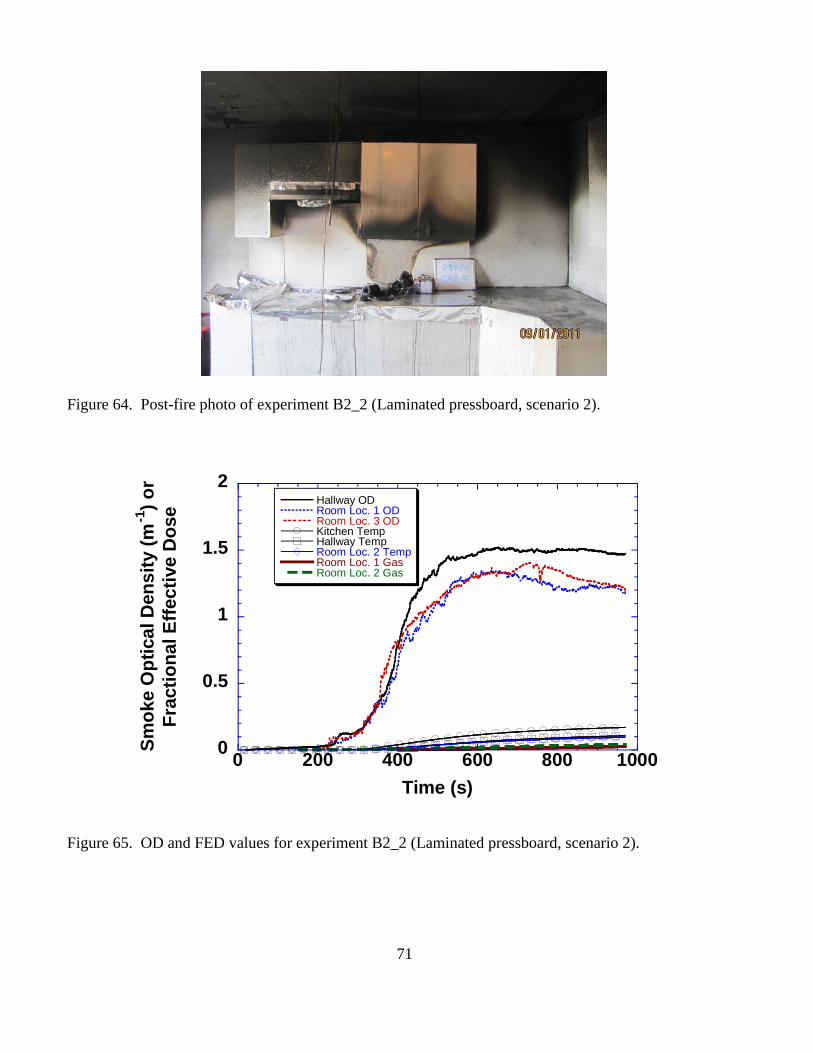
71
Figure 64. Post-fire photo of experiment B2_2 (Laminated pressboard, scenario 2).
0
0.5
1
1.5
2
0 200 400 600 800 1000
Hallway ODRoom Loc. 1 ODRoom Loc. 3 ODKitchen TempHallway TempRoom Loc. 2 TempRoom Loc. 1 GasRoom Loc. 2 Gas
Sm
oke O
pti
ca
l D
en
sit
y (
m-1
) o
r
Fra
cti
on
al E
ffec
tive
Do
se
Time (s)
Figure 65. OD and FED values for experiment B2_2 (Laminated pressboard, scenario 2).

72
Distance from Stove,
m (ft.)
P1
Ta (s)
P2
Ta (s)
I1
Ta (s)
I2
Ta (s)
D1
Ta (s)
D2
Ta (s)
M1
Ta (s)
M2
Ta (s)
1.82 (5.98)
1.87 (6.12) 121 130
2.96 (9.72) 127 125 133
3.33 (10.93)
4.50 (14.77)
5.39 (17.70)
6.01 (19.71)
6.94 (22.77) 219 203 213
Table 53. Alarm times for Experiment A3_1 (Oak/pressboard with sheet metal barrier, scenario 1).
Figure 66. Photo sequence for experiment A3_1 (Oak/pressboard with sheet metal barrier, scenario 1).

73
Figure 67. Post-fire photo of experiment A3_1 (Oak/pressboard with sheet metal barrier, scenario 1).
0
0.5
1
1.5
2
0 200 400 600 800 1000
Hallway ODRoom Loc. 1 ODRoom Loc. 3 ODKitchen TempHallway TempRoom Loc. 2 TempRoom Loc. 1 GasRoom Loc. 2 Gas
Sm
oke O
pti
ca
l D
en
sit
y (
m-1
) o
r
Fra
cti
on
al E
ffec
tive
Do
se
Time (s)
Figure 68. OD and FED values for experiment A3_1 (Oak/pressboard with sheet metal barrier, scenario
1).
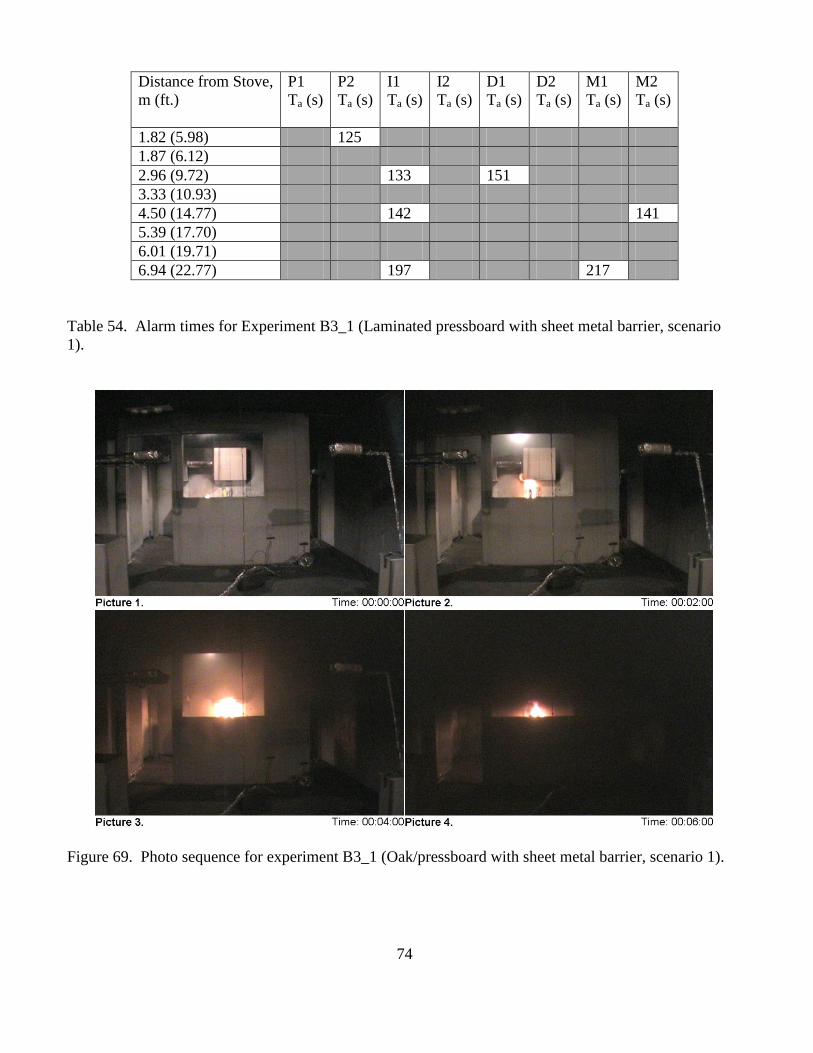
74
Distance from Stove,
m (ft.)
P1
Ta (s)
P2
Ta (s)
I1
Ta (s)
I2
Ta (s)
D1
Ta (s)
D2
Ta (s)
M1
Ta (s)
M2
Ta (s)
1.82 (5.98) 125
1.87 (6.12)
2.96 (9.72) 133 151
3.33 (10.93)
4.50 (14.77) 142 141
5.39 (17.70)
6.01 (19.71)
6.94 (22.77) 197 217
Table 54. Alarm times for Experiment B3_1 (Laminated pressboard with sheet metal barrier, scenario
1).
Figure 69. Photo sequence for experiment B3_1 (Oak/pressboard with sheet metal barrier, scenario 1).

75
Figure 70. Pre-fire photo of experiment B3_1 (Oak/pressboard with sheet metal barrier, scenario 1).
0
0.5
1
1.5
2
0 200 400 600 800 1000
Hallway ODRoom Loc. 1 ODRoom Loc. 3 ODKitchen TempHallway TempRoom Loc. 2 TempRoom Loc. 1 GasRoom Loc. 2 Gas
Sm
ok
e O
pti
ca
l D
en
sit
y (
m-1
) o
r
Fra
cti
on
al E
ffec
tive
Do
se
Time (s)
Figure 71. OD and FED values for experiment B3_1 (Oak/pressboard with sheet metal barrier, scenario
1).
Every installed smoke alarm activated during the 10 experiments. Typically, a photoelectric alarm in the
kitchen was the first to activate, and all smoke alarms activated within about 100 s of the first alarm
activation. Since the early stage of fire growth was similar for the two ignition scenarios, similarity in
alarm time range for all 10 experiments is not surprising.
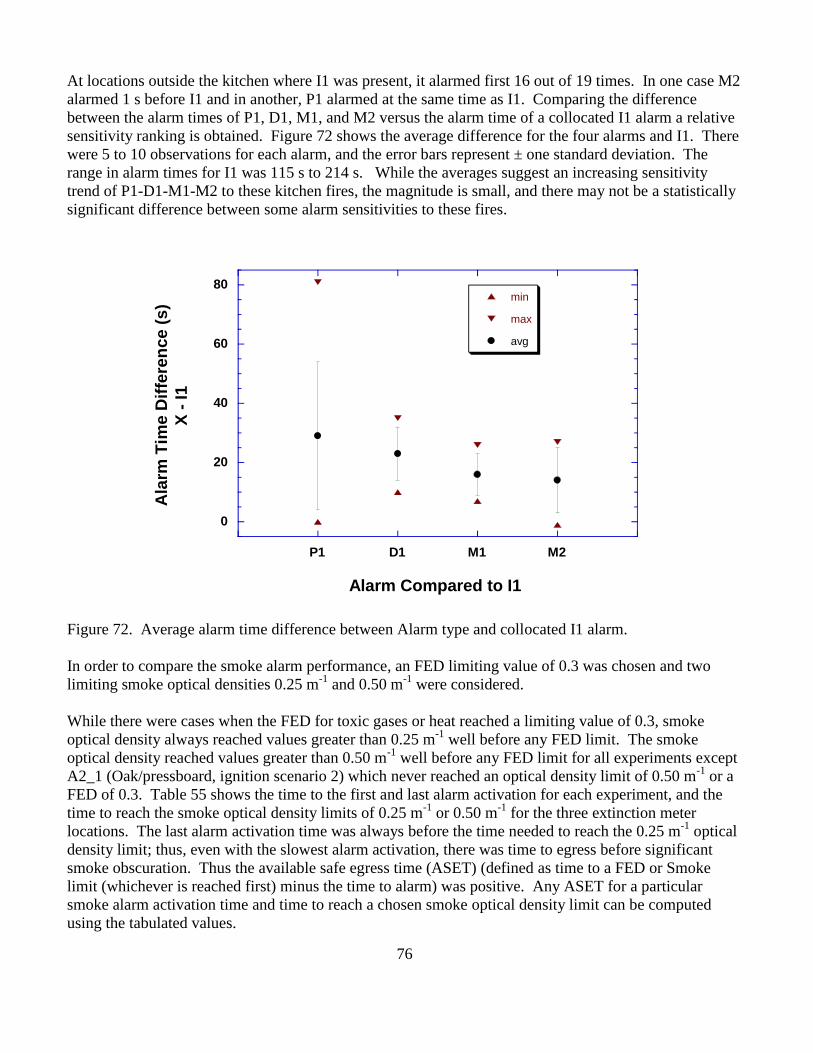
76
At locations outside the kitchen where I1 was present, it alarmed first 16 out of 19 times. In one case M2
alarmed 1 s before I1 and in another, P1 alarmed at the same time as I1. Comparing the difference
between the alarm times of P1, D1, M1, and M2 versus the alarm time of a collocated I1 alarm a relative
sensitivity ranking is obtained. Figure 72 shows the average difference for the four alarms and I1. There
were 5 to 10 observations for each alarm, and the error bars represent ± one standard deviation. The
range in alarm times for I1 was 115 s to 214 s. While the averages suggest an increasing sensitivity
trend of P1-D1-M1-M2 to these kitchen fires, the magnitude is small, and there may not be a statistically
significant difference between some alarm sensitivities to these fires.
0
20
40
60
80
P1 D1 M1 M2
min
max
avg
Ala
rm T
ime D
iffe
ren
ce (
s)
X -
I1
Alarm Compared to I1
Figure 72. Average alarm time difference between Alarm type and collocated I1 alarm.
In order to compare the smoke alarm performance, an FED limiting value of 0.3 was chosen and two
limiting smoke optical densities 0.25 m-1
and 0.50 m-1
were considered.
While there were cases when the FED for toxic gases or heat reached a limiting value of 0.3, smoke
optical density always reached values greater than 0.25 m-1
well before any FED limit. The smoke
optical density reached values greater than 0.50 m-1
well before any FED limit for all experiments except
A2_1 (Oak/pressboard, ignition scenario 2) which never reached an optical density limit of 0.50 m-1
or a
FED of 0.3. Table 55 shows the time to the first and last alarm activation for each experiment, and the
time to reach the smoke optical density limits of 0.25 m-1
or 0.50 m-1
for the three extinction meter
locations. The last alarm activation time was always before the time needed to reach the 0.25 m-1
optical
density limit; thus, even with the slowest alarm activation, there was time to egress before significant
smoke obscuration. Thus the available safe egress time (ASET) (defined as time to a FED or Smoke
limit (whichever is reached first) minus the time to alarm) was positive. Any ASET for a particular
smoke alarm activation time and time to reach a chosen smoke optical density limit can be computed
using the tabulated values.

77
Test First
Alarm
(s)
Last
Alarm
(s)
Time to Smoke OD
Hallway
Time to Smoke OD
Room Loc. 1
Time to Smoke OD
Room Loc. 3
0.25 m-1
0.50 m-1
0.25 m-1
0.50 m-1
0.25 m-1
0.50m-1
A1_1 153 243 408 506 419 504 402 498
A1_2 117 248 423 486 455 502 433 480
A2_1 98 190 368 - 360 - 358 -
A2_2 119 205 348 390 349 396 340 375
B1_1 123 182 395 429 380 430 384 453
B1_2 113 193 351 399 342 390 353 391
B2_1 127 232 339 392 335 371 327 373
B2_2 117 221 330 380 332 376 324 357
A3_1 121 219 403 461 395 471 396 462
B3_1 125 217 371 424 369 400 350 424
Table 55. Tabulated first and last alarm activation time and time to reach threshold smoke optical
densities.
Figure 73 shows ASET comparisons for four different cases, the difference between the time to reach an
optical density limit of either 0.25 m-1
or 0.50 m-1
first in either the room or hallway locations and either
the first or last alarm activation time. Thus, the shortest ASET was computed by using the last alarm
activation time and the time to reach an optical density limit of 0.25 m-1
and the longest ASET was
computed by using the first alarm activation time and the time to reach the optical density limit of 0.50
m-1
.
0
50
100
150
200
250
300
350
400
0.25-Last 0.50-Last 0.25-First 0.50-First
Shortest ASET of all TestsAverage ASET of all TestsLongest ASET of all Tests
Avail
ab
le S
afe
Eg
res
s T
ime
(s)
Time to Reach OD Limit (m-1
) - Alarm Activation Time
Figure 73. ASET computed using first or last alarm activation and time to reach 0.25 m
-1 or 0.50 m
-1

78
optical density limit.
The difference between the average ASET using alarm times from the first and last smoke alarms to
activate was approximately 100 s for both optical density limits. Comparing the results for the shortest
ASET computed for each experiment (that is, the last smoke alarm to activate and an optical density limit
of 0.25 m-1
), it varied from 95 s to 198 s with an average value of 150 s for all ten experiments. Only
three computed ASET values were less than 120 s, two P1 alarms and one M1 alarm located at the
furthest distance from the kitchen. While all of the smoke alarm provided ASET values greater than 94 s
or 135 s given an optical density limit of 0.25 m-1
or 0.50 m-1
, the results do reflect the need to place
smoke alarms in central locations in order to adequately detect all fires in the protected space.
79
4 Conclusions
The data collected provides insight into the fire growth and hazard development of kitchen fires,
susceptibility of smoke alarms to cooking nuisance sources, and smoke alarm performance in kitchen
fires. It is important to note that the overall performance of smoke alarms in residential settings is not
limited to kitchen fire detection, but includes a range of fire scenarios. There is a fairly extensive body of
research documenting alarm performance on a wide variety of fire scenarios that must be considered in
order to assess overall alarm performance. Specifically, the performance of M1 and M2 (the multi-
sensor, intelligent alarms) to a range of fire scenarios including smoldering fires, has not been
documented.
Several conclusions can be drawn from the experimental results. From the kitchen fire scenario heat
release rate measurements, the following conclusions are drawn.
1. Combustible materials typically found on a countertop can spread flames to overhead cabinets.
2. A single cabinet can produce a peak heat release rate nearly sufficient to flashover a small room.
3. A protective barrier on the bottom and side facing the range may limit the spread of flames to the
cabinet and tends to reduce the heat release rate.
From the kitchen nuisance alarm tests the following conclusions are drawn.
1. For the conditions studied here, the propensity to nuisance alarm decreased as the distance from
the cooking source increased.
2. Alarms (ionization alarm I1 and dual sensor alarm D2) that rely on sensitive ionization chambers
experienced significantly more nuisance alarm activations for cooking activities and locations
tested in this study.
3. All alarms except I1 and D2 experienced about the same nuisance alarm frequency for the
locations outside the kitchen for the cooking scenarios tested.
From the kitchen fire tests the following conclusions are drawn.
1. Smoke optical densities always reached values greater than 0.25 m-1
well before the fractional
equivalent dosage (FED) limit obtained a value of 0.3 in all the kitchen fires studied here.
2. All smoke alarms responded before hazardous conditions developed for the scenarios tested here;
the I1 alarm tended to respond first at a given location.
3. Some smoke alarms placed at the furthest location from the kitchen (6 m) did not provide
adequate available safe egress times (ASET) for the fire scenarios tested here, where adequate
ASET times were defined in terms of an optical density limit of 0.25 m-1
.
The location requirements specified in the NFPA 72 Code appear to reduce potential nuisance alarm
problems, but do not guarantee that nuisance alarms would be not problematic in all situations. The 2013
edition of the National Fire Alarm and Signaling Code has included language requiring smoke alarms
and smoke detectors used in household fire alarm systems installed near cooking appliances be listed for
resistance to common nuisance sources from cooking by 2016. Research at NIST and elsewhere is being
conducted to develop specific tests (including cooking sources) for nuisance resistant alarms tailored to
remove the most egregious alarms with the goal of improving smoke alarm nuisance resistance
performance.

80
5 References
1. Karter, M.J., “Fire Loss in the United States 2008,” National Fire Protection Association, Quincy,
MA., September, 2009.
2. Ahrens, M., “Home Smoke Alarms – The Data as Context for Decision,” Fire Technology,
January 2008, DOI: 10.1007/s10694-008-0045-9.
3. Ahrens, M., “Smoke Alarms in US Home Fires,” National Fire Protection Association, Quincy,
MA., September, 2011.
4. Rowland D.,et al. (2002) Prevalence of working smoke alarms in local authority inner
city housing: randomized controlled trial. BMJ, 325, 998-1001.
5. Mueller, B.A., Sidman, E.A., Alter, H., Perkins, R., and Grossman, D.C., (2008) Randomized
Controlled Trial of Ionization and Photoelectric Smoke Alarm Functionality, Inj Prev
2008;14:80–86. doi:10.1136/ip.2007.016725
6. Yang, J., Jones, M.P., Cheng, G., Ramirez, M., Taylor, C., Peek-Asa, C., (2011) Do Nuisance
Alarms Decrease Functionality of Smoke alarms Near the Kitchen? Findings from a Randomized
Controlled Study, Inj Prev doi:10.1136/ip.2010.027805
7. Ahrens, M., “Home Fires Involving Cooking Equipment,” National Fire Protection Association,
Quincy, MA., November, 2011.
8. R. W. Bukowski, R. D. Peacock, J. D. Averill, T. G. Cleary, N. P. Bryner, W. D. Walton, P. A.
Reneke, and E. D. Kuligowski, NIST Technical Note 1455, Performance of Home Smoke Alarms:
Analysis of the Response of Several Available Technologies in Residential Fire Settings,
Washington, DC: U.S. Department of Commerce, National Institute of Standards and
Technology, 2008 revision.
9. Mealy, C., Wolfe, A., and Gottuk, D., “Smoke Alarm Response and Tenability,” AUBE 09, 14th
International Conf. on Automatic Fire Detection, Duisburg Germany, Sept 8-10, 2009.
10. Lee, A., and Pineda D., “Smoke Alarms – Pilot Study of Nuisance Alarms Associated with
Cooking,” US Consumer Products Safety Commission, Bethesda, MD, March 2010.
11. NFPA 72, National Fire Alarm and Signaling Code, 2010 Edition, NFPA, Quincy MA.
12. UL 217 Single and Multiple Station Smoke Alarms, Underwriters Laboratories, Northbrook IL.
13. Bryant, R., Ohlemiller, T., Johnsson, E., Hamins, A., Grove, B., Guthrie, W.F., Maringhides,
A.and Mulholland, G., The NIST 3 Megawatt Quantitative Heat Release Rate Facility, NIST
Special Publication 1007, National Institute of Standards and Technology. Gaithersburg,
MD, December 2003.
14. Cleary, T., “Characterization of Residential Nuisance Sources,” NIST Technical Note in
preparation.
15. ISO/FDIS 13751, “Life-threatening components of fire – Guidelines for the estimation of time
available for escape using fire data,” 2007


![Estimating Smoke Alarm Effectiveness and Spatial Distribution in … · 100 fires) as it was in home fires with this protection (0.53 deaths per 100 fires).” Runyan et al. [5] studied](https://img.pdfslide.us/doc/110x75/5fb2f29401d53c73ce2b6d8c/estimating-smoke-alarm-effectiveness-and-spatial-distribution-in-100-fires-as-it.jpg)