Embed Size (px)
Citation preview
Topical Fire Report Series
National Fire Data Center16825 S. Seton Ave.Emmitsburg, MD 21727https://www.usfa.fema.gov/data/statistics/
July 2018 | Volume 19, Issue 4
Hotel and Motel Fires (2014-2016)
These topical reports are designed to explore facets of the U.S. fire problem as depicted through data collected in the U.S. Fire Administration’s National Fire Incident Reporting System. Each topical report brief ly addresses the nature of the specific fire or fire-related topic, highlights important findings from the data, and may suggest other resources to consider for further information. Also included are recent examples of fire incidents that demonstrate some of the issues addressed in the report or that put the report topic in context.
Findingsĵ Each year, from 2014 to 2016, an estimated 3,900 hotel and motel fires were
reported to fire departments within the United States. These fires caused an estimated 15 deaths, 100 injuries, and $100 million in property losses.
ĵ Of all residential building fires, only 1 percent were hotel and motel fires. More than half (56 percent) of hotel and motel fires were small, confined fires.
ĵ Hotel and motel fires occurred mainly in the evening hours, peaking from 6 to 9 p.m. (19 percent).
ĵ Cooking was the leading cause of hotel and motel fires (55 percent). Almost all hotel and motel cooking fires were small, confined fires (95 percent).
ĵ In 22 percent of nonconfined hotel and motel fires, the fires extended beyond the room of origin. The leading causes of these larger fires were open flames (13 percent), electrical malfunctions (13 percent), and other unintentional or careless actions (13 percent). In contrast, 50 percent of all nonconfined fires in all other residential buildings extended beyond the room of origin.
ĵ Bedrooms were the primary area of fire origin of nonconfined hotel and motel fires (21 percent). When confined cooking fires were considered, the kitchen or other cooking areas were the most prevalent areas of fire origin of all hotel and motel fires.
ĵ The leading reported factor contributing to ignition of nonconfined hotel and motel fires was misuse of material or product (40 percent).
ĵ Smoke alarms were not present in 10 percent of nonconfined fires in occupied hotels and motels. Additionally, automatic extinguishing systems (AESs) were not present in 45 percent of reported nonconfined fires in occupied hotels and motels.
In 1980, the National Fire Protection Association (NFPA) estimated that 12,200 fires occurred in hotels and motels. The estimated numbers of fires in hotels and motels has sharply declined since then. Deaths and injuries resulting from these fires has also declined.1 Today, the U.S. Fire Administration (USFA) estimates that 3,900 hotel and motel fires occur annually in the United States. What changed in the intervening years?
On Dec. 7, 1946, fire broke out in the Winecoff Hotel in Atlanta, Georgia. The early morning fire spread quickly through the building, trapping many people in the upper floors. With only one exit stairway (that, unfortunately, provided a conduit for the fire as many of its doors had been propped open) and no fire sprinkler system, the 119 fatalities from this fire made it the deadliest hotel fire in U.S. history, and prompted many changes in building codes.2
Three decades later, the lodging industry experienced a series of catastrophic fires that provided yet another call to action. In a six-year period, 190 people died and 1,000 were injured in hotel fires. On Nov. 21, 1980, an early morning fire at the MGM Grand Hotel in Las Vegas, Nevada, killed 85 occupants and injured over 650.3 Three months later, on Feb. 10, 1981, eight people died and nearly 200 were injured in an evening fire at the Las Vegas Hilton Hotel.4 Then, on Dec. 31, 1986, an afternoon fire at the Dupont Plaza Hotel and Casino in San Juan, Puerto Rico, resulted in 97 fatalities and 150 injuries.5
TFRS Volume 19, Issue 4 | Hotel and Motel Fires (2014-2016)
2
Investigations into these three fires revealed that smoke alarms and sprinkler systems could have mitigated the losses and, in many instances, prevented deaths and injuries, had the systems been in place. As a result, in the years that followed, substantial code changes requiring smoke alarms and AESs in hotels and motels were adopted and implemented, and the lodging industry redefined what “fire-safe” meant in their industry.
While fires and fire losses still occur in hotels and motels, these changes were largely successful in reducing hotel and motel fires and losses. Each year, from 2014 to 2016, an estimated 3,900 hotel and motel fires, a subset of residential building fires, accounted for only 1 percent of the residential building fires responded to by fire departments across the nation.6,7 These fires resulted in an annual average of 15 deaths, 100 injuries, and $100 million in property losses.
This report addresses the characteristics of hotel and motel fires, as reported to the National Fire Incident Reporting System (NFIRS). The focus is on fires reported from 2014 to 2016, the most recent data available at the time of the analysis.8 NFIRS data is used for the analyses throughout this report.
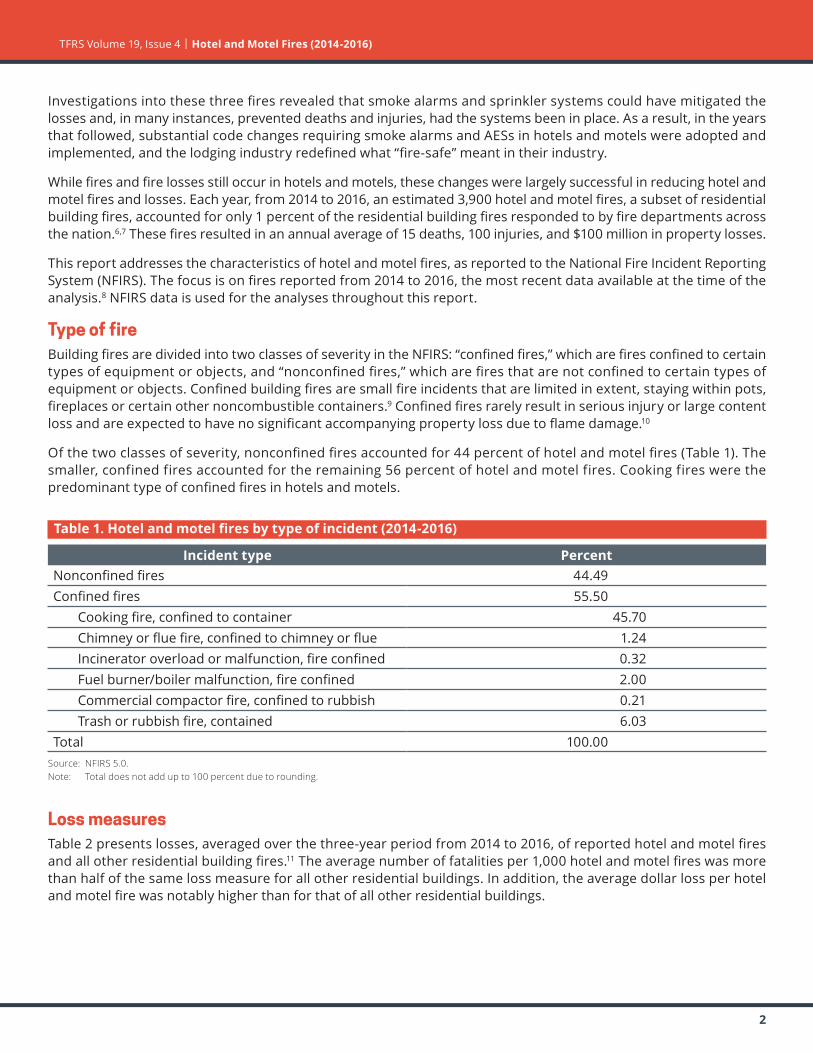
Type of fireBuilding fires are divided into two classes of severity in the NFIRS: “confined fires,” which are fires confined to certain types of equipment or objects, and “nonconfined fires,” which are fires that are not confined to certain types of equipment or objects. Confined building fires are small fire incidents that are limited in extent, staying within pots, fireplaces or certain other noncombustible containers.9 Confined fires rarely result in serious injury or large content loss and are expected to have no significant accompanying property loss due to flame damage.10
Of the two classes of severity, nonconfined fires accounted for 44 percent of hotel and motel fires (Table 1). The smaller, confined fires accounted for the remaining 56 percent of hotel and motel fires. Cooking fires were the predominant type of confined fires in hotels and motels.
Table 1. Hotel and motel fires by type of incident (2014-2016)
Incident type PercentNonconfined fires 44.49Confined fires 55.50
Cooking fire, confined to container 45.70Chimney or flue fire, confined to chimney or flue 1.24Incinerator overload or malfunction, fire confined 0.32Fuel burner/boiler malfunction, fire confined 2.00Commercial compactor fire, confined to rubbish 0.21Trash or rubbish fire, contained 6.03
Total 100.00Source: NFIRS 5.0.Note: Total does not add up to 100 percent due to rounding.
Loss measuresTable 2 presents losses, averaged over the three-year period from 2014 to 2016, of reported hotel and motel fires and all other residential building fires.11 The average number of fatalities per 1,000 hotel and motel fires was more than half of the same loss measure for all other residential buildings. In addition, the average dollar loss per hotel and motel fire was notably higher than for that of all other residential buildings.
TFRS Volume 19, Issue 4 | Hotel and Motel Fires (2014-2016)
3
Table 2. Loss measures for hotel and motel fires (three-year average, 2014-2016)
Measure Hotel and motel fires
Confined hotel and motel fires
Nonconfined hotel and motel fires
Residential building fires
(excluding hotel and motel fires)
Average loss:Fatalities/1,000 fires 3.2 0.0 7.1 5.8Injuries/1,000 fires 24.0 4.6 48.2 25.6Dollar loss/fire $25,090 $250 $56,070 $17,420
Source: NFIRS 5.0.Notes: 1.Averagelossforfatalitiesandinjuriesiscomputedper1,000fires.Averagedollarlossiscomputedper fire and rounded to the nearest 10. 2. The 2014 and 2015 dollar-loss values were adjusted to 2016 dollars.
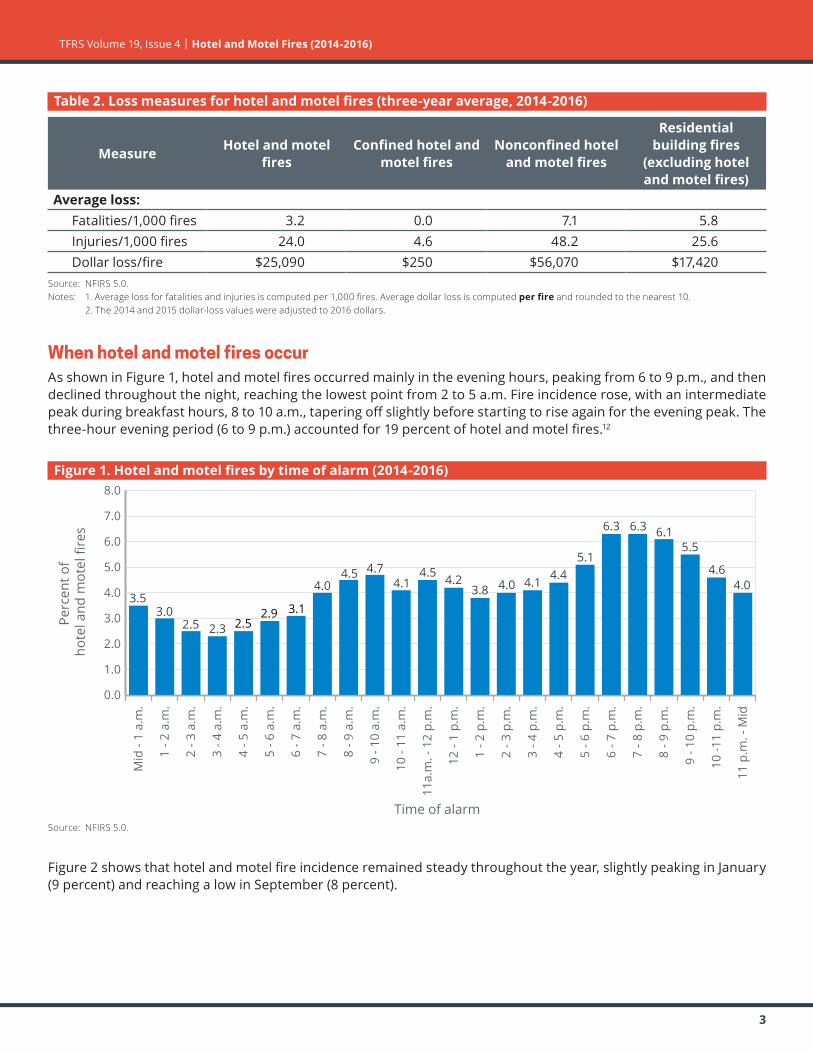
When hotel and motel fires occurAs shown in Figure 1, hotel and motel fires occurred mainly in the evening hours, peaking from 6 to 9 p.m., and then declined throughout the night, reaching the lowest point from 2 to 5 a.m. Fire incidence rose, with an intermediate peak during breakfast hours, 8 to 10 a.m., tapering off slightly before starting to rise again for the evening peak. The three-hour evening period (6 to 9 p.m.) accounted for 19 percent of hotel and motel fires.12
Figure 1. Hotel and motel fires by time of alarm (2014-2016)
0.0
1.0
2.0
3.0
4.0
5.0
6.0
7.0
8.0
11 p
.m. -
Mid
10 -1
1 p.
m.
9 - 1
0 p.
m.
8 - 9
p.m
.
7 - 8
p.m
.
6 - 7
p.m
.
5 - 6
p.m
.
4 - 5
p.m
.
3 - 4
p.m
.
2 - 3
p.m
.
1 - 2
p.m
.
12 -
1 p.
m.
11a.
m. -
12
p.m
.
10 -
11 a
.m.
9 - 1
0 a.
m.
8 - 9
a.m
.
7 - 8
a.m
.
6 - 7
a.m
.
5 - 6
a.m
.
4 - 5
a.m
.
3 - 4
a.m
.
2 - 3
a.m
.
1 - 2
a.m
.
Mid
- 1
a.m
.
3.53.0
2.5
4.04.5 4.7
4.14.5 4.2
3.8 4.0 4.1 4.45.1
6.3 6.3 6.15.5
4.64.0
2.3 2.52.9 3.1
Perc
ent o
f ho
tel a
nd m
otel
fire
s
Time of alarmSource: NFIRS 5.0.
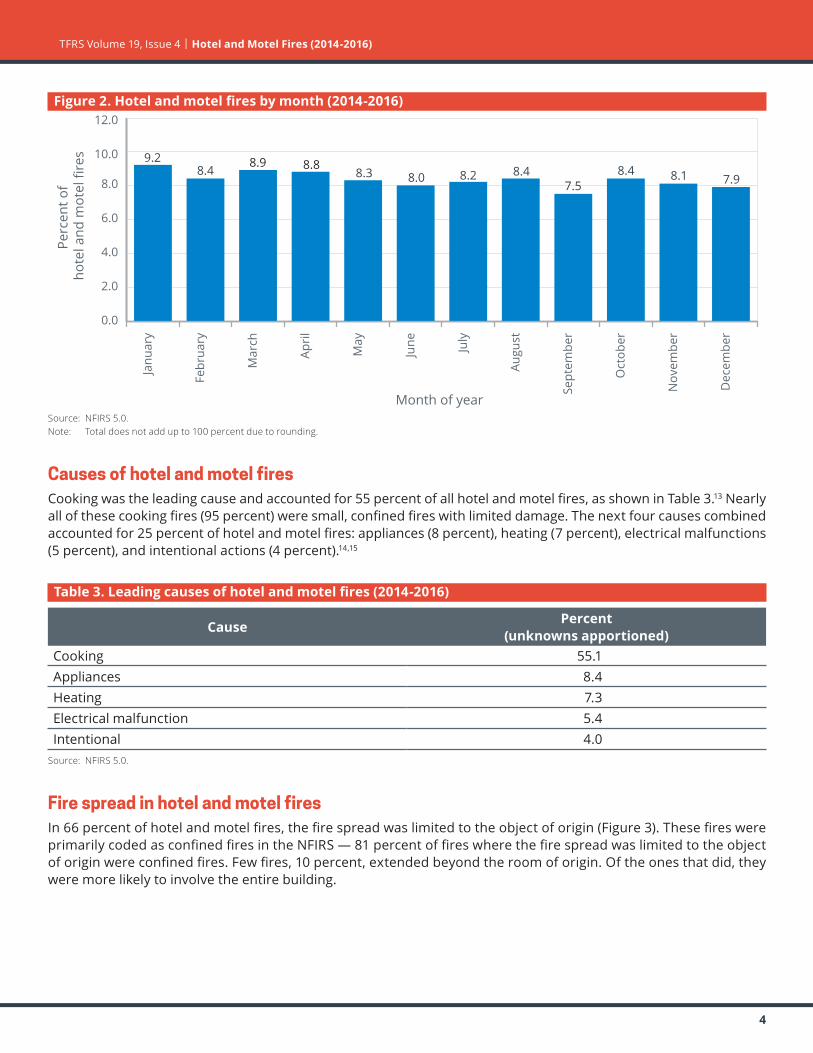
Figure 2 shows that hotel and motel fire incidence remained steady throughout the year, slightly peaking in January (9 percent) and reaching a low in September (8 percent).
TFRS Volume 19, Issue 4 | Hotel and Motel Fires (2014-2016)
4
Figure 2. Hotel and motel fires by month (2014-2016)
0.0
2.0
4.0
6.0
8.0
10.0
12.0
Dec
embe
r
Nov
embe
r
Oct
ober
Sept
embe
r
Augu
st
July
June
May
Apri
l
Mar
ch
Febr
uary
Janu
ary
9.28.4 8.3 8.0 8.2 8.4
7.58.4 8.1 7.9
8.9 8.8
Perc
ent o
f ho
tel a
nd m
otel
fire
s
Month of yearSource: NFIRS 5.0.Note: Total does not add up to 100 percent due to rounding.
Causes of hotel and motel firesCooking was the leading cause and accounted for 55 percent of all hotel and motel fires, as shown in Table 3.13 Nearly all of these cooking fires (95 percent) were small, confined fires with limited damage. The next four causes combined accounted for 25 percent of hotel and motel fires: appliances (8 percent), heating (7 percent), electrical malfunctions (5 percent), and intentional actions (4 percent).14,15
Table 3. Leading causes of hotel and motel fires (2014-2016)
Cause Percent (unknowns apportioned)
Cooking 55.1Appliances 8.4Heating 7.3Electrical malfunction 5.4Intentional 4.0
Source: NFIRS 5.0.
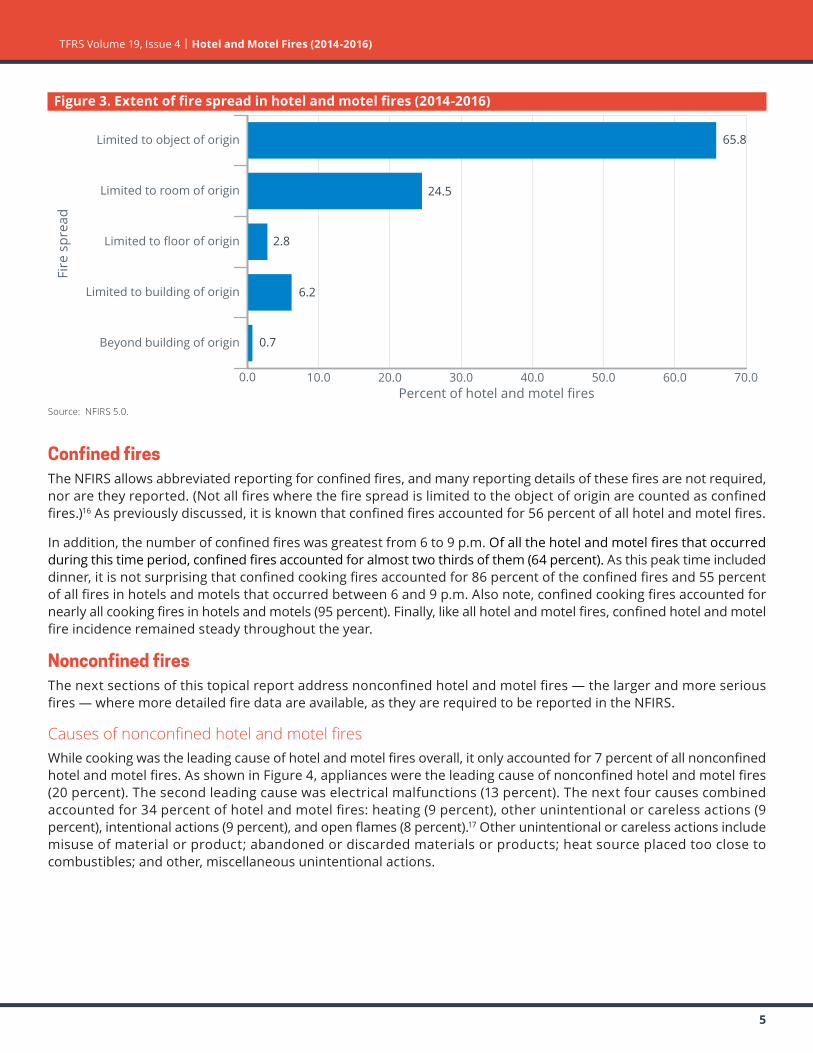
Fire spread in hotel and motel firesIn 66 percent of hotel and motel fires, the fire spread was limited to the object of origin (Figure 3). These fires were primarily coded as confined fires in the NFIRS — 81 percent of fires where the fire spread was limited to the object of origin were confined fires. Few fires, 10 percent, extended beyond the room of origin. Of the ones that did, they were more likely to involve the entire building.
TFRS Volume 19, Issue 4 | Hotel and Motel Fires (2014-2016)
5
Figure 3. Extent of fire spread in hotel and motel fires (2014-2016)
8.3
Fire
spr
ead
Percent of hotel and motel fires0.0 10.0 20.0 30.0 40.0 50.0 60.0 70.0
Beyond building of origin
Limited to building of origin
Limited to floor of origin
Limited to room of origin
Limited to object of origin 65.8
24.5
2.8
6.2
0.7
Source: NFIRS 5.0.
Confined firesThe NFIRS allows abbreviated reporting for confined fires, and many reporting details of these fires are not required, nor are they reported. (Not all fires where the fire spread is limited to the object of origin are counted as confined fires.)16 As previously discussed, it is known that confined fires accounted for 56 percent of all hotel and motel fires.
In addition, the number of confined fires was greatest from 6 to 9 p.m. Of all the hotel and motel fires that occurred during this time period, confined fires accounted for almost two thirds of them (64 percent). As this peak time included dinner, it is not surprising that confined cooking fires accounted for 86 percent of the confined fires and 55 percent of all fires in hotels and motels that occurred between 6 and 9 p.m. Also note, confined cooking fires accounted for nearly all cooking fires in hotels and motels (95 percent). Finally, like all hotel and motel fires, confined hotel and motel fire incidence remained steady throughout the year.
Nonconfined firesThe next sections of this topical report address nonconfined hotel and motel fires — the larger and more serious fires — where more detailed fire data are available, as they are required to be reported in the NFIRS.
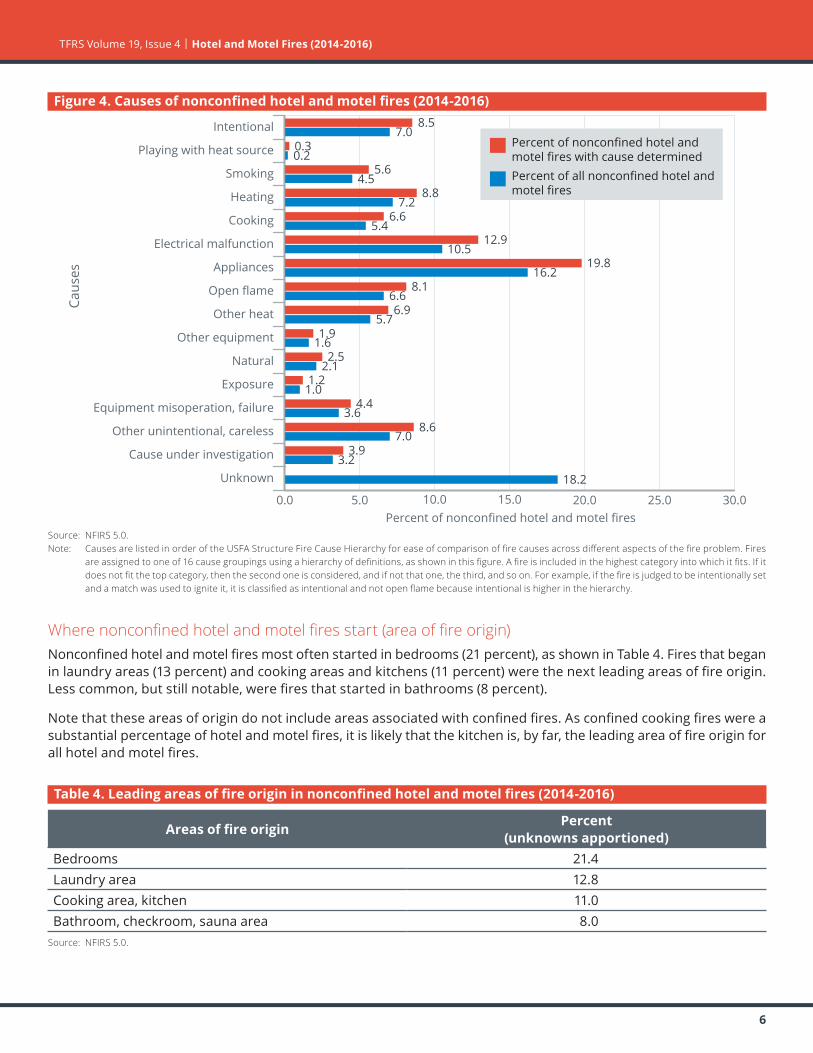
CausesofnonconfinedhotelandmotelfiresWhile cooking was the leading cause of hotel and motel fires overall, it only accounted for 7 percent of all nonconfined hotel and motel fires. As shown in Figure 4, appliances were the leading cause of nonconfined hotel and motel fires (20 percent). The second leading cause was electrical malfunctions (13 percent). The next four causes combined accounted for 34 percent of hotel and motel fires: heating (9 percent), other unintentional or careless actions (9 percent), intentional actions (9 percent), and open flames (8 percent).17 Other unintentional or careless actions include misuse of material or product; abandoned or discarded materials or products; heat source placed too close to combustibles; and other, miscellaneous unintentional actions.
TFRS Volume 19, Issue 4 | Hotel and Motel Fires (2014-2016)
6
Figure 4. Causes of nonconfined hotel and motel fires (2014-2016)
Caus
es
Percent of nonconfined hotel and motel fires0.0 5.0 10.0 15.0 20.0 25.0 30.0
Unknown
Cause under investigation
Other unintentional, careless
Equipment misoperation, failure
Exposure
Natural
Other equipment
Other heat
Open flame
Appliances
Electrical malfunction
Cooking
Heating
Smoking
Playing with heat source
IntentionalPercent of nonconfined hotel and motel fires with cause determinedPercent of all nonconfined hotel and motel fires
8.57.0
0.30.2
5.64.5
8.8
6.65.4
12.910.5
19.816.2
8.16.66.9
5.71.9
1.62.5
2.11.2
1.04.4
3.68.6
7.03.9
3.218.2
7.2
Source: NFIRS 5.0.Note: CausesarelistedinorderoftheUSFAStructureFireCauseHierarchyforeaseofcomparisonoffirecausesacrossdifferentaspectsofthefireproblem.Fires
areassignedtooneof16causegroupingsusingahierarchyofdefinitions,asshowninthisfigure.Afireisincludedinthehighestcategoryintowhichitfits.Ifitdoesnotfitthetopcategory,thenthesecondoneisconsidered,andifnotthatone,thethird,andsoon.Forexample,ifthefireisjudgedtobeintentionallysetandamatchwasusedtoigniteit,itisclassifiedasintentionalandnotopenflamebecauseintentionalishigherinthehierarchy.
Wherenonconfinedhotelandmotelfiresstart(areaoffireorigin)Nonconfined hotel and motel fires most often started in bedrooms (21 percent), as shown in Table 4. Fires that began in laundry areas (13 percent) and cooking areas and kitchens (11 percent) were the next leading areas of fire origin. Less common, but still notable, were fires that started in bathrooms (8 percent).
Note that these areas of origin do not include areas associated with confined fires. As confined cooking fires were a substantial percentage of hotel and motel fires, it is likely that the kitchen is, by far, the leading area of fire origin for all hotel and motel fires.
Table 4. Leading areas of fire origin in nonconfined hotel and motel fires (2014-2016)
Areas of fire origin Percent (unknowns apportioned)
Bedrooms 21.4Laundry area 12.8Cooking area, kitchen 11.0Bathroom, checkroom, sauna area 8.0
Source: NFIRS 5.0.
TFRS Volume 19, Issue 4 | Hotel and Motel Fires (2014-2016)
7
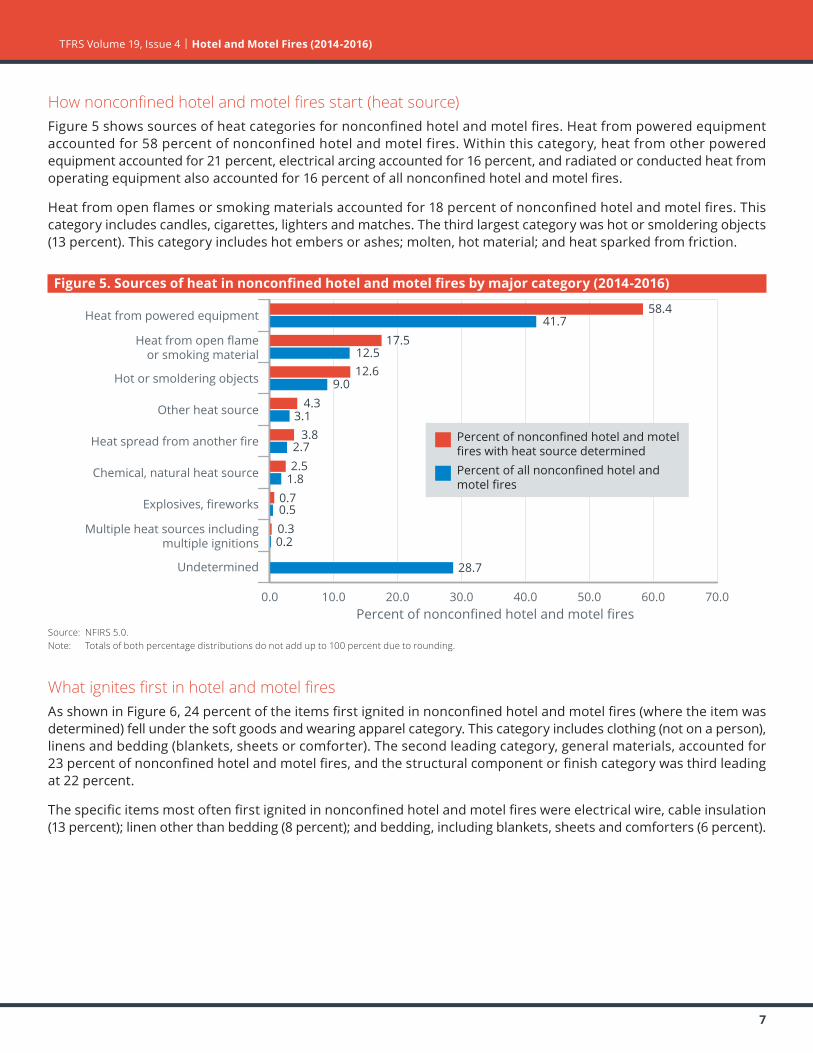
Hownonconfinedhotelandmotelfiresstart(heatsource)Figure 5 shows sources of heat categories for nonconfined hotel and motel fires. Heat from powered equipment accounted for 58 percent of nonconfined hotel and motel fires. Within this category, heat from other powered equipment accounted for 21 percent, electrical arcing accounted for 16 percent, and radiated or conducted heat from operating equipment also accounted for 16 percent of all nonconfined hotel and motel fires.
Heat from open flames or smoking materials accounted for 18 percent of nonconfined hotel and motel fires. This category includes candles, cigarettes, lighters and matches. The third largest category was hot or smoldering objects (13 percent). This category includes hot embers or ashes; molten, hot material; and heat sparked from friction.
Figure 5. Sources of heat in nonconfined hotel and motel fires by major category (2014-2016)
Percent of nonconfined hotel and motel fires0.0 10.0 20.0 30.0 40.0 50.0 60.0 70.0
Undetermined
Multiple heat sources including multiple ignitions
Explosives, fireworks
Chemical, natural heat source
Heat spread from another fire
Other heat source
Hot or smoldering objects
Heat from open flame or smoking material
Heat from powered equipment
28.7
0.20.30.50.7
1.82.52.7
3.83.1
4.39.0
12.612.5
17.541.7
58.4
Percent of all nonconfined hotel and motel fires
Percent of nonconfined hotel and motelfires with heat source determined
Source: NFIRS 5.0.Note: Totalsofbothpercentagedistributionsdonotaddupto100percentduetorounding.
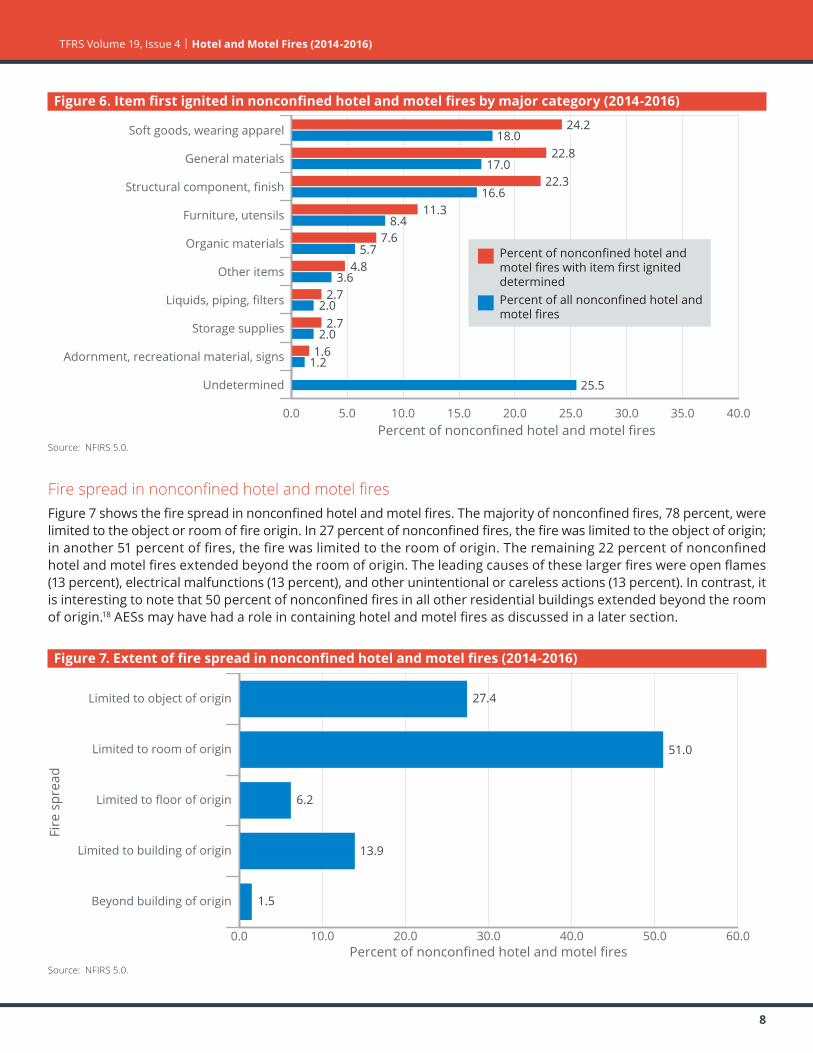
WhatignitesfirstinhotelandmotelfiresAs shown in Figure 6, 24 percent of the items first ignited in nonconfined hotel and motel fires (where the item was determined) fell under the soft goods and wearing apparel category. This category includes clothing (not on a person), linens and bedding (blankets, sheets or comforter). The second leading category, general materials, accounted for 23 percent of nonconfined hotel and motel fires, and the structural component or finish category was third leading at 22 percent.
The specific items most often first ignited in nonconfined hotel and motel fires were electrical wire, cable insulation (13 percent); linen other than bedding (8 percent); and bedding, including blankets, sheets and comforters (6 percent).
TFRS Volume 19, Issue 4 | Hotel and Motel Fires (2014-2016)
8
Figure 6. Item first ignited in nonconfined hotel and motel fires by major category (2014-2016)
Percent of nonconfined hotel and motel fires0.0 5.0 10.0 15.0 20.0 25.0 30.0 35.0 40.0
Undetermined
Adornment, recreational material, signs
Storage supplies
Liquids, piping, filters
Other items
Organic materials
Furniture, utensils
Structural component, finish
General materials
Soft goods, wearing apparel
25.5
1.21.62.0
2.72.0
2.73.6
4.85.7
7.68.4
11.316.6
22.317.0
22.818.0
24.2
Percent of all nonconfined hotel and motel fires
Percent of nonconfined hotel and motel fires with item first ignited determined
Source: NFIRS 5.0.
FirespreadinnonconfinedhotelandmotelfiresFigure 7 shows the fire spread in nonconfined hotel and motel fires. The majority of nonconfined fires, 78 percent, were limited to the object or room of fire origin. In 27 percent of nonconfined fires, the fire was limited to the object of origin; in another 51 percent of fires, the fire was limited to the room of origin. The remaining 22 percent of nonconfined hotel and motel fires extended beyond the room of origin. The leading causes of these larger fires were open flames (13 percent), electrical malfunctions (13 percent), and other unintentional or careless actions (13 percent). In contrast, it is interesting to note that 50 percent of nonconfined fires in all other residential buildings extended beyond the room of origin.18 AESs may have had a role in containing hotel and motel fires as discussed in a later section.
Figure 7. Extent of fire spread in nonconfined hotel and motel fires (2014-2016)
8.3
Fire
spr
ead
Percent of nonconfined hotel and motel fires0.0 10.0 20.0 30.0 40.0 50.0 60.0
Beyond building of origin
Limited to building of origin
Limited to floor of origin
Limited to room of origin
Limited to object of origin 27.4
51.0
6.2
13.9
1.5
Source: NFIRS 5.0.
TFRS Volume 19, Issue 4 | Hotel and Motel Fires (2014-2016)
9
FactorscontributingtoignitioninnonconfinedhotelandmotelfiresTable 5 shows the categories of factors contributing to ignition in nonconfined hotel and motel fires. By far, the leading category was the misuse of material or product (40 percent). In this category, the leading specific factors contributing to ignition were a heat source too close to combustible materials (14 percent) and abandoned or discarded materials, such as matches or cigarettes (12 percent).
Electrical failure or malfunction was the second leading category, accounting for 25 percent of nonconfined hotel and motel fires. Operational deficiency and mechanical failures and malfunctions were the third and fourth leading categories at 15 and 14 percent, respectively. Failure to clean equipment and unattended equipment were the specific leading factors in the operational deficiency category and accounted for 5 percent and 4 percent, respectively, of all nonconfined hotel and motel fires.
Table 5. Factors contributing to ignition for nonconfined hotel and motel fires by major category (where factors contributing to ignition were specified, 2014-2016)
Factors contributing to ignition Percent of nonconfined hotel and motel fires (unknowns apportioned)
Misuse of material or product 39.9Electrical failure, malfunction 25.3Operational deficiency 15.1Mechanical failure, malfunction 13.6Other factors contributing to ignition 4.9Fire spread or control 3.0Natural condition 1.9Design, manufacture, installation deficiency 1.4
Source: NFIRS 5.0.Notes: 1.Includesonlyincidentswherefactorsthatcontributedtotheignitionofthefirewerespecified. 2.Multiplefactorscontributingtofireignitionmaybenotedforeachincident;thetotalwillexceed100percent.
Suppression/Alerting systems in hotel and motel firesSmoke alarm data is available for both confined and nonconfined fires; although, for confined fires, the data is very limited in scope. Since different levels of data are reported on smoke alarms in confined and nonconfined fires, the analyses are performed separately. Note that the data presented in Tables 6, 7 and 8 are the raw counts from the NFIRS dataset and are not scaled to national estimates of smoke alarms in hotel and motel fires. In addition, the NFIRS does not allow for the determination of the type of smoke alarm (i.e., photoelectric or ionization) or the location of the smoke alarm with respect to the area of fire origin.
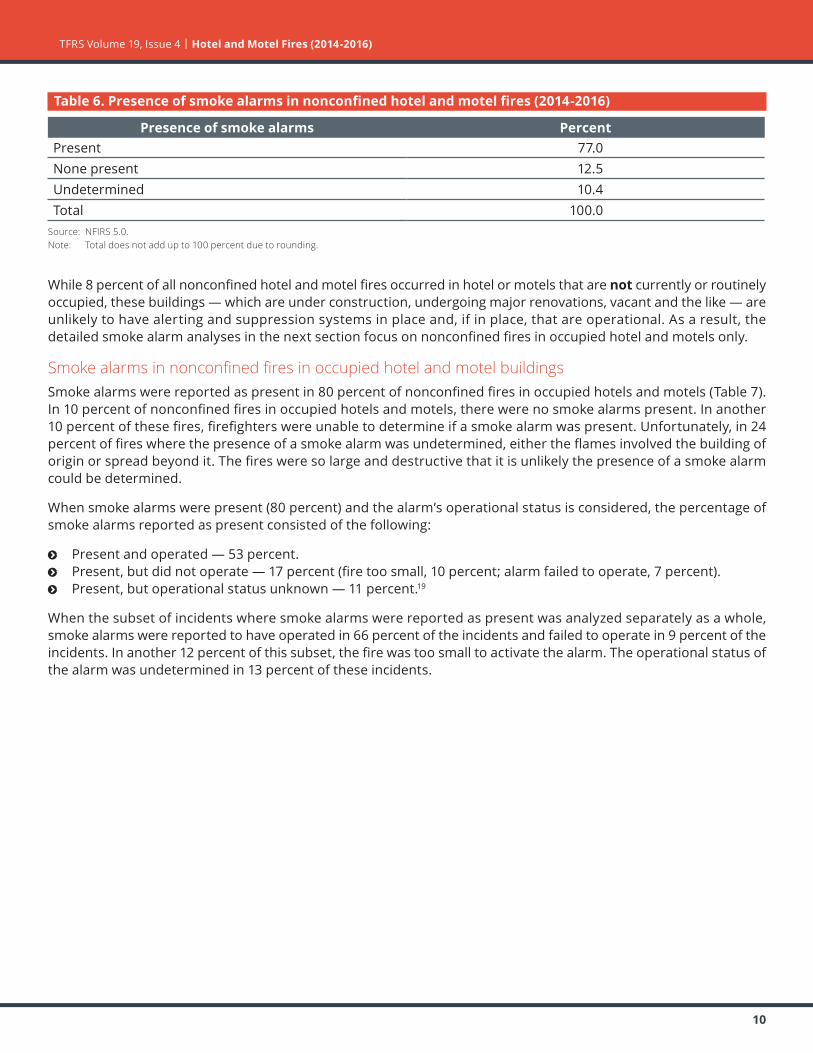
SmokealarmsinnonconfinedhotelandmotelfiresOverall, smoke alarms were reported as present in 77 percent of nonconfined hotel and motel fires (Table 6). In 13 percent of nonconfined hotel and motel fires, there were no smoke alarms present. In another 10 percent of these fires, firefighters were unable to determine if a smoke alarm was present. Thus, smoke alarms were potentially missing in 13 to 23 percent of fires, with the ability to spread and possibly result in fatalities.
TFRS Volume 19, Issue 4 | Hotel and Motel Fires (2014-2016)
10
Table 6. Presence of smoke alarms in nonconfined hotel and motel fires (2014-2016)
Presence of smoke alarms PercentPresent 77.0None present 12.5Undetermined 10.4Total 100.0
Source: NFIRS 5.0.Note: Total does not add up to 100 percent due to rounding.
While 8 percent of all nonconfined hotel and motel fires occurred in hotel or motels that are not currently or routinely occupied, these buildings — which are under construction, undergoing major renovations, vacant and the like — are unlikely to have alerting and suppression systems in place and, if in place, that are operational. As a result, the detailed smoke alarm analyses in the next section focus on nonconfined fires in occupied hotel and motels only.
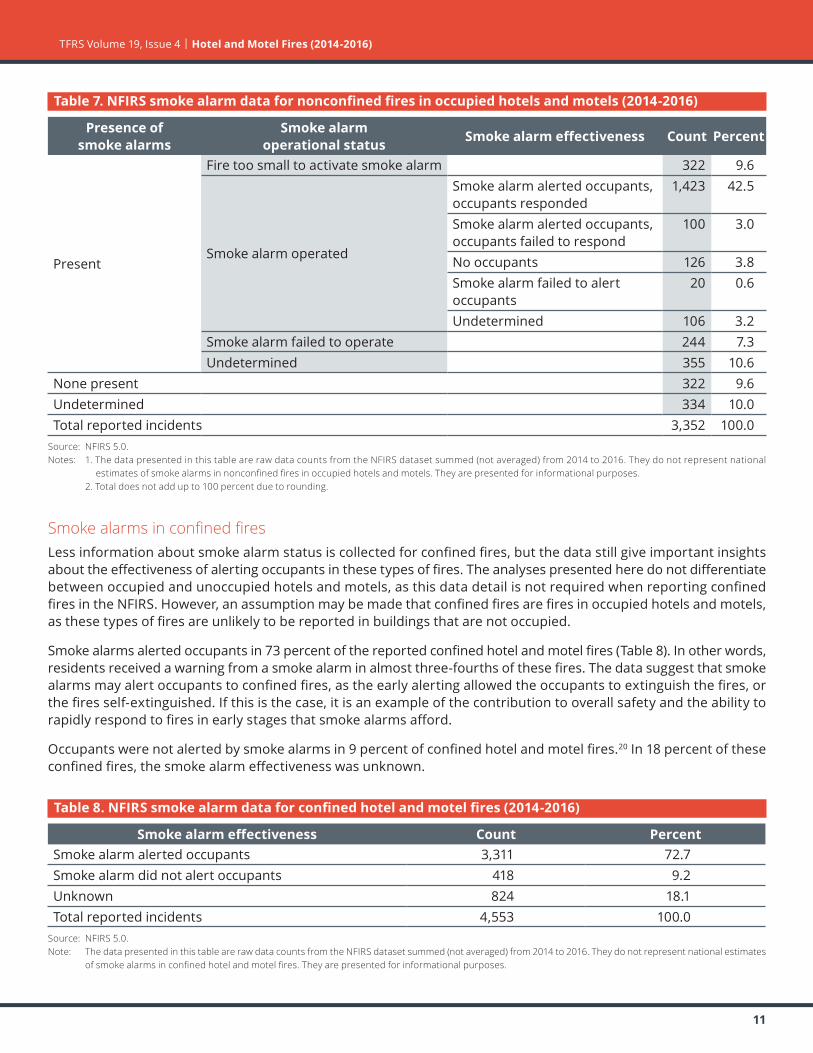
SmokealarmsinnonconfinedfiresinoccupiedhotelandmotelbuildingsSmoke alarms were reported as present in 80 percent of nonconfined fires in occupied hotels and motels (Table 7). In 10 percent of nonconfined fires in occupied hotels and motels, there were no smoke alarms present. In another 10 percent of these fires, firefighters were unable to determine if a smoke alarm was present. Unfortunately, in 24 percent of fires where the presence of a smoke alarm was undetermined, either the flames involved the building of origin or spread beyond it. The fires were so large and destructive that it is unlikely the presence of a smoke alarm could be determined.
When smoke alarms were present (80 percent) and the alarm’s operational status is considered, the percentage of smoke alarms reported as present consisted of the following:
ĵ Present and operated — 53 percent. ĵ Present, but did not operate — 17 percent (fire too small, 10 percent; alarm failed to operate, 7 percent). ĵ Present, but operational status unknown — 11 percent.19
When the subset of incidents where smoke alarms were reported as present was analyzed separately as a whole, smoke alarms were reported to have operated in 66 percent of the incidents and failed to operate in 9 percent of the incidents. In another 12 percent of this subset, the fire was too small to activate the alarm. The operational status of the alarm was undetermined in 13 percent of these incidents.
TFRS Volume 19, Issue 4 | Hotel and Motel Fires (2014-2016)
11
Table 7. NFIRS smoke alarm data for nonconfined fires in occupied hotels and motels (2014-2016)
Presence of smoke alarms
Smoke alarm operational status Smoke alarm effectiveness Count Percent
Present
Fire too small to activate smoke alarm 322 9.6
Smoke alarm operated
Smoke alarm alerted occupants, occupants responded
1,423 42.5
Smoke alarm alerted occupants, occupants failed to respond
100 3.0
No occupants 126 3.8Smoke alarm failed to alert occupants
20 0.6
Undetermined 106 3.2Smoke alarm failed to operate 244 7.3Undetermined 355 10.6
None present 322 9.6Undetermined 334 10.0Total reported incidents 3,352 100.0
Source: NFIRS 5.0.Notes: 1.ThedatapresentedinthistablearerawdatacountsfromtheNFIRSdatasetsummed(notaveraged)from2014to2016.Theydonotrepresentnational
estimatesofsmokealarmsinnonconfinedfiresinoccupiedhotelsandmotels.Theyarepresentedforinformationalpurposes. 2. Total does not add up to 100 percent due to rounding.
SmokealarmsinconfinedfiresLess information about smoke alarm status is collected for confined fires, but the data still give important insights about the effectiveness of alerting occupants in these types of fires. The analyses presented here do not differentiate between occupied and unoccupied hotels and motels, as this data detail is not required when reporting confined fires in the NFIRS. However, an assumption may be made that confined fires are fires in occupied hotels and motels, as these types of fires are unlikely to be reported in buildings that are not occupied.
Smoke alarms alerted occupants in 73 percent of the reported confined hotel and motel fires (Table 8). In other words, residents received a warning from a smoke alarm in almost three-fourths of these fires. The data suggest that smoke alarms may alert occupants to confined fires, as the early alerting allowed the occupants to extinguish the fires, or the fires self-extinguished. If this is the case, it is an example of the contribution to overall safety and the ability to rapidly respond to fires in early stages that smoke alarms afford.
Occupants were not alerted by smoke alarms in 9 percent of confined hotel and motel fires.20 In 18 percent of these confined fires, the smoke alarm effectiveness was unknown.
Table 8. NFIRS smoke alarm data for confined hotel and motel fires (2014-2016)
Smoke alarm effectiveness Count PercentSmoke alarm alerted occupants 3,311 72.7Smoke alarm did not alert occupants 418 9.2Unknown 824 18.1Total reported incidents 4,553 100.0
Source: NFIRS 5.0.Note: ThedatapresentedinthistablearerawdatacountsfromtheNFIRSdatasetsummed(notaveraged)from2014to2016.Theydonotrepresentnationalestimates
ofsmokealarmsinconfinedhotelandmotelfires.Theyarepresentedforinformationalpurposes.
TFRS Volume 19, Issue 4 | Hotel and Motel Fires (2014-2016)
12
If a fire occurs, properly installed and maintained smoke alarms provide an early warning signal. Smoke alarms help save lives and property. The USFA continues to partner with other government agencies and fire service organizations to improve and develop new smoke alarm technologies. More information on smoke alarm technologies, performance, disposal and storage, training bulletins, and public education and outreach materials can be found at https://www.usfa.fema.gov/prevention/technology/smoke_fire_alarms.html. Additionally, the USFA’s position statement on smoke alarms in residences is available at https://www.usfa.fema.gov/about/smoke_alarms_position.html.
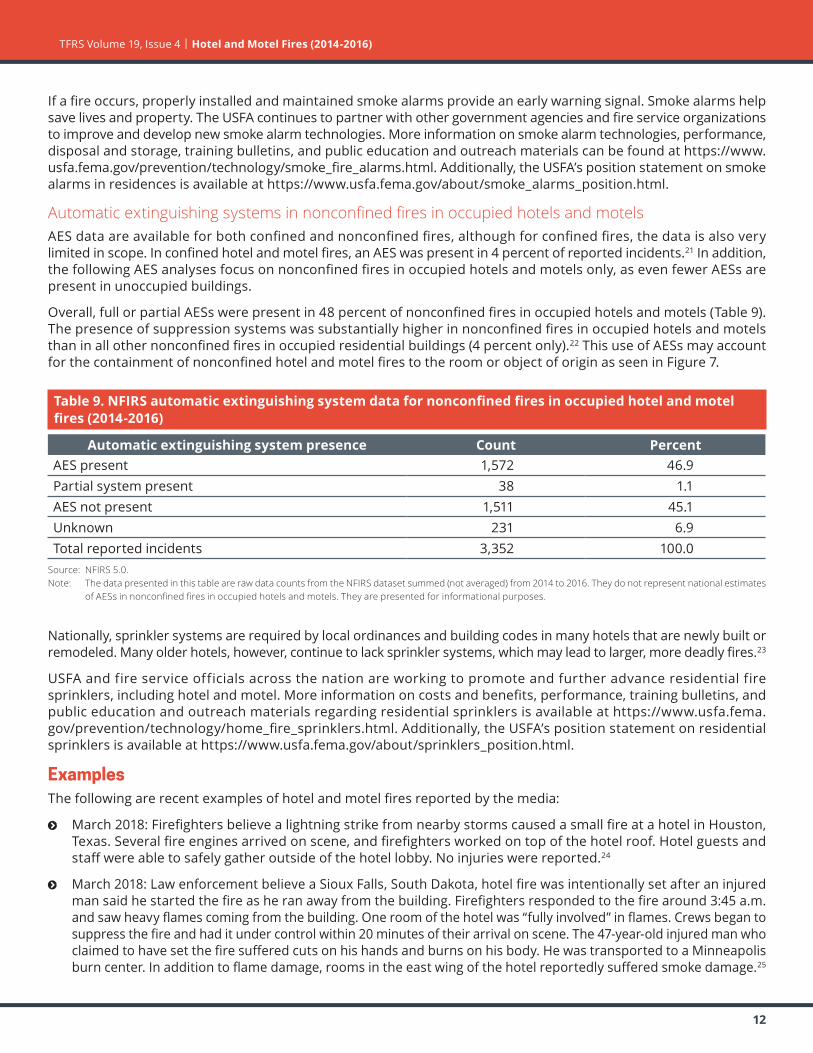
AutomaticextinguishingsystemsinnonconfinedfiresinoccupiedhotelsandmotelsAES data are available for both confined and nonconfined fires, although for confined fires, the data is also very limited in scope. In confined hotel and motel fires, an AES was present in 4 percent of reported incidents.21 In addition, the following AES analyses focus on nonconfined fires in occupied hotels and motels only, as even fewer AESs are present in unoccupied buildings.
Overall, full or partial AESs were present in 48 percent of nonconfined fires in occupied hotels and motels (Table 9). The presence of suppression systems was substantially higher in nonconfined fires in occupied hotels and motels than in all other nonconfined fires in occupied residential buildings (4 percent only).22 This use of AESs may account for the containment of nonconfined hotel and motel fires to the room or object of origin as seen in Figure 7.
Table 9. NFIRS automatic extinguishing system data for nonconfined fires in occupied hotel and motel fires (2014-2016)
Automatic extinguishing system presence Count PercentAES present 1,572 46.9Partial system present 38 1.1AES not present 1,511 45.1Unknown 231 6.9Total reported incidents 3,352 100.0
Source: NFIRS 5.0.Note: ThedatapresentedinthistablearerawdatacountsfromtheNFIRSdatasetsummed(notaveraged)from2014to2016.Theydonotrepresentnationalestimates
ofAESsinnonconfinedfiresinoccupiedhotelsandmotels.Theyarepresentedforinformationalpurposes.
Nationally, sprinkler systems are required by local ordinances and building codes in many hotels that are newly built or remodeled. Many older hotels, however, continue to lack sprinkler systems, which may lead to larger, more deadly fires.23
USFA and fire service officials across the nation are working to promote and further advance residential fire sprinklers, including hotel and motel. More information on costs and benefits, performance, training bulletins, and public education and outreach materials regarding residential sprinklers is available at https://www.usfa.fema.gov/prevention/technology/home_fire_sprinklers.html. Additionally, the USFA’s position statement on residential sprinklers is available at https://www.usfa.fema.gov/about/sprinklers_position.html.
ExamplesThe following are recent examples of hotel and motel fires reported by the media:
ĵ March 2018: Firefighters believe a lightning strike from nearby storms caused a small fire at a hotel in Houston, Texas. Several fire engines arrived on scene, and firefighters worked on top of the hotel roof. Hotel guests and staff were able to safely gather outside of the hotel lobby. No injuries were reported.24
ĵ March 2018: Law enforcement believe a Sioux Falls, South Dakota, hotel fire was intentionally set after an injured man said he started the fire as he ran away from the building. Firefighters responded to the fire around 3:45 a.m. and saw heavy flames coming from the building. One room of the hotel was “fully involved” in flames. Crews began to suppress the fire and had it under control within 20 minutes of their arrival on scene. The 47-year-old injured man who claimed to have set the fire suffered cuts on his hands and burns on his body. He was transported to a Minneapolis burn center. In addition to flame damage, rooms in the east wing of the hotel reportedly suffered smoke damage.25
TFRS Volume 19, Issue 4 | Hotel and Motel Fires (2014-2016)
13
ĵ March 2018: One person suffered minor injuries after an early afternoon fire in a Henrico County, Virginia, hotel room. Firefighters reported that several people evacuated the hotel around 2 p.m. as a result of the fire, some of whom had to exit through windows. Other people had to be rescued by firefighters. The hotel fire was contained to one room, but smoke filled hallways and common areas of the hotel. The cause of the fire is under investigation.26
ĵ January 2018: One person was killed in a Mineola, Texas, hotel fire which broke out just after midnight. Multiple fire departments responded and hotel occupants were evacuated. The victim, a 32-year-old male from Mexico, was visiting family in the area. The cause of the fire is still under investigation, and autopsy results on the victim are pending.27
ConclusionStricter codes and resulting changes in hotel and motel safety have contributed to the substantial decrease in the number of hotel and motel fires. While only one residential building fire in 100 is a hotel or motel fire, the potential for loss of life, injuries, and damage is still substantial as hotel and motels are designed to house a large number of people at once. Therefore, prevention must continue to be a priority.
The USFA continues to promote hotel and motel fire safety through prevention programs and outreach materials. More information on hotel and motel fire prevention, as well as hotel and motel fire safety messages, is available at https://www.usfa.fema.gov/prevention/outreach/hotel_motel.html. In addition, the USFA maintains the Hotel-Motel National Master List that identifies hotels and motels that have at least one single-station and hard-wired smoke alarm in each guest room, as well as an automatic fire sprinkler system in each guest room for buildings that are four or more stories tall. While traveling for official business, federal employees are required to stay at a hotel or motel that meets these criteria. The public, however, can also refer to and use this list. A search of the Hotel-Motel National Master List can be done at https://apps.usfa.fema.gov/hotel/.
NFIRS data specifications for hotel and motel firesData for this report were extracted from the NFIRS annual Public Data Release files for 2014, 2015 and 2016. Only Version 5.0 data were extracted.
Hotel and motel fires were defined using the following criteria:
ĵ Aid Types 3 (mutual aid given) and 4 (automatic aid given) were excluded to avoid counting a single incident more than once.
ĵ Incident Types 111 to 123 (excludes Incident Type 112):
Incident Type Description111 Building fire113 Cooking fire, confined to container114 Chimney or flue fire, confined to chimney or flue115 Incinerator overload or malfunction, fire confined116 Fuel burner/boiler malfunction, fire confined117 Commercial compactor fire, confined to rubbish118 Trash or rubbish fire, contained120 Fire in mobile property used as a fixed structure, other121 Fire in mobile home used as fixed residence122 Fire in motor home, camper, recreational vehicle123 Fire in portable building, fixed location
Note: IncidentTypes113to118donotspecifyifthestructureisabuilding.
TFRS Volume 19, Issue 4 | Hotel and Motel Fires (2014-2016)
14
ĵ Property Use 449:
Property Use Description449 Hotel/Motel, commercial
ĵ Structure Type:
Ý For Incident Types 113 to 118: f 1—Enclosed building, or f 2—Fixed portable or mobile structure, or f Structure Type not specified (null entry).
Ý For Incident Types 111 and 120 to 123: f 1—Enclosed building, or f 2—Fixed portable or mobile structure.
The analyses contained in this report reflect the current methodologies used by the USFA. The USFA is committed to providing the best and most current information on the U.S. fire problem and continually examines its data and methodology to fulfill this goal. Because of this commitment, data collection strategies and methodological changes are possible and do occur. As a result, analyses and estimates of the fire problem may change slightly over time. Previous analyses and estimates on specific issues (or similar issues) may have used different methodologies or data definitions and may not be directly comparable to the current ones.
Information regarding the USFA’s national estimates for residential building fires, as well as the data sources used to derive the estimates, can be found in the document “Data Sources and National Estimates Methodology Overview for the U.S. Fire Administration’s Topical Fire Report Series (Volume 19),” https://www.usfa.fema.gov/downloads/pdf/statistics/data_sources_and_national_estimates_methodology_vol19.pdf. This document also addresses the specific NFIRS data elements analyzed in the topical reports, as well as “unknown” data entries and missing data.
To request additional information, visit https://www.usfa.fema.gov/contact.html. To comment on this specific report, visit https://apps.usfa.fema.gov/contact/dataReportEval?reportTitle= Hotel%20and%20Motel%20Fires%20(2014-2016).
Notes:1Campbell, Richard. NFPA, “Structure Fires in Hotel and Motels,” September 2015, https://www.nfpa.org/-/media/Files/News-and-Research/Fire-statistics/Occupancies/oshotelsmotels.ashx?la=en. Fires are rounded to the nearest 100.2Winecoff Hotel Fire, Wikipedia, https://en.wikipedia.org/wiki/Winecoff_Hotel_fire (accessed April 9, 2018).3MGM Grand Fire, Wikipedia, https://en.wikipedia.org/wiki/MGM_Grand_fire (accessed April 9, 2018).4February 10, 1981, Clark County, Nevada, Fire Department, http://fire.co.clark.nv.us/(S(tazt4cezn5fnxpf22zzszp2v))/The%20LV%20Hilton.aspx (accessed April 9, 2018).5Manuel Suarez, “3 Admit Setting Hotel Fire That Killed 97 in San Juan,” www.nytimes.com, Archives 1987, https://www.nytimes.com/1987/04/25/us/3-admit-setting-hotel-fire-that-killed-97-in-san-juan.html (accessed April 9, 2018).6National estimates are based on 2014 to 2016 native Version 5.0 data from the NFIRS, residential structure fire loss estimates from NFPA’s annual surveys of fire loss, and the USFA’s residential building fire loss estimates: https://www.usfa.fema.gov/downloads/pdf/statistics/res_bldg_fire_estimates.pdf. Further information on the USFA’s residential building fire loss estimates can be found in the “National Estimates Methodology for Building Fires and Losses,” August 2012, https://www.usfa.fema.gov/downloads/pdf/statistics/national_estimate_methodology.pdf. For information on the NFPA’s survey methodology, see the NFPA’s report “Fire Loss in the United States During 2016,” September 2017, http://www.nfpa.org/news-and-research/fire-statistics-and-reports/fire-statistics/fires-in-the-us/overall-fire-problem/fire-loss-in-the-united-states. In this topical report, fires are rounded to the nearest 100, deaths to the nearest five, injuries to the nearest 25, and dollar losses to the nearest million dollars.7In NFIRS Version 5.0, a structure is a constructed item of which a building is one type. In previous versions of the NFIRS, the term “residential structure” commonly referred to buildings where people live. To coincide with this concept, the definition of a residential structure fire for the NFIRS 5.0 includes only those fires where the NFIRS 5.0 Structure Type is 1 or 2 (enclosed building and fixed portable or mobile structure) with a residential property use. Such structures are referred to as “residential buildings” to distinguish these buildings from other structures on residential properties that may include fences, sheds and other uninhabitable structures. In addition, confined fire incidents that have a residential property use but do not have a structure type specified are presumed to occur in buildings. Nonconfined fire incidents that have a residential property use without a structure type specified are considered to be invalid incidents (Structure Type is a required field) and are not included.
TFRS Volume 19, Issue 4 | Hotel and Motel Fires (2014-2016)
15
8Fire department participation in the NFIRS is voluntary; however, some states do require their departments to participate in the state system. Additionally, if a fire department is a recipient of a Fire Act Grant, participation is required. From 2014 to 2016, 68 percent of the NFPA’s annual average estimated 1,328,500 fires to which fire departments responded were captured in the NFIRS. Thus, the NFIRS is not representative of all fire incidents in the U.S. and is not a “complete” census of fire incidents. Although the NFIRS does not represent 100 percent of the incidents reported to fire departments each year, the enormous dataset exhibits stability from one year to the next without radical changes. Results based on the full dataset are generally similar to those based on part of the data.9In the NFIRS, confined fires are defined by Incident Type Codes 113 to 118.10The NFIRS distinguishes between “content” and “property” loss. Content loss includes losses to the contents of a structure due to damage by fire, smoke, water and overhaul. Property loss includes losses to the structure itself or to the property itself. Total loss is the sum of the content loss and the property loss. For confined fires, the expectation is that the fire did not spread beyond the container (or rubbish for Incident Type Code 118), and hence, there was no property damage (damage to the structure itself) from the flames. However, there could be property damage as a result of smoke, water and overhaul.11The average fire death and fire injury loss rates computed from the national estimates do not agree with average fire death and fire injury loss rates computed from the NFIRS data alone. The fire death rate computed from national estimates is (1,000 x (15/3,900)) = 3.8 deaths per 1,000 hotel and motel fires and the fire injury rate is (1,000 x (100/3,900)) = 25.6 injuries per 1,000 hotel and motel fires. 12For the purposes of this report, the time of the fire alarm is used as an approximation for the general time at which the fire started. However, in the NFIRS, it is the time at which the fire was reported to the fire department. 13The USFA Structure Fire Cause Methodology was used to determine the cause of hotel and motel fires. The cause methodology and definitions can be found in the document “National Fire Incident Reporting System Version 5.0 Fire Data Analysis Guidelines and Issues,” July 2011, https://www.usfa.fema.gov/downloads/pdf/nfirs/nfirs_data_analysis_guidelines_issues.pdf. 14Fires caused by intentional actions include, but are not limited to, fires that are deemed to be arson. Intentional fires are those fires that are deliberately set and include fires that result from the deliberate misuse of a heat source and fires of an incendiary nature (arson) that require fire service intervention. For information and statistics on arson fires only, refer to the Uniform Crime Reporting Program arson statistics from the U.S. Department of Justice, FBI, Criminal Justice Information Services Division, https://www.fbi.gov/about-us/cjis/ucr/ucr.15Total does not add up to 25 percent due to rounding.16As noted previously, confined building fires are small fire incidents that are limited in scope, are confined to noncombustible containers, rarely result in serious injury or large content loss, and are expected to have no significant accompanying property loss due to flame damage. In the NFIRS, confined fires are defined by Incident Type Codes 113 to 118.17Total does not add up to 34 percent due to rounding.18“Nonconfined fires in all other residential buildings” include nonconfined fires in all residential buildings except those in hotels and motels.19Total does not add up to 80 percent due to rounding.20In confined fires, the entry “smoke alarm did not alert occupants” can mean no smoke alarm was present; the smoke alarm was present but did not operate; the smoke alarm was present and operated, but the occupant(s) was already aware of the fire; or there were no occupants present at the time of the fire.21As confined fire codes are designed to capture fires contained to noncombustible containers, it is not recommended to code a fire incident as a small-, low- or no-loss confined fire incident if the AES operated and contained the fire as a result. The preferred method is to code the fire as a standard fire incident with fire spread confined to the object of origin and to provide the relevant information on AES presence and operation.22“All other nonconfined fires in occupied residential buildings” include nonconfined fires in all occupied residential buildings, except those in hotels and motels.23Johnson, Bob, “Legally, Many US Hotels Lack Fire Sprinklers,” archive.boston.com, June 4, 2010, http://archive.boston.com/news/education/higher/articles/2010/06/04/legally_many_us_hotels_lack_fire_sprinklers/ (accessed May 21, 2018).24“Lightning Strike May Have Caused Fire At Northwest Houston Hotel,” www.abc13.com, March 29, 2018, http://abc13.com/weather/lightning-strike-may-have-caused-fire-at-nw-houston-hotel-/3277213/ (accessed April 11, 2018).25Mitchell, Trevor, “Police: Burned Man Told Officer He Started Hotel Fire,” www.argusleader.com, March 22, 2018, https://www.argusleader.com/story/news/crime/2018/03/22/one-injured-sioux-falls-hotel-fire/448460002/ (accessed April 11, 2018).26Dignan, Sara, “One Hurt In Henrico Hotel Fire,” www.wric.com, March 17, 2018, http://www.wric.com/news/one-hurt-in-henrico-hotel-fire/1078313645 (accessed April 11, 2018).27Mayfield, Whitney, “Officials Identify Man Killed In Motel Fire,” www.kltv.com, Jan. 17, 2018, http://www.kltv.com/story/37285840/officials-identify-man-killed-in-motel-fire (accessed April 11, 2018).