Embed Size (px)
Citation preview
SMF SPRING 2018 PORTFOLIO REPORT
APRIL 27, 2018 UNIVERSITY OF CONNECTICUT SCHOOL OF BUSINESS
UNDERGRADUATE STUDENT MANAGED FUND
TEAM WILKOS
1
Table of Contents
Table of Contents .......................................................................................................................................... 1
Portfolio Overview ........................................................................................................................................ 3
Portfolio Overview ........................................................................................................................................ 3
Investment Managers ............................................................................................................................... 3
Investment Philosophy ............................................................................................................................. 3
Risk Management ..................................................................................................................................... 4
Current Market Conditions ....................................................................................................................... 4
Process ...................................................................................................................................................... 5
Equity Portfolio and Allocation ................................................................................................................. 5
Performance ............................................................................................................................................. 6
Total Portfolio Performance vs. S&P 500.................................................................................................. 6
Individual Stock Performance ................................................................................................................... 6
Economic Outlook ..................................................................................................................................... 7
Global Economy & Foreign Monetary Policy ............................................................................................ 8
Sector Analysis .............................................................................................................................................. 9
Materials ................................................................................................................................................... 9
Information Technology .......................................................................................................................... 10
Energy ..................................................................................................................................................... 10
Consumer Discretionary ......................................................................................................................... 11
Consumer Staples ................................................................................................................................... 11
Financials/Real Estate ............................................................................................................................. 12
Industrials ................................................................................................................................................ 13
Telecommunications ............................................................................................................................... 13
Healthcare ............................................................................................................................................... 14
Utilities .................................................................................................................................................... 14
Costco (NASDAQ: COST) ...................................................................................................................... 15
Starbucks (NASDAQ: SBUX) ................................................................................................................. 16
AerCap (NYSE: AER) ............................................................................................................................. 17
Blackstone (NYSE: BX) ......................................................................................................................... 18
Disney (NYSE: DIS) ............................................................................................................................... 19
Danaher (NYSE: DHR) .......................................................................................................................... 21
Veeva Systems (NYSE: VEEV) .............................................................................................................. 22
2
Celgene (NASDAQ: CELG) .................................................................................................................... 23
Martin Marietta Materials (NYSE: MLM) ............................................................................................ 25
Enterprise Products Partners (NYSE: EPD) .......................................................................................... 26
Constellation Brands ........................................................................................................................... 27
Waste Management (NYSE: WM) ....................................................................................................... 28
T-Mobile US Inc. .................................................................................................................................. 29
Alphabet .............................................................................................................................................. 30
Equinix (NASDAQ: EQIX) ...................................................................................................................... 32
KeyCorp ............................................................................................................................................... 33
PayPal (NASDAQ: PYPL) ....................................................................................................................... 34
Lessons Learned: ......................................................................................................................................... 35
3
Portfolio Overview
Portfolio Overview
Investment Managers
Reilly Cotter Marissa Esposito Daniel Glucksman
Mark Kugler Maeve Manley Stephen Mwangi
Jeff Noonan Alec Pisanelli Joaquin Sanchez
Vivek Tedla
Spring Officer Positions Co-Lead Manager – Jeffrey Noonan
Co-Lead Manager – Joaquin Sanchez
Portfolio Manager – Mark Kugler
Treasurer/Secretary – Maeve Manley
Web Manager – Alec Pisanelli
Undergraduate Supervisor - Christopher Wilkos
Fund Director - Chinmoy Ghosh
Investment Philosophy
The UConn Student Managed Fund applies the principles of value investing made famous by
Benjamin Graham and Warren Buffett to evaluate potential investments for the Fund. Positions
are added to our holdings after conducting both qualitative and quantitative research in order to
find undervalued stocks. Qualitative research focuses on understanding the quality of the business,
competitive landscape of the respective industry, evaluating the company’s management team, and
assessing risks that affect the company’s business model. Quantitative research consists of
analyzing a company’s and competitor’s financial performance in order to value the company on
a standalone basis (using a discounted cash flow method). The Fund also evaluates both domestic
and foreign news when considering an investment in a company. Though both quantitative and
qualitative factors are examined, primary focus is placed on the qualitative, fundamental factors
that drive financial performance.
Investment Strategy In order to evaluate the performance of the Student Managed Fund, the undergraduate team’s
portfolio will compare its returns to that of the S&P 500 Index. Each investment is analyzed for
several key qualitative and quantitative metrics before a decision is made to pursue or decline a
particular investment. These metrics include:
● Return on Invested Capital
● Competitive Advantages (such as patents and superior products)
● Strong Leadership
● Effective Business Models
4
● Shareholder Programs (dividends and share repurchases)
● Long-Term Growth Prospects
● Growth in Earnings and Revenues
● Free Cash Flow Yield
● Balance Sheet
● Potential Risks
● Margin of Safety (as determined by the difference between the calculated intrinsic value and
current market price)
Risk Management
The undergraduate portfolio is composed of U.S. equities and cash. In addition to the above
criteria, each manager must properly understand the risks of each security. The Fund considers the
following risks are of the highest importance:
Business Model Risk – company’s business model is unsustainable or easily duplicated
Balance Sheet Risk – company has leverage well above industry average
Management Risk – company may have unreliable management
Aggregation Risk – a portfolio sharing common risks among its holdings
At this time, the portfolio contains only large cap equities. This was not by design, but rather a
secondary result of other investment criteria. We acknowledge the risks associated with only
investing in large cap securities.
We are maintaining a high level of risk management by putting each selected stock through a
rigorous screening and analysis process before committing to a purchase. This process includes
analysis of the company’s business model, competitive landscape, industry, and corporate social
responsibility. Specifically, we take a long-term forward-looking approach to assess whether
competitive advantages are sustainable, including the company's financial situation such as debt
levels, intelligent allocation of capital, and ability to consistently generate cash for shareholders.
With multiple managers specializing in different sectors, we have been able to successfully
diversify our portfolio holdings across multiple sectors to avoid significant aggregation risk. Thus,
in the event of a single industry experiencing a downturn, the majority of the portfolio remains
unaffected. We continue to monitor the portfolio and reevaluate our existing positions as needed.
In the event of any single security or the market as whole taking a highly significant downturn, we
hold a 25% stop-loss from the purchase price to cap potential losses. Our risk management focus
is centered on long-term performance and capital preservation, so we are not overly concerned
with short-term volatility in the market.
Current Market Conditions
Since we began investing in October of 2017, we have experienced both a rising market, and a
subsequent market correction and turbulence in the aftermath. After a fall semester characterized
5
by a continuously rising stock market, despite what would normally be market moving geopolitical
events, the spring semester brought with it a more tumultuous market. At the beginning of the
spring semester markets crested, with the S&P 500 Index at $2,872.87 on January 26th. The market
dropped to a low of $2,581.00 on February 8, a drop of -10.16%. Since that initial drop we have
seen markets bounce up and down in response to news out of the white house and from across the
world, particularly related to fears about a trade war. The big news lately is that inflation is
reaching Fed Officials’ targets, and the U.S. 10-Year breached 3%, which the market is viewing
as a bearish signal for equities.
Process
Each manager specializes in at least three sectors and works with at least one other manager within
that sector. These teams then research their sector to determine which companies are trading
significantly from their intrinsic value.
The Fund then conducts weekly investment committee meetings during which managers pitch their
stocks before the team and Professor Wilkos. During committee, the Fund discusses fundamental
factors, such as the business model, growth opportunities and risks of investing in the business,
and then decides whether or not the Fund needs more information or is willing or unwilling to
invest at that time.
In order to invest in a stock, it must get approval from at least 7 out of 10 managers. After the Fund
decides to invest in a business, the group determines how much capital to allocate based on the
risks and growth potential of the business and the certainty of the company’s future. Each company
will be allocated approximately 3%-6.5% of the total capital available to the fund.
The sectors and the corresponding analysts are listed below:
Basic Materials – Daniel Glucksman, Stephen Mwangi
Consumer Discretionary – Marissa Esposito, Daniel Glucksman, Maeve Manley, Jeffrey Noonan
Consumer Staples – Marissa Esposito, Maeve Manley, Vivek Tedla
Energy – Stephen Mwangi, Jeffrey Noonan
Financials – Reilly Cotter, Mark Kugler, Stephen Mwangi
Healthcare – Marissa, Esposito, Mark Kugler, Maeve Manley, Alec Pisanelli
Industrials – Reilly Cotter, Joaquin Sanchez, Vivek Tedla
Information Technology – Daniel Glucksman, Mark Kugler, Alec Pisanelli, Vivek Tedla
Real Estate – Jeffrey Noonan, Alec Pisanelli
Telecom – Reilly Cotter, Vivek Tedla
Utilities – Reilly Cotter, Joaquin Sanchez
Equity Portfolio and Allocation
The Fund has 99.97% of the portfolio invested with 0.23% remaining in cash and 00.00%
remaining in the SPDR. Over the course of the academic year, we allocated funds to 17 companies,
making follow-on positions in two companies, DIS and GOOG. The average position size
6
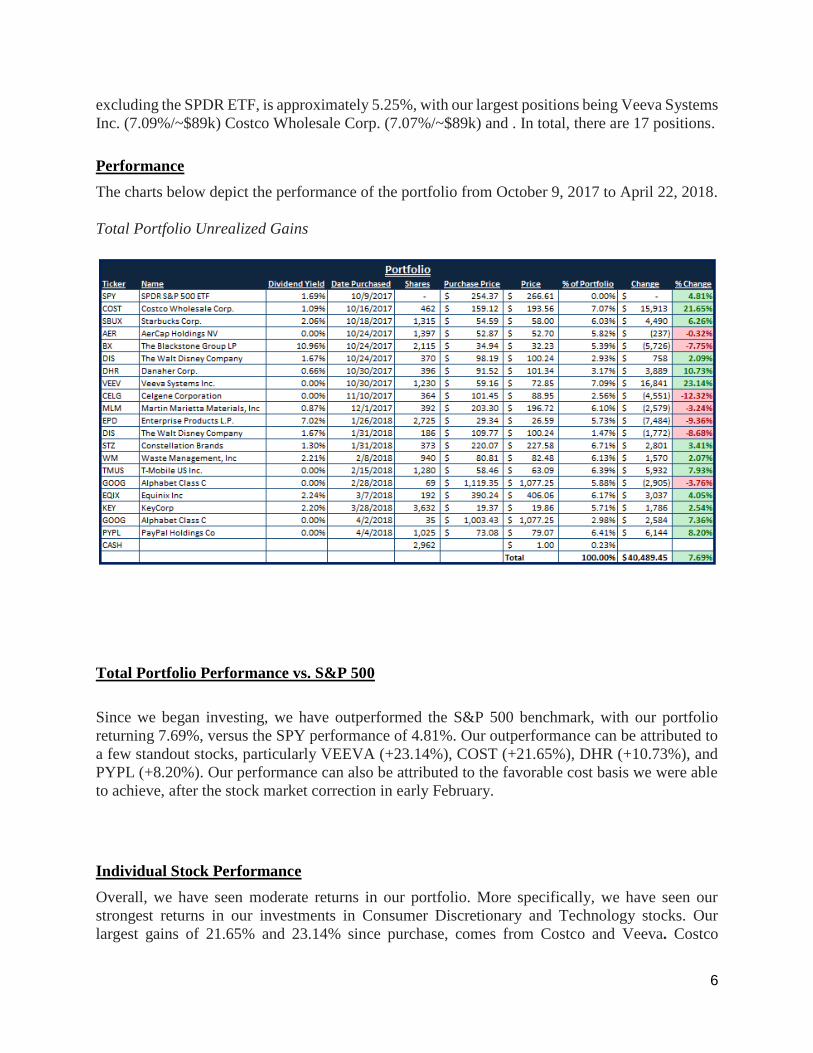
excluding the SPDR ETF, is approximately 5.25%, with our largest positions being Veeva Systems
Inc. (7.09%/~$89k) Costco Wholesale Corp. (7.07%/~$89k) and . In total, there are 17 positions.
Performance
The charts below depict the performance of the portfolio from October 9, 2017 to April 22, 2018.
Total Portfolio Unrealized Gains
Total Portfolio Performance vs. S&P 500
Since we began investing, we have outperformed the S&P 500 benchmark, with our portfolio
returning 7.69%, versus the SPY performance of 4.81%. Our outperformance can be attributed to
a few standout stocks, particularly VEEVA (+23.14%), COST (+21.65%), DHR (+10.73%), and
PYPL (+8.20%). Our performance can also be attributed to the favorable cost basis we were able
to achieve, after the stock market correction in early February.
Individual Stock Performance
Overall, we have seen moderate returns in our portfolio. More specifically, we have seen our
strongest returns in our investments in Consumer Discretionary and Technology stocks. Our
largest gains of 21.65% and 23.14% since purchase, comes from Costco and Veeva. Costco
7
rebounded from a July low of ~$150 after strong FY 2017 earnings and improved investor
sentiment. Strong revenue gains and e-commerce growth calmed investor fears over the impact of
the Amazon/Whole Foods merger. Veeva has risen on faster-than-expected adaptation of their
higher margin Veeva Vault suite of products and overall growth in highly regulated industries in
which they operate. Our largest loss thus far is Celgene, which is down 12.32% from our purchase
price of $101.45 per share. Shares declined when regulatory approval for Ozanimod, a key pipeline
drug, was delayed beyond 2018. We believe Celgene is an attractive long-term holding because of
its thickening pipeline of cancer-treatment drugs and impressive growth across their portfolio.
However, in late March, we decided to halve our position in Celgene and reallocate the capital to
Google, a stock we expect to have more near-term upside.
Economic Outlook
Though not macro investors, upon selecting potential investment opportunities for the
Undergraduate Student Managed Fund, our team analyzes the current state of the global economy
by focusing on macro-economic factors that will impact our investments in both the short and long
term. Some of these economic factors and trends include:
US Economy & Monetary Policy The U.S. economy remains strong even with a slightly slower 2.3% annual GDP growth in Q1
2018. Latest U-3 unemployment in March stayed steady at 4.1% to what economists believe is
below the natural rate of unemployment accounting for frictional employment, workers that are
transitioning between jobs, and structural employment, worker skills displaced by technology. We
expect this tightening labor market to continue to drive wage growth. At an increase of 3.18% Q1
YoY being one of the strongest post-recession figures. These drivers, coupled with a 17-year
record consumer confidence (128.7 in April) should pick up inflation close to the Federal
Reserve’s inflation target of 2%. Using the Fed’s preferred measure of inflation which excludes
the prices of food and energy, Core PCE stood at 1.6% YoY in February. Evaluating the market’s
expectations, the break-even 10-year TIPS spread takes inflation considerations closer to 2.17%
in April. We see further signs of a strong economy looking at private nonresidential fixed
investments which is often a leading indicator of GDP up 7.6% YoY in Q4 2017.
The newly appointed Fed Chair is expected to be Jerome Powell who will look towards
normalizing the Fed’s balance sheet below the $4.4 trillion in treasuries and mortgage-backed
securities. We will continue to monitor treasury yields currently passing the 3% mark as a sign of
how interest rates and valuation expectations are received in the market.
The August through September natural disasters of Hurricane Harvey and Irma especially affected
Texas, Florida, and Puerto Rico. Harvey expects to reach $73.5 billion in economic and
productivity loss ranking second to Hurricane Katrina in 2005. Congress approved for nearly $52
billion in funding to FEMA, flood projects and insurance, and low-interest credit to Puerto Rico.
A third round of funding for $44 billion was additionally requested for congressional approval.
These disasters largely affected leisure & hospitality, oil extraction, and agricultural production,
but saw increased activity in emergency services and repair efforts.
Fiscal & Political Developments
8
President Trump’s recent trip to Asian nations and ongoing renegotiation talks on NAFTA and
trade wars in general suggests the U.S. will look to form more bilateral trade agreements versus
multilateral trade in the future. This could potentially cause moments of instability among
corporates with established supply chains and distribution operations. Trade uncertainty could
follow during negotiations and hinder corporate investment confidence between nations.
Intuitively assuming corporate tax cut are realized, a rush of capital flows in the U.S. will increase
trade deficits. On NAFTA, a Mexican election in 2018 with a populist front-runner candidate will
likely change the negotiation backdrop.
Global Economy & Foreign Monetary Policy
One factor that we often consider when evaluating potential investments is international exposure.
Two major economies that we focus on are China and the Eurozone.
Considering exports, the trade weighted dollar index lately came off its January post-recession
peak from 128 down 8.7% as of April. This may indicate the dollar has come off its strong
appreciation path and provide a boost to US exports. Due to low global rates of inflation, most
central banks continue accommodative monetary policies while the dollar remains strong.
China posted 6.8% Q1 GDP growth, but the IMF expects economic moderation with 2018
forecasted at 6.4%. Even with more moderate growth in China, a rising consumer demographic
will propel the new growth model forward. Alibaba announcing $25 billion in sales on Singles
Day is a demonstration of this shift from savings to spending. On central banking, China’s foreign
reserve balance stood at $3.1 trillion USD in March showing short term increases. This can be
explained from less capital outflows and an appreciating Yuan. We view this reserve balance as a
potential tool the Chinese government can use to aid in the event of an Asian crisis. We will also
monitor China’s leverage as it amassed a large amount of non-performing loans and many credit
agencies downgrading China. This issue largely stems from state-owned enterprises and banks
providing easy lending. At some point, credit will no longer be able to sustain economic growth
and the country will experience a deleveraging cycle.
The European economy shows signs of recovery. UK has sustained a strong unemployment
recovery with latest figures at 4.4%. This forced their central bank to hike rates since Brexit to
keep up with inflation pressures. The UK’s OBR forecasts of 2% GDP growth for 2017 fell short
at 1.8% and projects slower growth of 1.5% in 2018. Overall the IMF expect Eurozone GDP to be
1.9%. Eurozone unemployment improved to 8.9% in September and continue to recover. More
importantly, will be to monitor possible electoral upheaval in Italy and anti-Eurozone candidates
winning in Netherlands, France, or Germany.
Oil & Commodities Industrial commodities prices continued to strengthen in the third quarter, while most agricultural
prices remained stable overall. In the oil market, inventories continue to decrease due to strong
market demand, caps on OPEC production, and the stabilizing of U.S. shale oil production. Oil
prices are forecast to average $65 a barrel over 2018, up from an average of $53 a barrel in 2017,
on strong demand from consumers and restraint by oil producers, while metals prices are expected
to rise 9 percent this year, also on a pickup in demand and supply constraints, the World Bank said
9
on Tuesday.
Prices for energy commodities – which include oil, natural gas, and coal -- are forecast to jump 20
percent in 2018, a 16 percentage point upward revision from October’s outlook, the World Bank
said in its April Commodity Markets Outlook. The metals index is expected to rise as an 9 percent
drop in iron ore prices is offset by increases in all base metals prices, led by nickel, which is
forecast to rise 30 percent.
Agricultural commodities, including food commodities and raw materials, are anticipated to see a
price rise of over 2 percent this year on diminished planting prospects. Weather disruptions are
expected to be minimal.
Oil prices are expected to average $65/bbl over 2019 as well. Although prices are projected to
decline from April 2018 levels, they should be supported by continued production restraint by
OPEC and non-OPEC producers and strong demand. Upside risks to the forecast include
constraints to U.S. shale oil output, geopolitical risks in several producing countries, and concerns
the United States may not waive sanctions against Iran. Downside risks include weaker
compliance with the oil producers’ agreement to restrain output or outright termination of the
accord, rising output from Libya and Nigeria, and a quicker-than-expected rise in shale oil output..
While natural disasters such as Hurricane Harvey and Hurricane Irma have recently impacted oil
prices in the southeastern United States, these are normal occurrences during hurricane season and
do not represent any long-term disruption to the industry. Likewise, fears of La Nina have not
materialized this cycle and are not expected to greatly impact the sector in the foreseeable future.
Sector Analysis
Materials
The materials sector makes up about 2.9% of the S&P 500 with 27 constituents and has seen a -
5.57% return year-to-date. Materials is sensitive to changes in the business cycle and depends on
strong economy. It is also sensitive to the price of raw materials and is largely driven by supply
and demand fluctuations. The materials sector is comprised of five major industries: chemicals,
construction materials, containers and packaging, metals and mining, and paper and forest
products. Chemicals include agricultural, basic and diversified, and specialty which are all widely
used for manufacturing. Construction materials is highly cyclical and fragmented with companies
dominate in certain niche areas. Containers and packaging serve food and beverage, household
products, and pharmaceutical with dispensing and protection of products. Metals and mining
companies supply commodities used in many of the other sectors. Companies that perform well
tend to have substantial mine reserves, an extent of projects, and steady production. Paper and
10
forest products operate in lumber and building supply, paper, and timberland markets where
electricity and transportation tend to be the biggest expenses.
There has been a strong trend of mergers and acquisitions in the chemicals materials sector. The
Dow-DuPont mega-merger closed and there has been other activity from Akzo Nobel, PPG,
Axalta, and others in the chemical space. The industry looks to benefit from accelerating residential
construction, continued growth in non-residential construction, and the possible increased in
infrastructure benefit from the government.
Current Holdings: Martin Marietta Materials (NYSE: MLM)
Information Technology
The Information Technology (Tech) sector includes companies that make hardware and software,
as well as companies that provide services in data analytics, technology implementation, and
technology process improvement. Companies in this sector include Facebook, Amazon, Apple,
Netflix, and Alphabet. Year-to-date the technology sector has returned 2.62%. Over the past 20
years, tech has experienced more growth than any other sector.
The semiconductor subsector has performed especially well YTD with the PHLX rising 41.93%.
Some of the trends bolstering growth in the semiconductor subsector and the information
technology sector as a whole are cloud computing, big data, SaaS, IoT, autonomous vehicles and
artificial intelligence. There are two factors that could negatively impact tech. The first is a
downturn in the global economy. The tech sector is increasingly global, and if a large economy
such as China’s falters, it could hurt the whole industry. The second factor is the potential of
increasing interest rates over the next year. Increased rates mean increased costs of raising capital,
which could make it more difficult for companies to invest in growth opportunities.
Current Holdings: Veeva Systems (Ticker: VEEV), Alphabet (Ticker: GOOG), PayPal (Ticker:
PYPL)
Energy
Across the energy complex the driving narrative of the last couple of years has been the substantial
decline in prices. From crude to natural gas and its derivatives, prices have come under pressure
as a result of overproduction that has stemmed from a rebalancing of power, most evidently seen
in the global crude oil market. Through technological advances, previously unextractable “tight”
oil in plays across the United States (most notably the Permian and Eagle Ford Shales) began
producing millions of barrels.
The story of the last eighteen months has been one of balancing prices with production. Producers
must to produce in order to cover costs but cannot produce to the extent to which price fall below
the point at which production becomes uneconomical. Early 2016 saw prices dive below $30 /
barrel as forecasts for global growth (and therefore demand for oil) showed worrying negative
indications. These were the lowest prices in years and quickly recovered (West Texas Intermediate
11
closed below $30 / barrel for only 13 days in 2016). Today oil prices are recovered and stabilized
largely stabilized between $60-$70 / barrel for West Texas Intermediate and $65-$75 / barrel for
Brent (though WTI has closed above $68 / barrel and Brent above $75 / barrel in recent days.
The Student Managed Fund currently sees value in companies within the energy value chain that
can perform independent of commodity price swings and take advantage of the broad-based
domestic push for increased infrastructure. We would find these companies even more attractive
if the market has grouped these companies with those that live and die with commodity prices and
so has assigned a price that we deem to be below intrinsic value.
Current holdings: Enterprise Products Partners (Ticker: EPD)
Consumer Discretionary
The Consumer Discretionary Sector includes companies whose businesses are the most sensitive
to economic cycles. It consists of a manufacturing segment as well as a services segment. Within
the manufacturing segment is automotive, household durable goods, textiles & apparel, and leisure
equipment. The services segment consists of hotels, restaurants & other leisure facilities, consumer
retailing & services, and media production & services.
Year to date, the Consumer Discretionary Sector has increased by 4.96%, which higher than the
S&P 500 return of -0.25%. This sector is quite substantial, with a market cap of $5.65 trillion and
a market weight of 12.75% (Fidelity).
The Consumer Discretionary sector has a positive outlook due to increasing consumer confidence,
a tightening labor market, and higher wages. The unemployment rate has also been declining over
the recent years. These factors allow families to have an increasing amount of discretionary income
that is available to spend on goods and services. Companies who are able to establish strong brand
loyalty and adapt to changing consumer behaviors and expectations will continue to flourish ahead
of others within the sector.
Some factors of concern for this sector include the recent trend of shopping online. Consumers
have been spending more time searching for the best deals on the internet, which could affect
profit-margins within the Consumer Discretionary sector. There has been a significant decrease in
mall traffic due to millennials’ new purchasing habits and their use of technology. This consumer
preference also creates heightened retail competition throughout the market.
Current Holdings: Starbucks (Ticker: SBUX), Disney (Ticker: DIS)
Consumer Staples
The Consumer Staples Sector includes companies whose businesses are less sensitive to economic
cycles. It includes manufacturers and distributors of food, beverage, and tobacco as well as
producers of non-durable household goods and personal products. Other companies that may be
classified under Consumer Staples include food & drug retailing companies as well as
hypermarkets and consumer supercenters. These companies tend to be seen as consumer
12
necessities; thus the sector as a whole is considered defensive and can be trusted during periods of
economic downturn.
The sector is strong and can sustain market fluctuations. It should be noted, however, that the
sector faces headwinds including skepticism about President Trump’s policies, increased
geopolitical tensions with North Korea, and increased competition from international markets.
However, these uncertainties make Consumer Staples relatively attractive since the sector is
positioned to withstand volatility. Additionally, companies in the Consumer Staples industry
benefit from cost cutting initiatives, which is amplified by decreasing energy costs.
A key market factor for Consumer Staples stocks is consumer confidence. With an improving labor
market, consumer confidence reaching a 16 year high, and consumer spending at strong rates now
may be a good buy opportunity for Consumer Staples. Year to date Consumer Staples has lost
11.93%, lagging significantly behind the broader S&P 500 Index (-0.25% YTD).
Current Holdings: Costco (Ticker: COST), Constellation Brands (Ticker: STZ)
Financials/Real Estate
The financial sector has maintained steady growth as of late, supported by interest rate
normalization and the prospect of a steepening yield curve, aiding profitability among banks - the
sector’s largest industry. The sector rose sharply after the 2016 election due to promises such as
deregulation and large-scale corporate tax cuts which are beginning to materialize. Solid economic
growth and a tight labor market will contribute to future tailwinds within the industry.
Higher loan growth is expected as businesses capitalize on the increased capital expenditure
deductibility over the next five years, and banks will continue to see moderate expansion in net
interest margins as they hike their prime rates at a quicker rate than they raise the rates offered to
consumers for CDs and other deposits. One trend that is particularly important is how sticky retail
deposits continue to be, a measure which is important considering that many banks currently have
significant levels of non-interest-bearing deposits. Developments in regulation will also be
important, as the government will seek to redefine the level of assets which banks will be subject
to heightened oversight. Increasing the level to $250 B from $50 B will provide relief for a number
of banks in the industry.
The Private Equity industry is experiencing a post-crisis high in fundraising with the largest
players benefitting the most. However, the companies in that space are being regarded with more
uncertainty given the proposed changes to how carried interest will be treated in the new tax plan.
Units of all major players have struggled although we are confident that any changes will have an
immaterial effect on how efficiently these companies can locate opportunities and return capital to
unitholders.
Current Holdings: Blackstone (Ticker: BX), KeyCorp (Ticker: KEY), Equinix (Ticker: EQIX)
13
Industrials
The Industrials sector contains a broad spectrum of companies that produce goods or provide
services to both consumers and business for industrial use. The types of companies included in
this sector include industrial conglomerates (United Technologies Corporation, General Electric),
aerospace companies (Boeing), heavy machinery companies (Caterpillar), airliners (Southwest
Airlines, American Airlines Group), shipping companies (FedEx, United Parcel Service), tool
manufacturers (Stanley Black & Decker), fire and security companies (Tyco International PLC),
defense companies (Lockheed Martin), etc. The industrial sector currently holds a weight of
9.88%. The sector is primarily driven by supply and demand for commercial, industrial, and
residential construction as well as demand for manufactured goods.
Industrials generally fare well when the purchasing managers’ index (PMI) is above 50. PMI levels
stand at 59.3 in March suggesting industrials are in a strong cycle. New orders on U.S. durable
goods show positive outlook with Q1 2018 posting 3.9% YoY growth. Sector specific there's a
trend in declining auto sales as consumers continue to favor auto leasing and the market is
experiencing an inventory glut.
Some important factors that will likely determine the performance of the industrial sector in the
upcoming years will be global growth, government spending, and tax reform. Recent data has
suggested to investors and to the market that China, the largest developing economy, may be
slowing down. This slowing economy will likely reduce the demand for industrial products, with
companies producing fewer products. However, increased infrastructure spending plan and
protectionist policies on domestic manufacturing industries will likely stimulate domestic
industrial companies, such as Caterpillar, and Stanley Black & Decker. In addition, a proposed
increase in the defense budget bodes well for companies like Boeing, UTC, Lockheed Martin, and
GE. Although global demand may be softening, favorable domestic policies may be enough to
offset the disparity between industrial supply and demand abroad.
Year to date Industrials have declined 3.38% compared to the -0.25% the S&P 500 Index.
Current Holdings: AerCap (Ticker: AER), Waste Management (Ticker: WM)
Telecommunications
The telecommunications sector is comprised of firms that erect the backbone of global
communications. The driving narratives in the space include cloud infrastructure, and the internet
of things (IOT), which hold significant implications for the way consumers and businesses will
transact now and in the future. The largest companies in this sector are wireless operators, satellite
companies, cable companies, and internet service providers.
Current consumer trends within the sector include consumers choosing to stream video content
over the internet. Mobile devices and new technology have added to this demand for higher speed
internet services and are driving intense competition within the industry. Corporate trends in the
industry are concentrated on M&A activity that seeks to add content delivery features. Comcast’s
successful bid for NBC Universal in December 2009 and AT&T current contested bid for Time
14
Warner illustrate this trend. Year to date Telecommunications Services have declined 9.87%
compared to the 0.25 pullback in the S&P 500 Index. With decreased equity prices, finding a good
buy opportunity may be available even among the heavy competition.
Current Holdings: T-Mobile (Ticker: TMUS)
Healthcare
Overall we view the healthcare sector as an attractive spot to be both in the end of 2017 and moving
forward into the future. In general, health care companies have solid balance sheets, a much-
improved cost structure, and attractive dividend yields. Additionally, with the aging population in
both the United States and Europe, demand for healthcare products and services is expected to
increase through 2025, according to Deloitte. Various research firms expect the US healthcare
market to grow 6% annually over the next 5-10 years, while the global healthcare market is
expected to grow at 5% annually.
As it often the case, the largest risk factor associated with the US Healthcare market is legislative.
President Trump was unable to “repeal and replace” the Affordable Care Act in 2017, and has
industry experts unsure of when or if another attempt to reform healthcare will occur during his
presidency. If a dramatic overhaul is not in the cards, it does seem likely congress will work to
make amendments to the current Affordable Care Act; but, the impact of these amendments is
subject to much speculation at this point. As a result, the US Healthcare market is experiencing
uncharacteristic volatility. While this volatility may make some investors uncomfortable, we
believe we can use it to find value in an industry that is only guaranteed to grow in importance for
the nation’s largest generation, Baby Boomers.
Finally, BCA Research shows the healthcare industry has historically outperformed during cycles
of Fed hiking cycles since the 1970s. As we are currently in a hiking cycle, this is promising
research for the healthcare industry. Overall we expect to see solid, but not outsized, returns in the
healthcare industry.
Holdings: Danaher (Ticker: DHR), Celgene (Ticker: CELG)
Utilities
Currently, our team has stayed away from the utilities sector given the normalization of interest
rates. Historically, an extended period of rising long-term interest rates has been negative for the
sector. As economic indicators have improved, investors have moved away from the defensive
sector and towards other growth areas.
The headwind of rising interest rates makes utility equities less attractive compared to conservative
fixed income instruments. The S&P 500 utility index’s P/E multiple expanded to a record 19.4x,
above its high 16 years ago. The spread between the 10-year and the sector’s 12-month trailing
dividend yield is the tightest in 15 years. Recent tax changes are proving to be headwinds for utility
companies given the reduced value of existing tax credits. Due to these conditions, we are not
15
focusing on the sector but will continue to pay attention to strong companies operating in attractive
geographies.
We will continue to monitor companies within the industry given that the recent sell-off may
present an opportunity to own an undervalued business. Potential catalysts include continued
investment into electrical and natural gas networks, as well as the execution of their defined
investment plans, many of which lock in more than 5% in earnings growth. Risks include a cut in
regulated returns.
Current Holdings: N/A
Portfolio Positions
Costco (NASDAQ: COST)
On October 16, 2017 we purchased 462 shares of Costco at $159.12 per share.
Costco Wholesale Corporation is the world’s largest membership wholesale club with 730+
locations worldwide serving nearly 90 million members. A majority of their stores are in the U.S.,
Canada, and Mexico, with additional locations in the Asia and EMEA regions. Costco sells an
annual membership for $60 or $120 which give cardholders access to discounts at warehouse
locations. The company sells a broad array of national brands (3,700 SKUs) as well as Kirkland
Signature, their low-cost proprietary brand.
The Consumer Staples GICS Sector has returned 4.44% YTD, while the Hypermarkets & Super
Centers sub-industry has returned 10.57%. The industry is positioned to continue its positive
outlook, reflecting favorable growth in value-conscious customers. Job growth continues to be
steady, and wages, while sluggish, continue to advance. Hypermarkets and Super Centers are
poised to gain market share, based on their price advantage to traditional retailers. Revenue growth
is expected to be in the mid-single digits based on increased spending by higher-income customers
and small businesses, who are attracted by the quality and value offered at these retailers. The
industry is positioned well to protect against macroeconomic trends, because of the inelastic
demand for consumer staples. Headwinds for the business include continuing downward pressures
on margins, rising wages, foreign currency gains and losses, and shipping costs.
COST will deliver long-term returns due to its industry position and operational excellence.
Costco’s unique value proposition (low-cost, “treasure hunt” experience), strong customer
retention (90% historically), and established market share (17.5% w/in Wholesalers) make them
an industry stand-out. They have shown resilience amid increased competition from retail comps,
with Same Store Sales (SSS) of 7.3% in Q3 2017 vs. consensus estimate 5.4%. Costco’s expanding
E-Commerce presence (5% of 2016 revenues) and warehouse expansion in the U.S. and abroad
(~30 new locations annually) are important catalysts. Additionally, they are ramping up CapEx
spending to establish footholds in new geographies, such as France and Iceland in 2017. COST
shares declined 17% after news of the AMZN-WFM merger, creating an attractive entry point for
long-term investment.
16
Costco has a proven business model (high-density/low-cost) that allows them to price products
lower than industry comps (20% cheaper than WMT, 7% cheaper than AMZN on average). They
emphasize low labor costs (by selling products directly from pallets), high inventory turnover, and
high employee satisfaction and retention. Because of this operational excellence and skilled capital
allocation, Costco has grown EBITDA margins in the last 5 years (3.70% to 4.15%) and returned
between 11 and 14% on invested capital. Their experienced management team (13 year average
tenure) has shown ability to withstand price competition and maintain consistent margins.
Costco faces a few primary risks, the first being waning consumer confidence and slowing
economic growth. Consumer expenditures are subject to broader market conditions, and as a result
open the business up to some risk, which we feel is mitigated by Costco’s low-cost value approach.
Secondly, Costco faces competitive pricing pressures from its competitors, including Amazon,
which is mitigated by its efficient operations and supply-chain capabilities. Additionally, Costco
faces risks associated with its membership renewal rates because of competition from other
wholesale clubs and Amazon Prime. The performance of Costco’s online business and the nature
of its product offerings serve to mitigate this risk.
As of April 23, 2018, we have an unrealized gain of 21.65% on COST.
Starbucks (NASDAQ: SBUX)
On October 18, 2017 we purchased 1,315 shares of Starbucks at $54.59 per share.
Starbucks Corporation retails, roasts, and provides its own brand of specialty coffee. The Company
operates retail locations worldwide and sells whole bean coffees through its sales group, direct
response business, supermarkets, and on the World Wide Web. Starbucks also produces and sells
bottled coffee drinks and a line of ice creams. They are the world's #1 specialty coffee retailer,
Starbucks has more than 25,000 coffee shops in 75 countries. The outlets offer coffee drinks and
food items, as well as roasted beans, coffee accessories, and teas. Starbucks operates more than
12,700 of its own shops, which are located mostly in the US, while licensees and operate roughly
12,375 units worldwide (including many locations in shopping centers and airports). In addition,
Starbucks markets its coffee through grocery stores, food service customers, and licenses its brand
for other food and beverage products.
The coffee industry as a whole has enjoyed a healthy 4.6% compound annual growth rate in US
Dollar sales since 2012. This growth has mainly been driven by the increase in popularity of single-
cup brands and single-cup sales. In 2012 single-cup sales accounted for 21% of all coffee sales,
but that figure is up to 41% today. The outlook for 2018 for the entirety of the US coffee market
is less promising, analysts predict a slower 2% growth rate, but international growth projections
are higher. The Chinese coffee market is expected to grow as much as 5% annually in the coming
years as key coffee producers and distributors double down their investments in the region. Overall
the market is seeing a shift towards on-the-go coffee sales as firms continue to cater to millennials’
consumption habits. These sales are expected to grow at 3% annually.
17
Starbucks’ expansion efforts into China represent significant growth potential for the company.
Opening stores in China at a rate of one every 15 hours, Starbucks is quickly moving to gain market
share in the largest consumer goods market in the world. This expansion is built upon Starbucks’
already world famous brand. The coffee they provide and the upscale in-store experience they
offer consumers are distinct competitive advantages for the business. As such, Starbucks is an
organization positioned for continued growth and success in the long run.
Starbucks’ main competitors include Dunkin Donuts, McDonald’s, Burger King, and
establishments owned by Yum Brands. Dunkin Donuts is the organization which competes most
directly with Starbucks, as both companies are predominantly coffee restaurants. While
McDonald’s and Burger King’s brand are more widely known throughout the world, Starbucks is
the brand that first comes to mind when consumers think “coffee.”
Starbucks’ main competitive advantage is their strong brand and the brand equity they have built
among customers. Starbucks today is synonymous with an upscale coffee experience. It is a place
that offers free Wi-Fi for customers to come drink coffee, get work done, and enjoy the true Italian
coffee shop experience that inspired Howard Schultz to take over the company in 1987. Starbucks
is able to offer a consistent experience to all guests due to the organization’s no-franchisee policy
and its strict licensee terms. Starbucks is the market leader in the specialty-café space.
Brand recognition is a major part of Starbuck’s business model. Their idea of the third place and
their premium brand are key drivers of growth. If their reputation were to be tarnished you would
see growth both internationally and domestically slow. This would have major implications on the
valuation of the business.
As of April 23, 2018, we have an unrealized gain of 6.26% on SBUX.
AerCap (NYSE: AER)
On October 24, 2017 we purchased 1,397 shares of AerCap at $52.87 per share.
AerCap is the global leader in aircraft leasing. Their business model involves buying, selling, and
leasing hundreds of aircrafts to earn a consistent spread on their portfolio. As of June 30, 2017
AerCap owned, managed, or had on order 1,539 aircraft in its portfolio. With one of the most
attractive order books in the business, AerCap has one of the most comprehensive portfolios on
the market. AerCap’s headquarters is in Dublin and has full service offices in Amsterdam, Los
Angeles, Shannon, Fort Lauderdale, Singapore, Shanghai, Abu Dhabi, Seattle, and Toulouse.
AerCap has over 200 active customer in 80 countries including American Airlines, British
Airways, Air France and many more.
AerCap participates in the highly attractive aerospace leasing sector. Trends within the sector
include air traffic growth increasing on average by 5.5% seasonally adjusted. Even with major
macroeconomic events and acts of terror, the aerospace market has remained extremely resilient.
Over the past 20 years the world aircraft fleet has doubled while the operating lease fleet size has
quadrupled. More and more airlines see the lease market as a faster, cheaper, and more efficient
means for fleet growth. Additionally, the growing middle class (2.8BB to 4.8BB in the next 20
18
years) and continued growth in globalization are strong trends for continued growth within the
industry.
AerCap is positioned well within the growing aerospace leasing industry and sector. With one of
the most attractive order books in the industry, approximately 200 customers in 80 countries, and
a strong portfolio management team AerCap is positioned for continued growth and success in the
long run. AerCap’s three main competitive advantages are their broad market penetration, strong
relationships with OEM’s, and skilled management team. Being the largest aircraft leasing
company gives them strong bargaining power with the OEM’s. Lastly, AerCap’s management
team leverages their strong sector knowledge to make hundreds of intelligent buy/sell decisions.
AerCap, however, is not without risks. The two major risks AerCap faces are aircraft oversupply
and rising interest rates. Aircraft oversupply could reduce aircraft prices diminishing the value of
AerCap’s fleet. Additionally, because AerCap’s business is so reliant on debt rising interest rate
may result in significantly higher interest rate expenses.
As of April 23, 2018, we have an unrealized loss of of 0.32% on AER.
Blackstone (NYSE: BX)
On October 24, 2017, we purchased 2,115 shares of Blackstone for $34.94 per share.
Blackstone is a leading global alternative investment firm providing asset management services
and investment vehicles focused on private equity, real estate, credit, hedge fund solutions, and
infrastructure. Blackstone fundraises from institutional investors and deploys capital to invest in
assets with upside. Through value-added initiatives, the firm drives price appreciation until they
can strategically exit the position and return value to their investors. Management fees are earned
based on a percentage of assets under management (AUM) and performance fees are determined
based on how the assets perform. Fee-earning AUM drive revenues for investment firms such as
Blackstone. The firm is organized as a limited partnership and offers units, rather than shares.
The prevailing environment has supported profitability, namely in higher asset levels benefitting
fee-related earnings (FRE). The largest managers, such as Blackstone, are reaping the greatest
rewards and fundraising is at a post-crisis high. Alternative asset managers are seeing limited fee
pressure relative to their traditional counterparts and they have found profitable ways to approach
this trend. Institutional investors are seeking tailor products for their portfolios allowing for large
players to customize vehicles to meet their needs. As global assets continue to rise, alternatives
have achieved a market share of 11% and are projected to reach 13% by 2020. The industry is
seeing large amounts of undeployed capital, with $900B of dry powder.
Blackstone’s strong growth of fee-earning AUM will continue to drive both FRE and distributions
to unitholders. The strong fundraising environment and $90B in dry powder will serve as tailwinds
to drive this growth. A shift towards permanent capital vehicles will offer the firm more control
over earnings, with smoother performance and the ability to allow strong investments to deliver
more value over longer holding periods. Shifting away from traditional drawdown funds will allow
19
for more value to be delivered to Blackstone’s clients. The new $40B infrastructure fund will
substantially add to FRE beginning in 2019 while capitalizing on a crucial need in this country.
Blackstone’s main competitors are Apollo Global Management, Oaktree Capital Group, KKR &
Co., and the Carlyle Group. These firms compete for the same assets and Blackstone’s strength
can be seen through the firm’s unparalleled fundraising efforts. The closest competitor – Apollo –
has $150B less in AUM. Blackstone’s suite of vehicles and amount of available capital positions
the firm for continued success amongst peers.
With $371B in AUM, Blackstone’s competitive advantage lies within their ability to leverage the
largest capital base in the industry along with their exceptional operational expertise. With $90B
in dry powder, their patient and disciplined nature means that any turn in the cycle will present
new opportunities. The firm’s extensive relationships allow them to operate on a global scale and
the communication between their various business lines supports their mission for responsibly
deploying capital.
Blackstone is exposed to traditional risks within their industry, many of which relate to prevailing
asset prices across regions and classes. While their performance does not track public markets, the
firm’s move towards net asset value fees increases their direct exposure to market performance.
Also, the firm’s unique business structure carriers unique tax implications for investors such as
distributions being eligible to be taxed as regular income.
As of April 23, 2018, we have an unrealized loss of 7.75% in Blackstone.
Disney (NYSE: DIS)
On October 24, 2017, we purchased 370 shares of Disney for $98.19 per share. After the
announcement of an agreement between Disney and Twenty-First Century Fox, our thesis and
model were updated to reflect the pending acquisition. We then decided to purchase an additional
186 shares of Disney for $109.77 on January 31, 2018.
The Walt Disney Company is a diversified, global entertainment conglomerate operating in four
main sectors: Media Networks, Parks and Resorts, Studio Entertainment, and Consumer Products
& Interactive Media.
Media Networks is the largest segment, consisting of cable and broadcast networks, and TV and
radio stations. Major TV stations include ABC, ESPN, Disney Channels, and Freeform. Revenue
is generated mainly from fees charged to cable providers and advertisers, and the sales of Disney
programming rights. The Parks and Resorts segment is comprised of domestic and international
theme parks and resorts Disney owns or has ownership in. Revenue is generated from ticket sales,
hotel stays, and in-park purchases. Studio Entertainment produces and acquires motion pictures,
direct-to-video content, musical recordings, and live stage plays under Walt Disney Pictures, Pixar,
Marvel, Lucasfilm, and Touchstone. Revenue in this segment is generated from the distribution of
films, ticket sales, distribution of music, and licensing of intellectual property. Lastly, Consumer
Products licenses Disney characters for the creation of various products, merchandise, and
20
electronic games. Revenue is mainly generated from licensing agreements and sales of the
products in the company's retail stores.
Disney has historically maintained a strong brand with undoubted consumer loyalty. It operates as
a market leader in the entertainment and media industries. It has the capital to support changing
operations, and the influence to be a market mover. Disney will continue to provide long term
value through its global presence and brand, studio and media success, and timeless ability to
attract consumers.
Currently, Disney is breaking into the Direct-to-Consumer media market. As more consumers are
‘cord cutting’ and opting for a digital experience, Disney is positioning itself to capture this
demand. Specifically, through Disney’s recent 75% stake in BAMTech, a sports streaming
platform, Disney will sell ESPN content on the Direct-to-Consumer market in 2018. Additionally,
Disney is launching a streaming platform of its original programming. This will be the only way
to access Disney’s content. With prices to be below competitors, Disney is expecting to capture a
large market.
Additionally, Disney is experiencing large international growth. After opening Disney Shanghai
in 2016, Disney has already broke even on costs and seen over 11 million visitors. With this
awareness and success, Disney plans to open more attractions tailored to the consumer preferences,
attracting more visitors. Disney is also expecting box office success in its Studio segment in 2018,
with 9 ‘blockbuster’ potential films in the pipeline. This success would boost the Consumer
Products and Interactive Media segment as well.
In December of 2017, Disney and Twenty-First Century Fox announced a definitive agreement for
Disney to acquire assets from Twenty-First Century Fox for $52.4 billion in stock. The deal is
pending regulatory approval but is expected to close in the summer of 2019. Disney will acquire
significant assets from Fox within television, film, and direct-to-consumer (DTC) markets. For
example, this acquisition would bring Disney Fox Sports Networks, Avatar, and a 39% stake in
Sky, a DTC telecommunications company in the United Kingdom. Additionally, Disney would
receive a 30% stake in Hulu, increasing their ownership to 60%.
Overall, Disney saw this deal as an opportunity to increase their catalog of intellectual property
across many segments. First, Disney would become a majority shareholder of Hulu, making it a
major player in the streaming market. Similarly, Sky would not only enhance their DTC and SVOD
capabilities, it would allow them to do so globally. In addition to Sky, this acquisition expands
Disney’s international presence. Sports networks will stretch into Europe, India, and Latin
America, complementing ESPN and supporting Disney further as it penetrates global markets.
Likewise, Fox’s 350 channels reach 170 countries. Lastly, financially, this acquisition would
provide Disney with $2 billion in cost synergies by 2021, accelerate revenue, and grow EPS as
soon as the second year after the close. Importantly, Disney’s CEO, Bob Iger, will extended his
contract until 2021 in order to participate in the integration of Fox’s assets.
Disney’s main competitors are Comcast, Time Warner, 21st Century Fox, CBS Corp., and
Discovery Communications. However, Disney operates within many different industries, as it is a
diversified conglomerate. In respect to the main competitors, Disney is the largest company, with
21
a leading P/E, EPS, and EBITDA. However, Disney’s biggest asset is its brand, giving it a
competitive advantage other media conglomerates do not have. Disney not only has influence over
its peers, but also over its consumers, allowing it to be secure as the market changes.
Some risks Disney faces are, firstly, changes in technology and consumer consumption,
particularly regarding ESPN and cable streaming, are reducing a demand for certain products.
However, Disney is adapting their business model to create alternative distribution channels to
capture the market lost in this area. Secondly, is it difficult to protect against intellectual property
and company data theft. IP is critical to Disney’s success, so they are devoting “substantial
resources” to protecting against theft and fight against unlicensed product use. Lastly, Disney’s
success is dependent on consumer tastes and current market conditions. However, Disney is
investing resources to develop products tailored to current consumer preferences and is hedging
against economic downturn, which they have historically overcome.
As of April 23, 2018, we have an unrealized loss of 1.79% on DIS.
Danaher (NYSE: DHR)
On October 30, 2017, we purchased 396 shares of Danaher at $91.52 per share.
Danaher Corporation is a well-diversified industrial and medical conglomerate whose products
test, analyze, and diagnose. Its subsidiaries design, manufacture, and market products and offer
services geared at worldwide professional, medical, industrial, and commercial markets. Examples
of Danaher’s products include water quality test kits, microscopes, dental turbines, and many other
products a doctor would use on a daily basis. Danaher’s businesses are broken up into four main
segments: Life Sciences, Diagnostics, Dental, and Environmental & Applied Solutions. These
business segments account for 32%, 30%, 16%, and 22% of total revenue, respectively. Danaher
operates across the globe, with roughly 38% of revenue coming from the United States, 30% from
Europe, and the remaining 32% coming from other regions with an emphasis on Asia and
Australia.
Since Danaher operates in such disparate segments of the industrials industry, it is difficult to
characterize one broad overarching trend affecting Danaher’s business. That said, 78% of revenue
is associated with healthcare in one form or another, which is promising given the fact that the
U.S. healthcare market is expected to grow at 6% annually through 2025. Worldwide, the $7.5
billion healthcare industry is expected to grow at 6.0% annually, with more growth seen in
transition economies to the tune of 7.5% annually. These growth assumptions are absent of any
healthcare major reform taken by the United States or other major nations. Although speculating
on politics is a losers game when it comes to making investment decisions, it should be noted that
any healthcare policy changes made by the United States will cause increased healthcare spend
both domestically and across the globe. Such a change would positively affect many of Danaher’s
business segments.
Danaher’s ability to target, acquire, and deploy the Danaher Business System into their operating
companies. Over the last five years Danaher has acquired companies like Pall, Cepheid, and
Phenomenex. Their ability to buy strong brands within the healthcare space and then deploy the
22
Danaher Business System to improve operating margins through increased efficiency is unlike
anything their competitors are able to do. Danaher has a 25+ year track record of successful
acquisitions and implementations of the Danaher Business System.
We believe Danaher’s strong management team, commitment to the Danaher Business System,
and its positioning as a market leader in the Healthcare and Life Sciences space will enable to firm
to grow over the next 10 years. The Danaher business system is a tried and true method of
integrating acquired companies into the broader organization and improving operating margins
through increased efficiency. This combined with stable revenue growth around 6% annually
makes Danaher an attractive investment.
With this being said, Danaher is not without risks. A large part of Danaher’s business takes place
within the healthcare industry. Legislative uncertainty regarding the Affordable Care Act and the
broader healthcare industry could be of concern. Additionally, Danaher achieves a lot of its growth
through acquisitions/spinoffs. The unsuccessful execution of one of these would cause a reduced
valuation of the business.
As of April 23, 2018, we have an unrealized gain of 10.73% on DHR.
Veeva Systems (NYSE: VEEV)
On October 30, 2017, we purchased 1,230 shares of Veeva Systems for $59.16 per share.
Veeva is a healthcare information technology company that provides cloud-solutions specifically
tailored to the life sciences and other highly regulated industries. Veeva’s solutions to its greater
than 550 customers provide two essential functions, sales and marketing and research and
development. Their products provide these functions through the use of their commercial cloud,
which offers more traditional CRM services, and their Veeva Vault. Veeva Vault is a proprietary
platform of unified applications that allow a company to address every step of the product
development lifecycle. Veeva looks to add more applications to their Vault platform which will
increase customer integration.
The life sciences industry is a $1.7 trillion industry that is growing at a 6% CAGR. Within the
industry, $50 billion is annually devoted to IT spending and $7 billion is specifically focused on
cloud-solutions. Currently, Veeva only consists of 9.6% of their total addressable market, which
provides room for significant growth in the life sciences industry. The life sciences industry is
highly regulated and demands the need for compliance and quality control software. Veeva is able
to capitalize on this demand as a best of breed, unified platform. This integration will reduce the
costs associated with bringing a drug to market.
In addition to their specialization in the life sciences industry, Veeva is looking to expand out into
other highly regulated industries with their Vault QualityOne software. So far, Veeva has 10
customers outside of life sciences, including a top 5 consumer packaged goods company.
Veeva stands at the crossroads of two dominating factors in the life science space – innovation and
regulation. Here the company has excelled and executed in the past – and is positioned to transform
23
the industry. They look to leverage their best of class products and services to increase and further
penetrate their customer base. Their expansion into OLS industries with their QualityOne
application looks to increase their TAM and provide a beachhead for future products. They look
to take advantage of cross-sell products which will increase their customers switching costs and
lead to a wider economic moat.
Veeva has a distinct competitive advantage because they are the only unified cloud-solutions
platform in the life sciences industry. They also have best of breed products which customers have
looked to integrate more of as their relationships have matured. Companies are looking to replace
the logo soup of providers for their old CRM needs with Veeva’s one-stop-shop solution. They are
competing with legacy providers such as Oracle and SAP that do not have the life sciences focus,
integrated platforms, or Veeva’s proprietary Vault platform.
Veeva faces the risk of having large software companies start to specifically focus on the life
sciences industry. Veeva looks to defend their position by having many years of experience
focusing on the space and providing specialized solutions through their unified platform and
proprietary Vault system. Data security can be a problem with any large, sensitive data set, but
Veeva’s integrated platform and annual testing ensures data security. Their risk of expansion into
OLS industries threatens their innovation and quality in life-sciences related software. Veeva has
continued to innovate their Vault platform and look to roll-out two new applications in the next
year. They are devoted to the life sciences industry and have only worked with early-stage
integration of their QualityOne application OLS.
As of April 23, 2018, we have an unrealized gain of 23.14% on VEEV.
Celgene (NASDAQ: CELG)
On November 10, 2017, we purchased 728 shares of Celgene at $101.45. After declining to $88.63
in 2018, we sold about half of our position (364 shares) to free up capital for use in other positions.
Though our confidence in the stock long term persists, we believed other companies in the
portfolio, specifically Alphabet, would be stronger in the short-term. We maintain our half position
to hopefully recoup losses in the long run.
Celgene is a biopharmaceutical company that discovers, develops, and commercializes primarily
cancer drugs. It is global, with operations in 60 countries and sales in 70; however, half of its
revenue is generated in the US. Currently, Celgene’s R&D expense is 31% of revenue, but their
R&D capabilities are unique in that they partner with other research facilities. With this, they can
share the cost and the risk of developing new drugs.
Celgene’s five largest drugs by percent of revenues and disease type are: Revlimid (62%, blood
cancer); Pomalyst (12%, blood); Otezla (9%, psoriasis/arthritis); Abraxane (9%, breast/pancreatic
cancer), and Vidaza (5%, blood). Revlimid’s patent expires in 2027 in the US, and 2024
internationally. However, Celgene is extensively expanding the use of its current drugs in order to
gain market share, while also developing over 100 other drugs, several of which are expected to
be blockbusters.
24
While historically successfully navigating an intensive FDA regulation process and patent
restrictions, Celgene demonstrates strong operational performance in the oncology treatment
space, has an expanding portfolio of billion-dollar drugs, and is currently at a discounted price
basis.
Celgene is a dominant drug manufacturer. While growing international operations, they command
a peer-best 96% gross margin and are on pace to grow EPS by 19.5% CAGR through 2020. They
dominate the myeloma (blood cancer) and psoriasis/arthritis markets, boasting high-teens revenue
growth over the previous five years. Additionally, Celgene is not only focused on creating new
drugs, but also finding new areas that their current drugs can be applied to, quickly and effectively
growing their market.
In its pipeline, Celgene has over 100 drugs in clinical phases. Several of which (e.g. Ozanimod
and Idhifa) are projected to be billion-dollar drugs. With the near term installation of these key
drugs, Celgene is on track to reach its projected 14.5% revenue CAGR and 19.5% EPS CAGR by
2020. Beyond 2020, the continued investment in R&D through external partnerships and pipeline
of 100+ other drugs will continue to grow Celgene.
Additionally, Celgene’s 2017 Q3 results sent shares down ~33%. Although management
announced 11% sales and 21% EPS year-over-year growth and a $3.8 billion share repurchase
program, 2017 and 2020 projected results were adjusted slightly downward. Management is fully
committed to meeting these new price targets, and this selloff provides an attractive entry point.
Celgene’s main competitors are Biogen, Gilead Sciences, and Amgen. Celgene’s drug portfolio is
diversified among blood and other cancers while Biogen, Gilead Sciences, and Amgen are focused
on neurology, HIV/AIDS, and blood deficiency, respectively. Although they are all drug
companies, Celgene dominates the oncology market, especially in blood-based cancers.
Additionally, compared to its competitors, Celgene has the largest R&D expenditure as a percent
of net sales. This allows them lead the market in drug discovery and patenting. Additionally,
through their R&D capabilities and market specialty, Celgene has benefitted from pricing power.
The prices of their drugs have risen in the past years, yet demand is still met. However, sales
growth is mainly generated from volume, not price, giving Celgene insurance if prices are forced
to come down. R&D efficiency and price leadership helps Celgene earn industry-leading gross
margins (96% and growing) and impressive EPS growth.
We recognize a few important risks with our recommendation of Celgene. First, Celgene derives
more than 60% of its annual revenues from its blockbuster cancer drug, Revlimid. Failure to
diversify revenues through product development may put profitability at risk when the drug’s
patents expire (2024 in Europe, 2027 in US). Next, recurring sales of their key drugs relies on
patent protection. Patents for Celgene’s four largest drugs expire between 2023 and 2028. A
diversified pipeline of 100+ drugs and releases of new billion-dollar drugs should mitigate these
risks. Finally, a recent pipeline miss (Mongerson) and trimmed guidance caused a sell-off in
October. Negative investor sentiment may limit upside in the near term. We believe investors will
return to the stock as their pipeline materializes in the long-term.
25
As of April 23, 2018, we have an unrealized loss of 12.32% on CELG.
Martin Marietta Materials (NYSE: MLM)
On December 1, 2017 we purchased 392 shares of Martin Marietta Materials at $203.30 per share.
Martin Marietta is a leading supplier of aggregates products, cement, ready mixed concrete, and
asphalt and paving services. An active participant in industry consolidation, Martin Marietta has
completed 85 acquisitions since its IPO in 1994. These have strengthened its position as a major
player in key markets. The company’s business model stresses identifying attractive markets to
enter as well as invest in present markets to drive organic growth. Historically, government
infrastructure spending drives half of the business’ volumes while the more cyclical residential
and non-residential construction industries make up the remainder of revenues.
The construction aggregates industry is fragmented in the U.S., consisting of over 5,600
companies. The 10 largest companies comprise 35% of the market share. Martin Marietta is second
to only Vuclan Materials. The concretes and aggregates market sales in the U.S. is historically
broken down between half public and half private. The public sector sales look to be increasing
from federal government infrastructure spending through the increased highway spending from
the FAST Act, passed in Dec. 2015. Municipalities are looking to contribute to this growth from
state’s DOT funding. The U.S.’s infrastructure report card from the ASCE gives the U.S. a D+
grade. This demonstrates the need for public investment in the country’s infrastructure. The private
sector looks to bolster growth through accelerated housing starts in residential construction and
continued growth from non-residential construction.
The failure of Washington to deliver on infrastructure promises as well as record precipitation in
key geographies have depressed MLM’s valuation. These pressures are neglecting present strong
fundamentals that are poised to drive durable growth through the remainder of the construction
industry’s recovery. We believe MLM’s presence in financially strong states will drive demand.
They have seen strong pricing power in the face of externally-pressured volumes and management
has made gathering plentiful reserves a long-term capital focus.
Martin Marietta’s main competitors are Vulcan Materials, Eagle Materials, and CRH. These are
all publicly traded concrete and aggregates companies that operate in slightly different
geographies.
Martin Marietta produces 73% of their revenue from TX, CO, NC, IA, GA. These geographies all
have high demand for road spending and the financial strength to support it. Martin Marietta’s
management has been diligent in expanding their geographical footprint with a roll-up strategy
due to the importance of location in the industry. Quarries need to be within 70 miles of the
aggregate’s destination otherwise they become unprofitable due to the transportation costs. This is
difficult because of the environmental and zoning regulations that make it increasingly difficult to
develop new quarries and expand existing ones. Martin Marietta’s reserves near the Texas Triangle
and other key geographies give them a competitive advantage.
Any construction materials company is going to experience some cyclicality. However, the
concretes and aggregates market receives 50% of their sales from the public sector. This allows
26
for better visibility with multi-year contracts and less sensitivity to the cyclicality of the private
sector. Another possible risk is government standstill not allowing increasing funds towards
infrastructure. This is mitigated by the fact that Martin Marietta has private sector exposure and
they operate in states that have the need for infrastructure investment and the stability to support
it from their state’s DOT budgets.
As of April 23, 2018, we have an unrealized loss of 3.24% on MLM.
Enterprise Products Partners (NYSE: EPD)
On January 26, 2018 we purchased 2,725 shares of Enterprise Products Partners at $29.34 per
share.
EPD is a publicly traded Delaware limited partnership, the common units of which are listed on
the New York Stock Exchange (“NYSE”) under the ticker symbol “EPD.” EPD was formed in
April 1998 to own and operate certain natural gas liquids (“NGLs”) related businesses of EPCO
and are a leading North American provider of midstream energy services to producers and
consumers of natural gas, NGLs, crude oil, petrochemicals and refined products. Their midstream
energy operations currently include: natural gas gathering, treating, processing, transportation and
storage; NGL transportation, fractionation, storage, and export and import terminals (including
those used to export liquefied petroleum gases, or “LPG,” and ethane); crude oil gathering,
transportation, storage, and export and import terminals; petrochemical and refined products
transportation, storage, export and import terminals, and related services; and a marine
transportation business that operates primarily on the United States (“U.S.”) inland and
Intracoastal Waterway systems. Their assets currently include approximately 49,300 miles of
pipelines; 260 MMBbls of storage capacity for NGLs, crude oil, petrochemicals and refined
products; and 14 Bcf of natural gas storage capacity.
EPD is an upper-tier player in the midstream pipeline business. Their market cap, north of $63
Billion, makes them the second largest player in the space behind Enbridge at $67B; and direct
competitors Williams Partners are far behind at $42B. Additionally, EPD dominates with over
50,000 miles of pipelines. While competitors like Kinder Morgan and Energy Transfer Partners
do boast closer to 70,000, EPD is still far ahead of Enbridge with 18,000 and ETP with 10,000.
Together, this combination of market cap and pipeline scale makes EPD a dominant midstream
player.
EPD’s main competitive advantage is economies of scale. No other player in the MLP marker has
the same combination of market cap and an expansive pipeline network that they do. Additionally,
EPD is well positioned to benefit from recent legislation lifting restrictions on internal NGL
exports. This is because they have multiple shipping and loading docks in the Houston coastal
area, as well as eighteen deep water ethane holding tanks. Finally, their industry leading credit
rating of Baa1 is a competitive advantage.
EPD is positioned to grow due to its economies of scale, future growth projects, and innovative
technology. With over 50,000 miles of pipelines, EPD will be a first choice for NGL producers for
years to come. Additionally, the company is projecting $5.2 Billion in new pipeline developments
over the next eight quarters. With their industry-leading credit rating, EPD is uniquely positioned
27
to capitalize on projects competitors could not afford. Finally, new discoveries in the isomerization
of butylene will enable EPD to produce 26% more petrochemical feedstock by converting waste
products back into useable material.
As of April 23, 2018, we have an unrealized loss of 9.36% on EPD.
Constellation Brands
On January 31, 2018 we purchased 374 shares of Constellation Brands at $220.07 per share.
Constellation Brands is a global producer and market of beer, wines and spirits. They have a wide
variety of brands and also has the right to brew and market Mexican Beers, such as Corona and
Modelo. They are the number one multi-category supplier, the number one high-end beer company
and the number one imported beer company in the U.S. Additionally, they are the leading premium
wine company in the world. They currently operate two breweries in Mexico and operate across
20,000 acres of vineyards to produce their wine.
In the beverage alcohol industry, there recently has been a trend towards premium beers, including
imported and craft beers. Constellation Brands is well positioned in this market due to their two
most recent craft brewery acquisitions: Funky Buddha Brewery & Ballast Point. There also has
been a trend in consuming healthier beverages, as consumers become more health conscious. To
tailor to these consumers, Constellation Brands has extended their Corona brand to develop
“Corona Premier”. This beer has less carbohydrates and less calories than Corona Light that is
currently being sold on the market. A fast-growing legal drinking age demographic are Hispanics
growing at about 3% annually until 2025. This is expected to boost the imported Mexican beer
demand.
Constellation Brands has a wide arrange of premium beers, wines, and spirits. With the increasing
trend towards premium beverages, this company has a great product portfolio to select from. This
company is able to detect consumer trends early on such as the heightened appeal of craft beers.
They have positioned themselves well in these growing markets and are able to sustain high
operating margins across all three categories they produce. They continue to add to their existing
product mix through acquisitions, which are experiencing high double digit growth. Lastly, their
ability to innovate and differentiate their products helps to appeal towards younger generations and
allows for margin expansion.
Constellation Brands boasts the competitive advantages of being the number one leader across the
imported beers segment that’s gaining more popularity among consumers. While the industry
category achieves growth slightly above 2%, Constellation Brands expects their business to grow
between 9 to 11% with the acquisition of two craft breweries and key brands like Modelo and
Pacifico increasing distributions. As the largest multi-category player in the industry, the company
can adjust their product portfolio across beer, spirits, and wine to accommodate changes in
consumer tastes. Their Constellation Ventures arm also lends to early detection and visibility of
blockbuster brands ripe for acquisition. Compared to peers, the company’s financial leverage lies
below main competitors such as Anheuser-Busch and Molson Coors allowing Constellation
Brands to take on important acquisitions or look for better financing.
28
Over competitors, Constellation Brands recently secured a new brewery capacity in Mexicali to
expand the supply of their imported beer. Among their highest cost components is glass
manufacturing which the company has taken positive measures to increase production at its lowest
cost supplier and add two new furnaces.
Finally, the company continues to spend in marketing to create brand equity across categories.
Their efforts in wine and spirits are to invest in a small selection of focus brands which are starting
to see double digit growth and margin expansion simply from digital media, television ads, and
higher consumer awareness. Their competitive advantages also lie in continual product innovation
and premiumization from launching new products such as the Michelada, Corona Premier, or
Black Box to meet consumer preferences.
Identified risks include a change in consumer tastes given the industry offers a wide variety. Most
of this risk can be mitigated as Constellation Brands is the largest multi-category player and can
shift marketing and resources to brands that are in popular demand. A second risk consists of
commodity risk across the cost of their inputs such as grapes. The company currently hedges about
56% of their commodities and has over 20,000 acres of vineyards to lower costs if prices increase
drastically. Finally, new trade agreements may impact their imports coming to the U.S., but
management has stated that costs could be shifted across borders especially the purchase of natural
gas that powers their breweries in low cost nations. Furthermore, any shocks to trade would send
the price of the Mexican Peso down and ultimately lower cost of goods produced.
As of April 23, 2018, we have an unrealized gain of 3.41% on STZ.
Waste Management (NYSE: WM)
On February 8, 2018 we purchased 940 shares of Waste Management at $80.81 per share.
Waste Management is the largest non-hazardous waste operator, servicing 21 million customers
across 48 states and Canada. The company owns nearly 400 collection operations, 249 active solid
waste landfills, 297 transfer stations, and 104 recycling centers. The company is vertically
integrated and has significant economies of scale – 66% of waste it collects disposed at its own
landfill. In the Collection business, they generally set up long term service contracts with clients.
For the residential market, contracts are generally 3-7 years and the fees are paid by either
municipalities or the actual individual homeowner. Commercial and industrial contracts are
typically 3 years, with fees depending on the type and scope of service. Generally, WM supplies a
large dumpster for businesses to use, which enables them to collect trash with one truck and
operator. The Landfill business is the most profitable, and is a source of competitive moat due to
the environmental and regulatory barriers in place to operation of landfills. The Transfer business
is also an important part of the business because haulers will stop there when a disposal site is not
nearby. This is where the garbage is sorted. Third party haulers also use these stations to dump
waste, and WM charges a “tipping fee” for this. The last part of their business is Recycling, which
is currently only 8% of revenue, but is the first to introduce residential single-stream recycling,
which has resulted in a dramatic increase in the volumes collected.
The waste management industry is a very competitive market with a few key drivers. The largest
driver is population, because as the population grows, the volume of trash increases. Another
important driver is manufacturing and construction, which is most notably seen in the way revenue
29
decreases in the winter months as construction slows. This results in some slight seasonality in
earnings. Severe storms also have an impact on the business, as post storm clean up generates
additional volumes.
Our investment thesis centers around three pillars: cash is king, expert capital allocators, and
internalization. First, WM has demonstrated a capability to generate steady and robust free cash
flows, all while maintaining a best in class credit rating. Having this access to cash provides
strategic flexibility to the business. Secondly, management has proven themselves to be expert
capital allocators. This is seen in their nearly 12% ROIC, and strategic acquisitions (supporting
their roll-up strategy) and divestitures. Thirdly, they have the largest and most diverse asset and
customer base, which begets a symbiotic relationship between business segments that leads to
lower operating leverage.
Waste Management is a leader in corporate social responsibility. This is highlighted by their
leadership in their green initiatives for wildlife preservation, green energy, and recycling. As part
of their methane to energy business, they create enough energy to power more than 500,000 homes
every year. Their ESG Disclosure Score is 27.3, which compares to an industry average of 19.9.
They also have better scores in % Independent Directors and % Women on Board, with 81.8 vs
79.0 and 18.2 vs 14.8, respectively.
Waste Management is the leader in the waste management industry, with the highest ROIC. In the
US, there are three top tier firms which are, WM, RSG, and WCM. These three firms have the
largest market shares, totaling nearly 48% of the market. The remaining players consist of
governmental players (think municipal garbage pick-up) and many small local and regional
players. These players are all subject to the same high levels of regulation, which creates high
barriers to entry in this industry. It is also difficult to leave the industry, particularly if you own
landfills, because the government requires that you manage those landfills into perpetuity to
prevent environmental damage.
Waste Management has a lot of competitive advantages over other firms, the biggest being its
economies of scale. Since the business is already so large, and integrated (note 66% top to bottom)
it means that they can leverage a multitude of cost savings up and down the value chain, which
puts them way ahead of the competition. Something interesting to note is their balance sheet
strength. They are under-levered compared to their competitors, and now with tax reform, they
will have the ability to go on a spending spree and accelerate their roll up strategy. They also have
strong management, that has a proven history of good strategic decision making.
The main risks we foresee impacting WM, include threats from competitors in their highly
competitive industry. They also face risks of increasing regulation and exposure to commodity
prices in their recycling business.
As of April 23, 2018, we have an unrealized gain of 2.07% on WM.
T-Mobile US Inc.
On February 15, 2018 we purchased 1,280 shares of T-Mobile US Inc. at $58.46 per share.
30
T-Mobile US, Inc. provides mobile communication services under the T-Mobile and MetroPCS
brands in the US, Puerto Rico, and the U.S. Virgin Islands. The company’s largest operating
segments are Postpaid Wireless, Prepaid Wireless, and Equipment Services from which they
derive 48%, 23%, and 23% of their revenue, respectively. T-Mobile operates as a low-cost industry
disruptor offering low-prices, great service, free bonuses, and simplicity as they strive to redefine
wireless as “The Un-carrier.” T-Mobile grows their user base by offering plans with superior value
to those of their competitors while leveraging the capabilities of their nationwide wireless network.
The wireless industry has seen a more aggressive behavior by the major players as competing
offerings have continually resulted in lower consumer wireless prices, as many plans and practices
are being simplified for the consumer. Growth in smartphone sales have continued to encourage
users to compare wireless providers and the recent iPhone releases have ushered in an upgrade
“supercycle”. The highest growth demographics include those 45-54 and 55+. Additionally, the
growth of wearables and IOT devices has been an area of growth in the industry. The emergence
of 5G coverage is expected to be complete by 2020 as firms such as T-Mobile have been heavily
investing in these next-generation networks for years.
On April 10th 2017, news broke that T-Mobile and Sprint’s parent companies Deutsche Telecom
and Softbank were in discussing a potential merger for the third time. If completed, this merger
would combine the third and fourth largest telecom providers in the USA. The combined entity
would surpass AT&T as the second largest telecom provider in the USA and would be poised to
surpass Verizon within the coming years. The merger talks started again as both T-Mobile and
Sprint begin their investment in a 5G network. By combining both entities they can better leverage
their capital and network capabilities and create a truly unmatched wireless network. There are
anti-trust concerns and the talks have just began, but the possibility for the merger provides
significant upside for T-Mobile.
We purchased a full position in T-Mobile given their exclusive focus on the wireless market, best
customer growth in the industry, and increasing quality of their newly national network and
offerings. We believe the company is undervalued because the market is discounting how
successful the company’s growth has been and how effective management has executed on their
strategic initiatives. T-Mobile’s network expansion since 2014 is the principal driver of their
growth although their distribution and presence lacked in newly covered geographies, or about
33% of the country. As they become a truly national network, their strengthened presence will
result in covering an additional 40 million subscribers, of which they are expected to capture at
least 10 million. Over a ten-year time horizon, we are confident that this growth will result in T-
Mobile having a scale similar to that of Verizon and AT&T within the wireless space and
ultimately increasing the pace at which they return capital to shareholders.
The main risks we see affecting T-Mobile are consumer churn rates in the highly competitive
mobile telecom industry, potential government regulation, and pressure from competitors offering
unlimited plans and integrated offerings similar to that of T-Mobile.
As of April 23, 2018, we have an unrealized gain of 7.93% on TMUS.
Alphabet
31
On February 28, 2018 we purchased 69 shares of Alphabet Class C at $1,119.35 per share. After
selling shares of another position in our portfolio (Celgene) and price of Alphabet dip, we saw this
as a strong buying opportunity, and on April 2, 2018 we purchased 35 additional shares of Alphabet
Class C at $1,003.43 per share. In conjunction to the price dip, we believe that Alphabet’s
performance and business model position it to be solidified in the market, while its ‘Other Bets’
will expand its offerings and capabilities in the future.
Alphabet is a leading technology company known most notably for Google. The holding company
was formed in 2015, and divides its segments into Google and Other Bets. Google is the leading
internet search engine, and 86% of its revenue is derived from advertising. Breaking this down,
the majority of advertising revenue is from advertisements on Google sites, while other advertising
consists of advertising on affiliate websites using Google’s platform. Other Bets are ‘moonshot’
ideas that revolutionize their respective industries. Nest (automated thermostats), Verily
(healthcare), Waymo (autonomous driving cars) are beginning to generate revenue.
Generally, the Information Technology industry has seen very fast and substantial growth.
Although there have been market fluctuations recently, as technology develops and the user base
grows, the industry will benefit. However, for the advertising industry specifically, global
spending continues to grow with a strong emphasis on digital and mobile advertising, whose
revenues are expected to be $250 billion worldwide by 2020. Additionally, the Cloud Computing
industry is expected to reach $160 billion by 2020, as well. More specifically, there is an increasing
shift toward Subscription Video on Demand (applicable to YouTube). Alphabet is positioned to
adapt to these trends.
Our investment thesis revolves around three key factors. Firstly, Alphabet has a strong core
business. It is the industry leader with a sustainable and profitable core business that grows in both
volume and through synergies in its business model. Next, Alphabet is focused on the future.
Beyond Google, Alphabet is launching revolutionary innovations that will expand Alphabet’s
market. Last, as technological capabilities improve globally, Alphabet will see international
expansion allowing it to grow its business further.
With this thesis, there are also catalysts that will boost Alphabet in the near term. Specifically,
while Other Bets have not generated revenue for Alphabet in the past, it is working extensively to
invest in various ventures that are beginning to be monetized. Additionally, as Artificial
Intelligence capabilities grow, Alphabet’s is able to harness it in all aspects of its business, and
most significantly in its “search” functionality. Lastly, Alphabet experiences a significant
ecosystem effect, as all of their devices are linked in a cohesive way that strengthens their platform.
Alphabet is the industry leader and dominates the market. Its biggest advantage is its business
model. As the internet expands, Alphabet is positioned to grow with it. Additionally, its
acquisitions like YouTube and ownership of Android expand and streamline its top line.
Alphabet’s ecosystem effect, along with its expanding its AI capabilities, positions it to grow far
beyond other competitors. Lastly, with over $100 billion of cash, Alphabet has the unique ability
to invest in R&D and take risks on innovative bets.
32
However, Alphabet also faces many risks to their business. First, tech companies specifically face
a lot of legal actions, and Alphabet is especially susceptible from its Other Bets. Next, many of the
bets Alphabet places are in risky market segments and may not result in desired outcomes. Lastly,
Alphabet faces a lot of competitive pressures from other players and could pressure its market
share.
As of April 23, 2018, we have an unrealized gain of 3.60% on GOOG.
Equinix (NASDAQ: EQIX)
On March 7, 2018 we purchased 192 shares of Equinix at $390.24 per share.
Equinix is a data center REIT. Their services include colocation, leasing rack space for servers
while providing cooling, power, and security. Their second major line of business is
interconnections, leasing fiber connections between collocated parties which also collects monthly
revenues and an initial instalment fee. Colocation accounts for 78% of revenue, while
interconnections account for 16%. The remaining 6% is MIS consisting of managed services only
available in select regions.
With technological changes, companies now exchange data, content, internet services, and cloud
storage. Equinix has grown a healthy customer mix consisting of five verticals. 25% network
providers such as AT&T, 20% financial services such as Bloomberg, 14% Content & Digital
media such as DirectTV and Netflix, 13% Enterprise such as Ford Motors, and 28% Cloud & IT
such as Amazon Web Services. Hosting these partners within the same data center provides
interconnection benefits making the density of partners a distinguishing factor when picking a
colocation provider.
Equinix competes with 650 other companies across the globe in data center offerings but maintain
their position as the largest data center operator in the world. The data center business looks to be
in the early stages of its growth, with Equinix being one of the first movers. The industry looks to
grow in double-digits in the future driven by positive trends in global internet traffic, e-commerce,
connected devices, high definition video and cloud-based storage and services.
Our investment thesis centers on three pillars: growing demand, top solution provider, and high
barriers to entry and switching costs. Nearly 90% of data was created in the last two years just
showing how much more demand of interconnectivity and data server space will need to be
available in the coming years. As enterprises continue moving to hybrid IT, content and network
demands increase, and public clouds make themselves available to collocate these factors will
create high sustainable growth in the following years. The company is growing a critical mass of
partnerships in key strategic hubs and metropolitan areas for lower latency or reduced operating
costs. Together they can support a global customer solution allowing customers to scale their
business as needed. The business is very hard to reproduce requiring large amounts of capital and
an established set of key partners. Customers also face high switching costs of moving their servers
to a different center and usually lock one to three-year contracts. Equinix’s premium service
alongside higher switching costs allows them to charge a rising premium on their cabinet space.
33
Equinix is devoted to corporate social responsibility and strong corporate stewardship. They focus
on green energy for their data centers and community outreach through their Equinix Impact
Program. Equinix is above industry average in both ESG disclosure score and percentage of
independent directors.
Equinix competes with a number of competitors across its different business segments, but there
is no other data center operator that has the same global scale and operational diversity as Equinix.
Their closest competitor is Digital Reality Trust, but they do not operate in all the same business
segments as Equinix and they do not have the same robust AFFO metrics.
Equinix’s competitive advantages stem from their global footprint, high-quality data centers, and
dynamic business ecosystem. EQIX has established a critical mass of customers with an
unmatched global scale comprising of 190 data centers in 48 metro areas with 176,000+ cross
connects. Equinix’s data centers demonstrate operating excellence with a 99.9999%+ uptime
record and they provide less than 10 milliseconds latency to more than 90% of the population of
North America and Europe. This builds a dynamic business ecosystem that connects 8,500+
customers directly with their customers and partners. The ecosystem hosts connections with almost
all carriers available locally and offers access to all major public cloud.
Some of the key risks for Equinix are customer retention, maintaining premium pricing, and
operating in a capital-intensive industry. The risks of customer retention and maintaining premium
pricing are mitigated through their high barriers to entry and the high switching costs for
customers. The capital-intensive industry serves as another barrier to entry because Equinix is
willing and able to allocate capital that competitors are not.
As of April 23, 2018, we have an unrealized gain of 4.05% on EQIX.
KeyCorp
On March 28, 2018 we purchased 3,632 shares of KeyCorp at $19.37 per share.
KeyCorp is a diversified financial services company that provides and commercial banking,
commercial leasing, investment management, and investment banking for individual and corporate
clients. They operate approximately 1,200 branches and 1,500 ATMs in 15 states, primarily
concentrated in the Northeast and Northwest US. Currently, about 60% of revenue comes from the
interest rate-sensitive Retail and Commercial Banking segment and the remaining 40% comes
from the fee-based asset management and investment banking segment.
The US regional banking sector is mature and highly saturated with players who dominate their
home geographies. The industry is heavily impacted by interest rates, including 30-yr. mortgage
rates, as well as aggregate debt levels in the economy. In 2018, US banks will benefit from several
planned rate hikes by the Fed, as well as potential deregulation by Congress. KeyCorp (~$140B in
assets) is at the midpoint of US regulatory spectrum, meaning they could see significant
compliance cost savings if Congress raises the threshold for SIFI recognition.
We recommend KeyCorp because of (1) revenue gains from their recent acquisitions of First
Niagara (FN) and Cain Brothers, (2) best-in-class investment banking (IB) capabilities among
34
regional banks, (3) a burgeoning loan portfolio with low charge-off rates, and (4) a clear plan for
operational improvement from management. First, KeyCorp continues to realize cost savings from
its merger with FN ($50MM per annum.) and capitalize on advisory relationships from the health-
care focused Cain Brothers. Next, we think KeyCorp’s full suite of IB products, and its surging
fee-based businesses, will drive long-term returns (Segment Rev. increased 25% in 2017). Finally,
KeyCorp’s loan portfolio has grown steadily through the current economic cycle (13% CAGR
2012-2017), while management has improved cash efficiency and returns on capital. We believe
they will achieve their optimistic ROTCE goals as macro factors, such as rising rates and decreased
regulation, provide near-term tailwinds.
KeyCorp’s closest regional competitors are Capital One, BB&T, US Bancorp, PNC Bank, and
SunTrust Bank. Banks are poised to take advantage of the rising interest rate environment given
that it will drive net interest margin expansion in the near term. Many of these companies operate
in their distinct geographic footholds where they source a large amount of their loans. Many of
their direct competitors stand to benefit less from the new Dodd-Frank asset thresholds given their
larger size.
The commercial banking industry is comprised of companies with similar business models that
are sensitive to interest rates and experience higher profitability during times of tightening.
KeyCorp has made strides in building out their fee-based offerings to insulate performance against
economic downturns. With an extensive suite of product offerings, KeyCorp’s investment banking
and capital market capabilities allows them to develop lasting customer relationships and foster
growth into the future.
We recognize a few key risks with an investment in KeyCorp. First, the firm has a scattered deposit
base across the Northeast region and lacks dominance in any one state. We see the FN acquisition
as an important mitigant: the deal increased overall deposits by 30% and thickened their coverage
in NY, PA, CT, and MA. We also see risk in KeyCorp’s sensitivity to interest rates and the credit
cycle, and its expanding debt balance ($15B or 1.02x D/E). However, the firm’s credit profile has
been strong, the quality of their loans has been improving (NPLs as a % of overall loans is in
decline), and all three ratings agencies maintain a stable outlook (Baa2).
As of April 23, 2018, we have an unrealized gain of 2.54% on KEY.
PayPal (NASDAQ: PYPL)
On April 4, 2018 we purchased 1,025 shares of PayPal at $73.08 per share.
PayPal is a leading technology platform and digital payments company that enables digital and
mobile payments on behalf of consumers and merchants worldwide. Their vision is to democratize
financial services, as they believe that managing and moving money is a right for all people, not
just the affluent. Their goal is to increase their relevance for consumers and merchants to manage
and move their money anywhere in the world, anytime, on any platform and using any device.
Their combined payment solutions, including PayPal, PayPal Credit, Braintree, Venmo, Xoom,
and Paydiant products, composes their proprietary Payments Platform. They operate a two-sided
proprietary global technology platform that links both customers, which consist of both merchants
and consumers, around the globe to facilitate the processing of payment transactions, allowing
35
them to connect millions of merchants and consumers worldwide.
PayPal operates in the digital payments space, which has seen rapid growth in recent years. As
early as 2015 only 6% of internet users used a digital wallet daily; that figure is up to 19% for all
internet users and 45% of affluent internet users by 2017, and it is expected to grow significantly.
While a competitive space, PayPal currently commands a market leadership with over 226M
customers who transfer over $131 billion in funds each year. The market as a whole is expected to
grow to accommodate upwards of one trillion dollars of transaction volume each year by 2030.
PayPal also operates as an intermediary for payment on platforms such as Airbnb and Uber, among
others. As these companies look to go public by 2020, they are expected to see increased traffic
and subsequent transaction volume, which will serviced by PayPal and others like them. The
market is growing on average at 11.3% per year over the past three years.
PayPal is the clear market leader in the digital space. They are the largest, most popular, most
trusted, and most secure digital payments platform available to consumers; and in a market that is
still so young and growing so rapidly these qualities have PayPal positioned to yield significant
returns over a 10 year time horizon. PayPal will remain the number one payments platform for
both customers and merchants due to its economic moat and the advantages it enjoys being a
double-sided platform at scale.
PayPal faces significant competition in the digital payments landscape. Competitors include Apple
Pay, Visa Checkout, and Pay with Amazon, among others. However, each of these competitors
offers digital payments solutions almost as an afterthought, whereas this is PayPal’s core business
focus.
99% of U.S. consumers have heard of PayPal, and 76% of them have used the service before.
When this is compared to Apple Pay, the next closest competitor with scores of 86% and 12%
respectively, we see just how dominant of a play PayPal truly is. PayPal is the trusted internal
funds transferor in over 200 countries, and the fact that they have never had a data breach leaves
consumers confident their financial information is safe at PayPal.
As online grows topline, margins are challenged. Ability for management to manage relationships
with major card issuers and financial institutions will continue to grow. Existing agreements with
both Visa and Mastercard are up for renegotiation in 2020. Additionally, the militarized cyber
world that we live in today presents one of the most prescient risk to PayPal’s business. A major
attack can have a devastating impact on the business, as customer trust would be advisedly
impacted, leading to a drop in transaction volume.
As of April 23, 2018, we have an unrealized gain of 8.20% on PYPL.
Lessons Learned:
The Student Managed Fund is a highly respected and coveted program. One of the reasons the
program is thought of in such a positive light is students understand their ability to learn in a
36
different way. The Harvard case method taught by Chris Wilkos is a different experience than you
get in any other class during your University of Connecticut undergraduate studies. This class
paired with the responsibility creating and investment process to manage over $1 million develops
a myriad of soft and hard skills for its participants.
One of the key soft skills that students develop in the SMF is the art of thinking. Students are
taught to think with questions instead of solutions. We are also encouraged to participate in second
and third level thinking. Another key skill is the ability to present and defend your thesis. This
skill is honed while pitching stocks through our rigorous investment process. We must be able to
field all questions about a company and be able to defend our thesis throughout question. It is
imperative we make a persuasive pitch and highlight the important differentiating factors that
reiterate our buy recommendation. Throughout the investment process and during the process of
crafting our pitches, we must collaborate with our peers. This teamwork and ability to use multiple
perspectives allows us to craft an investment process that gives us the greatest chance of reaching
our goal of outperforming the S&P 500 index over a ten-year investment horizon.
In addition to the soft skills students develop in the SMF, they also develop a number of hard skills.
Students use financial modeling in the forms of discounted cash flows, dividend discount models,
and comparable company analysis to value companies in both stock presentations and case studies.
These are core valuation methods that the majority of students will use during their full-time
employment. Another transferable skill is developing the ability to identify key characteristics of
a business model. We are taught to look at companies from a value investor’s perspective and look
at their growth potential, economic moat, brand leadership, and other key characteristics. The
ability to use our resources of Bloomberg, Value Line, and other financial databases provide us
with the content we need to become experts in specific companies, industries, and the
macroeconomic environment.