Embed Size (px)
Citation preview

SME Company Survey Synthetic ReportJanuary 2002
PIONPION
Pion EconomicsRef pejt/Syn.doc
SME Company SurveySynthetic Report
January 2002

SME Company Survey Synthetic ReportJanuary 2002
PIONPION
Contents
1 EXECUTIVE SUMMARY .......................................................................................1
1.1 INTRODUCTION ....................................................................................................11.2 OBSERVATIONS....................................................................................................1
1.2.1 Trading Environment and HRD Response ..................................................11.2.2 Labour Turnover, Skills and Recruitment ...................................................11.2.3 Training and HRD Development.................................................................1
1.3 CONCLUSIONS......................................................................................................2
2 INTRODUCTION AND BACKGROUND .............................................................3
2.1 INTRODUCTION ....................................................................................................32.2 BACKGROUND......................................................................................................3
3 THE SURVEY INSTRUMENT AND SAMPLE BASE ........................................7
3.1 THE SURVEY INSTRUMENT..................................................................................73.2 THE SAMPLE BASE ..............................................................................................8
3.2.1 Sector Distribution Profiles ........................................................................83.2.2 Size Distribution Profiles ............................................................................8
4 THE OPERATING ENVIRONMENT..................................................................10
4.1 MARKET CONDITIONS AND FINANCIAL TURNOVER..........................................104.2 EMPLOYMENT AND PRODUCTIVITY...................................................................104.3 COMPETITIVE RESPONSE ...................................................................................104.4 COMPETITIVE PRIORITIES..................................................................................114.5 ORGANISATIONAL CHANGE...............................................................................124.6 HRD RESPONSE.................................................................................................12
5 SKILLS AND RECRUITMENT............................................................................13
5.1 OCCUPATIONAL CHANGE AND LABOUR TURNOVER.........................................135.2 SKILL REQUIREMENTS AND SHORTAGES...........................................................135.3 SKILLS ASSESSMENT .........................................................................................155.4 RESPONSIBILITY FOR SKILLS DEVELOPMENT....................................................175.5 RECRUITMENT OF SCHOOL-LEAVER & GRADUATES.........................................185.6 RECRUITMENT AND VACANCIES........................................................................19
6 HRD DEVELOPMENT..........................................................................................20
6.1 TRAINING...........................................................................................................206.2 TRAINING INTENSITY.........................................................................................236.3 GRADUATE AND MANAGEMENT TRAINING.......................................................236.4 PERFORMANCE AND TRAINING ASSESSMENTS..................................................236.5 INTEGRATED HRD DEVELOPMENT ...................................................................23
7 STUDY TEAM RECOMMENDATIONS.............................................................26
8 OVERVIEW, OBSERVATIONS AND CONCLUSIONS...................................28
8.1 OVERVIEW.........................................................................................................288.2 OBSERVATIONS..................................................................................................28

SME Company Survey Synthetic ReportJanuary 2002
II
PIONPIONPIONPION
8.2.1 Trading Environment and HRD Response ................................................288.2.2 Labour Turnover, Skills and Recruitment .................................................298.2.3 Training and HRD Development...............................................................29
8.3 CONCLUSIONS....................................................................................................29

SME Company Survey Synthetic ReportJanuary 2002
1
PIONPIONPIONPION
1 Executive Summary
1.1 IntroductionThe aim of the project discussed in this report has been to assist National Observatoriesand regional representatives in five candidate countries to:
• undertake an in-depth demand–side qualitative assessment of emerging regionalSME skill needs;
• examine demand-side perspectives in the context of local supply-sideinfrastructure; and
• prepare the context for the development of intervention strategies
The exercise has covered companies in a variety of sectors across five very differentregions within economies that are at different stages of the transition process. Theregions have per-capita GDP levels that range from 26% to 53% of EU15 levels withcorresponding variation in employment profiles.
1.2 Observations
1.2.1 Trading Environment and HRD Response
The majority of organisations have experienced an improved trading environmentalongside substantial productivity growth. HRD responses to this changing environmenthave focussed prominently on job interchange and multi-skilling but the proportion ofemployers indicating that their workforce is a ‘major strength’ to their organisations is, atbest, 40%. This suggests that a relatively large number of companies do not assign‘significant value’ to the role and contribution of their workforce or have somedissatisfaction with their capabilities.
1.2.2 Labour Turnover, Skills and Recruitment
Employers appear to have implicit concerns about the skills capability of their workforceand between 28% and 65% report skills shortages. These are not insignificantmagnitudes and suggest that the competitiveness of firms in all regions is beingconstrained to some degree.
In most cases employers appear to take the view that they are key agents for skillsdevelopment but that employees also have an important contribution to make. The roleand responsibility of government in skills development is generally seen as limited.
The impact of difficult-to-fill vacancies on performance is primarily seen in lowerprofitability, bottlenecks/reductions in efficiency and reduced forward planning withresponses dominated by an attempt to increase productivity and the job range of staff.The decision to undertake more training is relatively limited.
1.2.3 Training and HRD Development
The proportions of companies reporting training and development activities (above andbeyond routine induction and legislative requirements) are relatively high though this

SME Company Survey Synthetic ReportJanuary 2002
2
PIONPIONPIONPION
may be explained in some instances by supplier training accompanying capital equipmentpurchases. However, what evidence exists suggests that there may exist an element ofskill–bias in some of the study areas – greater training being provided to thoseoccupational groups with a relatively greater stock of initial skills.
Additional questions also indicate that the nature of training provision conforms to thisgeneral pattern with higher skilled workers tending to receive more formal andsystematic training investment but that graduate and management training remains anarea of relative under-investment across most of the regions.
Evidence from the survey exercise indicates the general absence of a coherent andintegrated HRD framework in most if not all of the regions. Despite the fact that thesurvey results clearly profile the connection between HRD and growth, it remains thecase that many organisations fail to bind together business development and HRDpolicies.
1.3 ConclusionsThe exercise reported in this document has represented a commitment of a large numberof persons and organisations in the study regions. It has also been an important exercisefor three primary reasons, namely it has:
• provided a coherent way of assessing demand-side skills and training issues ‘incontext’;
• addressed the type of issues that will need to be considered in the progressiontowards Structural Funds Programming; and
• assisted the development of ‘evidence-based’ labour market intelligence (LMI)needed to secure and access an adequate resource base for HRD policyinterventions.
Despite the variation in regions and sample sets, the exercise has provided a profile ofdemand-side considerations and attitudes that are broadly consistent across regions. Thestudy has pointed to a number of potential deficiencies and inconsistencies in employerperspectives towards HRD development within their organisations and assisted regionalorganisations to form an initial set of recommendations designed to enhanceopportunities for growth.
Analysis of the results also indicates that there exists an underlying rationality across thesample set in terms of patterns of responses to underlying difficulties. Skill shortagesand training levels appear to be more pronounced in regional companies experiencingstrong market and productivity growth as well as being positively related. This is apromising outcome but the evidence remains that large numbers of employers undervaluethe potential contribution of employees and fail to adopt a structured approach to HRD.
The challenge for regional bodies is to take the results of the exercise forward, toestablish mechanisms to implement proposed recommendations through existing/newpartnerships and to monitor progress and improvement. Other considerations includethat of replicating the exercise within other regions and over time. All LMI is timelimited in relevance as economic conditions, policy interventions and organisationaldevelopment combine to alter the fundamentals of the labour market.

SME Company Survey Synthetic ReportJanuary 2002
3
PIONPIONPIONPION
2 Introduction and Background
2.1 IntroductionThis report has been produced in the context of the European Training Foundation’s2001 Work Programme. The aim of the project has been to assist National Observatoriesand regional representatives in five candidate countries to undertake an in-depthdemand–side qualitative assessment of emerging regional SME skill needs. The projectfollows on from previous exercises supported through the ETF Work Programme andmanaged by the respective National Observatories.
Planning for the project was undertaken via two preparatory meetings in Turin duringAutumn/Winter 2000. The first, attended by National Observatory representatives, ETFand a EU expert, was convened to discuss the proposed survey instrument, operationaldetails, reporting and dissemination arrangements. The second was broadened to includemembers of the survey team and organised to provide training activity and support.Additional written study guidance was provided by ETF prior to the onset of theexercise.
Each National Observatory subsequently held focus groups of employers to examine thewider validity of survey results before providing a draft report for comment to both ETFand the EU expert. A variety of dissemination events were also held in the regionsparticipating in the exercise.
The objective of this report is to draw together the broad findings of the project and toprovide a reference point for future activity in the candidate countries. The summary isbased on the individual reports produced by each project team rather than the sourcedata. This complicates elements of the comparative exercise for although the same basicsurvey instrument is used in each country, different teams choose to emphasise differentaspects of their projects and do not necessarily present identical information for anyparticular issue under discussion.
2.2 BackgroundThe important role attributed to HRD in promoting competitiveness and growth inregional economies is widely recognised. National Observatory studies, supported byETF Phare Programmes, have placed great emphasis on evaluating skill levels andsupply-side VET infrastructure in specific regions of the candidate countries. Thisexercise, alternatively, focuses on the demand side of the labour market and seeks toexamine the role of SME employers in the skills development process.
The study is based on the premise that the demand for skills, their deployment and use byemployers within the productive process are all critical aspects of the wider regionaldevelopment process. More fundamentally, however, it is based on the premise,illustrated in Figure 2.1, that any attempt to examine the ‘attitude to skills’ of employersin isolation from the commercial context in which their businesses operate is likely toproduce a misleading interpretation of their perspectives on HRD.
Likewise, any HRD intervention strategies that are being considered are much morelikely to be effective if they are ‘context sensitive’ – if they take account of howemployers relate/define skill needs to wider product market strategies and generaleconomic performance. In addition, there is a risk that any analysis of skills

SME Company Survey Synthetic ReportJanuary 2002
4
PIONPIONPIONPION
shortages/gaps that ignores the views of firms may unwittingly attribute the origins ofsuch difficulties to individuals who lack skills and/or on education institutions that fail toteach them.
There exist many shortcomings in firm behaviour that affect skill utilisation andperformance - poor management, fear of empowering workers, pursuit of low-wageoptions and the depression of wages, benefits and working conditions. Employers oftencomplain about `skill shortages’, but it not always clear what they really mean by this,and whether such shortages are caused by failures in the labour market as a whole orfailure by employers themselves to invest in training their workforce.
Figure 2.1: Business Performance & HRD Responses
CompetitivePressure
BusinessPerformance
Gap
ProductMarket
Development
TechnicalChange
SkillPerformance
Gap
ReviseHRM
Policy?
RethinkHRD?
NewTraining
Initiatives?
Limited ad-hoc change?
No Change?
More generally, the fact remains that, both within EU members and candidate countries,we still have much to learn about the way in which organisations deal with the issue ofskills. We know that the concept of skills is interpreted very widely and that the notion of askills shortage is viewed in a number of different ways.
We do not, in practice, know whether firms:
• ever take stock of the skills inherent within their workforce and, if so, the basis onwhich that judgement is made;
• ever consciously examine the skills of their workforce in relation to thedevelopment of the products they supply or the markets they serve;
• whether SMEs actively consider skills as an element contributing to theircompetitiveness;
• consider the acquisition of skills by their workforce as a benefit or cost;
• fail to recruit graduates/school leavers due to lack of awareness, accessibility,cost, lack of work experience or other reasons; and

SME Company Survey Synthetic ReportJanuary 2002
5
PIONPIONPIONPION
• respond to such issues differently depending on their particular size,sector/market or level of turnover.
It is important that we seek to find answers to such questions since the competitiveposition of any region will be seriously undermined if circumstances arise whereby alow-skill bad-job trap strategy is adopted by employers since a large proportion of theworkforce will remain unskilled, firms will have little incentive to provide good (highskill/wage) jobs and, as a result, workers will have little incentive to acquire skills.
This exercise has been designed to investigate some of these issues through a primaryresearch process involving detailed face-to-face interviews with a large number oforganisations across five candidate countries/regions:
• Czech Republic: North West Bohemia;
• Estonia: South Estonia;
• Hungary: South Great Plain region;
• Lithuania: Lithuania; and
• Poland: Lubelskie Voivodship.
A simple description of the study is that it seeks to find out “how do employers obtainand maintain the workforce they need to be able to operate and compete?” It is thereforedirectly concerned with issues such as recruitment, retention, training, job mobilitywithin organisations and whether the education/VET system produces people who haveskills that are relevant to employers’ needs and skill shortages in the context of Small andMedium Enterprise (SME) business development.
The exercise represents an attempt to understand how employers operate so that futuresupport can be targeted better and more effectively. It is not an attempt to judge howemployers are performing but to show that their importance in the regional economy isrecognised and that information needs to be gathered to provide better help andassistance.
Remaining sections of this report outline the origins and nature of the survey instrumentused and provide a summary of the primary findings. At the outset, however, it isimportant to place the study area in a wider comparative context to inform theinterpretation of findings.
Figures 2.2 and 2.3 provide Eurostat details on comparative GDP performance andemployment characteristics of the study areas. Per-capita GDP in each of the regions isat least 50% lower than that of the EU15 with NW Bohemia at the top and Lubelskie atthe bottom of the range.
Likewise, NW Bohemia and Lubelskie provide the two reference points in terms ofemployment profiles. The former has the smallest, and the latter the largest, share ofemployment in agriculture across the study regions. North West Bohemia has the largestindustrial workforce share but South Estonia has the largest service sector employmentshare.

SME Company Survey Synthetic ReportJanuary 2002
6
PIONPIONPIONPION
Figure 2.2: GDP per head 1998(EU15=100)
0
20
40
60
80
100
120
NWBohemia
SouthEstonia
SG Plain Lithuania Lubelskie EU15
2.3: Employment by sector 1999(% of total employment)
0%
20%
40%
60%
80%
100%
NWBohemia
SouthEstonia
SG Plain Lithuania Lubelskie EU15
Agriculture Indus try Se rv ice s

SME Company Survey Synthetic ReportJanuary 2002
7
PIONPIONPIONPION
3 The Survey Instrument and Sample Base
3.1 The Survey InstrumentThe origins of the survey instrument employed lie in a nationwide exercise carried out inthe United Kingdom during the course of the 1990s called the Employers Manpower andSkills Practices Survey (EMSPS). This exercise fully piloted the basic survey and thefieldwork included face-to-face interviews with 1,700 companies. The tool was also usedas the basis for additional study exercises in the North West of England and, throughETF, Kyrgystan.
The questionnaire is divided into 6 sections, outlined in Figure 3.1 and 3.2, and covers:
• The workforce and processes of change;
• Turnover of employees
• Skills and recruitment
• Training and development activities
• In depth questions on the skill shortages in particular occupational groups
• Beyond the establishment – the business environment
Sections A to D are concerned with the workforce as a whole, although a number ofquestions ask for details relating to each occupational group at the establishment.Section E seeks information on a maximum of two specific occupational groupsdisplaying extensive skills shortages. Section G looks at general processes affecting theestablishment, but with a focus upon external influences.
Figure 3.1: The Survey Instrument
• Section A – Background– Contact Details– Ownership– Size of workforce– Occupational Change– Organisational Development &
training– Productivity
• Section B – EmployeeTurnover– Rate & Occupations– Recent/Future redundancies &
occupations/operational areas
• Section C – Skills &Recruitment– Skill shortage by occupation &
operational area– Skills assessments– Views on skills/future skills– Recruitment – internal, school-
leavers, university graduates– Current/Future DTF vacancies
occupational/operational areas

SME Company Survey Synthetic ReportJanuary 2002
8
PIONPIONPIONPION
Figure 3.2: The Survey Instrument
• Section D – Training &Development– Training Levels– Training Type (by-doing, open,
place)– Multi-skilling & retraining
occupational/operational areas– Assessment– Facilities– Plans & budgets
• Section G – Market/productIssues– Product Development– Competitive factors– R&D– Sub-contracting– Design/development– Outside Links
• Section E – Focussed SkillShortages– Job profiles/age/experience– Qualifications/qualities– Promotion/pay– Providers
3.2 The Sample Base
3.2.1 Sector Distribution Profiles
In the course of the study exercise, some 952 firms were visited across the regions in thefive participating countries. Figure 3.3 provides an indication of the sample distributionacross each country as well as the distribution of the sample across sectors within eachregion.
Sector coverage has been relatively broad, though food processing, tourism, constructionand the environment have been covered by at least two countries. Coverage of somesectors is relatively limited with the result that individual findings for such sectors willinevitably contain a greater risk of statistical imprecision. However, findings at regionallevel are likely to be more robust in most instances.
3.2.2 Size Distribution Profiles
Comparison of sample size distributions is complicated by different structures adopted inreports. It is possible to directly compare Lubelskie, South Great Plain and Lithuania byaggregating into three size bands – 1-50 persons, 51-250 persons and 250+ persons – andto directly compare the NW Bohemia and South Estonia via three different groups – 1-50persons, 51-100 persons and 100+ persons.
The only way to compare all five sets of figures is to employ a simple definition withsmall firms defined as 1-50 persons and medium/large firms defined as 50+ persons.Figure 3.4 indicates the results of this classification and shows that in four out of the fiveparticipants, small firms represent over 60% of the sample distribution.
SME Company Survey Synthetic ReportJanuary 2002
9
PIONPIONPIONPION
Figure 3.3: Sample Profiles
• North West Bohemia: 155Firms
– 19 Glass– 22 Chemicals– 33 Communications– 23 Energy– 58 Environment
• South Estonia: 60 Firms– 33 Food– 16 Tourism– 11 Environment
• South Great Plain: 197 Firms– 44 Manufacturing– 34 Hotels/Catering– 58 Commercial– 40 Finance– 21 Construction
• Lithuania: 300 Firms– 100 Food Processing– 100 IT– 100 Tourism
• Lubelskie: 240 Firms– 78 Food Processing– 82 Wood Processing– 80 Construction
• Total: 952 Firms
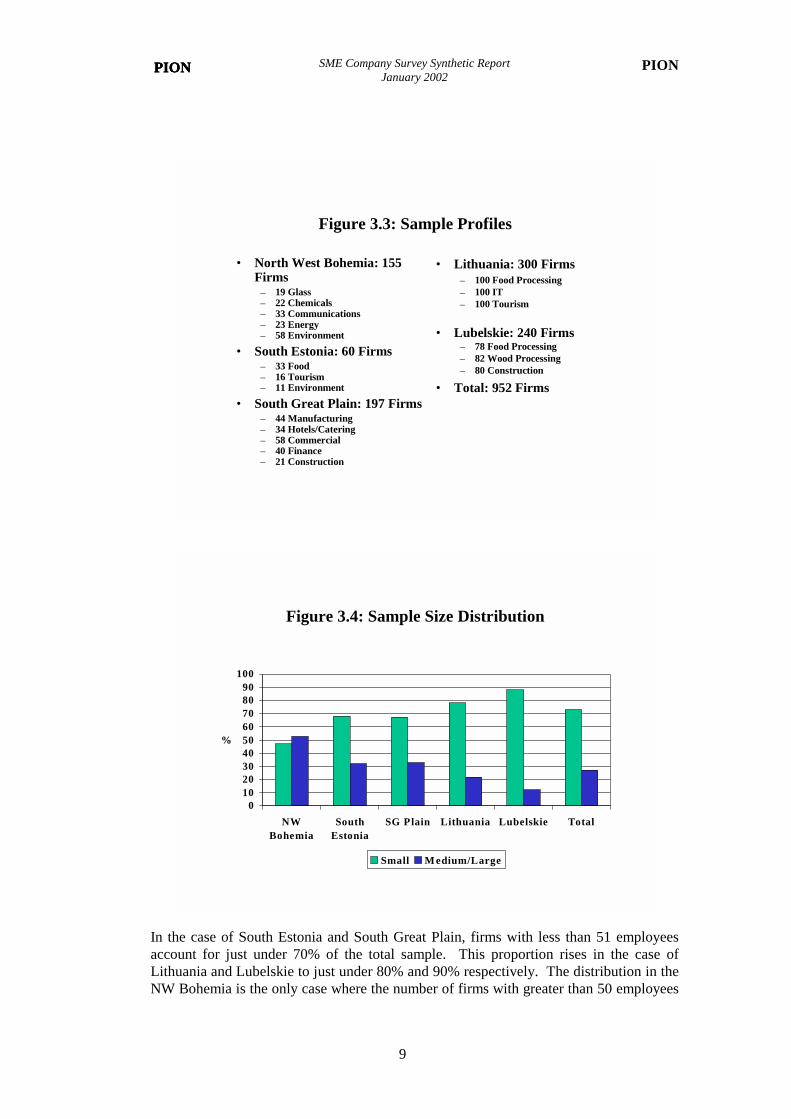
Figure 3.4: Sample Size Distribution
0102030405060708090
100
NWBohemia
SouthEstonia
SG Plain Lithuania Lubelskie Total
%
Small M edium/Large
In the case of South Estonia and South Great Plain, firms with less than 51 employeesaccount for just under 70% of the total sample. This proportion rises in the case ofLithuania and Lubelskie to just under 80% and 90% respectively. The distribution in theNW Bohemia is the only case where the number of firms with greater than 50 employees

SME Company Survey Synthetic ReportJanuary 2002
10
PIONPIONPIONPION
exceeds that for less than 50 employees. In terms of the overall sample, just over 70% offirms employ less than 50 employees.
4 The Operating EnvironmentIn the course of interviews, firms were asked a number of question designed to providedetails about the trading and operating environment in which they function. A summaryof key aspects of the information reported is contained in Appendix 1.
4.1 Market Conditions and Financial TurnoverIn the two years prior to the exercise, the majority of organisations in the survey regionsindicate a situation of expanding markets and turnover. The only exception, for theformer, is in Lubelskie where the proportion of firms reporting market growth is some30% in comparison to figures between 55% and 73% elsewhere. Figures for financialturnover also reflect a generally favourable trading situation with a majority of firms ineach area reporting growth.
4.2 Employment and ProductivityWhile the trading environment for participating companies has been relatively buoyant,follow-through to employment has been much more muted. Employment growth isreported by between 30% and 40% of firms across the regions but is balanced by similarproportions reporting employment loss. In the case of South Estonia and Lubelskie, theshare of firms indicating decline is marginally higher than that reporting expansion.
Much of the employment loss has taken the form of redundancy with large numbers offirms reporting this form of separation over the course of the last two years. Prospectsfor the next two years are, however, somewhat brighter with significant reductions inexpected redundancies (Figure 4.1).
Another contributory factor for the employment profile is related to productivity growthwhich is cited as highly significant in all regions ranging from around 50% in Lubelskieand South Great Plain to over 70% in the case of South Estonia and the NW Bohemia.Figures of this scale will invariably have impacted to restrain employment growth in theface of market expansion. Some productivity decline is evident but is relatively limited.
4.3 Competitive ResponseThere is evidence that firms in the survey regions/areas have responded to the dynamicsof the trading environment by attempting to improve their competitive position in themarket place. There has been some attention to product design but more emphasis hasgenerally been placed on product/service range and quality - between 50% and 71% ofcompanies report attempts to increase their product/service range and 75% to 93% reportincreased attention to quality.
Some 70% to 80% of firms have introduced new products/services (the figure forLubelskie is somewhat lower than elsewhere at 40%) though much of this activity has

SME Company Survey Synthetic ReportJanuary 2002
11
PIONPIONPIONPION
focussed on existing ranges or related fields. Significantly fewer numbers of firms haveintroduced completely new products/services despite four out of the five regionsreporting more than 20% of organisations with some form of R&D activity on-site.
Figure 4.1: Redundancy Patterns
01020304050607080
NWBohemia
SouthEstonia
SG Plain Lithuania Lubelskie Total
%
Last 2 Years Next Two Years
Companies have also introduced changes in order to reduce costs, further promoteproductivity and improve quality. Between 70% and 80% have sought to lower costs andto increase productivity but between 80% and 90% have sought to improve quality.There is some variation across regions but the profiles are all consistent.
4.4 Competitive PrioritiesThe importance attached to quality and quality improvements within survey organisationsis reflected in the findings of questions that seek to elicit the relative weight attached tokey competitiveness factors such as price, quality, responding to customers, marketingand advertising, product differentiation and availability/delivery.
Weighting the reported results by the numbers of firms in each region, the dominantfactor is defined as quality with an average rating of 93%. This is followed byresponding to customers (84%), price (75%), availability/delivery (71%),marketing/advertising (49%) and product differentiation (42%).
It is difficult to make observations with just five cases, but there is some evidence tosuggest that while organisations in all regions attach great importance to quality, moreimportance is attached by those who export a higher proportion of their goods andservices. There is no such evidence with regard to price or marketing/advertising, butsome moderate evidence of links between exporting, product differentiation andavailability/delivery.

SME Company Survey Synthetic ReportJanuary 2002
12
PIONPIONPIONPION
4.5 Organisational ChangeAlongside more detailed questions about skills and training issues that are discussed inlater sections, the initial review of trading context attempts to examine whether thevariety of market pressures that organisations have been subject to have promoted anyparticular set of organisational changes. Overall, the most common form of changeappears to have been job interchange though significant variation is present betweenregions. This is followed by introduction of TQM, multi-skilling and job redesign.Adoption of just-in-time scheduling ranks low on the list of responses.
4.6 HRD ResponsePrecisely how this profile of change feeds back into generic HRD development isinvestigated by another series of survey questions which invite organisations to indicatethe nature of management focus on employee development. The dominant HRD activityacross the set of regions as a whole has been to develop employees for improvedcustomer service. This is followed closely, however, by the desire to raise generalcompetence and promotion of teamwork.
Asked to evaluate whether their general workforce meets their organisational needs, theproportion indicating that the workforce is a major strength lies in around 40% for SouthGreat Plain and Lubelskie, 30% for North West Bohemia, 17% for Lithuania and 12%for South Estonia (Figure 4.2). Such figures would tend to indicate that substantialnumbers of employers across the regions believe that scope exists to improve thecapabilities and contribution of their current workforce.
Figure 4.2: Workforce Quality
05
101520253035404550
NWBohemia
SouthEstonia
SG Plain Lithuania Lubelskie Total
%
'M ajor Strength' 'Better than Competitors'
Figure 4.2 also reports the proportions of employers who perceive the quality of theirworkforce to be better than that of competitors. On the whole, this tends to be smaller

SME Company Survey Synthetic ReportJanuary 2002
13
PIONPIONPIONPION
than the proportion viewing their workforce as a major strength indicating someconcern over workforce quality.
5 Skills and RecruitmentHaving established a series of contextual parameters, the survey instrument focuses onspecific issues relating to skills and skills shortages. A summary of key aspects of theinformation reported is contained in Appendix 2.
5.1 Occupational Change and Labour TurnoverThe nature of the profiles outlined in section 4 suggest that many organisations have beenundergoing a sustained process of development in recent years. This is generallyreinforced by the number of companies who report experiencing a change in thedistribution of occupations internally within their organisations. Over 50% of companiesin South Estonia, Lithuania and Lubelskie report such change though the figures for theSouth Great Plain and NW Bohemia are lower at 33% and 25%.
Employee turnover levels are relatively moderate in most instances but there is evidencethat some employers are facing difficulties. Over 20% of companies in South Estoniaand South Great Plain areas report labour turnover greater than expected. This is broadlydouble that in Lithuania and Lubelskie and North West Bohemia.
Problem occupations, in terms of turnover, appear remarkably consistent across allfive regions. Elementary occupations, craft and plant and machine operators are themost common.
5.2 Skill Requirements and ShortagesThere is widespread recognition among survey companies that the skills required of theirworkforces have increased over the last two years. A minimum of 80% and a maximumof 95% of firms acknowledge that demands placed on the skill-sets of employees haveincreased (Figure 5.1).
This is generally reinforced by the proportion of organisations ranking skills as ‘veryimportant’. What is interesting, however, is to compare the difference between theproportion of firms ranking their workforce as a major strength and the proportionranking skills as very important. Figure 5.2 shows that the latter generally exceeds theformer by a significant margin suggesting that employers have some concerns aboutthe skills capability of their workforce.
Confirmation of these concerns is given through estimates of skill shortages which aredefined as situations where employers have not been able to identify anyone in the labourmarket with appropriate skills to undertake a specific task or have been ‘making do’ withexisting but inappropriately skilled staff. Between 28% and 65% of employers reportsuch shortages suggesting that between 1 in 4 and 1 in 2 employers are facingdifficulties. Even at the lower end of the spectrum, these are not insignificantmagnitudes and suggest that the competitiveness of firms in all regions is beingconstrained.

SME Company Survey Synthetic ReportJanuary 2002
14
PIONPIONPIONPION
Figure 5.1: Increasing Skill Requirements
0102030405060708090
100
NWBohemia
SouthEstonia
SG Plain Lithuania Lubelskie Total
%
Figure 5.2: Workforce Skills Capability
0102030405060708090
100
NWBohemia
SouthEstonia
SG Plain Lithuania Lubelskie Total
%
Work force is M ajor Stre ngth Sk ills are Ve ry Important

SME Company Survey Synthetic ReportJanuary 2002
15
PIONPIONPIONPION
The occupations creating difficulties are again relatively consistent across the set ofregions participating in the exercise. Craft occupations are identified by four of thefive regions, technical occupations are identified by three regions and service/sales andprofessional occupations are identified by two regions. The skills identified as being inparticular short supply include technical skills, communication skills, language andcreativity.
Figures 5.3 and 5.4 provide a simple cross-tabulation between the proportions ofemployers reporting skill shortages and the proportions reporting market and productivitygrowth. It is difficult with only five observations, and some care should be taken inassigning causality, but there exists prima-facie evidence that skill shortages are morepronounced in organisations experiencing strong market and productivity growth.Such a conclusion tends to be given a degree of support in those regional reports thatundertake a similar exercise.
Figure 5.3: Skills Shortage and Market Growth
Lithuania
South Estonia
NW Bohemia
SG Plain
Lubelskie
0
10
20
30
40
50
60
70
80
0 20 40 60 80
% M arket Expansion
% Skill Shortages
5.3 Skills AssessmentOrganisations were asked to indicate whether, and the frequency with which, theyundertake assessment of workforce skills. The results show some variation betweenregions. In the NW Bohemia, South Estonia and South Great Plain samples, some 80%to 90% of employers claim that they have previously assessed the skills of theirworkforce. In Lithuania the figure is 59% and in Lubelskie 17%.
Some of the focus group activity suggests that the high nature of some of these figuresmay reflect employer variation/misunderstanding of the concept of ‘skills assessment’and indicates that some care should be taken in interpreting this attribute. Figure 5.5suggests the not too surprising finding that more extensive skill shortages tend to bediscovered as higher levels of skills assessments are performed.

SME Company Survey Synthetic ReportJanuary 2002
16
PIONPIONPIONPION
Figure 5.4: Skills Shortage and Productivity Growth
Lithuania
South Estonia
NW Bohemia
SG Plain
Lubelskie
0
10
20
30
40
50
60
70
80
0 20 40 60 80 100
% Productivity Expansion
% Skill Shortages
Figure 5.5: Skills Shortage and Skills Assessment
Lithuania
South Estonia
NW Bohemia
SG Plain
Lubelskie
0
10
20
30
40
50
60
70
80
0 20 40 60 80 100
% Skills Assessment
% Skill Shortages

SME Company Survey Synthetic ReportJanuary 2002
17
PIONPIONPIONPION
It is instructive to note that the survey also enquires about the regularity with whichemployers undertake assessments. It is, of course, one thing to have undertaken anassessment but it is another to set in motion procedures to review skills development.Figure 5.6 shows that the proportion of companies undertaking regular assessments isgenerally lower than the proportion that have undertaken at least one assessment.
Figure 5.6:Skills Assessment
0102030405060708090
100
NWBohemia
SouthEstonia
SG Plain Lithuania Lubelskie Total
%
Undertaken Assessment Regular Assessment
This is not a surprising finding but there do appear to exist substantial differences acrossregions. The differential is smallest for NW Bohemia where regular assessments areclaimed by 90% of all those who have ever undertaken an assessment though again somecare is required in the light of differing interpretations of ‘regularity’.
In terms of capacity to evaluate current and future skill needs, what evidence is availablesuggests that organisations that already had some experience in this area tend to feel thatthey have the internal capacity to address the issue and vice versa. Hence 83% of NWBohemia firms have undertaken an assessment and 88% feel comfortable about capacityin this area whereas 17% of Lubelskie firms have undertaken an assessment and only14% feel capable of so doing. It is also interesting to note that access to externalintelligence on skills is very limited in the case of Lubelskie relative to other regions.Overall, there is some suggestion that firms feel a little less secure about evaluatingfuture skill needs with positive response rates falling by between 10% and 20%.
5.4 Responsibility for Skills DevelopmentWith relatively large numbers of firms reporting some degree of prolonged skill shortage,the survey exercise invites employers to express their opinion as to the nature ofresponsibility for the development of workforce skills. Figure 5.7 provides the findingsof this process.

SME Company Survey Synthetic ReportJanuary 2002
18
PIONPIONPIONPION
Figure 5.7:Skills Responsibility
0102030405060708090
100
NWBohemia
SouthEstonia
SG Plain Lithuania Lubelskie Total
%
Firms Gove rnme nt Employe e
Variation across the study regions is evident but in most cases employers appear to takethe view that they are key agents for skills development. Over 80% of employers in NWBohemia and South Great Plain areas cite themselves as bearing responsibility withfigures of over 60% for South Estonia and around 40% for Lithuania. There is a markeddrop in the response from Lubelskie where only 17% report in a similar manner. Suchvariation is not necessarily inconsistent with the differential nature of the latter areaevident in other responses.
Alongside recognition of their role, employers also believe that employees have animportant contribution to make to their own skills development. Over 50% of employersplace some emphasis on employee own development in South Estonia, South Great Plainand Lithuania with figures of 40% for NW Bohemia and 10% in Lubelskie.
With the exception of South Estonia, the role and responsibility of government inskills development is seen as very limited.
5.5 Recruitment of School-Leaver & GraduatesRecruitment of school leavers is relatively widespread across all survey regions. Whenasked if they have recruited any school leavers over the previous years, most regionsreport a figure between 40% and 55%. South Great Plain is the exception in reporting afigure of some 78%. The same broad profile exists in terms of university graduaterecruitment – most regions indicate a figure of some 20% to 25% while South GreatPlain reports a figure of 51%.
It is difficult to make generalisations but there are some signs that regions with greaterskills shortages are relatively more likely to recruit school-leavers and universitygraduates. To balance this, there is no significant evidence of a relationship betweenproductivity growth and school-leaver/graduate recruitment which may confirm the role

SME Company Survey Synthetic ReportJanuary 2002
19
PIONPIONPIONPION
of downsizing and capital development in the former rather than any supply-side skillsimprovement in the workforce.
5.6 Recruitment and VacanciesInformation on whether vacancies have been difficult-to-fill (DTF) presents aninteresting contrast to data on skill shortages. It has been common, in many skill studies,for employers to interpret vacancies that are difficult-to-fill as evidence of skill shortagethough they may equally reflect the nature and quality of employer attempts to secureappropriately qualified staff.
Figure 5.8 details the skills-shortage/DTF vacancy profile. DTF proportions for the NWBohemia and South Estonia regions are relatively close to the skill-shortage proportions(25% compared to 30% for the former and 57% compared to 65% for the latter) with theresult that one cannot rule out the role of DTF vacancies in determining claims of skillshortages. In contrast, there exists a substantial difference for Lithuania (23% comparedto 44%) suggesting a clear indication of a structural skills deficit among sampledorganisations.
Figure 5.8: Skills Shortage and DTF Vacancies
Lithuania
South Estonia
NW Bohemia
SG Plain
0
10
20
30
40
50
60
70
80
0 10 20 30 40 50 60
% DTF Vacancies
% Skill Shortages
Firms reporting DTF vacancies were also asked to indicate their impact on organisationalperformance. Among the subset of such firms, the highest response relates to lowerprofitability and is followed by bottlenecks/reductions in efficiency and reduced forwardplanning. Relatively few companies report any significant impact in terms of staffmorale. Responses to the existence of DTF vacancies is dominated by an attempt toincrease productivity and the job range of staff – making existing staff achieve/producemore – followed at some distance by increased overtime. The decision to undertakemore training is relatively limited.

SME Company Survey Synthetic ReportJanuary 2002
20
PIONPIONPIONPION
6 HRD DevelopmentOnce the issue of skill shortages has been investigated, the survey instrument turns to theway in which organisations address training and general HRD development. In line withprevious sections, a summary of key aspects of the information reported is contained inAppendix 3.
6.1 TrainingOrganisations were asked to report whether any training and development activities areprovided for employees above and beyond routine induction and any activities that arerequired by specific legislative requirements. Responses are generally high, rangingfrom some 40% in the case of Lubelskie to some 90% in the case of South Estonia1.
Figures 6.1 and 6.2, on the other hand demonstrate that the training profiles reported arebroadly consistent with a-priori expectations. Figure 6.1 shows that the proportion oforganisations providing training within sample regions increases in line with the level ofmarket expansion. Figure 6.2 indicates that the same is broadly true in terms ofproductivity growth.
Figure 6.3 provides an additional perspective and shows, as one might expect, an inverserelationship between training provision and assessment of workforce quality. Wherefirms in sample regions feel that their workforce is weak they appear to invest in higherlevels of training. Figure 6.4, finally, suggests that firms also tend to relate investment intraining to the level of perceived skill shortage. Training proportions generally exceedskill shortage levels by a factor of some 30% to 40%, the only exception being NWBohemia where the excess is some 100%.
1 This figure may be connected to high import level of capital equipment with associated supplier providedtraining.

SME Company Survey Synthetic ReportJanuary 2002
21
PIONPIONPIONPION
Figure 6.1: Training and Market Expansion
Lubelskie
SG PlainNW Bohemia
South Estonia
Lithuania
0102030405060708090
100
0 20 40 60 80
% M arket Expansion
% Training & Development
Figure 6.2: Training and Productivity Growth
Lubelskie
SG Plain NW Bohemia
South Estonia
Lithuania
30
40
50
60
70
80
90
100
30 40 50 60 70 80 90 100
% Productivity Growth
% Training & Development

SME Company Survey Synthetic ReportJanuary 2002
22
PIONPIONPIONPION
Figure 6.3: Training and Workforce Quality
Poland
SG PlainNW Bohemia
South Estonia
Lithuania
0102030405060708090
100
0 20 40 60 80 100
% Workforce 'M ajor Strength'
% Training & Development
Figure 6.4: Training and Skill Shortage
Lubelskie
SG PlainNW Bohemia
South Estonia
Lithuania
20
30
40
50
60
70
80
90
100
20 40 60 80 100
% Skill Shortage
% Training & Development

SME Company Survey Synthetic ReportJanuary 2002
23
PIONPIONPIONPION
6.2 Training IntensityAs a balance against high reported training levels, the survey tool asks employers todetail the proportion of employees who have participated in such activities over theprevious 12 months. Comparisons are difficult due to differences in regional reports butthe evidence that is available suggests that:
• North West Bohemia - higher proportions of companies provide training foradministration, technical and senior officials with highest number of trainingdays provided for technicians and senior managers;
• South Estonia – senior/professional and craft occupations receive highest numberof training days with lowest number for plant/machine operators and elementaryworkers;
• South Great Plain – highest number of training days allocated to administrationwith little variation elsewhere.
What evidence exists raises the suggestion that there may exist an element of skill–biasin some of the study areas – greater training being provided to those occupationalgroups with a relatively greater stock of initial skills. Additional questions also indicatethat the nature of training provision conforms to this general pattern with higher skilledworkers tending to receive more formal and systematic training investment.
6.3 Graduate and Management TrainingThe proportion of companies providing training for graduate entrants varies betweenregions. Figures for Lubelskie and South Estonia are equal to or less than 5% whereasthat reported for South Great Plain is 20%. Management development structures aremore prevalent than those for graduates but are still reported by only 30% oforganisations at most. Such figures suggest that graduate and management trainingremains an area of relative under-investment across most of the regions.
6.4 Performance and Training AssessmentsThe proportion of firms undertaking assessment of employees shows a clear divide acrossthe sample areas. At one end of the spectrum lie Lubelskie and South Estonia withresponses around 90% and at the other lies Lithuania with 27%. The figure for Lubelskieis noticeably high in relation to some of the other responses cited elsewhere in the report.
Figure 6.5 provides further information on training provision, results and needsassessments. Three regions (NW Bohemia, South Estonia and South Great Plain) have ahigher proportion of companies providing training than assessing training needs. InLithuania there is a rough balance whereas in Lubelskie the proportion assessing needsvastly exceeds the proportion providing training support.
6.5 Integrated HRD DevelopmentThe general responses of companies to questions regarding skills and training issuesindicate that many employers are aware of the importance of these considerations in thecontext of growth and development.

SME Company Survey Synthetic ReportJanuary 2002
24
PIONPIONPIONPION
Figure 6.5:Training Profiles
0102030405060708090
100
NWBohemia
SouthEstonia
SG Plain Lithuania Lubelskie Total
%
Training Provision Training Results Assessment Training Needs
Figure 6.6:Integrated HRD Infrastructure
0102030405060708090
100
NWBohemia
SouthEstonia
SG Plain Lithuania Lubelskie Total
%
Business Plan Training Plan Link between Plans
However, evidence from the survey exercise indicates the general absence of a coherentand integrated HRD framework in many of the regions. Figure 6.6 reports the proportionof companies who claim that they have business/training plans and the proportion that

SME Company Survey Synthetic ReportJanuary 2002
25
PIONPIONPIONPION
cite that the latter is linked to the former. The proportion with training plans varies fromjust over 15% to just 35% and is lower than the proportion with business plans in allinstances.
In terms of bringing together business and HRD planning, and despite the fact that thesurvey results clearly profile the connection between HRD and growth, there is avariable performance in terms of organisations formally linking together businessand HRD policies. This generally represents a significant lost opportunity and a majorarea of potential future activity.

SME Company Survey Synthetic ReportJanuary 2002
26
PIONPIONPIONPION
7 Study Team RecommendationsIn the light of the study exercise, each of the study teams have sought to provide a seriesof recommendations to address the weaknesses emerging from the overall project.Figures 7.1 to 5.5 provide a summary of the recommendations.
Figure 7.1: NW Bohemia Recommendations
• Tax/benefit structure should be redirected to strengthen incentives for bothcompanies and individuals to increase investment into human capital
• Companies need support to assess their workforce skills, to evaluate futureskill needs and make their workforce more productive in combination withnew technologies
• Engage a broader range of regional agents in the formulation andimplementation of measures and in the use of information and intelligencenetworks.
• Establishment of an agency to serve as consulting centre for regionalcompanies to:
– Support applications for EU financed projects,– Search for prospective participants in such projects and help with their
implementation.– Coordinate efforts and activities of various local and regional agents in
undertaking human capital development– Disseminate best practice in skills and training (both domestic and foreign) in the
regional business community
Figure 7.2: South Great Plain Recommendations
• Co-operation related to recruitment, training and skills assessment should be strengthened.
• Co-operation between companies and regional schools and universities should be strengthened.
• Regional information networks regarding workforce and skills should be set-up and operated.
Figure 7.3: South Estonia Recommendations
• Need to encourage companies to give workforce issues parity of esteem with as important other area (finance, technical)
• Companies should be encouraged to prepare systematic training plans and to include these in business plans
• Greater co-operation between enterprises, regional planners, training providers and vocational schools in workforce development issues
• Closer contacts between enterprises should be increased, both in forms of informal networks, and through associations
• More analysis of workforce issues for micro-enterprises and new business start-ups• More attention should be paid to social element of policy in future development plans

SME Company Survey Synthetic ReportJanuary 2002
27
PIONPIONPIONPION
Figure 7.4: Lithuania Recommendations
• Further develop the qualification system and training of adults• Subsidise training companies to encourage competition among training providers and
to develop the market of training services• Introduce incentives to encourage more extensive company contacts with training
institutions• Increase training of IT specialists.• Support training activities for managers of human resources• Support upgrading the qualifications of teachers• Initiate pilot programmes for the identification of skills and introduction of new
teaching methods• Initiate pilot programmes for the joint development of training programmes
involving employers and training institutions• Encourage group training activities to allow education and training service providers
to focus their efforts on the development of specialised training programmes
Figure 7.5: Poland Recommendations
• Raise awareness of importance of continued skill upgrading of the workforce among owners and managers of companies and the influence of this activity upon company development and economic performance
• Provide direct assistance to companies to aid assessment of workforce qualifications and prepare appropriate training plans/programmes linked to organisational development strategies
• Partial co-financing of the training programmes for identified occupational groups in a given company
• Develop a system of skill gaps identification (assessment of the most and the least needed qualifications on the labour market) and link to the assessment of vocational schools graduates
• Establish good working co-operation between representatives of employers, local and regional self-governments and vocational schools with the aim to adjust vocational training to the employer and labour market needs
• Promote life-long training among entrepreneurs and as one of the best ways ofmaintaining a well-qualified workforce

SME Company Survey Synthetic ReportJanuary 2002
28
PIONPIONPIONPION
8 Overview, Observations and Conclusions
8.1 OverviewGaining an insight into the way in which many varied sets of organisations approach theevaluation and definition of skills needs is an important activity which not onlycomplements consideration of the labour market supply side, but is vital to appreciatingthe wider HRD context and the design of intervention strategies.
The aim of the project discussed in this report has been to assist National Observatoriesand regional representatives in five candidate countries to:
• undertake an in-depth demand–side qualitative assessment of emerging regionalSME skill needs;
• examine demand-side perspectives in the context of local supply-sideinfrastructure; and
• prepare the context for the development of intervention strategies.
Demand-side studies are, however, rarely straightforward. They require access toorganisations and the cooperation of individuals for whom responding to a series ofstructured surveys is both time-consuming and not an everyday event. The issues andinterrelationships under investigation are complex and are difficult to examine other thanon a face-to-face basis. Moreover, since face-to-face fieldwork and data collection isresource intensive, such studies are invariably constrained in terms of the numbers ofemployers that can be interviewed though the use of focus groups provides a mechanismfor ‘testing’ findings among broader groups of employers.
This particular exercise has covered companies in a variety of sectors across five verydifferent regions within economies that are at different stages of the transition process.The regions have per-capita GDP levels that range from 26% to 53% of EU15 levels withcorresponding variation in employment profiles. However, despite such differentialsmany aspects of the demand-side profiles are broadly, if not completely, consistent. Thescale of individual responses to particular issues may vary, but the nature of responsesindicates much in common across the study areas.
8.2 Observations
8.2.1 Trading Environment and HRD Response
The majority of organisations have experienced an improved trading environmentalongside substantial productivity growth. This has been matched by muted employmentgrowth with significant but improving redundancy conditions. Emphasis withinorganisations has clearly been placed on quality improvements though much of thisactivity has concentrated on existing product/service ranges with more limited focus onnew business areas (reflected in relatively low or moderate export activity in some areas)and little in the way of movement towards more integrated supply-chains.
HRD responses to this changing environment do vary across regions though jobinterchange and multi-skilling are prominent. Nevertheless, the proportion of employersindicating that their workforce is a ‘major strength’ to their organisations is, at best, 40%.

SME Company Survey Synthetic ReportJanuary 2002
29
PIONPIONPIONPION
It is difficult to benchmark this figure but it may suggest that a relatively large number ofcompanies do not assign ‘significant value’ to the role and contribution of theirworkforce or have some dissatisfaction with their capabilities.
8.2.2 Labour Turnover, Skills and Recruitment
While some change is to be expected within the context of change, some 10% to 20% ofsample organisations report labour turnover to be higher than anticipated with remarkableconsistency across regions in terms of problem occupations.
Comparisons of the difference between the proportion of firms ranking their workforceas a major strength and the proportion ranking skills as very important suggest thatemployers have some implicit concerns about the skills capability of their workforce.Between 28% and 65% of employers report skills shortages with relative consistencyacross regions. These are not insignificant magnitudes and suggest that thecompetitiveness of firms in all regions is being constrained to some degree.
In most cases employers appear to take the view that they are key agents for skillsdevelopment but that employees also have an important contribution to make. The roleand responsibility of government in skills development is generally seen as limited.
The impact of difficult-to-fill vacancies on performance is primarily seen in lowerprofitability, bottlenecks/reductions in efficiency and reduced forward planning withresponses dominated by an attempt to increase productivity and the job range of staff.The decision to undertake more training is relatively limited.
8.2.3 Training and HRD Development
The proportions of companies reporting training and development activities (above andbeyond routine induction and any activities required by specific legislative requirements)are relatively high though maybe explained in some instances by supplier trainingaccompanying capital equipment purchases. However, what evidence exists suggeststhat there may exist an element of skill–bias in some of the study areas – greater trainingbeing provided to those occupational groups with a relatively greater stock of initialskills.
Additional questions also indicate that the nature of training provision conforms to thisgeneral pattern with higher skilled workers tending to receive more formal andsystematic training investment but that graduate and management training remains anarea of relative under-investment across most of the regions.
Evidence from the survey exercise indicates the general absence of a coherent andintegrated HRD framework in most if not all of the regions. Despite the fact that thesurvey results clearly profile the connection between HRD and growth, there issubstantial variation between regions in terms of organisations linking together businessand HRD policies.
8.3 ConclusionsThe exercise reported in this document has represented a commitment of a large numberof persons and organisations in the study regions. It has also been an important exercisefor three primary reasons, namely it has:

SME Company Survey Synthetic ReportJanuary 2002
30
PIONPIONPIONPION
• provided a coherent way of assessing demand-side skills and training issues ‘incontext’;
• addressed the type of issues that will need to be considered in the progressiontowards Structural Funds Programming; and
• assisted the development of ‘evidence-based’ labour market intelligence (LMI)needed to secure and access an adequate resource base for HRD policyinterventions.
Despite the variation in regions and sample sets, the exercise has provided a profile ofdemand-side considerations and attitudes that are broadly consistent across regions. Thestudy has pointed to a number of potential deficiencies and inconsistencies in employerperspectives towards HRD development within their organisations and assisted regionalorganisations to form an initial set of recommendations designed to enhanceopportunities for growth.
Analysis of the results also indicates that there exists an underlying rationality across thesample set in terms of patterns of responses to underlying difficulties. Skill shortagesand training levels appear to be more pronounced in regional companies experiencingstrong market and productivity growth as well as being positively related. This is apromising outcome but the evidence remains that large numbers of employers undervaluethe potential contribution of employees and adopt a structured approach to HRD.
The challenge for regional bodies is to take the results of the exercise forward, toestablish mechanisms to implement proposed recommendations through existing/newpartnerships and to monitor progress and improvement. Other considerations includethat of replicating the exercise within other regions (already the case in Hungary) andover time. All LMI is time limited in relevance as economic conditions, policyinterventions and organisational development combine to alter the fundamentals of thelabour market.

SME Company Survey Synthetic ReportJanuary 2002
31
PIONPIONPIONPION
Appendix 1: Trading and Organisational Context
NWBohemia
SouthEstonia
South GreatPlain
Lithuania Lubelskie
MarketsExpandingDeclining
60%7%
73%14%
55%24%
54%28%
30%24%
TurnoverExpandingDeclining
58%17%
76%10%
61%23%
56%27%
--
ProductivityExpandingDeclining
73%1%
88%7%
55%8%
65%2%
51%13%
Full-Time EmploymentExpandingDeclining
24%37%
27%28%
38%30%
34%27%
27%34%
Export Share 38% 33% 48% 9% 16%R&D on-site 22% 54% 22% 25% 7%Market Pressures producing:Increase in Product RangeImproved DesignAttention to Quality
67%42%81%
71%80%
-
55%42%75%
71%82%93%
50%42%83%
Changes designed to:Reduce costsIncrease productivityImprove quality
77%61%54%
83%83%92%
75%82%88%
75%79%90%
68%77%85%
Introduction of New ProductsIn existing rangeIn related fieldCompletely new
62%74%46%47%
68%43%56%23%
72%65%34%
6%
77%83%47%22%
40%84%44%33%
Competitive importance of:PriceQualityResponding to customersMarketing/advertisingProduct differentiationAvailability/delivery
67%92%83%39%40%83%
70%92%
-54%54%
-
83%96%95%57%48%75%
76%88%82%57%46%61%
74%92%77%38%29%74%
Collaboration through:PartnershipSuppliersFranchiseEmployer/Industry groupsResearch bodiesUniversitiesConsultancies
30%45%
6%6%
24%19%29%
27%51%
-36%29%32%37%
48%66%
9%44%
6%22%34%
57%67%
4%18%
9%34%39%
16%51%
5%5%
10%6%7%
Change in Occupational Dist 25% 52% 33% 61% 55%Changes Implemented:MultiskillingJob interchangeJob redesignJust-in-time schedulingTotal Quality ManagementCorporate culture focusNew management structuresChange of ownership
40%44%
8%2%3%1%2%2%
36%31%46%27%37%58%34%15%
26%35%32%12%23%29%29%13%
33%79%24%20%27%33%15%
6%
32%29%41%20%56%27%18%
8%Management focus on developingemployees to:Promote flexible workingPromote teamworkImprove customer serviceRaise product knowledgeRaise general competenceIntroduce new standards
68%69%84%52%76%41%
83%40%55%83%75%38%
79%69%73%73%86%64%
70%73%91%76%71%45%
40%-
68%-
50%-
Training to assist new:plant, machinery; equipment, ITapplications, products, services
83% 82% 57% 61% 42%

SME Company Survey Synthetic ReportJanuary 2002
32
PIONPIONPIONPION
Training sourced from outside 73% 77% 42% 58% 22%Workforce is a major strength 32% 12% 44% 17% 40%
Appendix 2: Skills and Recruitment
NWBohemia
SouthEstonia
South GreatPlain
Lithuania Lubelskie
Employee TurnoverHigher than expected 11% 22% 26% 11% 12%Turnover problem occupations Elementary
PM Op’sElementary
SalesSkilled Craft
ClericalTechnical
Professional
ElementaryCraft
PM Op’s
Redundancy:Last 2 yearsNext 2 years
70%18%
57%16%
24%10%
45%16%
58%15%
Skills seen as ‘very important’ 65% 65% 90% 63% -Increased demand on employeeskills
87% 85% 95% 94% 80%
Skill Shortage
Occupations
Skills
30%
ProfessionalTechnical
TechnicalComm’s
Languages
65%
Service/salesCraft
TechnicalComm’s
Languages
46%
Service/salesCraft
TechnicalComm’s
Creativity
44%
CraftTechnical
Professional
TechnicalCreativityCustomer
28%
CraftTechnicalPM Op’s
TechnicalProduction
Skills Assessment:
Regular basis
In relation to:Existing productsNew productsTechnology Change
83%
75%
89%26%19%
91%
35%
42%33%28%
83%
57%
55%19%17%
59%
50%
64%62%41%
17%
9%
12%9%8%
Skills viewed as:Responsibility of firmsResponsibility of GovernmentResponsibility of employeeResponsibility of industry
88%4%
40%3%
65%57%55%37%
84%14%63%
-
40%7%
45%9%
17%3%
10%1%
Capacity to evaluate:Current skill needsFuture skill needs
88%80%
94%77%
90%87%
43%41%
14%-
Access to external intelligence onskills needs 38% 47% 77% 61% 10%Employer Links to advise on:Recruitment issuesPayTraining
45%20%48%
23%19%50%
57%14%59%
40%13%39%
32%29%50%
Recruitment of:School LeaversGraduates
46%26%
52%25%
78%51%
25%54%
41%23%
Difficult–To-Fill Vacancies 25% 57% 10% 23% -Impact of DTF vacancies (% ofthose with Difficulty)Lower profitabilityBottlenecks/lower efficiencyLower standard of serviceReduced forward planningLower moraleTemporary staff costs
44%78%44%22%16%11%
35%5%
20%10%
8%5%
42%63%21%32%26%32%
43%33%46%51%20%
9%
64%36%33%36%14%22%
Response to DTF vacancies (% ofthose with Difficulty)Reduce workloadIncrease overtimeIncrease productivity
33%50%55%
8%20%40%
16%100%
89%
26%30%42%
22%31%
100%

SME Company Survey Synthetic ReportJanuary 2002
33
PIONPIONPIONPION
Increase trainingIncrease job range of staffRecruit temporary staffSub-contractChange organisational structure
17%44%
5%33%
5%
27%28%20%
8%15%
21%100%
26%47%37%
38%36%14%20%20%
44%75%56%14%33%

SME Company Survey Synthetic ReportJanuary 2002
34
PIONPIONPIONPION
Appendix 3: HRD & Training
NWBohemia
SouthEstonia
South GreatPlain
Lithuania Lubelskie
Training Provisions 61% 90% 59% 58% 40%Increase in training volume 32% 40% 40% 41% -Training for multiskilling 71% - 29% 68% 33%Retraining 28% 48% 15% 45% 30%Graduate training 17% 3% 20% 51% 5%Assess training results 44% 65% 43% 66% 76%Assess employee performance 57% 91% 56% 27% 90%Assess training needs 54% 79% 42% 61% 79%Assist management development 26% 26% 30% 31% -Training supervisor 42% 72% 49% 45% 74%Company Business Plan 40% 77% 52% 69% 44%Training PlanRelated to business planWith separate budget
35%87%32%
28%37%20%
32%62%25%
15%38%17%
30%10%
-