Embed Size (px)
Citation preview
Cod. 191020451 Rev. A Ed.09/2017
SMB20, SMB30SeriesVARIABLE SPEED BOOSTER SETS WITH e-SM DRIVEVERTICAL MULTISTAGE ELECTRIC PUMPS SERIES e-SV™ SMARTVERTICAL MULTISTAGE MONOLITHIC ELECTRIC PUMPS SERIES VM™ SMARTHORIZONTAL MULTISTAGE ELECTRIC PUMPS SERIES e-HM™ SMART

3
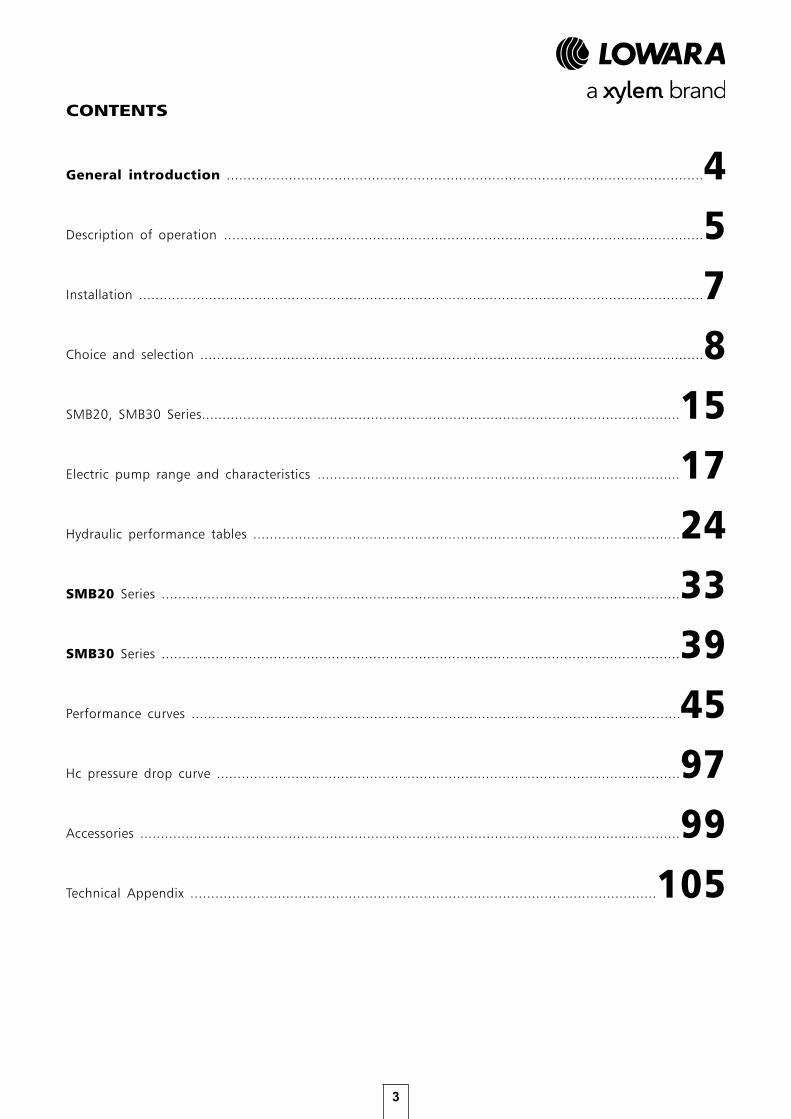
CONTENTS
General introduction ...................................................................................................................4Description of operation ....................................................................................................................5Installation .........................................................................................................................................7Choice and selection ..........................................................................................................................8SMB20, SMB30 Series....................................................................................................................15Electric pump range and characteristics ........................................................................................17Hydraulic performance tables .......................................................................................................24SMB20 Series .............................................................................................................................33SMB30 Series .............................................................................................................................39Performance curves ......................................................................................................................45Hc pressure drop curve ................................................................................................................97Accessories ...................................................................................................................................99Technical Appendix ................................................................................................................105
4
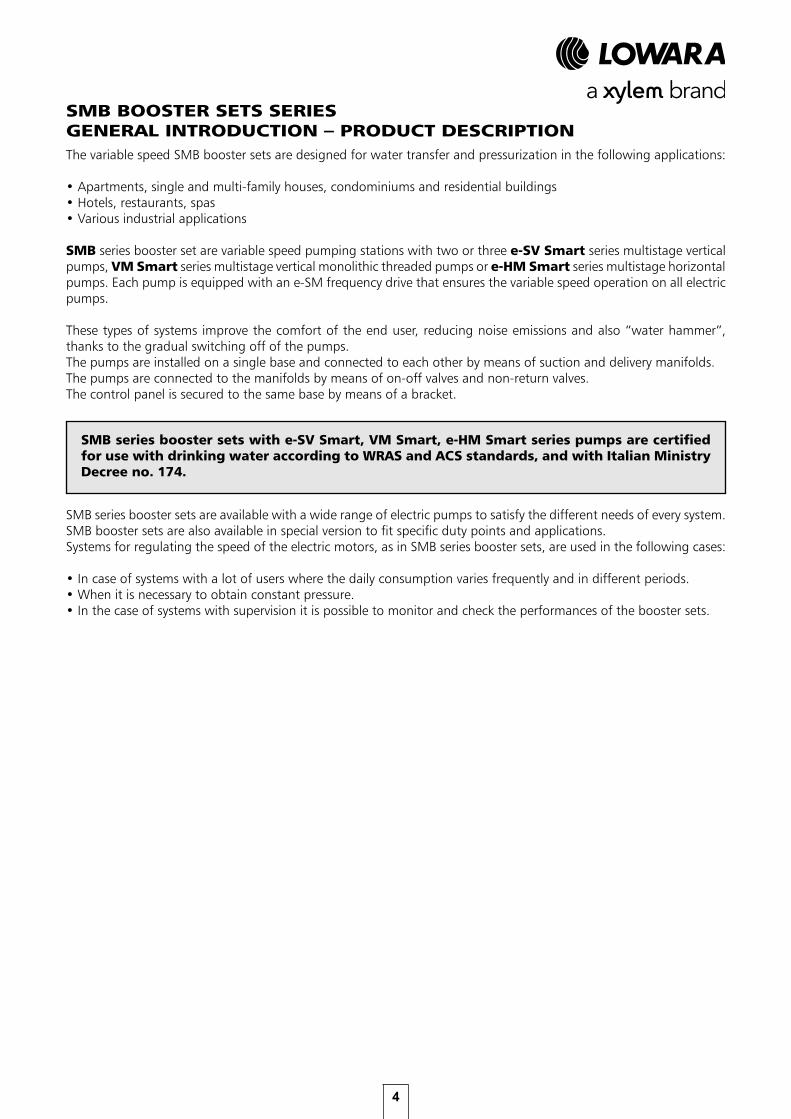
SMB BOOSTER SETS SERIESGENERAL INTRODUCTION – PRODUCT DESCRIPTIONThe variable speed SMB booster sets are designed for water transfer and pressurization in the following applications:
• Apartments, single and multi-family houses, condominiums and residential buildings• Hotels, restaurants, spas• Various industrial applications
SMB series booster set are variable speed pumping stations with two or three e-SV Smart series multistage vertical pumps, VM Smart series multistage vertical monolithic threaded pumps or e-HM Smart series multistage horizontal pumps. Each pump is equipped with an e-SM frequency drive that ensures the variable speed operation on all electric pumps.
These types of systems improve the comfort of the end user, reducing noise emissions and also “water hammer”, thanks to the gradual switching off of the pumps.The pumps are installed on a single base and connected to each other by means of suction and delivery manifolds.The pumps are connected to the manifolds by means of on-off valves and non-return valves.The control panel is secured to the same base by means of a bracket.
SMB series booster sets with e-SV Smart, VM Smart, e-HM Smart series pumps are certified for use with drinking water according to WRAS and ACS standards, and with Italian Ministry Decree no. 174.
SMB series booster sets are available with a wide range of electric pumps to satisfy the different needs of every system. SMB booster sets are also available in special version to fit specific duty points and applications.Systems for regulating the speed of the electric motors, as in SMB series booster sets, are used in the following cases:
• In case of systems with a lot of users where the daily consumption varies frequently and in different periods.• When it is necessary to obtain constant pressure.• In the case of systems with supervision it is possible to monitor and check the performances of the booster sets.
5
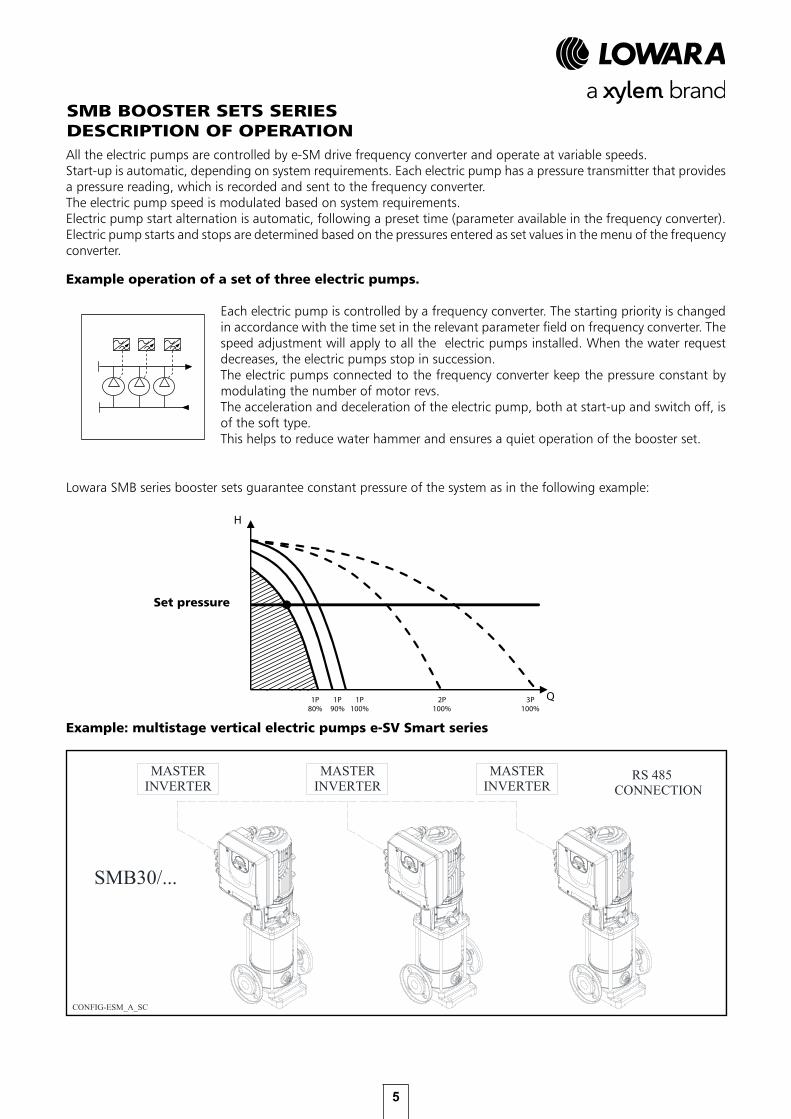
Example operation of a set of three electric pumps.
Each electric pump is controlled by a frequency converter. The starting priority is changed in accordance with the time set in the relevant parameter field on frequency converter. The speed adjustment will apply to all the electric pumps installed. When the water request decreases, the electric pumps stop in succession.The electric pumps connected to the frequency converter keep the pressure constant by modulating the number of motor revs.The acceleration and deceleration of the electric pump, both at start-up and switch off, is of the soft type.This helps to reduce water hammer and ensures a quiet operation of the booster set.
SMB BOOSTER SETS SERIESDESCRIPTION OF OPERATIONAll the electric pumps are controlled by e-SM drive frequency converter and operate at variable speeds.Start-up is automatic, depending on system requirements. Each electric pump has a pressure transmitter that provides a pressure reading, which is recorded and sent to the frequency converter.The electric pump speed is modulated based on system requirements. Electric pump start alternation is automatic, following a preset time (parameter available in the frequency converter).Electric pump starts and stops are determined based on the pressures entered as set values in the menu of the frequency converter.
Lowara SMB series booster sets guarantee constant pressure of the system as in the following example:
2
Descrizione del funzionamento Nei gruppi Lowara della serie GHV, tutte le pompe funzionano a velocità variabile. Le pompe sono collegate ad un convertitore di frequenza direttamente montato sul copriventola del motore elettrico. Tutte le pompe fino ad un massimo di quattro, si avviano tramite i rispettivi convertitori di frequenza. L’avviamento delle pompe è automatico secondo le richieste dell’impianto. Ogni pompa è dotata di un trasmettitore di pressione che garantisce la lettura della variazione di pressione. Il dato registrato è trasmesso al convertitore di frequenza. La pompa guidata dall’inverter modula la sua velocità sulla richiesta dell’impianto. L’alternanza dell’avvio delle pompe è fatta in modo automatico sia ad ogni nuovo avvio, sia attraverso un tempo impostato. L’avvio e la fermata delle pompe sono determinati in base alla pressione impostata come valore di set nel menù del convertitore di frequenza. Esempio di funzionamento di un gruppo a tre pompe serie GHV. Esempio di funzionamento di un gruppo a tre pompe serie GHC.
Le pompe sono controllate da ciascun convertitore di frequenza, collegato direttamente al motore elettrico della pompa. Ad ogni nuovo ciclo d’avvio delle pompe, si ha l’alternanza della priorità d’avvio delle pompe. La regolazione della velocità sarà per tutte le pompe installate. Le pompe ruoteranno tutte alla stessa velocità. Alla diminuzione della richiesta d’acqua, le pompe si arresteranno in cascata. Le pompe collegate ai convertitori di frequenza, mantengono la pressione costante modulando il numero di giri del motore. Tutte le pompe sia all’avviamento sia allo spegnimento, hanno un’accelerazione e una decelerazione di tipo soft. Questo permette la riduzione dei colpi d’ariete e un’ottima silenziosità del gruppo di pressione.
Una pompa è controllata da un convertitore di frequenza tipo Master, collegato direttamente al motore elettrico della pompa. Le altre pompe sono comandate tramite un segnale esterno ON/OFF e ruotano a velocità fissa. La regolazione della velocità, si ha solo per la pompa collegata al convertitore di frequenza. Le altre pompe per l’avviamento utilizzano i contattori all’interno del quadro elettrico. La pompa collegata al convertitore di frequenza si avvierà per prima, mentre le altre pompe si avvieranno dopo di questa. E’ possibile avere per quest’ultime, l’alternanza automatica d’avviamento in modo da distribuire le ore di lavoro. Alla diminuzione della richiesta d’acqua, le pompe si arresteranno in cascata. L’ultima a fermarsi sarà la pompa con inverter. La pressione costante è mantenuta attraverso la regolazione della velocità della prima pompa.
Example: multistage vertical electric pumps e-SV Smart series
CONFIG-ESM_A_SC
MASTERINVERTER
SMB30/...
RS 485CONNECTION
MASTERINVERTER
MASTERINVERTER
Set pressure
H
Q1P 80%
1P 90%
1P 100%
2P 100%
3P 100%
6
SMB BOOSTER SETS SERIESDESCRIPTION OF OPERATION
Set pressure
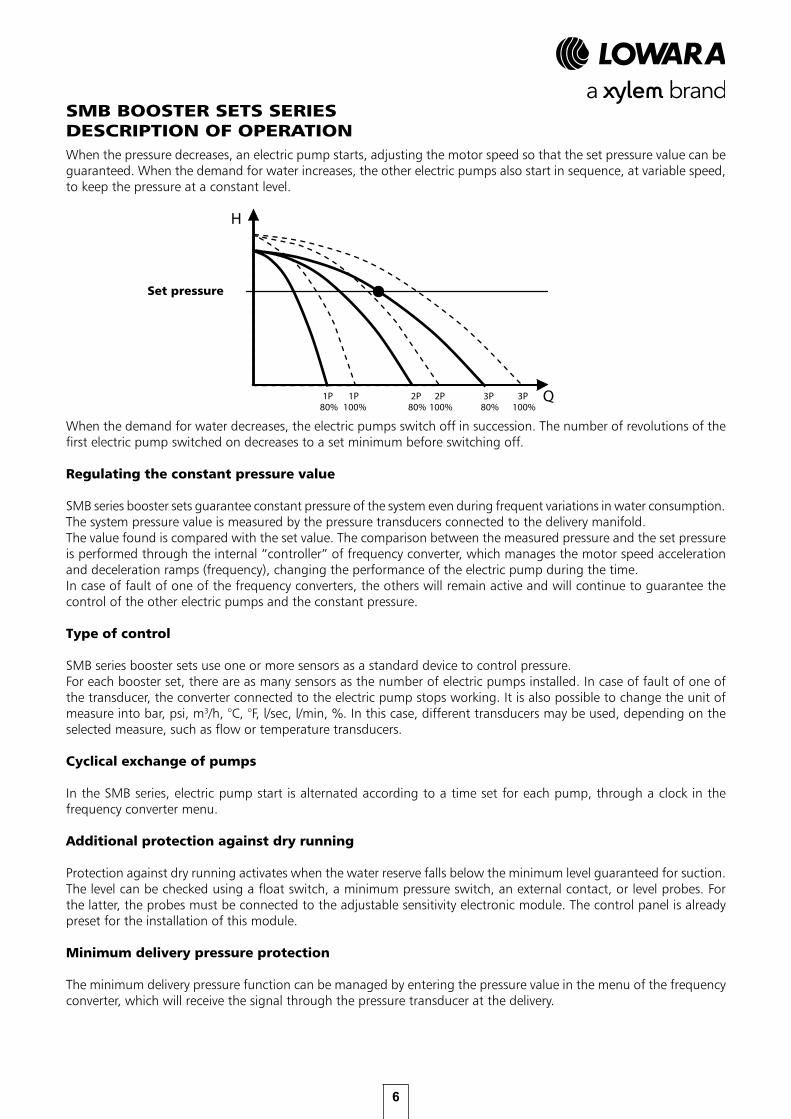
When the pressure decreases, an electric pump starts, adjusting the motor speed so that the set pressure value can be guaranteed. When the demand for water increases, the other electric pumps also start in sequence, at variable speed, to keep the pressure at a constant level.
When the demand for water decreases, the electric pumps switch off in succession. The number of revolutions of the first electric pump switched on decreases to a set minimum before switching off.
Regulating the constant pressure value
SMB series booster sets guarantee constant pressure of the system even during frequent variations in water consumption.The system pressure value is measured by the pressure transducers connected to the delivery manifold.The value found is compared with the set value. The comparison between the measured pressure and the set pressure is performed through the internal “controller” of frequency converter, which manages the motor speed acceleration and deceleration ramps (frequency), changing the performance of the electric pump during the time.In case of fault of one of the frequency converters, the others will remain active and will continue to guarantee the control of the other electric pumps and the constant pressure.
Type of control
SMB series booster sets use one or more sensors as a standard device to control pressure.For each booster set, there are as many sensors as the number of electric pumps installed. In case of fault of one of the transducer, the converter connected to the electric pump stops working. It is also possible to change the unit of measure into bar, psi, m3/h, °C, °F, l/sec, l/min, %. In this case, different transducers may be used, depending on the selected measure, such as flow or temperature transducers.
Cyclical exchange of pumps
In the SMB series, electric pump start is alternated according to a time set for each pump, through a clock in the frequency converter menu.
Additional protection against dry running
Protection against dry running activates when the water reserve falls below the minimum level guaranteed for suction.The level can be checked using a float switch, a minimum pressure switch, an external contact, or level probes. For the latter, the probes must be connected to the adjustable sensitivity electronic module. The control panel is already preset for the installation of this module.
Minimum delivery pressure protection
The minimum delivery pressure function can be managed by entering the pressure value in the menu of the frequency converter, which will receive the signal through the pressure transducer at the delivery.
H
Q1P 80%
1P 100%
2P 100%
3P 100%
2P 80%
3P 80%
7
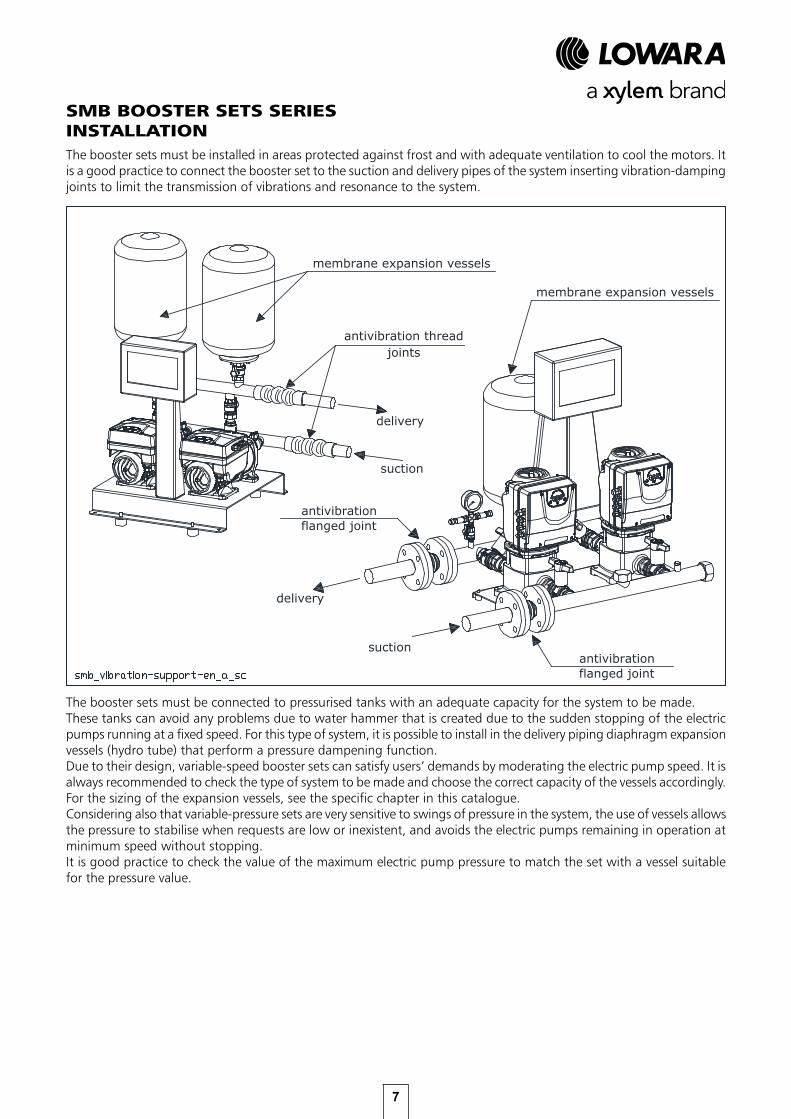
SMB BOOSTER SETS SERIESINSTALLATIONThe booster sets must be installed in areas protected against frost and with adequate ventilation to cool the motors. It is a good practice to connect the booster set to the suction and delivery pipes of the system inserting vibration-damping joints to limit the transmission of vibrations and resonance to the system.
The booster sets must be connected to pressurised tanks with an adequate capacity for the system to be made.These tanks can avoid any problems due to water hammer that is created due to the sudden stopping of the electric pumps running at a fixed speed. For this type of system, it is possible to install in the delivery piping diaphragm expansion vessels (hydro tube) that perform a pressure dampening function.Due to their design, variable-speed booster sets can satisfy users’ demands by moderating the electric pump speed. It is always recommended to check the type of system to be made and choose the correct capacity of the vessels accordingly.For the sizing of the expansion vessels, see the specific chapter in this catalogue.Considering also that variable-pressure sets are very sensitive to swings of pressure in the system, the use of vessels allows the pressure to stabilise when requests are low or inexistent, and avoids the electric pumps remaining in operation at minimum speed without stopping.It is good practice to check the value of the maximum electric pump pressure to match the set with a vessel suitable for the pressure value.
delivery
suction
antivibration threadjoints
membrane expansion vessels
delivery
suction
antivibrationflanged joint
antivibrationflanged joint
membrane expansion vessels
8
SMB BOOSTER SETS SERIESCHOICE AND SELECTION
1
Scelta del gruppo di pressione La scelta di un gruppo di pressione, deve tener conto delle seguenti condizioni:
• Garantire il fabbisogno dell’impianto come portata e pressione. • Il gruppo di pressione non sia sovradimensionato in maniera da evitare costi d’installazione
e d’esercizio inutili. Generalmente gli impianti di distribuzione idrica come quelli ad uso sanitario per abitazioni, o per grandi agglomerati come ospedali, alberghi o similari, hanno un consumo d’acqua definito “variabile” dove nel periodo di tempo di 24 h, si hanno consumi con variazioni improvvise di difficile previsione. Uno schema del consumo si può verificare sulle 24 h, ma si può anche verificare la percentuale giornaliera di funzionamento del gruppo di pressione alle varie portate. In genere la definizione della portata per questi tipi d’impianti si basa sul “calcolo delle probabilità” un sistema di calcolo molto complesso, oppure ci si basa su tabelle o diagrammi all’interno delle normative nazionali che danno dei criteri guida per il dimensionamento degli impianti, e quindi per il calcolo della massima portata contemporanea. Consumption--over 24 h Il tempo di funzionamento del gruppo di pressione, calcolato sempre nelle 24 h ci da una visione della percentuale giornaliera di funzionamento alle varie portate. Vale a dire che ci possono essere dei picchi giornalieri dove in un breve periodo di tempo, si concentra il massimo di portata richiesta. Nell’esempio sotto riportato, si nota che nel 100% del tempo si ha un consumo di 4 m³/h, mentre al 20% del tempo di funzionamento si ha un consumo di 40 m³/h. Tempo di funzionamento
hours 3 6 12 9 15 18 21 24
Q (m³/h)
10
20
30
40
% ore/gg 20 50 75 100
Q (m³/h)
10
20
30
40
1
Scelta del gruppo di pressione La scelta di un gruppo di pressione, deve tener conto delle seguenti condizioni:
• Garantire il fabbisogno dell’impianto come portata e pressione. • Il gruppo di pressione non sia sovradimensionato in maniera da evitare costi d’installazione
e d’esercizio inutili. Generalmente gli impianti di distribuzione idrica come quelli ad uso sanitario per abitazioni, o per grandi agglomerati come ospedali, alberghi o similari, hanno un consumo d’acqua definito “variabile” dove nel periodo di tempo di 24 h, si hanno consumi con variazioni improvvise di difficile previsione. Uno schema del consumo si può verificare sulle 24 h, ma si può anche verificare la percentuale giornaliera di funzionamento del gruppo di pressione alle varie portate. In genere la definizione della portata per questi tipi d’impianti si basa sul “calcolo delle probabilità” un sistema di calcolo molto complesso, oppure ci si basa su tabelle o diagrammi all’interno delle normative nazionali che danno dei criteri guida per il dimensionamento degli impianti, e quindi per il calcolo della massima portata contemporanea. Consumo durante le 24 h Il tempo di funzionamento del gruppo di pressione, calcolato sempre nelle 24 h ci da una visione della percentuale giornaliera di funzionamento alle varie portate. Vale a dire che ci possono essere dei picchi giornalieri dove in un breve periodo di tempo, si concentra il massimo di portata richiesta. Nell’esempio sotto riportato, si nota che nel 100% del tempo si ha un consumo di 4 m³/h, mentre al 20% del tempo di funzionamento si ha un consumo di 40 m³/h. Operating time
ore 3 6 12 9 15 18 21 24
Q (m³/h)
10
20
30
40
% hours/day20 50 75 100
Q (m³/h)
10
20
30
40
The following conditions should be considered when choosing a booster set:
• The system’s flow rate and pressure requirements should be met. • The unit must not be oversized, avoiding unnecessary installation and running costs.
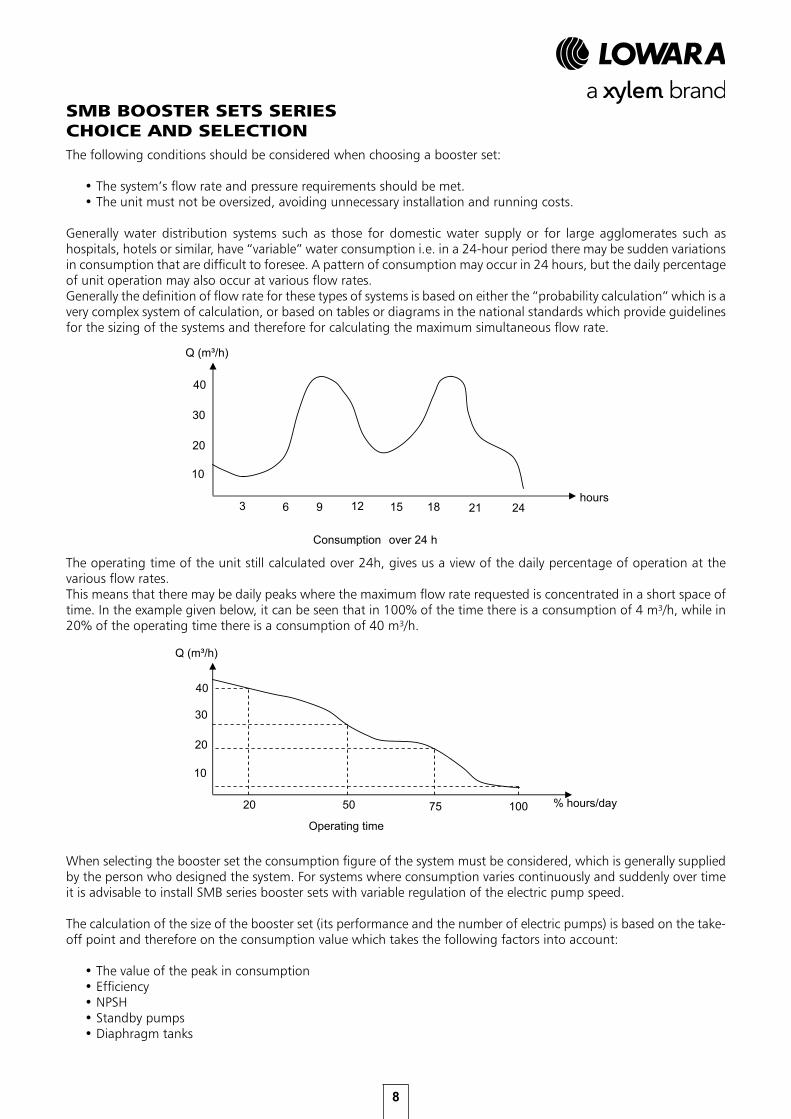
Generally water distribution systems such as those for domestic water supply or for large agglomerates such as hospitals, hotels or similar, have “variable” water consumption i.e. in a 24-hour period there may be sudden variations in consumption that are difficult to foresee. A pattern of consumption may occur in 24 hours, but the daily percentage of unit operation may also occur at various flow rates.Generally the definition of flow rate for these types of systems is based on either the “probability calculation” which is a very complex system of calculation, or based on tables or diagrams in the national standards which provide guidelines for the sizing of the systems and therefore for calculating the maximum simultaneous flow rate.
The operating time of the unit still calculated over 24h, gives us a view of the daily percentage of operation at the various flow rates.This means that there may be daily peaks where the maximum flow rate requested is concentrated in a short space of time. In the example given below, it can be seen that in 100% of the time there is a consumption of 4 m³/h, while in 20% of the operating time there is a consumption of 40 m³/h.
When selecting the booster set the consumption figure of the system must be considered, which is generally supplied by the person who designed the system. For systems where consumption varies continuously and suddenly over time it is advisable to install SMB series booster sets with variable regulation of the electric pump speed.
The calculation of the size of the booster set (its performance and the number of electric pumps) is based on the take-off point and therefore on the consumption value which takes the following factors into account:
• The value of the peak in consumption • Efficiency • NPSH • Standby pumps • Diaphragm tanks
9
SMB BOOSTER SETS SERIESCHOICE AND SELECTIONBy adjusting their operation over time, variable-speed booster sets give the end user energy savings which can be calculated directly on the control board with a metering module fitted in the electric control panel.This allows checking of the system yield, especially in complex systems with many users and many ranges of consumption.It is possible to install a standby electric pump if it is necessary to have some kind of additional safety in the pump station.This is typical in systems of a certain importance, such as hospitals or factories, or in the field of crop irrigation.
SMB series booster sets must also be equipped with expansion vessels (for the size of the vessels, see the specific chapter in this catalogue).A single vessel or several smaller vessels can be installed on the delivery of the booster set, always taking the total capacity into account.Expansion vessels avoid the risk of water hammer, which is harmful for both the system and the electric pumps.
Generally for systems with highly variable or sudden variations in consumption, it is recommended to install a booster set with variable electric pump speed, such as the SMB series, to guarantee constant pressure.
What type of electric pump to choose?Generally, the selection of electric pump is based on the maximum duty point of the system, which is usually the highest possible. The maximum request value is normally for short periods, so the electric pump must also be able to satisfy variable requests throughout its time in service.Generally the choice of the electric pump, based on the performance curve, should fall around the maximum efficiency point. The pump must ensure operation within its rated performance.
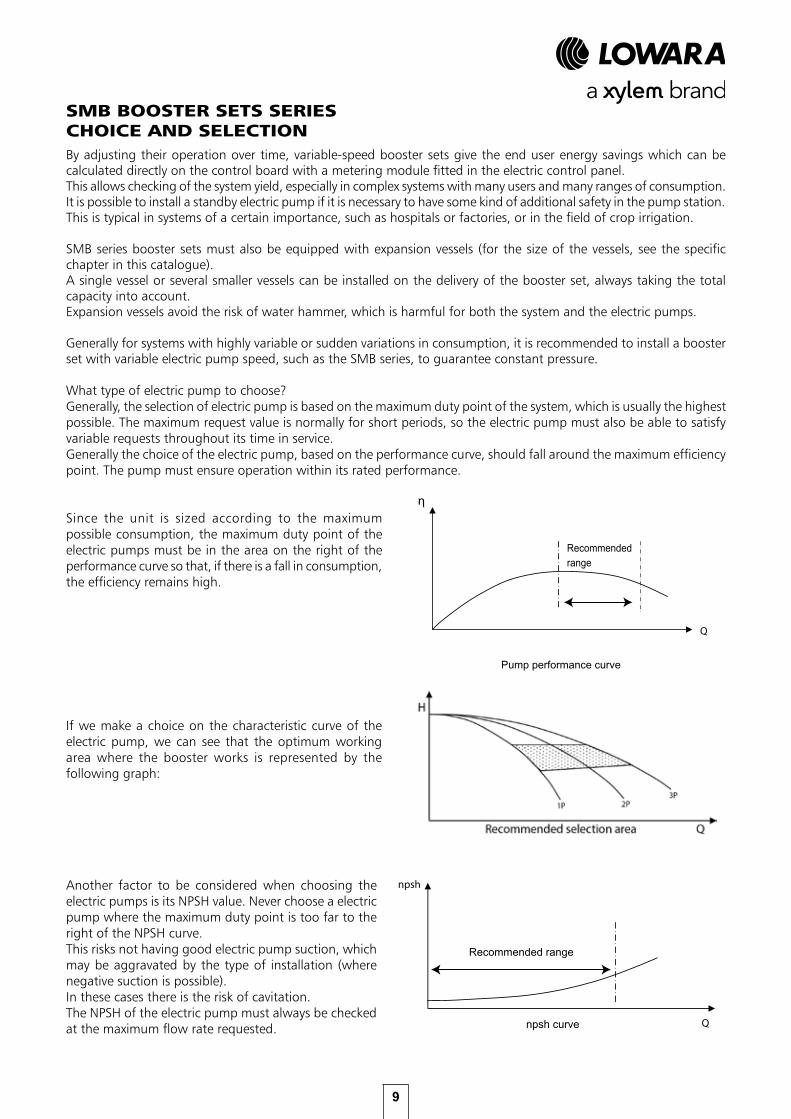
Since the unit is sized according to the maximum possible consumption, the maximum duty point of the electric pumps must be in the area on the right of the performance curve so that, if there is a fall in consumption, the efficiency remains high.
If we make a choice on the characteristic curve of the electric pump, we can see that the optimum working area where the booster works is represented by the following graph:
Another factor to be considered when choosing the electric pumps is its NPSH value. Never choose a electric pump where the maximum duty point is too far to the right of the NPSH curve.This risks not having good electric pump suction, which may be aggravated by the type of installation (where negative suction is possible).In these cases there is the risk of cavitation.The NPSH of the electric pump must always be checked at the maximum flow rate requested.
Pump performance curve
Q
η
Recommended range
npsh
Q
÷ Recommended range
npsh curve
10
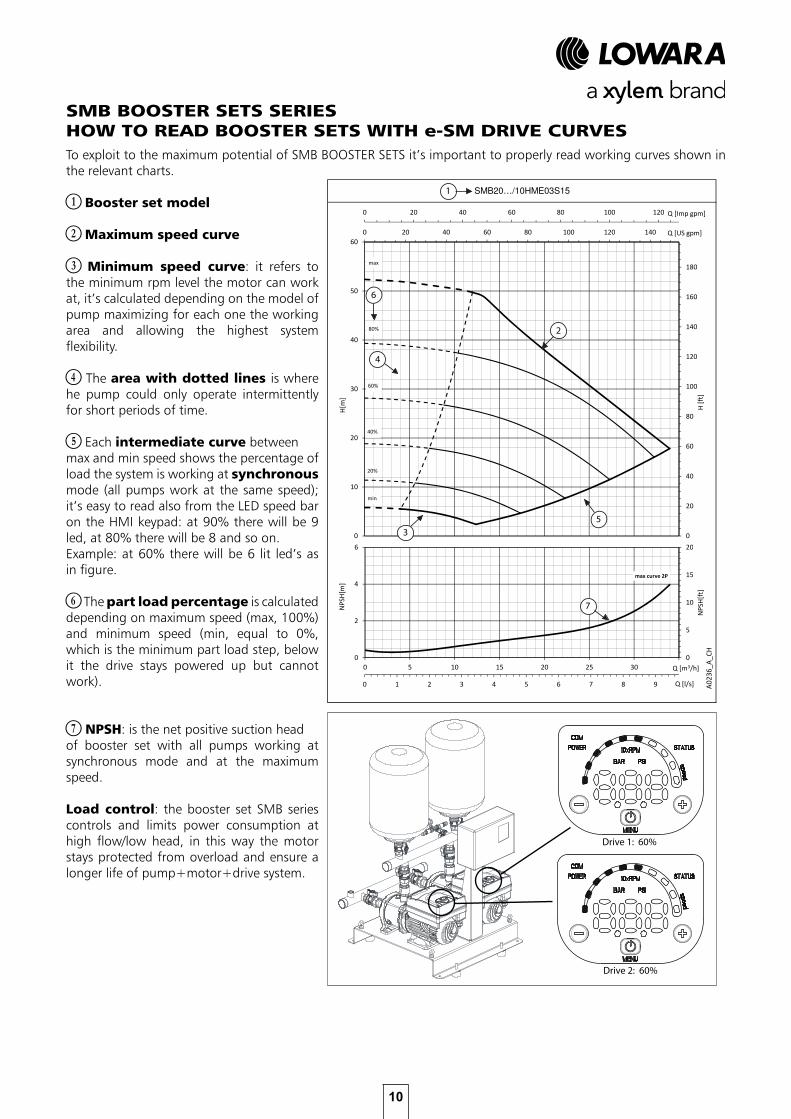
To exploit to the maximum potential of SMB BOOSTER SETS it’s important to properly read working curves shown in the relevant charts.
B Booster set model
C Maximum speed curve
D Minimum speed curve: it refers to the minimum rpm level the motor can work at, it’s calculated depending on the model of pump maximizing for each one the working area and allowing the highest system flexibility.
E The area with dotted lines is where he pump could only operate intermittently for short periods of time.
F Each intermediate curve between max and min speed shows the percentage of load the system is working at synchronous mode (all pumps work at the same speed); it’s easy to read also from the LED speed bar on the HMI keypad: at 90% there will be 9 led, at 80% there will be 8 and so on.Example: at 60% there will be 6 lit led’s as in figure.
G The part load percentage is calculated depending on maximum speed (max, 100%) and minimum speed (min, equal to 0%, which is the minimum part load step, below it the drive stays powered up but cannot work).
H NPSH: is the net positive suction head of booster set with all pumps working at synchronous mode and at the maximum speed.
Load control: the booster set SMB series controls and limits power consumption at high flow/low head, in this way the motor stays protected from overload and ensure a longer life of pump+motor+drive system.
SMB BOOSTER SETS SERIES HOW TO READ BOOSTER SETS WITH e-SM DRIVE CURVES
SMB20…/10HME03S15
1
4
35
7
2
6
Drive 1: 60%
Drive 2: 60%
11
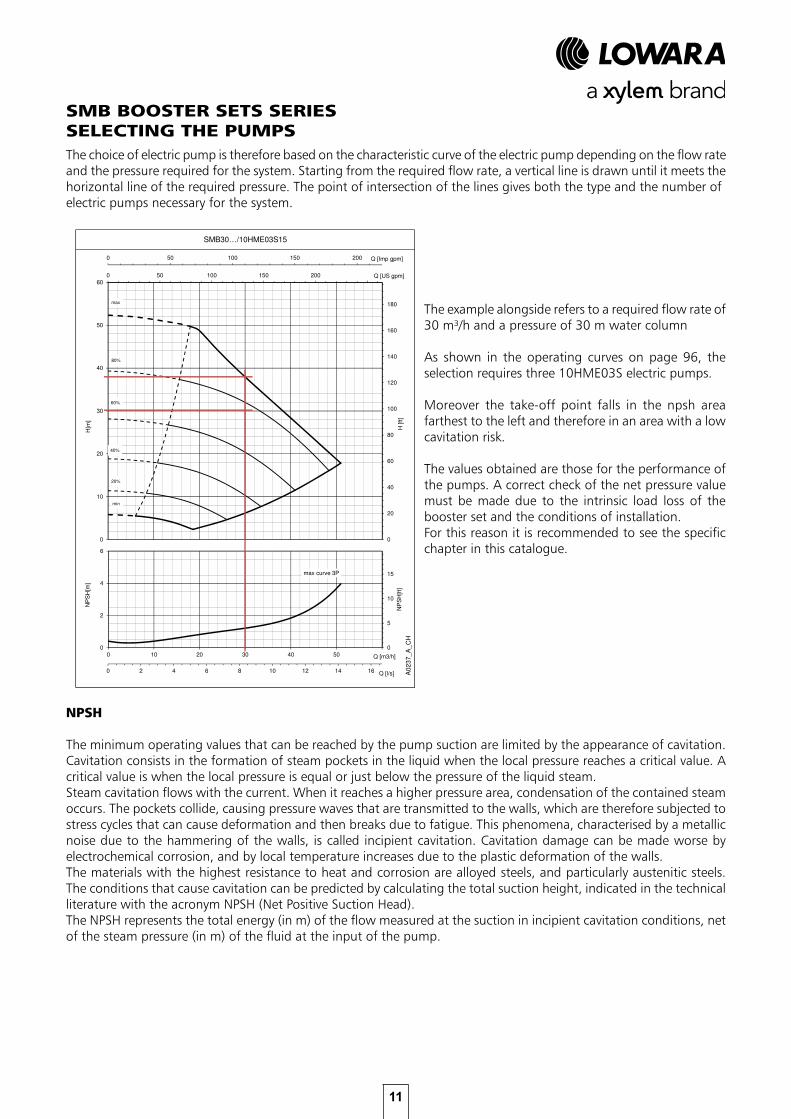
The choice of electric pump is therefore based on the characteristic curve of the electric pump depending on the flow rate and the pressure required for the system. Starting from the required flow rate, a vertical line is drawn until it meets thehorizontal line of the required pressure. The point of intersection of the lines gives both the type and the number ofelectric pumps necessary for the system.
SMB30…/10HME03S15
0 50 100 150 200
0 2 4 6 8 10 12 14 16
Q [Imp gpm]
Q [l/s]
0 50 100 150 200 250
0
20
40
60
80
100
120
140
160
180
0
10
20
30
40
50
60
Q [US gpm]
H [ft
]
H[m
]
max
80%
40%
max
80%
40%
max
80%
40%
max
80%
60%
40%
max curve 3P
0
5
10
15
0
2
4
6
0 10 20 30 40 50 60
NP
SH
[ft]
NP
SH
[m]
Q [m3/h]
A0
23
7_
A_
CH
20%
min
SMB BOOSTER SETS SERIESSELECTING THE PUMPS
The example alongside refers to a required flow rate of 30 m³/h and a pressure of 30 m water column
As shown in the operating curves on page 96, the selection requires three 10HME03S electric pumps.
Moreover the take-off point falls in the npsh area farthest to the left and therefore in an area with a low cavitation risk.
The values obtained are those for the performance of the pumps. A correct check of the net pressure value must be made due to the intrinsic load loss of the booster set and the conditions of installation.For this reason it is recommended to see the specific chapter in this catalogue.
NPSH
The minimum operating values that can be reached by the pump suction are limited by the appearance of cavitation. Cavitation consists in the formation of steam pockets in the liquid when the local pressure reaches a critical value. A critical value is when the local pressure is equal or just below the pressure of the liquid steam.Steam cavitation flows with the current. When it reaches a higher pressure area, condensation of the contained steam occurs. The pockets collide, causing pressure waves that are transmitted to the walls, which are therefore subjected to stress cycles that can cause deformation and then breaks due to fatigue. This phenomena, characterised by a metallic noise due to the hammering of the walls, is called incipient cavitation. Cavitation damage can be made worse by electrochemical corrosion, and by local temperature increases due to the plastic deformation of the walls. The materials with the highest resistance to heat and corrosion are alloyed steels, and particularly austenitic steels. The conditions that cause cavitation can be predicted by calculating the total suction height, indicated in the technical literature with the acronym NPSH (Net Positive Suction Head). The NPSH represents the total energy (in m) of the flow measured at the suction in incipient cavitation conditions, net of the steam pressure (in m) of the fluid at the input of the pump.
12
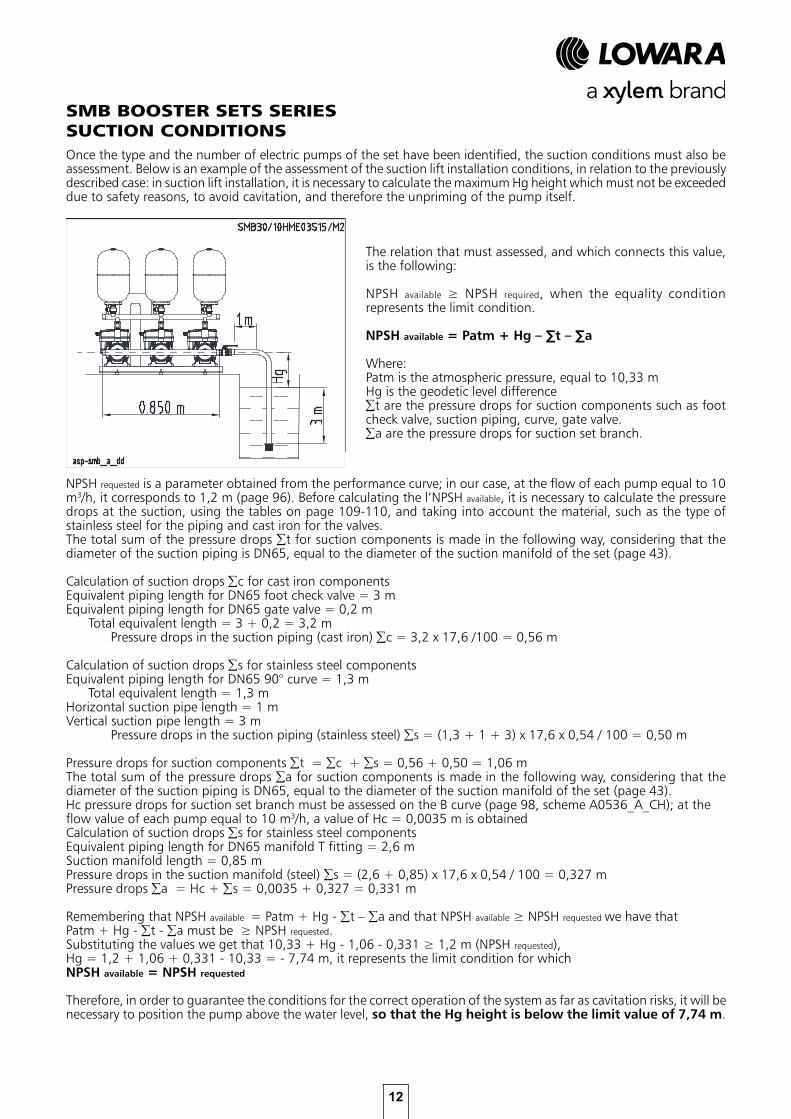
Once the type and the number of electric pumps of the set have been identified, the suction conditions must also beassessment. Below is an example of the assessment of the suction lift installation conditions, in relation to the previously described case: in suction lift installation, it is necessary to calculate the maximum Hg height which must not be exceeded due to safety reasons, to avoid cavitation, and therefore the unpriming of the pump itself.
SMB BOOSTER SETS SERIESSUCTION CONDITIONS
The relation that must assessed, and which connects this value, is the following:
NPSH available ≥ NPSH required, when the equality condition represents the limit condition.
NPSH available = Patm + Hg – ∑t – ∑a
Where:Patm is the atmospheric pressure, equal to 10,33 mHg is the geodetic level difference∑t are the pressure drops for suction components such as foot check valve, suction piping, curve, gate valve.∑a are the pressure drops for suction set branch.
NPSH requested is a parameter obtained from the performance curve; in our case, at the flow of each pump equal to 10 m3/h, it corresponds to 1,2 m (page 96). Before calculating the l’NPSH available, it is necessary to calculate the pressure drops at the suction, using the tables on page 109-110, and taking into account the material, such as the type of stainless steel for the piping and cast iron for the valves.The total sum of the pressure drops ∑t for suction components is made in the following way, considering that the diameter of the suction piping is DN65, equal to the diameter of the suction manifold of the set (page 43).
Calculation of suction drops ∑c for cast iron componentsEquivalent piping length for DN65 foot check valve = 3 mEquivalent piping length for DN65 gate valve = 0,2 m Total equivalent length = 3 + 0,2 = 3,2 m Pressure drops in the suction piping (cast iron) ∑c = 3,2 x 17,6 /100 = 0,56 m
Calculation of suction drops ∑s for stainless steel componentsEquivalent piping length for DN65 90° curve = 1,3 m Total equivalent length = 1,3 mHorizontal suction pipe length = 1 mVertical suction pipe length = 3 m Pressure drops in the suction piping (stainless steel) ∑s = (1,3 + 1 + 3) x 17,6 x 0,54 / 100 = 0,50 m
Pressure drops for suction components ∑t = ∑c + ∑s = 0,56 + 0,50 = 1,06 mThe total sum of the pressure drops ∑a for suction components is made in the following way, considering that the diameter of the suction piping is DN65, equal to the diameter of the suction manifold of the set (page 43). Hc pressure drops for suction set branch must be assessed on the B curve (page 98, scheme A0536_A_CH); at theflow value of each pump equal to 10 m3/h, a value of Hc = 0,0035 m is obtainedCalculation of suction drops ∑s for stainless steel componentsEquivalent piping length for DN65 manifold T fitting = 2,6 mSuction manifold length = 0,85 mPressure drops in the suction manifold (steel) ∑s = (2,6 + 0,85) x 17,6 x 0,54 / 100 = 0,327 mPressure drops ∑a = Hc + ∑s = 0,0035 + 0,327 = 0,331 m
Remembering that NPSH available = Patm + Hg - ∑t – ∑a and that NPSH available ≥ NPSH requested we have that Patm + Hg - ∑t - ∑a must be ≥ NPSH requested. Substituting the values we get that 10,33 + Hg - 1,06 - 0,331 ≥ 1,2 m (NPSH requested), Hg = 1,2 + 1,06 + 0,331 - 10,33 = - 7,74 m, it represents the limit condition for which NPSH available = NPSH requested
Therefore, in order to guarantee the conditions for the correct operation of the system as far as cavitation risks, it will be necessary to position the pump above the water level, so that the Hg height is below the limit value of 7,74 m.
13
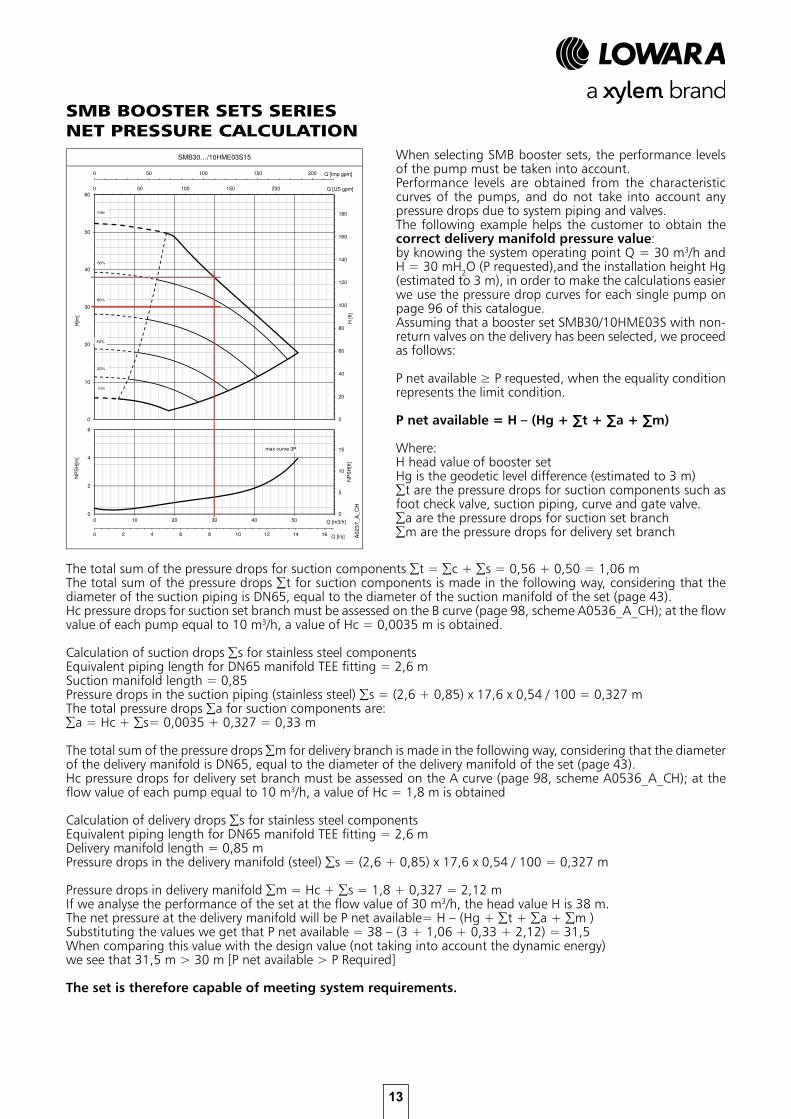
SMB BOOSTER SETS SERIESNET PRESSURE CALCULATION
When selecting SMB booster sets, the performance levels of the pump must be taken into account.Performance levels are obtained from the characteristic curves of the pumps, and do not take into account any pressure drops due to system piping and valves. The following example helps the customer to obtain the correct delivery manifold pressure value:by knowing the system operating point Q = 30 m3/h and H = 30 mH2O (P requested),and the installation height Hg (estimated to 3 m), in order to make the calculations easier we use the pressure drop curves for each single pump on page 96 of this catalogue.Assuming that a booster set SMB30/10HME03S with non-return valves on the delivery has been selected, we proceed as follows:
P net available ≥ P requested, when the equality condition represents the limit condition.
P net available = H – (Hg + ∑t + ∑a + ∑m)
Where:H head value of booster setHg is the geodetic level difference (estimated to 3 m)∑t are the pressure drops for suction components such as foot check valve, suction piping, curve and gate valve.∑a are the pressure drops for suction set branch∑m are the pressure drops for delivery set branch
SMB30…/10HME03S15
0 50 100 150 200
0 2 4 6 8 10 12 14 16
Q [Imp gpm]
Q [l/s]
0 50 100 150 200 250
0
20
40
60
80
100
120
140
160
180
0
10
20
30
40
50
60
Q [US gpm]
H [ft
]
H[m
]
max
80%
40%
max
80%
40%
max
80%
40%
max
80%
60%
40%
max curve 3P
0
5
10
15
0
2
4
6
0 10 20 30 40 50 60
NP
SH
[ft]
NP
SH
[m]
Q [m3/h]
A0
23
7_
A_
CH
20%
min
The total sum of the pressure drops for suction components ∑t = ∑c + ∑s = 0,56 + 0,50 = 1,06 mThe total sum of the pressure drops ∑t for suction components is made in the following way, considering that the diameter of the suction piping is DN65, equal to the diameter of the suction manifold of the set (page 43).Hc pressure drops for suction set branch must be assessed on the B curve (page 98, scheme A0536_A_CH); at the flow value of each pump equal to 10 m3/h, a value of Hc = 0,0035 m is obtained.
Calculation of suction drops ∑s for stainless steel componentsEquivalent piping length for DN65 manifold TEE fitting = 2,6 mSuction manifold length = 0,85Pressure drops in the suction piping (stainless steel) ∑s = (2,6 + 0,85) x 17,6 x 0,54 / 100 = 0,327 mThe total pressure drops ∑a for suction components are:∑a = Hc + ∑s= 0,0035 + 0,327 = 0,33 m
The total sum of the pressure drops ∑m for delivery branch is made in the following way, considering that the diameter of the delivery manifold is DN65, equal to the diameter of the delivery manifold of the set (page 43).Hc pressure drops for delivery set branch must be assessed on the A curve (page 98, scheme A0536_A_CH); at the flow value of each pump equal to 10 m3/h, a value of Hc = 1,8 m is obtained
Calculation of delivery drops ∑s for stainless steel componentsEquivalent piping length for DN65 manifold TEE fitting = 2,6 mDelivery manifold length = 0,85 mPressure drops in the delivery manifold (steel) ∑s = (2,6 + 0,85) x 17,6 x 0,54 / 100 = 0,327 m
Pressure drops in delivery manifold ∑m = Hc + ∑s = 1,8 + 0,327 = 2,12 mIf we analyse the performance of the set at the flow value of 30 m3/h, the head value H is 38 m.The net pressure at the delivery manifold will be P net available= H – (Hg + ∑t + ∑a + ∑m ) Substituting the values we get that P net available = 38 – (3 + 1,06 + 0,33 + 2,12) = 31,5When comparing this value with the design value (not taking into account the dynamic energy) we see that 31,5 m > 30 m [P net available > P Required]
The set is therefore capable of meeting system requirements.

14
15
Variable speed booster sets
e-SV™ SMART series multistage vertical electric pumpsVM™ SMART series multistage vertical monolithic threaded electric pumpse-HM™ SMART series multistage horizontal electric pumps
High efficiency motors with integrated e-SM driveFlow rate up to 51 m3/h and pressure up to 16 bar
SMB20, SMB30SERIES
16
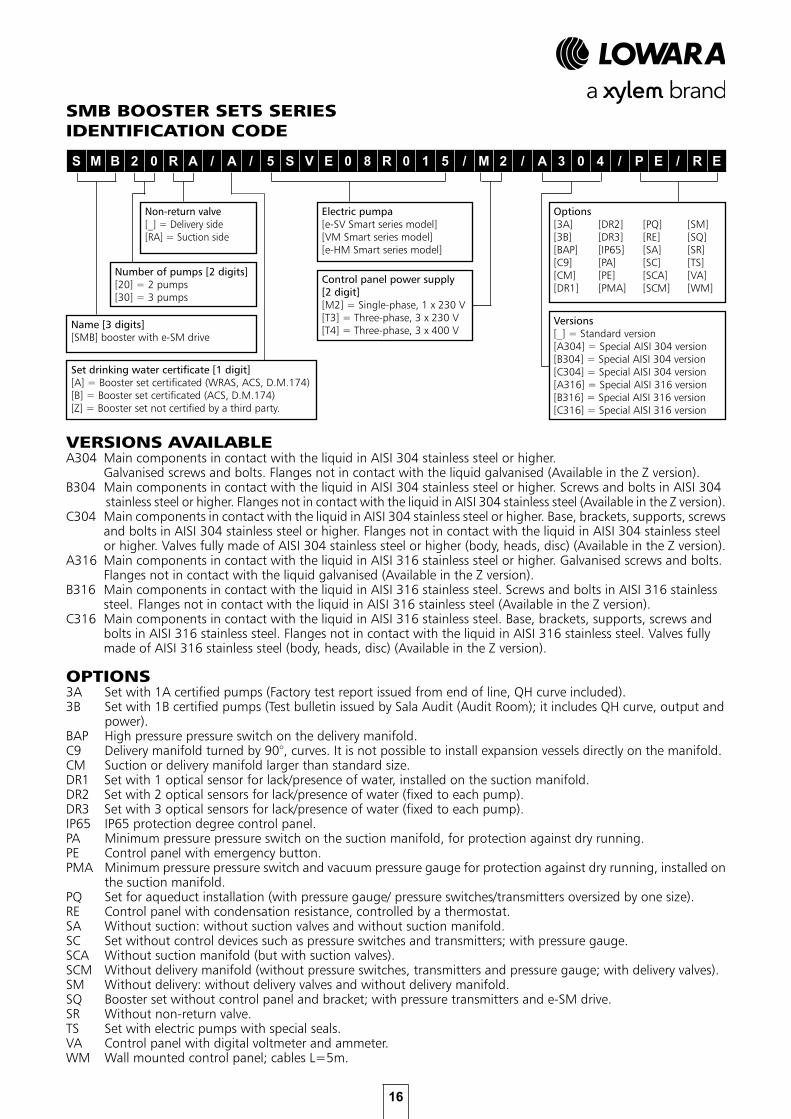
SMB BOOSTER SETS SERIESIDENTIFICATION CODE
Name [3 digits][SMB] booster with e-SM drive
Number of pumps [2 digits][20] = 2 pumps[30] = 3 pumps
Non-return valve[_] = Delivery side[RA] = Suction side
Set drinking water certificate [1 digit][A] = Booster set certificated (WRAS, ACS, D.M.174)[B] = Booster set certificated (ACS, D.M.174)[Z] = Booster set not certified by a third party.
Electric pumpa[e-SV Smart series model][VM Smart series model][e-HM Smart series model]
Control panel power supply[2 digit][M2] = Single-phase, 1 x 230 V[T3] = Three-phase, 3 x 230 V[T4] = Three-phase, 3 x 400 V
Versions[_] = Standard version[A304] = Special AISI 304 version[B304] = Special AISI 304 version[C304] = Special AISI 304 version[A316] = Special AISI 316 version[B316] = Special AISI 316 version[C316] = Special AISI 316 version
S M B 2 0 R A / A / 5 S V E 0 8 R 0 1 5 / M 2 / A 3 0 4 / P E / R E
VERSIONS AVAILABLE A304 Main components in contact with the liquid in AISI 304 stainless steel or higher. Galvanised screws and bolts. Flanges not in contact with the liquid galvanised (Available in the Z version).B304 Main components in contact with the liquid in AISI 304 stainless steel or higher. Screws and bolts in AISI 304 stainless steel or higher. Flanges not in contact with the liquid in AISI 304 stainless steel (Available in the Z version).C304 Main components in contact with the liquid in AISI 304 stainless steel or higher. Base, brackets, supports, screws and bolts in AISI 304 stainless steel or higher. Flanges not in contact with the liquid in AISI 304 stainless steel or higher. Valves fully made of AISI 304 stainless steel or higher (body, heads, disc) (Available in the Z version).A316 Main components in contact with the liquid in AISI 316 stainless steel or higher. Galvanised screws and bolts. Flanges not in contact with the liquid galvanised (Available in the Z version).B316 Main components in contact with the liquid in AISI 316 stainless steel. Screws and bolts in AISI 316 stainless steel. Flanges not in contact with the liquid in AISI 316 stainless steel (Available in the Z version).C316 Main components in contact with the liquid in AISI 316 stainless steel. Base, brackets, supports, screws and bolts in AISI 316 stainless steel. Flanges not in contact with the liquid in AISI 316 stainless steel. Valves fully made of AISI 316 stainless steel (body, heads, disc) (Available in the Z version).
OPTIONS3A Set with 1A certified pumps (Factory test report issued from end of line, QH curve included).3B Set with 1B certified pumps (Test bulletin issued by Sala Audit (Audit Room); it includes QH curve, output and power).BAP High pressure pressure switch on the delivery manifold.C9 Delivery manifold turned by 90°, curves. It is not possible to install expansion vessels directly on the manifold.CM Suction or delivery manifold larger than standard size.DR1 Set with 1 optical sensor for lack/presence of water, installed on the suction manifold.DR2 Set with 2 optical sensors for lack/presence of water (fixed to each pump).DR3 Set with 3 optical sensors for lack/presence of water (fixed to each pump).IP65 IP65 protection degree control panel.PA Minimum pressure pressure switch on the suction manifold, for protection against dry running.PE Control panel with emergency button.PMA Minimum pressure pressure switch and vacuum pressure gauge for protection against dry running, installed on the suction manifold.PQ Set for aqueduct installation (with pressure gauge/ pressure switches/transmitters oversized by one size).RE Control panel with condensation resistance, controlled by a thermostat.SA Without suction: without suction valves and without suction manifold.SC Set without control devices such as pressure switches and transmitters; with pressure gauge.SCA Without suction manifold (but with suction valves).SCM Without delivery manifold (without pressure switches, transmitters and pressure gauge; with delivery valves).SM Without delivery: without delivery valves and without delivery manifold.SQ Booster set without control panel and bracket; with pressure transmitters and e-SM drive.SR Without non-return valve.TS Set with electric pumps with special seals.VA Control panel with digital voltmeter and ammeter.WM Wall mounted control panel; cables L=5m.
Options[3A][3B][BAP][C9][CM][DR1]
[DR2] [DR3] [IP65][PA][PE][PMA]
[PQ][RE][SA][SC][SCA][SCM]
[SM][SQ][SR][TS][VA][WM]
17
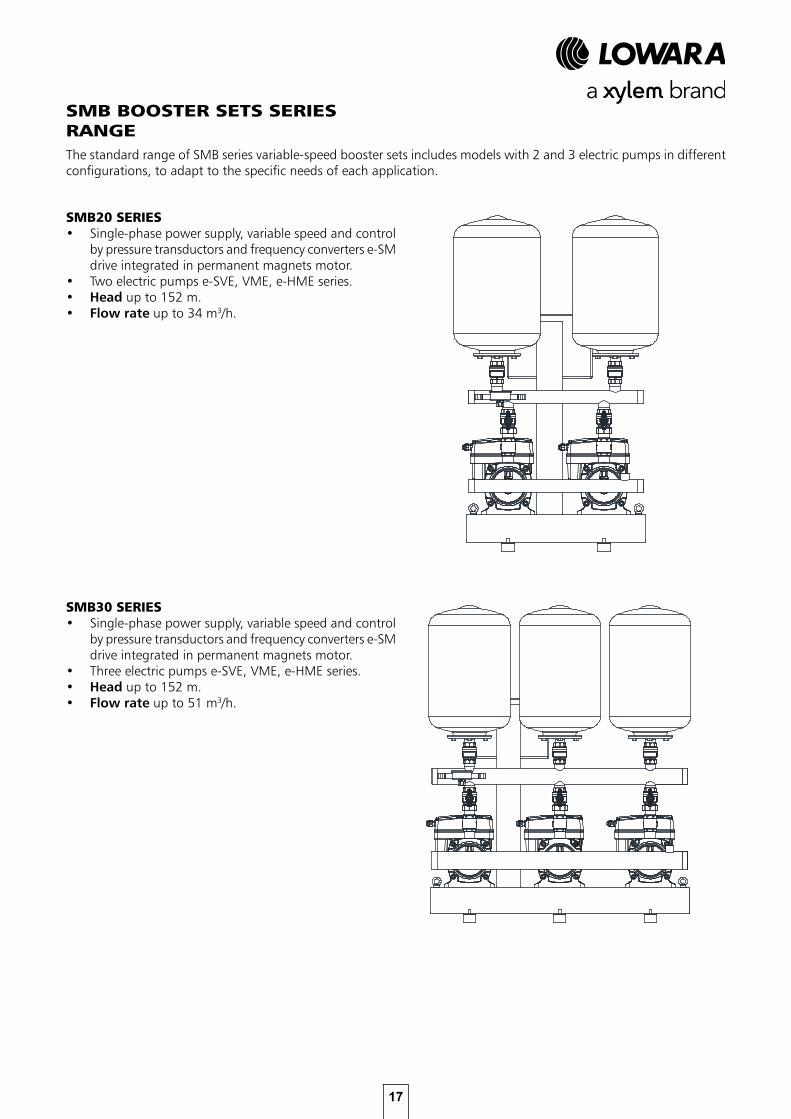
SMB BOOSTER SETS SERIES RANGE
SMB20 SERIES• Single-phase power supply, variable speed and control
by pressure transductors and frequency converters e-SM drive integrated in permanent magnets motor.
• Two electric pumps e-SVE, VME, e-HME series.• Head up to 152 m.• Flow rate up to 34 m3/h.
The standard range of SMB series variable-speed booster sets includes models with 2 and 3 electric pumps in different configurations, to adapt to the specific needs of each application.
SMB30 SERIES• Single-phase power supply, variable speed and control
by pressure transductors and frequency converters e-SM drive integrated in permanent magnets motor.
• Three electric pumps e-SVE, VME, e-HME series.• Head up to 152 m.• Flow rate up to 51 m3/h.
18
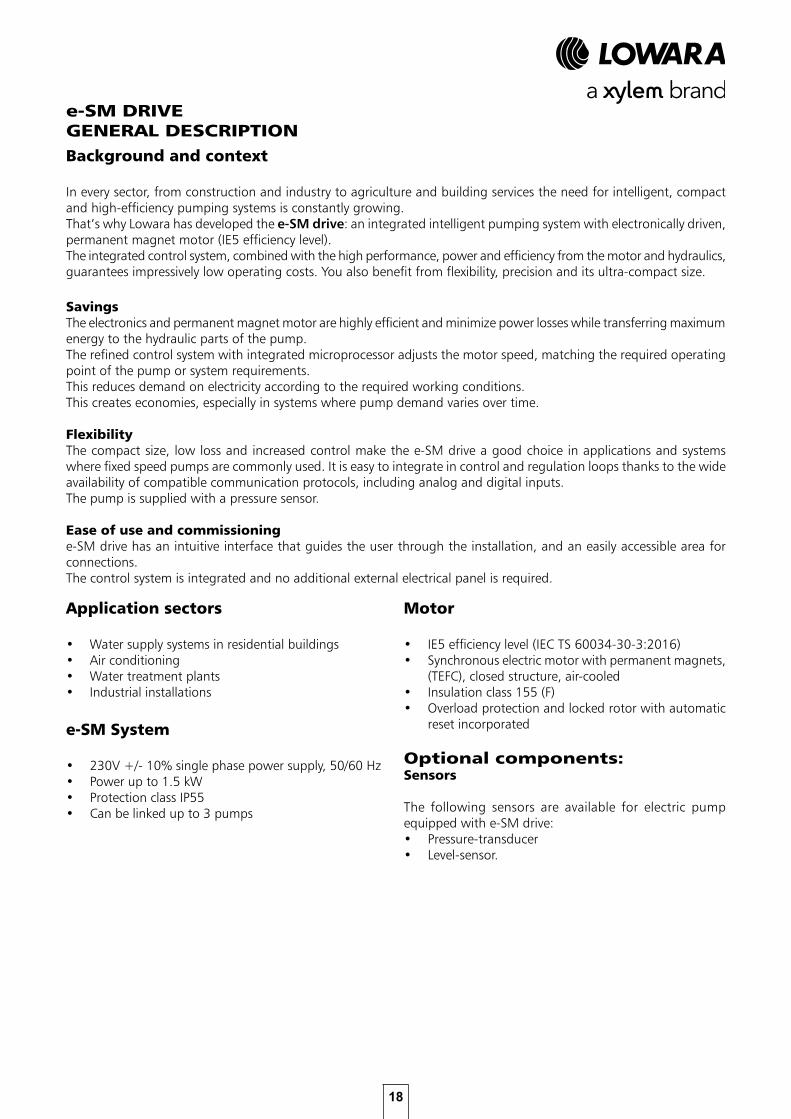
e-SM DRIVEGENERAL DESCRIPTIONBackground and context
In every sector, from construction and industry to agriculture and building services the need for intelligent, compact and high-efficiency pumping systems is constantly growing.That’s why Lowara has developed the e-SM drive: an integrated intelligent pumping system with electronically driven, permanent magnet motor (IE5 efficiency level).The integrated control system, combined with the high performance, power and efficiency from the motor and hydraulics, guarantees impressively low operating costs. You also benefit from flexibility, precision and its ultra-compact size.
SavingsThe electronics and permanent magnet motor are highly efficient and minimize power losses while transferring maximum energy to the hydraulic parts of the pump. The refined control system with integrated microprocessor adjusts the motor speed, matching the required operating point of the pump or system requirements. This reduces demand on electricity according to the required working conditions. This creates economies, especially in systems where pump demand varies over time.
FlexibilityThe compact size, low loss and increased control make the e-SM drive a good choice in applications and systems where fixed speed pumps are commonly used. It is easy to integrate in control and regulation loops thanks to the wide availability of compatible communication protocols, including analog and digital inputs.The pump is supplied with a pressure sensor.
Ease of use and commissioninge-SM drive has an intuitive interface that guides the user through the installation, and an easily accessible area for connections. The control system is integrated and no additional external electrical panel is required.
Application sectors
• Water supply systems in residential buildings• Air conditioning• Water treatment plants• Industrial installations
e-SM System
• 230V +/- 10% single phase power supply, 50/60 Hz• Power up to 1.5 kW• Protection class IP55• Can be linked up to 3 pumps
Motor
• IE5 efficiency level (IEC TS 60034-30-3:2016)• Synchronous electric motor with permanent magnets,
(TEFC), closed structure, air-cooled• Insulation class 155 (F)• Overload protection and locked rotor with automatic
reset incorporated
Optional components:Sensors
The following sensors are available for electric pump equipped with e-SM drive:• Pressure-transducer• Level-sensor.
19
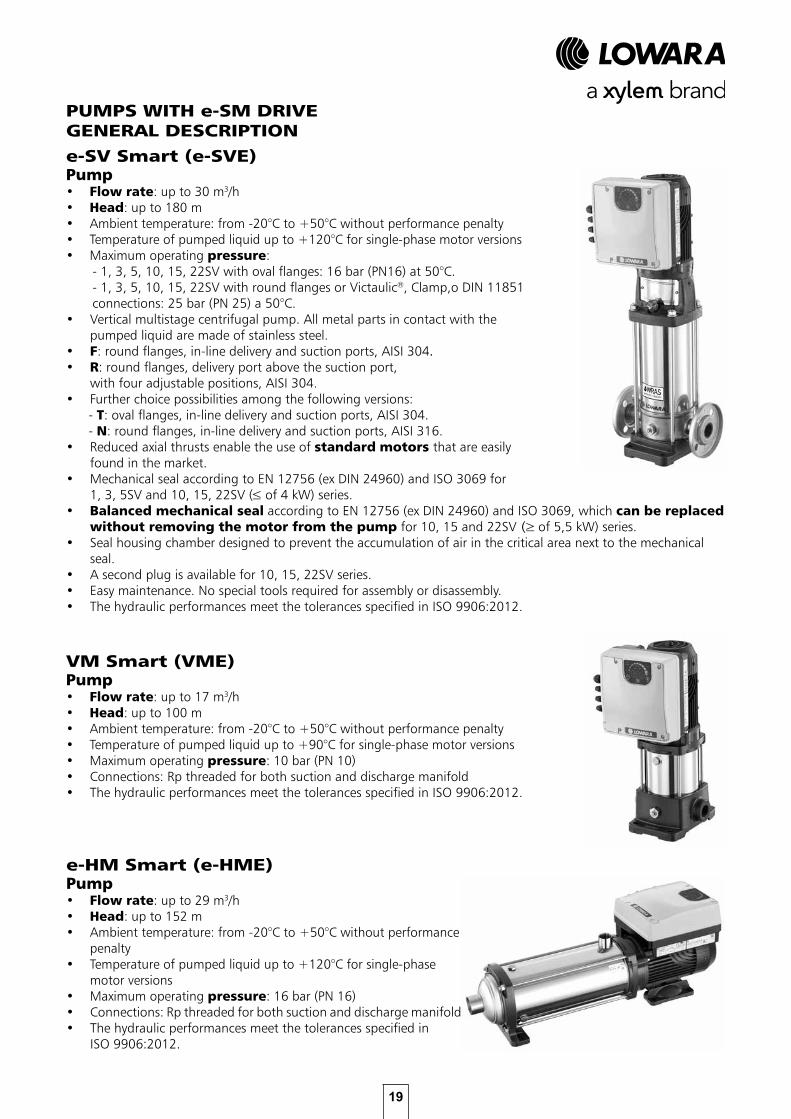
e-SV Smart (e-SVE)Pump• Flow rate: up to 30 m3/h• Head: up to 180 m • Ambient temperature: from -20°C to +50°C without performance penalty• Temperature of pumped liquid up to +120°C for single-phase motor versions• Maximum operating pressure:
- 1, 3, 5, 10, 15, 22SV with oval flanges: 16 bar (PN16) at 50°C.- 1, 3, 5, 10, 15, 22SV with round flanges or Victaulic®, Clamp,o DIN 11851 connections: 25 bar (PN 25) a 50°C.
• Vertical multistage centrifugal pump. All metal parts in contact with the pumped liquid are made of stainless steel.
• F: round flanges, in-line delivery and suction ports, AISI 304.• R: round flanges, delivery port above the suction port,
with four adjustable positions, AISI 304.• Further choice possibilities among the following versions:
- T: oval flanges, in-line delivery and suction ports, AISI 304. - N: round flanges, in-line delivery and suction ports, AISI 316.
• Reduced axial thrusts enable the use of standard motors that are easily found in the market.
• Mechanical seal according to EN 12756 (ex DIN 24960) and ISO 3069 for 1, 3, 5SV and 10, 15, 22SV (≤ of 4 kW) series.
• Balanced mechanical seal according to EN 12756 (ex DIN 24960) and ISO 3069, which can be replaced without removing the motor from the pump for 10, 15 and 22SV (≥ of 5,5 kW) series.
• Seal housing chamber designed to prevent the accumulation of air in the critical area next to the mechanical seal.
• A second plug is available for 10, 15, 22SV series.• Easy maintenance. No special tools required for assembly or disassembly. • The hydraulic performances meet the tolerances specified in ISO 9906:2012.
VM Smart (VME)Pump• Flow rate: up to 17 m3/h• Head: up to 100 m • Ambient temperature: from -20°C to +50°C without performance penalty• Temperature of pumped liquid up to +90°C for single-phase motor versions • Maximum operating pressure: 10 bar (PN 10)• Connections: Rp threaded for both suction and discharge manifold• The hydraulic performances meet the tolerances specified in ISO 9906:2012.
e-HM Smart (e-HME)Pump• Flow rate: up to 29 m3/h• Head: up to 152 m • Ambient temperature: from -20°C to +50°C without performance
penalty• Temperature of pumped liquid up to +120°C for single-phase
motor versions• Maximum operating pressure: 16 bar (PN 16)• Connections: Rp threaded for both suction and discharge manifold• The hydraulic performances meet the tolerances specified in
ISO 9906:2012.
PUMPS WITH e-SM DRIVEGENERAL DESCRIPTION
20
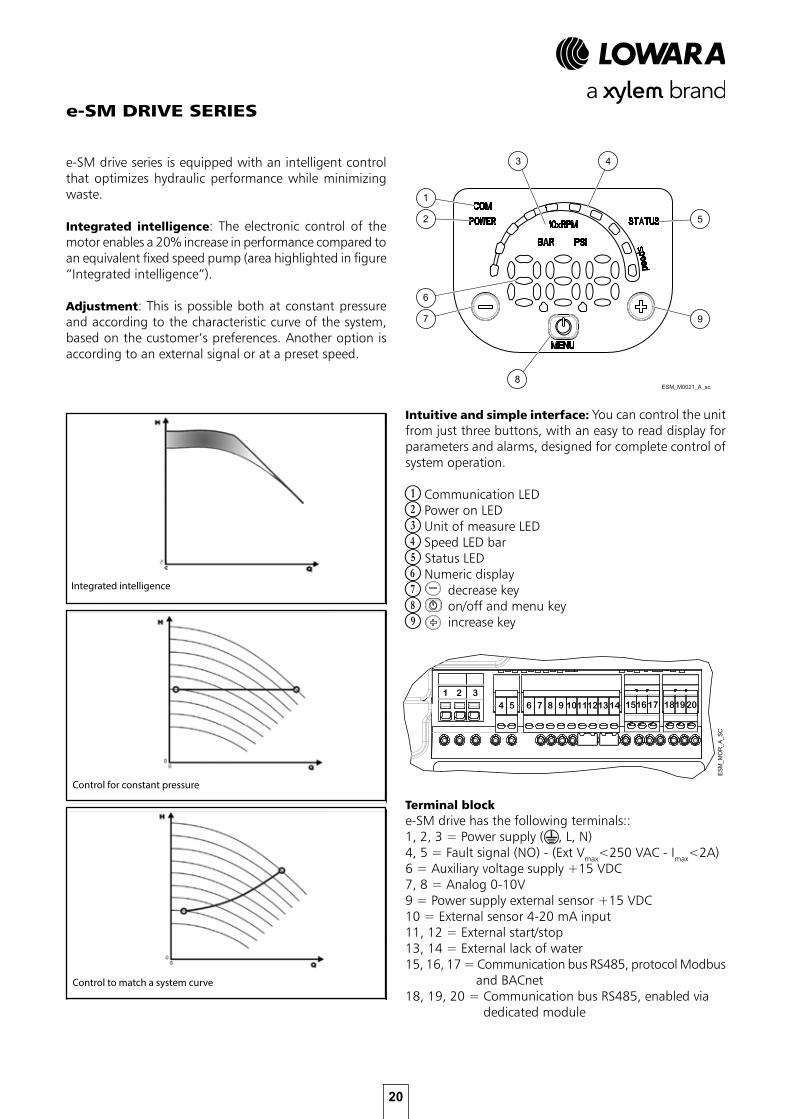
e-SM DRIVE SERIES
e-SM drive series is equipped with an intelligent control that optimizes hydraulic performance while minimizing waste.
Integrated intelligence: The electronic control of the motor enables a 20% increase in performance compared to an equivalent fixed speed pump (area highlighted in figure “Integrated intelligence”).
Adjustment: This is possible both at constant pressure and according to the characteristic curve of the system, based on the customer’s preferences. Another option is according to an external signal or at a preset speed.
1
2
6
7
5
9
8
3 4
ESM_M0021_A_sc
ESM
_MO
R_A
_SC
4 5 6 7 8 9 1011121314 151617 1819201 2 3
Terminal blocke-SM drive has the following terminals::1, 2, 3 = Power supply ( , L, N)4, 5 = Fault signal (NO) - (Ext Vmax<250 VAC - Imax<2A)6 = Auxiliary voltage supply +15 VDC7, 8 = Analog 0-10V 9 = Power supply external sensor +15 VDC10 = External sensor 4-20 mA input11, 12 = External start/stop13, 14 = External lack of water15, 16, 17 = Communication bus RS485, protocol Modbus and BACnet18, 19, 20 = Communication bus RS485, enabled via dedicated module
Integrated intelligence
Control for constant pressure
Control to match a system curve
Intuitive and simple interface: You can control the unit from just three buttons, with an easy to read display for parameters and alarms, designed for complete control of system operation.
B Communication LEDC Power on LEDD Unit of measure LEDE Speed LED barF Status LEDG Numeric displayH decrease keyI on/off and menu keyJ increase key
21
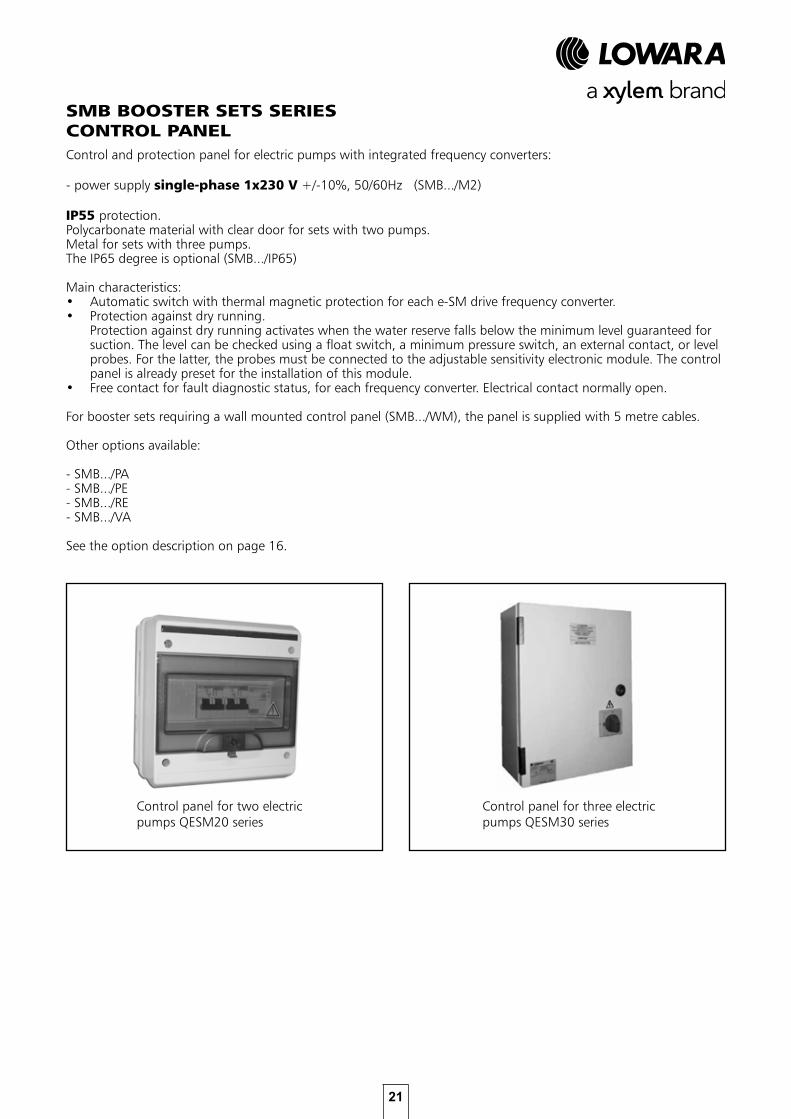
SMB BOOSTER SETS SERIES CONTROL PANEL
Control panel for three electric pumps QESM30 series
Control panel for two electric pumps QESM20 series
Control and protection panel for electric pumps with integrated frequency converters:
- power supply single-phase 1x230 V +/-10%, 50/60Hz (SMB.../M2)
IP55 protection.Polycarbonate material with clear door for sets with two pumps.Metal for sets with three pumps.The IP65 degree is optional (SMB.../IP65)
Main characteristics:• Automatic switch with thermal magnetic protection for each e-SM drive frequency converter.• Protection against dry running.
Protection against dry running activates when the water reserve falls below the minimum level guaranteed for suction. The level can be checked using a float switch, a minimum pressure switch, an external contact, or level probes. For the latter, the probes must be connected to the adjustable sensitivity electronic module. The control panel is already preset for the installation of this module.
• Free contact for fault diagnostic status, for each frequency converter. Electrical contact normally open.
For booster sets requiring a wall mounted control panel (SMB.../WM), the panel is supplied with 5 metre cables.
Other options available:
- SMB.../PA- SMB.../PE- SMB.../RE- SMB.../VA
See the option description on page 16.
22
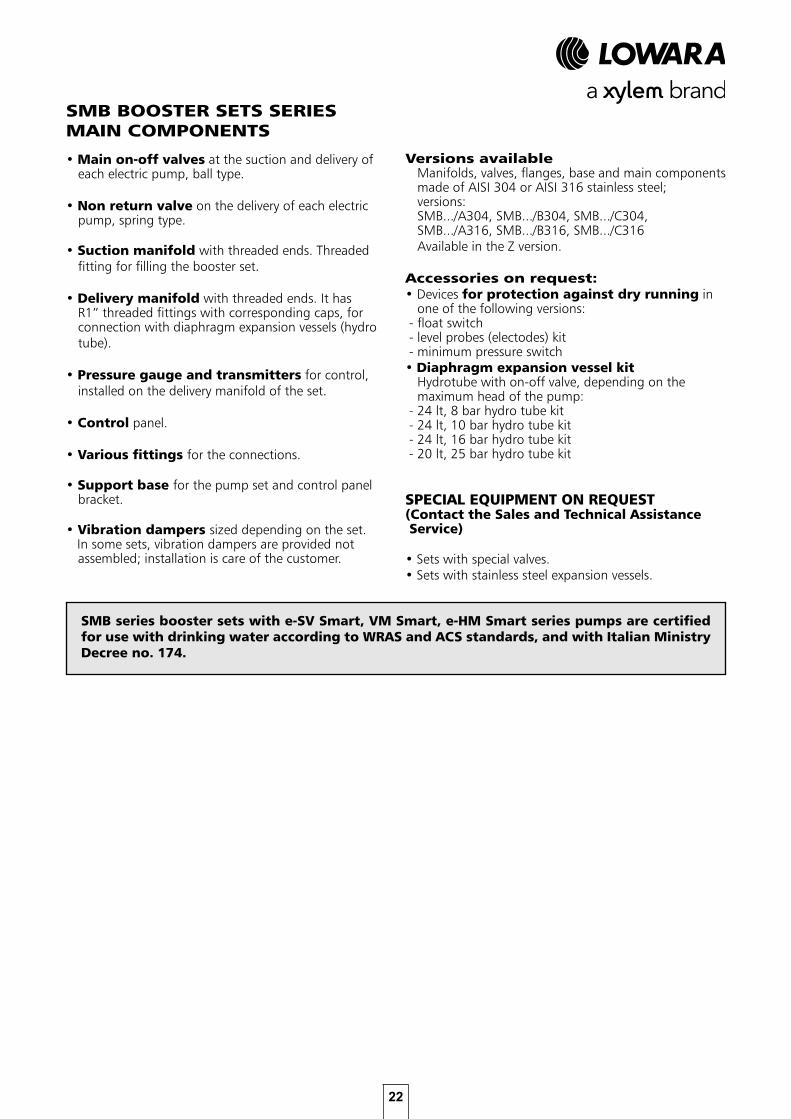
• Main on-off valves at the suction and delivery of each electric pump, ball type.
• Non return valve on the delivery of each electric pump, spring type.
• Suction manifold with threaded ends. Threaded fitting for filling the booster set.
• Delivery manifold with threaded ends. It has R1” threaded fittings with corresponding caps, for connection with diaphragm expansion vessels (hydro tube).
• Pressure gauge and transmitters for control, installed on the delivery manifold of the set.
• Control panel.
• Various fittings for the connections.
• Support base for the pump set and control panel bracket.
• Vibration dampers sized depending on the set. In some sets, vibration dampers are provided not
assembled; installation is care of the customer.
Versions available Manifolds, valves, flanges, base and main components made of AISI 304 or AISI 316 stainless steel; versions:SMB.../A304, SMB.../B304, SMB.../C304,SMB.../A316, SMB.../B316, SMB.../C316Available in the Z version.
Accessories on request: • Devices for protection against dry running in
one of the following versions: - float switch - level probes (electodes) kit - minimum pressure switch• Diaphragm expansion vessel kit
Hydrotube with on-off valve, depending on the maximum head of the pump:
- 24 lt, 8 bar hydro tube kit - 24 lt, 10 bar hydro tube kit - 24 lt, 16 bar hydro tube kit - 20 lt, 25 bar hydro tube kit
SPECIAL EQUIPMENT ON REQUEST (Contact the Sales and Technical Assistance Service)
• Sets with special valves.• Sets with stainless steel expansion vessels.
SMB BOOSTER SETS SERIES MAIN COMPONENTS
SMB series booster sets with e-SV Smart, VM Smart, e-HM Smart series pumps are certified for use with drinking water according to WRAS and ACS standards, and with Italian Ministry Decree no. 174.
23
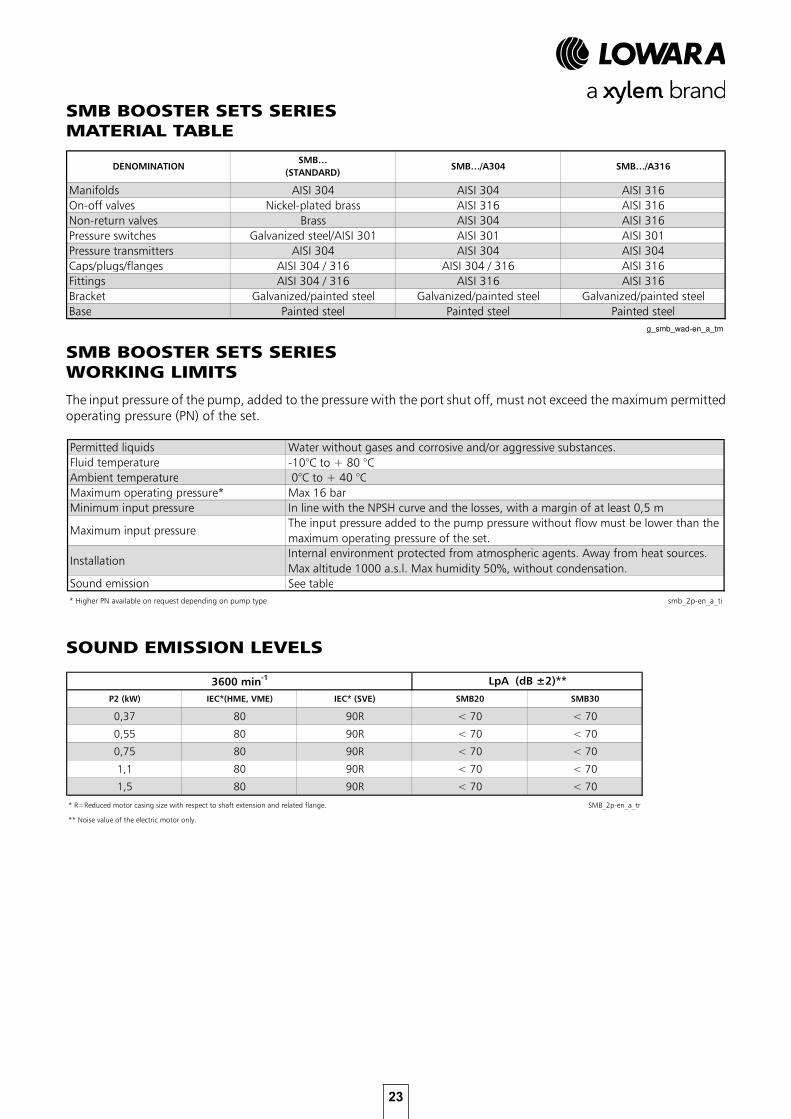
SMB BOOSTER SETS SERIES MATERIAL TABLE
g_smb_wad-en_a_tm
The input pressure of the pump, added to the pressure with the port shut off, must not exceed the maximum permittedoperating pressure (PN) of the set.
SMB BOOSTER SETS SERIES WORKING LIMITS
SOUND EMISSION LEVELS
24
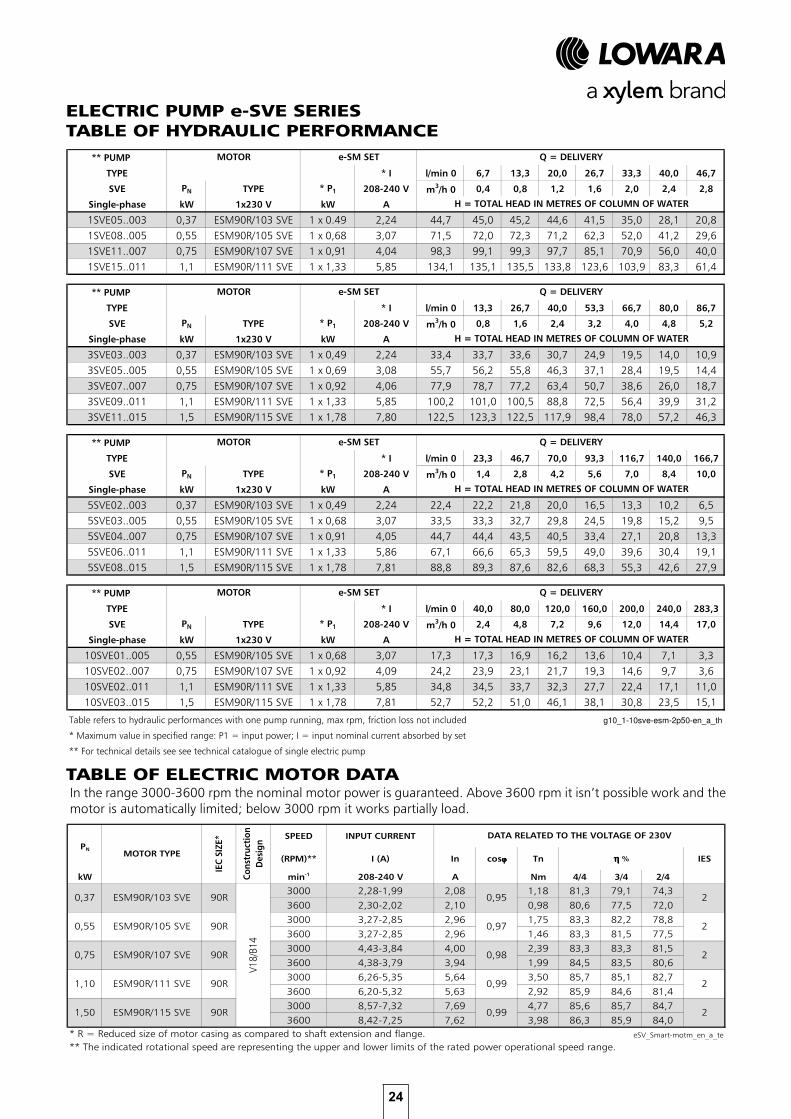
ELECTRIC PUMP e-SVE SERIESTABLE OF HYDRAULIC PERFORMANCE
g10_1-10sve-esm-2p50-en_a_th
ϕϕϕϕ
ηηηη
TABLE OF ELECTRIC MOTOR DATAIn the range 3000-3600 rpm the nominal motor power is guaranteed. Above 3600 rpm it isn’t possible work and themotor is automatically limited; below 3000 rpm it works partially load.
25
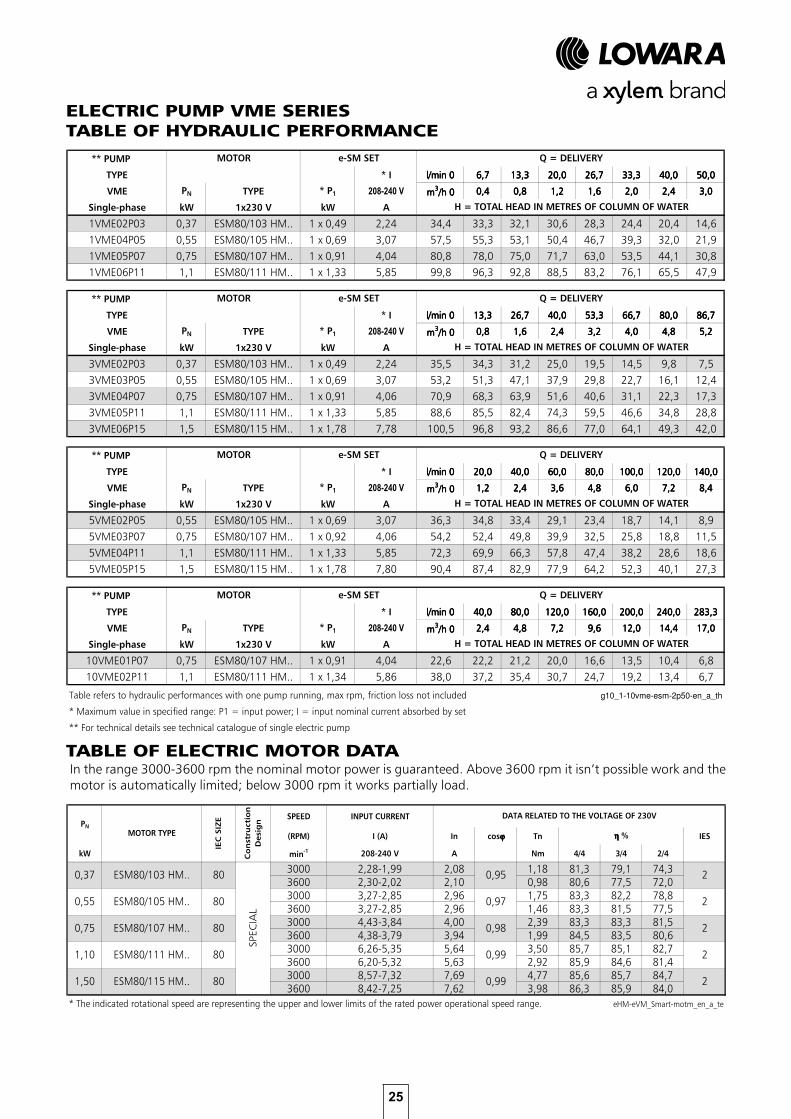
ELECTRIC PUMP VME SERIESTABLE OF HYDRAULIC PERFORMANCE
g10_1-10vme-esm-2p50-en_a_th
TABLE OF ELECTRIC MOTOR DATAIn the range 3000-3600 rpm the nominal motor power is guaranteed. Above 3600 rpm it isn’t possible work and themotor is automatically limited; below 3000 rpm it works partially load.
ϕϕϕϕ
ηηηη
26
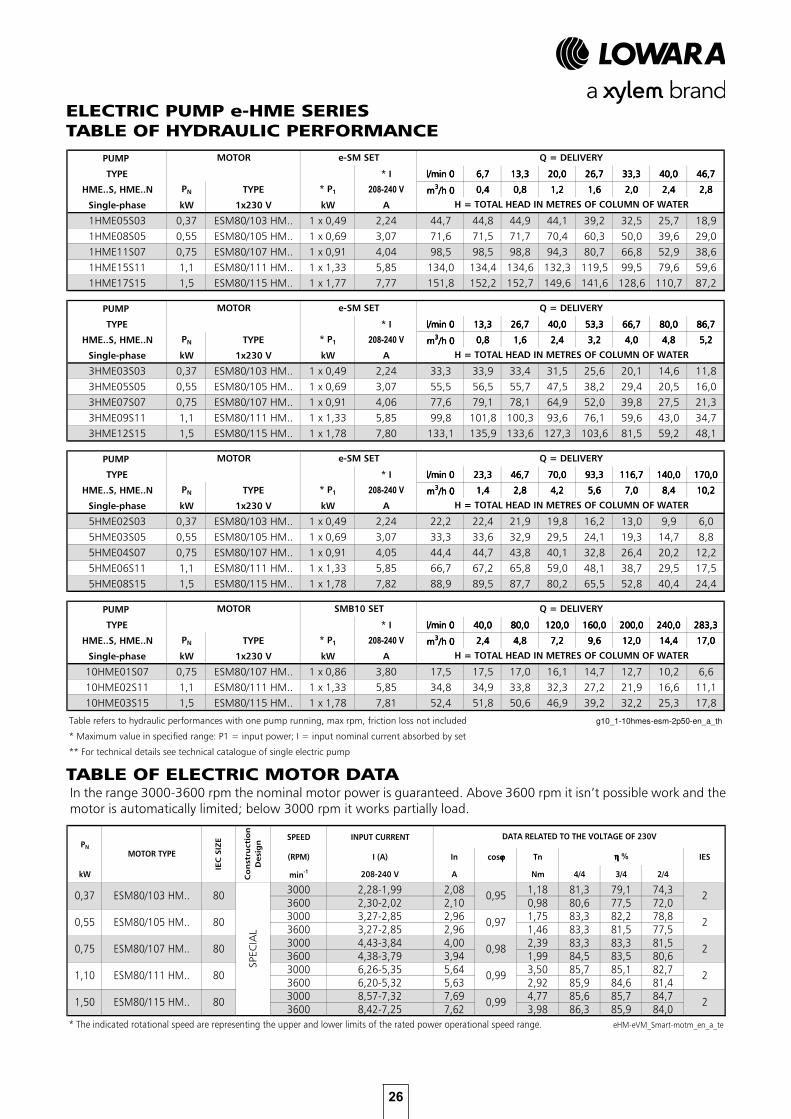
ELECTRIC PUMP e-HME SERIESTABLE OF HYDRAULIC PERFORMANCE
g10_1-10hmes-esm-2p50-en_a_th
TABLE OF ELECTRIC MOTOR DATAIn the range 3000-3600 rpm the nominal motor power is guaranteed. Above 3600 rpm it isn’t possible work and themotor is automatically limited; below 3000 rpm it works partially load.
ϕϕϕϕ
ηηηη
27
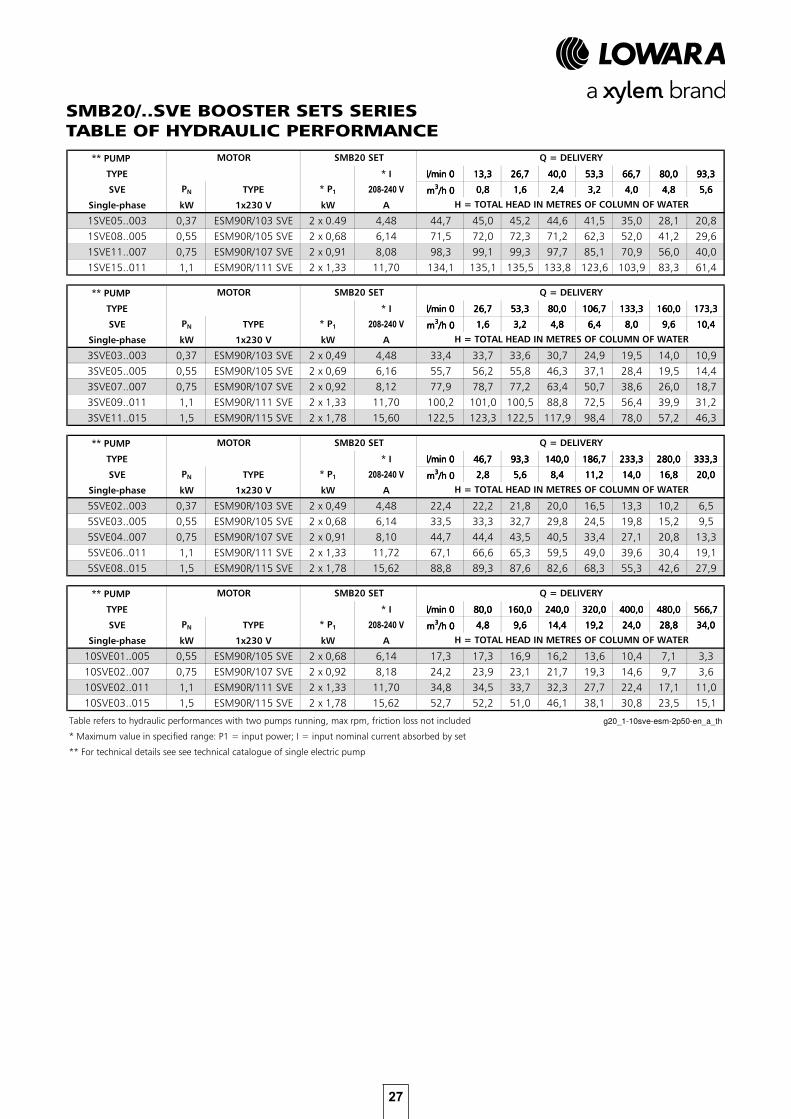
SMB20/..SVE BOOSTER SETS SERIESTABLE OF HYDRAULIC PERFORMANCE
g20_1-10sve-esm-2p50-en_a_th
28
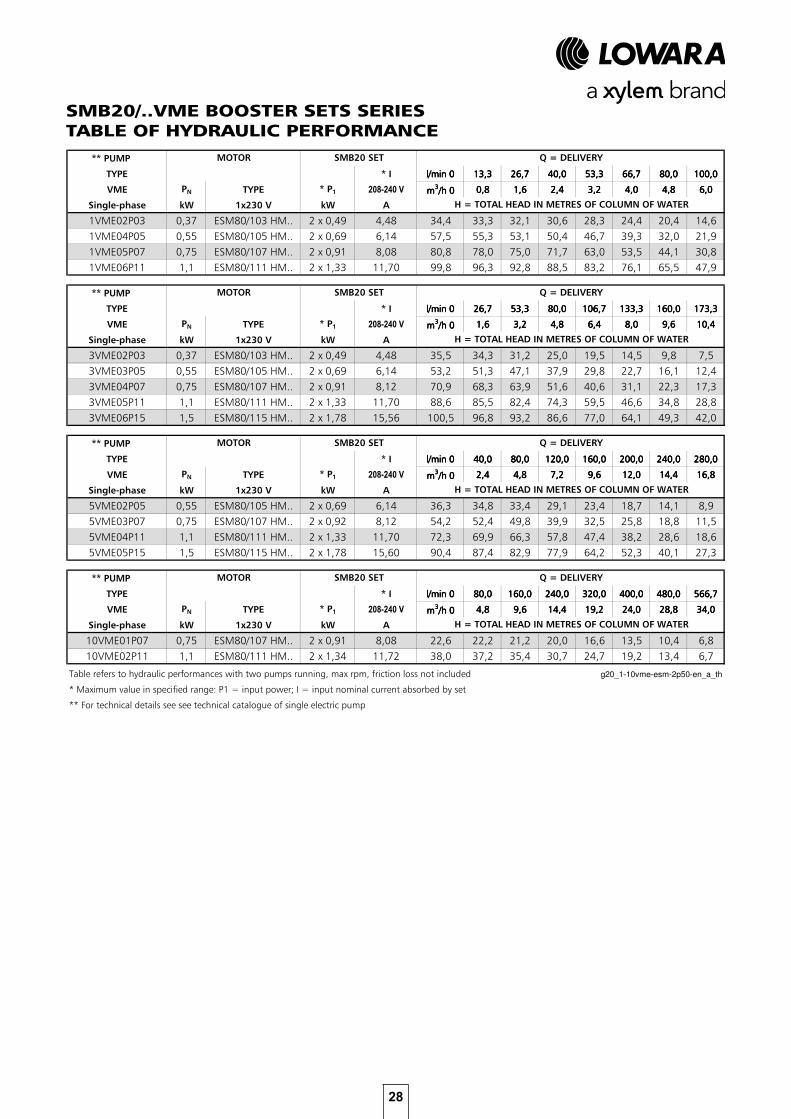
SMB20/..VME BOOSTER SETS SERIESTABLE OF HYDRAULIC PERFORMANCE
g20_1-10vme-esm-2p50-en_a_th
29
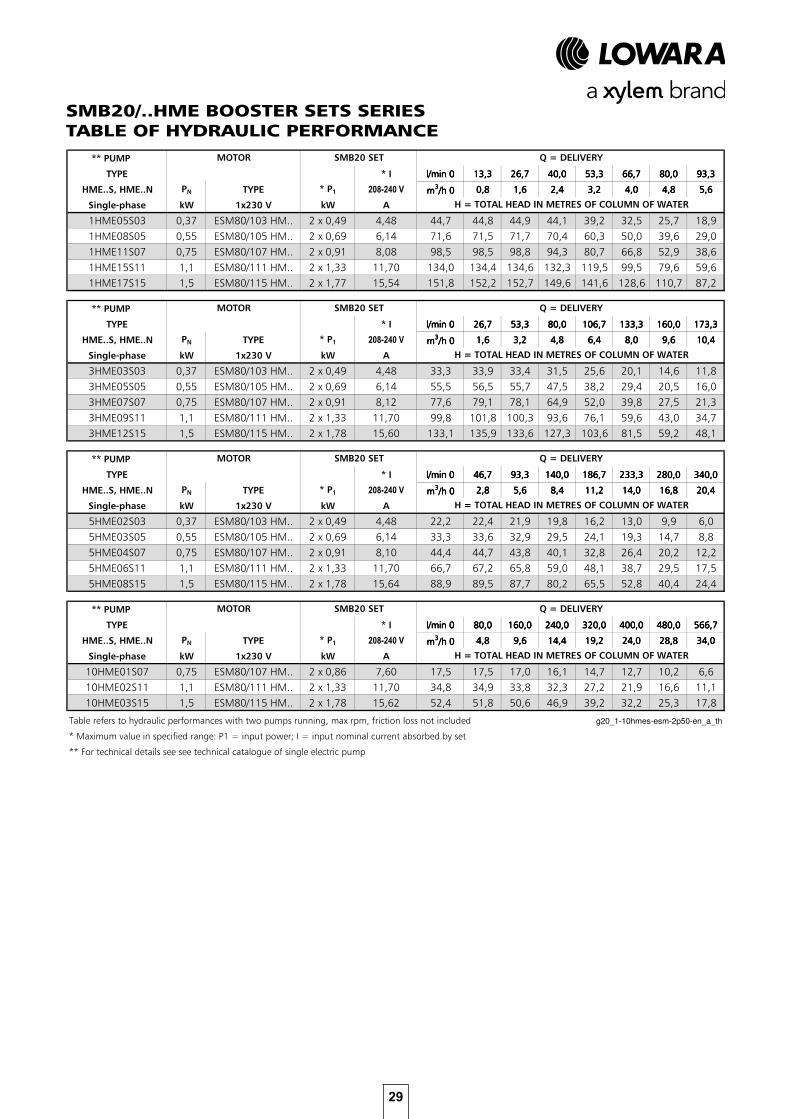
SMB20/..HME BOOSTER SETS SERIESTABLE OF HYDRAULIC PERFORMANCE
g20_1-10hmes-esm-2p50-en_a_th

30
SMB30/..SVE BOOSTER SETS SERIESTABLE OF HYDRAULIC PERFORMANCE
g30_1-10sve-esm-2p50-en_a_th
31
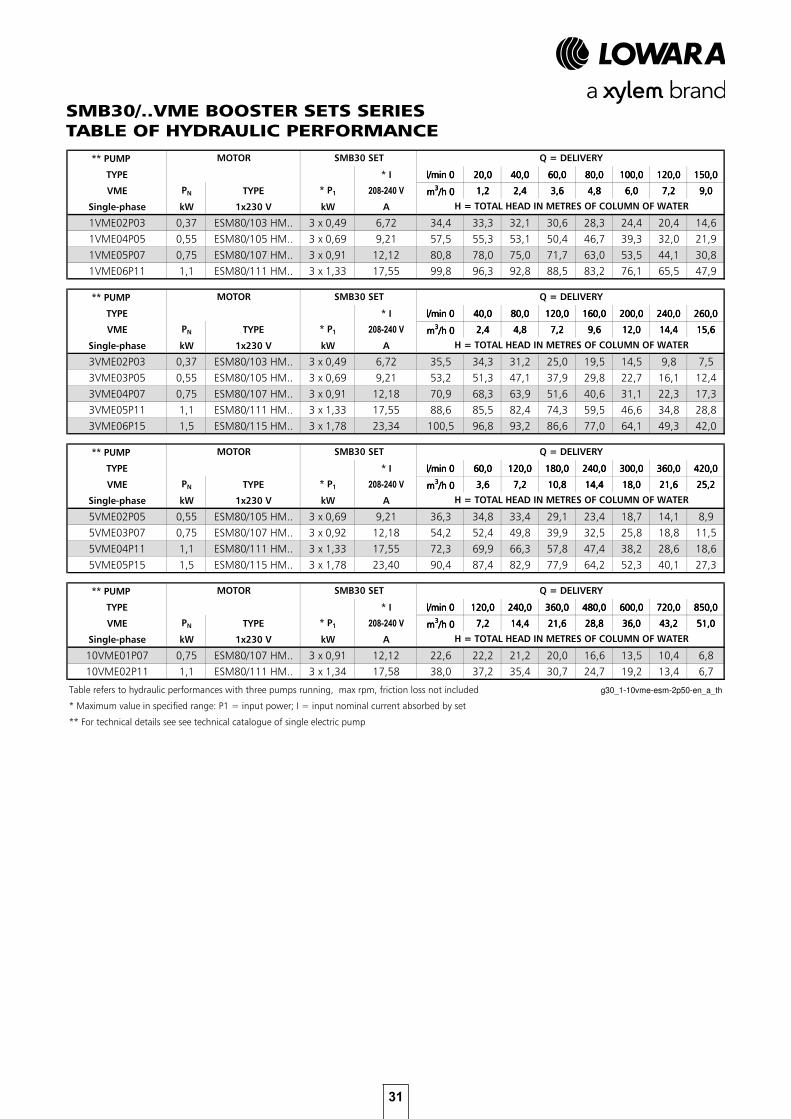
SMB30/..VME BOOSTER SETS SERIESTABLE OF HYDRAULIC PERFORMANCE
g30_1-10vme-esm-2p50-en_a_th
32
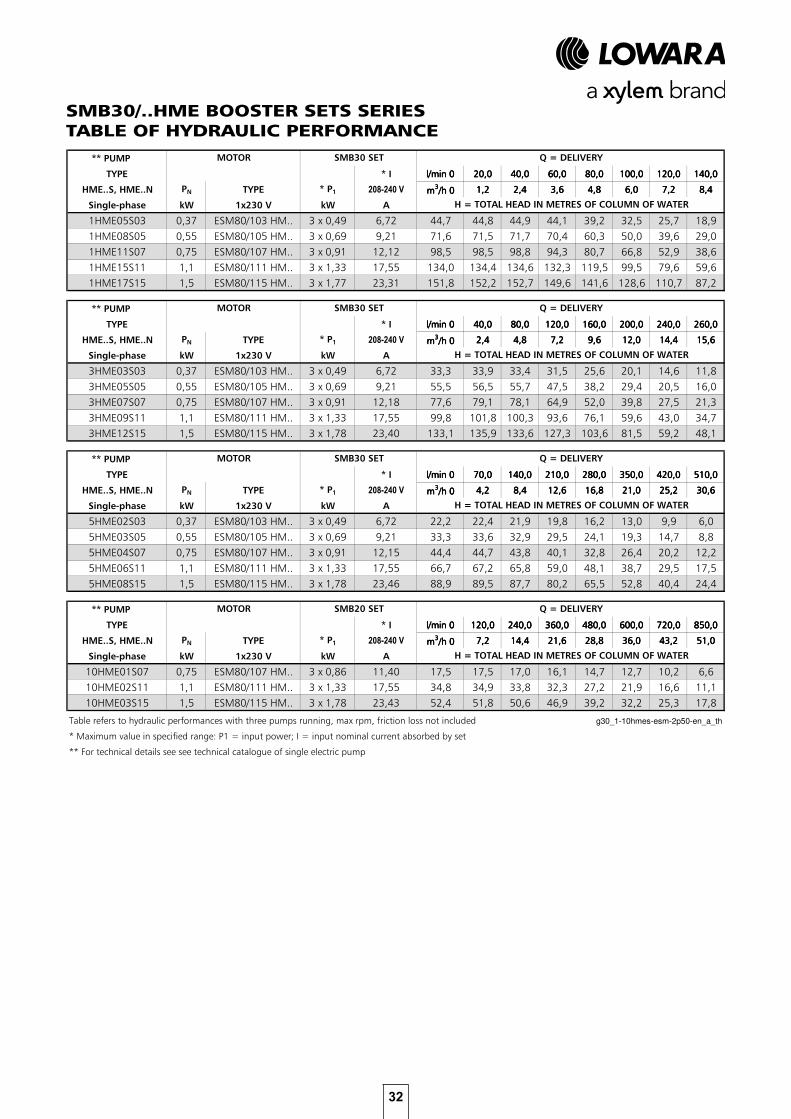
SMB30/..HME BOOSTER SETS SERIESTABLE OF HYDRAULIC PERFORMANCE
g30_1-10hmes-esm-2p50-en_a_th
33
Boostersets
SMB20Series
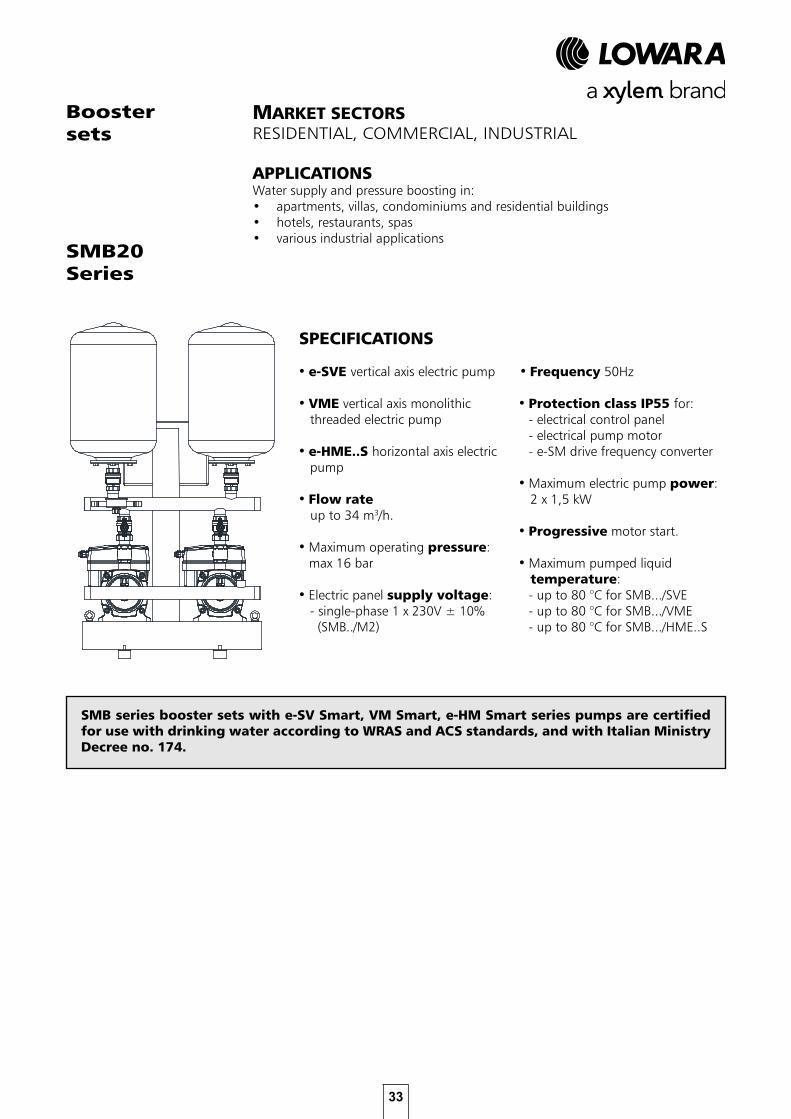
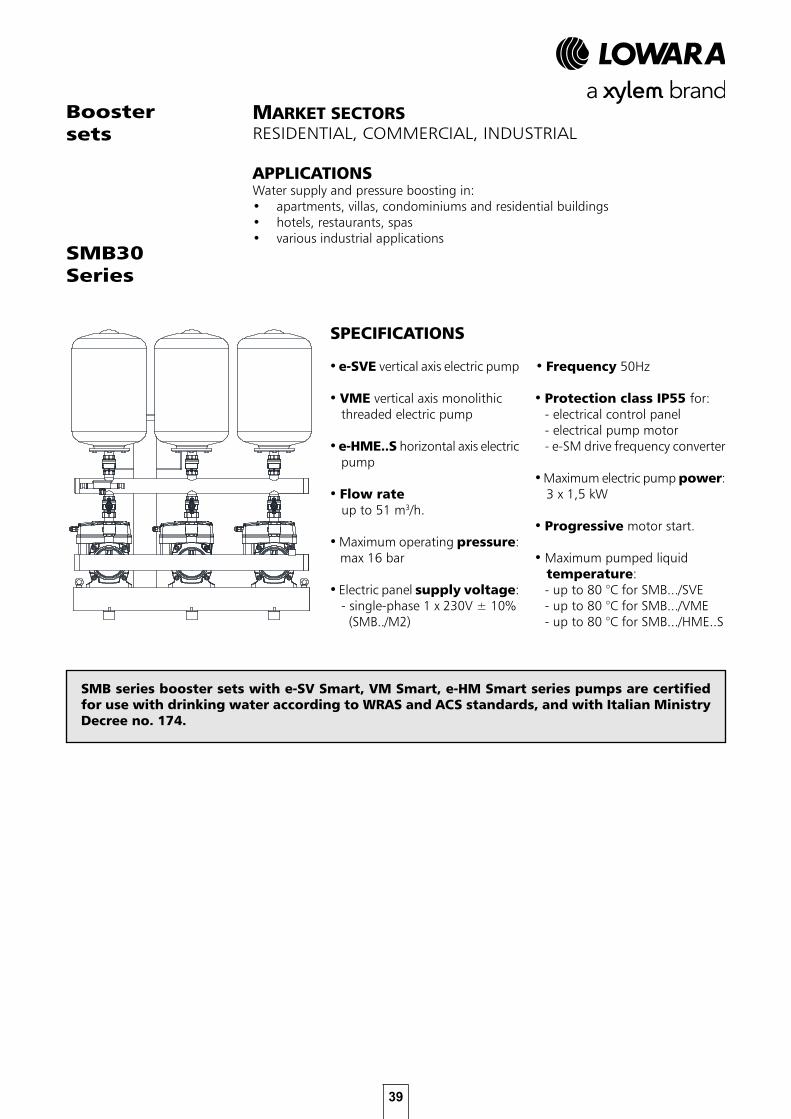
MARKET SECTORSRESIDENTIAL, COMMERCIAL, INDUSTRIAL
APPLICATIONSWater supply and pressure boosting in:• apartments, villas, condominiums and residential buildings• hotels, restaurants, spas• various industrial applications
SPECIFICATIONS
• e-SVE vertical axis electric pump
• VME vertical axis monolithic threaded electric pump
• e-HME..S horizontal axis electricpump
• Flow rate up to 34 m3/h.
• Maximum operating pressure: max 16 bar
• Electric panel supply voltage:- single-phase 1 x 230V ± 10%
(SMB../M2)
• Frequency 50Hz
• Protection class IP55 for:- electrical control panel- electrical pump motor- e-SM drive frequency converter
• Maximum electric pump power: 2 x 1,5 kW
• Progressive motor start.
• Maximum pumped liquid temperature:- up to 80 °C for SMB.../SVE- up to 80 °C for SMB.../VME- up to 80 °C for SMB.../HME..S
SMB series booster sets with e-SV Smart, VM Smart, e-HM Smart series pumps are certified for use with drinking water according to WRAS and ACS standards, and with Italian Ministry Decree no. 174.
34
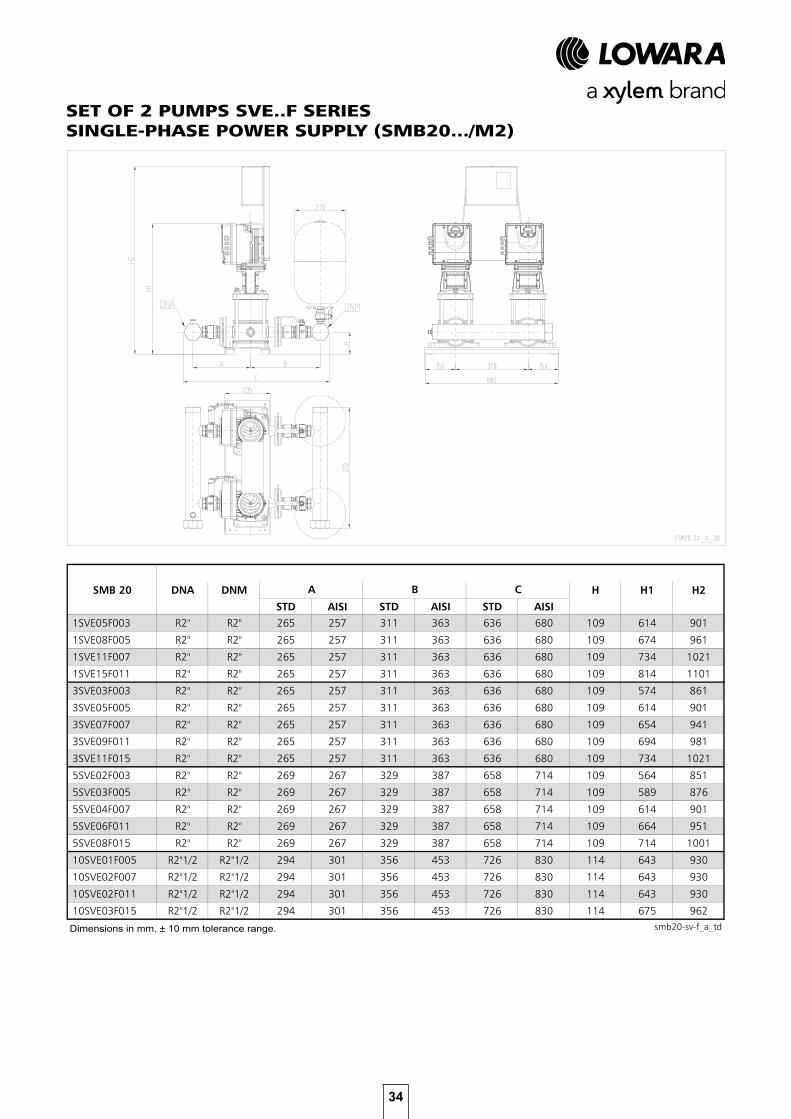
SET OF 2 PUMPS SVE..F SERIESSINGLE-PHASE POWER SUPPLY (SMB20.../M2)
Dimensions in mm. ± 10 mm tolerance range.
35
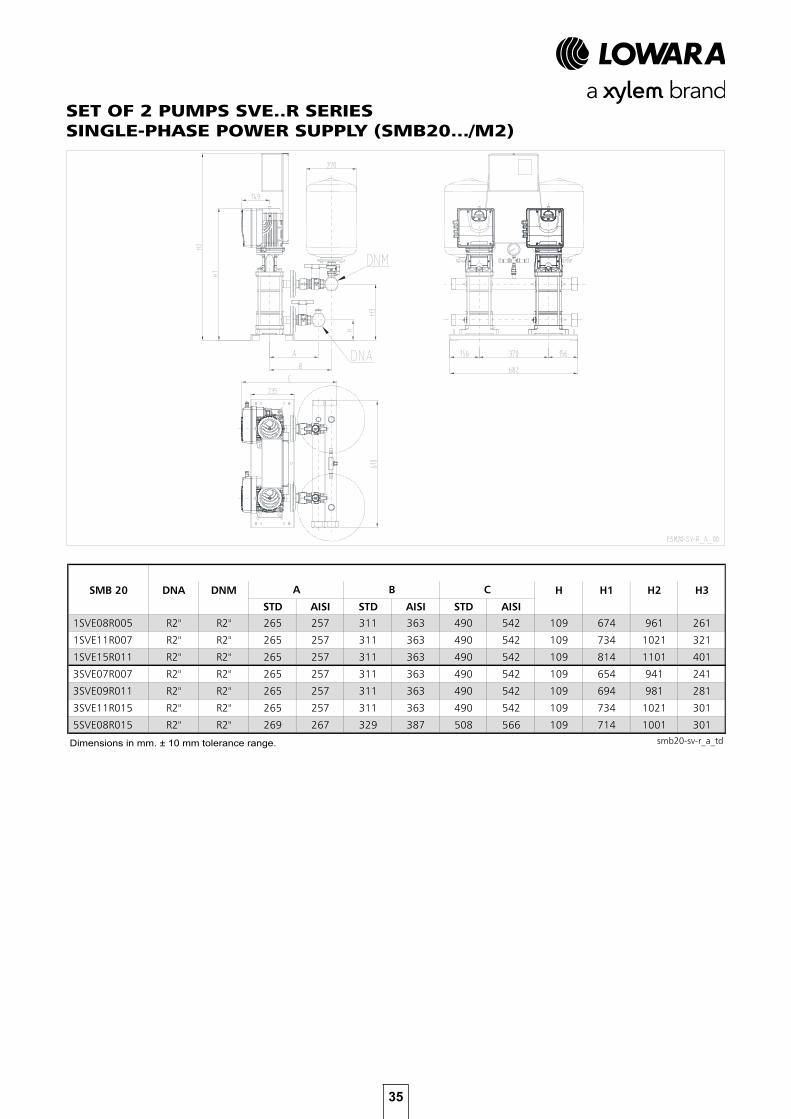
Dimensions in mm. ± 10 mm tolerance range.
SET OF 2 PUMPS SVE..R SERIESSINGLE-PHASE POWER SUPPLY (SMB20.../M2)
36
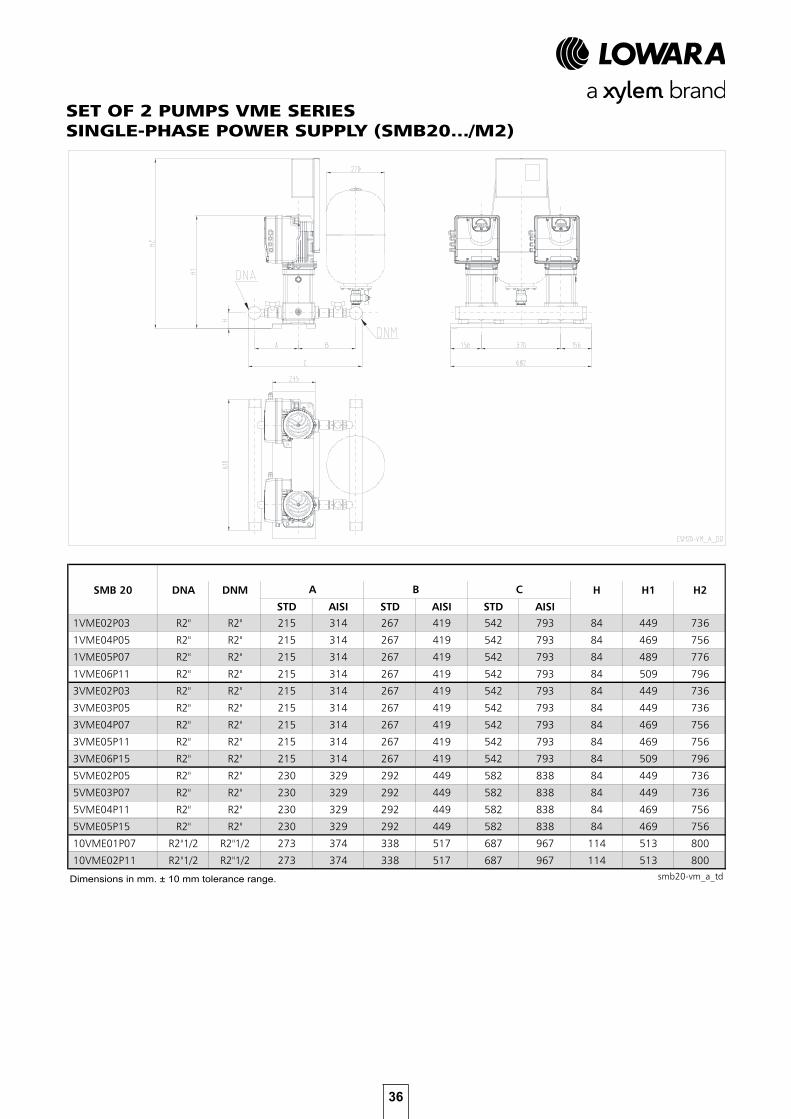
Dimensions in mm. ± 10 mm tolerance range.
SET OF 2 PUMPS VME SERIESSINGLE-PHASE POWER SUPPLY (SMB20.../M2)
37
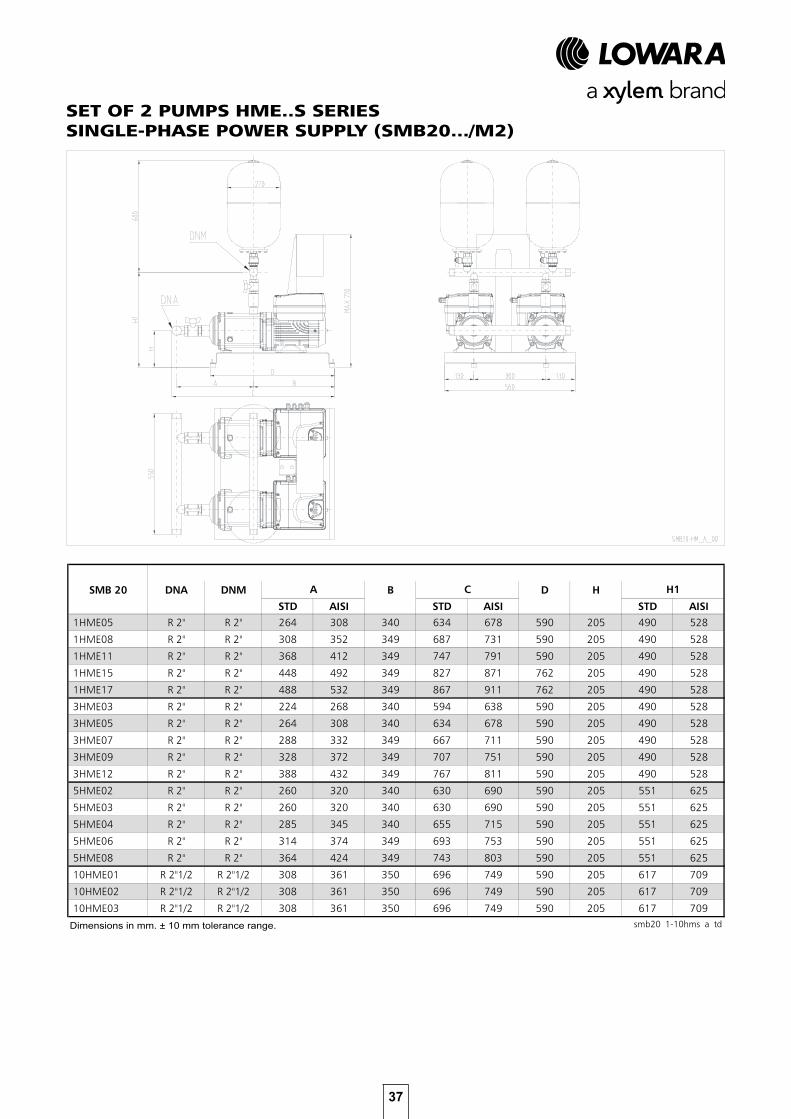
SET OF 2 PUMPS HME..S SERIESSINGLE-PHASE POWER SUPPLY (SMB20.../M2)
Dimensions in mm. ± 10 mm tolerance range.

38
39
Boostersets
SMB30Series
MARKET SECTORSRESIDENTIAL, COMMERCIAL, INDUSTRIAL
APPLICATIONSWater supply and pressure boosting in:• apartments, villas, condominiums and residential buildings• hotels, restaurants, spas• various industrial applications
SPECIFICATIONS
• e-SVE vertical axis electric pump
• VME vertical axis monolithic threaded electric pump
• e-HME..S horizontal axis electricpump
• Flow rate up to 51 m3/h.
• Maximum operating pressure: max 16 bar
• Electric panel supply voltage:- single-phase 1 x 230V ± 10%
(SMB../M2)
• Frequency 50Hz
• Protection class IP55 for:- electrical control panel- electrical pump motor- e-SM drive frequency converter
• Maximum electric pump power: 3 x 1,5 kW
• Progressive motor start.
• Maximum pumped liquid temperature:- up to 80 °C for SMB.../SVE- up to 80 °C for SMB.../VME- up to 80 °C for SMB.../HME..S
SMB series booster sets with e-SV Smart, VM Smart, e-HM Smart series pumps are certified for use with drinking water according to WRAS and ACS standards, and with Italian Ministry Decree no. 174.
40
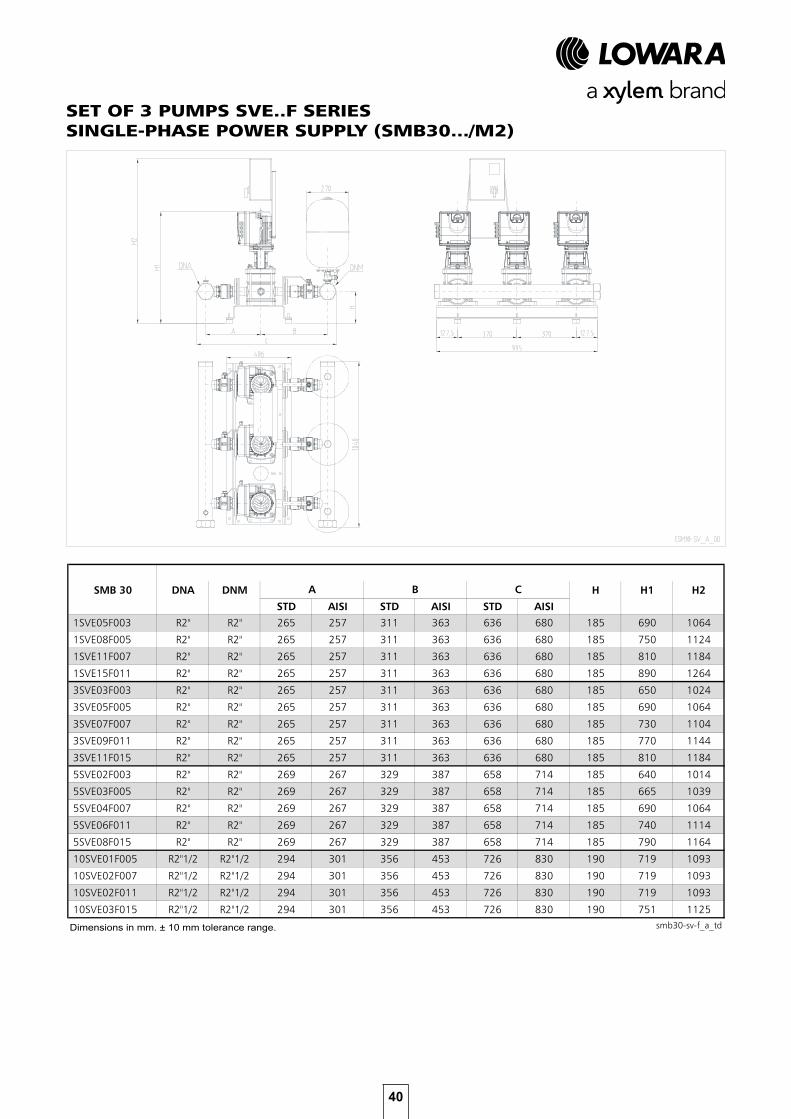
SET OF 3 PUMPS SVE..F SERIESSINGLE-PHASE POWER SUPPLY (SMB30.../M2)
Dimensions in mm. ± 10 mm tolerance range.
41
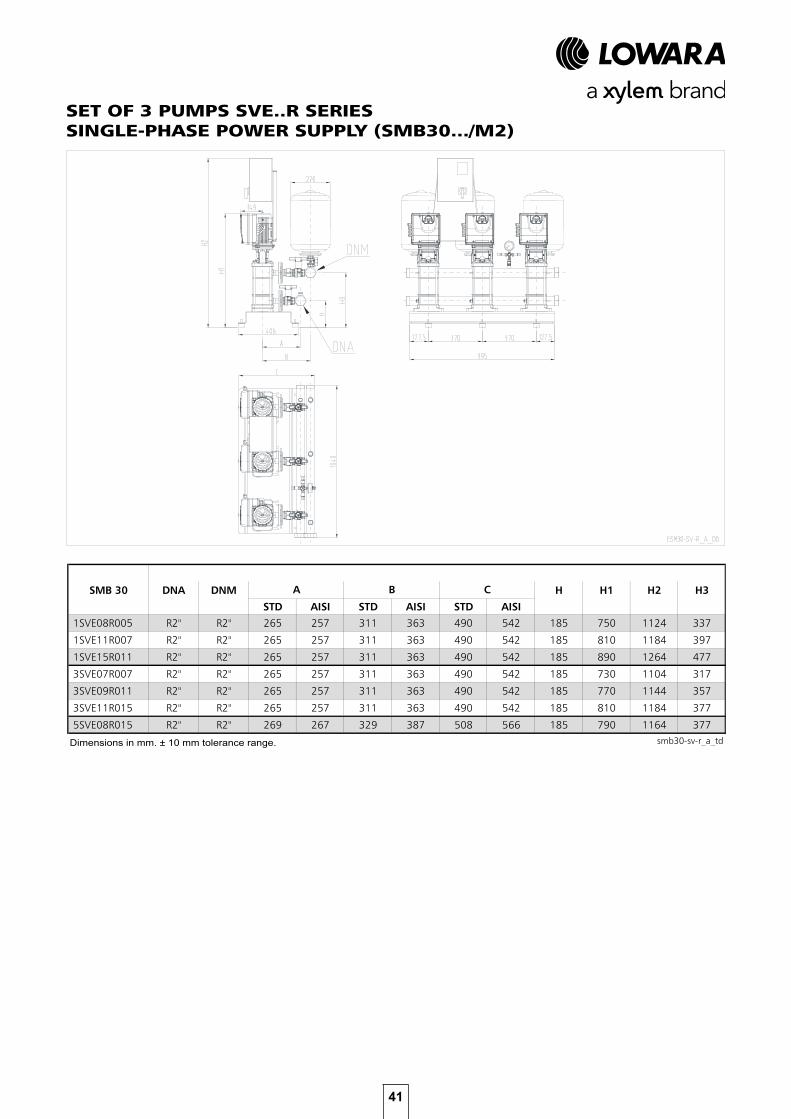
Dimensions in mm. ± 10 mm tolerance range.
SET OF 3 PUMPS SVE..R SERIESSINGLE-PHASE POWER SUPPLY (SMB30.../M2)
42
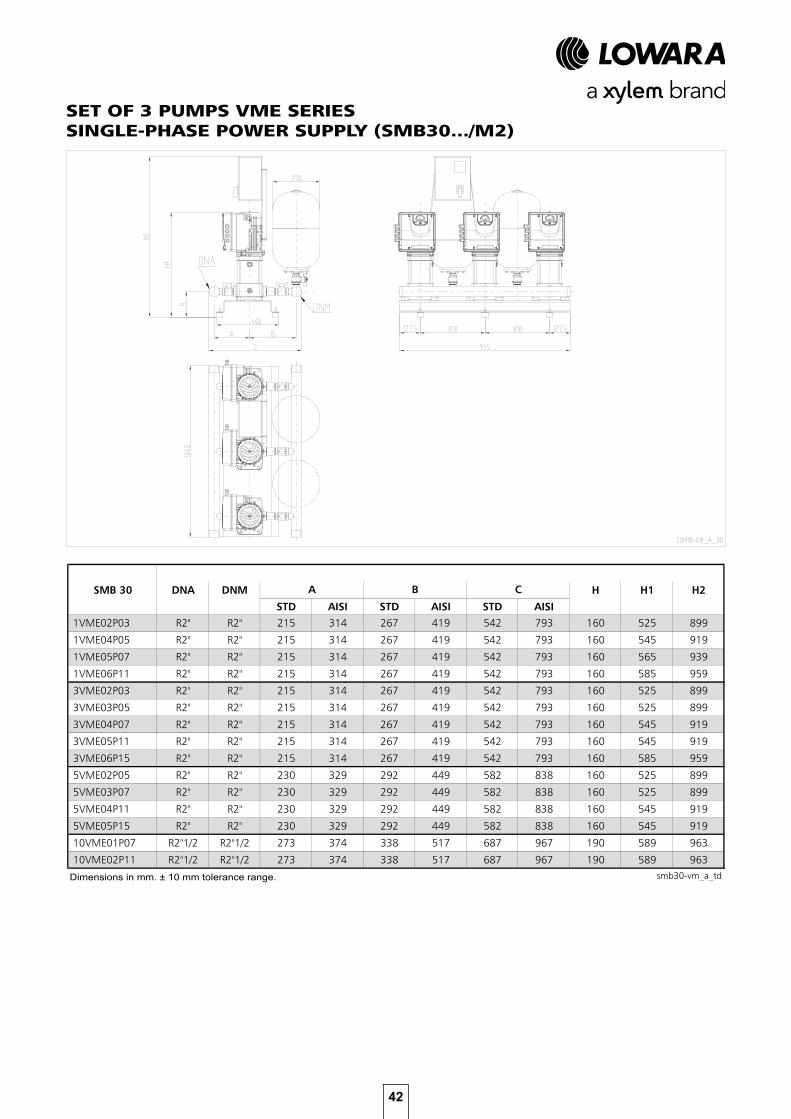
Dimensions in mm. ± 10 mm tolerance range.
SET OF 3 PUMPS VME SERIESSINGLE-PHASE POWER SUPPLY (SMB30.../M2)
43
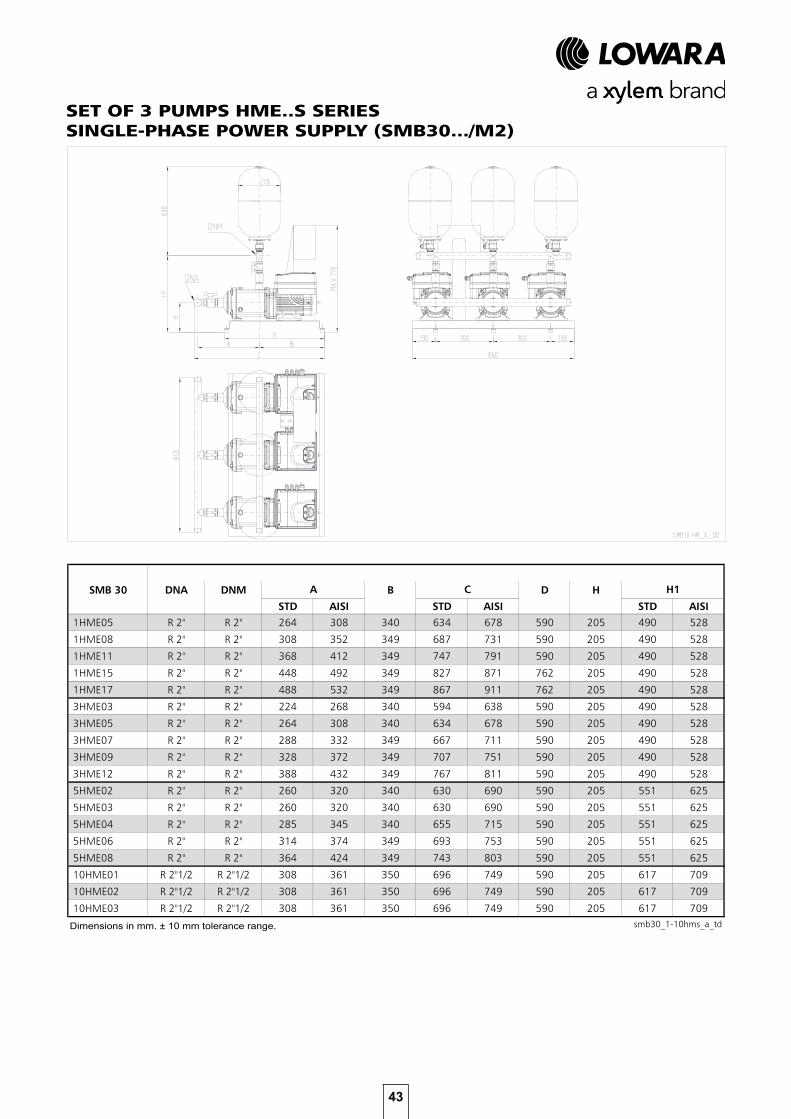
Dimensions in mm. ± 10 mm tolerance range.
SET OF 3 PUMPS HME..S SERIESSINGLE-PHASE POWER SUPPLY (SMB30.../M2)

44
45
PERFORMANCECURVES

46
SMB.../SVE BOOSTER SETS SERIESOPERATING CHARACTERISTICS
The performance curves do not take into account flow resistance in the valves and piping. The curves show the performance with one, two and three pumps running.These performances are valid for liquids with density ρ = 1 Kg/dm3 and kinematic viscosity ν = 1 mm2/sec.The declared NPSH values are laboratory values; for practical use we recommend increasing these values by 0,5 m.
1SVE05..003
0 2 4 6 8 10
0.0 0.1 0.2 0.3 0.4 0.5 0.6 0.7 0.8
Q [Imp gpm]
Q [l/s]
0 2 4 6 8 10 12
0
20
40
60
80
100
120
140
160
0
5
10
15
20
25
30
35
40
45
50Q [US gpm]
H [ft
]
H[m
]
max
80%
60%
40%
max
80%
60%
40%
max
80%
60%
40%
max
80%
60%
40%
max curve 1P
0
10
20
30
40
0
5
10
15
0.0 0.5 1.0 1.5 2.0 2.5 3.0
NPS
H[ft
]
NPS
H[m
]
Q [m3/h]
A028
6_A_
CH
20%
min
SMB30…/1SVE05..003
0 5 10 15 20 25 30
0.0 0.5 1.0 1.5 2.0 2.5
Q [Imp gpm]
Q [l/s]
0 5 10 15 20 25 30 35
0
20
40
60
80
100
120
140
160
0
5
10
15
20
25
30
35
40
45
50Q [US gpm]
H [ft
]
H[m
]
max
80%
60%
40%
max
80%
60%
40%
max
80%
60%
40%
max
80%
60%
40%
max curve 3P
0
10
20
30
40
0
5
10
15
0 1 2 3 4 5 6 7 8 9
NPS
H[ft
]
NPS
H[m
]
Q [m3/h]
A028
8_A_
CH
20%
min
SMB20…/1SVE05..003
0 5 10 15 20
0.0 0.2 0.4 0.6 0.8 1.0 1.2 1.4 1.6
Q [Imp gpm]
Q [l/s]
0 5 10 15 20 25
0
20
40
60
80
100
120
140
160
0
5
10
15
20
25
30
35
40
45
50Q [US gpm]
H [ft
]
H[m
]
max
80%
60%
40%
max
80%
60%
40%
max
80%
60%
40%
max
80%
60%
40%
max curve 2P
0
10
20
30
40
0
5
10
15
0 1 2 3 4 5 6
NPS
H[ft
]
NPS
H[m
]
Q [m3/h]
A028
7_A_
CH
20%
min

47
SMB.../SVE BOOSTER SETS SERIESOPERATING CHARACTERISTICS
1SVE08..005
0 2 4 6 8 10
0.0 0.1 0.2 0.3 0.4 0.5 0.6 0.7 0.8
Q [Imp gpm]
Q [l/s]
0 2 4 6 8 10 12
0
50
100
150
200
250
0
10
20
30
40
50
60
70
80Q [US gpm]
H [ft
]
H[m
]
max
80%
60%
40%
max
80%
60%
40%
max
80%
60%
40%
max
80%
60%
40%
max curve 1P
0
10
20
30
40
0
5
10
15
0.0 0.5 1.0 1.5 2.0 2.5 3.0
NPS
H[ft
]
NPS
H[m
]
Q [m3/h]
A028
9_A_
CH
20%
min
SMB30…/1SVE08..005
0 5 10 15 20 25 30
0.0 0.5 1.0 1.5 2.0 2.5
Q [Imp gpm]
Q [l/s]
0 5 10 15 20 25 30 35
0
50
100
150
200
250
0
10
20
30
40
50
60
70
80Q [US gpm]
H [ft
]
H[m
]
max
80%
60%
40%
max
80%
60%
40%
max
80%
60%
40%
max
80%
60%
40%
max curve 3P
0
10
20
30
40
0
5
10
15
0 1 2 3 4 5 6 7 8 9
NPS
H[ft
]
NPS
H[m
]
Q [m3/h]
A029
1_A_
CH
20%
min
SMB20…/1SVE08..005
0 5 10 15 20
0.0 0.2 0.4 0.6 0.8 1.0 1.2 1.4 1.6
Q [Imp gpm]
Q [l/s]
0 5 10 15 20 25
0
50
100
150
200
250
0
10
20
30
40
50
60
70
80Q [US gpm]
H [ft
]
H[m
]
max
80%
60%
40%
max
80%
60%
40%
max
80%
60%
40%
max
80%
60%
40%
max curve 2P
0
10
20
30
40
0
5
10
15
0 1 2 3 4 5 6
NPS
H[ft
]
NPS
H[m
]
Q [m3/h]
A029
0_A_
CH
20%
min
The performance curves do not take into account flow resistance in the valves and piping. The curves show the performance with one, two and three pumps running.These performances are valid for liquids with density ρ = 1 Kg/dm3 and kinematic viscosity ν = 1 mm2/sec.The declared NPSH values are laboratory values; for practical use we recommend increasing these values by 0,5 m.

48
SMB.../SVE BOOSTER SETS SERIESOPERATING CHARACTERISTICS
1SVE11..007
0 2 4 6 8 10
0.0 0.1 0.2 0.3 0.4 0.5 0.6 0.7 0.8
Q [Imp gpm]
Q [l/s]
0 2 4 6 8 10 12
0
50
100
150
200
250
300
0
10
20
30
40
50
60
70
80
90
100Q [US gpm]
H [ft
]H[m
]
max
80%
max
80%
max
80%
max
80%
60%
40%
max curve 1P
0
10
20
30
40
0
5
10
15
0.0 0.5 1.0 1.5 2.0 2.5 3.0
NPS
H[ft
]
NPS
H[m
]
Q [m3/h]
A029
2_A_
CH
20%
min
SMB30…/1SVE11..007
0 5 10 15 20 25 30
0.0 0.5 1.0 1.5 2.0 2.5
Q [Imp gpm]
Q [l/s]
0 5 10 15 20 25 30 35
0
50
100
150
200
250
300
0
10
20
30
40
50
60
70
80
90
100Q [US gpm]
H [ft
]
H[m
]
80%80%80%
max
80%
60%
40%
max curve 3P
0
10
20
30
40
0
5
10
15
0 1 2 3 4 5 6 7 8 9
NPS
H[ft
]
NPS
H[m
]
Q [m3/h]
A029
4_A_
CH
20%
min
SMB20…/1SVE11..007
0 5 10 15 20
0.0 0.2 0.4 0.6 0.8 1.0 1.2 1.4 1.6
Q [Imp gpm]
Q [l/s]
0 5 10 15 20 25
0
50
100
150
200
250
300
0
10
20
30
40
50
60
70
80
90
100Q [US gpm]
H [ft
]
H[m
]
80%80%80%
max
80%
60%
40%
max curve 2P
0
10
20
30
40
0
5
10
15
0 1 2 3 4 5 6
NPS
H[ft
]
NPS
H[m
]
Q [m3/h]
A029
3_A_
CH
20%
min
The performance curves do not take into account flow resistance in the valves and piping. The curves show the performance with one, two and three pumps running.These performances are valid for liquids with density ρ = 1 Kg/dm3 and kinematic viscosity ν = 1 mm2/sec.The declared NPSH values are laboratory values; for practical use we recommend increasing these values by 0,5 m.
49
SMB.../SVE BOOSTER SETS SERIESOPERATING CHARACTERISTICS
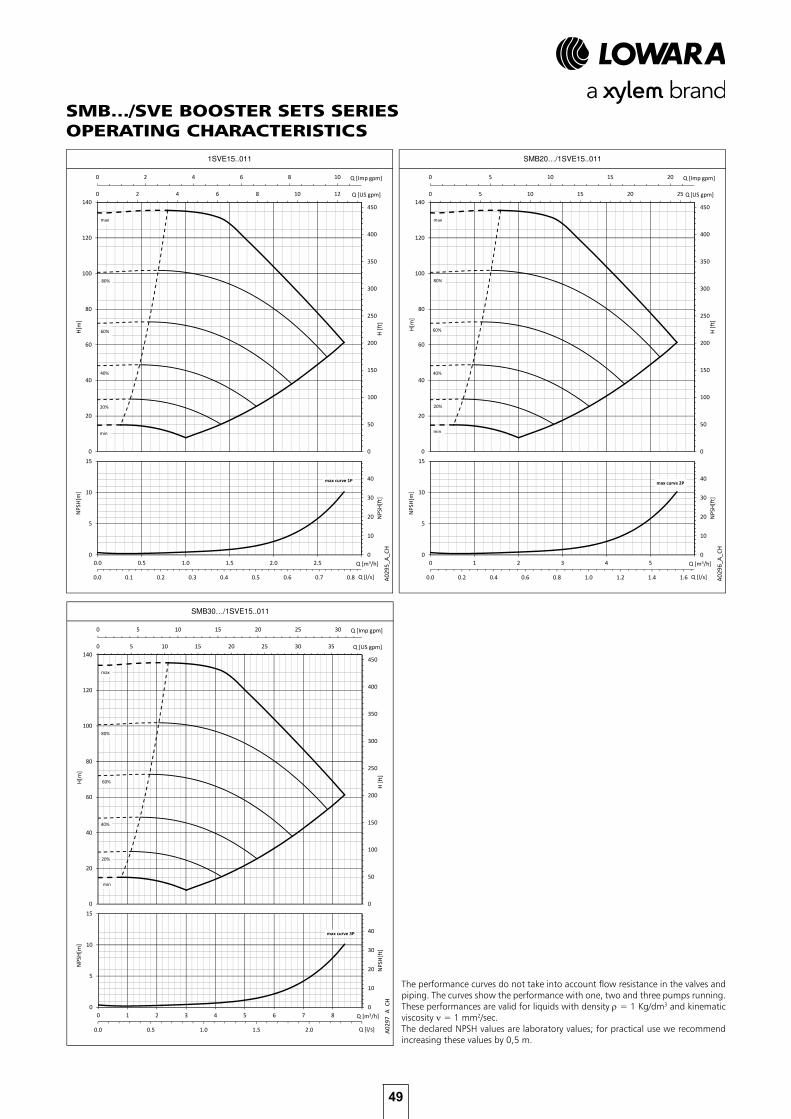
1SVE15..011
0 2 4 6 8 10
0.0 0.1 0.2 0.3 0.4 0.5 0.6 0.7 0.8
Q [Imp gpm]
Q [l/s]
0 2 4 6 8 10 12
0
50
100
150
200
250
300
350
400
450
0
20
40
60
80
100
120
140Q [US gpm]
H [ft
]
H[m
]
maxmaxmaxmax
80%
60%
40%
max curve 1P
0
10
20
30
40
0
5
10
15
0.0 0.5 1.0 1.5 2.0 2.5 3.0
NPS
H[ft
]
NPS
H[m
]
Q [m3/h]
A029
5_A_
CH
20%
min
SMB30…/1SVE15..011
0 5 10 15 20 25 30
0.0 0.5 1.0 1.5 2.0 2.5
Q [Imp gpm]
Q [l/s]
0 5 10 15 20 25 30 35
0
50
100
150
200
250
300
350
400
450
0
20
40
60
80
100
120
140Q [US gpm]
H [ft
]
H[m
]
maxmaxmaxmax
80%
60%
40%
max curve 3P
0
10
20
30
40
0
5
10
15
0 1 2 3 4 5 6 7 8 9
NPS
H[ft
]
NPS
H[m
]
Q [m3/h]
A029
7_A_
CH
20%
min
SMB20…/1SVE15..011
0 5 10 15 20
0.0 0.2 0.4 0.6 0.8 1.0 1.2 1.4 1.6
Q [Imp gpm]
Q [l/s]
0 5 10 15 20 25
0
50
100
150
200
250
300
350
400
450
0
20
40
60
80
100
120
140Q [US gpm]
H [ft
]
H[m
]
maxmaxmaxmax
80%
60%
40%
max curve 2P
0
10
20
30
40
0
5
10
15
0 1 2 3 4 5 6
NPS
H[ft
]
NPS
H[m
]
Q [m3/h]
A029
6_A_
CH
20%
min
The performance curves do not take into account flow resistance in the valves and piping. The curves show the performance with one, two and three pumps running.These performances are valid for liquids with density ρ = 1 Kg/dm3 and kinematic viscosity ν = 1 mm2/sec.The declared NPSH values are laboratory values; for practical use we recommend increasing these values by 0,5 m.
50
3SVE03..003
0 5 10 15 20
0.0 0.2 0.4 0.6 0.8 1.0 1.2 1.4 1.6
Q [Imp gpm]
Q [l/s]
0 5 10 15 20 25
0
20
40
60
80
100
0
5
10
15
20
25
30
35Q [US gpm]
H [ft
]
H[m
]
maxmaxmaxmax
80%
60%
40%
max curve 1P
0
5
10
15
20
25
30
35
0
2
4
6
8
10
12
0 1 2 3 4 5 6
NPS
H[ft
]
NPS
H[m
]
Q [m3/h]
A049
1_A_
CH
20%
min
SMB30…/3SVE03..003
0 10 20 30 40 50
0.0 0.5 1.0 1.5 2.0 2.5 3.0 3.5 4.0
Q [Imp gpm]
Q [l/s]
0 10 20 30 40 50 60 70
0
20
40
60
80
100
0
5
10
15
20
25
30
35Q [US gpm]
H [ft
]
H[m
]
maxmaxmaxmax
80%
60%
40%
max curve 3P
0
5
10
15
20
25
30
35
0
2
4
6
8
10
12
0 2 4 6 8 10 12 14 16
NPS
H[ft
]
NPS
H[m
]
Q [m3/h]
A049
3_A_
CH
20%
min
SMB20…/3SVE03..003
0 5 10 15 20 25 30 35 40
0.0 0.5 1.0 1.5 2.0 2.5 3.0
Q [Imp gpm]
Q [l/s]
0 10 20 30 40 50
0
20
40
60
80
100
0
5
10
15
20
25
30
35Q [US gpm]
H [ft
]
H[m
]
maxmaxmaxmax
80%
60%
40%
max curve 2P
0
5
10
15
20
25
30
35
0
2
4
6
8
10
12
0 2 4 6 8 10 12
NPS
H[ft
]
NPS
H[m
]
Q [m3/h]
A049
2_A_
CH
20%
min
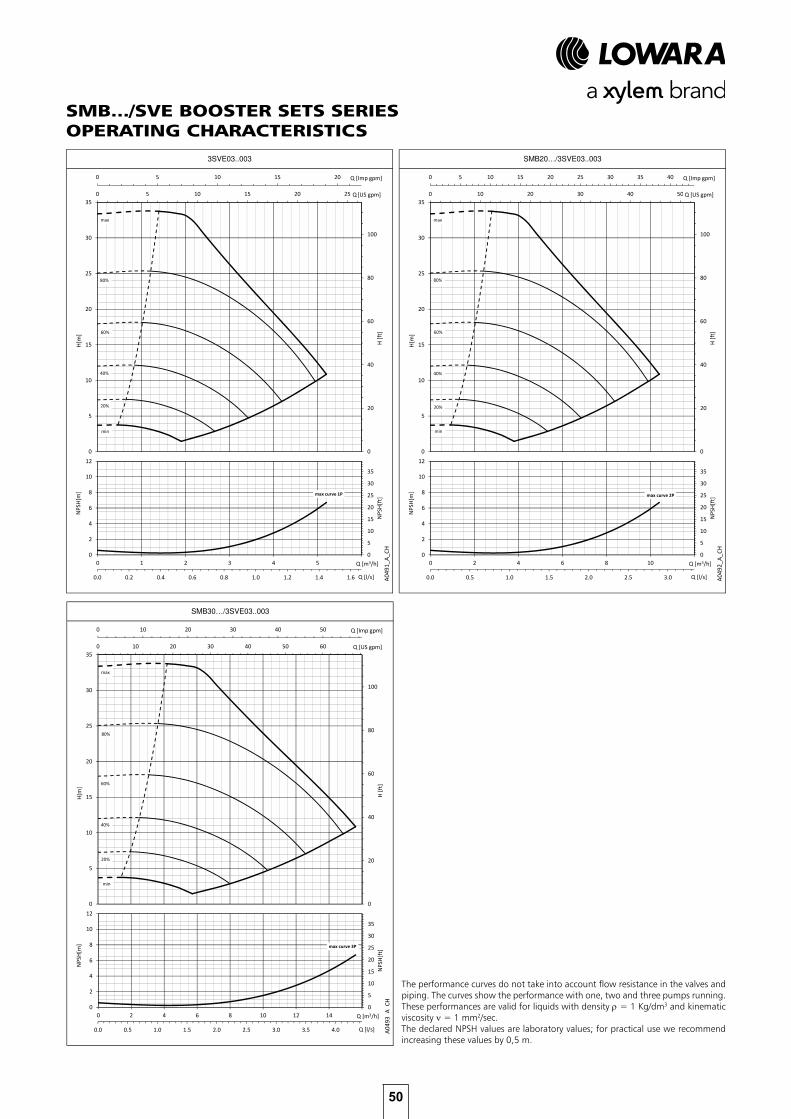
SMB.../SVE BOOSTER SETS SERIESOPERATING CHARACTERISTICS
The performance curves do not take into account flow resistance in the valves and piping. The curves show the performance with one, two and three pumps running.These performances are valid for liquids with density ρ = 1 Kg/dm3 and kinematic viscosity ν = 1 mm2/sec.The declared NPSH values are laboratory values; for practical use we recommend increasing these values by 0,5 m.

51
3SVE05..005
0 5 10 15 20
0.0 0.2 0.4 0.6 0.8 1.0 1.2 1.4 1.6
Q [Imp gpm]
Q [l/s]
0 5 10 15 20 25
0
20
40
60
80
100
120
140
160
180
0
10
20
30
40
50
60Q [US gpm]
H [ft
]
H[m
]
max
80%
60%
40%
max curve 1P
0
5
10
15
20
25
30
0
2
4
6
8
10
0 1 2 3 4 5 6
NPS
H[ft
]
NPS
H[m
]
Q [m3/h]
A049
4_A_
CH
20%
min
SMB30…/3SVE05..005
0 10 20 30 40 50
0.0 0.5 1.0 1.5 2.0 2.5 3.0 3.5 4.0
Q [Imp gpm]
Q [l/s]
0 10 20 30 40 50 60 70
0
20
40
60
80
100
120
140
160
180
0
10
20
30
40
50
60Q [US gpm]
H [ft
]
H[m
]
max
80%
60%
40%
max curve 3P
0
5
10
15
20
25
30
0
2
4
6
8
10
0 2 4 6 8 10 12 14 16
NPS
H[ft
]
NPS
H[m
]
Q [m3/h]
A049
6_A_
CH
20%
min
SMB20…/3SVE05..005
0 5 10 15 20 25 30 35 40
0.0 0.5 1.0 1.5 2.0 2.5 3.0
Q [Imp gpm]
Q [l/s]
0 10 20 30 40 50
0
20
40
60
80
100
120
140
160
180
0
10
20
30
40
50
60Q [US gpm]
H [ft
]
H[m
]
max
80%
60%
40%
max curve 2P
0
5
10
15
20
25
30
0
2
4
6
8
10
0 2 4 6 8 10 12
NPS
H[ft
]
NPS
H[m
]
Q [m3/h]
A049
5_A_
CH
20%
min
SMB.../SVE BOOSTER SETS SERIESOPERATING CHARACTERISTICS
The performance curves do not take into account flow resistance in the valves and piping. The curves show the performance with one, two and three pumps running.These performances are valid for liquids with density ρ = 1 Kg/dm3 and kinematic viscosity ν = 1 mm2/sec.The declared NPSH values are laboratory values; for practical use we recommend increasing these values by 0,5 m.
52
3SVE07..007
0 5 10 15 20
0.0 0.2 0.4 0.6 0.8 1.0 1.2 1.4 1.6
Q [Imp gpm]
Q [l/s]
0 5 10 15 20 25
0
50
100
150
200
250
0
10
20
30
40
50
60
70
80Q [US gpm]
H [ft
]
H[m
]
max
80%
max
80%
max
80%
max
80%
60%
40%
max curve 1P
0
5
10
15
20
25
30
0
2
4
6
8
10
0 1 2 3 4 5 6
NPS
H[ft
]
NPS
H[m
]
Q [m3/h]
A049
7_A_
CH
20%
min
SMB30…/3SVE07..007
0 10 20 30 40 50
0.0 0.5 1.0 1.5 2.0 2.5 3.0 3.5 4.0
Q [Imp gpm]
Q [l/s]
0 10 20 30 40 50 60 70
0
50
100
150
200
250
0
10
20
30
40
50
60
70
80Q [US gpm]
H [ft
]
H[m
]
max
80%
max
80%
max
80%
max
80%
60%
40%
max curve 3P
0
5
10
15
20
25
30
0
2
4
6
8
10
0 2 4 6 8 10 12 14 16
NPS
H[ft
]
NPS
H[m
]
Q [m3/h]
A049
9_A_
CH
20%
min
SMB20…/3SVE07..007
0 5 10 15 20 25 30 35 40
0.0 0.5 1.0 1.5 2.0 2.5 3.0
Q [Imp gpm]
Q [l/s]
0 10 20 30 40 50
0
50
100
150
200
250
0
10
20
30
40
50
60
70
80Q [US gpm]
H [ft
]
H[m
]
max
80%
max
80%
max
80%
max
80%
60%
40%
max curve 2P
0
5
10
15
20
25
30
0
2
4
6
8
10
0 2 4 6 8 10 12
NPS
H[ft
]
NPS
H[m
]
Q [m3/h]
A049
8_A_
CH
20%
min
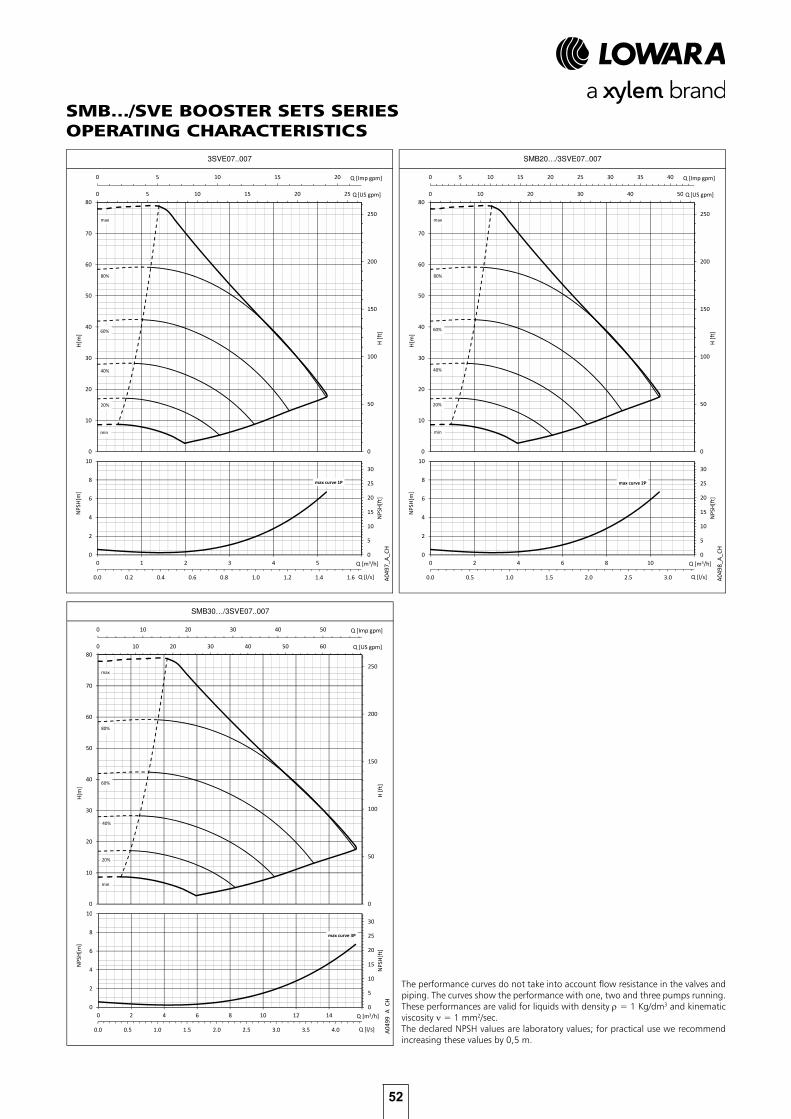
SMB.../SVE BOOSTER SETS SERIESOPERATING CHARACTERISTICS
The performance curves do not take into account flow resistance in the valves and piping. The curves show the performance with one, two and three pumps running.These performances are valid for liquids with density ρ = 1 Kg/dm3 and kinematic viscosity ν = 1 mm2/sec.The declared NPSH values are laboratory values; for practical use we recommend increasing these values by 0,5 m.
53
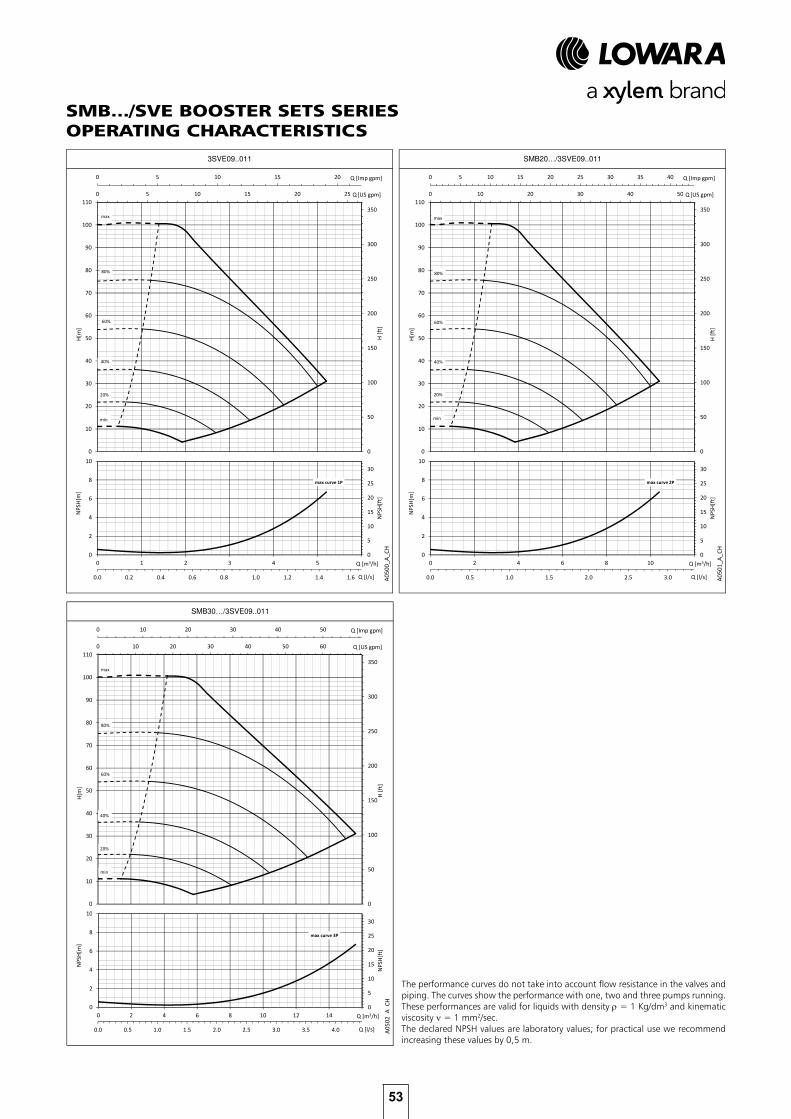
3SVE09..011
0 5 10 15 20
0.0 0.2 0.4 0.6 0.8 1.0 1.2 1.4 1.6
Q [Imp gpm]
Q [l/s]
0 5 10 15 20 25
0
50
100
150
200
250
300
350
0
10
20
30
40
50
60
70
80
90
100
110Q [US gpm]
H [ft
]
H[m
]
40%40%40%
max
80%
60%
40%
max curve 1P
0
5
10
15
20
25
30
0
2
4
6
8
10
0 1 2 3 4 5 6
NPS
H[ft
]
NPS
H[m
]
Q [m3/h]
A050
0_A_
CH20%
min
SMB30…/3SVE09..011
0 10 20 30 40 50
0.0 0.5 1.0 1.5 2.0 2.5 3.0 3.5 4.0
Q [Imp gpm]
Q [l/s]
0 10 20 30 40 50 60 70
0
50
100
150
200
250
300
350
0
10
20
30
40
50
60
70
80
90
100
110Q [US gpm]
H [ft
]
H[m
]
40%40%40%
max
80%
60%
40%
max curve 3P
0
5
10
15
20
25
30
0
2
4
6
8
10
0 2 4 6 8 10 12 14 16
NPS
H[ft
]
NPS
H[m
]
Q [m3/h]
A050
2_A_
CH
20%
min
SMB20…/3SVE09..011
0 5 10 15 20 25 30 35 40
0.0 0.5 1.0 1.5 2.0 2.5 3.0
Q [Imp gpm]
Q [l/s]
0 10 20 30 40 50
0
50
100
150
200
250
300
350
0
10
20
30
40
50
60
70
80
90
100
110Q [US gpm]
H [ft
]
H[m
]
max
80%
60%
40%
max curve 2P
0
5
10
15
20
25
30
0
2
4
6
8
10
0 2 4 6 8 10 12
NPS
H[ft
]
NPS
H[m
]
Q [m3/h]
A050
1_A_
CH
20%
min
SMB.../SVE BOOSTER SETS SERIESOPERATING CHARACTERISTICS
The performance curves do not take into account flow resistance in the valves and piping. The curves show the performance with one, two and three pumps running.These performances are valid for liquids with density ρ = 1 Kg/dm3 and kinematic viscosity ν = 1 mm2/sec.The declared NPSH values are laboratory values; for practical use we recommend increasing these values by 0,5 m.

54
3SVE11..015
0 5 10 15 20
0.0 0.2 0.4 0.6 0.8 1.0 1.2 1.4 1.6
Q [Imp gpm]
Q [l/s]
0 5 10 15 20 25
0
50
100
150
200
250
300
350
400
450
0
20
40
60
80
100
120
140Q [US gpm]
H [ft
]
H[m
]
max
80%
60%
40%
max
80%
60%
40%
max
80%
60%
40%
max
80%
60%
40%
max curve 1P
0
5
10
15
20
25
30
0
2
4
6
8
10
0 1 2 3 4 5 6
NPS
H[ft
]
NPS
H[m
]
Q [m3/h]
A050
3_A_
CH
20%
min
SMB30…/3SVE11..015
0 10 20 30 40 50
0.0 0.5 1.0 1.5 2.0 2.5 3.0 3.5 4.0
Q [Imp gpm]
Q [l/s]
0 10 20 30 40 50 60 70
0
50
100
150
200
250
300
350
400
450
0
20
40
60
80
100
120
140Q [US gpm]
H [ft
]
H[m
]
max
80%
60%
40%
max
80%
60%
40%
max
80%
60%
40%
max
80%
60%
40%
max curve 3P
0
5
10
15
20
25
30
0
2
4
6
8
10
0 2 4 6 8 10 12 14 16
NPS
H[ft
]
NPS
H[m
]
Q [m3/h]
A050
5_A_
CH
20%
min
SMB20…/3SVE11..015
0 5 10 15 20 25 30 35 40
0.0 0.5 1.0 1.5 2.0 2.5 3.0
Q [Imp gpm]
Q [l/s]
0 10 20 30 40 50
0
50
100
150
200
250
300
350
400
450
0
20
40
60
80
100
120
140Q [US gpm]
H [ft
]
H[m
]
max
80%
60%
40%
max
80%
60%
40%
max
80%
60%
40%
max
80%
60%
40%
max curve 2P
0
5
10
15
20
25
30
0
2
4
6
8
10
0 2 4 6 8 10 12
NPS
H[ft
]
NPS
H[m
]
Q [m3/h]
A050
4_A_
CH
20%
min
SMB.../SVE BOOSTER SETS SERIESOPERATING CHARACTERISTICS
The performance curves do not take into account flow resistance in the valves and piping. The curves show the performance with one, two and three pumps running.These performances are valid for liquids with density ρ = 1 Kg/dm3 and kinematic viscosity ν = 1 mm2/sec.The declared NPSH values are laboratory values; for practical use we recommend increasing these values by 0,5 m.

55
5SVE02..003
0 5 10 15 20 25 30 35 40
0.0 0.5 1.0 1.5 2.0 2.5 3.0
Q [Imp gpm]
Q [l/s]
0 10 20 30 40 50
0
10
20
30
40
50
60
70
0
2
4
6
8
10
12
14
16
18
20
22
24Q [US gpm]
H [ft
]
H[m
]
max
80%
60%
40%
max curve 1P
0
5
10
15
20
25
0
2
4
6
8
0 2 4 6 8 10 12
NPS
H[ft
]
NPS
H[m
]
Q [m3/h]
A050
6_A_
CH20%
min
SMB30…/5SVE02..003
0 20 40 60 80 100 120
0 1 2 3 4 5 6 7 8 9
Q [Imp gpm]
Q [l/s]
0 20 40 60 80 100 120 140
0
10
20
30
40
50
60
70
0
2
4
6
8
10
12
14
16
18
20
22
24Q [US gpm]
H [ft
]
H[m
]
max
80%
60%
40%
max curve 3P
0
5
10
15
20
25
0
2
4
6
8
0 5 10 15 20 25 30 35
NPS
H[ft
]
NPS
H[m
]
Q [m3/h]
A050
8_A_
CH
20%
min
SMB20…/5SVE02..003
0 10 20 30 40 50 60 70 80 90
0 1 2 3 4 5 6
Q [Imp gpm]
Q [l/s]
0 20 40 60 80 100
0
10
20
30
40
50
60
70
0
2
4
6
8
10
12
14
16
18
20
22
24Q [US gpm]
H [ft
]
H[m
]
max
80%
60%
40%
max curve 2P
0
5
10
15
20
25
0
2
4
6
8
0 5 10 15 20 25
NPS
H[ft
]
NPS
H[m
]
Q [m3/h]
A050
7_A_
CH
20%
min
SMB.../SVE BOOSTER SETS SERIESOPERATING CHARACTERISTICS
The performance curves do not take into account flow resistance in the valves and piping. The curves show the performance with one, two and three pumps running.These performances are valid for liquids with density ρ = 1 Kg/dm3 and kinematic viscosity ν = 1 mm2/sec.The declared NPSH values are laboratory values; for practical use we recommend increasing these values by 0,5 m.
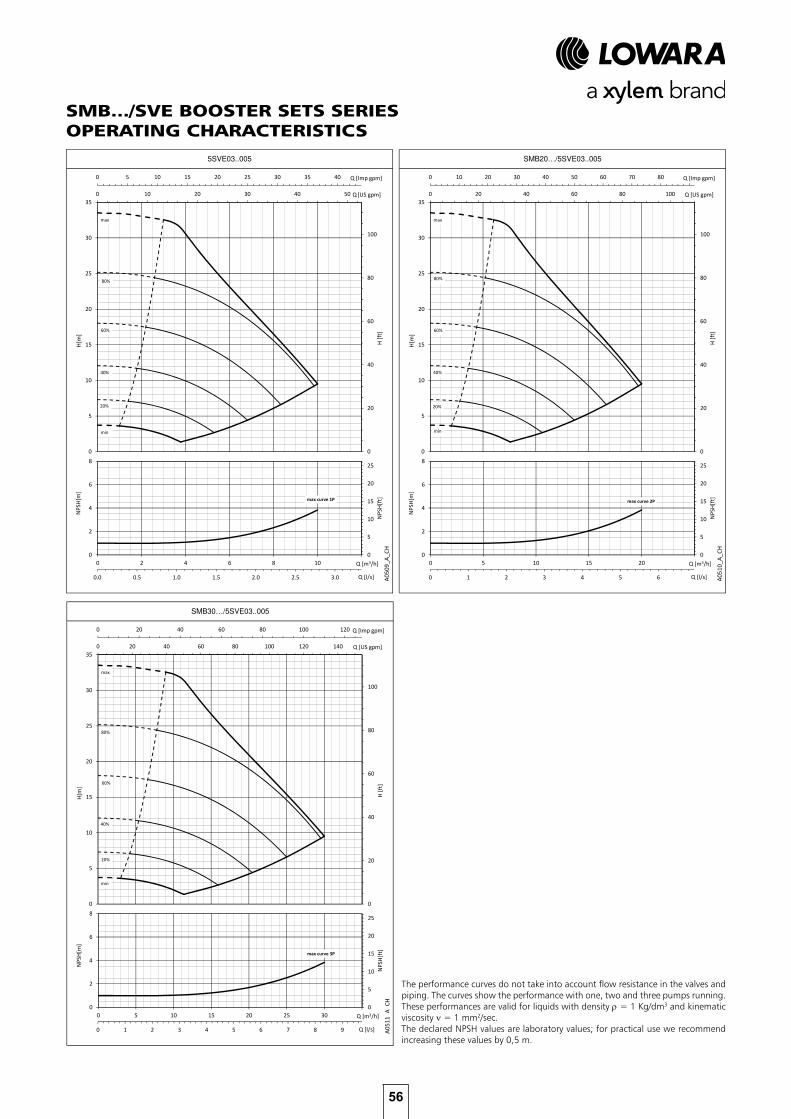
56
5SVE03..005
0 5 10 15 20 25 30 35 40
0.0 0.5 1.0 1.5 2.0 2.5 3.0
Q [Imp gpm]
Q [l/s]
0 10 20 30 40 50
0
20
40
60
80
100
0
5
10
15
20
25
30
35Q [US gpm]
H [ft
]
H[m
]
maxmaxmaxmax
80%
60%
40%
max curve 1P
0
5
10
15
20
25
0
2
4
6
8
0 2 4 6 8 10 12
NPS
H[ft
]
NPS
H[m
]
Q [m3/h]
A050
9_A_
CH
20%
min
SMB30…/5SVE03..005
0 20 40 60 80 100 120
0 1 2 3 4 5 6 7 8 9
Q [Imp gpm]
Q [l/s]
0 20 40 60 80 100 120 140
0
20
40
60
80
100
0
5
10
15
20
25
30
35Q [US gpm]
H [ft
]
H[m
]
maxmaxmaxmax
80%
60%
40%
max curve 3P
0
5
10
15
20
25
0
2
4
6
8
0 5 10 15 20 25 30 35
NPS
H[ft
]
NPS
H[m
]
Q [m3/h]
A051
1_A_
CH
20%
min
SMB20…/5SVE03..005
0 10 20 30 40 50 60 70 80 90
0 1 2 3 4 5 6
Q [Imp gpm]
Q [l/s]
0 20 40 60 80 100
0
20
40
60
80
100
0
5
10
15
20
25
30
35Q [US gpm]
H [ft
]
H[m
]
maxmaxmaxmax
80%
60%
40%
max curve 2P
0
5
10
15
20
25
0
2
4
6
8
0 5 10 15 20 25
NPS
H[ft
]
NPS
H[m
]
Q [m3/h]
A051
0_A_
CH
20%
min
SMB.../SVE BOOSTER SETS SERIESOPERATING CHARACTERISTICS
The performance curves do not take into account flow resistance in the valves and piping. The curves show the performance with one, two and three pumps running.These performances are valid for liquids with density ρ = 1 Kg/dm3 and kinematic viscosity ν = 1 mm2/sec.The declared NPSH values are laboratory values; for practical use we recommend increasing these values by 0,5 m.

57
5SVE04..007
0 5 10 15 20 25 30 35 40
0.0 0.5 1.0 1.5 2.0 2.5 3.0
Q [Imp gpm]
Q [l/s]
0 10 20 30 40 50
0
20
40
60
80
100
120
140
0
5
10
15
20
25
30
35
40
45Q [US gpm]
H [ft
]
H[m
]
max
80%
60%
max
80%
60%
max
80%
60%
max
80%
60%
40%
max curve 1P
0
5
10
15
20
25
0
2
4
6
8
0 2 4 6 8 10 12
NPS
H[ft
]
NPS
H[m
]
Q [m3/h]
A051
2_A_
CH
20%
min
SMB30…/5SVE04..007
0 20 40 60 80 100 120
0 1 2 3 4 5 6 7 8 9
Q [Imp gpm]
Q [l/s]
0 20 40 60 80 100 120 140
0
20
40
60
80
100
120
140
0
5
10
15
20
25
30
35
40
45Q [US gpm]
H [ft
]
H[m
] 60%60%60%
max
80%
60%
40%
max curve 3P
0
5
10
15
20
25
0
2
4
6
8
0 5 10 15 20 25 30 35
NPS
H[ft
]
NPS
H[m
]
Q [m3/h]
A051
4_A_
CH
20%
min
SMB20…/5SVE04..007
0 10 20 30 40 50 60 70 80 90
0 1 2 3 4 5 6
Q [Imp gpm]
Q [l/s]
0 20 40 60 80 100
0
20
40
60
80
100
120
140
0
5
10
15
20
25
30
35
40
45Q [US gpm]
H [ft
]
H[m
]
max
80%
60%
40%
max curve 2P
0
5
10
15
20
25
0
2
4
6
8
0 5 10 15 20 25
NPS
H[ft
]
NPS
H[m
]
Q [m3/h]
A051
3_A_
CH
20%
min
SMB.../SVE BOOSTER SETS SERIESOPERATING CHARACTERISTICS
The performance curves do not take into account flow resistance in the valves and piping. The curves show the performance with one, two and three pumps running.These performances are valid for liquids with density ρ = 1 Kg/dm3 and kinematic viscosity ν = 1 mm2/sec.The declared NPSH values are laboratory values; for practical use we recommend increasing these values by 0,5 m.

58
5SVE06..011
0 5 10 15 20 25 30 35 40
0.0 0.5 1.0 1.5 2.0 2.5 3.0
Q [Imp gpm]
Q [l/s]
0 10 20 30 40 50
0
50
100
150
200
0
10
20
30
40
50
60
70Q [US gpm]
H [ft
]
H[m
]
maxmaxmaxmax
80%
60%
40%
max curve 1P
0
5
10
15
20
25
0
2
4
6
8
0 2 4 6 8 10 12
NPS
H[ft
]
NPS
H[m
]
Q [m3/h]
A051
5_A_
CH
20%
min
SMB30…/5SVE06..011
0 20 40 60 80 100 120
0 1 2 3 4 5 6 7 8 9
Q [Imp gpm]
Q [l/s]
0 20 40 60 80 100 120 140
0
50
100
150
200
0
10
20
30
40
50
60
70Q [US gpm]
H [ft
]
H[m
]
maxmaxmaxmax
80%
60%
40%
max curve 3P
0
5
10
15
20
25
0
2
4
6
8
0 5 10 15 20 25 30 35
NPS
H[ft
]
NPS
H[m
]
Q [m3/h]
A051
7_A_
CH
20%
min
SMB20…/5SVE06..011
0 10 20 30 40 50 60 70 80 90
0 1 2 3 4 5 6
Q [Imp gpm]
Q [l/s]
0 20 40 60 80 100
0
50
100
150
200
0
10
20
30
40
50
60
70Q [US gpm]
H [ft
]
H[m
]
maxmaxmaxmax
80%
60%
40%
max curve 2P
0
5
10
15
20
25
0
2
4
6
8
0 5 10 15 20 25
NPS
H[ft
]
NPS
H[m
]
Q [m3/h]
A051
6_A_
CH
20%
min
SMB.../SVE BOOSTER SETS SERIESOPERATING CHARACTERISTICS
The performance curves do not take into account flow resistance in the valves and piping. The curves show the performance with one, two and three pumps running.These performances are valid for liquids with density ρ = 1 Kg/dm3 and kinematic viscosity ν = 1 mm2/sec.The declared NPSH values are laboratory values; for practical use we recommend increasing these values by 0,5 m.

59
SMB.../SVE BOOSTER SETS SERIESOPERATING CHARACTERISTICS
5SVE08..015
0 5 10 15 20 25 30 35 40
0.0 0.5 1.0 1.5 2.0 2.5 3.0
Q [Imp gpm]
Q [l/s]
0 10 20 30 40 50
0
50
100
150
200
250
0
10
20
30
40
50
60
70
80
90Q [US gpm]
H [ft
]
H[m
]
max
80%
max
80%
max
80%
max
80%
60%
40%
max curve 1P
0
5
10
15
20
25
0
2
4
6
8
0 2 4 6 8 10 12
NPS
H[ft
]
NPS
H[m
]
Q [m3/h]
A051
8_A_
CH
20%
min
SMB30…/5SVE08..015
0 20 40 60 80 100 120
0 1 2 3 4 5 6 7 8 9
Q [Imp gpm]
Q [l/s]
0 20 40 60 80 100 120 140
0
50
100
150
200
250
0
10
20
30
40
50
60
70
80
90Q [US gpm]
H [ft
]
H[m
]
max
80%
max
80%
max
80%
max
80%
60%
40%
max curve 3P
0
5
10
15
20
25
0
2
4
6
8
0 5 10 15 20 25 30 35
NPS
H[ft
]
NPS
H[m
]
Q [m3/h]
A052
0_A_
CH
20%
min
SMB20…/5SVE08..015
0 10 20 30 40 50 60 70 80 90
0 1 2 3 4 5 6
Q [Imp gpm]
Q [l/s]
0 20 40 60 80 100
0
50
100
150
200
250
0
10
20
30
40
50
60
70
80
90Q [US gpm]
H [ft
]
H[m
]
max
80%
max
80%
max
80%
max
80%
60%
40%
max curve 2P
0
5
10
15
20
25
0
2
4
6
8
0 5 10 15 20 25
NPS
H[ft
]
NPS
H[m
]
Q [m3/h]
A051
9_A_
CH
20%
min
The performance curves do not take into account flow resistance in the valves and piping. The curves show the performance with one, two and three pumps running.These performances are valid for liquids with density ρ = 1 Kg/dm3 and kinematic viscosity ν = 1 mm2/sec.The declared NPSH values are laboratory values; for practical use we recommend increasing these values by 0,5 m.

60
SMB.../SVE BOOSTER SETS SERIESOPERATING CHARACTERISTICS
10SVE01..005
0 10 20 30 40 50 60
0.0 0.5 1.0 1.5 2.0 2.5 3.0 3.5 4.0 4.5 5.0
Q [Imp gpm]
Q [l/s]
0 10 20 30 40 50 60 70
0
10
20
30
40
50
0
2
4
6
8
10
12
14
16
18Q [US gpm]
H [ft
]
H[m
]
max
80%
60%
40%
max curve 1P
0
5
10
15
20
25
0
2
4
6
8
0 2 4 6 8 10 12 14 16 18
NPS
H[ft
]
NPS
H[m
]
Q [m3/h]
A052
1_A_
CH
20%
min
SMB30…/10SVE01..005
0 50 100 150 200
0 2 4 6 8 10 12 14 16
Q [Imp gpm]
Q [l/s]
0 50 100 150 200 250
0
10
20
30
40
50
0
2
4
6
8
10
12
14
16
18Q [US gpm]
H [ft
]
H[m
]
maxmaxmaxmax
80%
60%
40%
max curve 3P
0
5
10
15
20
25
0
2
4
6
8
0 10 20 30 40 50 60
NPS
H[ft
]
NPS
H[m
]
Q [m3/h]
A052
3_A_
CH
20%
min
SMB20…/10SVE01..005
0 20 40 60 80 100 120
0 1 2 3 4 5 6 7 8 9
Q [Imp gpm]
Q [l/s]
0 20 40 60 80 100 120 140
0
10
20
30
40
50
0
2
4
6
8
10
12
14
16
18Q [US gpm]
H [ft
]
H[m
]
maxmaxmaxmax
80%
60%
40%
max curve 2P
0
5
10
15
20
25
0
2
4
6
8
0 5 10 15 20 25 30 35
NPS
H[ft
]
NPS
H[m
]
Q [m3/h]
A052
2_A_
CH
20%
min
The performance curves do not take into account flow resistance in the valves and piping. The curves show the performance with one, two and three pumps running.These performances are valid for liquids with density ρ = 1 Kg/dm3 and kinematic viscosity ν = 1 mm2/sec.The declared NPSH values are laboratory values; for practical use we recommend increasing these values by 0,5 m.
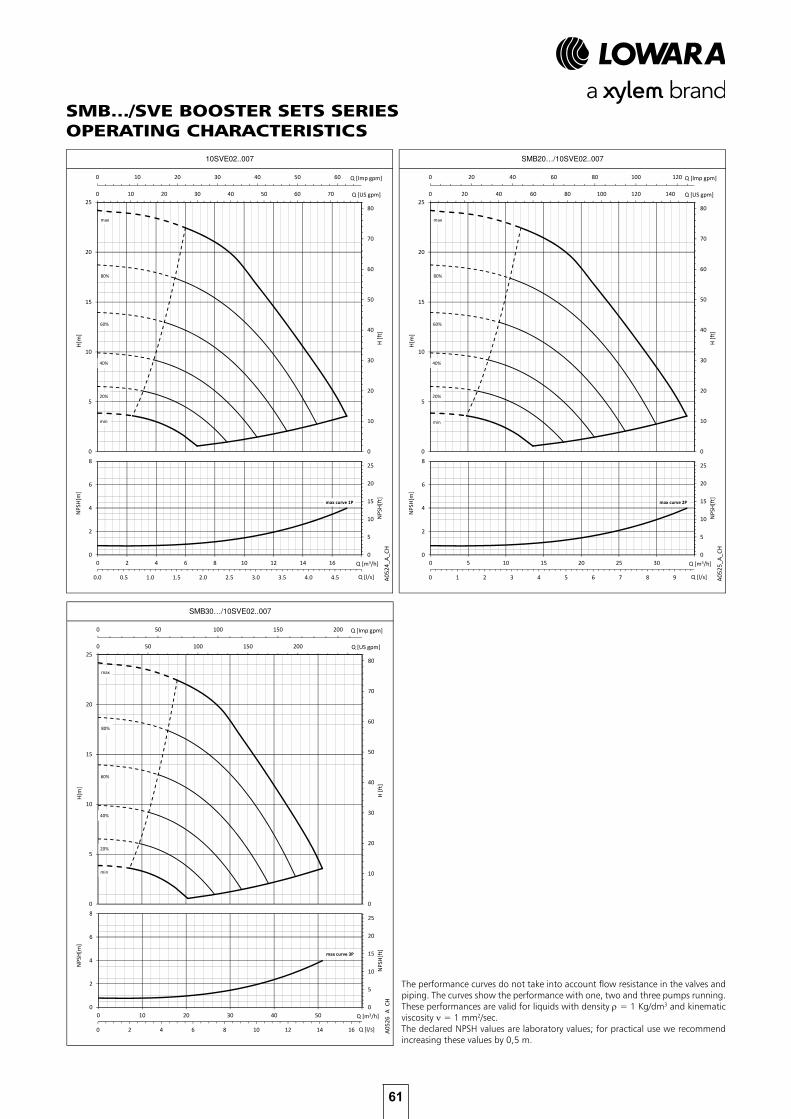
61
SMB.../SVE BOOSTER SETS SERIESOPERATING CHARACTERISTICS
10SVE02..007
0 10 20 30 40 50 60
0.0 0.5 1.0 1.5 2.0 2.5 3.0 3.5 4.0 4.5 5.0
Q [Imp gpm]
Q [l/s]
0 10 20 30 40 50 60 70
0
10
20
30
40
50
60
70
80
0
5
10
15
20
25Q [US gpm]
H [ft
]
H[m
]
max
80%
60%
40%
max
80%
60%
40%
max
80%
60%
40%
max
80%
60%
40%
max curve 1P
0
5
10
15
20
25
0
2
4
6
8
0 2 4 6 8 10 12 14 16 18
NPS
H[ft
]
NPS
H[m
]
Q [m3/h]
A052
4_A_
CH
20%
min
SMB30…/10SVE02..007
0 50 100 150 200
0 2 4 6 8 10 12 14 16
Q [Imp gpm]
Q [l/s]
0 50 100 150 200 250
0
10
20
30
40
50
60
70
80
0
5
10
15
20
25Q [US gpm]
H [ft
]
H[m
]
max
80%
60%
40%
max
80%
60%
40%
max
80%
60%
40%
max
80%
60%
40%
max curve 3P
0
5
10
15
20
25
0
2
4
6
8
0 10 20 30 40 50 60
NPS
H[ft
]
NPS
H[m
]
Q [m3/h]
A052
6_A_
CH
20%
min
SMB20…/10SVE02..007
0 20 40 60 80 100 120
0 1 2 3 4 5 6 7 8 9
Q [Imp gpm]
Q [l/s]
0 20 40 60 80 100 120 140
0
10
20
30
40
50
60
70
80
0
5
10
15
20
25Q [US gpm]
H [ft
]
H[m
]
max
80%
60%
40%
max
80%
60%
40%
max
80%
60%
40%
max
80%
60%
40%
max curve 2P
0
5
10
15
20
25
0
2
4
6
8
0 5 10 15 20 25 30 35
NPS
H[ft
]
NPS
H[m
]
Q [m3/h]
A052
5_A_
CH
20%
min
The performance curves do not take into account flow resistance in the valves and piping. The curves show the performance with one, two and three pumps running.These performances are valid for liquids with density ρ = 1 Kg/dm3 and kinematic viscosity ν = 1 mm2/sec.The declared NPSH values are laboratory values; for practical use we recommend increasing these values by 0,5 m.
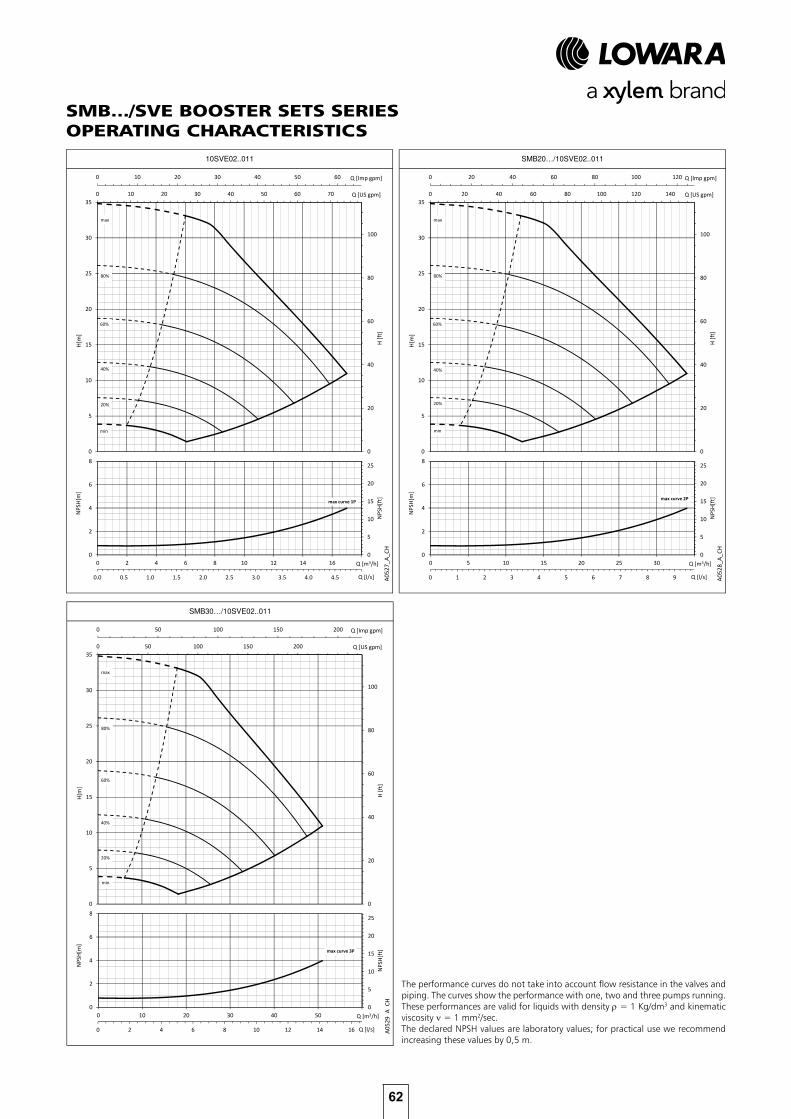
62
SMB.../SVE BOOSTER SETS SERIESOPERATING CHARACTERISTICS
10SVE02..011
0 10 20 30 40 50 60
0.0 0.5 1.0 1.5 2.0 2.5 3.0 3.5 4.0 4.5 5.0
Q [Imp gpm]
Q [l/s]
0 10 20 30 40 50 60 70
0
20
40
60
80
100
0
5
10
15
20
25
30
35Q [US gpm]
H [ft
]
H[m
]
max
80%
60%
max
80%
60%
max
80%
60%
max
80%
60%
40%
max curve 1P
0
5
10
15
20
25
0
2
4
6
8
0 2 4 6 8 10 12 14 16 18
NPS
H[ft
]
NPS
H[m
]
Q [m3/h]
A052
7_A_
CH
20%
min
SMB30…/10SVE02..011
0 50 100 150 200
0 2 4 6 8 10 12 14 16
Q [Imp gpm]
Q [l/s]
0 50 100 150 200 250
0
20
40
60
80
100
0
5
10
15
20
25
30
35Q [US gpm]
H [ft
]
H[m
]
max
80%
max
80%
max
80%
max
80%
60%
40%
max curve 3P
0
5
10
15
20
25
0
2
4
6
8
0 10 20 30 40 50 60
NPS
H[ft
]
NPS
H[m
]
Q [m3/h]
A052
9_A_
CH
20%
min
SMB20…/10SVE02..011
0 20 40 60 80 100 120
0 1 2 3 4 5 6 7 8 9
Q [Imp gpm]
Q [l/s]
0 20 40 60 80 100 120 140
0
20
40
60
80
100
0
5
10
15
20
25
30
35Q [US gpm]
H [ft
]
H[m
]
max
80%
60%
max
80%
60%
max
80%
60%
max
80%
60%
40%
max curve 2P
0
5
10
15
20
25
0
2
4
6
8
0 5 10 15 20 25 30 35
NPS
H[ft
]
NPS
H[m
]
Q [m3/h]
A052
8_A_
CH
20%
min
The performance curves do not take into account flow resistance in the valves and piping. The curves show the performance with one, two and three pumps running.These performances are valid for liquids with density ρ = 1 Kg/dm3 and kinematic viscosity ν = 1 mm2/sec.The declared NPSH values are laboratory values; for practical use we recommend increasing these values by 0,5 m.
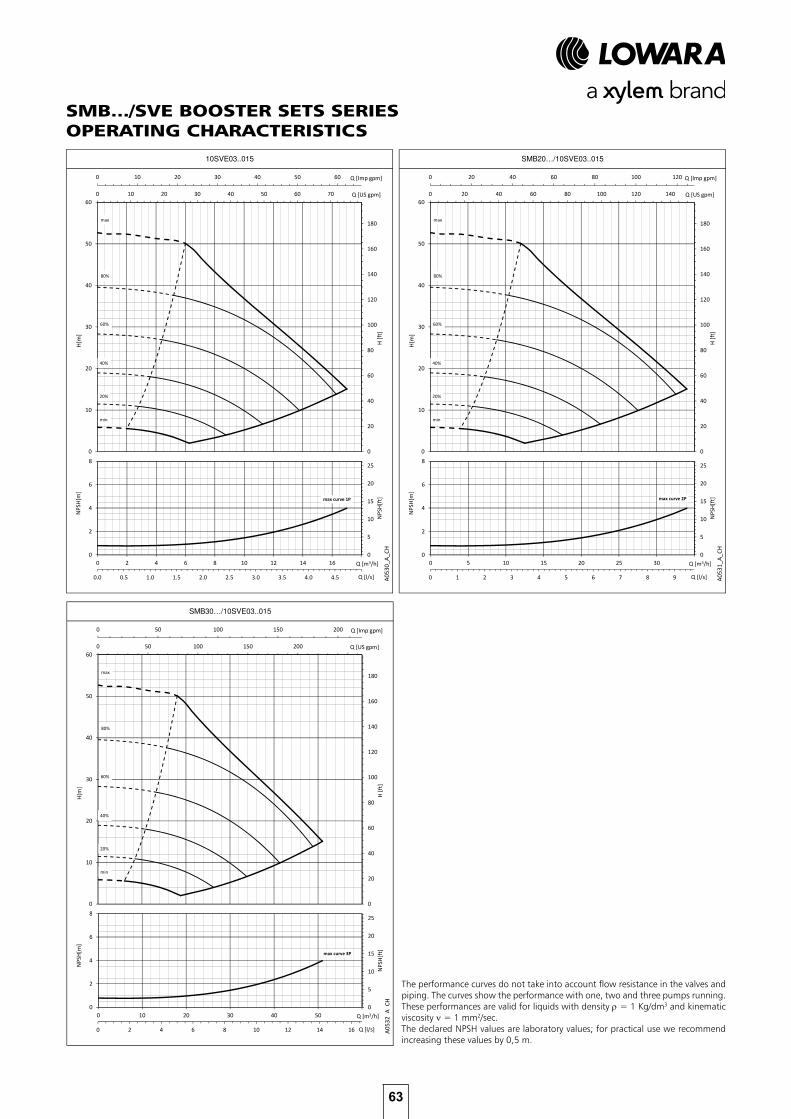
63
SMB.../SVE BOOSTER SETS SERIESOPERATING CHARACTERISTICS
10SVE03..015
0 10 20 30 40 50 60
0.0 0.5 1.0 1.5 2.0 2.5 3.0 3.5 4.0 4.5 5.0
Q [Imp gpm]
Q [l/s]
0 10 20 30 40 50 60 70
0
20
40
60
80
100
120
140
160
180
0
10
20
30
40
50
60Q [US gpm]
H [ft
]
H[m
]
max
80%
60%
40%
max
80%
60%
40%
max
80%
60%
40%
max
80%
60%
40%
max curve 1P
0
5
10
15
20
25
0
2
4
6
8
0 2 4 6 8 10 12 14 16 18
NPS
H[ft
]
NPS
H[m
]
Q [m3/h]
A053
0_A_
CH
20%
min
SMB30…/10SVE03..015
0 50 100 150 200
0 2 4 6 8 10 12 14 16
Q [Imp gpm]
Q [l/s]
0 50 100 150 200 250
0
20
40
60
80
100
120
140
160
180
0
10
20
30
40
50
60Q [US gpm]
H [ft
]
H[m
]
max
80%
60%
40%
max
80%
60%
40%
max
80%
60%
40%
max
80%
60%
40%
max curve 3P
0
5
10
15
20
25
0
2
4
6
8
0 10 20 30 40 50 60
NPS
H[ft
]
NPS
H[m
]
Q [m3/h]
A053
2_A_
CH
20%
min
SMB20…/10SVE03..015
0 20 40 60 80 100 120
0 1 2 3 4 5 6 7 8 9
Q [Imp gpm]
Q [l/s]
0 20 40 60 80 100 120 140
0
20
40
60
80
100
120
140
160
180
0
10
20
30
40
50
60Q [US gpm]
H [ft
]
H[m
]
max
80%
60%
40%
max
80%
60%
40%
max
80%
60%
40%
max
80%
60%
40%
max curve 2P
0
5
10
15
20
25
0
2
4
6
8
0 5 10 15 20 25 30 35
NPS
H[ft
]
NPS
H[m
]
Q [m3/h]
A053
1_A_
CH
20%
min
The performance curves do not take into account flow resistance in the valves and piping. The curves show the performance with one, two and three pumps running.These performances are valid for liquids with density ρ = 1 Kg/dm3 and kinematic viscosity ν = 1 mm2/sec.The declared NPSH values are laboratory values; for practical use we recommend increasing these values by 0,5 m.

64
1VME02P03
0 2 4 6 8 10 12
0.0 0.1 0.2 0.3 0.4 0.5 0.6 0.7 0.8 0.9
Q [Imp gpm]
Q [l/s]
0 2 4 6 8 10 12 14
0
20
40
60
80
100
0
5
10
15
20
25
30
35Q [US gpm]
H [ft
]
H[m
]
max
80%
max
80%
max
80%
max
80%
60%
40%
max curve 1P
0
5
10
15
20
25
0
2
4
6
8
0.0 0.5 1.0 1.5 2.0 2.5 3.0 3.5
NPS
H[ft
]
NPS
H[m
]
Q [m3/h]
A023
8_A_
CH
20%
min
SMB30…/1VME02P03
0 5 10 15 20 25 30 35
0.0 0.5 1.0 1.5 2.0 2.5
Q [Imp gpm]
Q [l/s]
0 5 10 15 20 25 30 35 40
0
20
40
60
80
100
0
5
10
15
20
25
30
35Q [US gpm]
H [ft
]
H[m
]
max
80%
max
80%
max
80%
max
80%
60%
40%
max curve 3P
0
5
10
15
20
25
0
2
4
6
8
0 1 2 3 4 5 6 7 8 9 10
NPS
H[ft
]
NPS
H[m
]
Q [m3/h]
A024
0_A_
CH
20%
min
SMB20…/1VME02P03
0 5 10 15 20 25
0.0 0.2 0.4 0.6 0.8 1.0 1.2 1.4 1.6 1.8
Q [Imp gpm]
Q [l/s]
0 5 10 15 20 25 30
0
20
40
60
80
100
0
5
10
15
20
25
30
35Q [US gpm]
H [ft
]
H[m
]
max
80%
max
80%
max
80%
max
80%
60%
40%
max curve 2P
0
5
10
15
20
25
0
2
4
6
8
0 1 2 3 4 5 6 7
NPS
H[ft
]
NPS
H[m
]
Q [m3/h]
A023
9_A_
CH
20%
min
SMB.../VME BOOSTER SETS SERIESOPERATING CHARACTERISTICS
The performance curves do not take into account flow resistance in the valves and piping. The curves show the performance with one, two and three pumps running.These performances are valid for liquids with density ρ = 1 Kg/dm3 and kinematic viscosity ν = 1 mm2/sec.The declared NPSH values are laboratory values; for practical use we recommend increasing these values by 0,5 m.

65
1VME04P05
0 2 4 6 8 10 12
0.0 0.1 0.2 0.3 0.4 0.5 0.6 0.7 0.8 0.9
Q [Imp gpm]
Q [l/s]
0 2 4 6 8 10 12 14
0
20
40
60
80
100
120
140
160
180
0
10
20
30
40
50
60Q [US gpm]
H [ft
]
H[m
]
max
80%
60%
40%
max curve 1P
0
5
10
15
20
25
0
2
4
6
8
0.0 0.5 1.0 1.5 2.0 2.5 3.0 3.5
NPS
H[ft
]
NPS
H[m
]
Q [m3/h]
A024
1_A_
CH
20%
min
SMB30…/1VME04P05
0 5 10 15 20 25 30 35
0.0 0.5 1.0 1.5 2.0 2.5
Q [Imp gpm]
Q [l/s]
0 5 10 15 20 25 30 35 40
0
20
40
60
80
100
120
140
160
180
0
10
20
30
40
50
60Q [US gpm]
H [ft
]
H[m
]
max
80%
60%
40%
max curve 3P
0
5
10
15
20
25
0
2
4
6
8
0 1 2 3 4 5 6 7 8 9 10
NPS
H[ft
]
NPS
H[m
]
Q [m3/h]
A024
3_A_
CH
20%
min
SMB20…/1VME04P05
0 5 10 15 20 25
0.0 0.2 0.4 0.6 0.8 1.0 1.2 1.4 1.6 1.8
Q [Imp gpm]
Q [l/s]
0 5 10 15 20 25 30
0
20
40
60
80
100
120
140
160
180
0
10
20
30
40
50
60Q [US gpm]
H [ft
]
H[m
]
max
80%
60%
40%
max curve 2P
0
5
10
15
20
25
0
2
4
6
8
0 1 2 3 4 5 6 7
NPS
H[ft
]
NPS
H[m
]
Q [m3/h]
A024
2_A_
CH
20%
min
SMB.../VME BOOSTER SETS SERIESOPERATING CHARACTERISTICS
The performance curves do not take into account flow resistance in the valves and piping. The curves show the performance with one, two and three pumps running.These performances are valid for liquids with density ρ = 1 Kg/dm3 and kinematic viscosity ν = 1 mm2/sec.The declared NPSH values are laboratory values; for practical use we recommend increasing these values by 0,5 m.
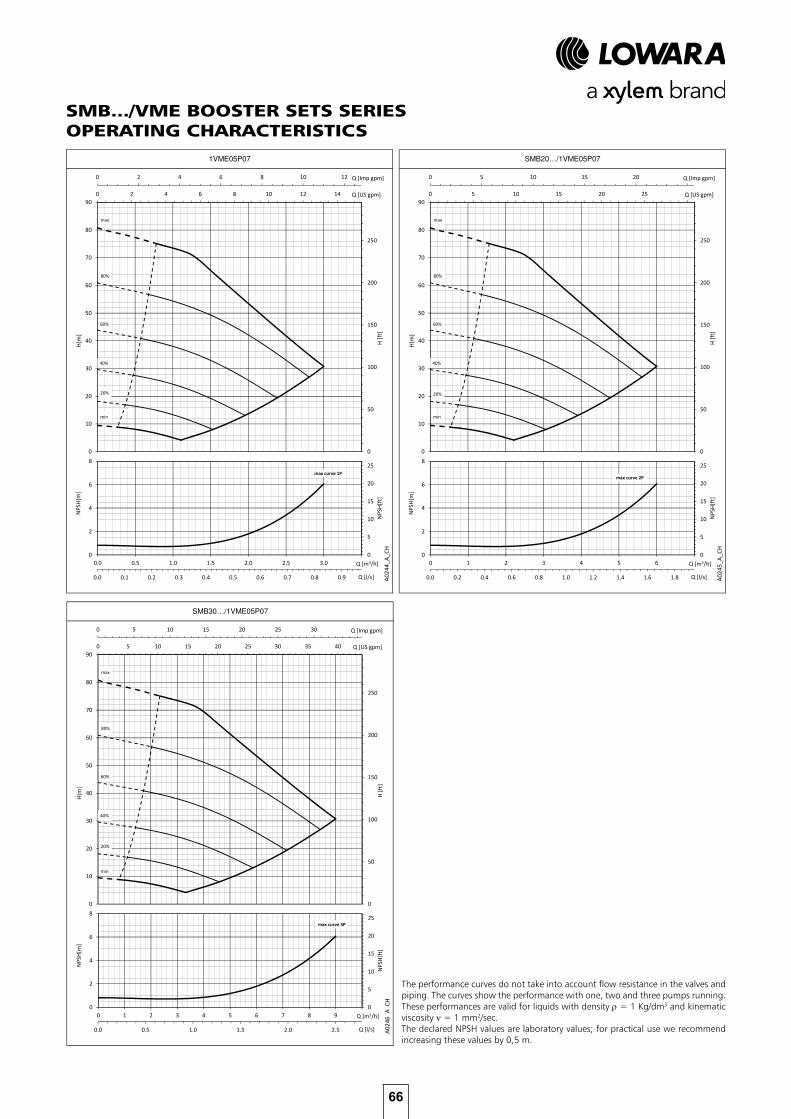
66
1VME05P07
0 2 4 6 8 10 12
0.0 0.1 0.2 0.3 0.4 0.5 0.6 0.7 0.8 0.9
Q [Imp gpm]
Q [l/s]
0 2 4 6 8 10 12 14
0
50
100
150
200
250
0
10
20
30
40
50
60
70
80
90Q [US gpm]
H [ft
]
H[m
]
max
80%
60%
40%
max
80%
60%
40%
max
80%
60%
40%
max
80%
60%
40%
max curve 1P
0
5
10
15
20
25
0
2
4
6
8
0.0 0.5 1.0 1.5 2.0 2.5 3.0 3.5
NPS
H[ft
]
NPS
H[m
]
Q [m3/h]
A024
4_A_
CH20%
min
SMB30…/1VME05P07
0 5 10 15 20 25 30 35
0.0 0.5 1.0 1.5 2.0 2.5
Q [Imp gpm]
Q [l/s]
0 5 10 15 20 25 30 35 40
0
50
100
150
200
250
0
10
20
30
40
50
60
70
80
90Q [US gpm]
H [ft
]
H[m
]
max
80%
60%
40%
max
80%
60%
40%
max
80%
60%
40%
max
80%
60%
40%
max curve 3P
0
5
10
15
20
25
0
2
4
6
8
0 1 2 3 4 5 6 7 8 9 10
NPS
H[ft
]
NPS
H[m
]
Q [m3/h]
A024
6_A_
CH
20%
min
SMB20…/1VME05P07
0 5 10 15 20 25
0.0 0.2 0.4 0.6 0.8 1.0 1.2 1.4 1.6 1.8
Q [Imp gpm]
Q [l/s]
0 5 10 15 20 25 30
0
50
100
150
200
250
0
10
20
30
40
50
60
70
80
90Q [US gpm]
H [ft
]
H[m
]
max
80%
60%
40%
max
80%
60%
40%
max
80%
60%
40%
max
80%
60%
40%
max curve 2P
0
5
10
15
20
25
0
2
4
6
8
0 1 2 3 4 5 6 7
NPS
H[ft
]
NPS
H[m
]
Q [m3/h]
A024
5_A_
CH
20%
min
SMB.../VME BOOSTER SETS SERIESOPERATING CHARACTERISTICS
The performance curves do not take into account flow resistance in the valves and piping. The curves show the performance with one, two and three pumps running.These performances are valid for liquids with density ρ = 1 Kg/dm3 and kinematic viscosity ν = 1 mm2/sec.The declared NPSH values are laboratory values; for practical use we recommend increasing these values by 0,5 m.

67
1VME06P11
0 2 4 6 8 10 12
0.0 0.1 0.2 0.3 0.4 0.5 0.6 0.7 0.8 0.9
Q [Imp gpm]
Q [l/s]
0 2 4 6 8 10 12 14
0
50
100
150
200
250
300
0
10
20
30
40
50
60
70
80
90
100Q [US gpm]
H [ft
]
H[m
]
max
80%
max
80%
max
80%
max
80%
60%
40%
max curve 1P
0
5
10
15
20
25
0
2
4
6
8
0.0 0.5 1.0 1.5 2.0 2.5 3.0 3.5
NPS
H[ft
]
NPS
H[m
]
Q [m3/h]
A024
7_A_
CH
20%
min
SMB30…/1VME06P11
0 5 10 15 20 25 30 35
0.0 0.5 1.0 1.5 2.0 2.5
Q [Imp gpm]
Q [l/s]
0 5 10 15 20 25 30 35 40
0
50
100
150
200
250
300
0
10
20
30
40
50
60
70
80
90
100Q [US gpm]
H [ft
]
H[m
]
max
80%
max
80%
max
80%
max
80%
60%
40%
max curve 3P
0
5
10
15
20
25
0
2
4
6
8
0 1 2 3 4 5 6 7 8 9 10
NPS
H[ft
]
NPS
H[m
]
Q [m3/h]
A024
9_A_
CH
20%
min
SMB20…/1VME06P11
0 5 10 15 20 25
0.0 0.2 0.4 0.6 0.8 1.0 1.2 1.4 1.6 1.8
Q [Imp gpm]
Q [l/s]
0 5 10 15 20 25 30
0
50
100
150
200
250
300
0
10
20
30
40
50
60
70
80
90
100Q [US gpm]
H [ft
]
H[m
]
max
80%
max
80%
max
80%
max
80%
60%
40%
max curve 2P
0
5
10
15
20
25
0
2
4
6
8
0 1 2 3 4 5 6 7
NPS
H[ft
]
NPS
H[m
]
Q [m3/h]
A024
8_A_
CH
20%
min
SMB.../VME BOOSTER SETS SERIESOPERATING CHARACTERISTICS
The performance curves do not take into account flow resistance in the valves and piping. The curves show the performance with one, two and three pumps running.These performances are valid for liquids with density ρ = 1 Kg/dm3 and kinematic viscosity ν = 1 mm2/sec.The declared NPSH values are laboratory values; for practical use we recommend increasing these values by 0,5 m.

68
3VME02P03
0 5 10 15 20
0.0 0.2 0.4 0.6 0.8 1.0 1.2 1.4 1.6
Q [Imp gpm]
Q [l/s]
0 5 10 15 20 25
0
20
40
60
80
100
120
0
5
10
15
20
25
30
35
40Q [US gpm]
H [ft
]
H[m
]
max
80%
60%
40%
max
80%
60%
40%
max
80%
60%
40%
max
80%
60%
40%
max curve 1P
0
10
20
30
40
0
5
10
15
0 1 2 3 4 5 6
NPS
H[ft
]
NPS
H[m
]
Q [m3/h]
A025
0_A_
CH
20%
min
SMB30…/3VME02P03
0 10 20 30 40 50
0.0 0.5 1.0 1.5 2.0 2.5 3.0 3.5 4.0
Q [Imp gpm]
Q [l/s]
0 10 20 30 40 50 60 70
0
20
40
60
80
100
120
0
5
10
15
20
25
30
35
40Q [US gpm]
H [ft
]
H[m
]
max
80%
60%
40%
max
80%
60%
40%
max
80%
60%
40%
max
80%
60%
40%
max curve 3P
0
10
20
30
40
0
5
10
15
0 2 4 6 8 10 12 14 16
NPS
H[ft
]
NPS
H[m
]
Q [m3/h]
A025
2_A_
CH
20%
min
SMB20…/3VME02P03
0 5 10 15 20 25 30 35 40
0.0 0.5 1.0 1.5 2.0 2.5 3.0
Q [Imp gpm]
Q [l/s]
0 10 20 30 40 50
0
20
40
60
80
100
120
0
5
10
15
20
25
30
35
40Q [US gpm]
H [ft
]
H[m
]
max
80%
60%
40%
max
80%
60%
40%
max
80%
60%
40%
max
80%
60%
40%
max curve 2P
0
10
20
30
40
0
5
10
15
0 2 4 6 8 10 12
NPS
H[ft
]
NPS
H[m
]
Q [m3/h]
A025
1_A_
CH
20%
min
SMB.../VME BOOSTER SETS SERIESOPERATING CHARACTERISTICS
The performance curves do not take into account flow resistance in the valves and piping. The curves show the performance with one, two and three pumps running.These performances are valid for liquids with density ρ = 1 Kg/dm3 and kinematic viscosity ν = 1 mm2/sec.The declared NPSH values are laboratory values; for practical use we recommend increasing these values by 0,5 m.

69
3VME03P05
0 5 10 15 20
0.0 0.2 0.4 0.6 0.8 1.0 1.2 1.4 1.6
Q [Imp gpm]
Q [l/s]
0 5 10 15 20 25
0
20
40
60
80
100
120
140
160
180
0
10
20
30
40
50
60Q [US gpm]
H [ft
]
H[m
]
max
80%
60%
40%
max
80%
60%
40%
max
80%
60%
40%
max
80%
60%
40%
max curve 1P
0
10
20
30
40
0
5
10
15
0 1 2 3 4 5 6
NPS
H[ft
]
NPS
H[m
]
Q [m3/h]
A025
3_A_
CH
20%
min
SMB30…/3VME03P05
0 10 20 30 40 50
0.0 0.5 1.0 1.5 2.0 2.5 3.0 3.5 4.0
Q [Imp gpm]
Q [l/s]
0 10 20 30 40 50 60 70
0
20
40
60
80
100
120
140
160
180
0
10
20
30
40
50
60Q [US gpm]
H [ft
]
H[m
]
max
80%
60%
40%
max
80%
60%
40%
max
80%
60%
40%
max
80%
60%
40%
max curve 3P
0
10
20
30
40
0
5
10
15
0 2 4 6 8 10 12 14 16
NPS
H[ft
]
NPS
H[m
]
Q [m3/h]
A025
5_A_
CH
20%
min
SMB20…/3VME03P05
0 5 10 15 20 25 30 35 40
0.0 0.5 1.0 1.5 2.0 2.5 3.0
Q [Imp gpm]
Q [l/s]
0 10 20 30 40 50
0
20
40
60
80
100
120
140
160
180
0
10
20
30
40
50
60Q [US gpm]
H [ft
]
H[m
]
max
80%
60%
40%
max
80%
60%
40%
max
80%
60%
40%
max
80%
60%
40%
max curve 2P
0
10
20
30
40
0
5
10
15
0 2 4 6 8 10 12
NPS
H[ft
]
NPS
H[m
]
Q [m3/h]
A025
4_A_
CH
20%
min
SMB.../VME BOOSTER SETS SERIESOPERATING CHARACTERISTICS
The performance curves do not take into account flow resistance in the valves and piping. The curves show the performance with one, two and three pumps running.These performances are valid for liquids with density ρ = 1 Kg/dm3 and kinematic viscosity ν = 1 mm2/sec.The declared NPSH values are laboratory values; for practical use we recommend increasing these values by 0,5 m.

70
3VME04P07
0 5 10 15 20
0.0 0.2 0.4 0.6 0.8 1.0 1.2 1.4 1.6
Q [Imp gpm]
Q [l/s]
0 5 10 15 20 25
0
50
100
150
200
250
0
10
20
30
40
50
60
70
80Q [US gpm]
H [ft
]
H[m
]
max
80%
60%
40%
max
80%
60%
40%
max
80%
60%
40%
max
80%
60%
40%
max curve 1P
0
10
20
30
40
0
5
10
15
0 1 2 3 4 5 6
NPS
H[ft
]
NPS
H[m
]
Q [m3/h]
A025
6_A_
CH
20%
min
SMB30…/3VME04P07
0 10 20 30 40 50
0.0 0.5 1.0 1.5 2.0 2.5 3.0 3.5 4.0
Q [Imp gpm]
Q [l/s]
0 10 20 30 40 50 60 70
0
50
100
150
200
250
0
10
20
30
40
50
60
70
80Q [US gpm]
H [ft
]
H[m
]
max
80%
60%
40%
max
80%
60%
40%
max
80%
60%
40%
max
80%
60%
40%
max curve 3P
0
10
20
30
40
0
5
10
15
0 2 4 6 8 10 12 14 16
NPS
H[ft
]
NPS
H[m
]
Q [m3/h]
A025
8_A_
CH
20%
min
SMB20…/3VME04P07
0 5 10 15 20 25 30 35 40
0.0 0.5 1.0 1.5 2.0 2.5 3.0
Q [Imp gpm]
Q [l/s]
0 10 20 30 40 50
0
50
100
150
200
250
0
10
20
30
40
50
60
70
80Q [US gpm]
H [ft
]
H[m
]
max
80%
60%
40%
max
80%
60%
40%
max
80%
60%
40%
max
80%
60%
40%
max curve 2P
0
10
20
30
40
0
5
10
15
0 2 4 6 8 10 12
NPS
H[ft
]
NPS
H[m
]
Q [m3/h]
A025
7_A_
CH
20%
min
SMB.../VME BOOSTER SETS SERIESOPERATING CHARACTERISTICS
The performance curves do not take into account flow resistance in the valves and piping. The curves show the performance with one, two and three pumps running.These performances are valid for liquids with density ρ = 1 Kg/dm3 and kinematic viscosity ν = 1 mm2/sec.The declared NPSH values are laboratory values; for practical use we recommend increasing these values by 0,5 m.
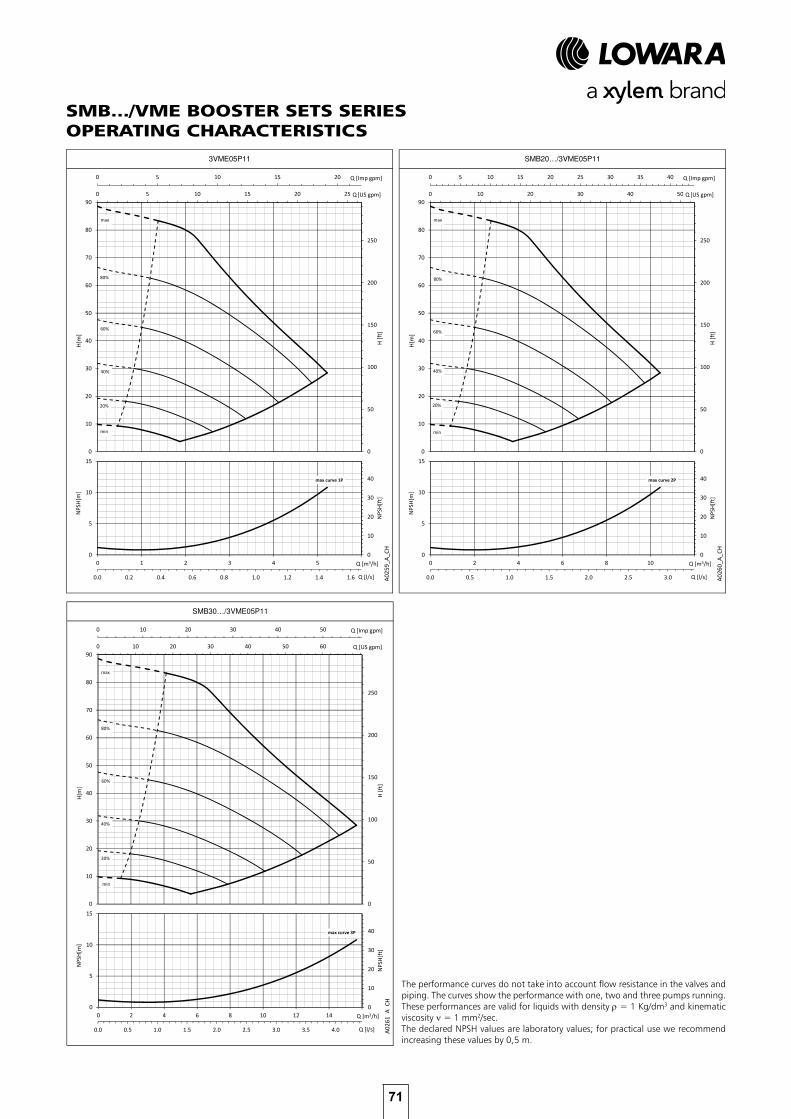
71
3VME05P11
0 5 10 15 20
0.0 0.2 0.4 0.6 0.8 1.0 1.2 1.4 1.6
Q [Imp gpm]
Q [l/s]
0 5 10 15 20 25
0
50
100
150
200
250
0
10
20
30
40
50
60
70
80
90Q [US gpm]
H [ft
]
H[m
]
maxmaxmaxmax
80%
60%
40%
max curve 1P
0
10
20
30
40
0
5
10
15
0 1 2 3 4 5 6
NPS
H[ft
]
NPS
H[m
]
Q [m3/h]
A025
9_A_
CH
20%
min
SMB30…/3VME05P11
0 10 20 30 40 50
0.0 0.5 1.0 1.5 2.0 2.5 3.0 3.5 4.0
Q [Imp gpm]
Q [l/s]
0 10 20 30 40 50 60 70
0
50
100
150
200
250
0
10
20
30
40
50
60
70
80
90Q [US gpm]
H [ft
]
H[m
]
max
80%
max
80%
max
80%
max
80%
60%
40%
max curve 3P
0
10
20
30
40
0
5
10
15
0 2 4 6 8 10 12 14 16
NPS
H[ft
]
NPS
H[m
]
Q [m3/h]
A026
1_A_
CH
20%
min
SMB20…/3VME05P11
0 5 10 15 20 25 30 35 40
0.0 0.5 1.0 1.5 2.0 2.5 3.0
Q [Imp gpm]
Q [l/s]
0 10 20 30 40 50
0
50
100
150
200
250
0
10
20
30
40
50
60
70
80
90Q [US gpm]
H [ft
]
H[m
]
maxmaxmaxmax
80%
60%
40%
max curve 2P
0
10
20
30
40
0
5
10
15
0 2 4 6 8 10 12
NPS
H[ft
]
NPS
H[m
]
Q [m3/h]
A026
0_A_
CH
20%
min
SMB.../VME BOOSTER SETS SERIESOPERATING CHARACTERISTICS
The performance curves do not take into account flow resistance in the valves and piping. The curves show the performance with one, two and three pumps running.These performances are valid for liquids with density ρ = 1 Kg/dm3 and kinematic viscosity ν = 1 mm2/sec.The declared NPSH values are laboratory values; for practical use we recommend increasing these values by 0,5 m.

72
3VME06P15
0 5 10 15 20
0.0 0.2 0.4 0.6 0.8 1.0 1.2 1.4 1.6
Q [Imp gpm]
Q [l/s]
0 5 10 15 20 25
0
50
100
150
200
250
300
350
0
10
20
30
40
50
60
70
80
90
100
110Q [US gpm]
H [ft
]
H[m
]
max
80%
60%
40%
max curve 1P
0
10
20
30
40
0
5
10
15
0 1 2 3 4 5 6
NPS
H[ft
]
NPS
H[m
]
Q [m3/h]
A026
2_A_
CH20%
min
SMB30…/3VME06P15
0 10 20 30 40 50
0.0 0.5 1.0 1.5 2.0 2.5 3.0 3.5 4.0
Q [Imp gpm]
Q [l/s]
0 10 20 30 40 50 60 70
0
50
100
150
200
250
300
350
0
10
20
30
40
50
60
70
80
90
100
110Q [US gpm]
H [ft
]
H[m
]
40%40%40%
max
80%
60%
40%
max curve 3P
0
10
20
30
40
0
5
10
15
0 2 4 6 8 10 12 14 16
NPS
H[ft
]
NPS
H[m
]
Q [m3/h]
A026
4_A_
CH
20%
min
SMB20…/3VME06P15
0 5 10 15 20 25 30 35 40
0.0 0.5 1.0 1.5 2.0 2.5 3.0
Q [Imp gpm]
Q [l/s]
0 10 20 30 40 50
0
50
100
150
200
250
300
350
0
10
20
30
40
50
60
70
80
90
100
110Q [US gpm]
H [ft
]
H[m
]
max
80%
60%
40%
max curve 2P
0
10
20
30
40
0
5
10
15
0 2 4 6 8 10 12
NPS
H[ft
]
NPS
H[m
]
Q [m3/h]
A026
3_A_
CH
20%
min
SMB.../VME BOOSTER SETS SERIESOPERATING CHARACTERISTICS
The performance curves do not take into account flow resistance in the valves and piping. The curves show the performance with one, two and three pumps running.These performances are valid for liquids with density ρ = 1 Kg/dm3 and kinematic viscosity ν = 1 mm2/sec.The declared NPSH values are laboratory values; for practical use we recommend increasing these values by 0,5 m.
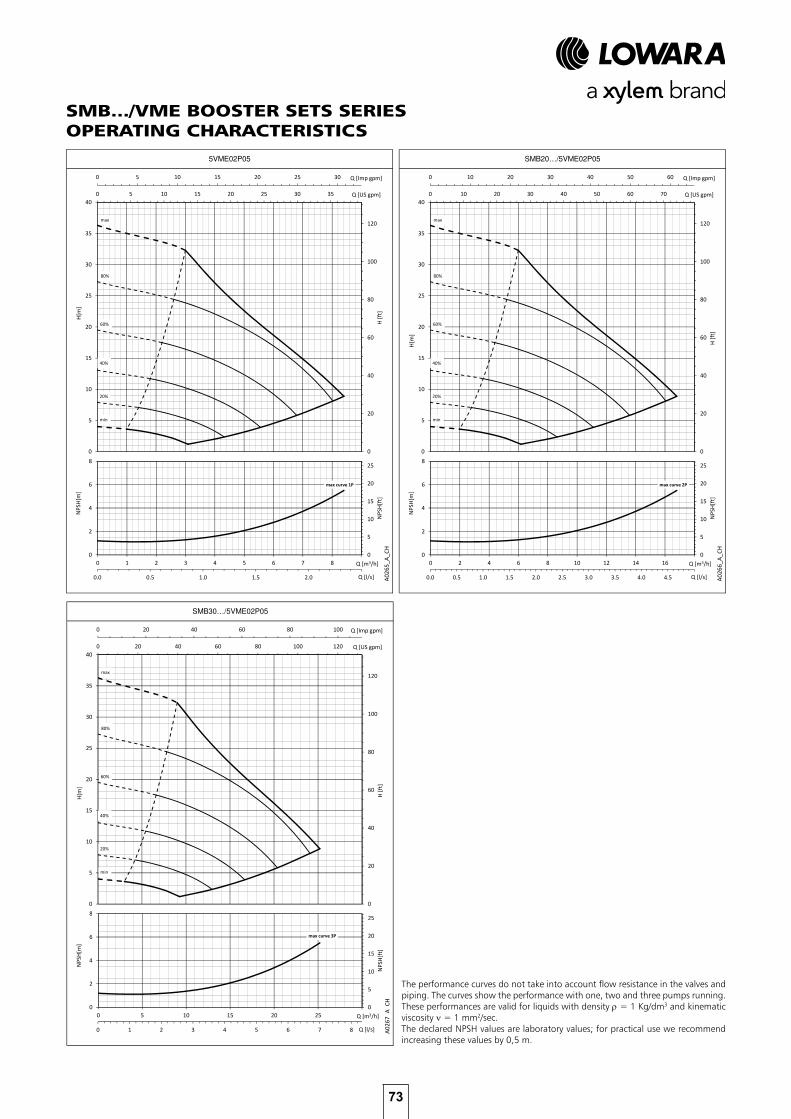
73
5VME02P05
0 5 10 15 20 25 30
0.0 0.5 1.0 1.5 2.0 2.5
Q [Imp gpm]
Q [l/s]
0 5 10 15 20 25 30 35
0
20
40
60
80
100
120
0
5
10
15
20
25
30
35
40Q [US gpm]
H [ft
]
H[m
]
max
80%
60%
40%
max
80%
60%
40%
max
80%
60%
40%
max
80%
60%
40%
max curve 1P
0
5
10
15
20
25
0
2
4
6
8
0 1 2 3 4 5 6 7 8 9
NPS
H[ft
]
NPS
H[m
]
Q [m3/h]
A026
5_A_
CH
20%
min
SMB30…/5VME02P05
0 20 40 60 80 100
0 1 2 3 4 5 6 7 8
Q [Imp gpm]
Q [l/s]
0 20 40 60 80 100 120
0
20
40
60
80
100
120
0
5
10
15
20
25
30
35
40Q [US gpm]
H [ft
]
H[m
]
max
80%
60%
40%
max
80%
60%
40%
max
80%
60%
40%
max
80%
60%
40%
max curve 3P
0
5
10
15
20
25
0
2
4
6
8
0 5 10 15 20 25 30
NPS
H[ft
]
NPS
H[m
]
Q [m3/h]
A026
7_A_
CH
20%
min
SMB20…/5VME02P05
0 10 20 30 40 50 60
0.0 0.5 1.0 1.5 2.0 2.5 3.0 3.5 4.0 4.5 5.0
Q [Imp gpm]
Q [l/s]
0 10 20 30 40 50 60 70
0
20
40
60
80
100
120
0
5
10
15
20
25
30
35
40Q [US gpm]
H [ft
]
H[m
]
max
80%
60%
40%
max
80%
60%
40%
max
80%
60%
40%
max
80%
60%
40%
max curve 2P
0
5
10
15
20
25
0
2
4
6
8
0 2 4 6 8 10 12 14 16 18
NPS
H[ft
]
NPS
H[m
]
Q [m3/h]
A026
6_A_
CH
20%
min
SMB.../VME BOOSTER SETS SERIESOPERATING CHARACTERISTICS
The performance curves do not take into account flow resistance in the valves and piping. The curves show the performance with one, two and three pumps running.These performances are valid for liquids with density ρ = 1 Kg/dm3 and kinematic viscosity ν = 1 mm2/sec.The declared NPSH values are laboratory values; for practical use we recommend increasing these values by 0,5 m.
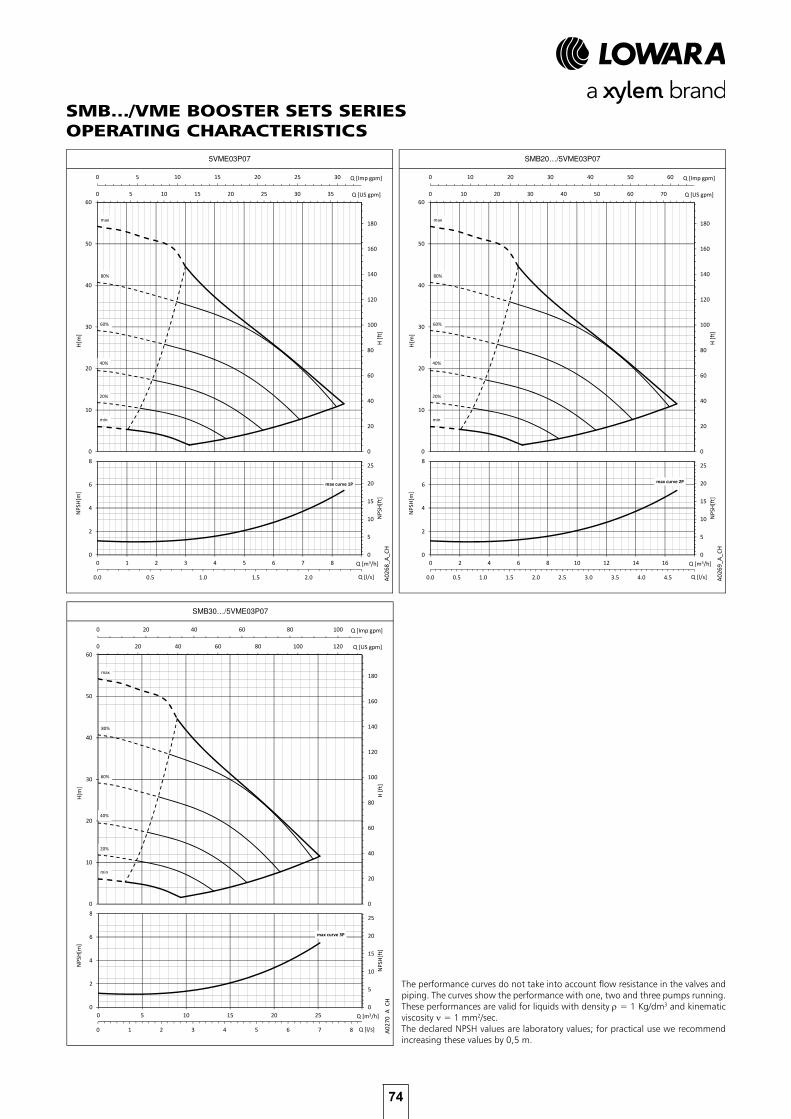
74
5VME03P07
0 5 10 15 20 25 30
0.0 0.5 1.0 1.5 2.0 2.5
Q [Imp gpm]
Q [l/s]
0 5 10 15 20 25 30 35
0
20
40
60
80
100
120
140
160
180
0
10
20
30
40
50
60Q [US gpm]
H [ft
]
H[m
]
max
80%
60%
40%
max
80%
60%
40%
max
80%
60%
40%
max
80%
60%
40%
max curve 1P
0
5
10
15
20
25
0
2
4
6
8
0 1 2 3 4 5 6 7 8 9
NPS
H[ft
]
NPS
H[m
]
Q [m3/h]
A026
8_A_
CH
20%
min
SMB30…/5VME03P07
0 20 40 60 80 100
0 1 2 3 4 5 6 7 8
Q [Imp gpm]
Q [l/s]
0 20 40 60 80 100 120
0
20
40
60
80
100
120
140
160
180
0
10
20
30
40
50
60Q [US gpm]
H [ft
]
H[m
]
max
80%
60%
40%
max
80%
60%
40%
max
80%
60%
40%
max
80%
60%
40%
max curve 3P
0
5
10
15
20
25
0
2
4
6
8
0 5 10 15 20 25 30
NPS
H[ft
]
NPS
H[m
]
Q [m3/h]
A027
0_A_
CH
20%
min
SMB20…/5VME03P07
0 10 20 30 40 50 60
0.0 0.5 1.0 1.5 2.0 2.5 3.0 3.5 4.0 4.5 5.0
Q [Imp gpm]
Q [l/s]
0 10 20 30 40 50 60 70
0
20
40
60
80
100
120
140
160
180
0
10
20
30
40
50
60Q [US gpm]
H [ft
]
H[m
]
max
80%
60%
40%
max
80%
60%
40%
max
80%
60%
40%
max
80%
60%
40%
max curve 2P
0
5
10
15
20
25
0
2
4
6
8
0 2 4 6 8 10 12 14 16 18
NPS
H[ft
]
NPS
H[m
]
Q [m3/h]
A026
9_A_
CH
20%
min
SMB.../VME BOOSTER SETS SERIESOPERATING CHARACTERISTICS
The performance curves do not take into account flow resistance in the valves and piping. The curves show the performance with one, two and three pumps running.These performances are valid for liquids with density ρ = 1 Kg/dm3 and kinematic viscosity ν = 1 mm2/sec.The declared NPSH values are laboratory values; for practical use we recommend increasing these values by 0,5 m.

75
5VME04P11
0 5 10 15 20 25 30
0.0 0.5 1.0 1.5 2.0 2.5
Q [Imp gpm]
Q [l/s]
0 5 10 15 20 25 30 35
0
50
100
150
200
250
0
10
20
30
40
50
60
70
80Q [US gpm]
H [ft
]
H[m
]
max
80%
60%
40%
max
80%
60%
40%
max
80%
60%
40%
max
80%
60%
40%
max curve 1P
0
5
10
15
20
25
0
2
4
6
8
0 1 2 3 4 5 6 7 8 9
NPS
H[ft
]
NPS
H[m
]
Q [m3/h]
A027
1_A_
CH
20%
min
SMB30…/5VME04P11
0 20 40 60 80 100
0 1 2 3 4 5 6 7 8
Q [Imp gpm]
Q [l/s]
0 20 40 60 80 100 120
0
50
100
150
200
250
0
10
20
30
40
50
60
70
80Q [US gpm]
H [ft
]
H[m
]
max
80%
60%
40%
max
80%
60%
40%
max
80%
60%
40%
max
80%
60%
40%
max curve 3P
0
5
10
15
20
25
0
2
4
6
8
0 5 10 15 20 25 30
NPS
H[ft
]
NPS
H[m
]
Q [m3/h]
A027
3_A_
CH
20%
min
SMB20…/5VME04P11
0 10 20 30 40 50 60
0.0 0.5 1.0 1.5 2.0 2.5 3.0 3.5 4.0 4.5 5.0
Q [Imp gpm]
Q [l/s]
0 10 20 30 40 50 60 70
0
50
100
150
200
250
0
10
20
30
40
50
60
70
80Q [US gpm]
H [ft
]
H[m
]
max
80%
60%
40%
max
80%
60%
40%
max
80%
60%
40%
max
80%
60%
40%
max curve 2P
0
5
10
15
20
25
0
2
4
6
8
0 2 4 6 8 10 12 14 16 18
NPS
H[ft
]
NPS
H[m
]
Q [m3/h]
A027
2_A_
CH
20%
min
SMB.../VME BOOSTER SETS SERIESOPERATING CHARACTERISTICS
The performance curves do not take into account flow resistance in the valves and piping. The curves show the performance with one, two and three pumps running.These performances are valid for liquids with density ρ = 1 Kg/dm3 and kinematic viscosity ν = 1 mm2/sec.The declared NPSH values are laboratory values; for practical use we recommend increasing these values by 0,5 m.

76
5VME05P15
0 5 10 15 20 25 30
0.0 0.5 1.0 1.5 2.0 2.5
Q [Imp gpm]
Q [l/s]
0 5 10 15 20 25 30 35
0
50
100
150
200
250
300
0
10
20
30
40
50
60
70
80
90
100Q [US gpm]
H [ft
]
H[m
]
max
80%
60%
40%
max
80%
60%
40%
max
80%
60%
40%
max
80%
60%
40%
max curve 1P
0
5
10
15
20
25
0
2
4
6
8
0 1 2 3 4 5 6 7 8 9
NPS
H[ft
]
NPS
H[m
]
Q [m3/h]
A027
4_A_
CH
20%
min
SMB30…/5VME05P15
0 20 40 60 80 100
0 1 2 3 4 5 6 7 8
Q [Imp gpm]
Q [l/s]
0 20 40 60 80 100 120
0
50
100
150
200
250
300
0
10
20
30
40
50
60
70
80
90
100Q [US gpm]
H [ft
]
H[m
]
max
80%
60%
40%
max
80%
60%
40%
max
80%
60%
40%
max
80%
60%
40%
max curve 3P
0
5
10
15
20
25
0
2
4
6
8
0 5 10 15 20 25 30
NPS
H[ft
]
NPS
H[m
]
Q [m3/h]
A027
6_A_
CH
20%
min
SMB20…/5VME05P15
0 10 20 30 40 50 60
0.0 0.5 1.0 1.5 2.0 2.5 3.0 3.5 4.0 4.5 5.0
Q [Imp gpm]
Q [l/s]
0 10 20 30 40 50 60 70
0
50
100
150
200
250
300
0
10
20
30
40
50
60
70
80
90
100Q [US gpm]
H [ft
]
H[m
]
max
80%
60%
40%
max
80%
60%
40%
max
80%
60%
40%
max
80%
60%
40%
max curve 2P
0
5
10
15
20
25
0
2
4
6
8
0 2 4 6 8 10 12 14 16 18
NPS
H[ft
]
NPS
H[m
]
Q [m3/h]
A027
5_A_
CH
20%
min
SMB.../VME BOOSTER SETS SERIESOPERATING CHARACTERISTICS
The performance curves do not take into account flow resistance in the valves and piping. The curves show the performance with one, two and three pumps running.These performances are valid for liquids with density ρ = 1 Kg/dm3 and kinematic viscosity ν = 1 mm2/sec.The declared NPSH values are laboratory values; for practical use we recommend increasing these values by 0,5 m.

77
10VME01P07
0 10 20 30 40 50 60
0.0 0.5 1.0 1.5 2.0 2.5 3.0 3.5 4.0 4.5 5.0
Q [Imp gpm]
Q [l/s]
0 10 20 30 40 50 60 70
0
10
20
30
40
50
60
70
0
2
4
6
8
10
12
14
16
18
20
22
24Q [US gpm]
H [ft
]
H[m
]
max
80%
60%
40%
max curve 1P
0
5
10
15
20
25
0
2
4
6
8
0 2 4 6 8 10 12 14 16 18
NPS
H[ft
]
NPS
H[m
]
Q [m3/h]
A027
7_A_
CH20%
min
SMB30…/10VME01P07
0 50 100 150 200
0 2 4 6 8 10 12 14 16
Q [Imp gpm]
Q [l/s]
0 50 100 150 200 250
0
10
20
30
40
50
60
70
0
2
4
6
8
10
12
14
16
18
20
22
24Q [US gpm]
H [ft
]
H[m
]
max
80%
60%
40%
max curve 3P
0
5
10
15
20
25
0
2
4
6
8
0 10 20 30 40 50 60
NPS
H[ft
]
NPS
H[m
]
Q [m3/h]
A027
9_A_
CH
20%
min
SMB20…/10VME01P07
0 20 40 60 80 100 120 140
0 2 4 6 8 10
Q [Imp gpm]
Q [l/s]
0 20 40 60 80 100 120 140 160
0
10
20
30
40
50
60
70
0
2
4
6
8
10
12
14
16
18
20
22
24Q [US gpm]
H [ft
]
H[m
]
max
80%
60%
40%
max curve 2P
0
5
10
15
20
25
0
2
4
6
8
0 5 10 15 20 25 30 35 40
NPS
H[ft
]
NPS
H[m
]
Q [m3/h]
A027
8_A_
CH
20%
min
SMB.../VME BOOSTER SETS SERIESOPERATING CHARACTERISTICS
The performance curves do not take into account flow resistance in the valves and piping. The curves show the performance with one, two and three pumps running.These performances are valid for liquids with density ρ = 1 Kg/dm3 and kinematic viscosity ν = 1 mm2/sec.The declared NPSH values are laboratory values; for practical use we recommend increasing these values by 0,5 m.
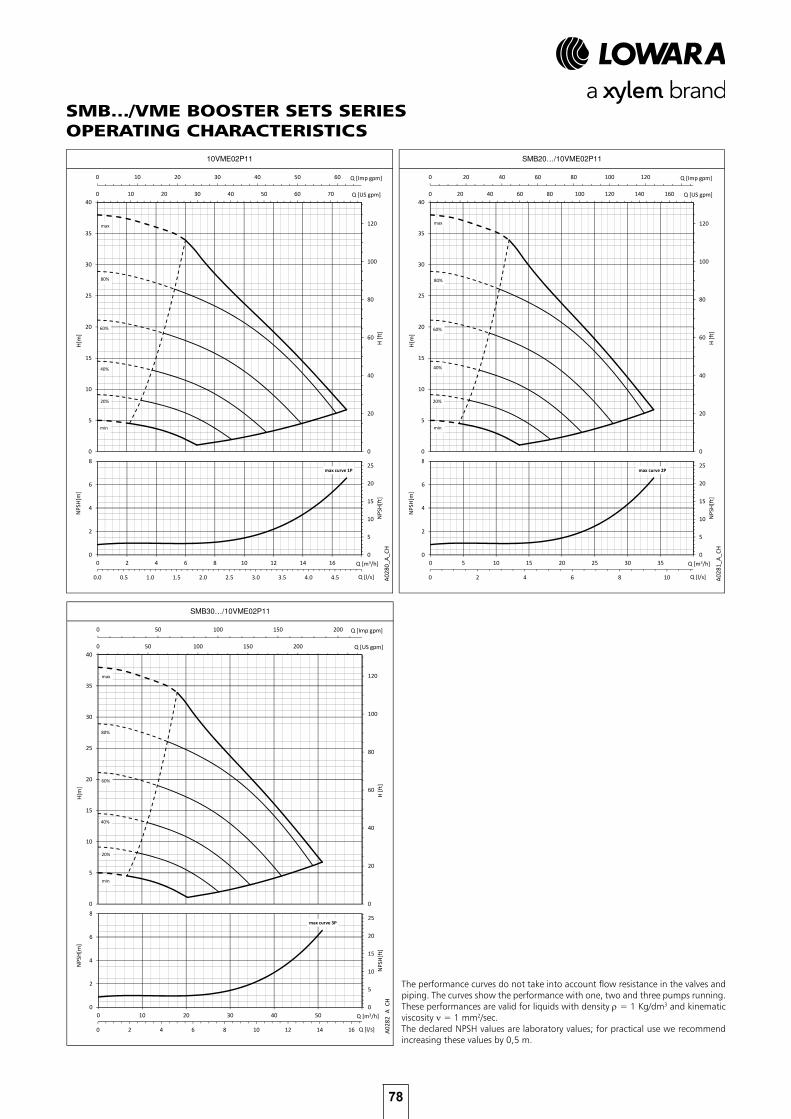
78
10VME02P11
0 10 20 30 40 50 60
0.0 0.5 1.0 1.5 2.0 2.5 3.0 3.5 4.0 4.5 5.0
Q [Imp gpm]
Q [l/s]
0 10 20 30 40 50 60 70
0
20
40
60
80
100
120
0
5
10
15
20
25
30
35
40Q [US gpm]
H [ft
]
H[m
]
max
80%
60%
40%
max curve 1P
0
5
10
15
20
25
0
2
4
6
8
0 2 4 6 8 10 12 14 16 18
NPS
H[ft
]
NPS
H[m
]
Q [m3/h]
A028
0_A_
CH
20%
min
SMB30…/10VME02P11
0 50 100 150 200
0 2 4 6 8 10 12 14 16
Q [Imp gpm]
Q [l/s]
0 50 100 150 200 250
0
20
40
60
80
100
120
0
5
10
15
20
25
30
35
40Q [US gpm]
H [ft
]
H[m
]
max
80%
60%
40%
max curve 3P
0
5
10
15
20
25
0
2
4
6
8
0 10 20 30 40 50 60
NPS
H[ft
]
NPS
H[m
]
Q [m3/h]
A028
2_A_
CH
20%
min
SMB20…/10VME02P11
0 20 40 60 80 100 120 140
0 2 4 6 8 10
Q [Imp gpm]
Q [l/s]
0 20 40 60 80 100 120 140 160
0
20
40
60
80
100
120
0
5
10
15
20
25
30
35
40Q [US gpm]
H [ft
]
H[m
]
max
80%
60%
40%
max curve 2P
0
5
10
15
20
25
0
2
4
6
8
0 5 10 15 20 25 30 35 40
NPS
H[ft
]
NPS
H[m
]
Q [m3/h]
A028
1_A_
CH
20%
min
SMB.../VME BOOSTER SETS SERIESOPERATING CHARACTERISTICS
The performance curves do not take into account flow resistance in the valves and piping. The curves show the performance with one, two and three pumps running.These performances are valid for liquids with density ρ = 1 Kg/dm3 and kinematic viscosity ν = 1 mm2/sec.The declared NPSH values are laboratory values; for practical use we recommend increasing these values by 0,5 m.

79
1HME05S03
0 2 4 6 8 10
0.0 0.1 0.2 0.3 0.4 0.5 0.6 0.7 0.8
Q [Imp gpm]
Q [l/s]
0 2 4 6 8 10 12
0
20
40
60
80
100
120
140
160
0
5
10
15
20
25
30
35
40
45
50Q [US gpm]
H [ft
]
H[m
]
max
80%
60%
40%
max
80%
60%
40%
max
80%
60%
40%
max
80%
60%
40%
max curve 1P
0
5
10
15
20
25
0
2
4
6
8
0.0 0.5 1.0 1.5 2.0 2.5 3.0
NPS
H[ft
]
NPS
H[m
]
Q [m3/h]
A018
4_A_
CH
20%
min
SMB30…/1HME05S03
0 5 10 15 20 25 30
0.0 0.5 1.0 1.5 2.0 2.5
Q [Imp gpm]
Q [l/s]
0 5 10 15 20 25 30 35
0
20
40
60
80
100
120
140
160
0
5
10
15
20
25
30
35
40
45
50Q [US gpm]
H [ft
]
H[m
]
max
80%
60%
40%
max
80%
60%
40%
max
80%
60%
40%
max
80%
60%
40%
max curve 3P
0
5
10
15
20
25
0
2
4
6
8
0 1 2 3 4 5 6 7 8 9
NPS
H[ft
]
NPS
H[m
]
Q [m3/h]
A018
6_A_
CH
20%
min
SMB20…/1HME05S03
0 5 10 15 20
0.0 0.2 0.4 0.6 0.8 1.0 1.2 1.4 1.6
Q [Imp gpm]
Q [l/s]
0 5 10 15 20 25
0
20
40
60
80
100
120
140
160
0
5
10
15
20
25
30
35
40
45
50Q [US gpm]
H [ft
]
H[m
]
max
80%
60%
40%
max
80%
60%
40%
max
80%
60%
40%
max
80%
60%
40%
max curve 2P
0
5
10
15
20
25
0
2
4
6
8
0 1 2 3 4 5 6
NPS
H[ft
]
NPS
H[m
]
Q [m3/h]
A018
5_A_
CH
20%
min
SMB.../HME BOOSTER SETS SERIESOPERATING CHARACTERISTICS
The performance curves do not take into account flow resistance in the valves and piping. The curves show the performance with one, two and three pumps running.These performances are valid for liquids with density ρ = 1 Kg/dm3 and kinematic viscosity ν = 1 mm2/sec.The declared NPSH values are laboratory values; for practical use we recommend increasing these values by 0,5 m.

80
SMB.../HME BOOSTER SETS SERIESOPERATING CHARACTERISTICS
1HME08S05
0 2 4 6 8 10
0.0 0.1 0.2 0.3 0.4 0.5 0.6 0.7 0.8
Q [Imp gpm]
Q [l/s]
0 2 4 6 8 10 12
0
50
100
150
200
250
0
10
20
30
40
50
60
70
80Q [US gpm]
H [ft
]
H[m
]
max
80%
60%
40%
max
80%
60%
40%
max
80%
60%
40%
max
80%
60%
40%
max curve 1P
0
5
10
15
20
25
0
2
4
6
8
0.0 0.5 1.0 1.5 2.0 2.5 3.0
NPS
H[ft
]
NPS
H[m
]
Q [m3/h]
A018
7_A_
CH
20%
min
SMB30…/1HME08S05
0 5 10 15 20 25 30
0.0 0.5 1.0 1.5 2.0 2.5
Q [Imp gpm]
Q [l/s]
0 5 10 15 20 25 30 35
0
50
100
150
200
250
0
10
20
30
40
50
60
70
80Q [US gpm]
H [ft
]
H[m
]
max
80%
60%
40%
max
80%
60%
40%
max
80%
60%
40%
max
80%
60%
40%
max curve 3P
0
5
10
15
20
25
0
2
4
6
8
0 1 2 3 4 5 6 7 8 9
NPS
H[ft
]
NPS
H[m
]
Q [m3/h]
A018
9_A_
CH
20%
min
SMB20…/1HME08S05
0 5 10 15 20
0.0 0.2 0.4 0.6 0.8 1.0 1.2 1.4 1.6
Q [Imp gpm]
Q [l/s]
0 5 10 15 20 25
0
50
100
150
200
250
0
10
20
30
40
50
60
70
80Q [US gpm]
H [ft
]
H[m
]
max
80%
60%
40%
max
80%
60%
40%
max
80%
60%
40%
max
80%
60%
40%
max curve 2P
0
5
10
15
20
25
0
2
4
6
8
0 1 2 3 4 5 6
NPS
H[ft
]
NPS
H[m
]
Q [m3/h]
A018
8_A_
CH
20%
min
The performance curves do not take into account flow resistance in the valves and piping. The curves show the performance with one, two and three pumps running.These performances are valid for liquids with density ρ = 1 Kg/dm3 and kinematic viscosity ν = 1 mm2/sec.The declared NPSH values are laboratory values; for practical use we recommend increasing these values by 0,5 m.

81
SMB.../HME BOOSTER SETS SERIESOPERATING CHARACTERISTICS
1HME11S07
0 2 4 6 8 10
0.0 0.1 0.2 0.3 0.4 0.5 0.6 0.7 0.8
Q [Imp gpm]
Q [l/s]
0 2 4 6 8 10 12
0
50
100
150
200
250
300
0
10
20
30
40
50
60
70
80
90
100Q [US gpm]
H [ft
]
H[m
]
max
80%
60%
40%
max curve 1P
0
5
10
15
20
25
0
2
4
6
8
0.0 0.5 1.0 1.5 2.0 2.5 3.0
NPS
H[ft
]
NPS
H[m
]
Q [m3/h]
A019
0_A_
CH20%
min
SMB30…/1HME11S07
0 5 10 15 20 25 30
0.0 0.5 1.0 1.5 2.0 2.5
Q [Imp gpm]
Q [l/s]
0 5 10 15 20 25 30 35
0
50
100
150
200
250
300
0
10
20
30
40
50
60
70
80
90
100Q [US gpm]
H [ft
]
H[m
]
80%80%80%
max
80%
60%
40%
max curve 3P
0
5
10
15
20
25
0
2
4
6
8
0 1 2 3 4 5 6 7 8 9
NPS
H[ft
]
NPS
H[m
]
Q [m3/h]
A019
2_A_
CH
20%
min
SMB20…/1HME11S07
0 5 10 15 20
0.0 0.2 0.4 0.6 0.8 1.0 1.2 1.4 1.6
Q [Imp gpm]
Q [l/s]
0 5 10 15 20 25
0
50
100
150
200
250
300
0
10
20
30
40
50
60
70
80
90
100Q [US gpm]
H [ft
]H[m
]
80%
max
60%
40%
max curve 2P
0
5
10
15
20
25
0
2
4
6
8
0 1 2 3 4 5 6
NPS
H[ft
]
NPS
H[m
]
Q [m3/h]
A019
1_A_
CH
20%
min
The performance curves do not take into account flow resistance in the valves and piping. The curves show the performance with one, two and three pumps running.These performances are valid for liquids with density ρ = 1 Kg/dm3 and kinematic viscosity ν = 1 mm2/sec.The declared NPSH values are laboratory values; for practical use we recommend increasing these values by 0,5 m.

82
SMB.../HME BOOSTER SETS SERIESOPERATING CHARACTERISTICS
1HME15S11
0 2 4 6 8 10
0.0 0.1 0.2 0.3 0.4 0.5 0.6 0.7 0.8
Q [Imp gpm]
Q [l/s]
0 2 4 6 8 10 12
0
50
100
150
200
250
300
350
400
450
0
20
40
60
80
100
120
140Q [US gpm]
H [ft
]
H[m
]
maxmaxmaxmax
80%
60%
40%
max curve 1P
0
5
10
15
20
25
0
2
4
6
8
0.0 0.5 1.0 1.5 2.0 2.5 3.0
NPS
H[ft
]
NPS
H[m
]
Q [m3/h]
A019
3_A_
CH
20%
min
SMB30…/1HME15S11
0 5 10 15 20 25 30
0.0 0.5 1.0 1.5 2.0 2.5
Q [Imp gpm]
Q [l/s]
0 5 10 15 20 25 30 35
0
50
100
150
200
250
300
350
400
450
0
20
40
60
80
100
120
140Q [US gpm]
H [ft
]
H[m
]
maxmaxmaxmax
80%
60%
40%
max curve 3P
0
5
10
15
20
25
0
2
4
6
8
0 1 2 3 4 5 6 7 8 9
NPS
H[ft
]
NPS
H[m
]
Q [m3/h]
A019
5_A_
CH
20%
min
SMB20…/1HME15S11
0 5 10 15 20
0.0 0.2 0.4 0.6 0.8 1.0 1.2 1.4 1.6
Q [Imp gpm]
Q [l/s]
0 5 10 15 20 25
0
50
100
150
200
250
300
350
400
450
0
20
40
60
80
100
120
140Q [US gpm]
H [ft
]
H[m
]
maxmaxmaxmax
80%
60%
40%
max curve 2P
0
5
10
15
20
25
0
2
4
6
8
0 1 2 3 4 5 6
NPS
H[ft
]
NPS
H[m
]
Q [m3/h]
A019
4_A_
CH
20%
min
The performance curves do not take into account flow resistance in the valves and piping. The curves show the performance with one, two and three pumps running.These performances are valid for liquids with density ρ = 1 Kg/dm3 and kinematic viscosity ν = 1 mm2/sec.The declared NPSH values are laboratory values; for practical use we recommend increasing these values by 0,5 m.

83
SMB.../HME BOOSTER SETS SERIESOPERATING CHARACTERISTICS
1HME17S15
0 2 4 6 8 10
0.0 0.1 0.2 0.3 0.4 0.5 0.6 0.7 0.8
Q [Imp gpm]
Q [l/s]
0 2 4 6 8 10 12
0
100
200
300
400
500
0
20
40
60
80
100
120
140
160Q [US gpm]
H [ft
]
H[m
]
max
80%
60%
40%
max curve 1P
0
5
10
15
20
25
0
2
4
6
8
0.0 0.5 1.0 1.5 2.0 2.5 3.0
NPS
H[ft
]
NPS
H[m
]
Q [m3/h]
A019
6_A_
CH20%
min
SMB30…/1HME17S15
0 5 10 15 20 25 30
0.0 0.5 1.0 1.5 2.0 2.5
Q [Imp gpm]
Q [l/s]
0 5 10 15 20 25 30 35
0
100
200
300
400
500
0
20
40
60
80
100
120
140
160Q [US gpm]
H [ft
]
H[m
]
60%
max
80%
40%
max curve 3P
0
5
10
15
20
25
0
2
4
6
8
0 1 2 3 4 5 6 7 8 9
NPS
H[ft
]
NPS
H[m
]
Q [m3/h]
A019
8_A_
CH
20%
min
SMB20…/1HME17S15
0 5 10 15 20
0.0 0.2 0.4 0.6 0.8 1.0 1.2 1.4 1.6
Q [Imp gpm]
Q [l/s]
0 5 10 15 20 25
0
100
200
300
400
500
0
20
40
60
80
100
120
140
160Q [US gpm]
H [ft
]
H[m
]
max
80%
60%
40%
max curve 2P
0
5
10
15
20
25
0
2
4
6
8
0 1 2 3 4 5 6
NPS
H[ft
]
NPS
H[m
]
Q [m3/h]
A019
7_A_
CH
20%
min
The performance curves do not take into account flow resistance in the valves and piping. The curves show the performance with one, two and three pumps running.These performances are valid for liquids with density ρ = 1 Kg/dm3 and kinematic viscosity ν = 1 mm2/sec.The declared NPSH values are laboratory values; for practical use we recommend increasing these values by 0,5 m.

84
SMB.../HME BOOSTER SETS SERIESOPERATING CHARACTERISTICS
3HME03S03
0 5 10 15 20
0.0 0.2 0.4 0.6 0.8 1.0 1.2 1.4 1.6
Q [Imp gpm]
Q [l/s]
0 5 10 15 20 25
0
20
40
60
80
100
0
5
10
15
20
25
30
35Q [US gpm]
H [ft
]
H[m
]
maxmaxmaxmax
80%
60%
40%
max curve 1P
0
5
10
15
20
25
0
2
4
6
8
0 1 2 3 4 5 6
NPS
H[ft
]
NPS
H[m
]
Q [m3/h]
A019
9_A_
CH
20%
min
SMB30…/3HME03S03
0 10 20 30 40 50
0.0 0.5 1.0 1.5 2.0 2.5 3.0 3.5 4.0
Q [Imp gpm]
Q [l/s]
0 10 20 30 40 50 60 70
0
20
40
60
80
100
0
5
10
15
20
25
30
35Q [US gpm]
H [ft
]
H[m
]
maxmaxmaxmax
80%
60%
40%
max curve 3P
0
5
10
15
20
25
0
2
4
6
8
0 2 4 6 8 10 12 14 16
NPS
H[ft
]
NPS
H[m
]
Q [m3/h]
A020
1_A_
CH
20%
min
SMB20…/3HME03S03
0 5 10 15 20 25 30 35 40
0.0 0.5 1.0 1.5 2.0 2.5 3.0
Q [Imp gpm]
Q [l/s]
0 10 20 30 40 50
0
20
40
60
80
100
0
5
10
15
20
25
30
35Q [US gpm]
H [ft
]
H[m
]
maxmaxmaxmax
80%
60%
40%
max curve 2P
0
5
10
15
20
25
0
2
4
6
8
0 2 4 6 8 10 12
NPS
H[ft
]
NPS
H[m
]
Q [m3/h]
A020
0_A_
CH
20%
min
The performance curves do not take into account flow resistance in the valves and piping. The curves show the performance with one, two and three pumps running.These performances are valid for liquids with density ρ = 1 Kg/dm3 and kinematic viscosity ν = 1 mm2/sec.The declared NPSH values are laboratory values; for practical use we recommend increasing these values by 0,5 m.
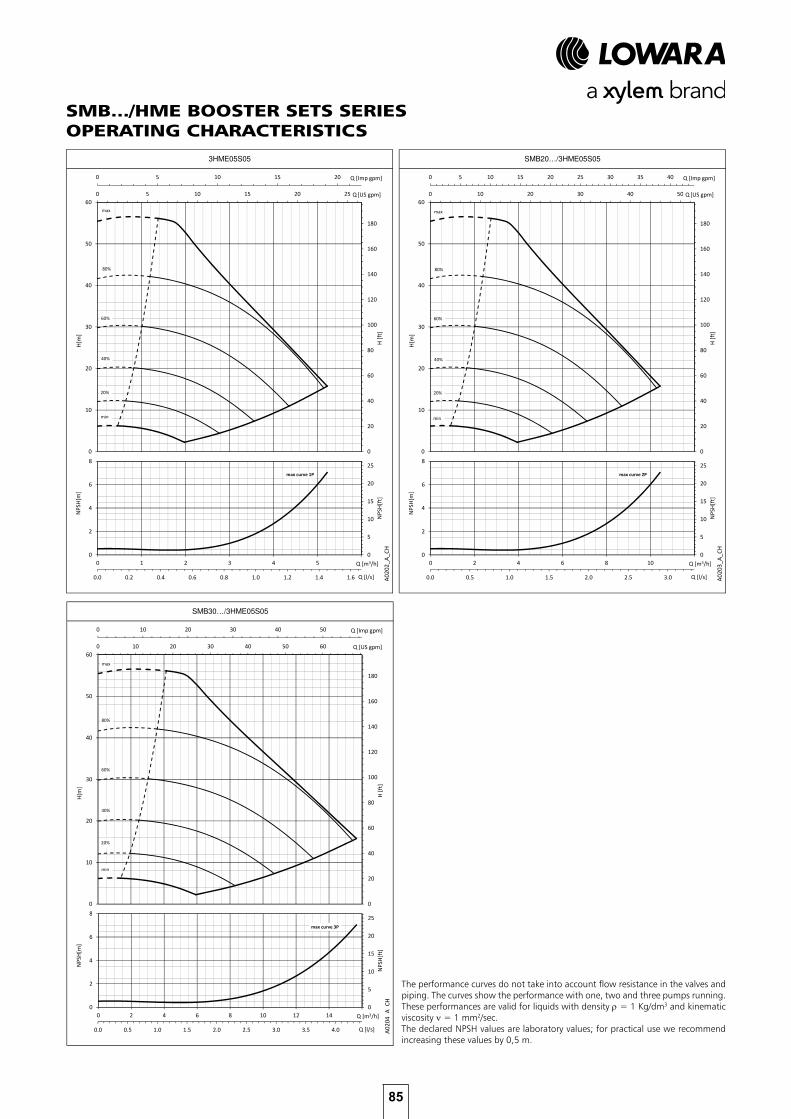
85
3HME05S05
0 5 10 15 20
0.0 0.2 0.4 0.6 0.8 1.0 1.2 1.4 1.6
Q [Imp gpm]
Q [l/s]
0 5 10 15 20 25
0
20
40
60
80
100
120
140
160
180
0
10
20
30
40
50
60Q [US gpm]
H [ft
]
H[m
]
max
80%
60%
40%
max curve 1P
0
5
10
15
20
25
0
2
4
6
8
0 1 2 3 4 5 6
NPS
H[ft
]
NPS
H[m
]
Q [m3/h]
A020
2_A_
CH20%
min
SMB30…/3HME05S05
0 10 20 30 40 50
0.0 0.5 1.0 1.5 2.0 2.5 3.0 3.5 4.0
Q [Imp gpm]
Q [l/s]
0 10 20 30 40 50 60 70
0
20
40
60
80
100
120
140
160
180
0
10
20
30
40
50
60Q [US gpm]
H [ft
]
H[m
]
max
80%
60%
40%
max curve 3P
0
5
10
15
20
25
0
2
4
6
8
0 2 4 6 8 10 12 14 16
NPS
H[ft
]
NPS
H[m
]
Q [m3/h]
A020
4_A_
CH
20%
min
SMB20…/3HME05S05
0 5 10 15 20 25 30 35 40
0.0 0.5 1.0 1.5 2.0 2.5 3.0
Q [Imp gpm]
Q [l/s]
0 10 20 30 40 50
0
20
40
60
80
100
120
140
160
180
0
10
20
30
40
50
60Q [US gpm]
H [ft
]
H[m
]
max
80%
60%
40%
max curve 2P
0
5
10
15
20
25
0
2
4
6
8
0 2 4 6 8 10 12
NPS
H[ft
]
NPS
H[m
]
Q [m3/h]
A020
3_A_
CH
20%
min
SMB.../HME BOOSTER SETS SERIESOPERATING CHARACTERISTICS
The performance curves do not take into account flow resistance in the valves and piping. The curves show the performance with one, two and three pumps running.These performances are valid for liquids with density ρ = 1 Kg/dm3 and kinematic viscosity ν = 1 mm2/sec.The declared NPSH values are laboratory values; for practical use we recommend increasing these values by 0,5 m.

86
3HME07S07
0 5 10 15 20
0.0 0.2 0.4 0.6 0.8 1.0 1.2 1.4 1.6
Q [Imp gpm]
Q [l/s]
0 5 10 15 20 25
0
50
100
150
200
250
0
10
20
30
40
50
60
70
80Q [US gpm]
H [ft
]
H[m
]
max
80%
max
80%
max
80%
max
80%
60%
40%
max curve 1P
0
5
10
15
20
25
0
2
4
6
8
0 1 2 3 4 5 6
NPS
H[ft
]
NPS
H[m
]
Q [m3/h]
A020
5_A_
CH
20%
min
SMB30…/3HME07S07
0 10 20 30 40 50
0.0 0.5 1.0 1.5 2.0 2.5 3.0 3.5 4.0
Q [Imp gpm]
Q [l/s]
0 10 20 30 40 50 60 70
0
50
100
150
200
250
0
10
20
30
40
50
60
70
80Q [US gpm]
H [ft
]
H[m
]
max
80%
max
80%
max
80%
max
80%
60%
40%
max curve 3P
0
5
10
15
20
25
0
2
4
6
8
0 2 4 6 8 10 12 14 16
NPS
H[ft
]
NPS
H[m
]
Q [m3/h]
A020
7_A_
CH
20%
min
SMB20…/3HME07S07
0 5 10 15 20 25 30 35 40
0.0 0.5 1.0 1.5 2.0 2.5 3.0
Q [Imp gpm]
Q [l/s]
0 10 20 30 40 50
0
50
100
150
200
250
0
10
20
30
40
50
60
70
80Q [US gpm]
H [ft
]
H[m
]
max
80%
max
80%
max
80%
max
80%
60%
40%
max curve 2P
0
5
10
15
20
25
0
2
4
6
8
0 2 4 6 8 10 12
NPS
H[ft
]
NPS
H[m
]
Q [m3/h]
A020
6_A_
CH
20%
min
SMB.../HME BOOSTER SETS SERIESOPERATING CHARACTERISTICS
The performance curves do not take into account flow resistance in the valves and piping. The curves show the performance with one, two and three pumps running.These performances are valid for liquids with density ρ = 1 Kg/dm3 and kinematic viscosity ν = 1 mm2/sec.The declared NPSH values are laboratory values; for practical use we recommend increasing these values by 0,5 m.

87
3HME09S11
0 5 10 15 20
0.0 0.2 0.4 0.6 0.8 1.0 1.2 1.4 1.6
Q [Imp gpm]
Q [l/s]
0 5 10 15 20 25
0
50
100
150
200
250
300
350
0
20
40
60
80
100
120Q [US gpm]
H [ft
]
H[m
]
80%
60%
40%
80%
60%
40%
80%
60%
40%
max
80%
60%
40%
max curve 1P
0
5
10
15
20
25
0
2
4
6
8
0 1 2 3 4 5 6
NPS
H[ft
]
NPS
H[m
]
Q [m3/h]
A020
8_A_
CH
20%
min
SMB30…/3HME09S11
0 10 20 30 40 50
0.0 0.5 1.0 1.5 2.0 2.5 3.0 3.5 4.0
Q [Imp gpm]
Q [l/s]
0 10 20 30 40 50 60 70
0
50
100
150
200
250
300
350
0
20
40
60
80
100
120Q [US gpm]
H [ft
]
H[m
]
max
80%
60%
40%
max curve 3P
0
5
10
15
20
25
0
2
4
6
8
0 2 4 6 8 10 12 14 16
NPS
H[ft
]
NPS
H[m
]
Q [m3/h]
A021
0_A_
CH
20%
min
SMB20…/3HME09S11
0 5 10 15 20 25 30 35 40
0.0 0.5 1.0 1.5 2.0 2.5 3.0
Q [Imp gpm]
Q [l/s]
0 10 20 30 40 50
0
50
100
150
200
250
300
350
0
20
40
60
80
100
120Q [US gpm]
H [ft
]
H[m
]
max
80%
60%
40%
max curve 2P
0
5
10
15
20
25
0
2
4
6
8
0 2 4 6 8 10 12
NPS
H[ft
]
NPS
H[m
]
Q [m3/h]
A020
9_A_
CH
20%
min
SMB.../HME BOOSTER SETS SERIESOPERATING CHARACTERISTICS
The performance curves do not take into account flow resistance in the valves and piping. The curves show the performance with one, two and three pumps running.These performances are valid for liquids with density ρ = 1 Kg/dm3 and kinematic viscosity ν = 1 mm2/sec.The declared NPSH values are laboratory values; for practical use we recommend increasing these values by 0,5 m.
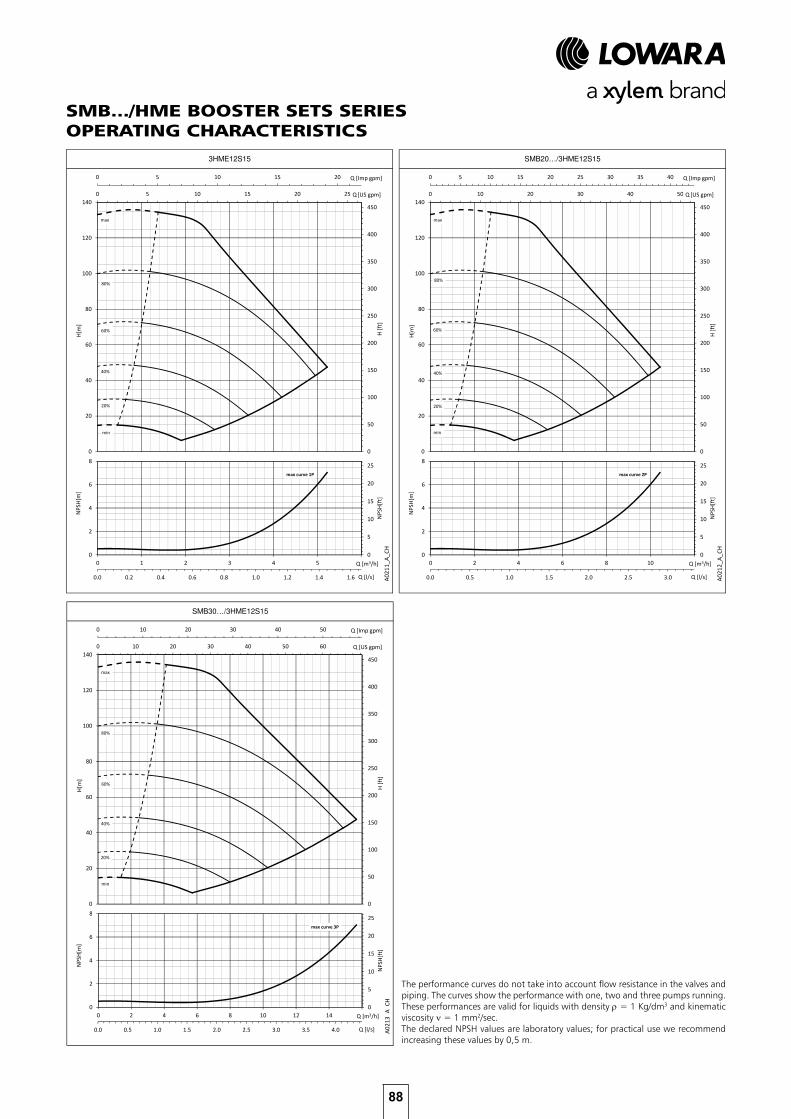
88
3HME12S15
0 5 10 15 20
0.0 0.2 0.4 0.6 0.8 1.0 1.2 1.4 1.6
Q [Imp gpm]
Q [l/s]
0 5 10 15 20 25
0
50
100
150
200
250
300
350
400
450
0
20
40
60
80
100
120
140Q [US gpm]
H [ft
]
H[m
]
maxmaxmaxmax
80%
60%
40%
max curve 1P
0
5
10
15
20
25
0
2
4
6
8
0 1 2 3 4 5 6
NPS
H[ft
]
NPS
H[m
]
Q [m3/h]
A021
1_A_
CH
20%
min
SMB30…/3HME12S15
0 10 20 30 40 50
0.0 0.5 1.0 1.5 2.0 2.5 3.0 3.5 4.0
Q [Imp gpm]
Q [l/s]
0 10 20 30 40 50 60 70
0
50
100
150
200
250
300
350
400
450
0
20
40
60
80
100
120
140Q [US gpm]
H [ft
]
H[m
]
maxmaxmaxmax
80%
60%
40%
max curve 3P
0
5
10
15
20
25
0
2
4
6
8
0 2 4 6 8 10 12 14 16
NPS
H[ft
]
NPS
H[m
]
Q [m3/h]
A021
3_A_
CH
20%
min
SMB20…/3HME12S15
0 5 10 15 20 25 30 35 40
0.0 0.5 1.0 1.5 2.0 2.5 3.0
Q [Imp gpm]
Q [l/s]
0 10 20 30 40 50
0
50
100
150
200
250
300
350
400
450
0
20
40
60
80
100
120
140Q [US gpm]
H [ft
]
H[m
]
maxmaxmaxmax
80%
60%
40%
max curve 2P
0
5
10
15
20
25
0
2
4
6
8
0 2 4 6 8 10 12
NPS
H[ft
]
NPS
H[m
]
Q [m3/h]
A021
2_A_
CH
20%
min
SMB.../HME BOOSTER SETS SERIESOPERATING CHARACTERISTICS
The performance curves do not take into account flow resistance in the valves and piping. The curves show the performance with one, two and three pumps running.These performances are valid for liquids with density ρ = 1 Kg/dm3 and kinematic viscosity ν = 1 mm2/sec.The declared NPSH values are laboratory values; for practical use we recommend increasing these values by 0,5 m.

89
5HME02S03
0 5 10 15 20 25 30 35 40
0.0 0.5 1.0 1.5 2.0 2.5 3.0
Q [Imp gpm]
Q [l/s]
0 10 20 30 40 50
0
10
20
30
40
50
60
70
0
4
8
12
16
20
24Q [US gpm]
H [ft
]
H[m
]
max
80%
60%
40%
0
5
10
15
0
2
4
6
0 2 4 6 8 10 12
NPS
H[ft
]
NPS
H[m
]
Q [m3/h]
A021
4_A_
CH
20%
min
max curve 1P
SMB30…/5HME02S03
0 20 40 60 80 100 120
0 1 2 3 4 5 6 7 8 9
Q [Imp gpm]
Q [l/s]
0 20 40 60 80 100 120 140
0
10
20
30
40
50
60
70
0
4
8
12
16
20
24Q [US gpm]
H [ft
]
H[m
]
max
80%
60%
40%
0
5
10
15
0
2
4
6
0 5 10 15 20 25 30 35
NPS
H[ft
]
NPS
H[m
]
Q [m3/h]
A021
6_A_
CH
20%
min
max curve 3P
SMB20…/5HME02S03
0 10 20 30 40 50 60 70 80 90
0.0 1.0 2.0 3.0 4.0 5.0 6.0
Q [Imp gpm]
Q [l/s]
0 20 40 60 80 100
0
10
20
30
40
50
60
70
0
2
4
6
8
10
12
14
16
18
20
22
24Q [US gpm]
H [ft
]
H[m
]
max
80%
60%
40%
0
5
10
15
0
2
4
6
0 5 10 15 20 25
NPS
H[ft
]
NPS
H[m
]
Q [m3/h]
A021
5_A_
CH
20%
min
max curve 2P
SMB.../HME BOOSTER SETS SERIESOPERATING CHARACTERISTICS
The performance curves do not take into account flow resistance in the valves and piping. The curves show the performance with one, two and three pumps running.These performances are valid for liquids with density ρ = 1 Kg/dm3 and kinematic viscosity ν = 1 mm2/sec.The declared NPSH values are laboratory values; for practical use we recommend increasing these values by 0,5 m.

90
5HME03S05
0 5 10 15 20 25 30 35 40
0.0 0.5 1.0 1.5 2.0 2.5 3.0
Q [Imp gpm]
Q [l/s]
0 10 20 30 40 50
0
20
40
60
80
100
0
5
10
15
20
25
30
35Q [US gpm]
H [ft
]
H[m
]
maxmaxmaxmax
80%
60%
40%
max curve 1P
0
5
10
15
0
2
4
6
0 2 4 6 8 10 12
NPS
H[ft
]
NPS
H[m
]
Q [m3/h]
A021
7_A_
CH
20%
min
SMB30…/5HME03S05
0 20 40 60 80 100 120
0 1 2 3 4 5 6 7 8 9
Q [Imp gpm]
Q [l/s]
0 20 40 60 80 100 120 140
0
20
40
60
80
100
0
5
10
15
20
25
30
35Q [US gpm]
H [ft
]
H[m
]
maxmaxmaxmax
80%
60%
40%
max curve 3P
0
5
10
15
0
2
4
6
0 5 10 15 20 25 30 35
NPS
H[ft
]
NPS
H[m
]
Q [m3/h]
A021
9_A_
CH
20%
min
SMB20…/5HME03S05
0 10 20 30 40 50 60 70 80 90
0 1 2 3 4 5 6
Q [Imp gpm]
Q [l/s]
0 20 40 60 80 100
0
20
40
60
80
100
0
5
10
15
20
25
30
35Q [US gpm]
H [ft
]
H[m
]
maxmaxmaxmax
80%
60%
40%
max curve 2P
0
5
10
15
0
2
4
6
0 5 10 15 20 25
NPS
H[ft
]
NPS
H[m
]
Q [m3/h]
A021
8_A_
CH
20%
min
SMB.../HME BOOSTER SETS SERIESOPERATING CHARACTERISTICS
The performance curves do not take into account flow resistance in the valves and piping. The curves show the performance with one, two and three pumps running.These performances are valid for liquids with density ρ = 1 Kg/dm3 and kinematic viscosity ν = 1 mm2/sec.The declared NPSH values are laboratory values; for practical use we recommend increasing these values by 0,5 m.
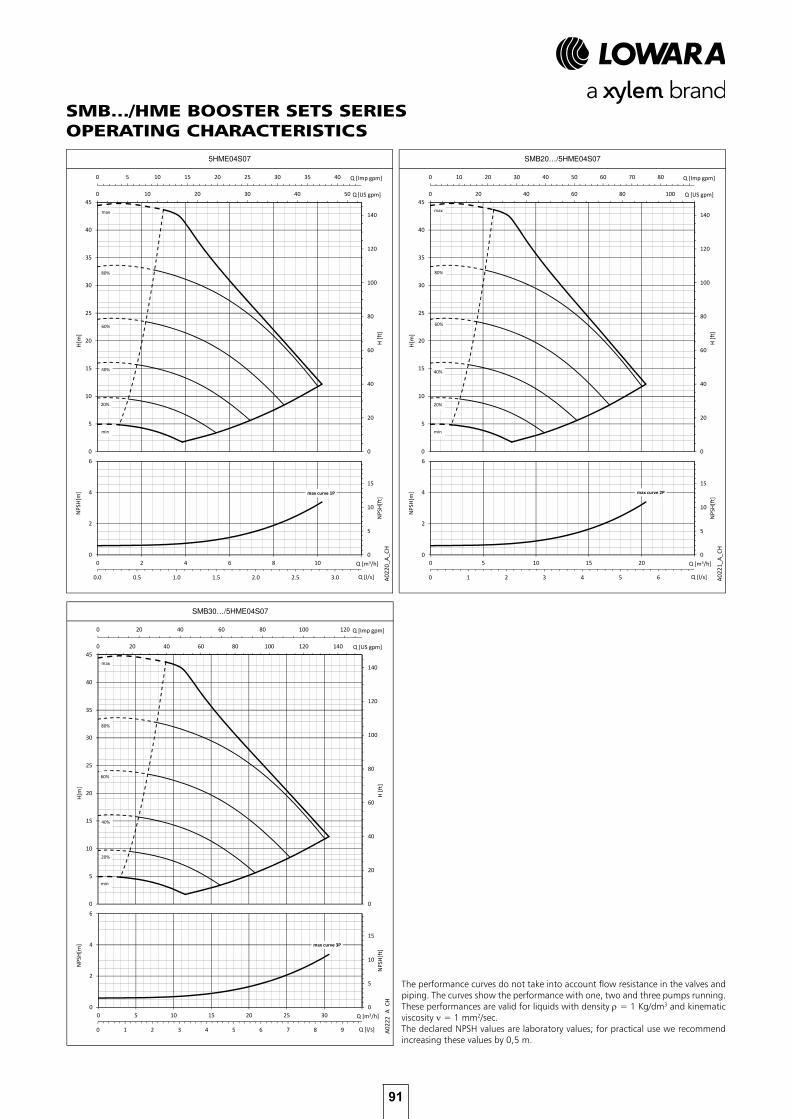
91
5HME04S07
0 5 10 15 20 25 30 35 40
0.0 0.5 1.0 1.5 2.0 2.5 3.0
Q [Imp gpm]
Q [l/s]
0 10 20 30 40 50
0
20
40
60
80
100
120
140
0
5
10
15
20
25
30
35
40
45Q [US gpm]
H [ft
]
H[m
]
max
80%
60%
40%
max curve 1P
0
5
10
15
0
2
4
6
0 2 4 6 8 10 12
NPS
H[ft
]
NPS
H[m
]
Q [m3/h]
A022
0_A_
CH
20%
min
SMB30…/5HME04S07
0 20 40 60 80 100 120
0 1 2 3 4 5 6 7 8 9
Q [Imp gpm]
Q [l/s]
0 20 40 60 80 100 120 140
0
20
40
60
80
100
120
140
0
5
10
15
20
25
30
35
40
45Q [US gpm]
H [ft
]
H[m
]
60%60%60%
max
80%
60%
40%
max curve 3P
0
5
10
15
0
2
4
6
0 5 10 15 20 25 30 35
NPS
H[ft
]
NPS
H[m
]
Q [m3/h]
A022
2_A_
CH
20%
min
SMB20…/5HME04S07
0 10 20 30 40 50 60 70 80 90
0 1 2 3 4 5 6
Q [Imp gpm]
Q [l/s]
0 20 40 60 80 100
0
20
40
60
80
100
120
140
0
5
10
15
20
25
30
35
40
45Q [US gpm]
H [ft
]
H[m
]
max
80%
60%
40%
max curve 2P
0
5
10
15
0
2
4
6
0 5 10 15 20 25
NPS
H[ft
]
NPS
H[m
]
Q [m3/h]
A022
1_A_
CH
20%
min
SMB.../HME BOOSTER SETS SERIESOPERATING CHARACTERISTICS
The performance curves do not take into account flow resistance in the valves and piping. The curves show the performance with one, two and three pumps running.These performances are valid for liquids with density ρ = 1 Kg/dm3 and kinematic viscosity ν = 1 mm2/sec.The declared NPSH values are laboratory values; for practical use we recommend increasing these values by 0,5 m.

92
5HME06S11
0 5 10 15 20 25 30 35 40
0.0 0.5 1.0 1.5 2.0 2.5 3.0
Q [Imp gpm]
Q [l/s]
0 10 20 30 40 50
0
50
100
150
200
0
10
20
30
40
50
60
70Q [US gpm]
H [ft
]
H[m
]
maxmaxmaxmax
80%
60%
40%
max curve 1P
0
5
10
15
0
2
4
6
0 2 4 6 8 10 12
NPS
H[ft
]
NPS
H[m
]
Q [m3/h]
A022
3_A_
CH
20%
min
SMB30…/5HME06S11
0 20 40 60 80 100 120
0 1 2 3 4 5 6 7 8 9
Q [Imp gpm]
Q [l/s]
0 20 40 60 80 100 120 140
0
50
100
150
200
0
10
20
30
40
50
60
70Q [US gpm]
H [ft
]
H[m
]
maxmaxmaxmax
80%
60%
40%
max curve 3P
0
5
10
15
0
2
4
6
0 5 10 15 20 25 30 35
NPS
H[ft
]
NPS
H[m
]
Q [m3/h]
A022
5_A_
CH
20%
min
SMB20…/5HME06S11
0 10 20 30 40 50 60 70 80 90
0 1 2 3 4 5 6
Q [Imp gpm]
Q [l/s]
0 20 40 60 80 100
0
50
100
150
200
0
10
20
30
40
50
60
70Q [US gpm]
H [ft
]
H[m
]
maxmaxmaxmax
80%
60%
40%
max curve 2P
0
5
10
15
0
2
4
6
0 5 10 15 20 25
NPS
H[ft
]
NPS
H[m
]
Q [m3/h]
A022
4_A_
CH
20%
min
SMB.../HME BOOSTER SETS SERIESOPERATING CHARACTERISTICS
The performance curves do not take into account flow resistance in the valves and piping. The curves show the performance with one, two and three pumps running.These performances are valid for liquids with density ρ = 1 Kg/dm3 and kinematic viscosity ν = 1 mm2/sec.The declared NPSH values are laboratory values; for practical use we recommend increasing these values by 0,5 m.

93
5HME08S15
0 5 10 15 20 25 30 35 40
0.0 0.5 1.0 1.5 2.0 2.5 3.0
Q [Imp gpm]
Q [l/s]
0 10 20 30 40 50
0
50
100
150
200
250
0
10
20
30
40
50
60
70
80
90Q [US gpm]
H [ft
]
H[m
]
80%
60%
80%
60%
80%
60%
max
80%
60%
40%
max curve 1P
0
5
10
15
0
2
4
6
0 2 4 6 8 10 12
NPS
H[ft
]
NPS
H[m
]
Q [m3/h]
A022
6_A_
CH
20%
min
SMB30…/5HME08S15
0 20 40 60 80 100 120
0 1 2 3 4 5 6 7 8 9
Q [Imp gpm]
Q [l/s]
0 20 40 60 80 100 120 140
0
50
100
150
200
250
0
10
20
30
40
50
60
70
80
90Q [US gpm]
H [ft
]
H[m
]
60%60%60%
max
80%
60%
40%
max curve 3P
0
5
10
15
0
2
4
6
0 5 10 15 20 25 30 35
NPS
H[ft
]
NPS
H[m
]
Q [m3/h]
A022
8_A_
CH
20%
min
SMB20…/5HME08S15
0 10 20 30 40 50 60 70 80 90
0 1 2 3 4 5 6
Q [Imp gpm]
Q [l/s]
0 20 40 60 80 100
0
50
100
150
200
250
0
10
20
30
40
50
60
70
80
90Q [US gpm]
H [ft
]
H[m
]
80%
60%
80%
60%
80%
60%
max
80%
60%
40%
max curve 2P
0
5
10
15
0
2
4
6
0 5 10 15 20 25
NPS
H[ft
]
NPS
H[m
]
Q [m3/h]
A022
7_A_
CH
20%
min
SMB.../HME BOOSTER SETS SERIESOPERATING CHARACTERISTICS
The performance curves do not take into account flow resistance in the valves and piping. The curves show the performance with one, two and three pumps running.These performances are valid for liquids with density ρ = 1 Kg/dm3 and kinematic viscosity ν = 1 mm2/sec.The declared NPSH values are laboratory values; for practical use we recommend increasing these values by 0,5 m.

94
SMB.../HME BOOSTER SETS SERIESOPERATING CHARACTERISTICS
10HME01S07
0 10 20 30 40 50 60
0.0 0.5 1.0 1.5 2.0 2.5 3.0 3.5 4.0 4.5 5.0
Q [Imp gpm]
Q [l/s]
0 10 20 30 40 50 60 70
0
10
20
30
40
50
0
2
4
6
8
10
12
14
16
18Q [US gpm]
H [ft
]
H[m
]
max
80%80%80%80%
60%
40%
max curve 1P
0
5
10
15
0
2
4
6
0 2 4 6 8 10 12 14 16 18
NPS
H[ft
]
NPS
H[m
]
Q [m3/h]
A022
9_A_
CH
20%
min
SMB30…/10HME01S07
0 50 100 150 200
0 2 4 6 8 10 12 14 16
Q [Imp gpm]
Q [l/s]
0 50 100 150 200 250
0
10
20
30
40
50
0
2
4
6
8
10
12
14
16
18Q [US gpm]
H [ft
]
H[m
]
max
80%
max
80%
max
80%
max
80%
60%
40%
max curve 3P
0
5
10
15
0
2
4
6
0 10 20 30 40 50 60
NPS
H[ft
]
NPS
H[m
]
Q [m3/h]
A023
1_A_
CH
20%
min
SMB20…/10HME01S07
0 20 40 60 80 100 120
0 1 2 3 4 5 6 7 8 9
Q [Imp gpm]
Q [l/s]
0 20 40 60 80 100 120 140
0
10
20
30
40
50
0
2
4
6
8
10
12
14
16
18Q [US gpm]
H [ft
]
H[m
]
max
80%
max
80%
max
80%
max
80%
60%
40%
max curve 2P
0
5
10
15
0
2
4
6
0 5 10 15 20 25 30 35
NPS
H[ft
]
NPS
H[m
]
Q [m3/h]
A023
0_A_
CH
20%
min
The performance curves do not take into account flow resistance in the valves and piping. The curves show the performance with one, two and three pumps running.These performances are valid for liquids with density ρ = 1 Kg/dm3 and kinematic viscosity ν = 1 mm2/sec.The declared NPSH values are laboratory values; for practical use we recommend increasing these values by 0,5 m.
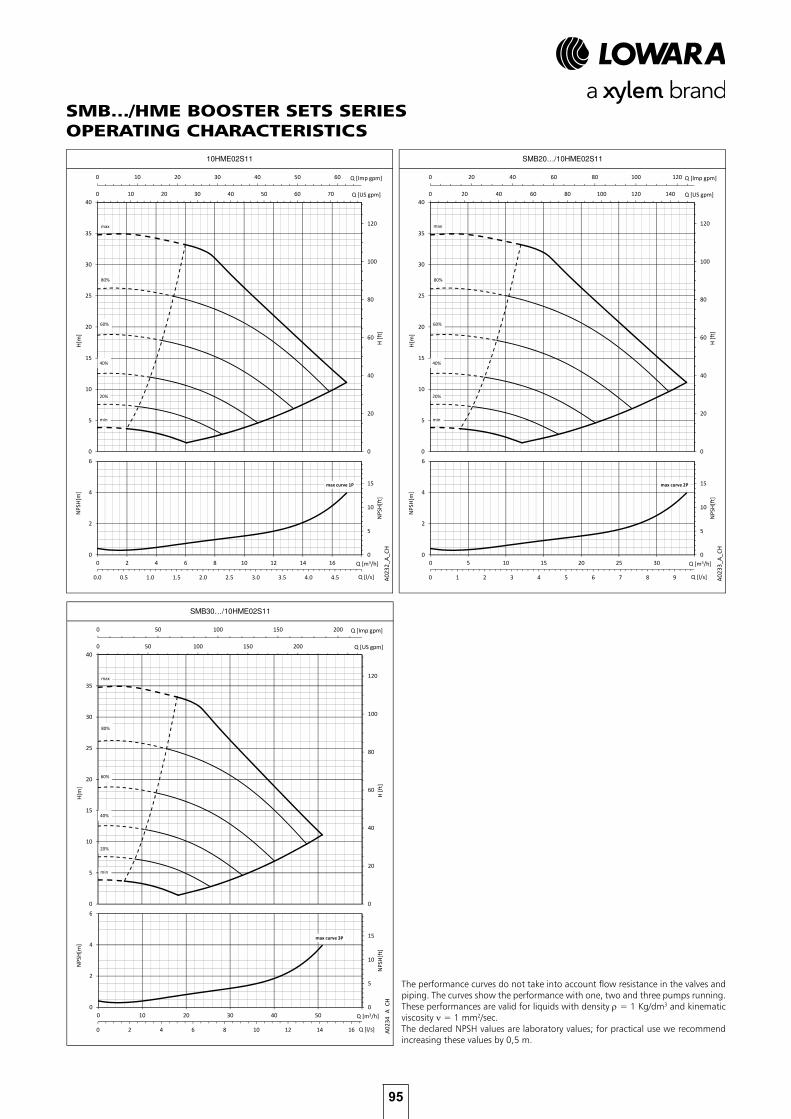
95
SMB.../HME BOOSTER SETS SERIESOPERATING CHARACTERISTICS
10HME02S11
0 10 20 30 40 50 60
0.0 0.5 1.0 1.5 2.0 2.5 3.0 3.5 4.0 4.5 5.0
Q [Imp gpm]
Q [l/s]
0 10 20 30 40 50 60 70
0
20
40
60
80
100
120
0
5
10
15
20
25
30
35
40Q [US gpm]
H [ft
]
H[m
]
60%
40%
60%
40%
60%
40%
max
80%
60%
40%
max curve 1P
0
5
10
15
0
2
4
6
0 2 4 6 8 10 12 14 16 18
NPS
H[ft
]
NPS
H[m
]
Q [m3/h]
A023
2_A_
CH
20%
min
SMB30…/10HME02S11
0 50 100 150 200
0 2 4 6 8 10 12 14 16
Q [Imp gpm]
Q [l/s]
0 50 100 150 200 250
0
20
40
60
80
100
120
0
5
10
15
20
25
30
35
40Q [US gpm]
H [ft
]
H[m
]
80%
60%
40%
80%
60%
40%
80%
60%
40%
max
80%
60%
40%
max curve 3P
0
5
10
15
0
2
4
6
0 10 20 30 40 50 60
NPS
H[ft
]
NPS
H[m
]
Q [m3/h]
A023
4_A_
CH
20%
min
SMB20…/10HME02S11
0 20 40 60 80 100 120
0 1 2 3 4 5 6 7 8 9
Q [Imp gpm]
Q [l/s]
0 20 40 60 80 100 120 140
0
20
40
60
80
100
120
0
5
10
15
20
25
30
35
40Q [US gpm]
H [ft
]
H[m
]
60%
40%
60%
40%
60%
40%
max
80%
60%
40%
max curve 2P
0
5
10
15
0
2
4
6
0 5 10 15 20 25 30 35
NPS
H[ft
]
NPS
H[m
]
Q [m3/h]
A023
3_A_
CH
20%
min
The performance curves do not take into account flow resistance in the valves and piping. The curves show the performance with one, two and three pumps running.These performances are valid for liquids with density ρ = 1 Kg/dm3 and kinematic viscosity ν = 1 mm2/sec.The declared NPSH values are laboratory values; for practical use we recommend increasing these values by 0,5 m.

96
SMB.../HME BOOSTER SETS SERIESOPERATING CHARACTERISTICS
10HME03S15
0 10 20 30 40 50 60
0.0 0.5 1.0 1.5 2.0 2.5 3.0 3.5 4.0 4.5 5.0
Q [Imp gpm]
Q [l/s]
0 10 20 30 40 50 60 70
0
20
40
60
80
100
120
140
160
180
0
10
20
30
40
50
60Q [US gpm]
H [ft
]
H[m
]
max
80%
60%
40%
max
80%
60%
40%
max
80%
60%
40%
max
80%
60%
40%
max curve 1P
0
5
10
15
0
2
4
6
0 2 4 6 8 10 12 14 16 18
NPS
H[ft
]
NPS
H[m
]
Q [m3/h]
A023
5_A_
CH
20%
min
SMB30…/10HME03S15
0 50 100 150 200
0 2 4 6 8 10 12 14 16
Q [Imp gpm]
Q [l/s]
0 50 100 150 200 250
0
20
40
60
80
100
120
140
160
180
0
10
20
30
40
50
60Q [US gpm]
H [ft
]
H[m
]
max
80%
60%
40%
max
80%
60%
40%
max
80%
60%
40%
max
80%
60%
40%
max curve 3P
0
5
10
15
0
2
4
6
0 10 20 30 40 50 60
NPS
H[ft
]
NPS
H[m
]
Q [m3/h]
A023
7_A_
CH
20%
min
SMB20…/10HME03S15
0 20 40 60 80 100 120
0 1 2 3 4 5 6 7 8 9
Q [Imp gpm]
Q [l/s]
0 20 40 60 80 100 120 140
0
20
40
60
80
100
120
140
160
180
0
10
20
30
40
50
60Q [US gpm]
H [ft
]
H[m
]
max
80%
60%
40%
max
80%
60%
40%
max
80%
60%
40%
max
80%
60%
40%
max curve 2P
0
5
10
15
20
0
2
4
6
0 5 10 15 20 25 30 35
NPS
H[ft
]
NPS
H[m
]
Q [m3/h]
A023
6_A_
CH
20%
min
The performance curves do not take into account flow resistance in the valves and piping. The curves show the performance with one, two and three pumps running.These performances are valid for liquids with density ρ = 1 Kg/dm3 and kinematic viscosity ν = 1 mm2/sec.The declared NPSH values are laboratory values; for practical use we recommend increasing these values by 0,5 m.
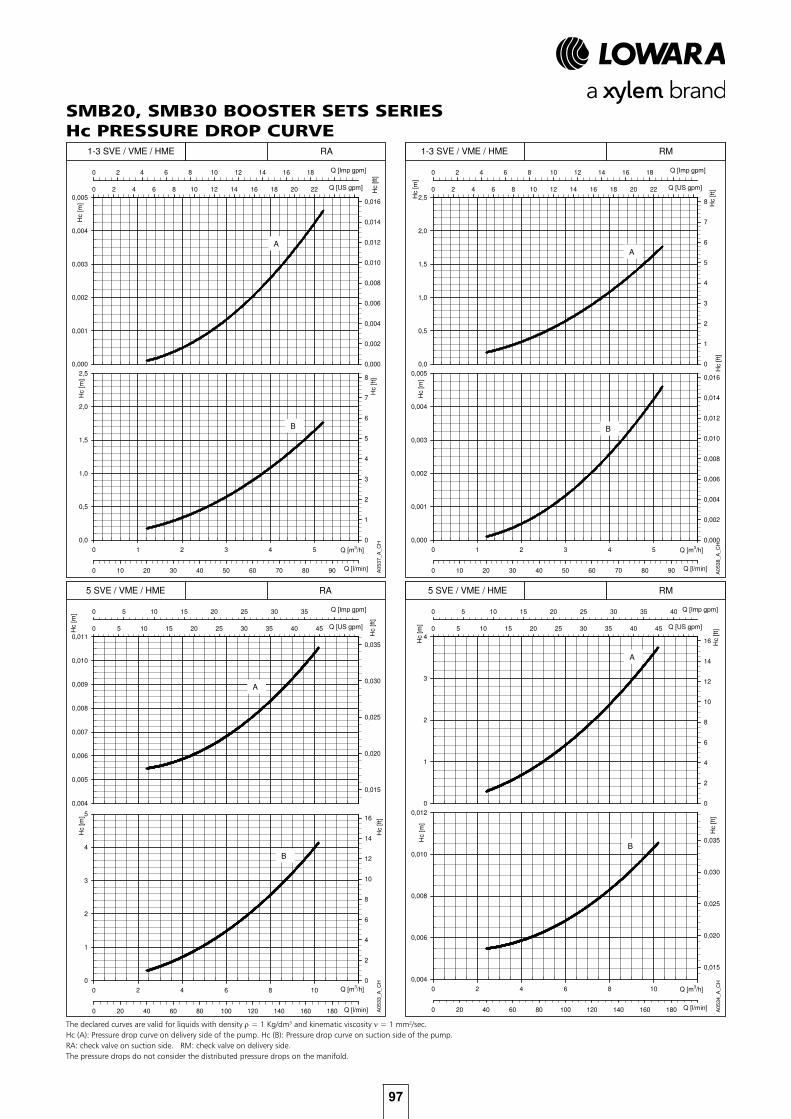
97
SMB20, SMB30 BOOSTER SETS SERIESHc PRESSURE DROP CURVE
The declared curves are valid for liquids with density ρ = 1 Kg/dm3 and kinematic viscosity ν = 1 mm2/sec.Hc (A): Pressure drop curve on delivery side of the pump. Hc (B): Pressure drop curve on suction side of the pump.RA: check valve on suction side. RM: check valve on delivery side.The pressure drops do not consider the distributed pressure drops on the manifold.
Hc [m
]
0,004
0,005
0,006
0,007
0,008
0,009
0,010
0,011
0 5 10 15 20 25 30 35 40 45 50
Hc [ft
]
0,015
0,020
0,025
0,030
0,035
0 5 10 15 20 25 30 35 40
Col 1 vs Col 2
Col 50 vs Col 51
Col 50 vs Col 51
0 2 4 6 8 10 12
Hc [m
]
0
1
2
3
4
5
0 20 40 60 80 100 120 140 160 180 200
Hc [ft
]
0
2
4
6
8
10
12
14
16
A05
33_
A_
CH
5 SVE / VME / HME
Q [m3/h]
Q [l/min]
Q [US gpm]
Q [Imp gpm]
A
B
RA
Hc [m
]
0
1
2
3
4
0 5 10 15 20 25 30 35 40 45 50
Hc [ft
]
0
2
4
6
8
10
12
14
16
0 5 10 15 20 25 30 35 40
Col 1 vs Col 2
Col 50 vs Col 51
Col 50 vs Col 51
0 2 4 6 8 10 12
Hc [m
]
0,004
0,006
0,008
0,010
0,012
0 20 40 60 80 100 120 140 160 180 200
Hc [ft
]
0,015
0,020
0,025
0,030
0,035
A05
34_
A_
CH
5 SVE / VME / HME
Q [m3/h]
Q [l/min]
Q [US gpm]
Q [Imp gpm]
A
B
RM
Hc [m
]
0,000
0,001
0,002
0,003
0,004
0,005
0 2 4 6 8 10 12 14 16 18 20 22 24 26 Hc [ft
]
0,000
0,002
0,004
0,006
0,008
0,010
0,012
0,014
0,016
0 2 4 6 8 10 12 14 16 18 20
Col 1 vs Col 2
Col 50 vs Col 51
Col 50 vs Col 51
0 1 2 3 4 5 6
Hc [m
]
0,0
0,5
1,0
1,5
2,0
2,5
0 10 20 30 40 50 60 70 80 90 100
Hc [ft]
0
1
2
3
4
5
6
7
8A
05
37_
A_
CH
Q [m3/h]
Q [l/min]
Q [US gpm]
Q [Imp gpm]
A
B
1-3 SVE / VME / HME RA
Hc [m
]
0,0
0,5
1,0
1,5
2,0
2,5
0 2 4 6 8 10 12 14 16 18 20 22 24 26
Hc [ft
]
0
1
2
3
4
5
6
7
8
0 2 4 6 8 10 12 14 16 18 20
Col 1 vs Col 2
Col 50 vs Col 51
Col 50 vs Col 51
0 1 2 3 4 5 6
Hc [m
]
0,000
0,001
0,002
0,003
0,004
0,005
0 10 20 30 40 50 60 70 80 90 100
Hc [ft
]
0,000
0,002
0,004
0,006
0,008
0,010
0,012
0,014
0,016
A053
8_
A_
CH
1-3 SVE / VME / HME
Q [m3/h]
Q [l/min]
Q [US gpm]
Q [Imp gpm]
A
B
RM
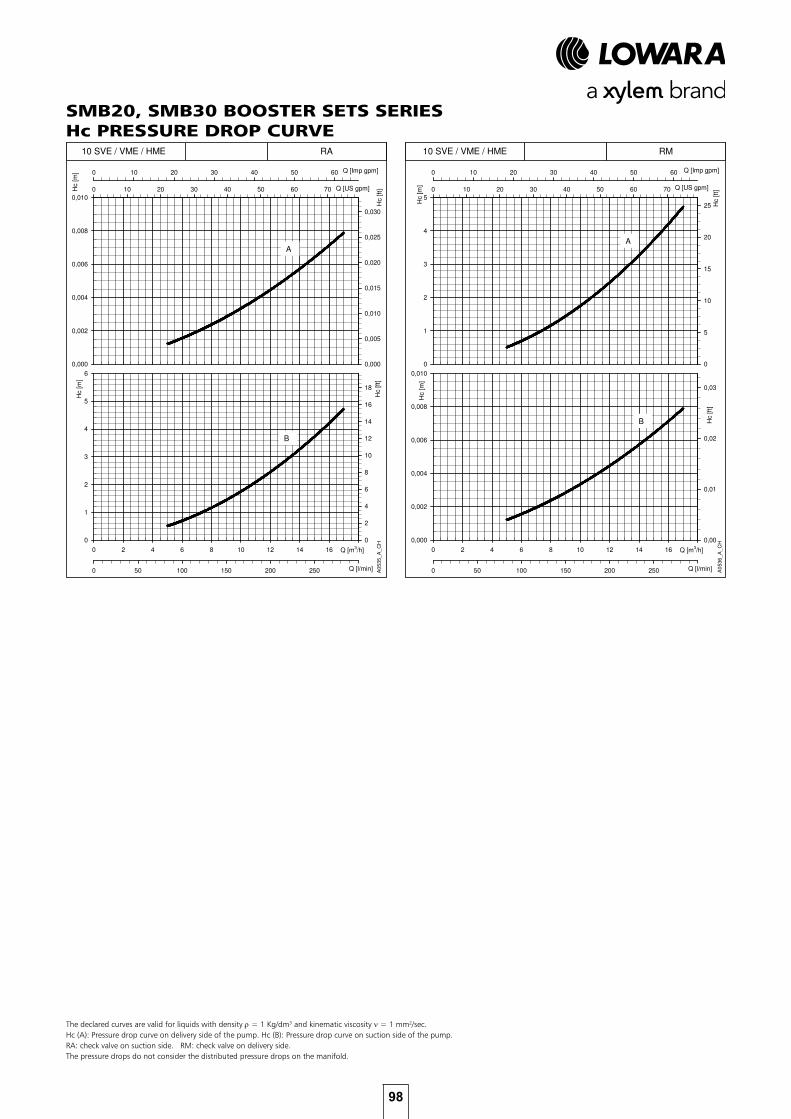
98
SMB20, SMB30 BOOSTER SETS SERIESHc PRESSURE DROP CURVE
The declared curves are valid for liquids with density ρ = 1 Kg/dm3 and kinematic viscosity ν = 1 mm2/sec.Hc (A): Pressure drop curve on delivery side of the pump. Hc (B): Pressure drop curve on suction side of the pump.RA: check valve on suction side. RM: check valve on delivery side.The pressure drops do not consider the distributed pressure drops on the manifold.
Hc [m
]
0,000
0,002
0,004
0,006
0,008
0,010
0 10 20 30 40 50 60 70
Hc [ft
]
0,000
0,005
0,010
0,015
0,020
0,025
0,030
0 10 20 30 40 50 60
Col 1 vs Col 2
Col 50 vs Col 51
Col 50 vs Col 51
0 2 4 6 8 10 12 14 16 18
Hc [m
]
0
1
2
3
4
5
6
0 50 100 150 200 250 300
Hc [ft
]
0
2
4
6
8
10
12
14
16
18
A05
35_
A_
CH
10 SVE / VME / HME
Q [m3/h]
Q [l/min]
Q [US gpm]
Q [Imp gpm]
A
B
RA
Hc [m
]
0
1
2
3
4
5
0 10 20 30 40 50 60 70
Hc [ft
]
0
5
10
15
20
25
0 10 20 30 40 50 60
Col 1 vs Col 2
Col 50 vs Col 51
Col 50 vs Col 51
0 2 4 6 8 10 12 14 16 18
Hc [m
]
0,000
0,002
0,004
0,006
0,008
0,010
0 50 100 150 200 250 300
Hc [ft
]
0,00
0,01
0,02
0,03
A053
6_
A_
CH
10 SVE / VME / HME
Q [m3/h]
Q [l/min]
Q [US gpm]
Q [Imp gpm]
A
B
RM

99
ACCESSORIES
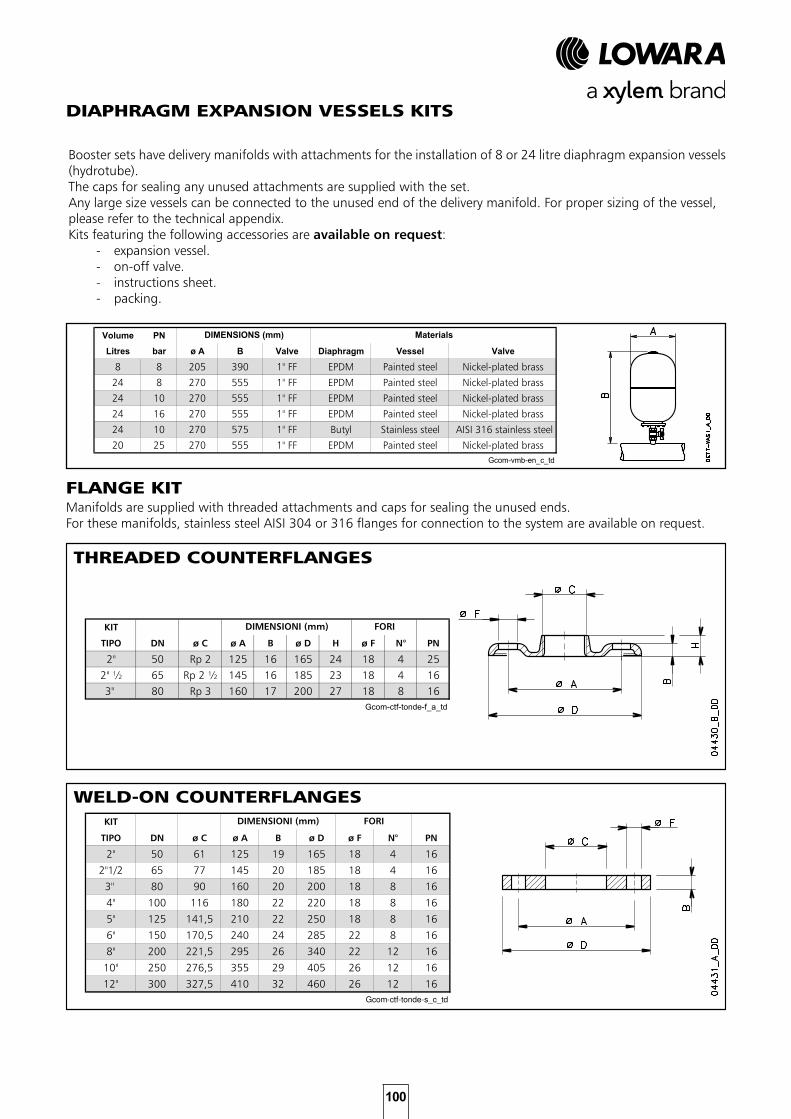
100
DIAPHRAGM EXPANSION VESSELS KITS
Booster sets have delivery manifolds with attachments for the installation of 8 or 24 litre diaphragm expansion vessels(hydrotube).The caps for sealing any unused attachments are supplied with the set. Any large size vessels can be connected to the unused end of the delivery manifold. For proper sizing of the vessel, please refer to the technical appendix.Kits featuring the following accessories are available on request:
- expansion vessel.- on-off valve.- instructions sheet.- packing.
FLANGE KIT
THREADED COUNTERFLANGES
WELD-ON COUNTERFLANGES
Manifolds are supplied with threaded attachments and caps for sealing the unused ends.For these manifolds, stainless steel AISI 304 or 316 flanges for connection to the system are available on request.
DIMENSIONI KIT VASI A MEMBRANA
Volume PN
Litres bar ø A B Valve Diaphragm Vessel Valve
8 8 205 390 1" FF EPDM Painted steel Nickel-plated brass
24 8 270 555 1" FF EPDM Painted steel Nickel-plated brass
24 10 270 555 1" FF EPDM Painted steel Nickel-plated brass
24 16 270 555 1" FF EPDM Painted steel Nickel-plated brass
24 10 270 575 1" FF Butyl Stainless steel AISI 316 stainless steel
20 25 270 555 1" FF EPDM Painted steel Nickel-plated brass Gcom-vmb-en_c_td
Compilato : Andrea CavaliereData : 24 Maggio 2006
MaterialsDIMENSIONS (mm)
DIMENSIONI KIT CONTROFLANGE TONDE FILETTATE
KIT
TIPO DN ø C ø A B ø D H ø F N° PN
2" 50 Rp 2 125 16 165 24 18 4 252" ½ 65 Rp 2 ½ 145 16 185 23 18 4 163" 80 Rp 3 160 17 200 27 18 8 16
Gcom-ctf-tonde-f_a_td
DIMENSIONI (mm) FORI
DIMENSIONI KIT CONTROFLANGE TONDE A SALDAREDIMENSIONI KIT CONTROFLANGE TONDE A SALDAREDIMENSIONI KIT CONTROFLANGE TONDE A SALDAREDIMENSIONI KIT CONTROFLANGE TONDE A SALDARE
KIT
TIPO DN ø C ø A B ø D ø F N° PN
2" 50 61 125 19 165 18 4 16
2"1/2 65 77 145 20 185 18 4 16
3" 80 90 160 20 200 18 8 16
4" 100 116 180 22 220 18 8 16
5" 125 141,5 210 22 250 18 8 16
6" 150 170,5 240 24 285 22 8 16
8" 200 221,5 295 26 340 22 12 16
10" 250 276,5 355 29 405 26 12 16
12" 300 327,5 410 32 460 26 12 16 Gcom-ctf-tonde-s_c_td
Denominazione : TABELLA DIMENSIONI KIT CONTROFLANGE TONDE a saldareCodice :Gcom-ctf-tonde-s_c_tdRevisione : BCompilato : Renzo SoffiaData : 02 Novembre 2005
DIMENSIONI (mm) FORI
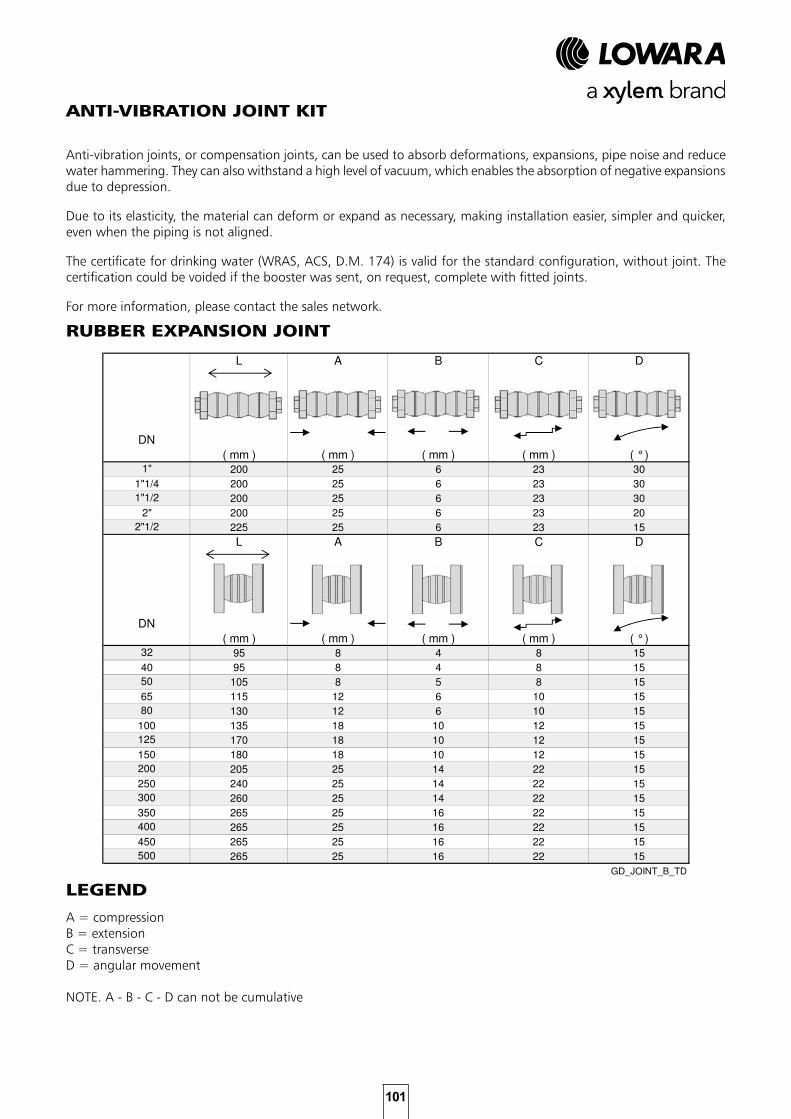
101
ANTI-VIBRATION JOINT KIT
Anti-vibration joints, or compensation joints, can be used to absorb deformations, expansions, pipe noise and reduce water hammering. They can also withstand a high level of vacuum, which enables the absorption of negative expansions due to depression.
Due to its elasticity, the material can deform or expand as necessary, making installation easier, simpler and quicker, even when the piping is not aligned.
The certificate for drinking water (WRAS, ACS, D.M. 174) is valid for the standard configuration, without joint. The certification could be voided if the booster was sent, on request, complete with fitted joints.
For more information, please contact the sales network.
L A B C D
( mm ) ( mm ) ( mm ) ( mm ) ( ° )
200 25 6 23 30
200 25 6 23 30
200 25 6 23 30
200 25 6 23 20
225 25 6 23 15
L A B C D
( mm ) ( mm ) ( mm ) ( mm ) ( ° )
95 8 4 8 15
95 8 4 8 15
105 8 5 8 15
115 12 6 10 15
130 12 6 10 15
135 18 10 12 15
170 18 10 12 15
180 18 10 12 15
205 25 14 22 15
240 25 14 22 15
260 25 14 22 15
265 25 16 22 15
265 25 16 22 15
265 25 16 22 15
265 25 16 22 15500
200
250
300
350
400
450
50
65
80
100
125
150
DN
.
GD_JOINT_B_TD
DN
.
1"
1"1/4
1"1/2
2"
2"1/2
32
40
A = compressionB = extensionC = transverseD = angular movement
NOTE. A - B - C - D can not be cumulative
RUBBER EXPANSION JOINT
LEGEND
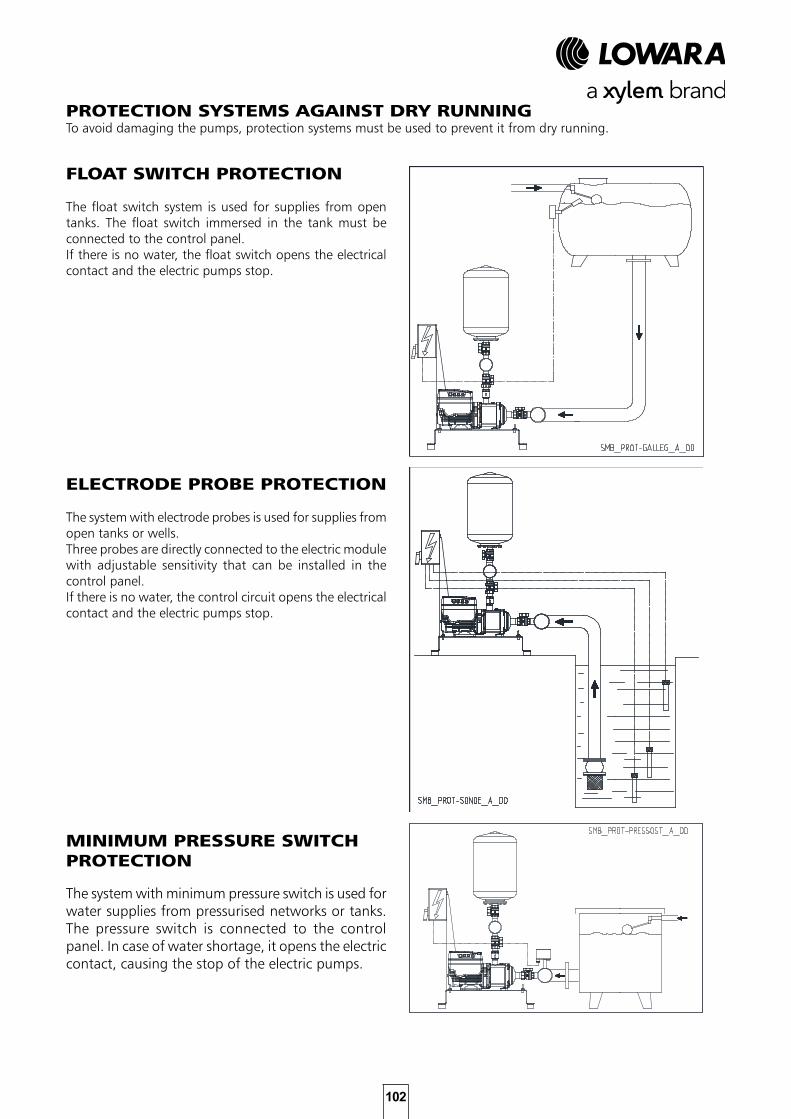
102
PROTECTION SYSTEMS AGAINST DRY RUNNINGTo avoid damaging the pumps, protection systems must be used to prevent it from dry running.
FLOAT SWITCH PROTECTION
The float switch system is used for supplies from open tanks. The float switch immersed in the tank must be connected to the control panel. If there is no water, the float switch opens the electrical contact and the electric pumps stop.
ELECTRODE PROBE PROTECTION
The system with electrode probes is used for supplies from open tanks or wells.Three probes are directly connected to the electric module with adjustable sensitivity that can be installed in the control panel.If there is no water, the control circuit opens the electrical contact and the electric pumps stop.
MINIMUM PRESSURE SWITCHPROTECTION
The system with minimum pressure switch is used for water supplies from pressurised networks or tanks. The pressure switch is connected to the control panel. In case of water shortage, it opens the electric contact, causing the stop of the electric pumps.
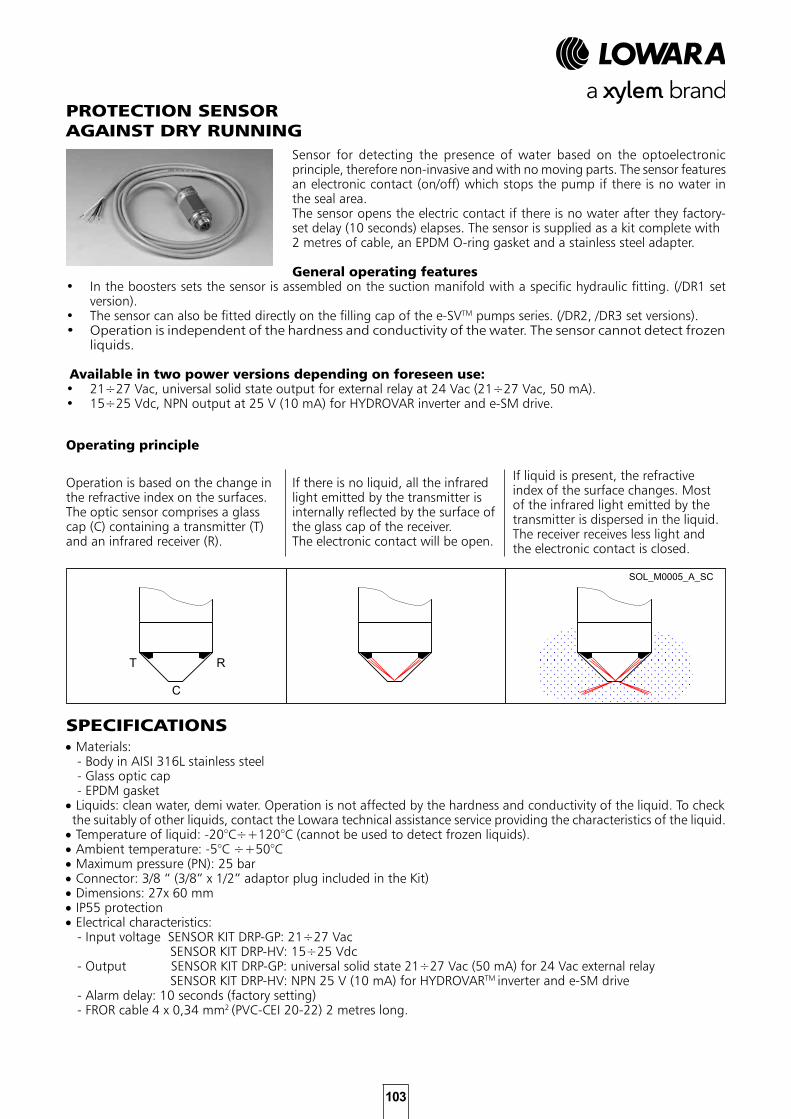
103
PROTECTION SENSORAGAINST DRY RUNNING
Sensor for detecting the presence of water based on the optoelectronic principle, therefore non-invasive and with no moving parts. The sensor features an electronic contact (on/off) which stops the pump if there is no water in the seal area.The sensor opens the electric contact if there is no water after they factory-set delay (10 seconds) elapses. The sensor is supplied as a kit complete with2 metres of cable, an EPDM O-ring gasket and a stainless steel adapter.
General operating features• In the boosters sets the sensor is assembled on the suction manifold with a specific hydraulic fitting. (/DR1 set
version).• The sensor can also be fitted directly on the filling cap of the e-SVTM pumps series. (/DR2, /DR3 set versions).• Operation is independent of the hardness and conductivity of the water. The sensor cannot detect frozen
liquids.
Available in two power versions depending on foreseen use:• 21÷27 Vac, universal solid state output for external relay at 24 Vac (21÷27 Vac, 50 mA).• 15÷25 Vdc, NPN output at 25 V (10 mA) for HYDROVAR inverter and e-SM drive.
Operating principle
Operation is based on the change in the refractive index on the surfaces. The optic sensor comprises a glass cap (C) containing a transmitter (T) and an infrared receiver (R).
If there is no liquid, all the infrared light emitted by the transmitter is internally reflected by the surface of the glass cap of the receiver.The electronic contact will be open.
If liquid is present, the refractive index of the surface changes. Most of the infrared light emitted by the transmitter is dispersed in the liquid. The receiver receives less light and the electronic contact is closed.
• Materials: - Body in AISI 316L stainless steel - Glass optic cap - EPDM gasket• Liquids: clean water, demi water. Operation is not affected by the hardness and conductivity of the liquid. To check the suitably of other liquids, contact the Lowara technical assistance service providing the characteristics of the liquid. • Temperature of liquid: -20°C÷+120°C (cannot be used to detect frozen liquids).• Ambient temperature: -5°C ÷+50°C• Maximum pressure (PN): 25 bar• Connector: 3/8 “ (3/8” x 1/2” adaptor plug included in the Kit)• Dimensions: 27x 60 mm• IP55 protection• Electrical characteristics: - Input voltage SENSOR KIT DRP-GP: 21÷27 Vac SENSOR KIT DRP-HV: 15÷25 Vdc - Output SENSOR KIT DRP-GP: universal solid state 21÷27 Vac (50 mA) for 24 Vac external relay SENSOR KIT DRP-HV: NPN 25 V (10 mA) for HYDROVARTM inverter and e-SM drive - Alarm delay: 10 seconds (factory setting) - FROR cable 4 x 0,34 mm2 (PVC-CEI 20-22) 2 metres long.
SPECIFICATIONS
SOL_M0005_A_SC
C
T R
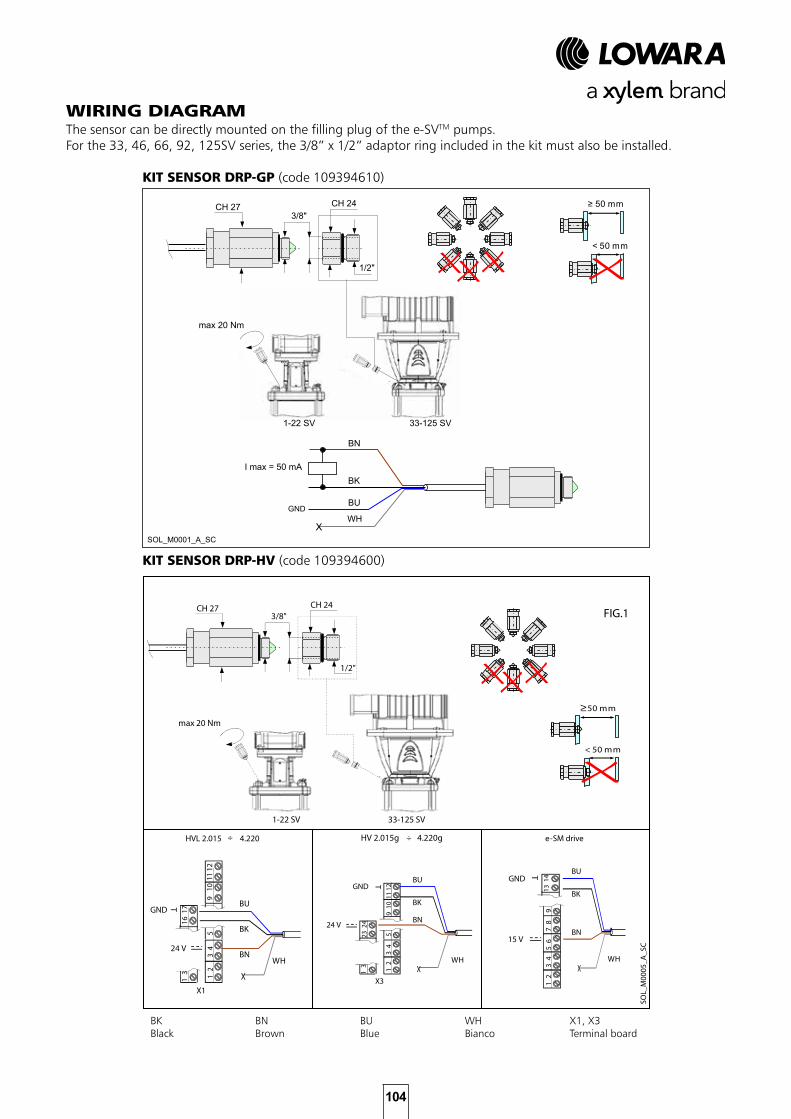
104
WIRING DIAGRAMThe sensor can be directly mounted on the filling plug of the e-SVTM pumps.For the 33, 46, 66, 92, 125SV series, the 3/8” x 1/2” adaptor ring included in the kit must also be installed.
KIT SENSOR DRP-GP (code 109394610)
KIT SENSOR DRP-HV (code 109394600)
Denominazione Deriva da • sensore ottico di livello per SV • DP_M0001GP_A_SC
Codice Revisione• SOL_M0001_A_SC • A
Disegnatore Data• Mauro Caldarde • 26 aprile 2012
SOL_M0001_A_SC
1/2"
CH 243/8"
CH 27 ≥ 50 mm
< 50 mm
FIG.1
BK
BU
BN
WHGND
I max = 50 mA
X
1-22 SV 33-125 SV
max 20 Nm
G:\R&D_doc\Product-Data\SensoreOtticoDiLivello\50hz\Drawings\Manuals\SOL_M0001_A_sc
SOL_
M00
05_A
_SC
50 mm
< 50 mm
FIG.1
1/2"
CH 243/8"
CH 27
1-22 SV 33-125 SV
max 20 Nm
1 2
3 4
5 6
7 8
9
HVL 2.015 ÷ 4.220
1 2
3 4
59
X3
GND
24 V
T
BK
BU
BN
WHX
1 2
3 4
59
X1
GND
24 V
T
BK
BU
BNWH
X
HV 2.015g 4.220g e-SM drive
GND
T
15 V
X
G:\R&D_doc\Product-Data\SensoreOtticoDiLivello_iAle rt\50hz\Drawings\Manuals\SOL_M0005_A_sc.xls
1 3
10 1
1 12
16 1
7
1 3
23 2
4
10 1
1 12
÷
13 1
4
≥
BK
BU
BN
WH
BKBlack
BNBrown
BUBlue
WHBianco
X1, X3Terminal board
105
TECHNICAL APPENDIX
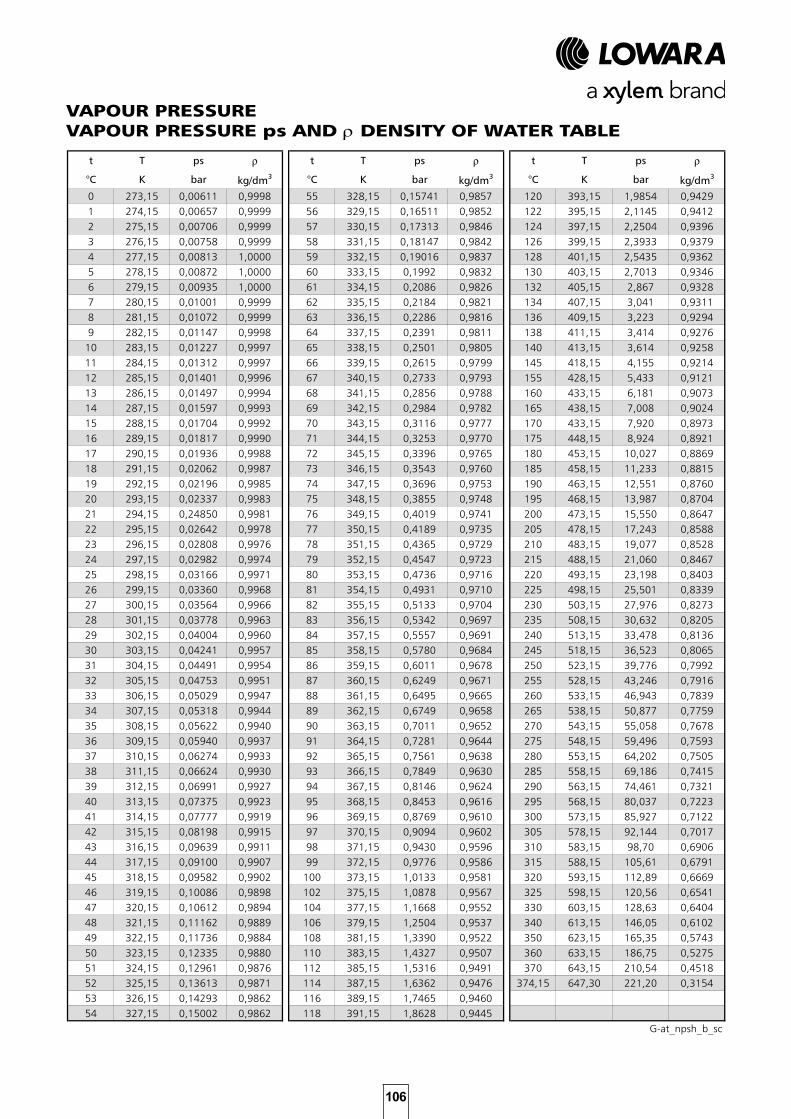
106
VAPOUR PRESSUREVAPOUR PRESSURE ps AND ρ DENSITY OF WATER TABLETENSIONE DI VAPORETABELLA TENSIONE DI VAPORE ps E DENSITA' ρ DELL'ACQUA
t T ps ρ t T ps ρ t T ps ρ
°C K bar kg/dm3 °C K bar kg/dm3 °C K bar kg/dm3
0 273,15 0,00611 0,9998 55 328,15 0,15741 0,9857 120 393,15 1,9854 0,94291 274,15 0,00657 0,9999 56 329,15 0,16511 0,9852 122 395,15 2,1145 0,94122 275,15 0,00706 0,9999 57 330,15 0,17313 0,9846 124 397,15 2,2504 0,93963 276,15 0,00758 0,9999 58 331,15 0,18147 0,9842 126 399,15 2,3933 0,93794 277,15 0,00813 1,0000 59 332,15 0,19016 0,9837 128 401,15 2,5435 0,93625 278,15 0,00872 1,0000 60 333,15 0,1992 0,9832 130 403,15 2,7013 0,93466 279,15 0,00935 1,0000 61 334,15 0,2086 0,9826 132 405,15 2,867 0,93287 280,15 0,01001 0,9999 62 335,15 0,2184 0,9821 134 407,15 3,041 0,93118 281,15 0,01072 0,9999 63 336,15 0,2286 0,9816 136 409,15 3,223 0,92949 282,15 0,01147 0,9998 64 337,15 0,2391 0,9811 138 411,15 3,414 0,927610 283,15 0,01227 0,9997 65 338,15 0,2501 0,9805 140 413,15 3,614 0,925811 284,15 0,01312 0,9997 66 339,15 0,2615 0,9799 145 418,15 4,155 0,921412 285,15 0,01401 0,9996 67 340,15 0,2733 0,9793 155 428,15 5,433 0,912113 286,15 0,01497 0,9994 68 341,15 0,2856 0,9788 160 433,15 6,181 0,907314 287,15 0,01597 0,9993 69 342,15 0,2984 0,9782 165 438,15 7,008 0,902415 288,15 0,01704 0,9992 70 343,15 0,3116 0,9777 170 433,15 7,920 0,897316 289,15 0,01817 0,9990 71 344,15 0,3253 0,9770 175 448,15 8,924 0,892117 290,15 0,01936 0,9988 72 345,15 0,3396 0,9765 180 453,15 10,027 0,886918 291,15 0,02062 0,9987 73 346,15 0,3543 0,9760 185 458,15 11,233 0,881519 292,15 0,02196 0,9985 74 347,15 0,3696 0,9753 190 463,15 12,551 0,876020 293,15 0,02337 0,9983 75 348,15 0,3855 0,9748 195 468,15 13,987 0,870421 294,15 0,24850 0,9981 76 349,15 0,4019 0,9741 200 473,15 15,550 0,864722 295,15 0,02642 0,9978 77 350,15 0,4189 0,9735 205 478,15 17,243 0,858823 296,15 0,02808 0,9976 78 351,15 0,4365 0,9729 210 483,15 19,077 0,852824 297,15 0,02982 0,9974 79 352,15 0,4547 0,9723 215 488,15 21,060 0,846725 298,15 0,03166 0,9971 80 353,15 0,4736 0,9716 220 493,15 23,198 0,840326 299,15 0,03360 0,9968 81 354,15 0,4931 0,9710 225 498,15 25,501 0,833927 300,15 0,03564 0,9966 82 355,15 0,5133 0,9704 230 503,15 27,976 0,827328 301,15 0,03778 0,9963 83 356,15 0,5342 0,9697 235 508,15 30,632 0,820529 302,15 0,04004 0,9960 84 357,15 0,5557 0,9691 240 513,15 33,478 0,813630 303,15 0,04241 0,9957 85 358,15 0,5780 0,9684 245 518,15 36,523 0,806531 304,15 0,04491 0,9954 86 359,15 0,6011 0,9678 250 523,15 39,776 0,799232 305,15 0,04753 0,9951 87 360,15 0,6249 0,9671 255 528,15 43,246 0,791633 306,15 0,05029 0,9947 88 361,15 0,6495 0,9665 260 533,15 46,943 0,783934 307,15 0,05318 0,9944 89 362,15 0,6749 0,9658 265 538,15 50,877 0,775935 308,15 0,05622 0,9940 90 363,15 0,7011 0,9652 270 543,15 55,058 0,767836 309,15 0,05940 0,9937 91 364,15 0,7281 0,9644 275 548,15 59,496 0,759337 310,15 0,06274 0,9933 92 365,15 0,7561 0,9638 280 553,15 64,202 0,750538 311,15 0,06624 0,9930 93 366,15 0,7849 0,9630 285 558,15 69,186 0,741539 312,15 0,06991 0,9927 94 367,15 0,8146 0,9624 290 563,15 74,461 0,732140 313,15 0,07375 0,9923 95 368,15 0,8453 0,9616 295 568,15 80,037 0,722341 314,15 0,07777 0,9919 96 369,15 0,8769 0,9610 300 573,15 85,927 0,712242 315,15 0,08198 0,9915 97 370,15 0,9094 0,9602 305 578,15 92,144 0,701743 316,15 0,09639 0,9911 98 371,15 0,9430 0,9596 310 583,15 98,70 0,690644 317,15 0,09100 0,9907 99 372,15 0,9776 0,9586 315 588,15 105,61 0,679145 318,15 0,09582 0,9902 100 373,15 1,0133 0,9581 320 593,15 112,89 0,666946 319,15 0,10086 0,9898 102 375,15 1,0878 0,9567 325 598,15 120,56 0,654147 320,15 0,10612 0,9894 104 377,15 1,1668 0,9552 330 603,15 128,63 0,640448 321,15 0,11162 0,9889 106 379,15 1,2504 0,9537 340 613,15 146,05 0,610249 322,15 0,11736 0,9884 108 381,15 1,3390 0,9522 350 623,15 165,35 0,574350 323,15 0,12335 0,9880 110 383,15 1,4327 0,9507 360 633,15 186,75 0,527551 324,15 0,12961 0,9876 112 385,15 1,5316 0,9491 370 643,15 210,54 0,451852 325,15 0,13613 0,9871 114 387,15 1,6362 0,9476 374,15 647,30 221,20 0,315453 326,15 0,14293 0,9862 116 389,15 1,7465 0,946054 327,15 0,15002 0,9862 118 391,15 1,8628 0,9445
G-at_npsh_b_sc
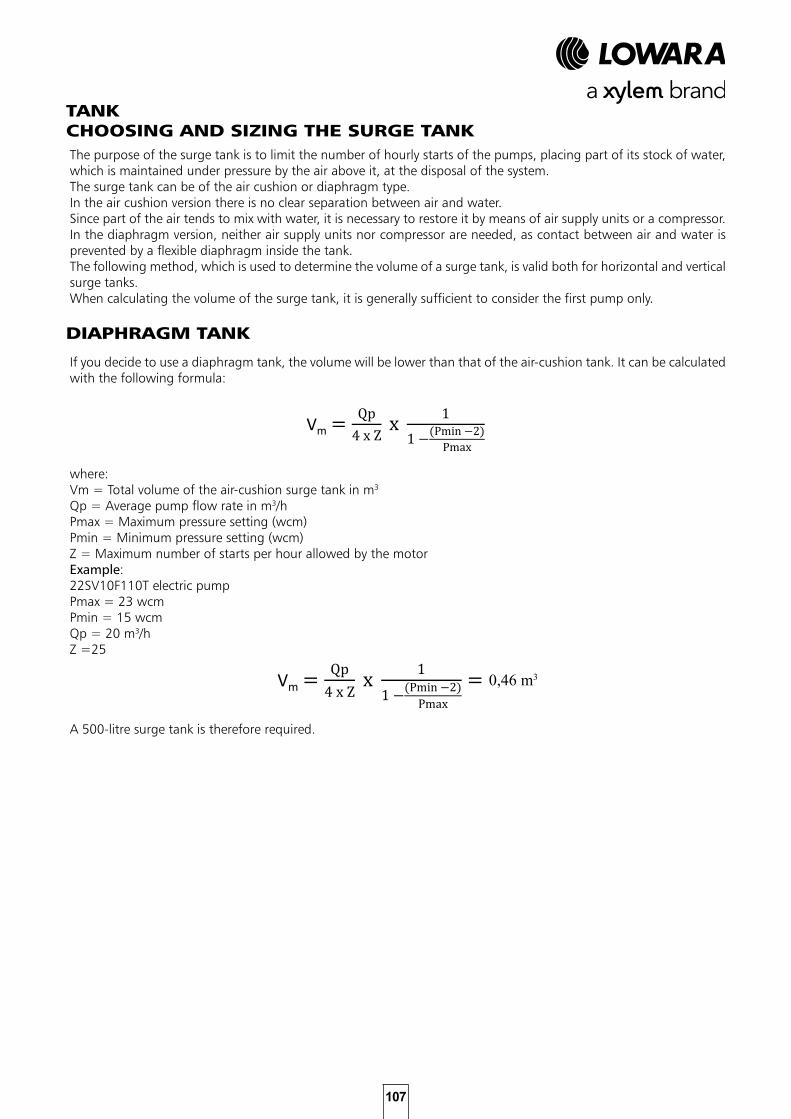
107
TANKCHOOSING AND SIZING THE SURGE TANKThe purpose of the surge tank is to limit the number of hourly starts of the pumps, placing part of its stock of water, which is maintained under pressure by the air above it, at the disposal of the system.The surge tank can be of the air cushion or diaphragm type.In the air cushion version there is no clear separation between air and water. Since part of the air tends to mix with water, it is necessary to restore it by means of air supply units or a compressor.In the diaphragm version, neither air supply units nor compressor are needed, as contact between air and water is prevented by a flexible diaphragm inside the tank.The following method, which is used to determine the volume of a surge tank, is valid both for horizontal and vertical surge tanks.When calculating the volume of the surge tank, it is generally sufficient to consider the first pump only.
DIAPHRAGM TANK
If you decide to use a diaphragm tank, the volume will be lower than that of the air-cushion tank. It can be calculated with the following formula:
where:Vm = Total volume of the air-cushion surge tank in m3
Qp = Average pump flow rate in m3/hPmax = Maximum pressure setting (wcm)Pmin = Minimum pressure setting (wcm)Z = Maximum number of starts per hour allowed by the motorExample:22SV10F110T electric pumpPmax = 23 wcmPmin = 15 wcmQp = 20 m3/hZ =25
A 500-litre surge tank is therefore required.
Vm 0,4 m3
Vm
0,46 m3
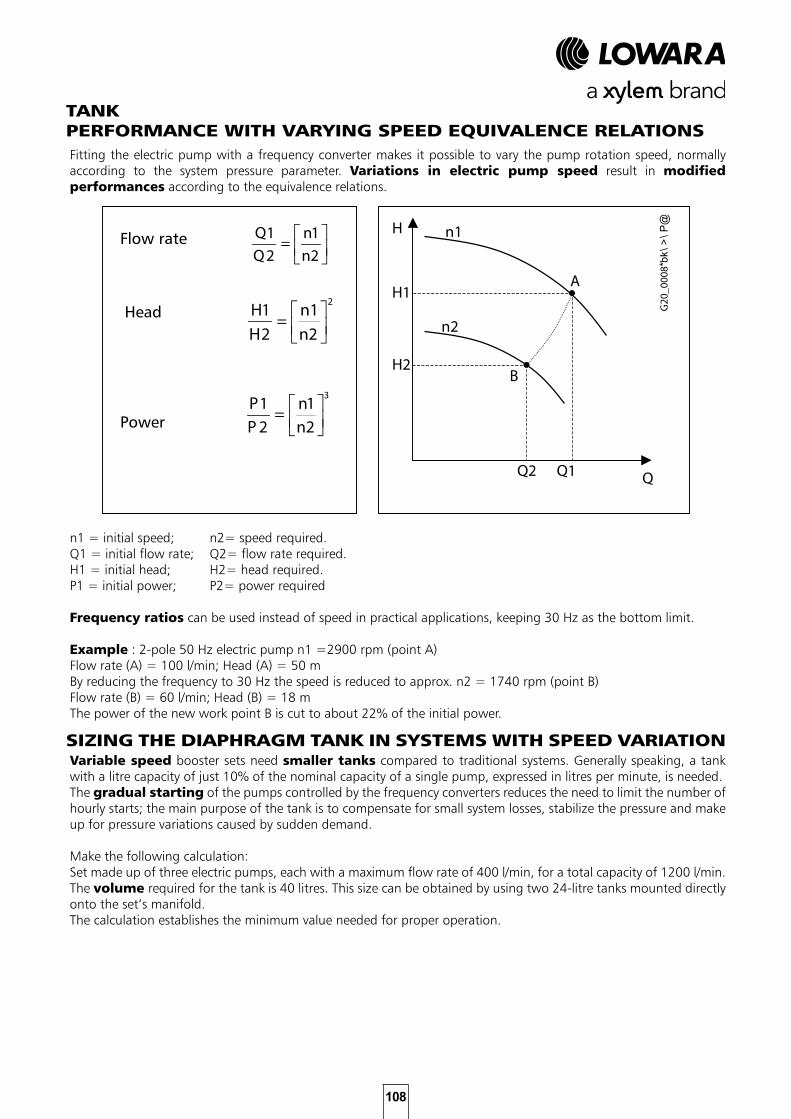
108
TANKPERFORMANCE WITH VARYING SPEED EQUIVALENCE RELATIONSFitting the electric pump with a frequency converter makes it possible to vary the pump rotation speed, normally according to the system pressure parameter. Variations in electric pump speed result in modified performances according to the equivalence relations.
n1 = initial speed; n2= speed required.Q1 = initial flow rate; Q2= flow rate required.H1 = initial head; H2= head required.P1 = initial power; P2= power required
Frequency ratios can be used instead of speed in practical applications, keeping 30 Hz as the bottom limit.
Example : 2-pole 50 Hz electric pump n1 =2900 rpm (point A)Flow rate (A) = 100 l/min; Head (A) = 50 mBy reducing the frequency to 30 Hz the speed is reduced to approx. n2 = 1740 rpm (point B)Flow rate (B) = 60 l/min; Head (B) = 18 mThe power of the new work point B is cut to about 22% of the initial power.
SIZING THE DIAPHRAGM TANK IN SYSTEMS WITH SPEED VARIATIONVariable speed booster sets need smaller tanks compared to traditional systems. Generally speaking, a tank with a litre capacity of just 10% of the nominal capacity of a single pump, expressed in litres per minute, is needed.The gradual starting of the pumps controlled by the frequency converters reduces the need to limit the number of hourly starts; the main purpose of the tank is to compensate for small system losses, stabilize the pressure and make up for pressure variations caused by sudden demand.
Make the following calculation:Set made up of three electric pumps, each with a maximum flow rate of 400 l/min, for a total capacity of 1200 l/min.The volume required for the tank is 40 litres. This size can be obtained by using two 24-litre tanks mounted directly onto the set’s manifold.The calculation establishes the minimum value needed for proper operation.
Flow rate
Head
Power
=n2n1
2H1H
2
=2n1n
2Q1Q
=2n1n
2P1P
3
B
A
H
Q
n1
n2
H1
H2
Q2 Q1
G20
_000
8*bk
\>\P
@
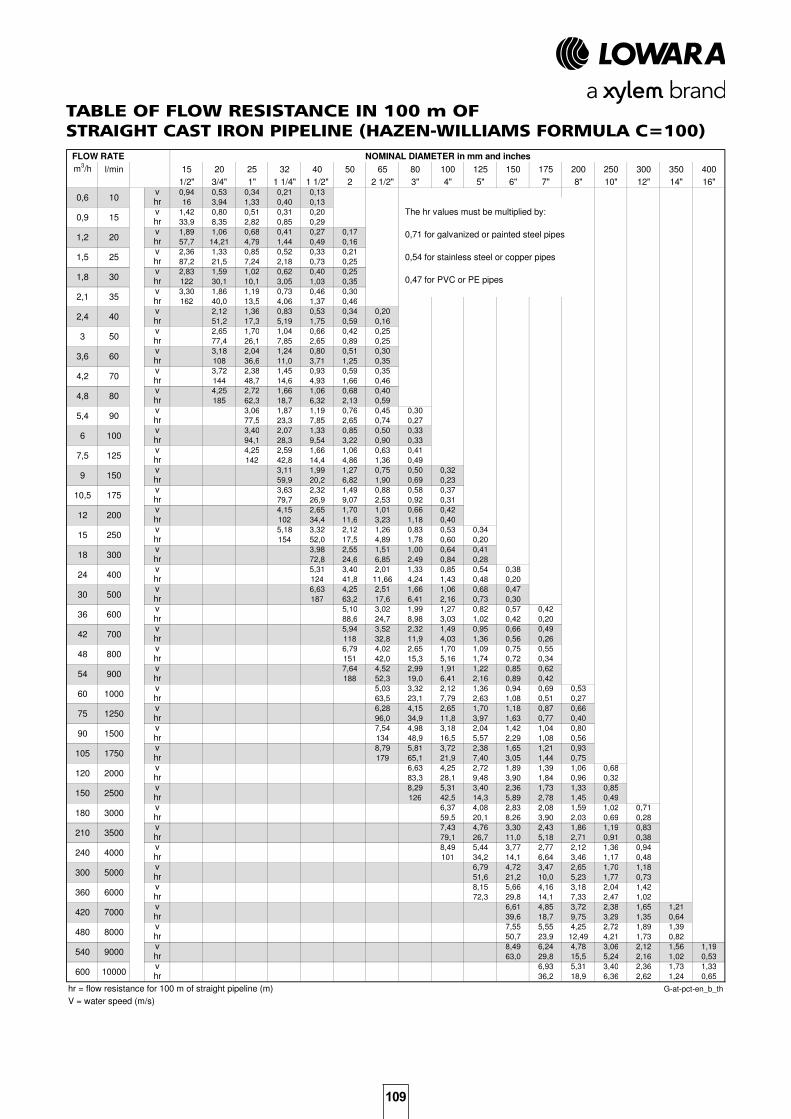
109
m3/h l/min 15 20 25 32 40 50 65 80 100 125 150 175 200 250 300 350 400
1/2" 3/4" 1" 1 1/4" 1 1/2" 2 2 1/2" 3" 4" 5" 6" 7" 8" 10" 12" 14" 16"
v 0,94 0,53 0,34 0,21 0,13
hr 16 3,94 1,33 0,40 0,13
v 1,42 0,80 0,51 0,31 0,20
hr 33,9 8,35 2,82 0,85 0,29
v 1,89 1,06 0,68 0,41 0,27 0,17
hr 57,7 14,21 4,79 1,44 0,49 0,16
v 2,36 1,33 0,85 0,52 0,33 0,21
hr 87,2 21,5 7,24 2,18 0,73 0,25
v 2,83 1,59 1,02 0,62 0,40 0,25
hr 122 30,1 10,1 3,05 1,03 0,35
v 3,30 1,86 1,19 0,73 0,46 0,30
hr 162 40,0 13,5 4,06 1,37 0,46
v 2,12 1,36 0,83 0,53 0,34 0,20
hr 51,2 17,3 5,19 1,75 0,59 0,16
v 2,65 1,70 1,04 0,66 0,42 0,25
hr 77,4 26,1 7,85 2,65 0,89 0,25
v 3,18 2,04 1,24 0,80 0,51 0,30
hr 108 36,6 11,0 3,71 1,25 0,35
v 3,72 2,38 1,45 0,93 0,59 0,35
hr 144 48,7 14,6 4,93 1,66 0,46
v 4,25 2,72 1,66 1,06 0,68 0,40
hr 185 62,3 18,7 6,32 2,13 0,59
v 3,06 1,87 1,19 0,76 0,45 0,30
hr 77,5 23,3 7,85 2,65 0,74 0,27
v 3,40 2,07 1,33 0,85 0,50 0,33
hr 94,1 28,3 9,54 3,22 0,90 0,33
v 4,25 2,59 1,66 1,06 0,63 0,41
hr 142 42,8 14,4 4,86 1,36 0,49
v 3,11 1,99 1,27 0,75 0,50 0,32
hr 59,9 20,2 6,82 1,90 0,69 0,23
v 3,63 2,32 1,49 0,88 0,58 0,37
hr 79,7 26,9 9,07 2,53 0,92 0,31
v 4,15 2,65 1,70 1,01 0,66 0,42
hr 102 34,4 11,6 3,23 1,18 0,40
v 5,18 3,32 2,12 1,26 0,83 0,53 0,34
hr 154 52,0 17,5 4,89 1,78 0,60 0,20
v 3,98 2,55 1,51 1,00 0,64 0,41
hr 72,8 24,6 6,85 2,49 0,84 0,28
v 5,31 3,40 2,01 1,33 0,85 0,54 0,38
hr 124 41,8 11,66 4,24 1,43 0,48 0,20
v 6,63 4,25 2,51 1,66 1,06 0,68 0,47
hr 187 63,2 17,6 6,41 2,16 0,73 0,30
v 5,10 3,02 1,99 1,27 0,82 0,57 0,42
hr 88,6 24,7 8,98 3,03 1,02 0,42 0,20
v 5,94 3,52 2,32 1,49 0,95 0,66 0,49
hr 118 32,8 11,9 4,03 1,36 0,56 0,26
v 6,79 4,02 2,65 1,70 1,09 0,75 0,55
hr 151 42,0 15,3 5,16 1,74 0,72 0,34
v 7,64 4,52 2,99 1,91 1,22 0,85 0,62
hr 188 52,3 19,0 6,41 2,16 0,89 0,42
v 5,03 3,32 2,12 1,36 0,94 0,69 0,53
hr 63,5 23,1 7,79 2,63 1,08 0,51 0,27
v 6,28 4,15 2,65 1,70 1,18 0,87 0,66
hr 96,0 34,9 11,8 3,97 1,63 0,77 0,40
v 7,54 4,98 3,18 2,04 1,42 1,04 0,80
hr 134 48,9 16,5 5,57 2,29 1,08 0,56
v 8,79 5,81 3,72 2,38 1,65 1,21 0,93
hr 179 65,1 21,9 7,40 3,05 1,44 0,75
v 6,63 4,25 2,72 1,89 1,39 1,06 0,68
hr 83,3 28,1 9,48 3,90 1,84 0,96 0,32
v 8,29 5,31 3,40 2,36 1,73 1,33 0,85
hr 126 42,5 14,3 5,89 2,78 1,45 0,49
v 6,37 4,08 2,83 2,08 1,59 1,02 0,71
hr 59,5 20,1 8,26 3,90 2,03 0,69 0,28
v 7,43 4,76 3,30 2,43 1,86 1,19 0,83
hr 79,1 26,7 11,0 5,18 2,71 0,91 0,38
v 8,49 5,44 3,77 2,77 2,12 1,36 0,94
hr 101 34,2 14,1 6,64 3,46 1,17 0,48
v 6,79 4,72 3,47 2,65 1,70 1,18
hr 51,6 21,2 10,0 5,23 1,77 0,73
v 8,15 5,66 4,16 3,18 2,04 1,42
hr 72,3 29,8 14,1 7,33 2,47 1,02
v 6,61 4,85 3,72 2,38 1,65 1,21
hr 39,6 18,7 9,75 3,29 1,35 0,64
v 7,55 5,55 4,25 2,72 1,89 1,39
hr 50,7 23,9 12,49 4,21 1,73 0,82
v 8,49 6,24 4,78 3,06 2,12 1,56 1,19
hr 63,0 29,8 15,5 5,24 2,16 1,02 0,53
v 6,93 5,31 3,40 2,36 1,73 1,33
hr 36,2 18,9 6,36 2,62 1,24 0,65
hr = flow resistance for 100 m of straight pipeline (m) G-at-pct-en_b_th
V = water speed (m/s)
The hr values must be multiplied by:
0,71 for galvanized or painted steel pipes
0,54 for stainless steel or copper pipes
0,47 for PVC or PE pipes
420 7000
600 10000
8000480
540 9000
210 3500
360 6000
240 4000
300 5000
500
800
600
180 3000
2000120
150 2500
1500
100060
90
75 1250
10,5
18 300
250
48
36
24
15
80
400
90
175
6 100
5,4
10
30
4,2 70
3 50
150
12 200
4,8
1,2 20
1,8 30
2,1 35
1,5
FLOW RATE NOMINAL DIAMETER in mm and inches
40
3,6 60
25
2,4
0,9 15
0,6
105 1750
42 700
54 900
9
7,5 125
TABLE OF FLOW RESISTANCE IN 100 m OF STRAIGHT CAST IRON PIPELINE (HAZEN-WILLIAMS FORMULA C=100)
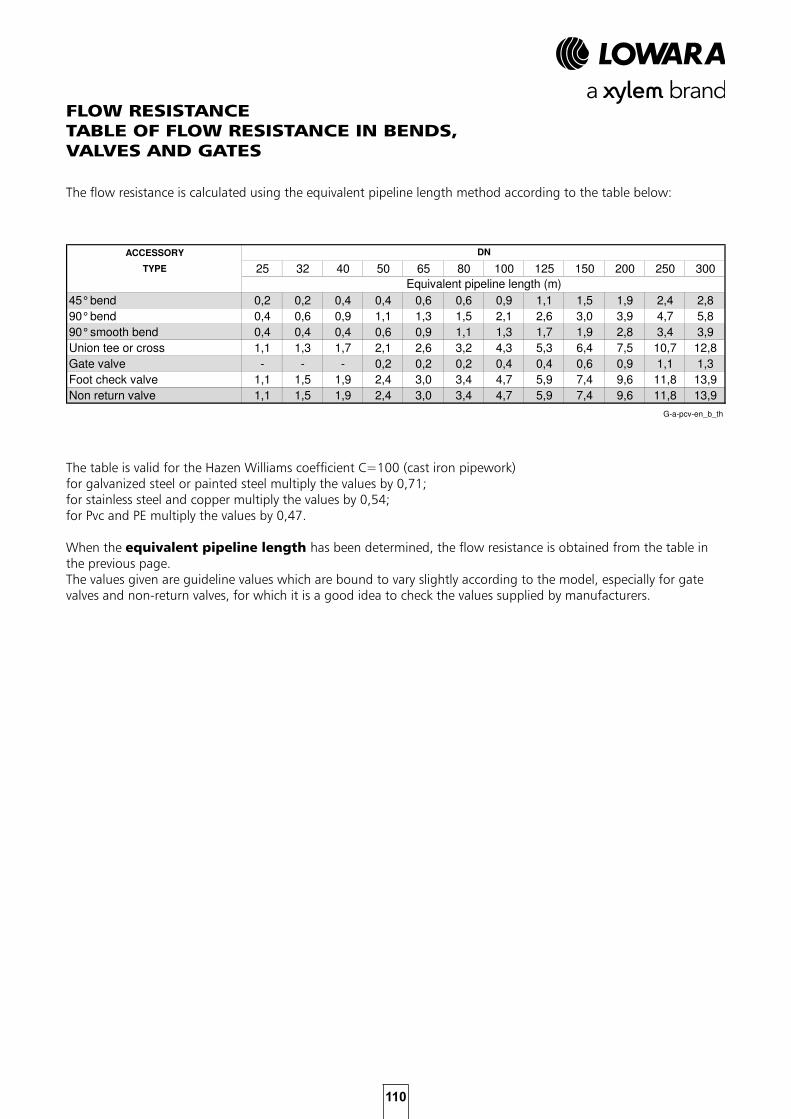
110
TABELLA LUNGHEZZA DI TUBAZIONE EQUIVALENTE
ACCESSORY
TYPE 25 32 40 50 65 80 100 125 150 200 250 300
45° bend 0,2 0,2 0,4 0,4 0,6 0,6 0,9 1,1 1,5 1,9 2,4 2,8
90° bend 0,4 0,6 0,9 1,1 1,3 1,5 2,1 2,6 3,0 3,9 4,7 5,8
90° smooth bend 0,4 0,4 0,4 0,6 0,9 1,1 1,3 1,7 1,9 2,8 3,4 3,9
Union tee or cross 1,1 1,3 1,7 2,1 2,6 3,2 4,3 5,3 6,4 7,5 10,7 12,8
Gate valve - - - 0,2 0,2 0,2 0,4 0,4 0,6 0,9 1,1 1,3
Foot check valve 1,1 1,5 1,9 2,4 3,0 3,4 4,7 5,9 7,4 9,6 11,8 13,9
Non return valve 1,1 1,5 1,9 2,4 3,0 3,4 4,7 5,9 7,4 9,6 11,8 13,9
G-a-pcv-en_b_th
DN
Equivalent pipeline length (m)
FLOW RESISTANCETABLE OF FLOW RESISTANCE IN BENDS, VALVES AND GATES
The flow resistance is calculated using the equivalent pipeline length method according to the table below:
The table is valid for the Hazen Williams coefficient C=100 (cast iron pipework)for galvanized steel or painted steel multiply the values by 0,71; for stainless steel and copper multiply the values by 0,54;for Pvc and PE multiply the values by 0,47.
When the equivalent pipeline length has been determined, the flow resistance is obtained from the table in the previous page.The values given are guideline values which are bound to vary slightly according to the model, especially for gate valves and non-return valves, for which it is a good idea to check the values supplied by manufacturers.
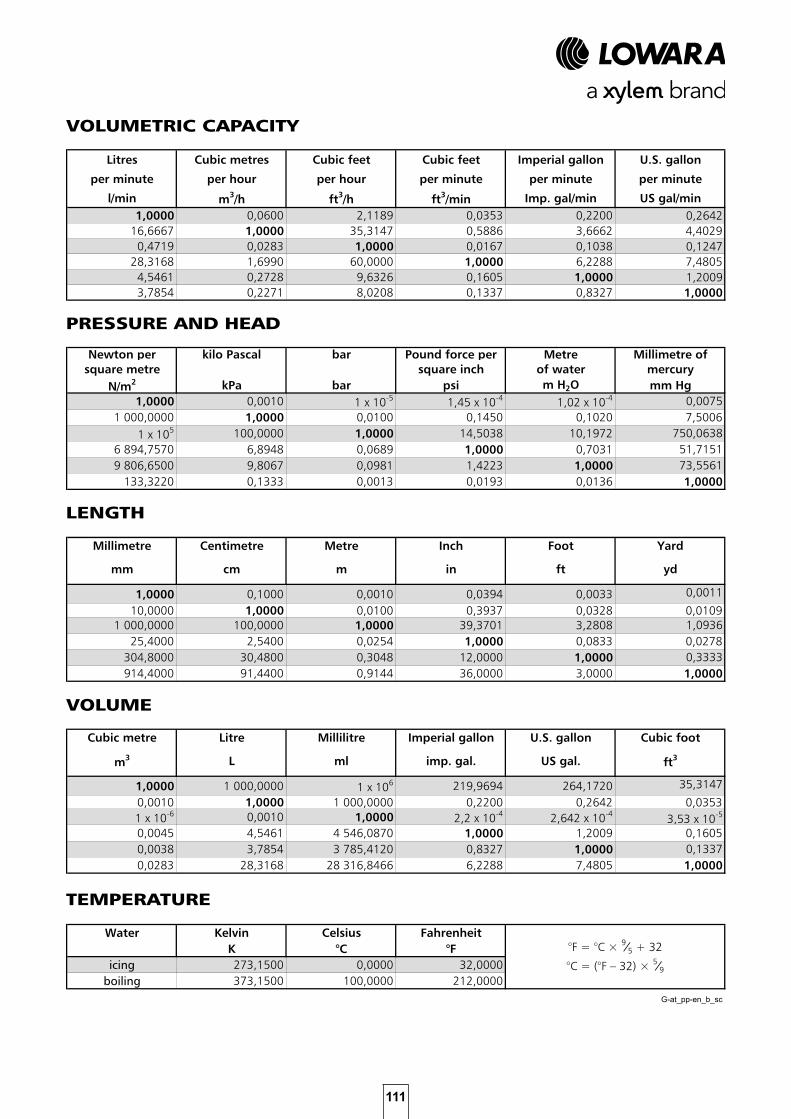
111
Litres Cubic metres Cubic feet Cubic feet Imperial gallon U.S. gallon
per minute per hour per hour per minute per minute per minute
l/min m3/h ft3/h ft3/min Imp. gal/min US gal/min1,0000 0,0600 2,1189 0,0353 0,2200 0,2642
16,6667 1,0000 35,3147 0,5886 3,6662 4,40290,4719 0,0283 1,0000 0,0167 0,1038 0,1247
28,3168 1,6990 60,0000 1,0000 6,2288 7,48054,5461 0,2728 9,6326 0,1605 1,0000 1,20093,7854 0,2271 8,0208 0,1337 0,8327 1,0000
Newton per kilo Pascal bar Pound force per Metre Millimetre ofsquare metre square inch of water mercury
N/m2 kPa bar psi m H2O mm Hg1,0000 0,0010 1 x 10⁻⁵ 1,45 x 10⁻⁴ 1,02 x 10⁻⁴ 0,0075
1 000,0000 1,0000 0,0100 0,1450 0,1020 7,50061 x 10⁵ 100,0000 1,0000 14,5038 10,1972 750,0638
6 894,7570 6,8948 0,0689 1,0000 0,7031 51,7151 9 806,6500 9,8067 0,0981 1,4223 1,0000 73,5561
133,3220 0,1333 0,0013 0,0193 0,0136 1,0000
Millimetre Centimetre Metre Inch Foot Yard
mm cm m in ft yd
1,0000 0,1000 0,0010 0,0394 0,0033 0,0011
10,0000 1,0000 0,0100 0,3937 0,0328 0,0109 1 000,0000 100,0000 1,0000 39,3701 3,2808 1,0936
25,4000 2,5400 0,0254 1,0000 0,0833 0,0278304,8000 30,4800 0,3048 12,0000 1,0000 0,3333914,4000 91,4400 0,9144 36,0000 3,0000 1,0000
Cubic metre Litre Millilitre Imperial gallon U.S. gallon Cubic foot
m3 L ml imp. gal. US gal. ft3
1,0000 1 000,0000 1 x 10⁶ 219,9694 264,1720 35,3147
0,0010 1,0000 1 000,0000 0,2200 0,2642 0,03531 x 10⁻⁶ 0,0010 1,0000 2,2 x 10⁻⁴ 2,642 x 10-4 3,53 x 10⁻⁵
0,0045 4,5461 4 546,0870 1,0000 1,2009 0,16050,0038 3,7854 3 785,4120 0,8327 1,0000 0,13370,0283 28,3168 28 316,8466 6,2288 7,4805 1,0000
Water Kelvin Celsius FahrenheitK °C °F
icing 273,1500 0,0000 32,0000boiling 373,1500 100,0000 212,0000
G-at_pp-en_b_sc
°F = °C × 95 + 32
°C = (°F – 32) × 59
VOLUMETRIC CAPACITY
PRESSURE AND HEAD
LENGTH
VOLUME
TEMPERATURE
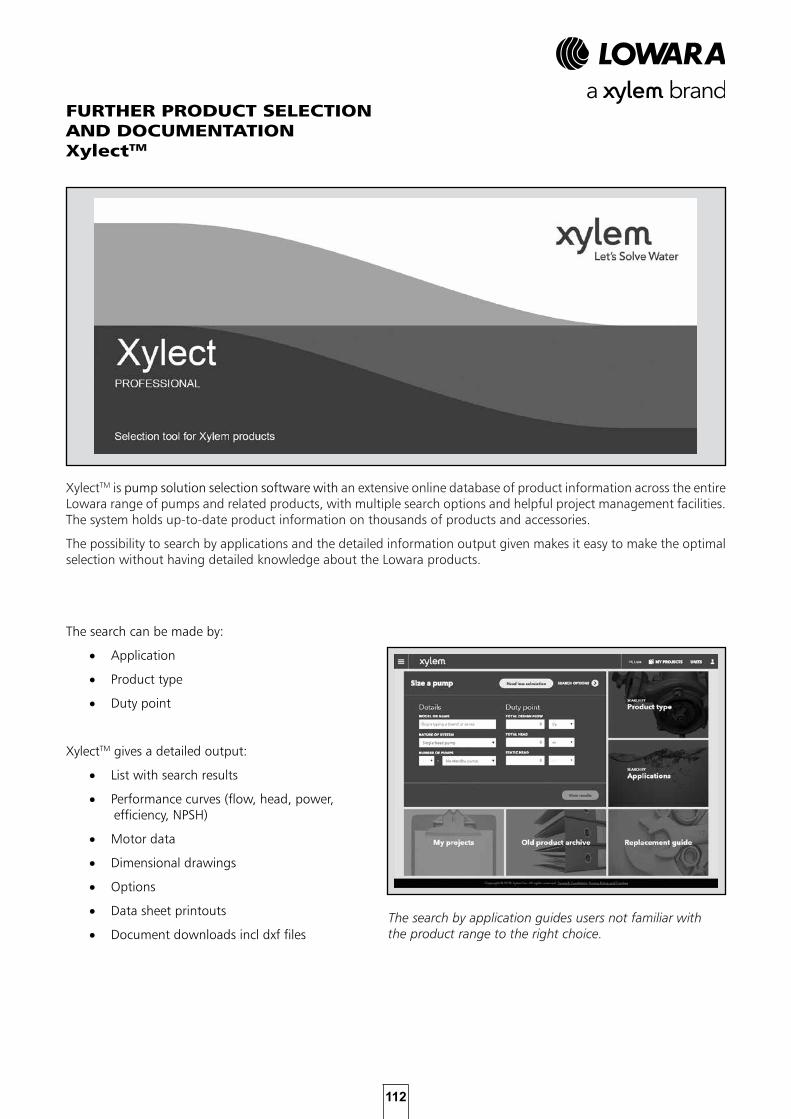
112
FURTHER PRODUCT SELECTIONAND DOCUMENTATIONXylectTM
XylectTM is pump solution selection software with an extensive online database of product information across the entire Lowara range of pumps and related products, with multiple search options and helpful project management facilities. The system holds up-to-date product information on thousands of products and accessories.
The possibility to search by applications and the detailed information output given makes it easy to make the optimal selection without having detailed knowledge about the Lowara products.
The search can be made by:
• Application
• Product type
• Duty point
XylectTM gives a detailed output:
• List with search results
• Performance curves (flow, head, power, efficiency, NPSH)
• Motor data
• Dimensional drawings
• Options
• Data sheet printouts
• Document downloads incl dxf filesThe search by application guides users not familiar with the product range to the right choice.
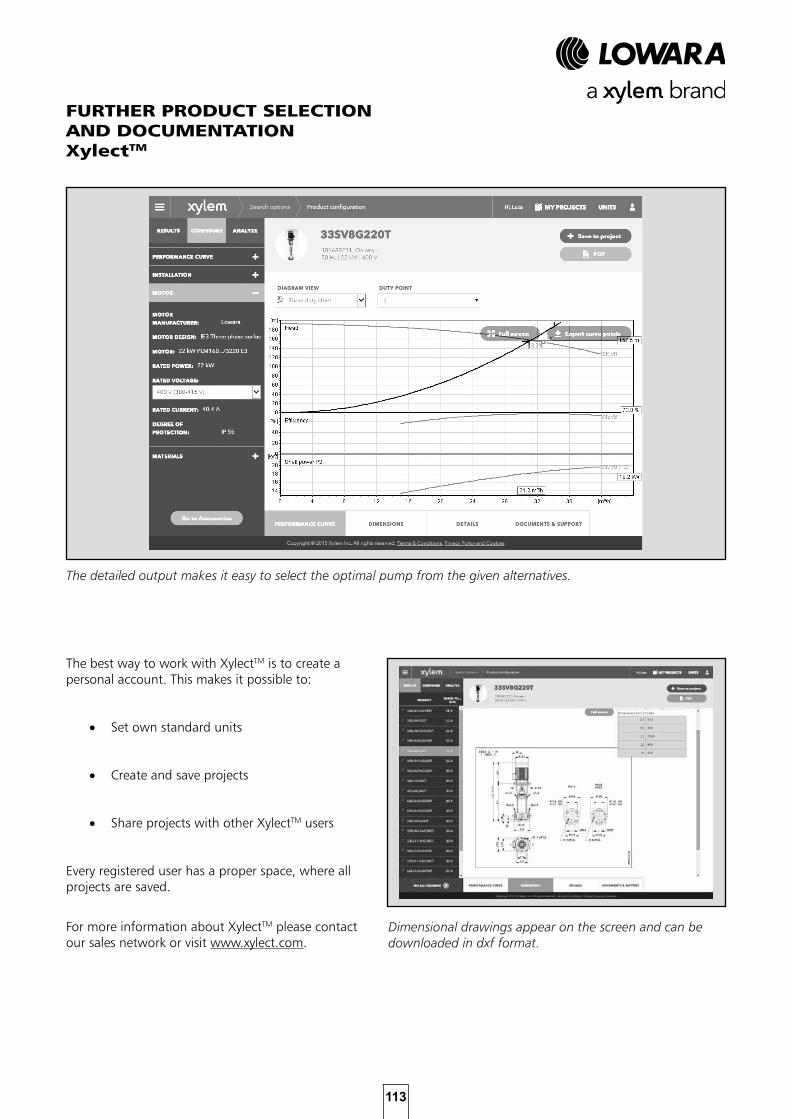
113
FURTHER PRODUCT SELECTIONAND DOCUMENTATIONXylectTM
The detailed output makes it easy to select the optimal pump from the given alternatives.
The best way to work with XylectTM is to create a personal account. This makes it possible to:
• Set own standard units
• Create and save projects
• Share projects with other XylectTM users
Every registered user has a proper space, where all projects are saved.
For more information about XylectTM please contact our sales network or visit www.xylect.com.
Dimensional drawings appear on the screen and can be downloaded in dxf format.


Xylem Service Italia Srl reserves the right to make modification without prior notice.Lowara, Xylem are trademarks of Xylem Inc. or one of its subsidiaries© 2017 Xylem, Inc.
For information and technical support Xylem Service Italia Srl Via Dottor Vittorio Lombardi 14 36075 - Montecchio Maggiore (VI) - Italy Tel. (+39) 0444 707111 Fax (+39) 0444 491043 www.lowara.com
1) The tissue in plants that brings water upward from the roots; 2) a leading global water technology company.
We’re a global team unified in a common purpose: creating advanced technology solutions to the world’s water challenges. Developing new technologies that will improve the way water is used, conserved, and re-used in the future is central to our work. Our products and services move, treat, analyze, monitor and return water to the environment, in public utility, industrial, residential and commercial building services, and agricultural settings. With its October 2016 acquisition of Sensus, Xylem added smart metering, network technologies and advanced data analytics for water, gas and electric utilities to its portfolio of solutions. In more than 150 countries, we have strong, long-standing relationships with customers who know us for our powerful combination of leading product brands and applications expertise with a strong focus on developing comprehensive, sustainable solutions.
For more information on how Xylem can help you, go to www.xylem.com.
Xylem |’zīl m|e