Embed Size (px)
Citation preview
SmartProS Ltd. 2013 annuaL rePort to SharehoLderS
2013
For over 30 years SmartPros has been a leading provider of accredited professional education and training to Fortune 500 companies, as well as the major firms and associations in its professional markets:
Keepsmarttm with SmartPros®
accounting & Finance
Financial Services
Legal & ethics
engineering
Information technology
multimedia
Interactive
marketing Services
K E E P S M A R T
Smart Pros®®

SmartPros Accounting & Finance™ SmartPros eCampus™ SmartPros eLP mobile™ Financial management network (Fmn)™ CPa report (CPar)™ CPa report Government/ not-for-Profit edition (CPar Gov/nFP)™ SmartPros advantage (SPa)™ this Week in accounting™ Loscalzo Associates™ Live CPe seminars for public CPas In-firm CPe training programs Executive Enterprise Institute (EEI)™ Live CPe & CLe seminars for finance and legal professionals In-house CPe & CLe training solutions CPe & CLe administration for organizations
SmartPros Financial Services™ SmartPros FinancialCampus™ Financial Services and Sales training online Banking, Securities and Insurance Courseware SmartPros audit management System (amS)™
SmartPros Legal & Ethics™ Cognistar® Continuing Legal education (CLe) Library organization training Solutions Working Values™ Corporate ethics and Compliance Solutions Integrity alignment Process™ Integrity toolkit™ hr Compliance
SmartPros Engineering™ Interactive Pe exam Prep for Civil engineers Villanova electrical engineering (Pe review) Project management for engineers Civil engineering Courses mGI management Institute engineering education Catalog™ aPICS Certification exam Prep Green engineering (Leed) health & Safety
SmartIT™ Information Technology WatchIt™ Course Catalog
Skye Multimedia™ Custom Interactive training Solutions ireflect™ training Software
SmartPros Interactive™ media & Video, Web development & Video Production SmartStudios Video Studio & Production
SmartPros Marketing Services™ marketing Solutions for accredited Professionals
our combined subscription libraries feature more than 2,000 course titles covering subjects in the accounting, financial services, legal, engineering and information technology industries. SmartPros’ content is delivered via its award-winning SmartPros eCampustm Learning management System (LmS), offering enterprise-wide distribution and administration capabilities for corporations and associations.
In addition, SmartPros produces a popular news and information portal for accounting and finance professionals serving more than one million ads and distributing more than 200,000 subscriber email newsletters each month. SmartPros’ network of sites averages more than 900,000 monthly visits, serving a user base of 1,000,000+ members.
K E E P S M A R T
Smart Pros®®

am pleased that our Company returned to profitability in 2013. however, your management team won’t be satisfied until we get back to the performance levels we achieved prior to this extended recession. many economists believe that 2013 was the beginning of an economic recovery. We
are hopeful their predictions are correct and that we can sustain the growth we realized in 2013.
highlights of our 2013 performance included a revenue increase of nearly $1 million to $16.8 million, an operating profit of $148,000, compared to an operating loss of $1.18 million in 2012, and a net profit of $143,000, or $.03 per share, compared to net loss of $1.9 million, or $.40 per share, for 2012.
SmartPros’ cash position and eBItda results allowed the Company to extend its streak of quarterly dividend payments to 17 consecutive quarters. total dividends in 2013 equaled $.06 per share. In addition, our board once again renewed our $750,000 stock buyback program pursuant to which we repurchased 73,473 shares in 2013.
We have used this prolonged recessionary period to build new products and improve existing ones. the goal has been to position ourselves for growth as soon as the economy starts to expand. as such, we have spent a lot of money over the past few years as a major investment in our own future. We expect to substantially complete new product development by the end of the second quarter 2014, with some carryover in to the third quarter.
Included in recent development was expansion of our eCampus Learning management System (LmS), the addition of a mobile content delivery with the launch of eLP-mobile, development of our own accreditation manager System, and the building of a new cloud-based software product for the Financial Services industry known as the audit management System (amS).
We have begun selling amS, a software system designed to help Financial Services companies meet their compliance requirements, as a stand-alone product that can be packaged with or without our core eCampus LmS. While we announced this new platform in 2012, we continue to upgrade and enhance the feature set of this system in a manner that will allow us to introduce it to a wider range of clients and industries.
our recently completed accreditation manager System will allow us to be more efficient in the way we process, store and issue continuing education credits and certificates across multiple licensing bodies. It not only increases our self-sufficiency in this key area, but it also will enable us to reduce our costs by allowing us to manage the entire process in-house.
We also recently announced the latest enhancement to our eCampus LmS, SmartPros’ eLP-mobile player, which extends the capability of SmartPros’ best-of-breed content libraries and learning management solutions to mobile devices and tablets. all of our new core library content, as well as archives dating back to october 2013, are accessible to our on-the-go clients.
the recession has taken its toll on many businesses, and we are no exception. We remain cautiously optimistic that our business will continue to recover along with the economy. We are hopeful that our current efforts will bear fruit with economic growth so that we can sustain and increase our top and bottom lines.
Sincerely,
allen S. Greene Chairman and Chief executive officer
to our Shareholders
1
I

SmartProS Ltd. 2013 annuaL rePort to SharehoLderS
2013
SmartPros® accounting & Finance
Financial management network (Fmn)™Fmn is the leading “update” subscription program for financial and accounting professionals and is a popular solution for Fortune 500 companies. It is available in an offline video group-study format and an online self-study format. Fmn produces 48 new courses each year (96 online and self-study credits) focused on the hottest financial topics. Fmn also publishes an online archive covering the past 18 months of courseware. online courses feature streaming video, easy-to-follow course outlines, interactive quizzes and the ability to track credits and print completion certificates.
CPa report (CPar)™CPa report is our in-depth professional education subscription for accountants in public practice delivered via video and online. It covers the hottest topics affecting the profession and produces more than 48 new segments each year (over 96 credits). online subscrip-tions include access to a 12-month archive of past topics. online courses feature streaming video, easy-to-follow course outlines, interactive quizzes and the ability to track credits and print completion certificates.
CPa report Government/ not-for-Profit edition (CPar Gov/nFP)™this edition of CPa report is designed specifically for CPas in the areas of government and not-for-profit accounting. Video and online subscriptions are available.
SmartPros® advantage (SPa)™SPa is our annual CPe subscription program featuring hundreds of online skills-based courses offering a blend of self-study via multimedia and interactive text. Courses include downloadable course materials, interactive quizzes and the ability to track credits and print completion certificates. topic areas include: accounting and auditing, tax, Financial Planning, management, ethics, technology and Personal development.
Loscalzo associates, Ltd.Loscalzo associates is a leading provider of live accounting- and auditing-related CPe programs, conferences and seminars. Loscalzo delivers hundreds of seminars each year through state CPa societies, associations of accounting firms and directly with accounting firm clients.
With Loscalzo offerings in the mix, SmartPros now offers a complete blended learning environment for accounting- and finance-related organizations on a national level.
Loscalzo, based in Shrewsbury, new Jersey, operates as a wholly owned subsidiary of SmartPros Ltd.
executive enterprise Institute (eeI)executive enterprise Institute (eeI) is a leader in providing live,professional education focused on compliance and best practicestopics for over 40 years. eeI offers a variety of CPe/CLe accreditedinstructor-led programs open to the public. eeI also focuses on customized client-specific, in-house programs, and a wide variety of support services for corporations and associations, including supplying subject matter experts, production and web-delivery support and CPe/CLe administrative services.
eeI’s public conferences and seminars are offered in major cities across the united States, primarily in corporate accounting and financial reporting, taxation, banking, and international compliance topics. eeI’s programs are delivered by an outstanding network of expert speakers with proven, engaging presentation skills. eeI’s financial topics and many more are available on a customized basis for delivery on-site for eeI clients, as well as web delivery to multiple locations around the world.
... a robust platform and toolset for managing and deploying corporate training and accredited continuing education programs in multiple formats.
K E E P S M A R T
Smart Pros®®
2
neW
Fo
r 2
014

SmartProS Ltd. 2013 annuaL rePort to SharehoLderS
SmartPros® Financial Services
SmartPros®
FinancialCampus™
SmartPros’ FinancialCampus provides accredited education and training for insurance agents, stockbrokers, financial planners and related professions. FinancialCampus has delivered train-ing to more than one million financial services professionals, and features a catalog of over 250 accredited online courses representing more than 16,000 hours of approved insurance continuing education credits across all state regulators and various professional designations in financial services. FinancialCampus also features a series of securities and insurance pre-licensing training courses.
Financial Services and Sales trainingSmartPros Financial Services training is a specialized consulting division providing sales management training, product training and marketing support programs for the financial services industry. We deliver training to organizations, such as national and regional brokerage firms, large and small banks, insurance companies and product providers. our client list includes major financial services organizations from every segment of the industry. our programs are delivered online, as well as via live presentation, group discussion, work-book materials and role-play activities.
online Banking CoursewareSmartPros’ Banking catalog features more than 50 online courses to keep banking and financial services profes-sionals up to date on ever-evolving rules, regulations and business trends in the banking industry. topic areas include: compliance, insurance, lending, management, retirement, and sales and service. Courses feature printable course outlines, instantly graded exams, and the ability to print certificates of completion and track credits. Individual and organizational solutions are available.
SmartPros® audit management System™
SmartPros’ audit management System™ (amS) is designed to address the supervisory needs of securities companies. amS is designed to manage everything from the assignment of branch audits to audit staff through scheduling and notifying oSJ’s and branch managers. amS automates the audit itself, including the remediation letter and managing resolution and close-out. amS can assist smaller broker-dealers support-ing a few branches and is tested for organizations with more than 20,000 advisors, more than 5,000 branches, and over 70 audit staff.
CPe & CLe administration for organizationsas an accredited sponsor of group live training, and producer of thousands of CPe and CLe seminars, conferences, and webinars, SmartPros now works with its corporate and association partners to provide Group Live or Group Internet CPe and CLe credits for the client’s events. We can turn internal training sessions and webinars into qualifying CPe events. SmartPros provides content and speaker review, credit certificate processing, record retention, and compliance assurance. We make it easy for our clients to provide their teams with the CPe credits they need while attending the client’s training.
...SmartPros® FinancialCampus provides accredited education and training for insurance agents, stockbrokers, financial planners and related professions.
3
Introducing SmartPros® eLP mobile™
SmartPros recently announced the launch of its new eLP-mobile eLearning platform, enabling its customers to access continuing education and training courseware directly from supported phones and tablets. SmartPros customers can expect to experience the same high-quality content and ease-of-use as found accessing their courseware through the SmartPros eCampus Learning management system via their desktop browser-based player. SmartPros’ Financial management network (Fmn), CPa report (CPar), and SmartPros advantage (SPa) content is now mobile-enabled dating back to october 2013.
SmartPros® eCampus™SmartPros eCampus Learning management System is a robust platform and toolset for managing and deploying corporate training and accredited continuing education programs in multiple formats, including interactive text, pre-recorded Flash and video-based course modules, and live or recorded webcasts.
SmartPros eCampus was designed to meet the needs of its clients of all sizes, including individual retail customers and Fortune 1,000 companies, as well as major firms and associations in each of its professional markets.
SmartPros delivers over 2,000 off-the-shelf learning modules for the accounting, finance, insurance, banking, legal, It and engineering marketplaces. eCampus is immediately available for licensing to any enterprise looking for a cost-effective Learning management System. Customers can use built-in tools to develop and publish their own course catalogs and courseware, and may also choose to augment their training solutions with SmartPros’ accredited courseware.
SmartPros eCampus is brandable for any enterprise-level organization, and is delivered in a cloud-based hosting environment that requires little to no It commitment at the client level. eCampus is both SCorm and aICC compliant, multilingual, and capable of serving training modules from any modern content development platform.
SmartPros eCampus is available today by going to www.smartpros.com/eCampus
SmartPros® engineering™
Interactive Fe reviewFe exam review is available for a one-year subscription on Cd-rom and online (combo) or online only. the Fe exam review uses interactive quizzes, audio and animated slides to maximize your preparation to pass the exam.
Interactive Pe exam Prep for Civil engineersSmartPros’ Pe exam review is a state-of-the-art interactive multimedia tool that simulates the actual Pe exam using demonstration problems that are comparable to the real test. the course is available online and on Cd-rom. the review course is jointly produced with the american Society of Civil engineers.
Project management for engineersthis interactive program features 11 critical sections with over 60 individual learning modules and provides more than 35 hours of Pdu/Pdh credit.
Civil engineering CoursesCourses include: roadside design, Wetlands, Stormwater, Windloads, and Slope Stability. each of the first four courses has multiple modules available individually for purchase.
mGI management Institute™ engineering education CatalogmGI’s distance education courseware covers a wide range of professional topics for engineers, legal adminis-
trators, manufacturing professionals, quality managers, healthcare professionals and others. Since 1968, more than 200,000 professionals have enrolled in mGI courseware.
aPICS CPIm Certification ProgramIn partnership with aPICS, the association for operations management, SmartPros has developed the “Certified in Production and Inventory management (CPIm)” program. there are currently over 90,000 certified professionals who have completed the program.
health & SafetySmartPros added more than 140 e-learning courses to its health & Safety catalogs in 2012 through its asset acquisition of Global Collaboration Partners LLC. the catalog of courses is designed around measurable learning objectives that address regulatory requirements, helping customers meet the performance-based standards of employee training enforced by oSha, ePa and dot, along with other federal, state and local regulatory agencies. Course areas include environmental health, safety, human resources, and energy exploration markets. Courses are available through both annual subscriptions and individual course sales.
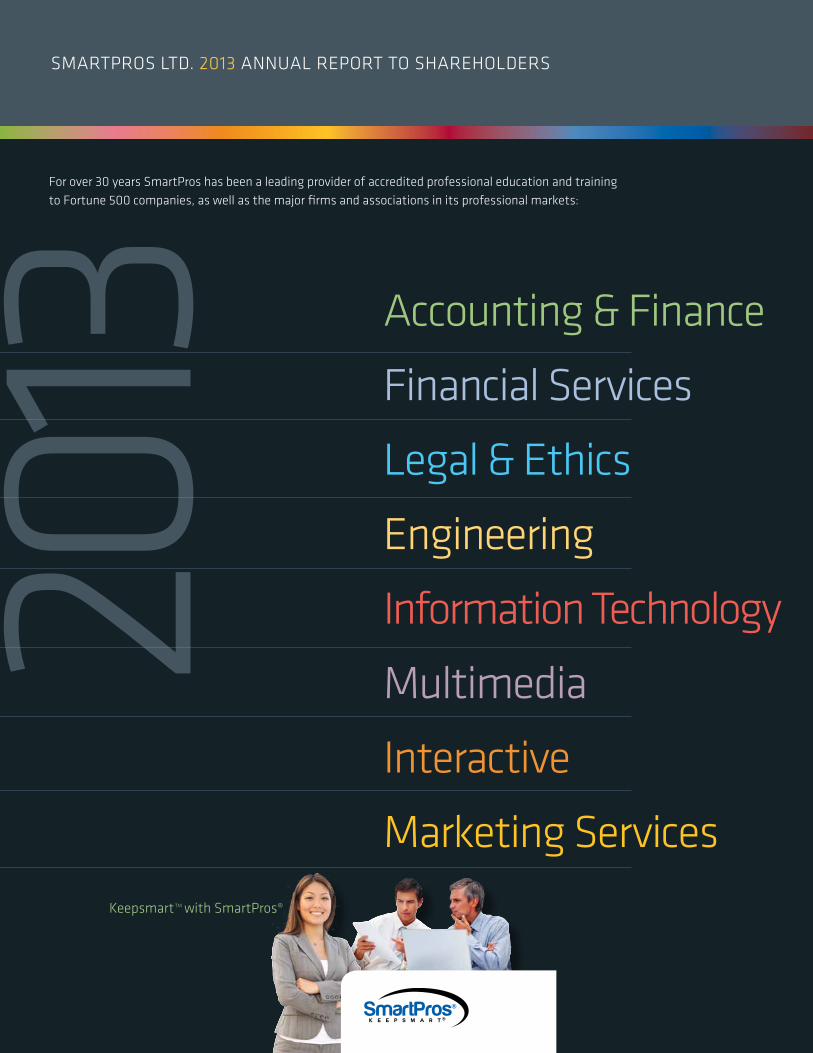
the SmartPros Legal & ethics Ltd. subsidiary now encompasses Working Values and Cognistar product lines. organizational training Solutions for Legal Firms and Corporate CounselSmartPros offers comprehensive end-to-end solutions for corpora-tions seeking legal education and training solutions. our programs help professionals and executives stay on top of their game by providing answers to the hot issues of the day through a variety of formats designed to inspire the user. our clients save time, resources and money on education and training, and have the opportunity to leverage their own in-house content.
Integrity alignment Process™SmartPros’ Integrity alignment Process aligns employee and manager actions with the organ-ization’s values and standards using integrated approaches to communication, learning and process realignment. the Process includes assessments and strategic planning, as well as award-winning training and communication programs.
Integrity toolkit™the toolkit is a compliance center that includes code of business conduct certification, training and assessment tools. It features a Learning management System that provides employees, managers, senior leaders and board members with the tools each group needs
to understand the compliance requirements of the organization and what is required of them to help move the company towards those goals.
Cognistar® Continuing Legal education (CLe) LibrarySmartPros has CLe solutions available in over 20 states, featuring more than 160 online CLe courses. these business-oriented legal programs cover the areas of litigation, intellectual property, corporate and securities law, taxation, labor and employment law, bankruptcy, ethics, professionalism, substance abuse, bias, and more.
Working Values™ Corporate ethics and Compliance SolutionsSmartPros works with leading organizations to develop programs that align workplace behavior and standards to meet ethics and compliance requirements.
hr & ComplianceSmartPros launched an hr & Com-pliance online course library shortly after acquiring certain assets from Global Collaboration Partners LLC. SmartPros’ online hr & Compliance library features more than 31 online, interactive courses for hr profes-sionals and business managers looking to stay on top of current trends. the catalog features courses in the areas of compliance, performance management, person-nel, communications, personal development, general hr and more. Courses are available through both annual subscriptions and individual course sales.
SmartPros® Legal & ethics
K E E P S M A R T
Smart Pros®®
... SmartPros offers comprehensive end-to-end solutions for corporations seeking legal education and training solutions.
SmartProS Ltd. 2013 annuaL rePort to SharehoLderS
4
SmartIt
WatchIt™ Course CatalogWatchIt is designed for business and It professionals looking to enhance their overall It literacy. WatchIt features the experience of real-world experts delivered on-demand wherever and whenever a professional needs to learn. We offer a library of 100 rich media-based courses, and produce two new titles each month in online video and offline formats (dVd). Customers also use our courseware for professional education and professional development. WatchIt helps smart people stay smart; at their pace, and at a time that’s convenient.
Skye multimedia
Custom Interactive training Solutions For more than 16 years Skye has designed and produced interactive training and marketing applications for electronic delivery via the Internet, Cd, dVd, video and kiosk. Skye also develops mobile applica-tions. our staff consists of instructional designers, writers, graphic designers, animators, developers, and project managers.In addition, Skye also has a port-folio of off-the-shelf publishing tools that assist an organization in developing and publishing their own content.
SmartPros® Interactive
media & Video, Web development & Video Production our in-house custom development team works with clients to convert their existing education or training content – or to produce custom content from scratch – for delivery online or via interactive Cd-rom or dVd. We feature a full-service in-house video studio with editing and duplication services.
SmartPros® marketing Services
marketing Solutions to accredited Professionalsthis group is responsible for content management, advertising and lead-generation programs offered through the company’s popular news and information portal.
In addition, we produce private- branded content solutions for our clients in the areas of industry-specific news headlines and news-letters. SmartPros marketing programs currently reach 300,000+ accredited professionals with one million targeted advertising impressions each month. all of our programs are available online and in print.
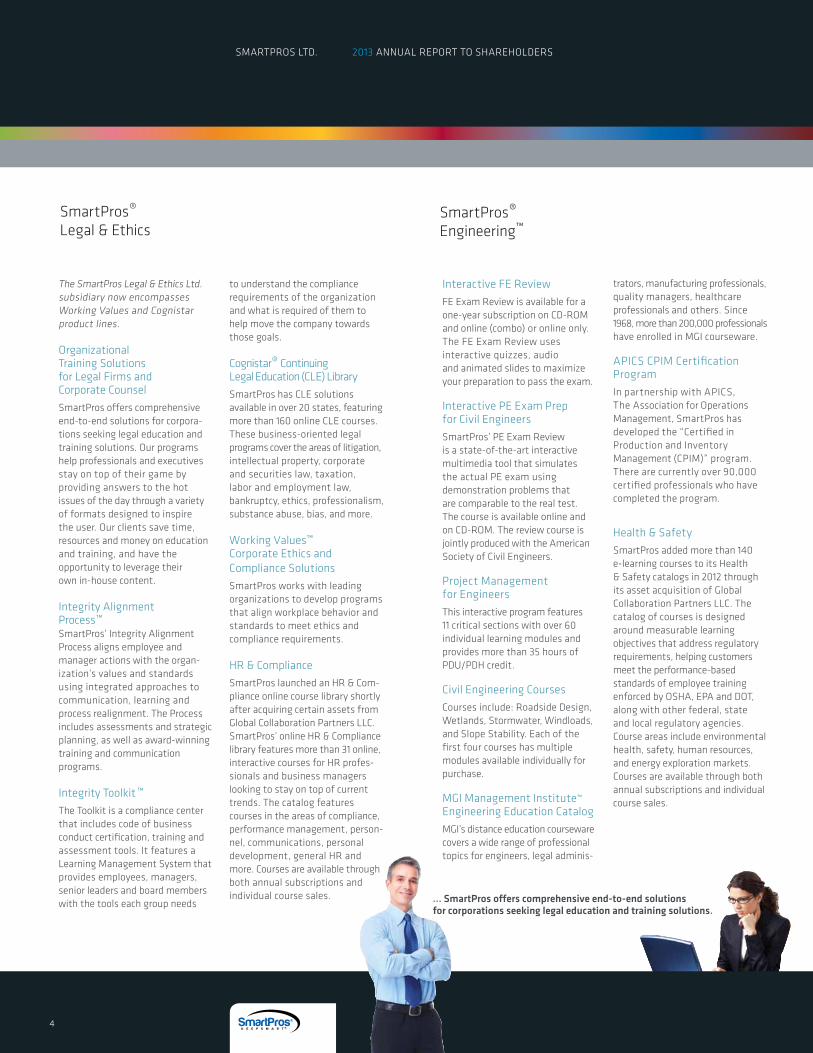
... SmartPros Engineering features a catalog of “green” engineering modules designed to meet the growing
demands for eco-friendly engineering processes.
Villanova Pe review Course in Power for electrical engineers
Villanova College of engineering, a top 10 engineering university according to recent uS news and World report, offers a one-of-a-kind Pe review Course in Power for electrical engineers and is the most comprehensive online Pe review course in electrical power in the country. In conjunction with SmartPros Ltd., the leader in online Pe review for engineers, the Pe review Course in Power for electrical engineers is now available through SmartPros’ engineering eCampus™ Learning management System (LmS). eCampus allows a learner to access the Pe review Course lectures, examples, problems and solutions at their own pace, to meet their own individual learning style and needs. the course has over 100 hours of online learning. Pe review Course in Power for electrical engineers provides nine modules for review of the key topics covered in the exam.
Green engineering Catalog
SmartPros engineering features a catalog of “green” engineering modules designed to meet the growing demands for eco-friendly engineering processes. these comprehensive online courses are designed for certified engineers, as well as related architecture and construction professionals.
Leed Ga exam review
SmartPros’ Leed Ga exam review is comprised of six modules and 18 hours of online courseware. the program offers step-by-step instruction for the Leed application and certification process. engineers taking the Leed Ga exam review receive the added benefit of three Pdh credits for continuing education for each module completed.
Power management Courses
SmartPros, in conjunction with Power management Concepts, a leading engineering firm and education provider in mission-critical data center management, offers a Certificate in the Principles of data Center energy efficiency. In addition, SmartPros Green engineering and Power management Concepts offers a compre-hensive set of 13 online courses, which range from fundamentals to in-depth knowledge of essential elements, such as data Center Cooling, uPS Systems and raised access Floors, as well as the latest best practices in design and operations.
SmartProS Ltd. 2013 annuaL rePort to SharehoLderS
5
The following discussion of our financial condition and results of operations should be read in conjunction with our audited consolidated financial statements and related notes included elsewhere in this Form 10-K. Certain statements in this discussion and elsewhere in this report constitute forward-looking statements within the meaning of Section 21E of the Securities and Exchange Act of 1934. See “Forward-Looking Statements” following the Table of Contents of this 10-K. Because this discussion involves risk and uncertainties, our actual results may differ materially from those anticipated in these forward-looking statements.
OverviewWe measure our operations using both financial and other metrics. The financial metrics include revenues, gross margins, operating expenses and income from continuing operations. Other key metrics include (i) revenues by sales source, (ii) online sales, (iii) cash flows and (iv) EBITDA.
Some of the most significant trends affecting our business are the following:
• the increasing recognition by professionals and corporations that they must continually improve their skills and those of their employees in order to remain competitive;
• continuing and expanding professional education requirements by governing bodies, including states and professional associations;
• the plethora of new laws and regulations affecting the conduct of business and the relationship between employers and their employees;
• the increased competition in today’s economy for skilled employees and the recognition that effective education can be used to recruit and train employees;
• the continual development of new technology as a delivery channel for the types of products and services we offer;
• current economic conditions; and
• competition.
Over the last five years we have experienced fluctuations in our annual net revenues due to various reasons, from the recession that began in 2008 and the resulting decrease in budgets and discretionary spending by many companies, to increased spending based upon what may be the start of a turnaround in our economy. Nevertheless, since 2009 we have experienced an overall decrease in net revenues from $19.2 million in 2009 to $16.8 million in 2013, primarily in our custom services divisions and live seminar business. During this period we have experienced a decline in demand due to various reasons, including a lack of new accounting pronouncements, competition, personnel reductions and reduced budgets for many of our
clients, as well as other factors. We intend to continue seeking acquisitions that will allow us to increase the breadth and depth of our current product offerings. We will also consider acquisitions that will give us access to new markets and products. We prefer acquisitions that are accretive, as opposed to those that are dilutive, but ultimately the decision will be based on maximizing shareholder value rather than short-term profits. The size of the acquisitions will be determined, in part, by the capital available to us and the liquidity and price of our common stock. We may use debt to enhance or augment our ability to consummate larger transactions. There are many risks involved with acquisitions. These risks include identifying appropriate acquisition candidates, successfully negotiating the business, legal and financial terms of the acquisitions, integrating the acquired business into our existing operations and corporate structure, retaining key employees and minimizing disruptions to our existing business. We cannot assure you that we will be able to identify appropriate acquisition opportunities or negotiate reasonable terms or that any acquired business or assets will deliver the shareholder value that we anticipated at the outset.
Our performance for the recently completed 2013 fiscal year resulted in increased revenues of approximately $950,000 compared to 2012, as revenues from our custom projects division increased by approximately $800,000. In addition to the increased revenues, our gross profit margin remained relatively constant as we reduced our selling, general and administrative expenses by approximately $350,000 in 2013 compared to 2012. We also did not have any additional impairments to our goodwill or write-down in our deferred tax asset in 2013. The increase in net revenues was mainly attributable to the increase in demand for custom work offset by decreased attendance in parts of our live seminar business. Our core subscription-based business was relatively flat, as customers are either imposing restrictions on their employees or are seeking lower cost alternatives to mandatory continuing education requirements. Overall net revenues from our accounting/finance division increased slightly as a consequence of various factors, including revenues from CPE administration, a relatively new product. We had a decrease in net revenues in our engineer-ing, Cognistar legal education and Working Values Ethics divisions, while our Financial Services division had an increase in net revenues. In order to reduce our operating expenses, we eliminated live seminars that had sub-par performance which, while reducing gross revenue, had a positive impact on our operating results. In addition, our fourth quarter live educational program revenues were impacted as a result of the storms in the northeast that resulted in some seminars being either canceled or we experienced reduced attendance. Our overall selling, general and administrative expenses decreased primarily due to reduced compensation expense, while we increased expenditures for advertising- and marketing- and technology- related costs. As the overall business environment improves, we expect net revenues from our major business units to increase. We continually monitor our direct and general and administrative costs and make the necessary adjustments where warranted. We are also always looking for new markets
smartpros ltd. and subsidiaries
Management’s Discussion and Analysis of Financial Condition and Results of Operation
6

and distribution channels for our existing products and we continue to expend a significant amount of money to upgrade our library, create new products and develop new technology.
Seasonality and cyclicalityHistorically, our operating results have fluctuated from quarter to quarter, primarily because a portion of our business is non-subscription based. Custom jobs and consulting work are subject to both the general business climate and client’s needs. Net revenue from our Engineering division is subject to staffing levels in both the private and public sector and the timing of various licensing exams. In economic downturns, staff reductions result in fewer people taking professional engineering licensing exams. Our subscription-based revenue is spread over the life of the subscription, which is generally one year and can be effected by staff reductions, as well. With our acquisitions of Loscalzo and EEI, these quarterly fluctuations have become more evident and we expect this trend to continue for the foreseeable future. Both Loscalzo and EEI generate most of their revenue from live programs. In EEI’s case, the revenue is recognized almost exclusively in the second and fourth quarters, when the sessions take place. In Loscalzo’s case, the revenue tends to be recognized over the second, third and fourth quarters, with the fourth quarter revenue being the greatest. While the costs that are directly related to the production of this revenue are incurred over the same period, both Loscalzo and EEI have general and administrative expenses that are incurred ratably over the year, creating the fluctuations in our operating results.
Critical Accounting Policies and EstimatesThe discussion and analysis of our financial condition and results of operations is based on our consolidated financial statements that have been prepared according to accounting principles generally accepted in the United States. In preparing these financial statements, we are required to make estimates and judgments that affect the reported amounts of assets, liabilities, revenues and expenses and related disclosures of contingent assets and liabilities. We evaluate these estimates on an ongoing basis. We base these estimates on historical experience and on various other assumptions that we believe are reasonable under the circumstances, the results of which form the basis for making judgments about the carrying values of assets and liabilities. Actual results may differ from these estimates under different assumptions or conditions. We consider the following accounting policies to be the most important to the portrayal of our financial condition.
RevenuesA large portion of our net revenues is in the form of subscription fees for our monthly accounting update programs or access to our accounting, financial services, legal and information technology course libraries. Other sources of net revenues include direct sales of programs or courses on a non-subscrip-tion basis or from various forms of live education, fees for design, software development, video production, course design and development, ongoing
maintenance of the LMS, and licensing fees. Subscriptions are billed on an annual basis, payable in advance and deferred at the time of billing. Sales made over the Internet are by credit card only. Renewals are usually sent out 60 days before the subscription period ends. Larger transactions are usually dealt with by contract, the financial terms of which depend on the services being provided.
Revenues from subscription services are recognized as earned, deferred at the time of billing or payment and amortized into revenue on a monthly basis over the term of the subscription. Engineering products are non-sub-scription based and revenue is recognized upon shipment of the product or, in the case of online sales, payment. Revenues from live programs are recognized when earned, usually upon the completion of the seminar or conference. Revenues from non-subscription services provided to customers, such as website design, video production, consulting services and custom projects, are generally recognized on a percentage of completion basis where sufficient information relating to project status and other supporting documentation is available. The contracts may have different billing arrangements resulting in either unbilled or deferred revenue. We obtain either a signed agreement or purchase order from our non-subscription customers outlining the terms and conditions of the sale or service to be provided. Otherwise, these services are recognized as revenues after completion and delivery to the customer. Duplication and related services are generally recognized upon shipment or, if later, when our obligations are complete and realization of receivable amounts is assured. We have recently hired additional sales and sales support personnel based on recent improvements in general economic conditions and we want to be in a position to be able to address increased customer demand for our products and services. However, we intend to proceed cautiously in this area until we are reasonably certain that the economic recovery is sustainable.
Impairment of goodwill and long-lived assetsWe evaluate the carrying value of goodwill and the recoverability of identifiable intangible assets and other long-lived tangible assets during the fourth quarter of each year and or whenever circumstances and situations change, such that there is an indication that the carrying amounts may not be recovered or are impaired.
Goodwill is evaluated by comparing the value of the reporting unit to the reporting unit’s carrying amount, including goodwill. The fair value of the reporting unit is estimated using a combination of discounted cash flows approach and the market approach, which utilizes comparable companies’ data. If the carrying amount of a reporting unit exceeds its fair value, then the amount of impairment loss must be measured. The impairment would be calculated by comparing the implied fair value of the reporting unit goodwill to its carrying amount. Any impairment loss would be recognized when the carrying amount of goodwill exceeds its implied fair value.
smartpros ltd. and subsidiaries
Management’s Discussion and Analysis of Financial Condition and Results of Operation
7

The evaluation of the recoverability of identifiable intangible assets is measured by comparing the carrying amount of the asset against estimated undiscounted cash flows associated with it. Impairment may be caused by a number of factors, including a significant decrease in the market value of an asset or a significant adverse change in the manner in which the asset is being used. The evaluation of asset impairment requires us to make assumptions about future cash flows over the life of the asset being evaluated. These assumptions require significant judgment and actual results may differ from assumed and estimated amounts.
Upon completing our review, testing and considerable analysis including significant assumptions and judgments by management for the current period, we did not recognize any impairment from our intangible assets. Our valuation methodology for assessing impairment requires management to make judgments and assumptions based on historical experience and to rely, heavily, on projections of future operating performance. There is no assurance that such results will be achieved, and in that case we may be required to record an additional impairment to our goodwill and other long-lived intangible assets in future periods.
Stock-based compensationCompensation costs are recognized in the financial statements at fair value for stock options or grants awarded to employees and directors. Options and warrants granted to non-employees are recorded as an expense at the date of grant based on the then estimated fair value of the security granted. The fair value of the options at grant date was estimated using the Black-Scholes Option Pricing Model. Stock grants to employees and directors are charged to expense at the closing price of the common stock at date of grant.
Segment reportingAll of our operations constitute a single segment, that of educational services. Net revenues from non-educational services, such as video production are not a material part of our operating income.
Income taxesWe account for deferred tax assets available principally from our fixed and intangible assets and our net operating loss carryforwards in accordance with the Accounting Standards Codification. We make significant estimates and assumptions in calculating our current period income tax liability and deferred tax assets. The most significant of these are estimates regarding future period earnings. Our net deferred tax asset is estimated by management using a three-year taxable income projection that incorporates significant estimates and assumptions of future operating periods, including potential new business from either the introduction of new products or greater sales efforts, as well as planned cost reductions.
Results of OperationsComparison of the years ended December 31, 2013 and 2012
The following table compares our statement of operations data for the years ended December 31, 2013 and 2012. The trends suggested by this table may not be indicative of future operating results, which will depend on various factors including the relative mix of products sold (accounting/finance, engineering or corporate education) and the method of sale (video or online).
Year ended December 31 2013 2012 Amount Percentage Amount Percentage Change
Net revenues $16,831,004 100.0% $ 15,883,212 100.0% 6.0%Cost of revenues 7,554,388 44.9% 7,028,032 44.2% 7.5%
Gross profit 9,276,616 55.1% 8,855,180 55.8% 4.8%
Selling, general and administrative 7,996,727 47.5% 8,346,635 52.6% (4.2)%Depreciation and amortization 1,131,499 6.7% 1 ,1 18 ,1 5 7 7.0% 1.2%Impairment of goodwill — —% 568,000 3.6% —%
Total operating expenses 9,128,226 54.2% 10,032,792 63.2% (9.0)%
Operating income (loss) 148,390 0.9% (1,177,612) (7.4)% 112.6%Other income, net 21,476 0.1% 17,526 0.1% 22.5%
Income (loss) before provision for income taxes 169,866 1.0% (1,160,086) (7.3)% 114.6%Provision for income taxes (26,943) (0.4)% (735,379) (4.6)% 96.3%
Net income (loss) $ 142,923 0.8% $(1,895,465) (11.9)% 107.5%
Net revenuesNet revenues for 2013 increased 6%, compared to net revenues for 2012, primarily as a result of increased work from our custom-based Skye subsidiary and from our financial services division. Our live education businesses represent approximately 24% of our net revenues. Net revenues from subscription-based and non-subscription based products delivered online, exclusive of advertising and other service income accounted for approximately $6.7 million, or 40%, of our net revenues.
Net revenues from our accounting/finance division increased in absolute dollars by approximately $148,000 but decreased as a percentage of total net revenues. Net revenues from our accounting/finance and related products increased from approximately $12.2 million in 2012 to $12.4 million in 2013. Net revenues from accounting/finance products, including both subscription and non-subscription based revenue, was $8.4 million in 2013 and $8.2 million in 2012. Net revenues from live programs and custom work were approximately $4.1 million in both 2013 and 2012.
smartpros ltd. and subsidiaries
Management’s Discussion and Analysis of Financial Condition and Results of Operation
8
Net revenues from sales of our engineering products, which are not subscription-based, were $467,000 in 2013, compared to $556,000 in 2012. The continual decline in engineering net revenues is due to a number of reasons, including fewer exam candidates, purchasing curtailments by both engineering firms and governmental agencies, and the need to update some of our courses. In addition to updating some of our existing courses, we recently added our “Construction Project Management Course” to our library. We are constantly seeking partners to either market our products or share their content with our customers. Engineering revenues include sales of our human resources, health and safety courses and our WatchIT technology subscription-based product.
Net revenues from SmartPros Legal and Ethics decreased from $712,000 in 2012 to $424,000 in 2013. This decrease was primarily due to a decrease of $114,000 from our Cognistar legal division, and a decrease of $174,000 from our Working Values ethics division. The ethics division’s income is derived primarily from custom consulting jobs. The decrease in Cognistar net revenues is due to custom work performed in 2012 from a client with whom we built a portal to host their legal education course material. We will share revenue generated by this portal with that client.
Skye generated $1.57 million of net revenues in 2013, compared to $771,000 in 2012. Skye produces customized training and educational material for the pharmaceutical industry, professional firms, financial services companies and others. As the economy recovers from the recession, we are seeing an increase in requests for proposals. However, the revenue recognition cycle for this type of work can be long as there can be a time lag between the time a client engages Skye and the actual work begins. This results in the timing of earned income, as contracts are signed and the work is postponed for a period of months.
Our financial services education division generated net revenues of $1.81 million in 2013, compared to $1.44 million in 2012. The increase is primarily a result of the completion of custom work in 2013.
Net revenues from video production, duplication and consulting services increased in 2013 to $134,000 from $125,000 in 2012, as a result of increased consulting work offset by a reduction in video work. Video production and duplication income fluctuates annually, but overall they continue to decline. The duplication business has declined because tape is no longer used and we do not have the capability of doing very large DVD duplication projects. Our video production facility is primarily used for internal work and income results from renting our facilities and our equipment. Consulting work varies from year to year and sales are credited to the department from which they originate and not to the department where the work is performed.
Cost of revenuesCost of revenues includes (i) production costs, such as the salaries, benefits and other costs related to personnel, whether our employees or independent contractors, who are used directly in connection with producing or conducting
our educational programs, (ii) royalties paid to third parties, (iii) the cost of materials, such as DVDs, printed matter and packaging materials, and (iv) shipping costs. Compared to 2012, cost of revenues in 2013 increased by approximately $526,000 from $7.0 million in 2012 to $7.6 million in 2013, and is directly related to the increase in revenues. The increase is primarily due to the use of outsourced labor, for both internal needs as well as those costs related to specific custom jobs. The costs of running our live seminars remained relatively constant in both 2013 and 2012. Cost of revenues increased in real dollars from $7.03 million in 2012 to $7.55 million in 2013, and as a percentage of net revenues, they increased to 44.9% from 44.2% in 2012. This resulted in a corresponding 4.8% increase in our gross profit margin from $8.86 million in 2012 to $9.28 million in 2013.
There are many different types of expenses that are characterized as production costs and they vary from period to period depending on many factors. The expenses that showed the greatest variations from 2012 to 2013 and the reasons for those variations are as follows:
• Outside labor and direct production costs. Outside labor includes the cost of hiring actors and production personnel, such as directors, producers and cameramen, and the outsourcing of non-video technology. It also includes the costs of instructors for live programs and the production of those courses. These costs increased by approximately $552,000 in 2013 from 2012. Both Skye and our consulting/technology departments employ a number of consultants to write scripts, edit course material, provide technology services and help develop new products such as Skye’s Role Play Certification Tool and The Coaching Toolkit. Loscalzo and EEI employ a number of consultants to develop course material, in addition to hiring instructors to deliver programs throughout the United States. We have been outsourcing some of the programming and content development functions that were previously done by our employees to firms outside of the United States. Direct production costs, which are costs related to producing videos other than labor costs — such as the cost of renting equipment and locations, and the purchase of materials — increased by $59,000. These variations are related to the type of video production and custom projects and do not reflect any trends in our business. • Salaries. Overall payroll and related costs attributable to production personnel decreased by approximately $68,000. The decrease was primarily attributable to re-allocations of employees’ salaries. Our overall headcount did not increase. Our SLE and Skye salaries and related costs decreased by $44,000, Salaries and related costs from our Loscalzo subsidiary increased approximately $73,000 as a result of the allocation of the division’s president’s duties. There were no additional employees in Loscalzo. Our FinancialCampus division accounted for an additional $149,000 in savings, offset by an increase of $135,000 in our technology division.
smartpros ltd. and subsidiaries
Management’s Discussion and Analysis of Financial Condition and Results of Operation
9

• Royalties. Royalty expense increased by $52,000 in 2013 from 2012, from approximately $1.02 million in 2012 to $1.07 million in 2012. Royalty expense is directly related to sales of certain products in our accounting and engineering catalogs, and as usage fluctuates so does our royalty expense. We often have to estimate the royalty expense due to our partners, as the information may not be readily available. If volume increases or if we enter into new agreements or modify existing agreements, the actual royalty payments in 2014 under these agreements may be either higher or lower than they were in 2013. • Other costs. This includes the cost of venues for our live educational program business, travel for instructors and others, shipping costs and other miscellaneous expenses. These other costs decreased by $68,000, primarily related to our live education business. The largest component of these expenses are venue, travel and course administration costs that decreased by $50,000 in 2013 from 2012. Travel costs incurred by Skye and Loscalzo are often billed to their respective clients.
As our business grows, we may be required to hire additional production personnel, increasing our cost of revenues. Selling, general and administrative expensesSelling, general and administrative expenses include corporate overhead such as (i) compensation and benefits for administrative, sales and marketing and finance personnel, (ii) rent, (iii) insurance, (iv) professional fees, (v) travel and entertainment, and (vi) office expenses. Selling, general and administrative expenses in 2013 decreased by approximately $350,000 from 2012, a 4.2% decrease. The decrease in terms of actual expenses is primarily from reductions in payroll and related costs as headcounts have been reduced. Reductions in compensation expense totaled $452,000. Overhead expenses for rent, technology-related expenses, advertising, promotional material and other selling expenses increased by approximately $86,000. Exclusive of these increases, other overhead expenses remained constant due to reductions in expense such as the cost of processing credit card transactions, outsourced customer service and sales personnel. The cost of maintaining our technology, such as annual software and maintenance licenses as well as our bandwidth costs continue to increase. In addition, in conformity with applicable accounting standards, we are expensing the costs associated with the grants of options and restricted stock to employees and directors. This non-cash expense in 2013 was $105,000 and $116,000 in 2012. We anticipate that selling, general and administrative expenses will remain constant in 2013 at our current level of operations.
Depreciation and amortizationDepreciation and amortization expenses were $13,000 higher in 2013 than they were in 2012. This increase is primarily from the amortization of internally developed software and courses, as many of the intangible assets acquired in acquisitions are now fully amortized. The total capitalized cost of eCampus is $2.19 million and is being amortized over five years. Although we are always upgrading our computer hardware and systems, and with
some projects in development, we expect our depreciation and amortization expenses on our fixed and intangible assets to decrease, as many of the assets acquired in prior acquisitions are either fully or nearly completely amortized and a substantial portion of the eCampus cost is now amortized.
Impairment of goodwillWe continuously monitor our goodwill and other long-lived assets for impairment. We perform an annual review prior to our year end or when circumstances indicate an event has occurred that would cause an earlier review of goodwill. In 2012, after careful analysis of expected future operating cash flows and other tests, we determined that the goodwill acquired as a result of the contingent purchase price paid for Skye Multimedia, Ltd. was impaired by $568,000. There was no additional impairment in 2013. We will continue to monitor these assets for any possible future impairment. It is possible that based on future operating results that we may incur additional impairment to this and our other long-lived assets.
Operating income (loss)For 2013, our operating income was $148,000, compared to an operating loss of $1.18 million in 2012. The increase in net revenues of approximately $948,000 and the reduced selling, general and administrative expenses of approximately $350,000 are the primary reasons for the approximately $1.33 million, increase in operating income.
Other income, netOther income and expense items primarily consist of interest earned on deposits, offset by the loss from our joint venture in iReflect, LLC. We currently have no outstanding debt, other than normal trade payables. Net interest income was relatively constant from 2012 to 2013. In addition, our joint venture in iReflect resulted in a loss of $6,000 in 2013, compared to a loss of $9,500 in 2012.
Income tax expenseIn 2013, we recorded a net tax expense of $27,000, compared to a $735,000 net tax expense in 2012. We have analyzed all of the components of the deferred tax assets and liabilities and have recorded a net tax deferred asset of $600,000 in both 2013 and 2012. In 2012 we increased our valuation allowance to approximately $1,538,000, resulting in an adjustment of $690,000, to our deferred tax asset. The 2013 and 2012 state and local tax expense is approximately $27,000 and $45,000, respectively.
Net income (loss)For 2013, we recorded net income of $143,000, compared to a net loss of $1.9 million in 2012. The increase in net income is primarily due to the increase in net revenues of approximately $948,000 and the decrease in selling, general and administrative expenses of approximately $350,000, as well as the non-recurring 2012 adjustments for impairment of goodwill and deferred taxes of $1.26 million.
Liquidity and Capital ResourcesSince becoming a public company in 2004, we have financed our working capital requirements entirely through internally generated funds. We have not had any sales of stock or incurred any debt.
smartpros ltd. and subsidiaries
Management’s Discussion and Analysis of Financial Condition and Results of Operation
10

Our working capital as of December 31, 2013, was approximately $2.2 million, compared to a $2.3 million working capital as of December 31, 2012. The decrease is attributable to a number of factors, including the payment of approximately $270,000 in dividends, and the repurchase of our common stock for approximately $116,000. Our current ratio at December 31, 2013, is 1.37 to 1, compared to 1.38 to 1 at December 31, 2012. The current ratio is derived by dividing current assets by current liabilities and is a measure used by lending sources to assess our ability to repay short-term liabilities. The largest component of our current liabilities, approximately $4.4 million and $5.0 million at December 31, 2013 and 2012 respectively, is deferred revenue, which is revenue collected or billed but not yet earned under the principles of revenue recognition. Most of this deferred revenue at December 31, 2013, is in the form of subscription fees and will be earned during 2014. The cost of fulfilling our monthly subscription obligation does not exceed this revenue and is booked to expense as incurred. For some of our products, there are no additional costs, other than shipping costs, required to complete this obligation as the material is already in our library.
For the year ended December 31, 2013, we had a net increase in cash of $385,000. We generated $1.4 million in cash from operations, offset by $641,000 used in investing activities, after $500,000 of the certificates of deposit matured, offset by $272,000 for asset acquisitions and $864,000 for the capitalization of software and courses. In addition, our financing activities include $116,000 for the purchase of treasury shares and $270,000 for the payment of dividends. The primary components of our operating cash flows are our net income adjusted for non-cash expenses, such as depreciation and amortization, and the changes in accounts receivable, accounts payable and deferred revenues.
In comparison, for the year-ended December 31, 2012, we had a $1.36 million decrease in cash. That decrease was a result of cash generated by operations of $177,000, which was offset by cash expended for investing activities of $1.13 million primarily for asset acquisitions and capitalization of software and courses, and $413,000 for the purchase of treasury shares and the payment of dividends.
Capital expenditures for the year ended December 31, 2013, were approximately $1.14 million, of which $272,000 consisted primarily of computer equipment and software. We capitalized $864,000 of costs for the production of various courses and for capitalizing the costs of software. We are constantly reviewing and upgrading our technology. For fiscal 2014, we have budgeted approximately $350,000 for capital expenditures (other than software and course development costs). We believe that our current cash balances, together with cash flow from operations, will be sufficient to meet our working capital and capital expenditure requirements for the next 12 months.
On March 6, 2014, our Board of Directors declared a dividend of $.015 per common share payable on April 7, 2014, to shareholders of record on March 21, 2014.
In November 2013, the Board of Directors renewed the stock buy-back program for a total of $750,000. As of March 24, 2014, no purchases have been made pursuant to this program.
smartpros ltd. and subsidiaries
Management’s Discussion and Analysis of Financial Condition and Results of Operation
Contractual Obligation, Commitments and ContingenciesAs of December 31, 2013, we had commitments under various leases for our offices in Hawthorne, New York, Skye’s offices in Bridgewater, New Jersey, and Loscalzo’s office in Shrewsbury, New Jersey. The total aggregate commitment under these leases is approximately $1.96 million through January 2019. The Skye lease was recently extended to January 2015 at a monthly rental of $3,190 and the lease for the Loscalzo office expires on December 31, 2016, at a monthly rent of approximately $3,700.
In the future, we may issue additional debt or equity securities to satisfy our cash needs. Any debt incurred or issued may be secured or unsecured, at a fixed or variable interest rate and may contain other terms and conditions that our Board of Directors deems prudent. Any sales of equity securities may be at or below current market prices. We cannot assure that we will be success- ful in generating sufficient capital to adequately fund our liquidity needs.
Interest Rate RiskInterest rate risk represents the potential loss from adverse changes in market interest rates. As we may hold U.S. Treasury securities or money market funds, we may be exposed to interest rate risk arising from changes in the level and volatility of interest rates and in the shape of the yield curve.
Credit RiskMost of our cash is held in deposit accounts, U.S. Treasury and non-Treasury money market funds. Our bank deposit accounts are insured by the U.S. government but only up to a maximum of $250,000 at any one bank. Our money market funds are held in a brokerage account that is insured by the Security Industry Protection Corp up to $500,000 and various brokerage firms may carry additional insurance from commercial insurance companies. Our cash balances vary from time to time based on a variety of factors but in most cases are significantly in excess of the insurable limit. As a result, we have exposure on these accounts in the event these financial institutions become insolvent.
In addition, we may have credit risk with respect to customers who default on custom orders or who default on subscription payments
Recent Accounting Pronouncements
In July 2013, the Financial Accounting Standards Board (“FASB”) issued Accounting Standards Update (“ASU”) 2013-11 which provides that an unrecognized tax benefit, or portion of an unrecognized tax benefit, should be presented in the financial statements as a reduction of a deferred tax asset for a net operating loss carryforward, a similar tax loss or a tax credit carryforward. If an applicable deferred tax asset is not available or the tax law does not require the company to use and the company does not expect to use the applicable deferred tax asset for such purpose, the unrecognized tax benefit should be presented as a liability in the financial statements and should not be combined with an unrelated deferred tax asset. ASU 2013-11 is effective for annual reporting periods, and interim periods within those years, beginning after December 15, 2013. The amendments should be applied prospectively to all unrecognized tax benefits that exist at the effective date; however, retrospective application is permitted. The adoption of this update is not expected to have a material impact on the Company’s consolidated financial statements.
11

December 31, 2013 2012
Assets Current Assets: Cash and cash equivalents $ 5,303,657 $ 4,918,543 Certificates of deposit — 500,000 Accounts receivable, net of allowance for doubtful accounts of approximately $20,000 at December 31, 2013 and 2012, respectively 2,430,495 2,612,709 Prepaid expenses and other current assets 340,463 331,493
Total Current Assets 8,074,615 8,362,745
Property and Equipment, net 566,475 547,448 Goodwill 2,807,257 2,807,257 Other Intangibles, net 3,516,411 3,530,744 Other Assets, including restricted cash of $75,000 at December 31, 2013 and 2012, respectively 104,515 104,515 Deferred Tax Asset 600,000 600,000 Investment in Joint Venture 2,268 3,245
Total Assets $ 15,671,541 $15,955,954
Liabilities and Stockholders’ Equity Current Liabilities: Accounts payable $ 1,203,222 $ 706,948 Accrued expenses 234,863 272,921 Deferred revenue 4,395,166 5,006,496 Dividend payable 70,289 58,936
Total Current Liabilities 5,903,540 6,045,301
Long-Term Liabilities: Other liabilities 70,378 63,598
Total Long-Term Liabilities 70,378 63,598
Total Liabilities 5,973,918 6,108,899
Commitments and Contingencies Stockholders’ Equity: Preferred stock, $.001 par value; 1,000,000 shares authorized, no shares issued and outstanding — — Common stock, $.0001 par value; 30,000,000 shares authorized, 5,665,433 and 5,622,433 shares issued as of December 31, 2013 and 2012, respectively, and 4,684,441 and 4,714,914 shares outstanding as of December 31, 2013 and 2012, respectively 567 563 Additional paid-in capital 17,217,008 17,393,260 Accumulated deficit (4,834,220) (4,977,143) Common stock in treasury, at cost - 980,992 and 907,519 shares as of December 31, 2013 and 2012, respectively (2,685,732) (2,569,625)
Total Stockholders’ Equity 9,697,623 9,847,055
Total Liabilities and Stockholders’ Equity $ 15,671,541 $15,955,954
See independent auditor’s report and notes to consolidated financial statements.
smartpros ltd. and subsidiaries
Consolidated Balance Sheets
12
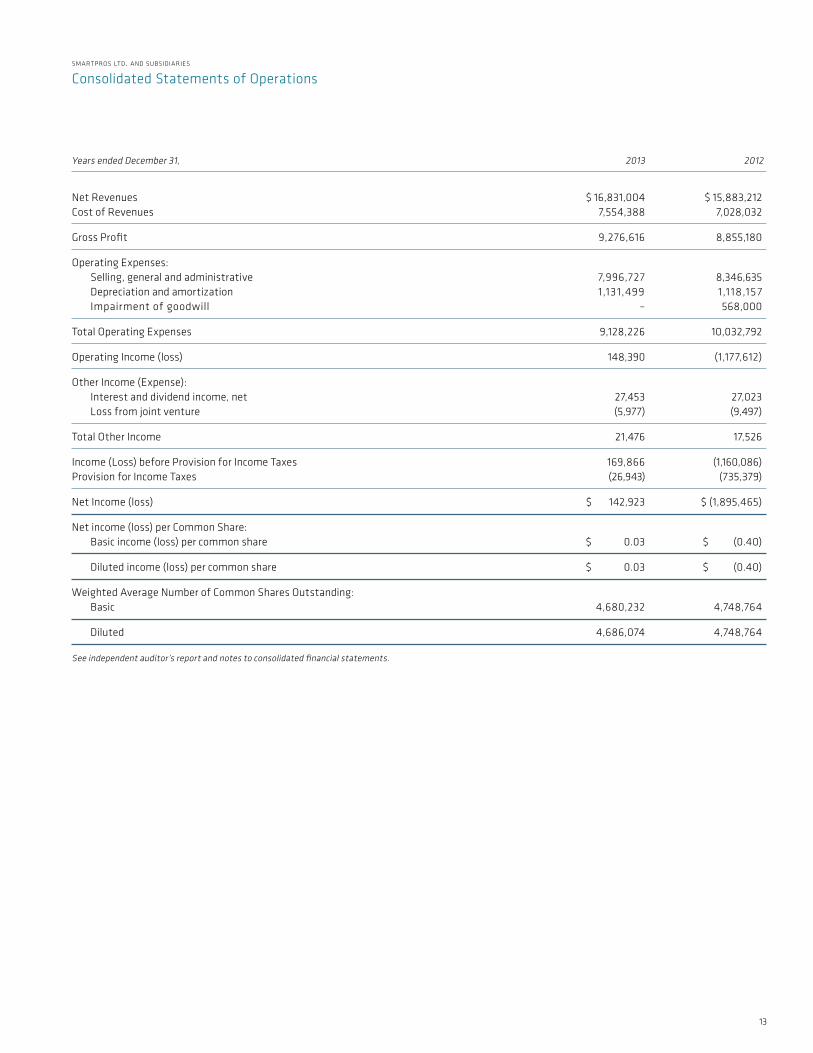
Years ended December 31, 2013 2012
Net Revenues $ 16,831,004 $ 15,883,212 Cost of Revenues 7,554,388 7,028,032
Gross Profit 9,276,616 8,855,180
Operating Expenses: Selling, general and administrative 7,996,727 8,346,635 Depreciation and amortization 1,131,499 1,1 18,157 Impairment of goodwill – 568,000
Total Operating Expenses 9,128,226 10,032,792
Operating Income (loss) 148,390 (1,177,612)
Other Income (Expense): Interest and dividend income, net 27,453 27,023 Loss from joint venture (5,977) (9,497)
Total Other Income 21,476 17,526
Income (Loss) before Provision for Income Taxes 169,866 (1,160,086) Provision for Income Taxes (26,943) (735,379)
Net Income (loss) $ 142,923 $ (1,895,465)
Net income (loss) per Common Share: Basic income (loss) per common share $ 0.03 $ (0.40)
Diluted income (loss) per common share $ 0.03 $ (0.40)
Weighted Average Number of Common Shares Outstanding: Basic 4,680,232 4,748,764
Diluted 4,686,074 4,748,764
See independent auditor’s report and notes to consolidated financial statements.
smartpros ltd. and subsidiaries
Consolidated Statements of Operations
13

Years ended December 31, 2013 and 2012 Additional Total Preferred Stock Common Stock Paid-in Accumulated Treasury Stockholders’ Shares Amount Shares Amount Capital Deficit Stock Equity
Balance, December 31, 2011 — $ — 5,615,433 $ 562 $ 17,514,275 $(3,081,678) $(2,393,717) $12,039,442
Dividends — — — — (236,705) — — (236,705)
Shares issued from Restricted Stock Plan — — 7,000 1 (1) — — —
Stock Compensation Expense — — — — 115,691 — — 115,691
Purchase of Treasury Shares — — — — — — (175,908) (175,908)
Net (loss) — — — — — (1,895,465) — (1,895,465)
Balance, December 31, 2012 — — 5,622,433 563 17,393,260 (4,977,143) (2,569,625) 9,847,055
Shares issued from Restricted Stock Plan — — 43,000 4 (4) — — —
Stock Compensation Expense — — — — 104,788 — — 104,788
Dividends — — — — (281,036) — — (281,036)
Purchase of Treasury Shares — — — — — — (116,107) (116,107)
Net income — — — — — 142,923 — 142,923
Balance, December 31, 2013 — $ — 5,665,433 $ 567 $ 17,217,008 $(4,834,220) $(2,685,732) $ 9,697,623
See independent auditor’s report and notes to consolidated financial statements.
smartpros ltd. and subsidiaries
Consolidated Statements of Stockholders’ Equity
14

Years ended December 31, 2013 2012
Cash Flows from Operating Activities: Net income (loss) $ 142,923 $ (1,895,465)
Adjustments to reconcile net income (loss) to net cash provided by operating activities: Depreciation and amortization 1,131,499 1,1 18,157 Stock compensation expense 104,788 115,691 Deferred income tax provision — 690,000 Impairment of goodwill — 568,000 Loss from joint venture 5,977 9,497 Deferred rent 6,780 (2,906) Changes in operating assets and liabilities: (Increase) decrease in operating assets: Accounts receivable 182,214 (744,646) Prepaid expenses and other current assets (8,970) 3,333 Other assets — (11,550) (Decrease) increase in operating liabilities: Accounts payable and accrued expenses 458,216 (73,635) Deferred revenue (611,330) 400,241
Total adjustments 1,269,174 2,072,182
Net Cash Provided by Operating Activities 1,412,097 176,717
Cash Flows from Investing Activities: (Redemption) of, investment in certificates of deposit 500,000 (500,000) Acquisition of property and equipment (271,881) (183,482) Capitalized course costs and software development (864,312) (343,930) Investment in joint venture (5,000) (10,000) Cash paid for business assets — (89,874)
Net Cash Used in Investing Activities (641,193) (1,127,286)
Cash Flows from Financing Activities: Purchase of treasury shares (116,107) (175,908) Dividends paid (269,683) (236,705)
Net Cash Used in Financing Activities (385,790) (412,613)
Net Increase (Decrease) in Cash and Cash Equivalents 385,114 (1,363,182) Cash and Cash Equivalents, beginning of year 4,918,543 6,281,725
Cash and Cash Equivalents, end of year $ 5,303,657 $ 4,918,543
Supplemental Disclosures of Cash Flow Information: Cash paid for interest $ — $ — Cash paid for income taxes $ 25,420 $ 45,400
See independent auditor’s report and notes to consolidated financial statements.
smartpros ltd. and subsidiaries
Consolidated Statements of Cash Flows
15

Note 1. Description of Business and Summary of Significant Accounting Policies
Nature of operations - SmartPros Ltd. and Subsidiaries (“SmartPros” or the “Company”), a Delaware corporation, was organized in 1981 for the purpose of producing educational videos primarily directed to the accounting profession. SmartPros’ primary products are periodic subscription and non-subscriptions services delivered in either video format or over the Internet directed to corporate accountants and financial managers, and accountants in public practice. Our Loscalzo Associates, Ltd. (“Loscalzo”) subsidiary, and our Executive Enterprises Institute (“EEI”) division, are leading providers of live training to accounting, legal, and financial services professionals. In addition, the Company produces a series of continuing education courses directed to the engineering profession, a series of courses designed for candidates for various professional engineering exams and training for infor-mation technology professionals. Its wholly owned subsidiary, SmartPros Legal and Ethics, Ltd. (“SLE”) produces ethics, governance, and compliance programs for corporate clients and, through its Cognistar division, produces online and customized educational courses for the legal profession. Its wholly owned subsidiary, Skye Multimedia Ltd. (“Skye”), produces customized educational solutions for a number of industries, including pharmaceuticals, professional services, and others. The Company also has various other online content, including a library of nationally certified training solutions for the banking, securities, and insurance industries, as well as a library for health, safety and human resources professionals. Some of these courses may also be designed for live programs. SmartPros also develops and hosts websites, produces custom videos and rents out its video production studio for a fee. SmartPros’ corporate headquarters is located in Hawthorne, New York, where it maintains its corporate offices, new media lab, and video production studio.
Basis of presentation - The consolidated financial statements of SmartPros include the accounts of SmartPros and its wholly owned subsidiaries, SLE, Skye, and Loscalzo. All significant intercompany balances and transactions have been eliminated.
Estimates - The preparation of financial statements in conformity with generally accepted accounting principles requires management to make estimates and assumptions that affect the reported amounts of assets and liabilities and disclosure of contingent assets and liabilities at the dates of financial statements and the reported amounts of revenues and expenses during the reporting period. Actual results could differ from those estimates.
Revenue recognition - The Company recognizes revenue from its subscription services as earned. Subscriptions are generally billed in advance on an annual basis, deferred at the time of billing and amortized into revenue on a monthly basis over the term of the subscription, generally one year. Engineering productsare non-subscription based and revenue is recognized upon shipment or, in the case of online sales, upon receipt of payment. Revenues from other
non-subscription services, such as website design, video production, consulting services, and custom projects, are recognized on a percentage of completion method where sufficient information relating to project status and other supporting documentation is available. The contracts may have different billing arrangements resulting in either unbilled or deferred revenue. The Company obtains either signed agreements or purchase orders from its non-subscription customers outlining the terms and conditions of the products or services to be provided. Otherwise, revenues are recognized after completion and/or delivery of services to the customer. Revenues from live programs are recognized upon completion of the conference or seminar, which usually last one to three days. Expenses directly related to the seminars, including marketing costs, are charged to operations in the period in which the seminar is held.
Segment reporting - The Company has evaluated the requirements under Topic 280, Segment Reporting, of the Accounting Standards Codification (“ASC”). The Company’s management monitors the revenue streams of its various products and services; however, operations are managed and financial performance is evaluated on a Company-wide basis. Accordingly, all of the Company’s operations are considered to be aggregated in one reportable segment, educational services.
Cash and cash equivalents - All highly liquid instruments with an original maturity of three months or less are considered cash equivalents. From time to time, the Company invests a portion of its excess cash in money market accounts that are stated at cost and approximate fair value.
Concentration of credit risk - Financial instruments that subject the Company to concentrations of credit risk consist primarily of cash and cash equivalents, and accounts receivable. From time to time, the cash balances exceed insured limits. The Company’s cash balances are deposited with high credit quality financial institutions to mitigate this risk. The Company closely monitors its cash investments in money market funds. No single customer represents a significant concentration (over 10%) of sales or receivables.
Accounts receivable - Accounts receivable are recorded at net realizable value which is the original invoice amount less an allowance that manage-ment believes will be adequate to absorb estimated losses on existing accounts receivable. The allowance is established through a provision for bad debts charged to operations. Accounts receivable are charged against the allowance for doubtful accounts when management believes that collectability is unlikely. The allowance is an amount that management believes will be adequate to absorb estimated losses on existing accounts receivable, based on an evaluation of the collectability of accounts receivable and prior bad debt experience. This evaluation also takes into consideration such factors as changes in the nature and volume of the accounts receivable, overall accounts receivable quality, review of specific problem accounts receivable, and current economic conditions that may affect the customer’s ability to pay. While management uses the best information available to make its evaluation, future adjustments to the allowance may be necessary if there are significant changes in economic conditions.
Accounts receivable are generally considered to be past due if any portion of the receivable balance is outstanding for more than 90 days.
smartpros ltd. and subsidiaries
Notes to Consolidated Financial Statements Years Ended December 31, 2013 and 2012
16
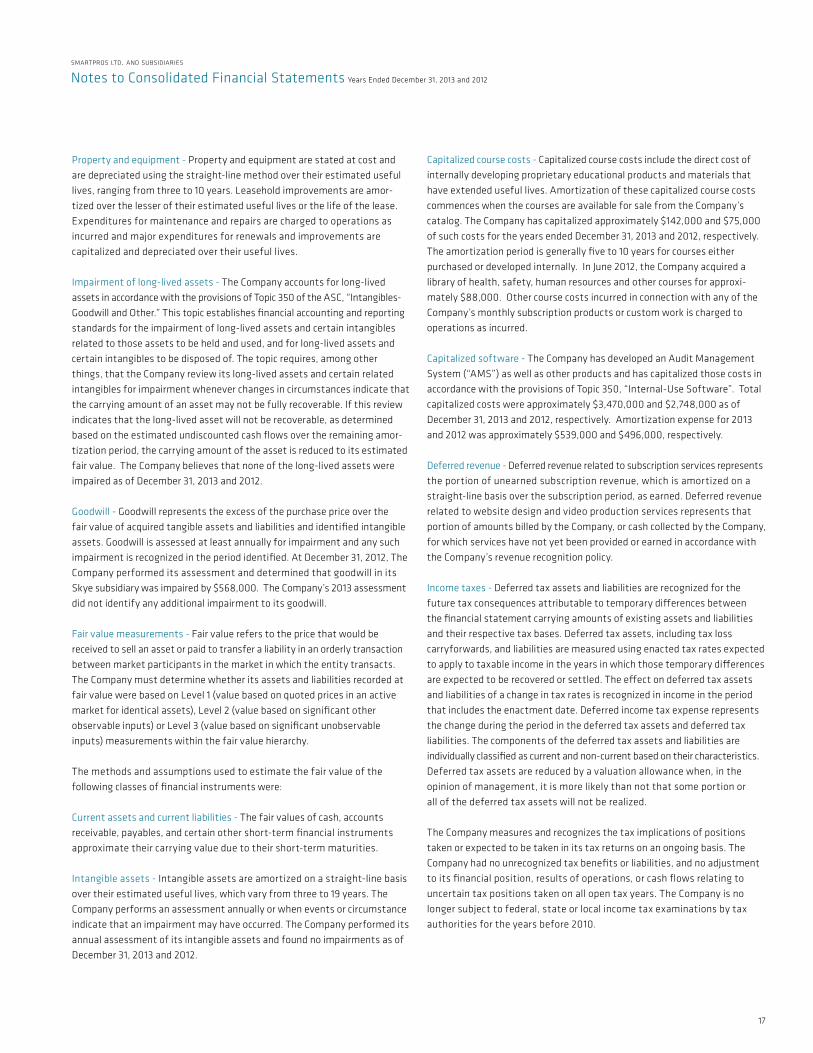
Property and equipment - Property and equipment are stated at cost and are depreciated using the straight-line method over their estimated useful lives, ranging from three to 10 years. Leasehold improvements are amor-tized over the lesser of their estimated useful lives or the life of the lease. Expenditures for maintenance and repairs are charged to operations as incurred and major expenditures for renewals and improvements are capitalized and depreciated over their useful lives.
Impairment of long-lived assets - The Company accounts for long-lived assets in accordance with the provisions of Topic 350 of the ASC, “Intangibles- Goodwill and Other.” This topic establishes financial accounting and reporting standards for the impairment of long-lived assets and certain intangibles related to those assets to be held and used, and for long-lived assets and certain intangibles to be disposed of. The topic requires, among other things, that the Company review its long-lived assets and certain related intangibles for impairment whenever changes in circumstances indicate that the carrying amount of an asset may not be fully recoverable. If this review indicates that the long-lived asset will not be recoverable, as determined based on the estimated undiscounted cash flows over the remaining amor-tization period, the carrying amount of the asset is reduced to its estimated fair value. The Company believes that none of the long-lived assets were impaired as of December 31, 2013 and 2012.
Goodwill - Goodwill represents the excess of the purchase price over the fair value of acquired tangible assets and liabilities and identified intangible assets. Goodwill is assessed at least annually for impairment and any such impairment is recognized in the period identified. At December 31, 2012, The Company performed its assessment and determined that goodwill in its Skye subsidiary was impaired by $568,000. The Company’s 2013 assessment did not identify any additional impairment to its goodwill.
Fair value measurements - Fair value refers to the price that would be received to sell an asset or paid to transfer a liability in an orderly transaction between market participants in the market in which the entity transacts. The Company must determine whether its assets and liabilities recorded at fair value were based on Level 1 (value based on quoted prices in an active market for identical assets), Level 2 (value based on significant other observable inputs) or Level 3 (value based on significant unobservable inputs) measurements within the fair value hierarchy.
The methods and assumptions used to estimate the fair value of the following classes of financial instruments were:
Current assets and current liabilities - The fair values of cash, accounts receivable, payables, and certain other short-term financial instruments approximate their carrying value due to their short-term maturities.
Intangible assets - Intangible assets are amortized on a straight-line basis over their estimated useful lives, which vary from three to 19 years. The Company performs an assessment annually or when events or circumstance indicate that an impairment may have occurred. The Company performed its annual assessment of its intangible assets and found no impairments as of December 31, 2013 and 2012.
Capitalized course costs - Capitalized course costs include the direct cost of internally developing proprietary educational products and materials that have extended useful lives. Amortization of these capitalized course costs commences when the courses are available for sale from the Company’s catalog. The Company has capitalized approximately $142,000 and $75,000 of such costs for the years ended December 31, 2013 and 2012, respectively. The amortization period is generally five to 10 years for courses either purchased or developed internally. In June 2012, the Company acquired a library of health, safety, human resources and other courses for approxi-mately $88,000. Other course costs incurred in connection with any of the Company’s monthly subscription products or custom work is charged to operations as incurred.
Capitalized software - The Company has developed an Audit Management System (“AMS”) as well as other products and has capitalized those costs in accordance with the provisions of Topic 350, “Internal-Use Software”. Total capitalized costs were approximately $3,470,000 and $2,748,000 as of December 31, 2013 and 2012, respectively. Amortization expense for 2013 and 2012 was approximately $539,000 and $496,000, respectively.
Deferred revenue - Deferred revenue related to subscription services represents the portion of unearned subscription revenue, which is amortized on a straight-line basis over the subscription period, as earned. Deferred revenue related to website design and video production services represents that portion of amounts billed by the Company, or cash collected by the Company, for which services have not yet been provided or earned in accordance with the Company’s revenue recognition policy.
Income taxes - Deferred tax assets and liabilities are recognized for the future tax consequences attributable to temporary differences between the financial statement carrying amounts of existing assets and liabilities and their respective tax bases. Deferred tax assets, including tax loss carryforwards, and liabilities are measured using enacted tax rates expected to apply to taxable income in the years in which those temporary differences are expected to be recovered or settled. The effect on deferred tax assets and liabilities of a change in tax rates is recognized in income in the period that includes the enactment date. Deferred income tax expense represents the change during the period in the deferred tax assets and deferred tax liabilities. The components of the deferred tax assets and liabilities are individually classified as current and non-current based on their characteristics. Deferred tax assets are reduced by a valuation allowance when, in the opinion of management, it is more likely than not that some portion or all of the deferred tax assets will not be realized.
The Company measures and recognizes the tax implications of positions taken or expected to be taken in its tax returns on an ongoing basis. The Company had no unrecognized tax benefits or liabilities, and no adjustment to its financial position, results of operations, or cash flows relating to uncertain tax positions taken on all open tax years. The Company is no longer subject to federal, state or local income tax examinations by tax authorities for the years before 2010.
smartpros ltd. and subsidiaries
Notes to Consolidated Financial Statements Years Ended December 31, 2013 and 2012
17
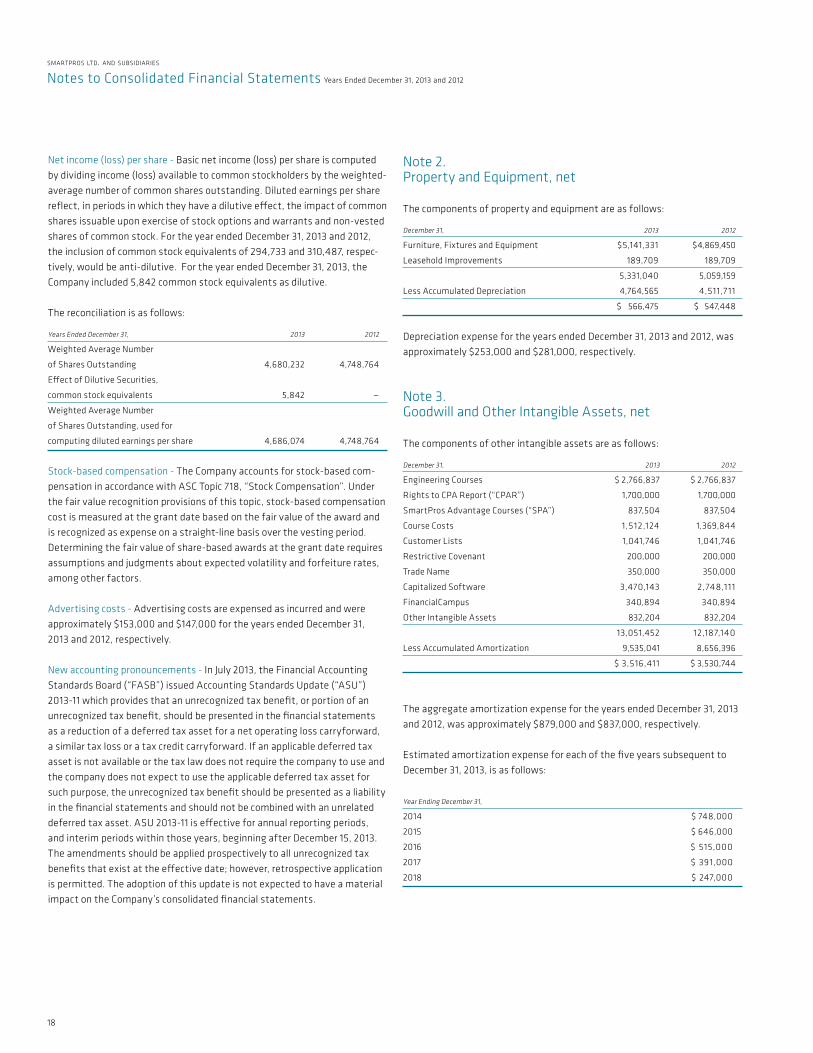
Net income (loss) per share - Basic net income (loss) per share is computed by dividing income (loss) available to common stockholders by the weighted-average number of common shares outstanding. Diluted earnings per share reflect, in periods in which they have a dilutive effect, the impact of common shares issuable upon exercise of stock options and warrants and non-vested shares of common stock. For the year ended December 31, 2013 and 2012, the inclusion of common stock equivalents of 294,733 and 310,487, respec-tively, would be anti-dilutive. For the year ended December 31, 2013, the Company included 5,842 common stock equivalents as dilutive.
The reconciliation is as follows:
Years Ended December 31, 2013 2012
Weighted Average Number
of Shares Outstanding 4,680,232 4,748,764
Effect of Dilutive Securities,
common stock equivalents 5,842 —
Weighted Average Number
of Shares Outstanding, used for
computing diluted earnings per share 4,686,074 4,748,764
Stock-based compensation - The Company accounts for stock-based com-pensation in accordance with ASC Topic 718, “Stock Compensation”. Under the fair value recognition provisions of this topic, stock-based compensation cost is measured at the grant date based on the fair value of the award and is recognized as expense on a straight-line basis over the vesting period. Determining the fair value of share-based awards at the grant date requires assumptions and judgments about expected volatility and forfeiture rates, among other factors.
Advertising costs - Advertising costs are expensed as incurred and were approximately $153,000 and $147,000 for the years ended December 31, 2013 and 2012, respectively.
New accounting pronouncements - In July 2013, the Financial Accounting Standards Board (“FASB”) issued Accounting Standards Update (“ASU”) 2013-11 which provides that an unrecognized tax benefit, or portion of an unrecognized tax benefit, should be presented in the financial statements as a reduction of a deferred tax asset for a net operating loss carryforward, a similar tax loss or a tax credit carryforward. If an applicable deferred tax asset is not available or the tax law does not require the company to use and the company does not expect to use the applicable deferred tax asset for such purpose, the unrecognized tax benefit should be presented as a liability in the financial statements and should not be combined with an unrelated deferred tax asset. ASU 2013-11 is effective for annual reporting periods, and interim periods within those years, beginning after December 15, 2013. The amendments should be applied prospectively to all unrecognized tax benefits that exist at the effective date; however, retrospective application is permitted. The adoption of this update is not expected to have a material impact on the Company’s consolidated financial statements.
Note 2. Property and Equipment, net
The components of property and equipment are as follows:
December 31, 2013 2012
Furniture, Fixtures and Equipment $5,141,331 $4,869,450
Leasehold Improvements 189,709 189,709
5,331,040 5,059,159
Less Accumulated Depreciation 4,764,565 4,511,7 11
$ 566,475 $ 547,448
Depreciation expense for the years ended December 31, 2013 and 2012, was approximately $253,000 and $281,000, respectively.
Note 3. Goodwill and Other Intangible Assets, net
The components of other intangible assets are as follows:
December 31, 2013 2012
Engineering Courses $ 2,766,837 $ 2,766,837
Rights to CPA Report (“CPAR”) 1,700,000 1,700,000
SmartPros Advantage Courses (“SPA”) 837,504 837,504
Course Costs 1,512,124 1,369,844
Customer Lists 1,041,746 1,041,746
Restrictive Covenant 200,000 200,000
Trade Name 350,000 350,000
Capitalized Software 3,470,143 2,748,111
FinancialCampus 340,894 340,894
Other Intangible Assets 832,204 832,204
13,051,452 12,187,140
Less Accumulated Amortization 9,535,041 8,656,396
$ 3,516,411 $ 3,530,744
The aggregate amortization expense for the years ended December 31, 2013 and 2012, was approximately $879,000 and $837,000, respectively.
Estimated amortization expense for each of the five years subsequent to December 31, 2013, is as follows:
Year Ending December 31,
2014 $ 748,000
2015 $ 646,000
2016 $ 515,000
2017 $ 391,000
2018 $ 247,000
smartpros ltd. and subsidiaries
Notes to Consolidated Financial Statements Years Ended December 31, 2013 and 2012
18
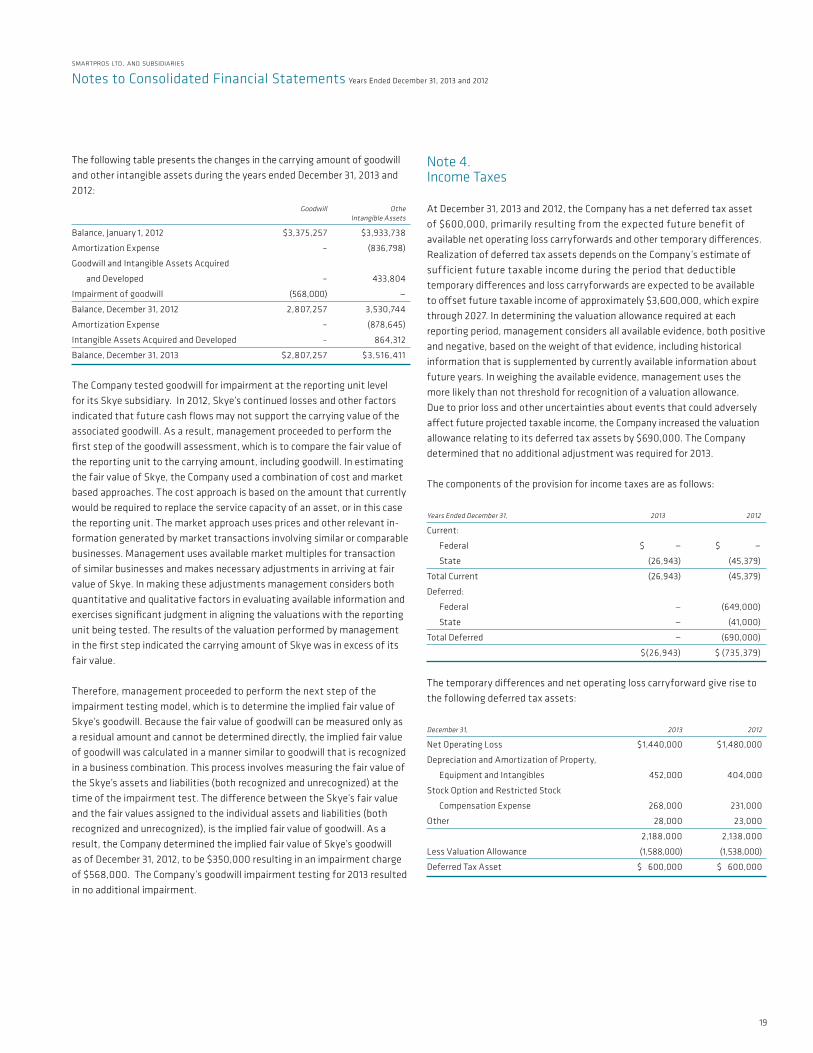
The following table presents the changes in the carrying amount of goodwill and other intangible assets during the years ended December 31, 2013 and 2012:
Goodwill Othe Intangible Assets
Balance, January 1, 2012 $3,375,257 $3,933,738
Amortization Expense – (836,798)
Goodwill and Intangible Assets Acquired
and Developed – 433,804
Impairment of goodwill (568,000) —
Balance, December 31, 2012 2,807,257 3,530,744
Amortization Expense – (878,645)
Intangible Assets Acquired and Developed – 864,312
Balance, December 31, 2013 $2,807,257 $3,516,411
The Company tested goodwill for impairment at the reporting unit level for its Skye subsidiary. In 2012, Skye’s continued losses and other factors indicated that future cash flows may not support the carrying value of the associated goodwill. As a result, management proceeded to perform the first step of the goodwill assessment, which is to compare the fair value of the reporting unit to the carrying amount, including goodwill. In estimating the fair value of Skye, the Company used a combination of cost and market based approaches. The cost approach is based on the amount that currently would be required to replace the service capacity of an asset, or in this case the reporting unit. The market approach uses prices and other relevant in-formation generated by market transactions involving similar or comparable businesses. Management uses available market multiples for transaction of similar businesses and makes necessary adjustments in arriving at fair value of Skye. In making these adjustments management considers both quantitative and qualitative factors in evaluating available information and exercises significant judgment in aligning the valuations with the reporting unit being tested. The results of the valuation performed by management in the first step indicated the carrying amount of Skye was in excess of its fair value.
Therefore, management proceeded to perform the next step of the impairment testing model, which is to determine the implied fair value of Skye’s goodwill. Because the fair value of goodwill can be measured only as a residual amount and cannot be determined directly, the implied fair value of goodwill was calculated in a manner similar to goodwill that is recognized in a business combination. This process involves measuring the fair value of the Skye’s assets and liabilities (both recognized and unrecognized) at the time of the impairment test. The difference between the Skye’s fair value and the fair values assigned to the individual assets and liabilities (both recognized and unrecognized), is the implied fair value of goodwill. As a result, the Company determined the implied fair value of Skye’s goodwill as of December 31, 2012, to be $350,000 resulting in an impairment charge of $568,000. The Company’s goodwill impairment testing for 2013 resulted in no additional impairment.
Note 4. Income Taxes
At December 31, 2013 and 2012, the Company has a net deferred tax asset of $600,000, primarily resulting from the expected future benefit of available net operating loss carryforwards and other temporary differences. Realization of deferred tax assets depends on the Company’s estimate of sufficient future taxable income during the period that deductible temporary differences and loss carryforwards are expected to be available to offset future taxable income of approximately $3,600,000, which expire through 2027. In determining the valuation allowance required at each reporting period, management considers all available evidence, both positive and negative, based on the weight of that evidence, including historical information that is supplemented by currently available information about future years. In weighing the available evidence, management uses the more likely than not threshold for recognition of a valuation allowance. Due to prior loss and other uncertainties about events that could adversely affect future projected taxable income, the Company increased the valuation allowance relating to its deferred tax assets by $690,000. The Company determined that no additional adjustment was required for 2013.
The components of the provision for income taxes are as follows:
Years Ended December 31, 2013 2012
Current:
Federal $ — $ —
State (26,943) (45,379)
Total Current (26,943) (45,379)
Deferred:
Federal — (649,000)
State — (41,000)
Total Deferred — (690,000)
$(26,943) $ (735,379)
The temporary differences and net operating loss carryforward give rise to the following deferred tax assets:
December 31, 2013 2012
Net Operating Loss $1,440,000 $1,480,000
Depreciation and Amortization of Property,
Equipment and Intangibles 452,000 404,000
Stock Option and Restricted Stock
Compensation Expense 268,000 231,000
Other 28,000 23,000
2,188,000 2,138,000
Less Valuation Allowance (1,588,000) (1,538,000)
Deferred Tax Asset $ 600,000 $ 600,000
smartpros ltd. and subsidiaries
Notes to Consolidated Financial Statements Years Ended December 31, 2013 and 2012
19

These amounts have been classified on the accompanying consolidated balance sheets as non-current.
A reconciliation of income tax expense at the federal statutory rate to income tax expense at the Company’s effective rate is as follows:
Years Ended December 31, 2013 2012
U.S. Federal Statutory Income Tax Rate 34% (34)%
State Income Tax Rate, net of federal benefit 16% 4%
Travel and Entertainment 2% —%
Prior Years’ True-ups (27)% (3)%
Change in Valuation Allowance (29)% 83%
Goodwill Impairment — % 1 7 %
Other 20% (4)%
Effective Income Tax Rate 16% 63%
Note 5. Stock Incentive Plan
In June 2009 the Company adopted, with shareholder approval, its 2009 Incentive Compensation Plan (the “Plan”), replacing the expired 1999 Stock Option Plan. The Plan provides for the grant of up to 800,000 shares of non-qualified stock options and restricted stock awards to employees, directors and consultants. Future restricted stock grants may not exceed 200,000 shares. The Plan incorporated the outstanding shares at the time of adoption. As of December 31, 2013, there were 328,733 options outstanding, of which 235,733 are currently exercisable and there were 79,611 restricted stock grants outstanding. As of December 31, 2013, the Plan had a net balance of 366,934 shares reserved for the issuance of future grants. The Plan is administered by the Compensation Committee of the Board of Directors of the Company. The administrator of the Plan determines the terms of options, including the exercise price, expiration date, number of shares, and vesting provisions.
The weighted average estimated fair value of stock options granted for the year ended December 31, 2013 and 2012, was $1.47 and $1.80, respectively. The fair value of options at the date of grant was estimated using the Black-Scholes Option Pricing Model. The Company takes into consideration guidance under ASC Topic 718, “Stock Compensation” when reviewing and updating assumptions. The expected volatility is based upon historical volatility of the Company’s stock and other contributing factors. The expected term is based upon observation of the actual time elapsed between the date of grant and the exercise of options for all employees.
The assumptions made in calculating the fair values of options are as follows:
Years Ended December 31, 2013 2012
Contractual Term 10 years 10 years
Expected Volatility 40% 40%
Expected Dividend Yield 3.0% 2.0%-2.5%
Risk-Free Interest Rate 0.60% 2.3%-4.0%
Expected Term 3-5 years 5 years
For the years ended December 31, 2013 and 2012, stock-based compensation expense related to stock options granted was approximately $24,000 and $31,000, respectively. As of December 31, 2013, the fair value of unamortized compensation cost related to non-vested stock option awards was approxi-mately $18,000. Unamortized compensation cost as of December 31, 2013, is expected to be recognized over a remaining weighted-average vesting period of 1.2 years.
As of December 31, 2013, the options had an intrinsic value of $94,930. At December 31, 2012, the options had no intrinsic value.
In February 2013, the Company granted 35,000 options to various officers and employee, exercisable over 10 years from the date of grant at $1.47 per share. These options vest one-third each year commencing one year from date of grant.
In February 2013, the Company granted 41,500 shares of its restricted common stock to various employees and members of its Board of Directors. The grants have various vesting periods between one and three years from date of grant and the grant price was $1.47 per share. Subsequent to the date of issuance 3,000 shares were forfeited and returned to the Plan.
In August 2013, the Company granted an employee 5,000 shares of its restricted stock from its Plan. The stock vest three years from date of issuance and the price of the stock at the date of grant was $1.63.
A summary of all stock option activity is as follows:
Number Weighted of AverageYears Ended December 31, 2013 and 2012 Options Exercise Price
Outstanding, January 1, 2012 334,587 $ 3.14
Options granted 15,000 $ 1.80
Options forfeited/expired (39,100) $ 2.88
Outstanding, December 31, 2012 310,487 $ 3 .1 1
Options granted 35,000 $ 1.47
Options forfeited/expired (16,754) $ 4.02
Outstanding, December 31, 2013 328,733 $ 2.89
Exercisable, December 31, 2013 235,733 $ 3.33
smartpros ltd. and subsidiaries
Notes to Consolidated Financial Statements Years Ended December 31, 2013 and 2012
20
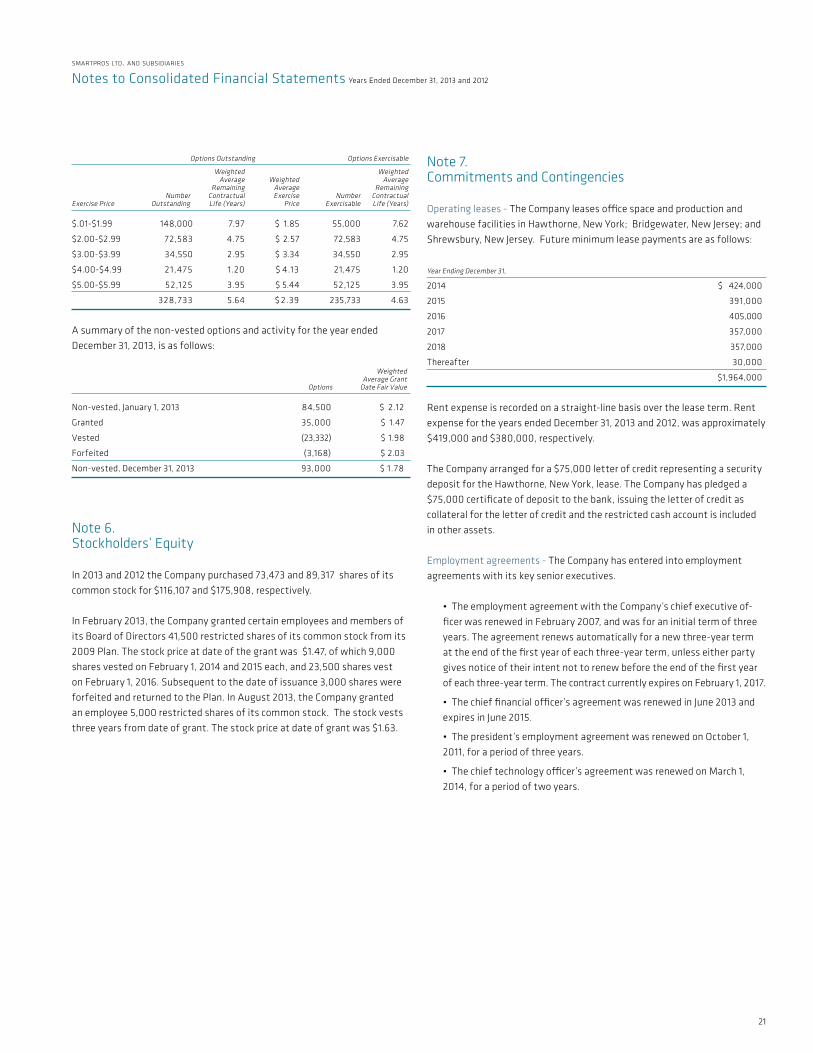
Options Outstanding Options Exercisable
Weighted Weighted Average Weighted Average Remaining Average Remaining Number Contractual Exercise Number Contractual Exercise Price Outstanding Life (Years) Price Exercisable Life (Years)
$.01-$1.99 148,000 7.97 $ 1.85 55,000 7.62
$2.00-$2.99 72,583 4.75 $ 2.57 72,583 4.75
$3.00-$3.99 34,550 2.95 $ 3.34 34,550 2.95
$4.00-$4.99 2 1,475 1.20 $ 4.13 21,475 1.20
$5.00-$5.99 52,125 3.95 $ 5.44 52,125 3.95
328,733 5.64 $ 2.39 235,733 4.63
A summary of the non-vested options and activity for the year ended December 31, 2013, is as follows:
Weighted Average Grant Options Date Fair Value
Non-vested, January 1, 2013 84,500 $ 2.12
Granted 35,000 $ 1.47
Vested (23,332) $ 1.98
Forfeited (3,168) $ 2.03
Non-vested, December 31, 2013 93,000 $ 1.78
Note 6. Stockholders’ Equity
In 2013 and 2012 the Company purchased 73,473 and 89,317 shares of its common stock for $116,107 and $175,908, respectively.
In February 2013, the Company granted certain employees and members of its Board of Directors 41,500 restricted shares of its common stock from its 2009 Plan. The stock price at date of the grant was $1.47, of which 9,000 shares vested on February 1, 2014 and 2015 each, and 23,500 shares vest on February 1, 2016. Subsequent to the date of issuance 3,000 shares were forfeited and returned to the Plan. In August 2013, the Company granted an employee 5,000 restricted shares of its common stock. The stock vests three years from date of grant. The stock price at date of grant was $1.63.
Note 7. Commitments and Contingencies
Operating leases - The Company leases office space and production and warehouse facilities in Hawthorne, New York; Bridgewater, New Jersey; and Shrewsbury, New Jersey. Future minimum lease payments are as follows:
Year Ending December 31,
2014 $ 424,000
2015 391,000
2016 405,000
2017 357,000
2018 357,000
Thereafter 30,000
$1,964,000
Rent expense is recorded on a straight-line basis over the lease term. Rent expense for the years ended December 31, 2013 and 2012, was approximately $419,000 and $380,000, respectively.
The Company arranged for a $75,000 letter of credit representing a security deposit for the Hawthorne, New York, lease. The Company has pledged a $75,000 certificate of deposit to the bank, issuing the letter of credit as collateral for the letter of credit and the restricted cash account is included in other assets.
Employment agreements - The Company has entered into employment agreements with its key senior executives.
• The employment agreement with the Company’s chief executive of-ficer was renewed in February 2007, and was for an initial term of three years. The agreement renews automatically for a new three-year term at the end of the first year of each three-year term, unless either party gives notice of their intent not to renew before the end of the first year of each three-year term. The contract currently expires on February 1, 2017.
• The chief financial officer’s agreement was renewed in June 2013 and expires in June 2015.
• The president’s employment agreement was renewed on October 1, 2011, for a period of three years.
• The chief technology officer’s agreement was renewed on March 1, 2014, for a period of two years.
smartpros ltd. and subsidiaries
Notes to Consolidated Financial Statements Years Ended December 31, 2013 and 2012
21
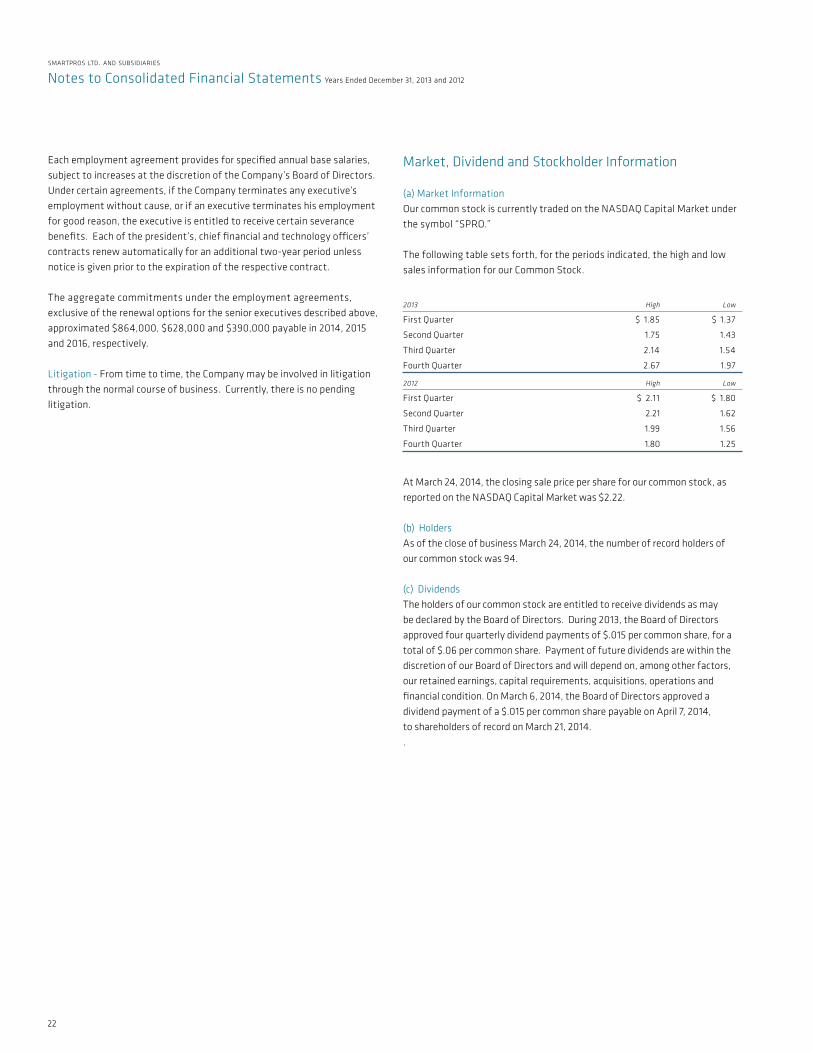
Each employment agreement provides for specified annual base salaries, subject to increases at the discretion of the Company’s Board of Directors. Under certain agreements, if the Company terminates any executive’s employment without cause, or if an executive terminates his employment for good reason, the executive is entitled to receive certain severance benefits. Each of the president’s, chief financial and technology officers’ contracts renew automatically for an additional two-year period unless notice is given prior to the expiration of the respective contract.
The aggregate commitments under the employment agreements, exclusive of the renewal options for the senior executives described above, approximated $864,000, $628,000 and $390,000 payable in 2014, 2015 and 2016, respectively.
Litigation - From time to time, the Company may be involved in litigation through the normal course of business. Currently, there is no pending litigation.
Market, Dividend and Stockholder Information (a) Market InformationOur common stock is currently traded on the NASDAQ Capital Market under the symbol “SPRO.”
The following table sets forth, for the periods indicated, the high and low sales information for our Common Stock. 2013 High Low
First Quarter $ 1.85 $ 1.37
Second Quarter 1.75 1.43
Third Quarter 2.14 1.54
Fourth Quarter 2.67 1.97
2012 High Low
First Quarter $ 2.11 $ 1.80
Second Quarter 2.21 1.62
Third Quarter 1.99 1.56
Fourth Quarter 1.80 1.25
At March 24, 2014, the closing sale price per share for our common stock, as reported on the NASDAQ Capital Market was $2.22.
(b) HoldersAs of the close of business March 24, 2014, the number of record holders of our common stock was 94.
(c) DividendsThe holders of our common stock are entitled to receive dividends as may be declared by the Board of Directors. During 2013, the Board of Directors approved four quarterly dividend payments of $.015 per common share, for a total of $.06 per common share. Payment of future dividends are within the discretion of our Board of Directors and will depend on, among other factors, our retained earnings, capital requirements, acquisitions, operations and financial condition. On March 6, 2014, the Board of Directors approved a dividend payment of a $.015 per common share payable on April 7, 2014, to shareholders of record on March 21, 2014..
smartpros ltd. and subsidiaries
Notes to Consolidated Financial Statements Years Ended December 31, 2013 and 2012
22

To the Shareholders, Audit Committee and Board of DirectorsSmartPros Ltd.Hawthorne, New York
We have audited the accompanying consolidated balance sheets of SmartPros Ltd. and Subsidiaries (the “Company”) as of December 31, 2013 and 2012, and the related consolidated statements of operations, stockholders’ equity, and cash flows for the years then ended. The consolidated financial statements are the responsibility of the Company’s management. Our responsibility is to express an opinion on the consolidated financial statements based on our audits.
We conducted our audits in accordance with the standards of the Public Company Accounting Oversight Board (United States). Those standards require that we plan and perform the audits to obtain reasonable assurance about whether the consolidated financial statements are free of material misstatement. The Company is not required to have, nor were we engaged to perform, an audit of its internal control over financial reporting. Our audits included consideration of internal control over financial reporting as a basis for designing audit procedures that are appropriate in the circumstances, but not for the purpose of expressing an opinion on the effectiveness of the Company’s internal control over financial reporting. Accordingly, we express no such opinion. An audit includes examining on a test basis, evidence supporting the amounts and disclosures in the consolidated financial statements. An audit also includes assessing the accounting principles used and significant estimates made by management as well as evaluating the overall consolidated financial statement presentation. We believe that our audits provide a reasonable basis for our opinion.
In our opinion, the consolidated financial statements referred to above present fairly, in all material respects, the consolidated financial position of SmartPros Ltd. and Subsidiaries as of December 31, 2013 and 2012, and the results of their operations and their cash flows for each of the years then ended, in conformity with accounting principles generally accepted in the United States of America.
/s/ Baker Tilly Virchow Krause, LLP
New York, New York
March 25, 2014
smartpros ltd. and subsidiaries
Report of Independent Registered Public Accounting Firm
23

Board of directors
Allen S. Greene Chairman of the Board Chief executive officer
Jack Fingerhut director President
John J. Gorman, Esq. director Partner Luse Gorman Pomerenk & Schick, PC
Martin H. Lager director owner martin h. Lager CPa
Leonard J. Stanley director Financial Services Consultant
Corporate officers
Allen S. Greene Chief executive officer Chairman of the Board
Jack Fingerhut President director
Stanley P. Wirtheim Chief Financial officer
Joseph Fish Chief technology officer executive Vice President
Karen Stolzar Vice President Corporate Secretary
Glenn Shapiro ethics officer President executive enterprise Institute President SmartPros Legal & ethics Ltd.
Senior management & division heads
Mike Fowler executive Vice President Business development
John Fleming, CPA, MBA executive Vice President
Shane Gillispie Vice President marketing & eCommerce
Mark Luciano Vice President engineering & Channel Partners
John T. Gray, CLU, ChFC Vice President Financial Services
Stacey Painter (nee Tedeschi), CPA President Loscalzo associates, Ltd.
Seth Oberman President Skye multimedia Ltd.
Corporate headquarters
SmartPros Ltd.12 Skyline drivehawthorne, nY 10532 (914) 345-2620www.smartpros.com
Subsidiaries
SmartPros Legal & ethics Ltd.12 Skyline drivehawthorne, nY 10532 (914) 829-4894http://sple.smartpros.com
Skye multimedia Ltd.1031 route 22 West Suite 301 Bridgewater, nJ 08807(908) 429-0099www.skyemm.com
Loscalzo associates, Ltd.revmont Park1151 Broad Street, Suite 214Shrewsbury, nJ 07702(732) 741-1600www.loscalzo.com
Stock market Information
the common stock ofSmartPros Ltd. trades on the naSdaQ Capital marketunder the symbol SPro.
Stock transfer agent & registrar
american Stock transfer& trust Company6201 15th avenueBrooklyn, nY 11219(800) 937-5449
the transfer agent is responsible for handling shareholder questions regarding lost stock certificates, address changes and changes of ownership or name in which shares are held.
Independent auditors
Baker tilly Virchow Krause, LLPone Penn PlazaSuite 3000new York, nY 10119
Legal Counsel
morse, Zelnick, rose & Lander LLP 825 third avenuenew York, nY 10022
smartpros ltd and subsidiaries
directors, officers and Corporate Information
za
ho
r d
es
ign
off
ice i
nc
. w
ww
.za
ho
rd
es
ign
.co
m
24

za
ho
r d
es
ign
off
ice i
nc
. w
ww
.za
ho
rd
es
ign
.co
m

SmartPros Ltd.
12 Skyline drive
hawthorne, nY 10532
(914) 345-2620
www.smartpros.com
K E E P S M A R T
Smart Pros®®