Embed Size (px)
Citation preview
UNLV Theses, Dissertations, Professional Papers, and Capstones
Spring 2012
Smartphone application effecting potential increaseof hotel business revenue and guest satisfactionKatelyn H. KimUniversity of Nevada, Las Vegas
Follow this and additional works at: https://digitalscholarship.unlv.edu/thesesdissertations
Part of the Hospitality Administration and Management Commons, and the Technology andInnovation Commons
This Professional Paper is brought to you for free and open access by Digital Scholarship@UNLV. It has been accepted for inclusion in UNLV Theses,Dissertations, Professional Papers, and Capstones by an authorized administrator of Digital Scholarship@UNLV. For more information, please [email protected].
Repository CitationKim, Katelyn H., "Smartphone application effecting potential increase of hotel business revenue and guest satisfaction" (2012). UNLVTheses, Dissertations, Professional Papers, and Capstones. 1353.https://digitalscholarship.unlv.edu/thesesdissertations/1353
SMARTPHONE APPLICATION EFFECTING POTENTIAL INCREASE OF HOTEL
BUSINESS REVENUE AND GUEST SATISFACTION
by
Katelyn H. Kim
Bachelor of Science in Hotel and Restaurant Management
Kyonggi University
2006
A professional paper submitted in partial fulfillment
of the requirements for the
Master of Hospitality Administration
William F Harrah College of Hotel Administration
Graduate College
University of Nevada, Las Vegas
Spring 2012
Pearl Brewer, Ph.D.
ii
ABSTRACT
Smartphone application effecting potential increase of hotel business revenue and guest
satisfaction
by
Katelyn Kim
Pearl Brewer, Ph.D.
Professor and Associate Dean of Academics
William F. Harrah College of Hotel Administration
University of Nevada, Las Vegas
In the past several years there has been an exponential increase in smartphone
applications made available by businesses looking for new ways to reach customers. Many of the
big hotel business have not failed to deliver such applications for their customers to use that
helps expedite and simplify the process of reserving a hotel room. Most applications have many
more uses than simply reserving the hotel room, such as locating the hotel, overviews of the
hotel, pictures of the hotel and property, and tracking rewards programs. The more popular these
smartphone applications the more people there are that will use them. The questions raised in this
report is whether or not such applications reduce costs or expenses related to generating the
reservations through using technical tools instead of agents or employees to handle bookings. A
thorough analysis of the cost of sales (when available) and operating expenses trends concurrent
to the release of smartphone applications for six hotel companies is included in this report, as
well as what the trends might mean and recommendations based on the research.
iii
TABLE OF CONTENTS
ABSTRACT .................................................................................................................................... ii
TABLE OF CONTENTS ............................................................................................................... iii
LIST OF FIGURES ....................................................................................................................... iv
PART ONE ..................................................................................................................................... 2
Introduction ............................................................................................................................... 2
Purpose ...................................................................................................................................... 2
Statement of Objective .............................................................................................................. 2
Justification ............................................................................................................................... 4
Constraints ................................................................................................................................ 6
PART TWO .................................................................................................................................... 9
Introduction ............................................................................................................................... 9
Review of Relevant Information and Financial Statistics ....................................................... 10
Mandarin Oriental ............................................................................................................. 10
Marriot Hotels ................................................................................................................... 14
Starwood Hotels & Resorts Worldwide ............................................................................ 17
Intercontinental Hotel Group ............................................................................................ 20
Wyndham Worldwide Corporation................................................................................... 23
Choice Hotels .................................................................................................................... 27
Analysis of Smartphone Applications’ Impact on Financial Statements................................ 29
Evidence of improving financial health ............................................................................ 30
Inconclusive or negative evidence of smartphone applications improving financial health
.......................................................................................................................................... 31
PART THREE .............................................................................................................................. 33
Introduction ............................................................................................................................. 33
Literature and Online Research Review ................................................................................. 34
Financial Research Overview ................................................................................................. 36
Mandarin Oriental ............................................................................................................. 36
Marriot Hotels ................................................................................................................... 38
Starwood Hotels & Resorts Worldwide ............................................................................ 38
Intercontinental Hotel Group ............................................................................................ 40
Wyndham Worldwide Corporation................................................................................... 41
Choice Hotels .................................................................................................................... 42
Conclusions ............................................................................................................................. 43
Mandarin Oriental ............................................................................................................. 43
Marriot Hotels ................................................................................................................... 44
Starwood Hotels & Resorts Worldwide ............................................................................ 44
Intercontinental Hotel Group ............................................................................................ 45
Wyndham Worldwide Corporation................................................................................... 46
Choice Hotels .................................................................................................................... 47
Conclusions Summary ............................................................................................................ 48
Recommendations ............................................................................................................. 48
References ..................................................................................................................................... 51
iv
LIST OF FIGURES
Figure 1. Shifting the Pricing Paradigm ....................................................................................... 35
2
PART ONE
Introduction
This research report will relate to the use of smartphones in the hotel industry.
Smartphones are growing in popularity, have been growing in popularity for a few years, and are
expected to become increasingly popular in the coming years. Email-Marketing-Reports.com
(2012) states that the global sale of smartphones is expected to grow from 420 million sales in
2011 to more than 1 billion sales in 2016. That’s more than a 100% increase in smartphone sales
that are expected over the next five years. Email-Marketing-Reports.com (2012) also states that
in 2012 the number of smartphones purchased by consumers is expected to exceed the number of
consumer purchases of PCs. Since there are so many people using smartphones the industries
that work closest with the people need to find a way to take advantage of this trend. The hotel
industry is one of the top users of new technology and has incorporated most new technologies
available to the public into the hotel experience since the invention of refrigeration and air
conditioning (DeMicco, 2009). This growth in the sales of smartphones and the growing number
of people that are now depending on smartphones instead of PCs has led to some adaption in the
hotel industry to make use of smartphones as a way to become more convenient for their
customers.
Purpose
The purpose of this research project will be to analyze the effects of smartphone hotel
reservation application on the financial information of participating hotel industry members.
Statement of Objective
By doing an analysis of financial statements prior to and following the adoption
smartphone hotel reservation applications by members of the hotel industry understanding can be
3
gained concerning how and if these applications increase business activity. By determining
which hotels have adopted smartphone room reservation applications and knowing the features
of those applications as well as analyzing the financial information may be found supporting the
idea that smartphone reservation applications might induce financial growth. The smartphone
hotel reservation applications have become very popular and widely used by many hotels and
hospitality and travel reservation websites. This research project and paper will be an analysis of
an expansion in the development of member organizations of the hotel industry’s marketing
strategies. Belopotosky (2011) states in her newspaper article that one mobile hotel reservation
application used with the Apple iPhone allows users to reserve a hotel room in any of more than
130,000 different hotels located in more than 200 different countries. This shows that the mobile
hotel reservation applications are becoming more diverse and more popular, but does not answer
the question this research project wishes to address; how have applications like this one impacted
the growth of hotels since they have become readily available. Other hotel chains have their own
smartphone application designed only for their company. These types of applications will also be
considered as a variable in the research process. Other variables will be the features of the
smartphone reservation applications and the variety of the applications that each hotel company
has had developed.
The objective of this research project and report will be to analyze relevant information
that could suggest any effects smartphone reservation applications have on hotel company
growth. This may serve as a solution to a problem if the hotels not adopting smartphone
reservation applications as a marketing strategy show an increase do not show a matching rate of
growth in the same timeframe of the adoption of the smartphone reservation applications adopted
by other members of the hotel industry. Details of the diversity and usefulness of the applications
4
will be considered when making distinctions between different hotels, their applications, and the
results of the corresponding financial analysis. One example of such a comparison would be to
compare how an average hotel using a travel reservation application such as Expedia compares
in growth to a company like Starwood Hotels & Resorts Worldwide, Inc. who have their own
smartphone application designed specifically for their hotels and resorts; the Starwood Preferred
Guest program that is now available through BlackBerry’s application store, BlackBerry App
World (Anonymous, 2010). The different types of applications that have been identified at this
time are web-based applications, iPhone applications, BlackBerry applications, and Android
applications. By making comparisons of the financial growth of these and other companies that
can be correlated to the introduction of smartphone reservation applications understanding can be
gained about the effectiveness of the applications.
Justification
The information from this study can be effectively applied in the hotel industry because it
will determine if a hotel or hotel chain can achieve desirable results from investing in the
development of a smartphone reservation application. By determining which hotels were early
adopters of smartphone reservation applications and analyzing financial statements of those
companies it will be possible to determine the effects of the smartphone reservation applications
on an individual hotel, or a series of individual hotel, in relation to financial profitability and
growth, or determine that there is a lack thereof. This topic is applicable and useful to the hotel
industry and other hospitality businesses because if smartphone reservations applications have a
beneficial effect on business profits and company growth other hospitality industry companies
may decide to adopt their own mobile reservations systems as a means to stimulate growth and
5
increase profits. It will also be beneficial to the hotel companies to know which kind of
application is best or if a variety of applications is better than in only one type of application.
The findings of this research project and report can be applied to the hotel industry as a
whole, individual members of the hotel industry, and also used to education the individuals
involved in management of the hotel businesses. By determining if the adoption of smartphone
reservations systems is beneficial to a hotel company’s profits and growth and making a
professional report to disseminate the results of the research and analysis to the hotel industry
community this will serve to leave the industry, individual organizations, and management of
those individual organizations more educated concerning diversifying methods of accepting hotel
reservations by included smartphone applications as an acceptable platform. Since most hotels’
reservations systems have probably become accessible through smartphone reservation
applications this research project may be of more academic importance than useful for marketing
practice. However, if a hotel reservation application like Starwood’s Special Preferred Guest
application shows a greater impact on growth than other less hotel-specific applications more
hotels may desire to have their own personalized application developed. Also, if the applications
prove to improve company growth in the hotel industry other industries may become more
motivated to have smartphone applications developed in order to boost business activity in their
companies. Some reservation companies, such as GetThere and Orbitz, claim that web based
applications that can be used by smartphones are a better option than downloadable applications,
such as the iOS (Apple iPod, iPad, and iPhone operating system) application released by Egencia
in 2011 (Campbell, 2011). Knowing the competitive differences between these types of
applications is also a justifiable reason for this research project and can make this report more
usable by members of the hotel industry. Knowing the variety of different smartphones that a
6
hotel has made reservation applications for and if more platforms will increase the effects of
smartphone reservation applications is also useful to hotel companies. If Marriot, a hotel
company that has applications available for the iPhone, BlackBerry, and Android (Marriot,
2011), shows a greater amount of growth than Starwood Hotels & Resorts Worldwide, Inc, that
only has a BlackBerry application, it may indicate that a variety of applications usable for each
of the different smartphone brands’ operating systems is more beneficial than only having one
application available. It is expected that the wider a variety of smartphone applications a hotel’s
reservations system is accessible through the more chance that hotel has of experiencing
heightened profitability and growth.
This report is being written to gather the information necessary to determine if the use of
smartphone hotel reservation applications has an effect on company growth, to compare financial
information of the companies previous to the use of smartphone hotel reservation applications to
the financial information in financial periods after the smartphone applications were released,
and determine if and what the effects of using such smartphone applications are on financial
growth in the hotel industry. The findings of this report can be used for many reasons, including
any applicable uses in marketing education and marketing practice. The report can also be used
for evidence of the impact of advancing technologies on the hotel and hospitality industry. The
report will also be useful to potential users of smartphone hotel reservation applications because
of the information it will present relating to features of individual applications.
Constraints
In any professional research or study there will be a number of constraints. Many hotels
and reservation websites have adopted smartphone reservation applications as an avenue through
which customers can reserve hotel rooms. This part of the research will be very broad and
7
hopefully it will be possible to include the less well known hotel companies as well as the hotel
chains that are more popular and internationally well known hotel chains. One major constraint
on this study is that it has been difficult to find academic journal articles that have addressed this
issue in any depth. Not only does this mean that little research has already been done on the
effects of smartphone reservation applications, but this means that much of the research will
need to be gathered from other sources and a greater amount of effort will be needed because
much of the research will be primary research instead of secondary research. Another constraint
is that the only resources available for review and analysis will be found via the internet; no
personal communication between the researcher and the hotel management or administration as a
means of gathering information because of lack of resources. The financial information will be
limited to online sources available at company websites, and that will limit the number of hotels
that can be included in the research, though this limitation is minimal because of requirements
that a business’s quarterly and yearly statements should be available to the public for the benefit
of possible investors and other stakeholders. The ability to determine when the hotels adopted
smartphone applications as a reservation system will also limit the breadth of the research. Not
all hotel companies will have information published on the internet about when the smartphone
reservation applications became available, which further limits the number of companies that can
be included in the research.
It is also a constraint that there are many other aspects of a hotel business that can affect
profitability and growth. The appearance of profitability and growth may not be entirely the
result of a marketing campaign’s inclusion of a smartphone room reservation application. The
expected result is a decrease in underlying revenue growth or underlying revenue growth as a
percentage of revenue that can give evidence showing that smartphone reservation applications
8
save the company money by streamlining the reservation process and reducing the time hourly
employees spend managing reservations. The goal of this research project is to attempt to locate
these trends in costs, expenses, and profitability that are concurrent with the introduction of
smartphone applications. In order for this to be strong evidence the trend needs to be present
throughout the industry, not in only one or two of the hotels included in the research. Some hotel
companies likely will have experienced such growth unrelated to the introduction smartphone
hotel reservation applications or a lack of growth not related to the release of the application. The
financial information alone is not conclusive evidence of smartphone reservation applications
resulting in company growth. Other factors such as downsizing, restructuring, external
economies, and other marketing practices may also have effected growth in the hotel companies.
9
PART TWO
Introduction
One of the industries that has always tried to stay ahead of the curve with the use of new
technologies and conveniences is the hospitality industry, especially the hotel companies. It has
always been assumed by the leaders of the hotel company that if they include modern
conveniences and follow technological trends their hotels will remain an attractive getaway for
businesspeople and vacationers while they are away from home. With the development of
smartphones and the increase in the popularity and usage by present and potential hotel guests
the hotel company leaders and marketing associates did not leave this trend unnoticed. Working
Without a Wire (2009) talks about some of the first uses for smartphones and mobile devices
developed by hotels as they follow technology trends. Some of the uses of mobile technology in
hotels used to make a guests visit more convenient is the ability to access concierge and room
service, ordering and managing entertainment, and bonus video and audio applications for
smartphones so guests can easily communicate with business associates and loved ones. This
report will focus on the smartphone applications that are hotel specific and include the ability to
reserve a room, among other features. Watkins (2010) mentions in his article that at the Hotel
Industry Technology Exposition & Conference it was mentioned that 20–25% of travel
companies were planning on adding mobile booking capabilities to their marketing tactics in
2010, with 24% of them planning to create iPhone applications. Hoteliers were told that mobile
webpages weren’t the best way to go but specialized smartphone apps with the ability to make
bookings and manage reservations would be the best way to utilize smartphone technology as a
method of hotel marketing. USA Today (2012) reports that after launching a hotel specific
smartphone application in November 2009 that mobile based sales increased 200%, comparing
10
May 2010’s mobile bookings to May 2009’s bookings. The purpose of this report will be to
analyze a collection of hotel’s offering hotel specific applications according to the financial
performance before and after the introduction of the smartphone applications. What is expected
is a reduction of operating expenses/cost of sales as a percentage of revenue as a result of a
streamlining of the reservation process. Financial trends will be analyzed comparing statistics
prior to the release of smartphone applications to statistics after the release of hotel specific
smartphone applications. Information for this report has been gathered from various online
resources including quarterly and annual reports of the individual hotels made available to the
public on their websites.
Review of Relevant Information and Financial Statistics
The following is a review of information gathered that is relevant to the hotels using hotel
specific smartphone applications including financial statistics and trends that can be used as
evidence for or against the effects of hotels offering smartphone reservation applications. The
hotel companies include Mandarin Oriental, Marriot, Starwood Hotels and Resorts,
Intercontinental Hotel Group, and Wyndham Hotel Group. Financial information will include
financial statements including the year before, the year of, and the year following the release of
the hotel company’s release of their company specific smartphone applications. Any information
that can be found about the applications will also be included.
Mandarin Oriental.
Application features.
The Mandarin Oriental smartphone application, named MO Hotels, is designed for
iPhones and can also be installed and used with any iPod or iPad using iOS 3.1 or newer. This
iOS application has a number of very useful features for Mandarin Oriental guests including
11
comprehensive property details (including room details, services, and amenities), real time
reservations, ability to cancel or modify reservations, ease of location of Mandarin Oriental’s
latest offers and discounts, the ability to call or email dining and spa services for appointments or
assistance, a list of all Mandarin Orientals international phone numbers for travelers planning
long distance travels, and finally “Cities by MO”; the concierge service destination guide
offering descriptions of area attractions, restaurants, shopping, nightlife opportunities, and any
other areas of interests of cities where Mandarin Oriental has a presence. For a personal profile
the app user can choose to enter their information with each reservation or save a profile,
including any contacts (friends, family, etc.) to make the next reservation easier to request, even
if your booking a room for a friend or family member (Mandarin Oriental, 2011b). Conde Nast
Digital (2012) reports that the iPhone application was released in the third quarter of 2010,
meaning that financial information from the years 2009, 2010, and 2012 will be needed to
discover any impact on financial trends in the hotel’s company’s financial statements that could
be related to the release of iPhone application. The iOS application is the only personalized
application made available by Mandarin Oriental, though the hotel company. There is not a
BlackBerry or Android application available yet.
Financial information 2009.
One area of the financial records that needs to be evaluated is the trends in profit and loss
statements of the years 2008, 2009, 2010, 2011. For some relevant information I will refer to the
profit and loss statements from the 2008 and 2009 Mandarin Oriental annual reports. The
revenue for the year ended December 31, 2009 was $438, a decrease of $92 million or 17.4%
from the year ended December 31, 2008, when revenues were at $530 million. Gross profit for
the year ended December 31, 2008 was $205.5 million and decreased to $139.9 million for the
12
year ended December 31, 2009. That is a decrease of $65.6 million or 31.9% in the gross profits
the year preceding any effects the release of the iPhone application may have had. Cost of sales
could also be considered when searching for a relationship between the iPhone application and
changes in financial trends of Mandarin Oriental. In year ended December 31, 2008 the cost of
sales was 61.2% and in the year ended December 31, 2009 the cost of sales was 68.1%
(Mandarin Oriental, 2010).
Financial information 2010.
In 2010 the iPhone application was released in the third quarter. This means that any
effects the iPhone has on profitability and financial trends will first show up on the 2010 annual
report’s profit and loss statement. Total revenues for the year ended December 31, 2009 was
$438 million while total revenues for the year ended December 31, 2010 was $513.2 million.
This reflects an increase in revenues of $75.2 million or 17.2% for 2010, a growth rate that is
only a .2% smaller than the reduction of revenue in the previous annual reporting period. Since
any costs pertaining to developing, maintaining, and updating the iPhone application, MO
Hotels, would be considered a cost of sales in year ended December 31, 2010 the gross profit
cost of sales should also be considered. While Mandarin Oriental had $139.9 million in gross
profits in 2009 that increased to $186.6 million gross profits for year ended December 31, 2010.
Gross profit in 2010 was 36.4% of revenue while gross profit as a percentage of revenue for
2009 was 31.9% (Mandarin Oriental, 2011a).
With cost of sales for the year ended December 31, 2009 being $298.1 million that means
the cost to make sales during that annual reporting was 68.1% of the amount of revenue
generated from sales. For the year ended December 31, 2010 cost of sales were $326.6 million
while revenue was $513.2 million, meaning that for the year of 2010 costs related to sales were
13
63.6% of the revenue generated from sales. From year ended December 31, 2009 to year ended
December 31, 2010 the cost of sales percentage was reduced by 4.5% (Mandarin Oriental,
2011a). This could be an indication that the release of the iPhone decreases the cost of sales but
could also indicate other changes in the organization’s structure, management, or wage scale.
Since cost of sales as a percentage of revenue increase 6.8% the previous annual reporting period
executive level management may have made adjustments to control costs. It is notable that the
year ended December 31, 2008 cost of sales as a percentage of revenue was 2.4% lower than the
year ended December 31, 2010 cost of sales as a percentage of revenue. Any impact the iPhone
would have on the financials would be much clearer comparing the 2010 – 2011 financial data
because of the application’s release taking place late in 2010.
Financial information 2011.
At the time of the writing of this report the 2011 annual report for Mandarin Oriental is
unavailable. Instead of using the 2011 Mandarin Oriental annual report the half yearly report will
be used, which was released in July 2011. This will affect the ease of comparing the 2011
financial information with the 2010 annual information because 2011 information is only for a
partial year. The statistics (revenue, cost of sales, and gross profit) will have to be doubled from
the half yearly report as an estimate and/or it will be necessary to rely only on percentages.
The total revenue for the six months ended June 30, 2011 for Mandarin Oriental was
$295.7 million. That is an increase of $54.4 million in revenue from the same six month period’s
$237.3 million of revenue in 2010. In 2010 $154.3 million of the $273.3 million was cost of
sales, making cost of sales 65% of total revenue for the six month period. The cost of sales for
the first six months of 2011 was $177.1 million, or 59.9% of the total revenues for the period.
That is a decrease of 5.1% of cost of sales as a percentage of revenues for the six month period
14
ending June 30, 2011 compared to the six month period ending June 30, 2010. This could be an
indication of a reduction of cost in sales due to the automated reservation process used with the
smartphone applications. Gross profit as a percentage of revenue for the first six months of 2011
was 40.1% which is 3.7% higher than the 2010 percentage and 8.2% higher than the 2009
percentage. This is another indicator that use of smartphone applications can produce hotel
company growth by reducing the cost of sales and increasing gross profits, but does not eliminate
the fact that other factors may be involved that impact the positive trend in financial health
(Mandarin Oriental, 2011b).
Marriot Hotels.
Application features.
The Marriot Hotels smartphone application is available to be used with any iPhone or
other iOS system, BlackBerry, and Android smartphones. If the use of smartphone applications
is a relevant factor in financial trends using all three popular smartphone types would increase
the impact. The application helps travelers find a near Marriot Hotel quickly, manage
reservations, see pictures of the hotel, other details of the hotel, enroll in Marriot Rewards, and
offers news of upcoming attractions and events in the local area. The website also includes an
eMarketer prediction that in 2012 approximately 29 million consumers will use mobile devices
for booking travel plans. This is additional evidence that if smartphone hotel reservation
applications reduce the cost of sales as a percentage of revenue their use can lead to greater
profits and increased growth in the companies that offer them (Marriot Hotels, 2012a).
2011 second quarter.
Because the Marriot smartphone application was only released in August 2011 there will
be no full reporting year in which the application was used that can be analyzed. Since this is the
15
case Marriot’s quarterly statements will be used instead of annual statements. The smartphone
application was released at the end of the third quarter. Any significant impact would be seen in
the fourth quarterly statement for 2011. Included in this analysis will be the second, third, and
fourth quarter quarterly statements from Marriot Hotels.
There is evidence of some changes in financial trends from the consolidated statements of
income on the second quarterly report for 2011. The twelve weeks ended June 17, 2010 shows a
$201 million increase in revenues from the $2,771 million of the previous years twelve weeks
ended June 18 to bring quarterly revenues to $2,972 million, which translates to a 7.2% increase.
The twenty four weeks ended June 17, 2011 shows a total of $5,750 million, meaning that the
second quarter’s revenues were 53% of the half year’s revenue reported. This means that
revenues in the twelve weeks ended June 17, 2011 were higher than both the previous year’s
same twelve weeks and the previous quarterly revenues. This is growth taking place prior to the
implementation of the smartphone applications released at the end of the third quarter but should
be noted to see if the growth rate increased more or less quickly after the release of the
applications. Since there is not cost of sales reported on the quarterly statements operating
expenses operating expenses will be substituted, as operating expenses relate to expenses
necessary for the business operations related to making the sales. Operating costs and expenses
for the quarter ended on June 17, 2011 was $2,740 million, or 92.2% of revenue. Operating costs
for the previous year’s second quarter were $2,545 million, or 91.8% of the quarterly revenue,
that is the quarter ended June 18, 2010 (Marriot Hotels, 2011a).
2011 third quarter.
For the quarter ended September 9, 2011 revenues were down from the previous quarter
to $2,874 million from $2,974 million the previous quarter. In comparison to the same quarter’s
16
revenues of the quarter ended September 10, 2010 revenues were increased by $174 million from
$2,648 million in the third quarter of 2010. The quarterly decrease in revenues was 3.2% from
the second quarter of 2011 to the third quarter of 2011. This may be irrelevant due to seasonal
fluctuations, more important is the 7.9% increase in revenues from the third quarter of September
2010. This is very similar to the second quarter of 2011’s comparison to the second quarter of
2010 in relation to the percentage of growth in revenues. Operating costs for the third quarter of
2011 were $3,018 million, or 105% of revenues, resulting in a loss for the period. This appears to
be a direct result of time-share strategy impairment charges of $324 million while other
operating costs and expenses were relatively close to the previous quarter. Not considering the
time-share strategy impairment the operating costs and expenses were 93.7% of revenues while
the previous years third quarter did not have any time-share impairment charges and was 93.7%
of revenues (Marriot Hotels, 2011b).
2011 fourth quarter.
The fourth quarter is the only quarter of the year that could have been affected by the
release of the smartphone reservation applications. Since the other quarters are 12 weeks long
and the fourth quarter 18 weeks comparisons to the previous years growth will be the most
important and relevant information.
Total revenues for the fourth quarter of 2011 were $3,693 million while the fourth quarter
of the previous year had $3,401 million in revenues. This shows a 7.1% increase in revenues
from the same quarter of the previous year. The operating costs for the fourth quarter of years
2010 and 2011 were $3,446 million and $3,520 million respectively. For the fourth quarter of
2011 the operating costs and expenses accounted for 93.3% of the revenues generation. For the
fourth quarter of the previous year, 2010, the operating costs and expenses were 96.7% of the
17
revenues generated (Marriot Hotels, 2012b). This shows a decrease from the previous year’s
fourth quarter but is still higher than the second quarter of the same year, possibly indicating that
the smartphone application did not significantly impact operating costs and expenses.
Starwood Hotels & Resorts Worldwide.
Application features.
Starwood Hotels & Resorts Worldwide has produced smartphone reservation applications
for both the iPhone and BlackBerry smartphone operating systems. The first application to be
introduced was the iPhone application, named SPG. The SPG application for iPhone was
released in June of 2009. Signing in can be completed by using the same login information as the
Starwood website and some of the main features are My Stays, Recent Activity, Find and Book,
Customer Support, and an online blog accessible through the application. My Stays includes lists
of past stays, upcoming stays, and all stays at the company’s hotels and resorts. Recent Activity
includes information about bonus points, award redemptions, and a chronological list of all the
activity on the user’s account. Find and Book and Customer Support both open a browser
window for access to the mobile version of the SPG website. This description is from Mak
(2009) and it is likely the application has been updated since the review. Mak (2009) mentioned
that the application was very handy but also contained several ‘bugs’ that caused inconsistencies
and inaccuracies in the My Stays feature. This negative feedback as well as the integration of
web-based software indicates that Starwood’s SPG application may not be technologically
competitive and could be unattractive to travelling professionals. The BlackBerry application has
the same features and was released September of 2010 (Starwood Hotels & Resorts Worldwide,
Inc., 2012).
Financial information 2008.
18
For the analysis of Starwood Hotels & Resorts, Inc. financial trends the consolidated
statements of income will be used for years 2008-2010. The two years previous to the release of
iPhone application Starwood Hotels & Resorts Worldwide, Inc. experienced two consecutive
years of lessening revenues. Revenues for the year ended December 31, 2007 and December 31,
2008 were $5,999 million and $5,754 million respectively, showing a 4.1% drop in total
revenues. Operating costs and expenses did not proportionately reduce with the drop in revenues
from the end of the 2007 reporting period to the end of the 2008 reporting period. For years
ended December 31, 2007 and December 31, 2008 the operating costs were $5,158 million and
$5,144 million respectively, that meaning during the 2007 reporting period operating costs and
expenses as a percentage of revenues was 86% and for the 2008 reporting period they were
89.5%. If this trend continued through 2009 and reverses in 2010 it could be considered evidence
that the reservation application had an impact (Starwood Hotels & Resorts Worldwide, Inc.,
2009).
Financial information 2009.
The original trend of a decrease in revenues continued for year ended December 31, 2009
with total revenues being $4,712 million a 8.1% decrease in revenues from the previous annual
reporting period. This rate that revenues dropped in 2009 was almost twice that of the loss of
revenues in 2008, indicating that the release of the iPhone application in midyear of 2009 was
not a sufficient factor in increasing revenues. The operating costs and expenses as a percentage
of total revenues was 99.4%, showing a continuation of previous trend of an increase. The
continuation of these trends and the exponential growth operating costs as a percentage of
revenue gives evidence that the iPhone SPG reservation application did not result in any
19
extraordinary company growth in the first six months of its release (Starwood Hotels and Resorts
Worldwide, Inc., 2010).
Financial information 2010.
Some significant information is offered in the Starwood Hotels & Resorts Worldwide,
Inc. 2010 annual report explaining some reasons for the bad financial health of the company that
relate to reservation systems. Third party reservation systems such as Travelocity.com,
Expedia.com, Orbitz.com, and Priceline.com have increase competition concerning booking
prices and discounts while the third party reservation systems also require commissions. This
statement was followed by a second statement mentioning that inability to be technologically
competitive in many areas, including reservation systems, could be harming Starwood’s financial
health. The statement that “these agencies hope that consumers will eventually develop brand
loyalties to their reservations system rather than to our lodging brand” coupled with the implied
facts that Starwood’s rates are not competitive and their own mobile reservation system was
flawed may be a strong indication of how reservations systems affect hotel growth (Starwood
Hotels & Resorts Worldwide, Inc., 2011). Following is an analysis the Starwood Hotels &
Resorts Worldwide, Inc. consolidated statements of income.
Comparison of revenues for years ended December 31, 2009 and 2010 shows the first
increase of revenues since 2008. Revenues increased from $4,696 million in 2009 to $5,071
million in 2010, which is an 8% increase in total revenues. Since 2010 is the first full year of the
use of the iPhone SPG application and the release of the BlackBerry SPG application this could
be an indication of a potential impact of the new reservation system impacting financial trends.
Operating costs and expenses as a percentage of total revenues for the year 2010 was 88.2% with
the biggest factor of the decrease from the previous year’s 99.4% being a credit of $75 million in
20
the place of an expense of $379 million in the restructuring, goodwill impairment and other
special charges section. If the restructuring expenses had remained the same as during 2009 the
percentage of operating costs and expenses as a percentage of total revenues would have been
97.1%, a 2.3% decrease from 2000, but still a higher percentage than those of 2007 and 2008
(Starwood Hotels % Resorts Worldwide, Inc., 2011).
With Starwood Hotels & Resorts undergoing a restructuring while lagging behind in
price competition and technological advancement it would be difficult to attribute and change in
financial trends to the SPG reservation application. From the notes of the 2010 annual report it
can be concluded that some technologically advanced reservation systems do serve to increase
price competition and expectancy of advanced reservation systems.
Intercontinental Hotel Group.
Application features.
Intercontinental Hotel Group launched is iPhone application April 27, 2010, during the
second quarter of the 2010 reporting period (Marksway Ltd., 2012). International Hotel Group
launches iPhone app, acquisitions not a priority for Lufthansa, (2012) reports that in a little more
than a year’s time the number of mobile hotel room reservations for Intercontinental Hotel Group
increased by nearly 1000% after the release of their first iPhone application in April, 2010. It is
also stated on the website that the Priority Rewards application for Android smartphones was
released during July, 2010 and that during the first five months of 2011 mobile hotel rooms
reserved via smartphones surpassed the number of smartphone bookings for the entire year of
2010. This is evidence that the smartphone hotel reservation applications are a popular method
and are preferred by hotel customers and are widely used when the applications are attractive and
functional. Considering it requires less manpower for hotel room reservations to be made
21
through a smartphone application it may also be evidence of smartphone application increasing
the profitability of reservations through reducing employee hours spent handling reservations
and therefore resulting in a decrease of salaries expense.
The iPhone, BlackBerry, Android, and Windows-based phone applications are all very
similar according to summaries of their features found on the company website (International
Hotel Group, 2012a). The features listed for the iPhone applications are the ability to redeem
Priority Club Reward Points, get GPS enabled directions to the hotel, click to call the hotel’s
front desk, full photo galleries of each hotel, ability to search International Hotel Group hotels
according to airport codes, expedition of bookings using stored user date in the user profile, use
of corporate IDs for special corporate rates, and access to any special offers being offered by
Intercontinental Hotel Group hotels.
Financial information 2009.
In the Intercontinental Hotel Group 2009 annual report (Intercontinental Hotel Group,
2010) the group income statement will be used for financial analysis. Since the first reservation
application came out in April, 2010 the 2008 – 2009 trends will only give background
information to compare to the 2009 – 2010 and 2010 – 2011 trends. The 2008 revenues were
$1,897 million and the 2009 revenues were $359 million less, $1,538 million, or 81.1% of 2008
revenues. Fortunately the cost of sales is available on Intercontinental Hotel Group’s annual
report, it is a more accurate indicator than operating expenses because of all the additional
expenses included in operating expenses such as administrative expenses, depreciation, and other
expenses. During years ended December 31, 2008 and 2009 the cost of sales was $852 million
and $860 million respectively. For the 2008 reporting period the $852 million cost of sales was
44.9% of the total revenues and for the 2009 reporting period the $860 million cost of sales was
22
55.9% of the total revenues. Not including exceptional items included in the $860 million the
before exceptional items cost of sales as a percentage of revenues for 2009 was 50%, an minute
increase from the 2008 cost of sales as a percentage of revenue (Intercontinental Hotel Group,
2010).
Financial information 2010.
The 2010 total revenues for Intercontinental Hotel Group were $1,628 million, that is a
$90 million or 5.8% increase from the 2009 total revenues. The cost of sales for year ended
December 31, 2010 was $753 million, or 46.3% of total revenues. This means that the 2010 cost
of sales as a percentage of total revenues was 3.4% lower than the 2008 figure and 3.6% lower
than the 2009 figure (excluding exceptional items in cost of sales) (Intercontinental Hotel Group,
2011). It could be evidence of increased profitability of sales (reservations) that the cost of sales
as a percentage of total revenues decreased by 3.6% the same year that the first iPhone
application was released. Because the release of the first iPhone application took place at the
beginning of the second quarter any decrease of cost of sales as a percentage of total revenues
should continue and be more than 3.6% lower than the 2009 percentage.
Financial information 2011.
At the time of the writing of this report the 2011 annual statement was not made available
to the public yet so the 2011 preliminary report will be used in its place. Intercontinental Hotel
Group’s total revenues for 2011 on the preliminary report were $1,768 million, an 8.6% increase
from the $1,628 million in revenues for the hotel group in 2010. Cost of sales as a percentage of
total revenues for the $1,768 million was 43.6%, or $771 million, a 1.7% decrease from the 2010
percentage and a continuation of the trend of a decrease beginning the first year a smartphone
hotel reservation application was released to be used for reserving Intercontinental Hotel Group
23
hotel rooms. It may be important to note that the year before the first iPhone application for the
hotel group was released the cost of sales as a percentage of total revenues were 50% and there
was a two year trend of decreasing cost of sales after the release. The total change in the
percentage from the year before the iPhone application was released to the end of year ended
December 31, 2011 was 6.7%, which is a significant change over a two year period
(Intercontinental Hotel Group, 2012b). There was not restructuring taking place during the 2008
– 2011 reporting periods used for this financially analysis, though there was a restructuring
taking place during the 2006 -2007 reporting periods (Intercontinental Hotel Group, 2012b).
The fact that the restructuring was finished and negative trends took place for the 2008
and 2009 years before seeing a positive impact may indicate that the restructuring did not
decrease the cost of sales as a percentage of total revenues and that such a decrease may be
contributed to the release of smartphone reservation applications. The increased impact of the
reservations on this hotel group could be contributed to the fact that they have smartphone
applications designed for four different smartphone operating systems instead of only one or two,
and that the applications were more attractive than the buggy Starwood Hotels & Resorts
application that left a bad impression on its users.
Wyndham Worldwide Corporation.
Application features.
Wyndham Worldwide Corporation announced the release of their smartphone reservation
application, called ‘Topguest’, on November 17, 2010. The application allows members to earn
bonus points for using other mobile applications such as Foursquare and Facebook Places for
checking into participating hotels and hotel restaurants. Wyndham Rewards is the largest reward
program in the hotel industry according to the number of participating hotels. Wyndham
24
Rewards are not only redeemable for hotel reservations but also for airline tickets, dining,
shopping gift cards, and name brand merchandise. The application is available free, as are the
other applications mentioned in this report, and is available only for the iPhone and Android
smartphones. Although Topguest is not available for BlackBerry or Windows Phone users the
application is versatile in the rewards it offers and could be very attractive to iPhone or other iOS
system users as well as users of Android operating systems based smartphones. Its interactivity
with other application and diversity of uses for its rewards are insofar unique compared to the
other smartphone applications and related reward programs covered in this report (Wyndham
Worldwide, 2011a).
Financial information 2009.
The Wyndham Worldwide Corporation consolidated statements of operations contains
information from the years ended December 31, 2008, 2009, and 2010. For the purposes of this
report the information for the 2008 and 2009 annual reporting period will be the majority of the
information used, while very little information will be taken from the 2007 annual reporting
period’s information. The total revenues for the 2008 reporting period were $4,281 million and
for the 2009 reporting period total reported revenues were $3,750 million, meaning that total
revenues for the 2009 period were 87.6% of the total revenues for the 2008 period. Operating
expenses for the year ended December 31, 2008 were $1,622 million or 37.9% of total revenues
for the same year. Operating expenses for the year ended December 31, 2009 were $1,501
million or 40% of the total revenues, showing a 2.1% increase in operating expenses as a
percentage of total revenues (Wyndham Worldwide Corporation, 2010).
The trends for the year prior to the release of the smartphone room reservation
application for Wyndham Worldwide Corporation hotels shows unhealthy trends with a decrease
25
in total revenues and an increase in operating costs as a percentage of total revenues. Other
financial information from the consolidate statements of operations from the Wyndham
Worldwide Corporations 2009 annual report show that in the year ended December 31, 2008
there was a operating loss of $830 million, the biggest factor of the loss being a ‘loss of goodwill
and other impairments’ of $1,426 million. A loss of goodwill is often explained as a loss incurred
due to the decreasing value of the company’s reputation which is often followed by a reduction
of profits (Wyndham Worldwide Corporation, 2012).
Financial information 2010.
Wyndham Worldwide Corporation’s 2010 annual report shows some improvements in
comparison to the 2008 – 2009 financial trends that were discussed. The total revenues in year
ended December 31, 2010 were $3,851 million, up from the $3,750 million in total revenues for
the 2009 annual reporting period. That calculates to be a $101 million increase for the 2010
reporting period, making 2010 total revenues 102.7% of the total revenues for the 2009 reporting
period. An increase in revenues is a good sign of a recover from the previous year’s trends. The
operating costs for the year ended December 31, 2010 were $1,587, or 41.2% of total revenues.
This is a 1.2% increase in operating expenses as a percentage of total revenues which shows that
the introduction of the smartphone reservation application in 2010 did not lower the operating
expenses as a percentage of total revenues (Wyndham Worldwide Corporation, 2011b).
Since individual operating expenses are not shown on the consolidate statements of
income where the financial information was taken from it is difficult to conclude whether the
increase is related to expenses required for reservations or for other types of operating expenses.
The cost of sales is briefly mentioned under the inventory part of the Summary of Significant
Accounting principles but no numerical data was found accompanying the method of calculation
26
that was described. Because the smartphone reservation application was only released a little
before December, 2010 there would be little or no impact on the 2010 financial information but
the years preceding and the year of the release of the smartphone application are important to
understand if there is any impact during the after the release.
Financial information 2011.
The 2011 annual report was not available at the time of the writing of this report so a
press release summarizing the financial information, made during February, 2012, will be used.
The consolidated statements of income will still be the statement used and the revenues,
operating expenses, and operating expenses as a percentage of revenues will be the financial
information under consideration. Revenues for the year ended December 31, 2011 increased
more sharply than during the 2010 annual reporting period with the 2011 total revenues being
$4,254 million, an increase of $403 million and making total revenues for 2011 110.5% of total
revenues for 2010. Operating expenses for the 2011 annual reporting period were $1,781 million
or 41.9% of total revenues. The 2010 operating expenses as a percentage of total revenues was
41.2% so the 2011 annual reporting period reflects a continuation of the previous trend of an
increase in operating expenses as a percentage of total revenue. This is further evidence
indicating that the smartphone hotel reservation for Wyndham Worldwide Corporation hotels did
not significantly lower operating expenses related to the reservation process (Wyndham
Worldwide Corporation, 2012).
The two year trend of an increase in revenues may be the result of a restructuring that
ended in first six months of 2011. The restricting had been taking place the 2008 reporting
period. Other factors during the 2010 – 2011 financial reporting years that could have increased
revenues were the acquisitions of James Villa Holidays, Hoseasons, the Tryp hotel brand, and
27
ResortQuest. There was also a new Wyndham Worldwide Corporation owned hotel opened in
Orlando, Florida. These acquisitions the opening of the Orlando hotel would have the effect of
increasing operating expenses as a percentage of revenue by less than 1% for the 2010 and 2011
reporting periods and also have the potential of significantly increasing revenues as well
(Wyndham Worldwide Corporation, 2012).
Choice Hotels.
Application features.
Penton Media (2012) states that Choice Hotels was one of the first hotel businesses to use
smartphone reservation applications as a marketing platform. The first iPhone application for
Choice Hotels was released in April, 2009. With the first release it was made possible for rooms
to be reserved in any of the 5,800 properties with the choice of Choice Hotels’ 11 different hotel
brand names. Some other features of the Choice Hotels iPhone reservation application is the
ability to locate the nearest choices of hotels according to the GPS system of the smartphone and
give door to door directions to the hotel chosen by the user. It is also possible to get a street view
of the hotel through the smartphone application’s database of hotel images. The reservations
made by participating users can be cancelled, changed, or otherwise managed through the
smartphone application and Choice Privileges, the hotel company’s customer loyalty rewards
program, can be accessed and used through the application as well (AOL, 2012). With Choice
Hotels being one of the first companies to implement the use of smartphone applications if there
is any impact on financial statistics it can be expected that the impact would be greater on this
company’s financial statements than the others.
Financial information 2008.
28
The 2008 annual report for Choice Hotels shows a solid rate of growth from the year
ended December 31, 2006 to the year ended December 31, 2008. The 2006 annual reporting
period had $539.9 million total revenues. Reported for the 2007 financial period was $615.5
million in total revenues and for the 2008 financial reporting period Choice Hotels had $641.7
million in total revenues reported. Starting with the 2007 – 2008 trend there was 114% of the
2007 amount of revenues in 2008 and there was 104.3% of the total revenue in 2007. Operating
expenses for the 2006 reporting period were $373.3 million or 69.1% of the total revenues for the
year. The operating expenses for 2007 were $430.3 million, which translates to be 69.9% of the
total revenues for the year. The operating expenses for the 2008 reporting period were $467.1
million or 72.8% of the total revenues for the year. This shows a trend of the operating expenses
as a percentage of total revenues increasing for two consecutive annual reporting periods prior to
the release of the first smartphone application released by Choice Hotels (Choice Hotels, 2009).
Financial information 2009.
The 2009 annual report for Choice Hotels shows a large decrease in revenues in year
ended December 31, 2009 compared to the previous annual reporting period. All six of the
different types of revenue decreased in 2009. The total operating expenses for 2009 that were
reported were $416.1 million. With the total revenues being $564.2 million for the 2009 annual
reporting period (87.9% of 2008’s revenues, which was $641.7 million) the operating expenses
as a percentage of total revenues was 73.8%, which is an increase of 1% from the percentage of
revenues that went towards operating expenses in 2008 (Choice Hotels, 2010).
With the first smartphone application being released towards the beginning of the second
quarter of 2009 and the operating expenses as a percentage of revenues still increasing after the
release it can be considered evident that smartphone reservation applications do not reduce
29
operating expenses effectively enough to thwart an ongoing unhealthy trend of increasing costs
and expenses per sales dollar. The rate at which operating expenses as a percentage of revenues
grew during the 2009 reporting period was slower than the 2007 and 2008 reporting periods,
which may be evidence that the a reservation system involving smartphone applications instead
of employee handled phone calls or commission based online reservation systems decreases
operating expenses related to generating room reservations.
Financial information 2010.
While the total revenues for year ended December 31, 2010 were higher than the
previous year they did not reach the revenues for the year ended December 31, 2008. Total
revenues for the 2010 annual reporting period were $596.1 million, that is 105.6% of the total
revenues for the entire year of 2009 but still only 92.9% of the total revenues for year ended
December 31, 2008. Operating expenses for the year increased by $19.2 million to be $435.3
million, which is 73% of the total revenues for the 2010 annual reporting period (Choice Hotels,
2011). 73% is a decrease of .8% of operating expenses as a percentage of total revenues. While
this is small it is a reversal of the previous year’s increase of operating expenses as a percentage
of total revenues of 1%. It appears that if the use of the smartphone application as a reservation
system had any effect on the financial statistics of Choice Hotels it may have reduced the
operating expenses as a percentage of total revenues (Choice Hotels, 2011).
Analysis of Smartphone Applications’ Impact on Financial Statements
There was a variety of different trends, some of which were influenced by other factors
than the introduction of smartphone hotel reservation applications by the hotels included in the
study. Restructuring expenses and a lack of competitive prices on the part of some of the hotels
influenced the financial statistics too much to show positive financial trends indicating a
30
relationship between smartphone reservation applications and strengthening financial health.
Below is a summary of evidence for and against the possibility that the smartphone applications
promote improvements and/or losses in financial health in any significant manner.
Evidence of improving financial health.
Mandarin Oriental could be used as an example of a possible link between smartphone
hotel reservations and positive changes in financial trends. With the introduction of the
company’s smartphone reservation application, MO Hotels, in the third quarter of the 2010
annual reporting period there were both trends of increasing revenues and decreasing cost of
sales as a percentage of revenues that could possibly be related to the use of the smartphone
reservation application and decreasing costs related with the reservation process.
The only other hotel company that used clear statements of cost of sales in their annual
reports was Intercontinental Hotel Group. Intercontinental Hotel Group launched the iPhone
application used for hotel reservation at their hotel in the beginning of the second quarter of the
2010 annual reporting period. Intercontinental Hotel Group also showed the same healthy
financial trends as Mandarin Oriental happening from the year prior to the release of the
smartphone application to the year following the release of the application. These healthy
financial trends are increases in revenue at the same time as decreases in cost of sales as a
percentage of total revenues. It may be of interest to the reader that the two hotels that showed
positive trends in the years of the smartphone applications releases are the only two hotels
included in the study that included cost of sales in the financial statements of the annual reports.
The other hotels were analyzed according operating costs and expenses and did not show the
same trends. It is possible that smartphone reservation applications reduce the cost of sales as a
percentage of total revenues. Because only two hotel companies using ‘cost of sales’ on their
31
financial reports are included in the research it is not sufficient evidence to conclusively state the
applications are the reason for this correlating trend.
Inconclusive or negative evidence of smartphone applications improving financial
health.
Choice Hotels did not report cost of sales on their annual reports so operating expenses
was used in the place of cost of sales. With the restructuring taking place in the 2009 annual
reporting period the expenses for 2009 were very high. In addition to this complication with
reading the financial trends the revenues were lower the year after the smartphone reservation
application’s release with the additional fact that operating expenses as a percentage of total
revenues increased in the year following the applications release in comparison to the year prior
to the application’s release.
Wyndham Worldwide Corporation showed a healthy financial trend of increasing
revenues for two consecutive annual reporting periods; the year of the smartphone application
release and the year after the release. However, without a cost of sales on the annual report
operating costs were used and operating costs as a percentage of total revenues increased of the
both the year of the release of the smartphone reservation application and the year following the
application’s release. This is evidence that Wyndham Worldwide Corporation’s smartphone
reservation application did not decrease operating costs enough to increase profitability.
Starwood Hotels & Resorts also had a restructuring in the year of the release of the
smartphone application that induced a spike in operating expenses, which were evaluated in the
place of cost of sales because cost of sales was not reported on the financial statements of the
annual reports used to analyze the trends. There is a decrease of operating costs as a percentage
32
of total revenues the year after the smartphone application’s release, which could be a result of
the restructuring the year before, so is therefore inconclusive.
Marriot’s smartphone application was release late in the 2011 annual reporting period
therefore quarterly statements were used. The revenues were higher the after the smartphone
application’s release but the operating costs and expenses as a percentage of total revenues were
also higher. This is evidence that the smartphone application for Marriot hotels did not
effectively lower the operating costs and expenses.
33
PART THREE
Introduction
Part two of the professional report introduced introductions to six different hotel
companies smartphone reservation applications in hopes of finding correlating healthy changes
in financial trends in the same six companies’ publicly available financial statements. Included
was financial information about the smartphone hotel reservation applications and financial
information and statistics including the year before the release of the smartphone reservation
application, the year of the smartphone reservation applications’ releases, and the year following
the smartphone reservation applications’ releases (quarterly or semi-annual statements were
substituted where necessary, if financial statements were not yet available for the most recent
annual financial reporting period). This information was used to indentify financial trends
affecting the health of the hotel companies before, during, and after the financial periods of the
smartphone reservation applications’ releases. In this part of the professional report the
information presented in part 2 will be more thoroughly summarized, analyzed, and explained in
as much of a non-biased way as possible. It is not the goal of this report to support any given
stance or opinion but to gather information, analyze the information, and present it (including
any implications, or lack thereof, of any effects on financial trends without any affecting bias).
Included in this part of the report will be the summary of the financial research, further
research derived from articles and websites concerning the use and impact of the smartphone
reservation applications in the hotel industry, the conclusions to be drawn from the research, and
recommendations that can be made regarding smartphone reservation applications and their use
in the hotel industry. All six of the previously researched hotel companies will be included in
34
both the results and conclusions sections. Recommendations will be drawn according what
conclusions are made.
Literature and Online Research Review
The idea of smartphone reservation applications evolved from the online marketing and
booking of hotel room reservations. With the increasing use of the internet by the public in
today’s modern times new and innovative ways for the customer to use technological tools to
interact with the hotels is attractive in the context of both marketing and convenience. Linn and
Lee (2010) state that when more customers have an online presence and the hotel companies
report profitable online reservations that profitability is achieved. This type of reservation
system, either online or in the form of a mobile application, can eliminate some of the fees
usually related to generating and processing reservations.
Burns (2011) discusses some of the normal fees included in reservations systems that
necessitate agents or representation in order to process reservations. Some of these normal fees
for agent representation include annual or monthly fees, minimum revenue requirements and
related penalties, fees for each transaction, and there may be an increase in fees over the contract
period. With a smartphone reservation application there is only the cost of producing the
application and any necessary upgrades instead of paying a fee for every reservation that is
generated. This could lead to a reduction in the costs related to generating reservations.
Luxenberg (2007) reports that hotel companies can sell the hotel rooms to popular online
reservations agencies like Expedia.com for as little as $65 - $70 per room and the web-based
agent will sell the room for as much a $100. This is a large part of the profits that the reservation
agent is taking for the room that can be retained in the hotel companies if smartphone
applications are used for reservations instead of online booking agencies. This could mean a big
35
increase of profitability resulting from a decrease in the costs related to generating the
reservations.
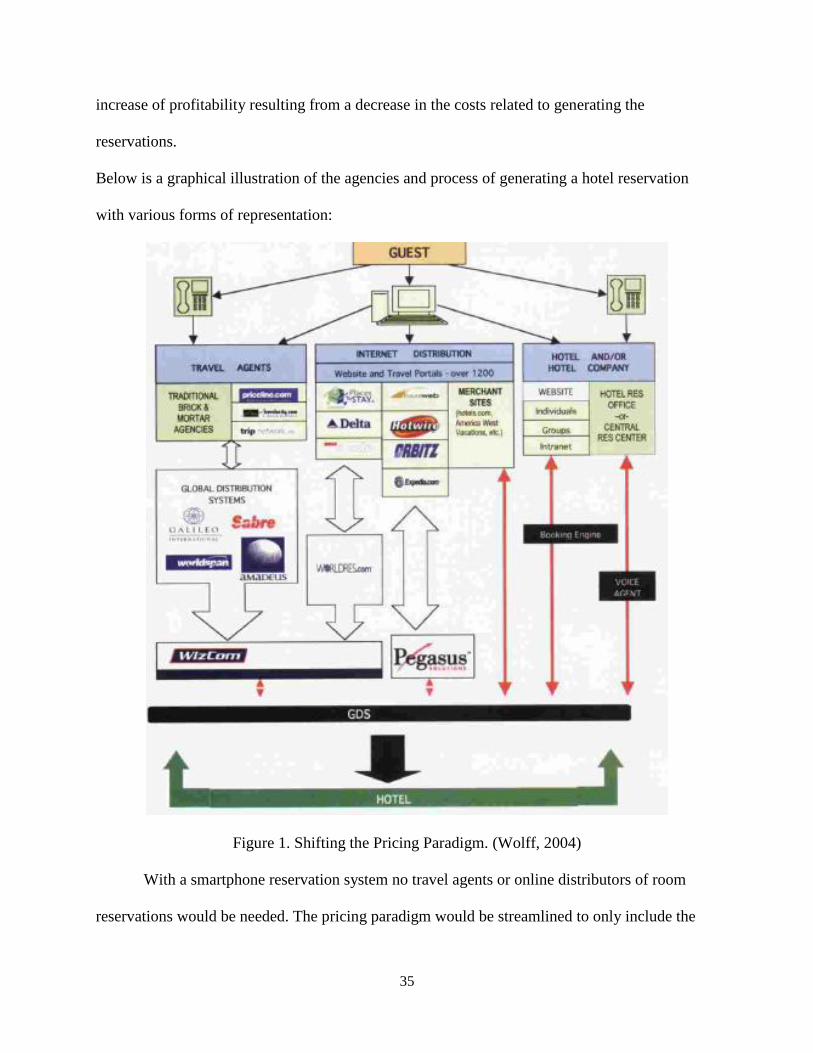
Below is a graphical illustration of the agencies and process of generating a hotel reservation
with various forms of representation:
Figure 1. Shifting the Pricing Paradigm. (Wolff, 2004)
With a smartphone reservation system no travel agents or online distributors of room
reservations would be needed. The pricing paradigm would be streamlined to only include the
36
costs of developing and maintaining the IT system that handles smartphone reservation
applications. With the removal of expensive agents for representation and the streamlined
process the expenses necessary would also be reduced. This can be beneficial to hotel
companies’ profit margin, especially considering that six out of tem smartphone users are
downloading travel applications and 42% of those smartphone applications users claimed to
research or book a hotel room while out of town, according to a survey on Tnooz.com (2012).
The use of smartphone is on the rise as well, so more and more users will choose to book
their hotels through smartphone applications after they choose which hotel company they wish to
be loyal to. Many smartphone users may even download and install multiple smartphone
reservation applications. Xinhua News Agency (2010) states that more than 100 million people
use their credit cards through iPhone applications alone, also states is that 25% of all smartphone
users book hotel rooms with their phones. Taking into consideration that this is only the number
of iPhone users and does not include BlackBerry, Windows Phones, and Android based phones
there will be many more users using credit cards through smartphone applications. Also
considering this reference is from more than two years go the number of smartphone applications
users likely has increased exponentially as the number of the smartphone users increased. Email-
Marketing-Reports (2012) gives estimates that the number of smartphone sales will more than
double between the end of 2011 and 2016. This means that more than twice as many people will
be using smartphone and smartphone applications in the next few years, making the smartphone
hotel room reservation applications not only a good marketing platform but a necessity of
matching the competition and the desires of general public.
Financial Research Overview
Mandarin Oriental.
37
Information for the financial trends of Mandarin Oriental was derived from the profit and
loss statements from the annual reports of the years 2008, 2009, 2010, and 2011. The most
important information used was the revenue and cost of sales, these numbers were used to
determine if the cost of sales decreased during and after the financial reporting periods in which
the release of the smartphone reservation application took place, which was in the third quarter
of the 2010 reporting period (Conde Nast Digital, 2012).
The trend before the release (years 2008 – 2009) were revenue of $530 million and $438
million respectively. The cost of sales for years 2008 and 2009 were $324.4 million and $298.3
million, or 61.2% and 68.1% respectively (Mandarin Oriental, 2010). The cost of sales directly
relates to the costs and expenses related to generating reservation; in order to see evidence of a
positive impact on financial trends due to the release of the smartphone application the trend of
an increasing cost of sales as a percentage of revenue will need to be reversed. In 2010 the total
revenues for Mandarin Oriental were $513.2 million and cost of sales was $326.6 million, or
63.6% of total revenues; that is a 4.5% decrease from the 2009 statistic, but still higher than the
2008 percentage (Mandarin Oriental, 2011a). A semi-annual report was used for the 2011, but
since percentages are used and not total revenues or cost of sales the percentages can still be
compared. For the first six months of the year 2011 revenues were $295.7 million and cost of
sales was $177.1 million, or 59.9% of total revenues, showing a continuation of the previous
year’s trend of decreasing cost of sales, 3.7% less than the previous year and .3% lower than the
2008 reporting period; this makes the cost of sales as a percentage of revenue for the first six
months of 2011 the lowest in 4 years. The trend for the years 2010 and 2011 also show an
increase of gross profit as a percentage of revenue with the statistics being 36.4% and 40.1%
respectively (Mandarin Oriental, 2011b).
38
Marriot Hotels.
Since the Marriot Hotels smartphone reservation application was released during the
early part of the third quarter quarterly statements from the year 2011 reporting period were used
to analyze financial trends. The second quarter, ended June 17, 2010, had total revenues of
$2,972 million and operating expenses of $2,740 million, or 92.2% of total revenues. Operating
expenses were used for the Marriot Hotel analysis because the cost of sales was not present in
the public financial statements. The previous year’s second quarter operating expenses as a
percentage of total revenues was 91.8%, this shows a trend of increasing operating expenses as a
percentage of total revenues (Marriot Hotels, 2011a). The quarterly statement for the third
quarter of 2011, ended September 9, 2011, shows total revenues of $2,874 million. With
operating expenses for the third quarter being $3,018 million, or 105% of total revenues, Marriot
Hotels incurred a loss in the third quarter (Marriot Hotels, 2011b). The quarterly statement for
the fourth quarter reported total revenues of $3,693 million. Operating costs for the same quarter
were reported to be $3,520 million, which is 93.3% of the total revenues for the quarter (Marriot
Hotels, 2012b). This is an improvement from the third quarter operating costs as a percentage of
total revenue but is still 1.5% higher than the second quarter.
Starwood Hotels & Resorts Worldwide.
Starwood Hotels & Resorts Worldwide, Inc. introduced their first smartphone reservation
application during June of the year 2009. Mak (2009) did a review of the smartphone application
and found that it had several bugs that made it unattractive to smartphone users. Information
from the annual reports of Starwood Hotels & Resorts Worldwide, Inc. for the years of 2009,
2010, and 2011 was used to analyze the financial trends for the company. Starwood Hotels &
Resorts Worldwide, Inc. was undergoing a major restricting during the years analyzed and
39
annual reports stated that competition induced by online reservation agents was hurting business
because Starwood Hotels & Resorts prices were not competitive compared to other international
hotel companies. The annual reports also reported that the company was not as technologically
advanced as its competitors (Starwood Hotels & Resorts Worldwide, Inc., 2011).
Revenues reported on the company’s 2008 annual report (consolidated statements of
income) were $5,754 million. Operating costs for the same annual reporting period were $5,144
million; making operating expenses 89.5% of total revenues. If restructuring expenses were
excluded from operating expenses the operating expenses as a percentage of total revenue would
be 87.1% (Starwood Hotels & Resorts Worldwide, Inc., 2009). Starwood Hotels & Resorts
Worldwide, Inc. reported $4,712 million in total revenues for the year 2009 annual financial
reporting period. Operating costs for the company during the same year were $4,683.7 million,
or 99.4% of total revenues. Not including a restructuring expense, which could be considered
extraordinary to normal operations, the percentage of operating expense as a percentage of
revenues for the 2009 annual reporting period is 91.3%. Trends from 2008 – 2009 are very
unhealthy, showing both a decrease in revenues and an increase in operating costs as a
percentage of total revenues (Starwood Hotels & Resorts Worldwide, Inc., 2010). Revenues for
the year 2010 financial reporting period are $5,071 million. Operating costs reported in the 2010
annual report were $4,472.6 million, or 88.2% of total revenues for the year. This percentage is
affected by an extraordinary credit of $75 million (reimbursement of restructuring expense); not
including this credit the operating costs as a percentage of revenues is 89.6%, an increase of
1.4% from the previous years statistic (excluding adjustments for restructuring) (Starwood
Hotels and Resorts Worldwide, Inc, 2011). During the three years of annual reports analyzed
Starwood Hotels & Resorts Worldwide, Inc .showed an ongoing trend of a rising operating
40
expenses as a percentage of revenue. The 2010 reporting period was the first annual financial
period that the company showed an increase of revenues since the increase in revenues from
2006 reporting period to the 2007 reporting period. A restructuring had been taking place since
the 2006 annual reporting period or possibly prior to that (Starwood Hotels & Resorts
Worldwide, Inc., 2009).
Intercontinental Hotel Group.
For the financial trend analysis done on Intercontinental Hotel Group the annual reports
from the years 2009 and 2010 were used, and for the year 2011 the proxy statement preceding
the finished annual report was used. Intercontinental Hotel Group is the second hotel company to
include cost of sales in the annual financial statements, which is beneficial to the research and
results.
Intercontinental Hotel Group’s total revenues reported on the 2009 annual report were
$1,538 million. Cost of sales for the 2009 annual reporting period was $860 million, which is
55.9% of the total revenues reported. Excluding extraordinary expenses reported during the 2009
reporting period cost of sales as a percentage of revenues was 50%. When excluding the
exceptional or extraordinary items the cost of sales as a percentage of revenue had a slight
increase from the 2008 reporting period. Reported revenues during 2009 were 81.1% of the
reported revenues during 2008 (Intercontinental Hotel Group, 2010). For the 2010 annual
reporting period Intercontinental Hotel Group reported $1,628 million in revenues, reversing the
previous trend of declining revenues with a $90 million increase in revenues from the 2009
annual report. Cost of sales for the 2010 reporting period were $753 million, which is 46.3% of
total revenues; that is a decrease of 3.4% from the 2008 reporting period and a 3.6% decrease
from the 2009 reporting period, reversing the trend of slightly increasing cost of sales as a
41
percentage of revenues (Intercontinental Hotel Group, 2011). On its 2011 preliminary report
(preceding the completed annual report, which was not finished at the time this report was
written) Intercontinental Hotel Group reported $1,768 million in revenues and cost of sales was
$771 million. This means that cost of sales for the 2011 annual reporting period was 43.6%, a
decrease of 2.7% from the previous annual reporting period and a two year decrease of
approximately 6.4%.
Wyndham Worldwide Corporation.
For Wyndham Worldwide Corporation the consolidated statement of operations that can
be found on the 2008, 2009, and 2010 annual reports was used as a reference to financial
information. The consolidated statement of operations that can be found online on the corporate
website was used for the 2011 financial information because at the time of the writing of this
report the 2011 annual report to be made publicly available was not yet finished. Operating
expenses will be the point of interest in the Wyndham Worldwide Corporation statements
because the figure ‘cost of sales’ was not stated in the financial statements.
The total revenues stated on the 2008 annual report’s consolidated statements of
operations was $4,241 million, while the total revenues stated in the 2009 annual report were
$3,750 million, beginning the findings of the research with a trend of decreasing revenues. For
the 2008 annual reporting period the total operating expenses stated on the consolidated
statements of operations was $1,622 million, which is a 37.9% of the total revenues stated. For
the 2009 annual reporting period total operating expenses were stated in the annual report to be
$1,501 million, which is a 2.1% in the operating expenses as a percentage of total revenues,
leaving the statistic at 40% (Wyndham Worldwide Corporation, 2010). The total revenues stated
on the consolidated statements of operations for the 2010 annual reporting period was $3,851
42
million, reversing the previous trend of decreasing revenues. The total operating expenses stated
on the 2010 annual report was $1,587 million, another increase in operating expenses as a
percentage of total revenues, making the statistic 41.2% for the 2010 reporting period (Wyndham
Worldwide Incorporated, 2011). The 2011 reporting period is the first reporting period in which
the smartphone application was available for the entire year. Revenues for the 2011 annual
reporting period were $4,254 million, a second year of increasing revenues for Wyndham
Worldwide Corporation. The 2011 annual reporting period’s total reported operating expenses
were $1,781, or 41.9%, showing an ongoing continuation of the trend of a rising operating
expenses as a percentage of total revenues (Wyndham Worldwide Corporation, 2012).
Choice Hotels.
For Choice Hotels the financial information was taken from the years 2008, 2009, and
2010 annual reports. Information from the 2008 annual report includes information from the
2006 and 2007 annual reporting periods. The financial statement the information is derived from
is the consolidated statements of income. In the 2006 annual reporting period the total reported
revenues were $539.9 million and total reported operating expenses were $373.3 million, making
the operating expenses as a percentage of total revenues 69.1% (Choice Hotels, 2009). In the
2007 annual reporting period the total reported revenues were $615.5 million and total reported
operating expenses were $430.3 million, which is 69.9% of the total revenues, an increase of
.8%. The 2008 annual reporting period financial statements reported $641.7 million in total
revenues and $467.1 million in total operating expenses, making operating expenses as a
percentage of total revenues 72.8% for the 2008 annual reporting period. In the 2009 annual
consolidated statements of income included in the annual report the total revenues were $564.2
million and the total operating expenses reported were $416.1 million, or 73.8% of total revenues
43
(Choice Hotels, 2010). The operating expenses as a percentage of revenues so far have increased
every year that was researched, beginning with the 2007 annual reporting period. In 2010 the
total revenues reported on the annual report were $596.1 million and the total reported operating
expenses were $435.3 million, or 73% of total revenues, showing that 2010 was the first
financial reporting period since 2007 that operating expenses as a percentage of total revenues
decreased, but the statistic was still higher than the 2008 percentage (Choice Hotels, 2011).
Conclusions
Mandarin Oriental.
The Mandarin Oriental smartphone reservation application was only made available for
use with iOS operating systems, limiting smartphone usage to the iPhone users. This limitation
would minimalize any impact that using smartphone applications for reservation purposes would
have on costs and expenses related to generating reservations because of the number of
smartphone users using other smartphone operating systems. With the release of the smartphone
reservation operating system taking place in late 2010 the changes in financial trends would be
noticeable in the 2011 reporting period if there was an impact (Conde Nast Digital, 2012).
With the financial trends in the operating expenses and operating expenses as a
percentage of total revenues there are possible indications that the use of the smartphone
application had the positive effect of decreasing the cost of sales (costs and expenses related to
generating reservations). The cost of sales as a percentage of total revenues for the years 2008,
2009, 2010, and 2011 are 61.2%, 68.1%, 63.6%, and 59.9% respectively (Mandarin Oriental,
2010, 2011a, 2011b). With the release of the smartphone reservation application taking place in
the third quarter of 2010 this trend shows evidence of an effect being made. The cost of sales as a
percentage of revenue was increasing until the year of the release and the percentage for the 2011
44
annual reporting period was the lowest in four years, with 2011 being the first full year during
which the application was being used.
Marriot Hotels.
The Marriot Hotels smartphone reservation application can be used with iOS systems,
BlackBerry smartphones, and Android system smartphones. This widens the potential uses with
the only major smartphone systems excluded being the Windows based phones. With the release
of the smartphone reservation application not taking place until the third quarter of 2011 a
quarterly financial trend analysis was done using quarterly statements from the 2011 reporting
period (Marriot Hotels, 2012). The operating expenses as a percentage of total revenue for the
second, third, and fourth quarters of the 2011 financial year were 92.2%, 105%, and 93.3%
(Marriot Hotels, 2011a, 2011b, 2012b). Because operating expenses cover a wide variety of
expenses there is a great possibility that expenses not related to generating expenses were
responsible for the erratic trends taking place in the 2011 quarterly financial trend analysis. With
the information found in the research of Marriot Hotels there is no evidence that the smartphone
reservation application had an immediate effect on the financial health or financial trends of the
company.
Starwood Hotels & Resorts Worldwide.
The Starwood Hotels & Resorts Worldwide, Inc. smartphone reservation application was
designed to be used with both the iPhone (and other iOS devices) as well as BlackBerry
smartphones. The iOS based reservation application was released during June of 2009 and has a
variety of tools that tracks activity with the hotel company, stays at the Starwood Hotels &
Resorts Worldwide, Inc. hotels, makes and manages reservations, and gives access to the online
blog. This company’s smartphone application most likely did not have a positive effect on
45
financial trends because with its first release it did not reliably display correct information, which
most likely displeased users and left them with a bad impression of the hotel company. The
BlackBerry application was released at a later date, during June of 2010, and it is very likely the
bugs in the first release were fixed (Mak, 2009).
Operating costs was once against used to analyze the financial information related to
generating reservations for Starwood Hotels & Resorts Worldwide. Operating espenses as a
percentage of total revenues for the reporting years 2008, 2009, and 2010 were 89.5%, 99.4%,
and 88.2%; excluding expenses and credits related to restructuring the operating expenses as a
percentage of total revenues were 87.1%, 91.3%, and 89.6% (Starwood Hotels & Resorts
Worldwide, 2009, 2010, 2011). Because the 2008 percentage is lower than the 2010 percentage
(2008 being prior to the smartphone application’s release and 2010 after the release) it is unlikely
that the application had a positive effect on financial trends. With such a large restructuring
taking place there are too many variables to accurately assess reasons for changes in financial
trends. Management discussion and analysis included several statements about being behind the
trends in technology and falling behind in price competitiveness which management used to
explain the variations in financial trends and the signs of poor financial health reflected in the
financial statements of the annual reports included in the research. With such statements and the
restructuring no statement can be made about the effects of the smartphone applications on the
financial trends of Starwood Hotels & Resorts Worldwide.
Intercontinental Hotel Group.
The Intercontinental Hotel Group’s smartphone reservation application is designed to be
used with iOS based products (iPhone, iPod, and iPad) and was released during April of 2010.
Later the same year, in July, the Intercontinental Hotel Group released a smartphone reservation
46
system to be used with the Android operating system smartphones. Later Windows phones and
BlackBerry smartphones were able to perform the Intercontinental Hotel Group application
(Marksway Ltd., 2012). The sharp increase of reservations made with smartphones after the
release of the smartphone applications (1000% in the first year, the same number of reservations
being made via smartphones in the first five months of the second year) gives testimony to how
popular the use of smartphone reservation applications are among hotel guests, instead of using
agents or direct calls to the hotel companies (International Hotel Group Launches iPhone app,
Acquisitions not a priority for Lufthansia, 2012).
Intercontinental Hotel Group is the second hotel company in the research that included
cost of sales in the annual report’s financial statements. Cost of sales as a percentage of revenues
for the annual reporting periods of 2009, 2010, and 2011 were 50%, 46.3%, and 43.6%
respectively (Intercontinental Hotel Group, 2010, 2011, 2012b). This being the second hotel
company to report a cost of sales in the financial statements and also the second company
showing a cost of sales as a percentage of revenue decreasing in a time corresponding with the
release of the smartphone hotel reservations is the strongest evidence that was found in the
research that smartphone reservation applications save hotel companies money by saving
expenses related to generating the reservations (reduced salary expenses and agent fees due to
the automated reservation process). This evidence is not conclusive, due to the complicated and
numerous variables that affect financial statements, but can still be considered evidence that
smartphone hotel reservations lower the cost of sales and, if other expenses do not increase, may
increase profitability.
Wyndham Worldwide Corporation.
47
Wyndham Worldwide Corporations smartphone application was designed to be used with
the iPhone and other iOS based devices as well as with Android operating system based
smartphones. The smartphone reservation application’s release was during mid-November 2010.
The smartphone application works with Wyndham Rewards, the company’s loyalty reward
program which is partnered with other hotel and travel companies. The lack of BlackBerry and
Windows phone applications may minimize any possible effects the smartphone reservation
application had on the company’s financial trends (Wyndham Worldwide, 2011a).
The operating expenses as a percentage of total revenues for the years 2008, 2009, 2010,
and 2011 were 37.9%, 40%, 41.2%, and 41.9% (Wyndham Worldwide Corporation, 2010,
2011b). With the smartphone reservation application release taking place in the fourth quarter of
2010 if there was a decrease in operating expenses due to the use of the smartphone application
the operating expenses as a percentage of total revenue should have decreased in the 2011 annual
financial reporting year. The fact that the percentage continued to rise is evidence that the
smartphone application did not have a significant positive effect on the company’s financial data.
Choice Hotels.
Choice Hotels released its first smartphone reservation application in April of 2009,
which was designed only for iPhones. The application has many helpful features which would
impress the guests, including the Choice Privileges customer loyalty rewards program. The GPS
locator may be the most useful tool, helping guests by giving them directions to the nearest hotel
owned by Choice Hotels in addition to helping them make a reservation (Penton Media, 2012).
The operating expenses as a percentage of total revenues for the years 2007, 2008, 2009,
and 2010 were 69.9%, 72.8%, 73.8%, and 73% respectively (Choice Hotels, 2009, 2010, 2011).
Although operating expenses decreased the annual financial period following the release of the
48
smartphone reservation application the operating expenses as a percentage of total revenues were
still higher than the 2007 and 2008 reporting periods. This is an indication that the smartphone
reservation did not have a major effect on the operating expenses that would significantly
increase profitability.
Conclusions Summary
With only two of the hotel companies using cost of sales in their annual reports’ financial
statements four of the six companies were analyzed according to their operating
expenses/revenue ratios. These four companies did not show significant changes in the financial
trends that give evidence of smartphone reservation applications having any major effect on
profitability. The two hotels that used cost of sales both showed a decrease in cost of sales as a
percentage of total revenues, which is evidence that the use of smartphone hotel reservation
applications may decrease the cost of sales (costs and expenses related to generating
reservations). Because cost of sales is a part of operating expenses this does not conclusively
prove that smartphone applications promote financial growth or increase profitability; the
various other operating expenses and many other factors are also involved. Lowering expenses
related to booking reservations will have an effect on the profitability but in the bigger picture
other operating expenses may increase negating the effects.
Recommendations.
Recommendations that can be drawn from the six separate case studies, the research,
results, and conclusions of the compiled information is that financial growth and profitability
will need more than a small portion of the expenses being lowered in order to be significantly
improved. There is evidence that the use of smartphone reservation applications being used by
hotel companies does lower the cost of sales, but there is also no evidence that lowering the cost
49
of sales guarantees that total operating expenses will be proportionately decreased. If a company
wishes to streamline the reservation process and lower cost of sales releasing a smartphone
application will help, but does not guarantee an increase in the profit margin.
In order to significantly change financial trends to produce growth and increased
profitability the company will need to take a multi-faceted approach to lower expenses and
expanding the customer base through avenues other than only a smartphone application, though a
smartphone application may help. One solid recommendation that can be drawn from the
research is that if a smartphone application is released by a hotel company the company should
ensure that the application works correctly and does not leave a bad impression of the company
through ample negative feedback, as the Starwood Hotels & Resorts Worldwide, Inc. application
did (Mak, 2009). The case study of Intercontinental Hotel Group shows that guests are eager to
use such application and logic knows that such convenience will increase customer satisfaction
as long as the tools are reliable and perform consistently.
This financial information was is supported by information found on many websites
reporting smartphone reservation applications as well as news and academic articles that include
research about smartphone application usage, the pricing of hotel room reservations, and the
expenses and fees related to having representatives make contact with the customers that wish to
reserve rooms. Evidence suggests that outside representations can claim about one third of
revenue for the reservations they are responsible for generating. With hotel companies making
direct contact with the guests through smartphone applications these fees and expenses are
eliminated and new costs for maintaining the IT system are implemented. Without these agent
fees and reduced room prices offered to reservations agencies the profitability of hotel room

50
reservations can be increased through direct contact with the guest via smartphone applications
as well as other direct contact methods.
51
References
Anonymous. (2010). Starwood hotels and resorts worldwide launches its first application for
blackberry smartphones. Transportation Business Journal, September, 19(1), 101.
AOL. (2012). Top guest travel app review: Check in and earn more airline and hotel loyalty
points. Retrieved from http://www.gadling.com/2010/12/02/travel-app-review-topguest
rewards-check-ins-with-airline-and-h/
Belopotosky, D. (2011, May 5). Mobile booking apps are only just starting to deliver. New York
Times Company.
Burns, J. (2011). Choosing a Reservation representation company. Hospitality Upgrade, 50-56.
Campbell, J. (2011). Get there, orbitz for business breach booking barrier in mobile.
Business Travel News, 28(6), 32.
Choice Hotels. (2009). Choice Hotels 2008 Annual Report. Silver Spring, MD.
Choice Hotels. (2010). Choice Hotels 2009 Annual Report. Silver Spring, MD.
Choice Hotels. (2011). Choice Hotels 2010 Annual Report. Silver Spring, MD.
Conde Nast Digital. (2012). Mandarin oriental releases ubiquitous iPhone app for hotel
Reservations. Retrieved from http://www.hotelchatter.com/story/2010/10/20/104954/
49/hotels/Mandarin_Oriental_Releases_biquitous_iPhone_App_for_Hotel_Reservations
Demicco, F. J. (2009). The Microsoft home: applications for the lodging and restaurant industry
today and in the future. Journal of Foodservice Business Research, 12(1), 95-106.
Email-Marketing-Reports.com. (2012). Smartphone sales and statistics. Retrieved from
http://www.email-marketing-reports.com/wireless-mobile/smartphone-statistics.htm
International Hotel Group Launches iPhone app, Acquisitions not a priority for Lufthansa,
52
overcoming fear or flying. (2012). Retrieved from http://www.iprteam.com/792-ihg-
launches-iphone-app-acquisitions-not-a-priority-for-lufthansa-overcoming-fear-or-flying/
Intercontinental Hotel Group. (2010). Intercontinental Hotel Group 2009 annual report.
Denham, Buckinghamshire.
Intercontinental Hotel Group. (2011). Intercontinental Hotel Group 2010 annual report.
Denham, Buckinghamshire.
International Hotel Group. (2012a). Priority Club® Rewards iPhone® App. Retrieved from
http://www.ichotelsgroup.com/ihg/hotels/us/en/global/support/mobile/iphone
Intercontinental Hotel Group. (2012b). Intercontinental Hotel Group 2011 preliminary report.
Denham, Buckinghamshire.
Lin, Y., & Lee, T. (2010). The Impacts of the Online Reservation System in London City Hotels.
Journal Of Hospitality Marketing & Management, 19(1), 82-96.
Luxenberg, S. (2007). Wooing Hotel Customers Online. National Real Estate Investor, 49(2), 86.
Mak, D. (2009). Review of the Starwood Hotels SPG iPhone App. Retrieved from
http://www.mythoughtsonthings.com/archive/2009/07/10/review-starwood-hotels-spg-
iphone-app
Mandarin Oriental. (2010). Mandarin Oriental 2010 annual report. Causeway Bay, Hong Kong.
Mandarin Oriental. (2011a). Mandarin Oriental 2010 annual report. Causeway Bay, Hong
Kong.
Mandarin Oriental. (2011b). Mandarin Oriental 2011 half yearly report. Causeway Bay, Hong
Kong.
Mandarin Oriental. (2012). Mandarin Oriental Hotel Group Launches iPhone Application On
Itunes App Store. Retrieved from http://www.mandarinoriental.com/about_mo/media/
53
press_releases/property/mohg_moapp.aspx
Marksway Ltd. (2012). iPhone App InterContinental Hotels Group launched yesterday.
Retrieved from http://www.phonesreview.co.uk/2010/04/28/iphone-app-intercontinental
hotels-group-launched-yesterday/
Marriot Hotels. (2011a). Marriot Hotels second quarter 2011 report. Bethesda, MD.
Marriot Hotels. (2011b). Marriot Hotels third quarter 2011 report. Bethesda, MD.
Marriot Hotels. (2012a). So many hotels, so little time, problem solved. Retrieved from
http://news.marriott.com/2011/08/so-many-hotels-so-little-time-problem-solved.html
Marriot Hotels. (2012b). Marriot Hotels fourth quarter 2011 report. Bethesda, MD.
Mariot International Inc.. (2011, September). Internet technology, so many hotels, so little time,
problem solved. Technology and Business Journal, September, 2011(1), 775.
Penton Media. (2012). Brands, properties turn to smartphone marketing technology. Retrieved
from http://lhonline.com/features/marketing_technology_apps_iPhone_
BlackBerry_loyalty_printing_0602/
Starwood Hotels & Resorts Worldwide. (2009). Starwood Hotels & Resorts Worldwide 2008
annual report. New York, NY.
Starwood Hotels & Resorts Worldwide. (2010). Starwood Hotels & Resorts Worldwide 2009
annual report. New York, NY.
Starwood Hotels & Resorts Worldwide. (2011). Starwood Hotels & Resorts Worldwide 2010
annual report. New York, NY.
Starwood Hotels & Resorts Worldwide, Inc. (2012). News & events. Retrieved from
http://development.starwoodhotels.com/news/7/148
starwood_hotels_resorts_launches_its_first_application_for_blackberry_smartphones
54
Tnooz.com. (2012). Six out of ten users now downloading travel apps. Retrieved from
http://www.tnooz.com/2011/05/27/mobile/six-out-of-ten-mobile-users-now-
downloading-travel-apps/
USA Today. (2012). Hilton: Revenue from mobile apps soaring 200% monthly. Retrieved from
http://travel.usatoday.com/hotels/post/2010/09/hilton-iphone-apps-340000-downloads
hilton-apps-no-1-among-hotels/125113/1
Watkins, E. (2010). Trend spotting at hitec 2010. Lodging Hospitality, 66(10), 30.
Wolff, C. (2004). Shifting the Pricing Paradigm. Lodging Hospitality, 60(1), 38-41.
Working without a wire. (2009). Lodging Hospitality, 65(3), 34.
Wyndham Worldwide Corporation. (2010). Wyndham Worldwide Corporation 2009 annual
report. Parsippany, NJ.
Wyndham Worldwide Corporation. (2011a). Wingate by Wyndham Hotels to reward points for
virtual check-ins. Retrieved from http://www.wyndhamworldwide.com/media/press
releases/press-release?wwprdid=847
Wyndham Worldwide Corporation. (2011b). Wyndham Worldwide Corporation 2010 annual
report. Parsippany, NJ.
Wyndham Worldwide Corporation. (2012). Investor press releases. Retrieved from
http://www.wyndhamworldwide.com/investors/press-releases
Xinhua News Agency – CIES. (2010). Smartphone unveils new era of mobile tourism marketing.
Retrieved from http://news.xinhuanet.com/english2010/sci/2010-03/13/c_13209612.htm
55
Glossary
Breadth – scope; comprehensive quality
Business activity – Functions that a business performs as a method of attempting to gain a profit
Constraint – The state of being restricted or avoided to perform an action
Correlate – Relation of two things to either that implies the two things are complementary to
each other
Diversifying – To give variety to
Feasible – Capable of being done or carried out
Financial analysis – An accounting activity that measures the profitability or growth of a
business over a stated period of time
Growth – Increase in profits resulting from increased business activity or expansion of a business
that signifies good business health
iOS – Operating software designed by Apple that is used in iPhones, iPods, and iPads
Justify – To give reason or reasons that show the act is right or reasonable
Smartphones – a cell phone that includes software able to perform functions such as email and
internet browsing. Examples – iPhone, Blackberry, Android operating system phones
Smartphone reservation application – Software available for a smartphone that is capable of
assisting the user in making a reservation or altering a reservation at a hotel
All definitions in the glossary are derived from Merriam-Webster (Merriam-Webster
Incorporated, 2012)
Glossary Reference
Merriam-webster.com. (2012). Retrieved from http://www.merriam-webster.com/dictionary