Embed Size (px)
Citation preview
Smarter than beta
Why factor investing?
White Paper March 2015
Authored by:
Alexander Davey, Director, Senior Equity Product Specialist
Stephen Tong, Director, Senior Equity Product Specialist
2
Smarter than beta Why factor investing? What is factor investing? 3
Alternative weighting schemes 3
Investment considerations 5
Factor investing in practice 7
Implementation of factor strategies 7
Low volatility case study 8
Conclusion 11
Introduction
Factor investing offers the potential for excess
returns that are generally achieved through a rules-
based, transparent methodology. Many factors such
as Value, Quality, Momentum, and Low Volatility
have been shown to deliver excess returns with
persistency over the long term. Factors also offer a
language for understanding the sources of portfolio
returns. Together, factor exposures and portfolio
construction are key drivers of overall return patterns.
Therefore it is important for investors to understand
factors and evaluate factor strategies. In this paper,
we examine low volatility as a case study to show
factor investing in action.
3
What is factor investing? Alternative weighting schemes
Factor investing offers the potential for excess
returns and increases the transparency around the
sources of return.
The appeal of traditional cap-weighted investing is
based on the notion of efficient markets. Cap-
weighted investing is macro-consistent, high capacity
and cost effective, and it has served as a
performance reference for equity industry. Cap-
weighting never challenges the potential irrationality
of markets, yet it manages to produce better returns
over time than many active managers. The strength
of such passive investing highlights the importance of
a single factor – beta – in explaining equity returns,
and it sets the bar for any alternative strategy to
improve upon market returns.
Smart beta, including factor investing, categorizes a
host of techniques which aim to improve risk-
adjusted returns versus standard market indices.
They operate within the fundamental rules of asset
management, but may challenge and disrupt
common wisdom.
While cap-weighted index weights adjust according
to market prices, alternative weighting approaches
enable a systematic rebalancing discipline to add
value by taking advantage of excess volatility. By
removing the link with price, alternative weighting
strategies help protect investors from behavioral
biases and “irrational exuberances” that can escalate
or depress asset values. Some academic papers
have shown that many alternative weighting
strategies, regardless of criterion, have this powerful
effect. For example, research by Clare, Motson and
Thomas1 has shown that alternative weighting
strategies delivered better risk-adjusted returns than
the cap-weighted index (using data on the 1,000
largest US stocks every year from 1968 to the end of
2011).
Intuitively, such a rebalancing process may sound
mistaken. Cut winners to fund losers? The broad
answer is that stock markets can run away with
themselves (New York in the late 1920s; Japan in the
1980s; New York, again, in the late 1990s) only to
undergo substantial corrections. Alternative
weighting and rebalancing can be beneficial as a
primary strategic goal.
Portfolio returns can be driven by common
factors
Do hundreds of stocks in a portfolio represent
hundreds of individual contributory elements to the
portfolio? Certainly, each company will have
idiosyncratic elements, and, by extension,
concentrated portfolios might well exhibit more
unusual characteristics. But for portfolios with a
larger number of holdings, common factors may be
more telling, and many individual decisions can be
reinterpreted in aggregate as tilts towards a few
factor risk premiums. For Professor Ang, factors offer
a powerful, simplifying means of understanding the
most important sources of returns. This forms a basis
for factor investing.
“Thousands of correlated individual bets by
managers effectively become large bets on
factors. An equity manager going long 1,000
value-oriented stocks and underweighting 1,000
growth stocks does not have 1,000 separate
bets; he has one big bet on the value-growth
factor. A fixed income manager who squeezes
out the last bits of yield by finding 1,000
relatively illiquid bonds funded by short
positions in 1,000 liquid bonds (through the repo
market) has made one bet on an illiquidity
factor2.”
1 “We find that all of the alternative indices considered would have produced a better risk-adjusted performance than could have been achieved by having a passive exposure to a market capitalization-weighted index.” An evaluation of alternative equity indices, Cass Business School, Clare, A., Motson, N., Thomas, S., An evaluation of alternative equity indices, Cass Business School, 2013
2 Ang, A., Asset Management: a Systematic Approach to Factor Investing, Oxford University Press, 2014
4
Factor definitions
There are numbers of data points that can aid in the
understanding of listed companies, such as the
number of employees with relevant PhDs or the
enterprise’s industrial safety record. These data
points may even inform investors about potential
risks.
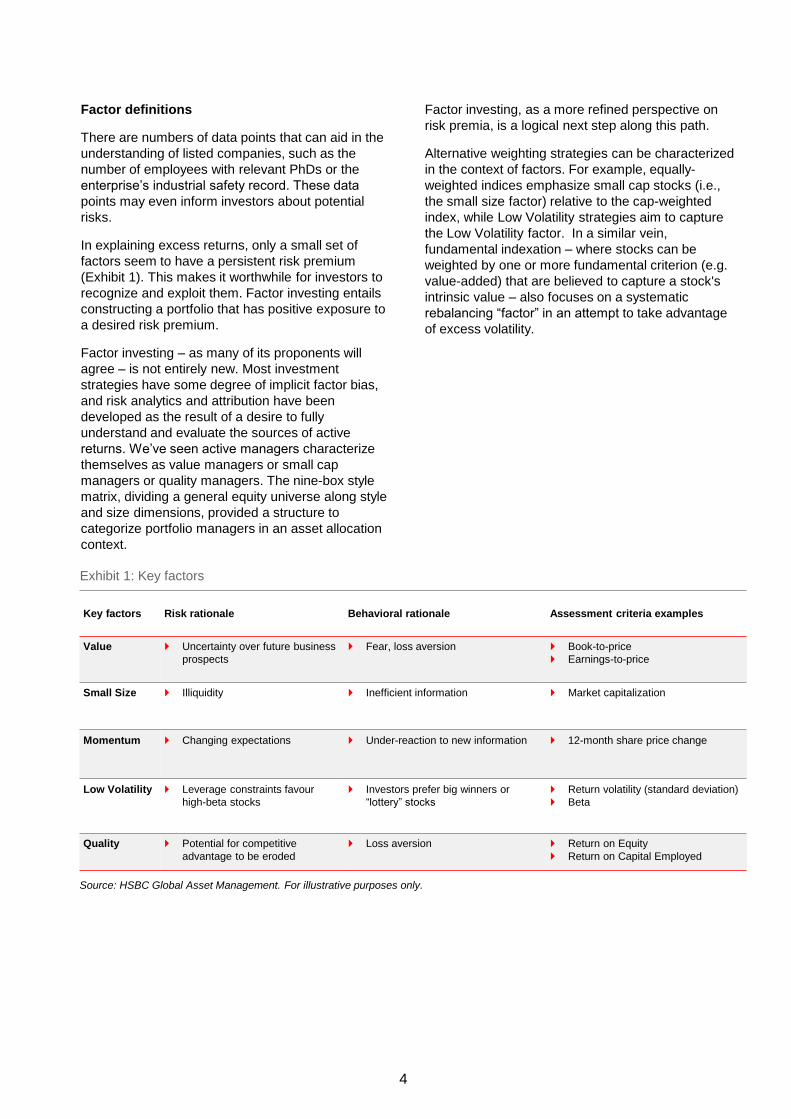
In explaining excess returns, only a small set of
factors seem to have a persistent risk premium
(Exhibit 1). This makes it worthwhile for investors to
recognize and exploit them. Factor investing entails
constructing a portfolio that has positive exposure to
a desired risk premium.
Factor investing – as many of its proponents will
agree – is not entirely new. Most investment
strategies have some degree of implicit factor bias,
and risk analytics and attribution have been
developed as the result of a desire to fully
understand and evaluate the sources of active
returns. We’ve seen active managers characterize
themselves as value managers or small cap
managers or quality managers. The nine-box style
matrix, dividing a general equity universe along style
and size dimensions, provided a structure to
categorize portfolio managers in an asset allocation
context.
Factor investing, as a more refined perspective on
risk premia, is a logical next step along this path.
Alternative weighting strategies can be characterized
in the context of factors. For example, equally-
weighted indices emphasize small cap stocks (i.e.,
the small size factor) relative to the cap-weighted
index, while Low Volatility strategies aim to capture
the Low Volatility factor. In a similar vein,
fundamental indexation – where stocks can be
weighted by one or more fundamental criterion (e.g.
value-added) that are believed to capture a stock's
intrinsic value – also focuses on a systematic
rebalancing “factor” in an attempt to take advantage
of excess volatility.
Key factors Risk rationale Behavioral rationale Assessment criteria examples
Value Uncertainty over future business
prospects
Fear, loss aversion
Book-to-price
Earnings-to-price
Small Size Illiquidity Inefficient information Market capitalization
Momentum Changing expectations Under-reaction to new information 12-month share price change
Low Volatility Leverage constraints favour
high-beta stocks
Investors prefer big winners or
“lottery” stocks
Return volatility (standard deviation)
Beta
Quality Potential for competitive
advantage to be eroded
Loss aversion
Return on Equity
Return on Capital Employed
Exhibit 1: Key factors
Source: HSBC Global Asset Management. For illustrative purposes only.
5
What is factor investing? Investment considerations
Factor investing is not as simple as building a portfolio
of stocks that rank highly on a specific factor. There is
fair debate over whether risk premiums are persistent.
In addition, the investment process – stock selection
(i.e., factor criteria) and portfolio construction
(weighting, rebalancing) – can have a significant
impact on investment outcomes.
Factor persistency
If factors have delivered excess returns on an
empirical basis, one naturally questions what can
drive persistency. Indeed, there are plausible
explanations put forward for individual factors that
suggest factor efficacy can be long-lasting. Financial
theory suggests investors earn higher returns for
bearing higher risk, so factors must be perceived, in
some way, as more risky for some market
participants. Behavioural finance may also highlight
investor actions that are unlikely to change.
Still, if cap-weighted indexation is the only macro-
consistent passive strategy, then investors may well
think of factor investing as a “more than passive”
strategy with potential capacity constraints. Risk
premia are susceptible to market erosion, through
arbitrage (i.e., popularity of the strategy and weight of
money) and the formation of a “crowded trade” which
can reduce potential returns. Some academics argue
that this is precisely what happened in the 1980s with
small caps3, following the Rolf Banz paper on the size
premium. Enough investors raised their allocations to
small caps – even at higher prices – to extinguish the
size premium. This interpretation remains a matter of
discussion, but it is a good reminder that factor risk
premiums are not immutable and remain part of the
organic, often surprising course of stock markets. On-
going analysis can evaluate how factor risk premiums
may change over time.
Building factor exposure
While there is general agreement on the set of factors
that can drive excess returns, there is little consensus
on the criteria for creating exposure to a specific
factor, nor is there a common portfolio construction
methodology either for weighting or rebalancing. If
asset managers have different ranking criteria and
different portfolio construction approaches, risk and
return characteristics are likely to vary substantially
across factor strategies that share similar labels.
Investors should not presume there is homogeneity
across factor strategies.
As factor criteria and portfolio construction drive
portfolio factor exposures and ultimately return
patterns, they are critical components of investment
process design.
Each stock will have a unique factor profile
depending on the criteria used to determine
exposure to each factor. As a result, a stock ranking
highly on one factor may have positive or negative
exposures to other factors. How stocks are weighted
will determine the portfolio’s target factor exposure
and its residual exposure to other factors. A key
consideration of portfolio construction is how to
manage factor exposure versus residual exposures.
Attempting to maximize exposure to one factor may
drive higher residual exposures, while attempting to
minimize residual exposures could reduce the
exposure to the desired factor.
The portfolio factor profile has broad implications.
First and foremost, it provides the foundation for
portfolio returns. We know that factor returns can
vary with macroeconomic conditions and market
cycles. As well, the correlation of excess returns
between factors can vary over time. Together, these
elements drive the pattern of portfolio returns.
In terms of investment governance, inconsistent
factor exposures increases the difficulty in explaining
returns. In addition, competing factor exposures
could mask the impact of the target factor. For
example, in the recovery after the global financial
crisis, we saw that both Value and Momentum
factors delivered excess returns. Which factor could
we say was the main driver of returns? When factors
are coincident, risk frameworks are challenged.
Return attribution would be inconclusive as the
analysis would be dependent on the order in which
the factors were regressed.
3 See for example, Andrew Ang in Chapter 14 of Asset management: a systematic approach to factor investing. OUP, 2013
6
Multi-factor diversification
We also observe that factor returns are time-varying
and can have long return cycles, implying factor
strategies can outperform or underperform relative to
the market cap index over long periods.
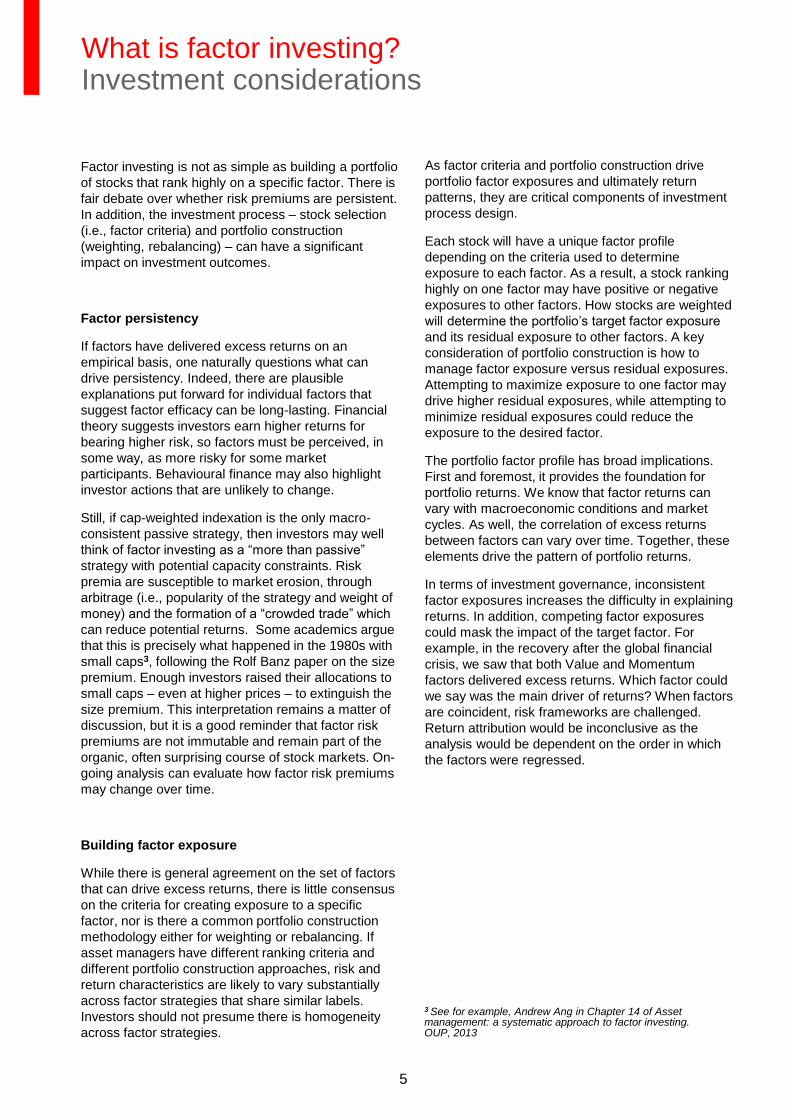
Exhibit 2 shows that single factors have low or
negative correlation with other factors, which means
while one factor may experience a long period of
underperformance, another factor may
simultaneously outperform. While correlations
between factors may change over time, returns are
generally orthogonal, so it is unlikely that all factors
outperform or underperform at the same time.
Given the different return patterns and low
correlations across factors, it seems to be
straightforward that combining factors in a multi-
factor portfolio could help keep excess return
potential strong while the diversification could lower
tracking error. The power of factor combinations is
evident. Note that it is critical to combine highly
efficient or “pure” factor strategies to mitigate the
affects of residual exposures on the risk and return
characteristics of the combination.
We see dynamic factor allocation as the next frontier
in multi-factor strategies.
Qualitative and quantitative
Factor investing lends itself to quantitative
management. Stock selection and portfolio
construction, however, may not include parameters
that screen out unattractive investments. For
example, one might express the value factor by low
price to book ratio. However, a stock may have low
value because its business is at risk and the market
has rightly marked down its value. In some
situations, including an element of fundamental or
qualitative judgement could temper some of the
effects described above and bring additional value to
the investment process in assessing the investment
potential of individual names.
A step beyond quantitative management, indexation
through a systematic, rules-based approach can
create a transparent, liquid and cost-effective
investment solution, though rules transparency may
create an arbitrage opportunity for traders around
index changes.
Valu
e
Sm
all
Cap
Mo
men
tum
Lo
w
Vo
lati
lity
Qu
ali
ty
Value
Small Cap 0.4
Momentum 0.2 0.1
Low Volatility -0.2 0.3 0.0
Quality 0.3 0.1 0.1 -0.1
Exhibit 2: Factor correlations
Excess returns relative to MSCI World, from June 2001 to December 2014. Source: HSBC Global Asset Management Simulated data is shown for illustrative purposes only, and should not be relied on as an indication of future returns. Simulations are based on back testing assuming that the optimization models and rules in place today are applied to historical data. As with any mathematical model that calculates results from inputs, results may vary significantly according to the values applied. Prospective investors should understand the assumptions and evaluate these assumptions to determine if they are appropriate for their purposes. Some relevant events or conditions may not have been considered in the assumptions. Actual events or conditions may differ materially from assumptions. Past performance is indicative only and not a guarantee of future results.

7
Factor investing in practice Implementation of factor strategies
Accessing factor strategies
How can asset owners take advantage of factor
strategies? The key challenge for asset owners is
how best to incorporate these new strategies within
their investment portfolios.
Over time, factor strategies can deliver excess
returns versus cap-weighted indices. They introduce
tracking error versus the cap-weighted index. The
diversity in the behavior of various factors means that
combining factors is not merely a case of gluing
together boxes back into an original whole, as is the
case with the current style matrix. Investors can
select which factor or factor combination best suits
their investment beliefs and needs. We see factor
strategies as a complement to traditional active stock
selection strategies that aim to capture idiosyncratic
risk.
A factor perspective has advantages over a style
matrix perspective
If one picks an investment strategy from each style
matrix box, asset owners are obliged to evaluate the
contribution of market beta, factors, stock selection
and manager skill for each mandate. In the end, their
aggregate contribution may amount to little more
than the market itself. Of course, if a large-cap value
manager and a small-cap growth manager are
selected, there may be definite tilts to the pairing in
aggregate. But the investor may also acquire
elements of bias from each box which effectively
offset each other so that the investor ends up buying
the market, more or less. Manager style drift can also
negate asset allocation decisions. In contrast, factor
strategies do not sum to the market, so this outcome
is less likely.
Greater transparency of returns
Many asset owners familiar with traditional style
investing have attributed active returns to a
combination of style exposure and idiosyncratic risk,
or manager skill. Style manager returns are often
referenced against a relevant style index as well as a
broader standard market-cap index.
We see the prism of factors as providing additional
insight into active returns, in combination with
traditional attribution parameters. If active manager
returns are decomposed into factor exposures and
skill, it might be the case that returns once
considered driven by skill may now be the result of
factor exposure. As with style indices, traditional
active managers may be asked to outperform a
reference factor index rather than a cap-weighted
index, uncovering closet factor seekers. Active
managers will need to adapt, acknowledging the
power and pervasiveness of factors within their own
strategies.
8
Factor investing in practice Low volatility case study
We consider low volatility as a case study to show
factor investing in action.
Low volatility definition
The low volatility anomaly was first documented
academically by Haugen and Heins over forty years
ago4. They discovered that stocks with lower volatility
can deliver better returns than stocks with higher
volatility. Over twenty years ago, Nobel prize-winner
Fischer Black proposed that low beta stocks should
be considered a separate category, which would
enable asset owners to better understand how to
incorporate them into asset allocation – for example,
a split of 80% low beta stocks and 20% fixed income.
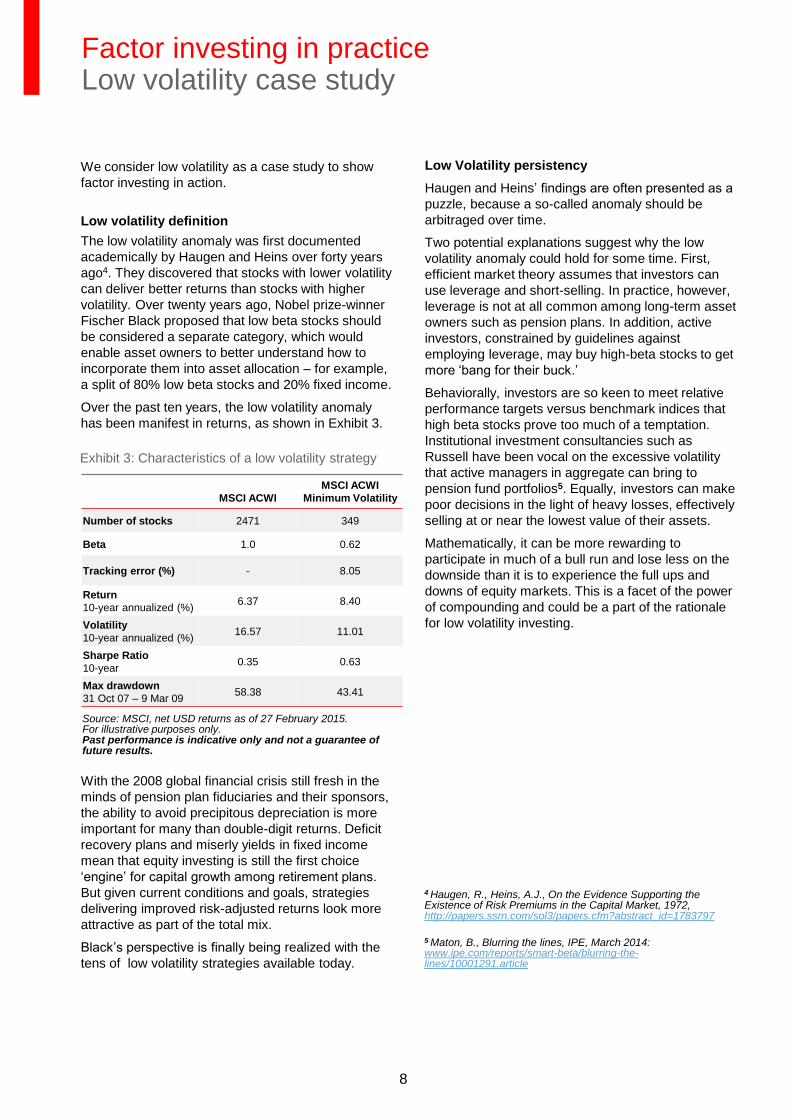
Over the past ten years, the low volatility anomaly
has been manifest in returns, as shown in Exhibit 3.
With the 2008 global financial crisis still fresh in the
minds of pension plan fiduciaries and their sponsors,
the ability to avoid precipitous depreciation is more
important for many than double-digit returns. Deficit
recovery plans and miserly yields in fixed income
mean that equity investing is still the first choice
‘engine’ for capital growth among retirement plans.
But given current conditions and goals, strategies
delivering improved risk-adjusted returns look more
attractive as part of the total mix.
Black’s perspective is finally being realized with the
tens of low volatility strategies available today.
Low Volatility persistency
Haugen and Heins’ findings are often presented as a
puzzle, because a so-called anomaly should be
arbitraged over time.
Two potential explanations suggest why the low
volatility anomaly could hold for some time. First,
efficient market theory assumes that investors can
use leverage and short-selling. In practice, however,
leverage is not at all common among long-term asset
owners such as pension plans. In addition, active
investors, constrained by guidelines against
employing leverage, may buy high-beta stocks to get
more ‘bang for their buck.’
Behaviorally, investors are so keen to meet relative
performance targets versus benchmark indices that
high beta stocks prove too much of a temptation.
Institutional investment consultancies such as
Russell have been vocal on the excessive volatility
that active managers in aggregate can bring to
pension fund portfolios5. Equally, investors can make
poor decisions in the light of heavy losses, effectively
selling at or near the lowest value of their assets.
Mathematically, it can be more rewarding to
participate in much of a bull run and lose less on the
downside than it is to experience the full ups and
downs of equity markets. This is a facet of the power
of compounding and could be a part of the rationale
for low volatility investing.
4 Haugen, R., Heins, A.J., On the Evidence Supporting the Existence of Risk Premiums in the Capital Market, 1972, http://papers.ssrn.com/sol3/papers.cfm?abstract_id=1783797
5 Maton, B., Blurring the lines, IPE, March 2014: www.ipe.com/reports/smart-beta/blurring-the-lines/10001291.article
MSCI ACWI
MSCI ACWI
Minimum Volatility
Number of stocks 2471 349
Beta 1.0 0.62
Tracking error (%) - 8.05
Return
10-year annualized (%) 6.37 8.40
Volatility
10-year annualized (%) 16.57 11.01
Sharpe Ratio
10-year 0.35 0.63
Max drawdown
31 Oct 07 – 9 Mar 09 58.38 43.41
Exhibit 3: Characteristics of a low volatility strategy
Source: MSCI, net USD returns as of 27 February 2015. For illustrative purposes only. Past performance is indicative only and not a guarantee of future results.
9
Building low volatility exposure
Three low volatility indices demonstrate differences
between strategies aimed at expressing the same
factor. The MSCI ACWI Minimum Volatility Index
applies an optimization process to deliver the lowest
return variance, with a maximum limit of ±5% on its
sector weights relative to the cap-weighted index.
The MSCI ACWI Volatility Tilt Index reweights the
cap-weighted index by the inverse of security price
variance. In contrast, the S&P Low Volatility Indices
screen for the least volatile stocks, have no such
sector constraints and their constituents are weighted
relative to the inverse of their volatility.
Exhibit 4 shows the return and volatility for the three
indices and the underlying cap-weighted index. Each
of the Low Volatility indices showed attractive
performance characteristics relative to the underlying
index, but the performance of the two MSCI volatility
strategies shows how a difference in investment
process can drive different outcomes.
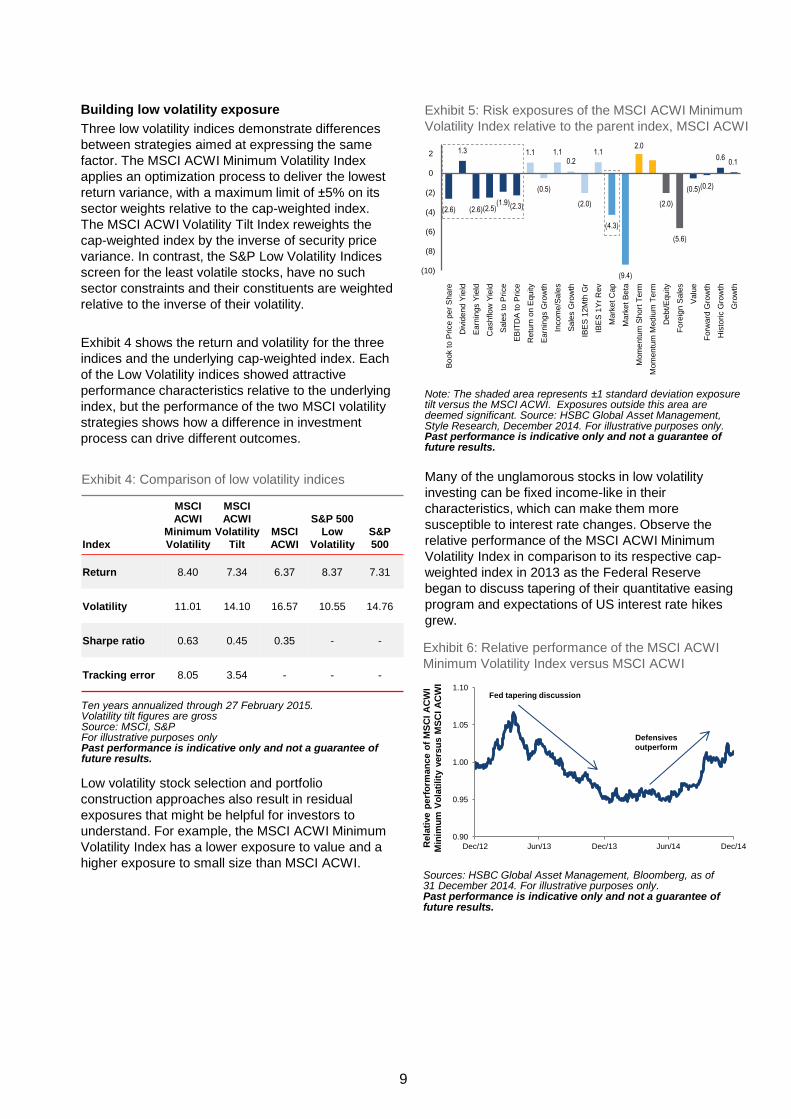
Low volatility stock selection and portfolio
construction approaches also result in residual
exposures that might be helpful for investors to
understand. For example, the MSCI ACWI Minimum
Volatility Index has a lower exposure to value and a
higher exposure to small size than MSCI ACWI.
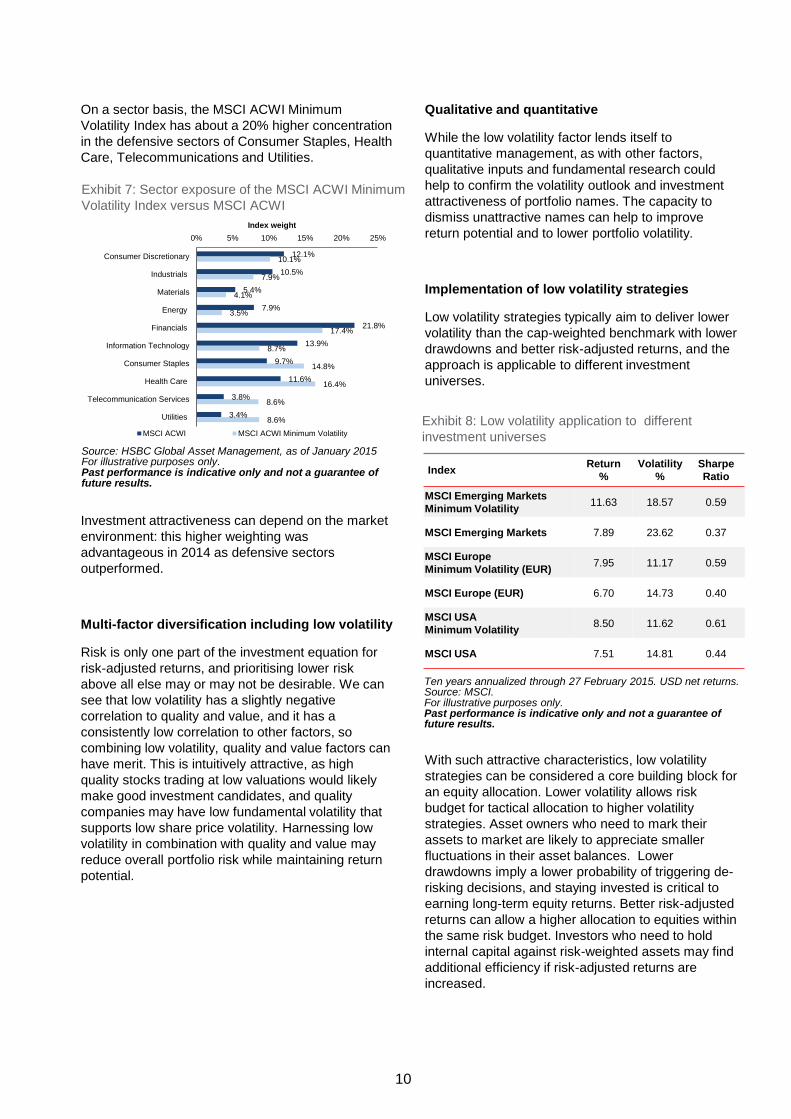
Many of the unglamorous stocks in low volatility
investing can be fixed income-like in their
characteristics, which can make them more
susceptible to interest rate changes. Observe the
relative performance of the MSCI ACWI Minimum
Volatility Index in comparison to its respective cap-
weighted index in 2013 as the Federal Reserve
began to discuss tapering of their quantitative easing
program and expectations of US interest rate hikes
grew.
Exhibit 4: Comparison of low volatility indices
Ten years annualized through 27 February 2015. Volatility tilt figures are gross Source: MSCI, S&P For illustrative purposes only Past performance is indicative only and not a guarantee of future results.
Index
MSCI
ACWI
Minimum
Volatility
MSCI
ACWI
Volatility
Tilt
MSCI
ACWI
S&P 500
Low
Volatility
S&P
500
Return 8.40 7.34 6.37 8.37 7.31
Volatility 11.01 14.10 16.57 10.55 14.76
Sharpe ratio 0.63 0.45 0.35 - -
Tracking error 8.05 3.54 - - -
Note: The shaded area represents ±1 standard deviation exposure tilt versus the MSCI ACWI. Exposures outside this area are deemed significant. Source: HSBC Global Asset Management, Style Research, December 2014. For illustrative purposes only. Past performance is indicative only and not a guarantee of future results.
Exhibit 5: Risk exposures of the MSCI ACWI Minimum
Volatility Index relative to the parent index, MSCI ACWI
(2.6)
1.3
(2.6) (2.5) (1.9) (2.3)
(0.5) (0.2)
0.6 0.1
1.1
(0.5)
1.1 0.2
(2.0)
1.1
(4.3)
(9.4)
2.0
(2.0)
(5.6)
(10)
(8)
(6)
(4)
(2)
0
2
Bo
ok t
o P
rice p
er
Sha
re
Div
ide
nd
Yie
ld
Ea
rnin
gs Y
ield
Cash
flo
w Y
ield
Sa
les t
o P
rice
EB
ITD
A to
Pri
ce
Retu
rn o
n E
quity
Ea
rnin
gs G
row
th
Incom
e/S
ale
s
Sa
les G
row
th
IBE
S 1
2M
th G
r
IBE
S 1
Yr
Rev
Mark
et
Cap
Mark
et
Be
ta
Mom
en
tum
Sh
ort
Te
rm
Mom
en
tum
Med
ium
Te
rm
Deb
t/E
quity
Fore
ign
Sa
les
Va
lue
Forw
ard
Gro
wth
His
tori
c G
row
th
Gro
wth
Sources: HSBC Global Asset Management, Bloomberg, as of 31 December 2014. For illustrative purposes only. Past performance is indicative only and not a guarantee of future results.
Exhibit 6: Relative performance of the MSCI ACWI
Minimum Volatility Index versus MSCI ACWI
0.90
0.95
1.00
1.05
1.10
Dec/12 Jun/13 Dec/13 Jun/14 Dec/14
Fed tapering discussion
Defensives
outperform
Rela
tive p
erf
orm
an
ce o
f M
SC
I A
CW
I
Min
imu
m V
ola
tility
vers
us M
SC
I A
CW
I
10
On a sector basis, the MSCI ACWI Minimum
Volatility Index has about a 20% higher concentration
in the defensive sectors of Consumer Staples, Health
Care, Telecommunications and Utilities.
Investment attractiveness can depend on the market
environment: this higher weighting was
advantageous in 2014 as defensive sectors
outperformed.
Multi-factor diversification including low volatility
Risk is only one part of the investment equation for
risk-adjusted returns, and prioritising lower risk
above all else may or may not be desirable. We can
see that low volatility has a slightly negative
correlation to quality and value, and it has a
consistently low correlation to other factors, so
combining low volatility, quality and value factors can
have merit. This is intuitively attractive, as high
quality stocks trading at low valuations would likely
make good investment candidates, and quality
companies may have low fundamental volatility that
supports low share price volatility. Harnessing low
volatility in combination with quality and value may
reduce overall portfolio risk while maintaining return
potential.
Qualitative and quantitative
While the low volatility factor lends itself to
quantitative management, as with other factors,
qualitative inputs and fundamental research could
help to confirm the volatility outlook and investment
attractiveness of portfolio names. The capacity to
dismiss unattractive names can help to improve
return potential and to lower portfolio volatility.
Implementation of low volatility strategies
Low volatility strategies typically aim to deliver lower
volatility than the cap-weighted benchmark with lower
drawdowns and better risk-adjusted returns, and the
approach is applicable to different investment
universes.
With such attractive characteristics, low volatility
strategies can be considered a core building block for
an equity allocation. Lower volatility allows risk
budget for tactical allocation to higher volatility
strategies. Asset owners who need to mark their
assets to market are likely to appreciate smaller
fluctuations in their asset balances. Lower
drawdowns imply a lower probability of triggering de-
risking decisions, and staying invested is critical to
earning long-term equity returns. Better risk-adjusted
returns can allow a higher allocation to equities within
the same risk budget. Investors who need to hold
internal capital against risk-weighted assets may find
additional efficiency if risk-adjusted returns are
increased.
Source: HSBC Global Asset Management, as of January 2015 For illustrative purposes only. Past performance is indicative only and not a guarantee of future results.
Exhibit 7: Sector exposure of the MSCI ACWI Minimum
Volatility Index versus MSCI ACWI
12.1%
10.5%
5.4%
7.9%
21.8%
13.9%
9.7%
11.6%
3.8%
3.4%
10.1%
7.9%
4.1%
3.5%
17.4%
8.7%
14.8%
16.4%
8.6%
8.6%
0% 5% 10% 15% 20% 25%
Consumer Discretionary
Industrials
Materials
Energy
Financials
Information Technology
Consumer Staples
Health Care
Telecommunication Services
Utilities
Index weight
MSCI ACWI MSCI ACWI Minimum Volatility
Index Return
%
Volatility
%
Sharpe
Ratio
MSCI Emerging Markets
Minimum Volatility 11.63 18.57 0.59
MSCI Emerging Markets 7.89 23.62 0.37
MSCI Europe
Minimum Volatility (EUR) 7.95 11.17 0.59
MSCI Europe (EUR) 6.70 14.73 0.40
MSCI USA
Minimum Volatility 8.50 11.62 0.61
MSCI USA 7.51 14.81 0.44
Exhibit 8: Low volatility application to different
investment universes
Ten years annualized through 27 February 2015. USD net returns. Source: MSCI. For illustrative purposes only. Past performance is indicative only and not a guarantee of future results.

11
Conclusion ?
Factor strategies have attractive investment
characteristics that should naturally drive
adoption by asset owners, and the breadth and
growth of factor investing has been astonishing.
Assets in smart beta strategies have grown 170%
over the past five years to over $540 billion
globally, according to Morningstar. Fiduciaries
that acknowledge the benefits of factor investing
have reshaped their investment strategies
accordingly.
It is clear that the investment process—factor
criteria and portfolio construction—can have a
direct impact on outcomes, and provide more
transparency into what is being delivered,
thereby helping to increase asset owner
confidence. For asset managers, we believe that
having conceptual clarity is key to advancing
beyond the current thinking and to deliver even
more robust factor strategies.

12
Authors ?
Stephen joined HSBC in 2014 as a Senior Equity
Product Specialist supporting global, European, UK
and thematic equities. Previously he worked on
sustainable solutions as Head of Emerging Markets
Portfolio Management at Bank Vontobel. Prior, he
was at AllianceBernstein for twelve years in
Singapore, Tokyo and London.
Stephen holds a Master of Business Administration
from Stanford University, an M.S. Food Science from
the University of California at Davis, and a B.S.
Mechanical Engineering and Nuclear Engineering
with High Honors from the University of California at
Berkeley. Stephen is a CFA charterholder.
Stephen Tong
Director, Senior Equity Product
Specialist
HSBC Global Asset Management
(UK)
Alexander Davey is the Director of Alternative Beta
Strategies with HSBC Global Asset Management
(UK) Ltd., joining the firm in 2014. He has 17 years
industry experience having held both sales and
investment focused roles with Barclay Global
Investors, Morgan Stanley Investment Management
and most recently Barclays Wealth and Investment
Management.
Alexander has a BA Honours in History from the
University of York and is a full Member of the
Chartered Securities Institute.
Alexander Davey
Director, Senior Equity Product
Specialist
HSBC Global Asset Management
(UK)
13
For financial professionals only. Not for further distribution
This document is for information only and does not constitute investment advice, a solicitation or a
recommendation to buy, sell or subscribe to any investments.
HSBC Global Asset Management has based this document on information obtained from sources it believes to
be reliable but which it has not independently verified. HSBC Global Asset Management and HSBC Group
accept no responsibility as to its accuracy or completeness.
The views expressed above were held at the time of preparation and are subject to change without notice.
Forecasts, projections or targets where provided are indicative only and are not guaranteed in any way. HSBC
Global Asset Management accepts no liability for any failure to meet such forecasts, projections or targets.
The value of any investments and any income from them can go down as well as up and investors may not get
back the amount originally invested. Where overseas investments are held the currency exchange may also
cause the value of such investments to fluctuate.
Past performance is indicative only and is no guarantee of future results. It is important to understand that
alternative beta indices do not outperform capitalization weighted indices at all times. In certain cases they can
underperform cap-weighted indices over considerable time periods.
US persons (both entities and individuals) are subject to US taxation on their worldwide income and may be
subject to tax and other filing obligations with respect to their US and non-US accounts. The Foreign Account
Tax Compliance Act (FATCA) is a US law designed to prevent the use of non-US accounts or non-US entities
to avoid US taxation of income and assets. To meet this objective, FATCA imposes on US and non-US entities
certain documentation, due diligence, withholding and reporting requirements with respect to accounts and
certain payments. Investors should consult their independent tax advisors about investment tax implications.
HSBC Global Asset Management is the brand name for the asset management businesses of HSBC Group.
HSBC Global Asset Management (USA) Inc. is an investment adviser registered in the US with the Securities
and Exchange Commission.
The contents of this document are confidential and may not be reproduced or further distributed to any person
or entity, whether in whole or in part, for any purpose.
© Copyright 2015 HSBC Global Asset Management. All rights reserved. CA# 20150320 - 111328
Important information ?