Embed Size (px)
Citation preview
Smart prepayment meters:householder experiences
Final report to Chesshire Lehmann Fund, March 2016
Contributing authors: Kate Simpson, Karen Smith, Kate Thomas
3 St Peter’s Court
Bedminster Parade
Bristol BS3 4AQ
0117 934 1400
www.cse.org.uk
We are a national charity that sharesour knowledge and experience tohelp people change the way theythink and act on energy.
(Charity 298740)
Centre for Sustainable Energy
Sign up to our monthly
enews at www.cse.org.uk
or follow us on Twitter at
@cse_bristol
1
This research was made possible through a grant from the Chesshire Lehmann Fund.
It also forms part of the Centre for Sustainable Energy’s work on the USmartConsumer project. This EU-funded project explores how households can get the most from their smart meters in terms of energy efficiency and managing fuel bills. By informing and involving consumers so they can access smart meter services and user-friendly interfaces, the aim is to improve consumer engagement with smart meters and reduce energy use. A special thank you to Jan and John, two volunteers who conducted many of the home visit interviews, and to all the research participants.
This publication is part of the project “USmartConsumer - You are a Smart Consumer”. The content of this document is for information purposes only. The relevant legal instruments and the text of the call shall take precedence over the information contained in this document. The European Commission or EASME does not accept responsibility for any use made of the information contained therein.
2
Executive summary This report presents the findings of research on householders’ experiences of using smart
prepayment meters (PPM) with the energy company Utilita, after switching from regular
prepayment meters.
Semi-structured interviews were used to gather data on householder experiences of 30 households.
Half of the households (n=15) received a home visit which included an interactive advice session,
delivered by energy advisers from the Centre for Sustainable Energy (CSE), on using their meters,
and a follow-up call four to six weeks later. Advice sessions were led predominantly by volunteers
experienced in conducting home visits, trained in energy awareness and the use of smart meter
displays. A control group (n=15) received a stand-alone 15 minute telephone interview. All
interviews were conducted in late summer/autumn 2015.
The householders were motivated to switch for four main reasons: Utilita were cheaper than other
companies, the flexible top-up options, they were attracted by the smart meter and display or
because they were keen to try a new company.
The householders were either approached by a door-to-door or telephone sales person, or
contacted Utilita independently after finding out that they were offering smart meters. Eight
participants went on to recommend the smart PPM to others, five of whom confirmed they had
since had meters installed.
Overall the householders reported positive experiences in using their smart meters. During the
home visits participants commented on the mobile nature of the display; this enabled them to place
it in a convenient and accessible location. The participants seemed mostly at ease in using the smart
meter display, especially following demonstrations. Some participants reported that the presence of
the display had resulted in increased awareness of their credit balance, less self-disconnection, and
greater peace of mind. Difficulties occasionally occurred with gas top ups as the credit did not
automatically show as quickly as electricity credits.
The analysis has found that this sample of householders would have benefitted from more detailed
advice on use of the smart meter display. Whilst most householders had received Utilita’s guidance
at installation on using the display, some were unaware of how to utilise it to use energy more
efficiently in the home or how to enter Emergency Credit. Lack of internet access prevented a few
households from registering online for phone topping up which would have benefitted them due to
health conditions. More focus could be placed on the provision of tailored energy efficiency advice
as set out in SMICoP1. Offering a variety of ongoing means to engage households on use of the
display (e.g. videos, phone advice, demonstrations and messaging) could reiterate key points on its
use for energy management/reduction and support more vulnerable households.
1 SMICoP: Smart metering installation code of practice, Section 3.7: Provision of Energy Efficiency Guidance
3
Contents Executive summary ................................................................................................................................. 2
Description of activities .......................................................................................................................... 4
Findings ................................................................................................................................................... 5
1) What motivated households to switch to smart prepay? .......................................................... 5
2) What information or support was provided to participants by the supplier in understanding
how to use their smart meter? ........................................................................................................... 6
3) How did participants use the smart meter display? ................................................................... 7
Table 1. Smart meter display activity per interview group ..................................................................... 8
4) Were households better able to reduce their energy expenditure? .......................................... 8
5) Did households have improved control of their energy use? ..................................................... 9
6) Health-related points ................................................................................................................ 11
Suggestions for further assistance to householders in using their smart meter display to manage
their energy use .................................................................................................................................... 13
Policy implications and recommendations ........................................................................................... 14
Further research ................................................................................................................................... 18
Appendix1: Demographic data for research participants ..................................................................... 19
Table 2: Demographic data for home visit group ............................................................................ 19
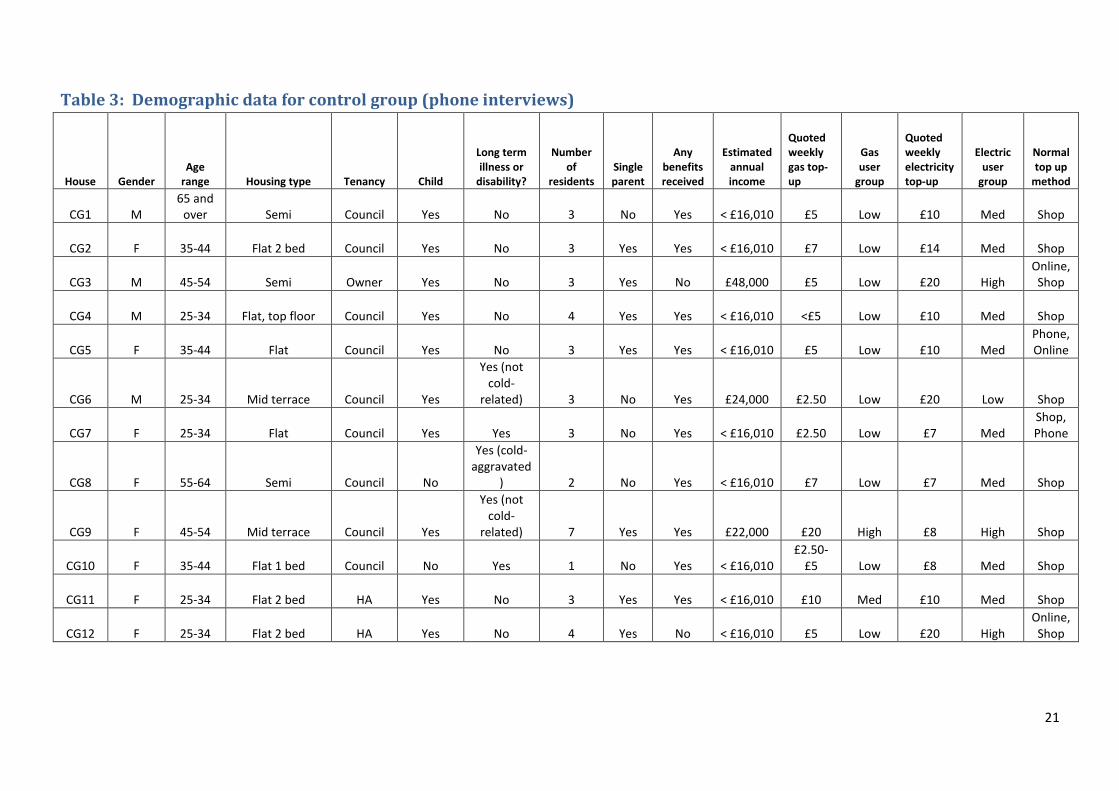
Table 3: Demographic data for control group (phone interviews) .................................................. 21
Appendix 2: Main screens of Utilita smart meter display..................................................................... 23
Appendix 3: Play sheet for using Utilita smart meter display ............................................................... 26
Appendix 4: Additional participant comments ..................................................................................... 30
Appendix 5: Cases studies of home visits ............................................................................................. 34
4
Description of activities This research aimed to address the following research questions:
For households that have a smart PPM what motivated them to get one?
What were their experiences of the switching and installation process?
How did they engage with their smart meter display?
Is anything needed to assist them to use their smart meter display to manage their energy use appropriately?
In this way, the research sought to achieve the following main outcomes:
A better understanding of the experiences of conventional PPM customers in switching to smart PPM.
To suggest improvements in the delivery of smart meter related services to fuel poor households.
Have more understanding of the perceived benefits that smart PPMs can provide people in fuel poverty.
Have a stronger evidence base for future research into smart PPMs.
This was achieved using semi-structured interviews to find out about the experiences of
householders in using their smart meter displays. These took place during home visits and by
telephone interviews during Autumn 2015. Home visits were made to 15 households, all of whom
received a short follow-up telephone interview approximately four to six weeks following their home
visit. The home visits consisted of an interview which lasted around 30 minutes, followed by an
interactive information session in which the energy advisers, from the Centre for Sustainable Energy
(CSE), guided the participants through all of the screens within the display (listed in Table 1, and
done using the Play Sheet in Appendix 3), highlighting the potential options and benefits in using
each one. The follow-up interviews were used to assess whether the participants smart meter
display use had changed since the home visit, in addition to gathering feedback on their views of the
advice given. A separate control group of 15 households participated in a short telephone interview
about their experiences in using their smart meter display; this group did not receive the CSE home
visit.
Participants were mainly recruited through telephone invitations using contact details provided by
the energy supplier Utilita which specialises in smart PPMs. Some participants were sourced through
CSE advice line calls and workshops. Most participants were PPM customers before they switched
to Utilita. A summary of the demographic data for all participants is provided in Appendix 1. During
recruitment an attempt was made to include an even distribution of participants across all age
ranges, where possible. Households were provided with full information on the purpose of the
study, either on paper or over the phone and given the opportunity to ask questions. Signed or
verbal consent was provided by each participant. Households were offered either a £15 (telephone
interview) or £25 (home visit) voucher, or a top up on their electricity or gas meter of equal value.
5
Interviews were conducted by trained and experienced energy advisers: CSE staff and volunteers.
Two volunteers predominantly led the home visits after a training session on smart PPMs. All
interviews were audio recorded and transcribed, and then qualitatively analysed using thematic
analysis in NVivo 10 software. The findings are presented in this report, followed by ‘Suggestions for
further assistance to householders in using their smart meter display to manage their energy use’
and ‘Policy implications and recommendations’. Additional participant comments under the sub
headings below are included in Appendix 4, to ensure brevity of the main report. Case studies for the
15 households that had home visits are given in Appendix 5.
Findings Firstly ‘What motivated households to switch to smart prepay?’ is presented, secondly ‘What
information or support was provided by their supplier in understanding how to use their smart
meter’, thirdly, ‘How did participants use the smart meter display’, followed by ‘Were households
better able to reduce their energy expenditure?’ and ‘Did households have improved control of their
energy use?, followed by ‘Health-related points’.
1. What motivated households to switch to smart prepay?
The vast majority of Utilita customers switch from prepayment meters to smart prepay. Smart
prepay offers the following additional facilities to prepay and credit meters:
a) A smart meter display which the householder can place in a visible location in the home, which
provides real time energy use information. This includes information on previous usage and the
ability to set daily energy use targets for fuel budgeting. This is available for all smart meters.
b) For smart prepay (compared to a smart credit meter) the display also:
Shows the credit remaining and an indication of how many days this will last
Has the capacity to set credit alerts which helps households to avoid self-disconnection
Indicates whether the meter is operating in prepay, Emergency Credit or Friendly Credit mode
Provides a means to enter Emergency Credit
Shows any debt on the meter
c) Smart prepay offers flexible topping up options. Prepay can only be topped up at the shops, whilst
smart prepay can be topped up online and by app, by phone, by text, and at the shops.
d) With smart prepay top ups are automatically credited to the account, without having to fit a key
or card into the meter. If a shop top up has not automatically been credited to the account it can be
done manually on the display using the voucher code.
This research found that the switch to Utilita was instigated by either sales people visiting the home
through door-to-door knocking, over telephone sales, or through customers contacting Utilita
following a recommendation from their friends. A couple of participants were told everybody will
6
switch to a smart meter soon as part of a Government scheme, which appeared to be overstating
the reality.
When exploring the motivation for getting a smart PPM the participants seemed particularly
attracted by the flexible top-up options, the option of entering Emergency Credit or Friendly Credit,
the fact that it is an accessible meter, a cheaper tariff (without a standing charge) or just a refreshing
change from the previous meter.
When asked about the key benefits of having the smart meter and display the main factors that
emerged were (N=30):
Increased awareness of energy use enabling more careful budgeting 15
Accessible display location 13
Flexible top-up options 7
Finding that energy costs are cheaper 5
Ability to see the live energy use of appliances 4
Automatic credit top-up (no need to put a key/card in the meter) 4
Checking the history of fuel use 3
Other benefits mentioned were the ability to top-up small amounts, checking top-ups have gone
through without going into the cupboard and the participants’ daughter thinking the smart PPM is
“cool”! There was a general feeling that the smart meters are more up-to-date with other
technology such as smart phones.
Some of these benefits may be useful in future marketing strategies.
As a result of having a Utilita smart PPM, ten participants recommended the meters to friends or
relatives, of who four stated their friends and relatives now had a Utilita smart PPM installed. A
further two said their friends were unsure about having a smart meter and did not wish to change
from the standard prepayment meter they already had.
2. What information or support was provided to participants by the supplier in
understanding how to use their smart meter?
The information provided by sales-people appeared to promote the benefits of having a smart
meter, as would be expected from a sales visit. The installers appeared to provide a general
overview of the display and smart meter to each participant and offer general advice in relation to
checking credit and topping up. Two participants said the installer showed them how to check the
history of energy usage, and one participant was shown how to set targets and credit alerts but most
said it was just the main functions that were demonstrated. Every participant had been provided
with a booklet on using the smart meter display but only two made reference to reading it.
The information provided during the CSE visit appeared to provide further insight and participants
did begin to use their display to better manage their energy use following this:
7
“Yeah, like I say I have been playing about a little bit more [since CSE visit] because I’ve been using the screen that looks like a clock [live energy usage]….It’s just I’m fascinated by little things like that so I’m intrigued to play about with it…. I think it needs someone to point it out to them what a useful gadget it is and then it would encourage them to actually make use of it.” [HV 10]
The majority of participants who received the CSE home visit found it helpful in improving their
understanding of the smart PPM, however, one participant felt the opposite:
I: “What did you think about the [CSE] advice that was offered in person?”
P: “It was all right but I don't really, I reckon it was too much hassle” [HV 15]
This particular participant did not feel the visit taught her anything new and did struggle to make
time for the home visit. Time was found to be an issue for a few householders who were too busy
for a home visit but opted for a telephone interview instead. However, most participants who
received a home visit made reference to the benefit of demonstrations as opposed to reading a
booklet; following the CSE visit a ‘play sheet’ was also left with participants; only two participants
within the home visit group had since read this. As demonstrations were found to be useful one idea
stemming from this research is for videos to be used to further demonstrate how the in-home
displays can enable energy efficiency behaviours in the home. Alternative strategies could also be
adopted such as using phone advice, email, text, letters or messages via the display.
This study found that the option to communicate with householders about energy management and
reduction via the smart meter display messages had potential, as 18 participants said that they
checked messages. Therefore, this could be an effective method of communicating innovative
energy/money saving ideas to householders, and to maintain their engagement with the smart
meter display.
3. How did participants use the smart meter display?
The participants were asked which screens they use on the display to initiate a conversation about
the way in which they use the information the in-home display can provide. The main screens are
listed in Table 1 with the number of participants who said they use each one.
The Home Visit pre-CSE visit group appear to be broadly comparable with the control group in
numbers, except for setting credit alerts and checking messages. The control group may have
checked messages more than the Home Visit pre-visit group following a £12 Government rebate
which was made to smart PPM customers by 12th November2.
The majority of Home Visit pre-visit and control group participants used the smart meter display for
checking their credit balance, whether top ups had been credited to the meter after they’d made
one, and doing a manual top up if a credit hadn’t gone through. Less than half had explored other
screens on the display, e.g. the History screens on previous usage. They tended to engage with the
display at least a few times a week, or if the lights changed on the display (indicating low credit or
high usage).
2 Government Electricity Rebate (£12): http://utilita.co.uk/government-electricity-rebate
8
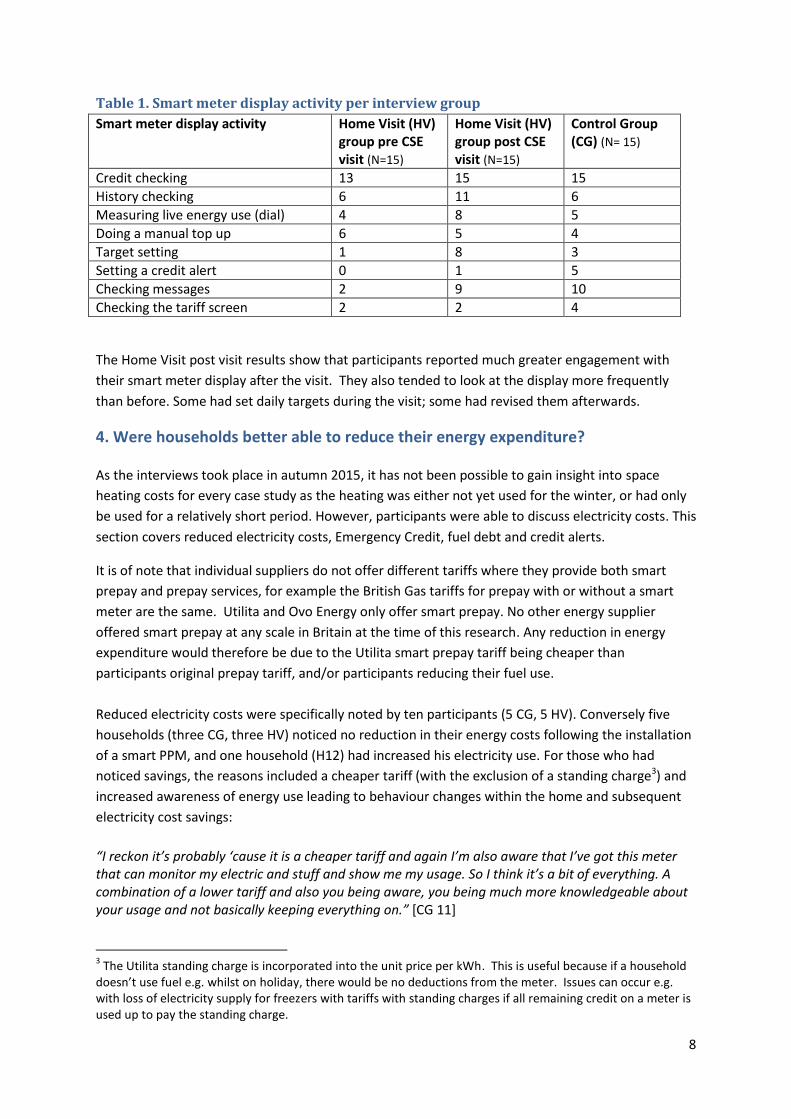
Table 1. Smart meter display activity per interview group
Smart meter display activity Home Visit (HV) group pre CSE visit (N=15)
Home Visit (HV) group post CSE visit (N=15)
Control Group (CG) (N= 15)
Credit checking 13 15 15
History checking 6 11 6
Measuring live energy use (dial) 4 8 5
Doing a manual top up 6 5 4
Target setting 1 8 3
Setting a credit alert 0 1 5
Checking messages 2 9 10
Checking the tariff screen 2 2 4
The Home Visit post visit results show that participants reported much greater engagement with
their smart meter display after the visit. They also tended to look at the display more frequently
than before. Some had set daily targets during the visit; some had revised them afterwards.
4. Were households better able to reduce their energy expenditure?
As the interviews took place in autumn 2015, it has not been possible to gain insight into space
heating costs for every case study as the heating was either not yet used for the winter, or had only
be used for a relatively short period. However, participants were able to discuss electricity costs. This
section covers reduced electricity costs, Emergency Credit, fuel debt and credit alerts.
It is of note that individual suppliers do not offer different tariffs where they provide both smart
prepay and prepay services, for example the British Gas tariffs for prepay with or without a smart
meter are the same. Utilita and Ovo Energy only offer smart prepay. No other energy supplier
offered smart prepay at any scale in Britain at the time of this research. Any reduction in energy
expenditure would therefore be due to the Utilita smart prepay tariff being cheaper than
participants original prepay tariff, and/or participants reducing their fuel use.
Reduced electricity costs were specifically noted by ten participants (5 CG, 5 HV). Conversely five
households (three CG, three HV) noticed no reduction in their energy costs following the installation
of a smart PPM, and one household (H12) had increased his electricity use. For those who had
noticed savings, the reasons included a cheaper tariff (with the exclusion of a standing charge3) and
increased awareness of energy use leading to behaviour changes within the home and subsequent
electricity cost savings:
“I reckon it’s probably ‘cause it is a cheaper tariff and again I’m also aware that I’ve got this meter that can monitor my electric and stuff and show me my usage. So I think it’s a bit of everything. A combination of a lower tariff and also you being aware, you being much more knowledgeable about your usage and not basically keeping everything on.” [CG 11]
3 The Utilita standing charge is incorporated into the unit price per kWh. This is useful because if a household
doesn’t use fuel e.g. whilst on holiday, there would be no deductions from the meter. Issues can occur e.g. with loss of electricity supply for freezers with tariffs with standing charges if all remaining credit on a meter is used up to pay the standing charge.
9
“In the winter I would usually just whack the heating on and then go upstairs or you know do whatever and sometimes I’d forget it was on and it would end up being on sort three or four hours, whereas I realise now that it doesn’t have to be on that long for the house to be warm. I sort of tend to notice it a bit more because you know exactly how much it’s costing.” [CG12]
One householder (H12) had bought a dishwasher after the display was installed as he knew he could
afford to use it and his energy use had increased as a result. He had bought a plug energy monitor to
measure individual appliance use after being loaned one during the visit. His energy literacy had
improved, and he was able to make lifestyle choices based on that. In contrast, some households
that reduced their fuel use had done so by worryingly cutting back on heating and hot drinks. This
suggests that guidance on use of the display should focus on promoting positive energy choices
directed towards enhancing health and wellbeing, to avoid rebound and increasing the negative
impacts of fuel poverty.
Some participants were unsure of the exact reasons they were paying less for electricity but noted
that the amount they were regularly topping up was now lasting longer:
“It’s been pretty good. I used to put on £50 a week, not on the smart meter, on the other…. But now £20 is lasting me over a week and a half” [HV 4]
As a result of reduced energy costs, some participants were able to reduce the frequency with which
they entered Emergency Credit or were disconnected from their energy supply. Overall, ten
participants had entered Emergency Credit mode, seven of whom stated they entered it less than
with their previous meter:
“I go in less since I’ve had the new one. I really do now whereas before I was always, always in Emergency Credit…I don’t know. I think maybe it is less I’m using, it’s not running as quick” [CG 11]
The option to enter Emergency Credit appeared to provide some relief to participants, particularly
those with children or with mobility issues which presented challenges in allowing them to top up
easily. In addition, six participants found the credit alerts to be especially helpful in preventing them
from running out of credit as they became aware that the credit was running low and were able to
top-up before entering Emergency Credit mode:
“Less [using Emergency Credit], because before I’d wait for it to go [laughs] before I put some money on it. That’s right in front of you so it’s a lot easier. And you’ve got the alarm as well…” [CG 13] Only two participants had been disconnected from their supply, in both cases this was for their gas
supply, and for one case this was also for their electricity supply. Only one of the cases were found
to have fuel debt at the time of interview which was for less than £30 for a cancellation fee.
5. Did households have improved control of their energy use?
Control of energy use is considered here in relation to the benefits the smart PPM provides;
accessible smart meter displays and the subsequent benefits of this in terms of monitoring energy
use and taking note of the historical patterns of energy use in the home, in addition to the flexible
options for topping up credit on the smart meters.
10
Use of in-home display Every participant had received an in-home display as part of the smart PPM meter package. They
were generally kept in prominent positions in their kitchen, hallway or living room and left on all of
time, except for a couple of cases who chose to turn them off to save energy.
“Probably every day I’ll have a quick nose, it only takes a second…. It's just habit; I've purposely got it where I can see it! When I walk through my door, it's there in my face. I wanted it in my face, so I know. Just look right by the stairs…. That’s one good thing about it, I don’t have to mess about going in my dark cupboard pulling everything out, I just have a quick look.” [HV 7]
As a result of this, every participant regularly checked their remaining credit varying from two-three
times a day (one participant) to once a week (three participants), with the majority checking the
display daily. The accessibility of the smart meter display was highlighted as a key benefit to having a
smart PPM by thirteen participants. The accessible nature of the smart meter display is likely to
increase awareness of energy use, whether or not participants use the display to further analyse
their own energy use patterns. As an additional benefit, a few participants highlighted the clock on
the display which they used and would check credit levels at the same time.
Whilst nine (seven HV, two CG) participants stated they use the display more now than when they
first received it, two said they use it less due to either the novelty wearing off, or feeling they have
now learnt what they can from the display information:
“Less. I use it less now. I did, it was a novelty, but it’s getting less now because I’m getting to use and turning this off and turning that off.” [HV 4] Measuring the energy use of appliances Of the participants who had used the display to explore their energy use beyond the basic credit
checking, thirteen had used it to measure the energy use of individual appliances. As a result of this,
some had adjusted their behaviour in the home in order to reduce their energy expenditure. Overall,
seven participants had become more aware of ‘high energy consuming devices’.
Some participants used the washing machine more economically (either using it less than they
had previously, or turning the temperature of the water within the wash cycle down to 30C)
Six participants turned things off standby more often
Five used the kettle more economically (either boiling less water, reducing the number of hot
drinks they consume, or using a gas kettle).
Four participants said they cooked more economically (either cooking less and freezing food, or
cooking with the microwave)
Two said they were more cautious with the heating system (either timing the heating or heating
less rooms)
Two adjusted their bathing habits (taking shorter showers or taking a bath instead of a shower).
Two participants felt the smart meter display enabled them to keep more informed about their
children’s energy use. They observed the amount of energy an Xbox gaming device used and
11
consequently they had a discussion with the child about this and the amount of time they could
spend on the Xbox was more restricted:
“..the thing I’ve found that uses a lot more electricity is the Xbox...cause they got quite a big processor, they draw quite a lot of electricity...but I do let him use it occasionally” [HV 7]
It should be noted that seven of these participants had received the CSE home visit and may have
also focussed on certain activities due to the advice they received during this visit, but it appeared
this was useful in combination with the visual impact of the energy figures on the display.
Knowing historical energy use for budgeting In addition to measuring live energy use, 17 participants also highlighted use of the history screen in
comparing their energy use from one week to the next and for three this was a key benefit of having
a smart meter display:
“Yeah, that’s [history screen] the function I use the most I reckon. I like to break it down over a week and see what my cost is and if I’m within my target…. I like to try and keep tabs of what I’m using and to budget really.” [HV 10]
This may be a feature which will assist householders to take more control of their energy use and
make long-term savings by continuing to develop energy-efficient behaviours around the home.
Topping up Finally, some participants appeared to feel less anxious about running out of credit as a result of
having the option to top up online, or whilst away from home, which seemed to create a feeling of
increased control of their energy use. Whilst 17 participants still topped up at the shop (for seven of
whom this was part of their routine), six now preferred to top up online and three over the phone.
Topping up from home was noted as a particular benefit by those who had limited mobility, or
children to care for:
“I think it was mainly the top up online [motivation to switch to Utilita] because I’ve got a daughter and the amount of times she’s in bed and it’s 9 o’clock at night and I’ve gone, “Oh no I need to get electric but the shops shut and my daughters in bed.” [CG 14]
In relation to topping up the meters and control of energy use, one key challenge mentioned by six
participants was difficulty topping up their gas credit. This appeared to relate to a delay between
making the payment and receiving the credit, which didn’t arise with electricity top ups. In dealing
with this participants would sometimes manually enter the code into the display but it appeared to
cause disruption and concern to those who highlighted it and could be an area to provide more
information on.
6. Health-related points
The key health benefit resulting from having a smart PPM appears to be a reduction in stress or
“peace of mind” mentioned by a few participants. This was in relation to the option of entering
Friendly Credit without being charged any extra cost for those with children to care for (four) and
through the option to top-up flexible top-up options for those with low mobility (two):

12
“Well, Billy [grandson] goes away every other weekend so I would always have to make sure that it was topped up before he went, whereas now I don’t have to worry if it runs low when he’s away because I know I can just top it up from home.” [HV 8]
The smart PPM was also considered easier by one participant who was sometimes in hospital for
long periods and by some who are happier now they no longer need to venture out during cold or
wet weather (two). For an older participant a particular benefit was the accessible meter as they
previously needed to climb a ladder to access the meter.
13
Suggestions for further assistance to householders in using their
smart meter display to manage their energy use This research found that additional support was needed for most participants on use of their smart
meter display, as they had not fully explored it or grasped how to use it for reducing energy waste.
This lack of understanding or interest could be due to distractions during installation, ill health, lack
of motivation as fuel use was already low or they believe they already knew how to use the display.
1. The householders appeared to value the interactive advice and discussed action they had taken
as a result of the session. During the home visit the base load4 was measured and an ‘energy
experiment’ conducted such as costing the energy used in boiling a kettle. The kettle experiment
was mentioned by most householders during the follow-up interview and appeared to
communicate a strong message in an effective way. It inspired further experiments for some
households, such as HV 1 who took time to measure the energy consumption of his pond and
‘one-cup kettle’ following the home visit. Developing further interactive examples of energy use
in the home would be useful.
2. Interactive advice sessions were predominantly led by two experienced, trained volunteers.
Their feedback highlighted a number of issues:
The smart meter display itself could have additional functionality to improve energy know
how, such as the capability to drill down into a previous week or month’s usage by day,
which it isn’t currently possible to do.
The structured approach to the home visit was useful to tailor advice and use of the smart
meter display to the householder’s needs but required 1.25-1.5 hours – longer than a
standard home visit of one hour. Some participants were particularly vulnerable and
required a number of shorter visits (H13).
3. Reiterating key messages after install would continue to engage households in monitoring
energy use on their in-home display. This is discussed in depth in the next section.
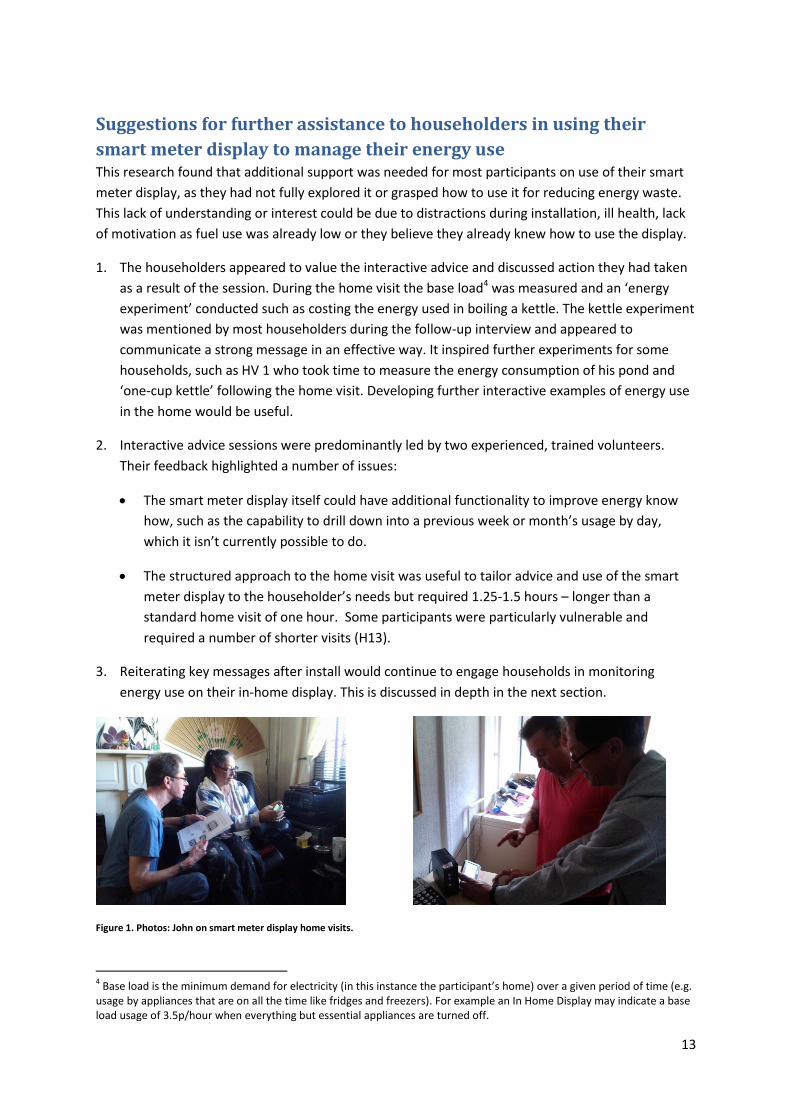
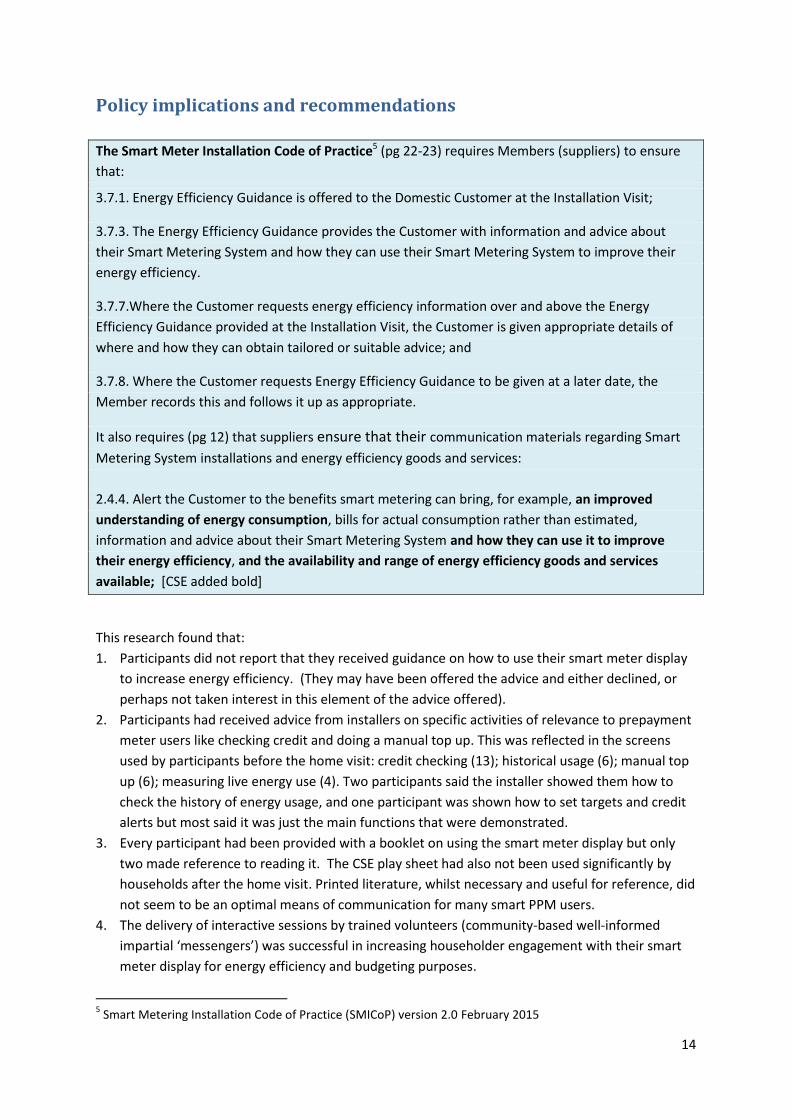
Figure 1. Photos: John on smart meter display home visits.
4 Base load is the minimum demand for electricity (in this instance the participant’s home) over a given period of time (e.g.
usage by appliances that are on all the time like fridges and freezers). For example an In Home Display may indicate a base load usage of 3.5p/hour when everything but essential appliances are turned off.
14
Policy implications and recommendations
The Smart Meter Installation Code of Practice5 (pg 22-23) requires Members (suppliers) to ensure
that:
3.7.1. Energy Efficiency Guidance is offered to the Domestic Customer at the Installation Visit;
3.7.3. The Energy Efficiency Guidance provides the Customer with information and advice about
their Smart Metering System and how they can use their Smart Metering System to improve their
energy efficiency.
3.7.7.Where the Customer requests energy efficiency information over and above the Energy
Efficiency Guidance provided at the Installation Visit, the Customer is given appropriate details of
where and how they can obtain tailored or suitable advice; and
3.7.8. Where the Customer requests Energy Efficiency Guidance to be given at a later date, the
Member records this and follows it up as appropriate.
It also requires (pg 12) that suppliers ensure that their communication materials regarding Smart
Metering System installations and energy efficiency goods and services:
2.4.4. Alert the Customer to the benefits smart metering can bring, for example, an improved
understanding of energy consumption, bills for actual consumption rather than estimated,
information and advice about their Smart Metering System and how they can use it to improve
their energy efficiency, and the availability and range of energy efficiency goods and services
available; [CSE added bold]
This research found that:
1. Participants did not report that they received guidance on how to use their smart meter display
to increase energy efficiency. (They may have been offered the advice and either declined, or
perhaps not taken interest in this element of the advice offered).
2. Participants had received advice from installers on specific activities of relevance to prepayment
meter users like checking credit and doing a manual top up. This was reflected in the screens
used by participants before the home visit: credit checking (13); historical usage (6); manual top
up (6); measuring live energy use (4). Two participants said the installer showed them how to
check the history of energy usage, and one participant was shown how to set targets and credit
alerts but most said it was just the main functions that were demonstrated.
3. Every participant had been provided with a booklet on using the smart meter display but only
two made reference to reading it. The CSE play sheet had also not been used significantly by
households after the home visit. Printed literature, whilst necessary and useful for reference, did
not seem to be an optimal means of communication for many smart PPM users.
4. The delivery of interactive sessions by trained volunteers (community-based well-informed
impartial ‘messengers’) was successful in increasing householder engagement with their smart
meter display for energy efficiency and budgeting purposes.
5 Smart Metering Installation Code of Practice (SMICoP) version 2.0 February 2015
15
Current smart meter policy emphasises the point of install as the crux point when energy efficiency
advice is to be delivered. However installers, even if well trained in delivering energy efficiency
guidance, are time-pressured in terms of completing meter installations and their skills may be more
technical rather than people orientated. Also householders may not be open and receptive to
information at the point of install. Clearly there is a need for strong, clear, simple and engaging
advice, iterating and reiterating key energy efficiency messages before, during and after smart
meter installation.
Pre-installation
Priming householders to the benefits of smart metering for energy efficiency before installation is
key to successful further engagement. However there is a disincentive for suppliers to provide
householders with excessive information pre-install as this might put people off changing their
meter. Installation no –shows are costly for suppliers.
The Smart Energy GB national smart meter roll out campaign could emphasise the potential to
reduce energy use through smart metering to pique consumer interest. So far advertising has
focused on informing consumers about what a smart meter is, rather than their energy saving
benefits. Their ‘Smart ways to save energy in your home’ video released January 2016, does highlight
energy efficiency, giving annual savings for behavioural changes related to heating and appliance
use. No Smart Energy GB video provides information on how to use the display to achieve energy
reduction. Their own research6 highlights (pg 12) that only 28% of people interviewed cite energy
waste reduction as an appeal of smart meters. If there is little promotion of this benefit, it is less
likely to happen.
Given that smart meter displays vary by supplier the obvious place for smart meter display ‘know
how’ would be on the videos or interactive tutorials on supplier websites. Current videos and
tutorials have little or no mention of how to use the display for energy efficiency. In fact one
supplier’s video7 ends with the uninspiring line: ‘You might even be able to work out ways to save
energy in your home’. This is unsurprising as energy suppliers have no motivation to help customers
reduce their fuel use. Nowhere is that vital know how on use of the smart meter display given.
Recommendations for pre installation stage
1) Smart Energy GB produce a video that shows broadly the stages of how to use smart meter
displays to reduce and manage energy use, and emphasises energy waste reduction as a key
benefit of smart meters.
2) Energy suppliers or display manufacturers are required (under a revised SMICoP) to produce
videos/other guidance to communicate how to use their specific display to achieve a number of
energy demand reduction and budgeting activities including detailed guidance on the smart
meter display and its screens; establishing a baseload and how to reduce it; costing appliances;
energy reducing choices e.g. use a microwave rather than hob for reheating (whilst emphasising
healthy actions); checking historical usage and setting a daily target for fuel budgeting. For
smart prepay additional activities should include topping up methods; manual topping up;
6 Smart energy outlook, February 2016, Smart Energy GB
7 Using our smart meter display, video, www.eonenergy.com (accessed 25/02/2016)
16
setting a credit alert to avoid disconnection; different credit modes, and how to enter
Emergency and Friendly Credit.
3) Households should receive information with their meter installation date is confirmed that
briefly includes the national roll out context, what to expect during the installation and what
they will be required to do.
During installation
Households need to be engaged and focused to make the best use of the energy efficiency guidance
to be delivered. That advice needs to be delivered in a cost-effective way by suppliers.
Recommendations
Require suppliers to create smart energy efficiency tutorials which householders watch during the
installation. Installers could log householders into a tablet-based or similar system to watch videos
or tutorials which:
prepares householders for using the smart meter display
helps them think about their key home practices where energy demand could be reduced
encourages them to ask the installer questions and play with the display themselves.
This would make the best use of installer time and logging households into a tutorial that can be
completed in small chunks would provide evidence of SMICoP compliance.
Combining this with a simple postcard for householders to complete, circling household
composition, what appliances they use, and high energy-using activities they engage in would enable
the installer to tailor guidance on use of the smart meter display, and address energy-using roles
within multiple occupancy households. The postcard could also flag if further energy efficiency
advice was needed e.g. a fact sheet on using night storage heaters. Printed literature and
information about post-install support should be left with the household.
Post- install
Smart Energy GB has highlighted specific groups8 in need of extra assistance (one of which is PPM
users), and some energy suppliers have or intend to set up post installation energy efficiency
support for vulnerable clients 9.
Ongoing monitoring of energy use and active learning has been shown to be most effective in
reducing energy demand in the long term10. Stimulating engagement with the smart meter display
through playful energy experiments could link the smart meter display to positive replacement
behaviours/practices that reduce energy demand. This research found that use of the messaging
facility on smart meter displays could be an accessible means to encourage ongoing engagement. It
could signpost people to other resources like videos, online home energy reports, games or phone
8 Smart Energy for All. Identifying audience characteristics that may act as additional barriers to realising the
benefits of a smart meter. Smart Energy GB 2015. 9 Smart for All. Understanding consumer vulnerability during the experience of smart meter installation.
National Energy Action and RS Consulting 2012.
10 Smart Metering Early Learning Project: Synthesis report. DECC March 2015.
17
advice, allowing the consumer to choose their preferred communication channels. Community-
based face to face support, as with the trained volunteers in this research, should be one of these
options available for especially vulnerable households e.g. customers on the Priority Service
Register. Above all, ongoing follow up advice is needed to reiterate the energy management and
reduction benefits of smart meters and how to achieve them via the smart meter display.
Recommendations
1) Suppliers are required to design and implement an annual programme of energy efficiency
messages for their displays to encourage consumers to adopt an ongoing energy monitoring
approach to promote energy management and demand reduction. Householder engagement
with messages can be tracked, providing evidence of energy efficiency guidance delivery and
identifying levels of consumer motivation. Messaging could be adapted for different customer
energy usage groups. Energy efficiency messages could also be conveyed in other media e.g.
text, email, social media, audio, to suit all communication needs.
2) Suppliers should offer a phone top up registration service for customers who want to top up by
phone but don’t have internet access.
3) Households to receive self-comparative energy reports to pull together cumulatively the effects
of their energy efficiency actions.
4) Community-based advice is resourced and supported, such as local trained energy champions to
deliver events and home visits.
5) Smart Energy GB could promote the collective national figure for energy waste reduced through
smart metering and communicate it in a highly visual and entertaining form as part of their
ongoing national campaign to 2020.
Energy advice should focus on encourage households to make healthy energy choices to avoid
exacerbating fuel poverty and increased energy use (rebound).
To summarise, this research found that smart PPMs are helping householders to reduce and manage
their fuel use, but that much more could be done to assist this vulnerable consumer group to reduce
energy waste in the home. Additional promotion of energy efficiency as a benefit of smart meters,
and ongoing practical action to help consumers reduce energy waste and manage their fuel bills
could help households experiencing fuel poverty get the most from their smart meter display. Fuller
use of the display can take the stress out of household energy use, decrease self-disconnection and
facilitate informed, healthy energy choices that avoid compounding fuel poverty or increasing
energy use. Otherwise such households may deprioritise involvement with their display and fail to
realise the reduction in energy waste, associated fuel bill savings and potential health benefits that
could result. A programme of ongoing energy efficiency advice would also indicate and provide
evidence that significant steps had been taken to realise the attributed Net Present Value of £5.73bn
of benefits to consumers in the smart meter roll out, which includes £5.69bn in savings from
reduced energy consumption11.
11 Impact Assessment IA DECC0009 Smart meter roll-out for the domestic and small and medium non-
domestic sectors (GB) Final version January 2014
18
Further research This short qualitative research project offers key pointers to help optimise the consumer and energy
reduction benefits for the wide smart meter roll out in Britain in 2016 and beyond. However
additional research on smart prepay would be warranted in the following areas. Research:
1. With a broader range of energy suppliers. (This research was conducted with Utilita customers
only, although anecdotal evidence suggests similar experiences by smart PPM users with other
suppliers).
2. With a broader range of customers, for example we were unable to visit anyone aged over 65.
3. With electricity only households to explore potential energy savings on electric heating.
4. Research that includes a full heating season.
5. Quantitative analysis of any change in fuel consumption by households pre and post smart
meter install, and before/after the home visit. This would determine the relative influences of
the smart meter display and any improved use of it after the home visit on energy use.
6. Investigation of the attitudinal, occupancy and lifestyle barriers to engagement with the smart
meter display in vulnerable households would help identify key aspects or narratives useful to
promote consumer engagement.
7. Additional research that explores messaging and effective communications media on use of the
smart meter display to reduce energy waste, at all stages of installation, especially with
vulnerable and fuel poor households would also be timely.
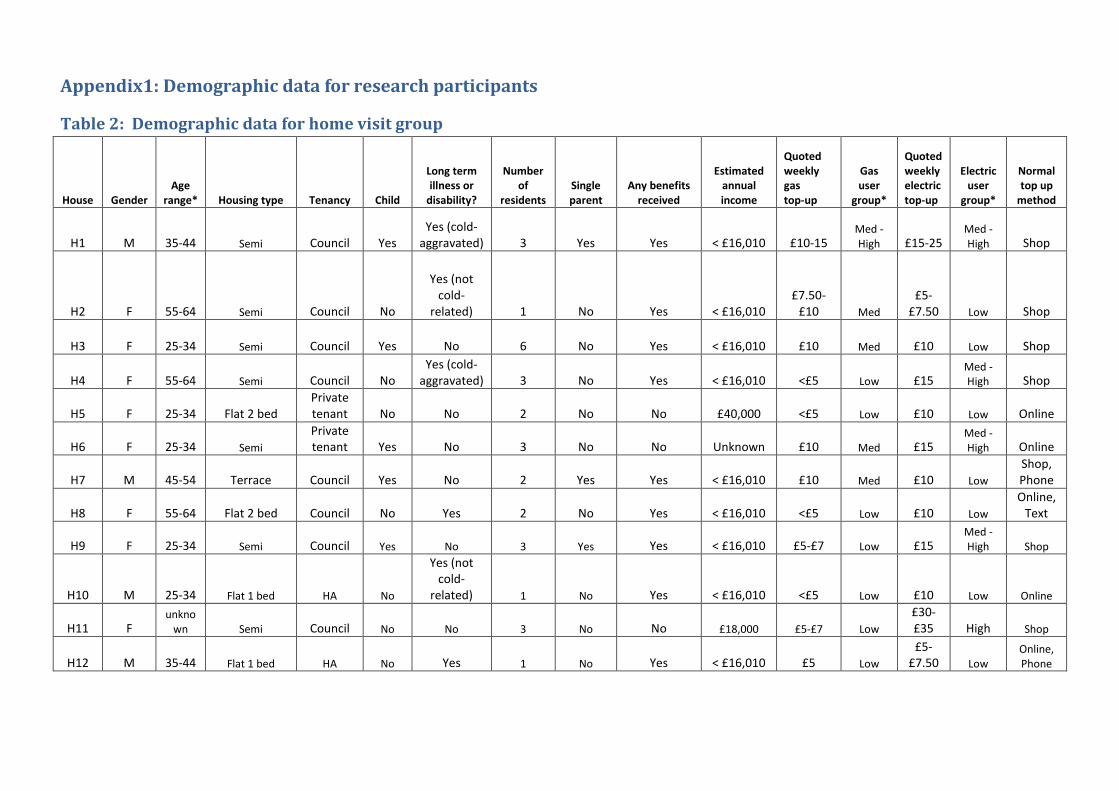
Appendix1: Demographic data for research participants
Table 2: Demographic data for home visit group
House Gender Age
range* Housing type Tenancy Child
Long term illness or
disability?
Number of
residents Single parent
Any benefits received
Estimated annual income
Quoted weekly gas top-up
Gas user
group*
Quoted weekly electric top-up
Electric user
group*
Normal top up
method
H1 M 35-44 Semi Council Yes Yes (cold-
aggravated) 3 Yes Yes < £16,010 £10-15 Med - High £15-25
Med - High Shop
H2 F 55-64 Semi Council No
Yes (not cold-
related) 1 No Yes < £16,010 £7.50-
£10 Med
£5-£7.50 Low Shop
H3 F 25-34 Semi Council Yes No 6 No Yes < £16,010 £10 Med £10 Low Shop
H4 F 55-64 Semi Council No Yes (cold-
aggravated) 3 No Yes < £16,010 <£5 Low £15 Med - High Shop
H5 F 25-34 Flat 2 bed Private tenant No No 2 No No £40,000 <£5 Low £10 Low Online
H6 F 25-34 Semi
Private tenant Yes No 3 No No Unknown £10 Med £15
Med - High Online
H7 M 45-54 Terrace Council Yes No 2 Yes Yes < £16,010 £10 Med £10 Low
Shop, Phone
H8 F 55-64 Flat 2 bed Council No Yes 2 No Yes < £16,010 <£5 Low £10 Low
Online, Text
H9 F 25-34 Semi Council Yes No 3 Yes Yes < £16,010 £5-£7 Low £15 Med - High Shop
H10 M 25-34 Flat 1 bed HA No
Yes (not cold-
related) 1 No Yes < £16,010 <£5 Low £10 Low Online
H11 F unkno
wn Semi Council No No 3 No No £18,000 £5-£7 Low
£30-£35 High Shop
H12 M 35-44 Flat 1 bed HA No Yes 1 No Yes < £16,010 £5 Low
£5-£7.50 Low
Online, Phone
20
House Gender Age
range* Housing type Tenancy Child
Long term illness or
disability?
Number of
residents Single parent
Any benefits received
Estimated annual income
Quoted weekly gas top-up
Gas user
group*
Quoted weekly electric top-up
Electric user
group*
Normal top up
method
H13 F 35-44 Flat 2 bed Council No
Yes (not cold-
related)
1 + daughter
who visits often
(18 FTE) Yes Yes <£16,010 £8 Low £8 Low Shop
H14 M 55-64 Flat 2 bed Council No
Yes (not cold-
related) 1 No Yes < £16,010 <£5 Low £10 Low Shop
H15 F 15-24 Flat 2 bed Council Yes No 3 No Yes <£16,010 £10 Med £15 Med - High
Shop, Phone
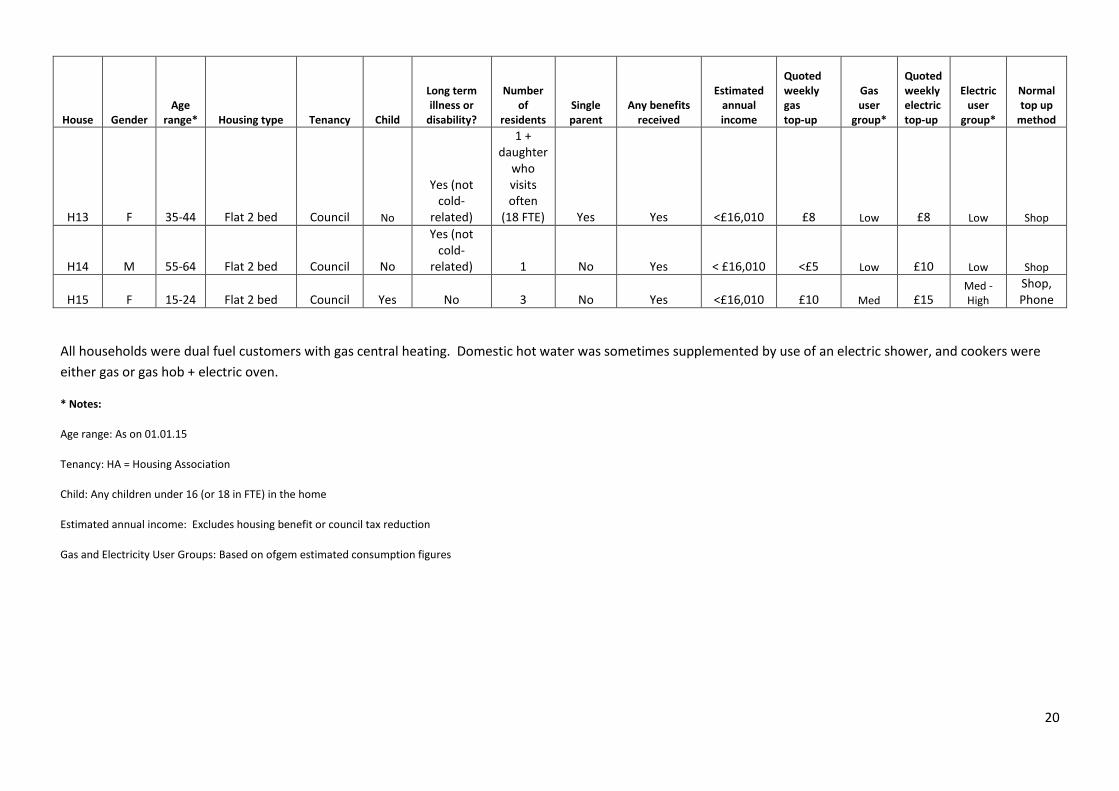
All households were dual fuel customers with gas central heating. Domestic hot water was sometimes supplemented by use of an electric shower, and cookers were
either gas or gas hob + electric oven.
* Notes:
Age range: As on 01.01.15
Tenancy: HA = Housing Association
Child: Any children under 16 (or 18 in FTE) in the home
Estimated annual income: Excludes housing benefit or council tax reduction
Gas and Electricity User Groups: Based on ofgem estimated consumption figures
21
Table 3: Demographic data for control group (phone interviews)
House Gender Age
range Housing type Tenancy Child
Long term illness or
disability?
Number of
residents Single parent
Any benefits received
Estimated annual income
Quoted weekly gas top-up
Gas user
group
Quoted weekly electricity top-up
Electric user
group
Normal top up
method
CG1 M 65 and
over Semi Council Yes No 3 No Yes < £16,010 £5 Low £10 Med Shop
CG2 F 35-44 Flat 2 bed Council Yes No 3 Yes Yes < £16,010 £7 Low £14 Med Shop
CG3 M 45-54 Semi Owner Yes No 3 Yes No £48,000 £5 Low £20 High Online, Shop
CG4 M 25-34 Flat, top floor Council Yes No 4 Yes Yes < £16,010 <£5 Low £10 Med Shop
CG5 F 35-44 Flat Council Yes No 3 Yes Yes < £16,010 £5 Low £10 Med Phone, Online
CG6 M 25-34 Mid terrace Council Yes
Yes (not cold-
related) 3 No Yes £24,000 £2.50 Low £20 Low Shop
CG7 F 25-34 Flat Council Yes Yes 3 No Yes < £16,010 £2.50 Low £7 Med Shop, Phone
CG8 F 55-64 Semi Council No
Yes (cold-aggravated
) 2 No Yes < £16,010 £7 Low £7 Med Shop
CG9 F 45-54 Mid terrace Council Yes
Yes (not cold-
related) 7 Yes Yes £22,000 £20 High £8 High Shop
CG10 F 35-44 Flat 1 bed Council No Yes 1 No Yes < £16,010 £2.50-
£5 Low £8 Med Shop
CG11 F 25-34 Flat 2 bed HA Yes No 3 Yes Yes < £16,010 £10 Med £10 Med Shop
CG12 F 25-34 Flat 2 bed HA Yes No 4 Yes No < £16,010 £5 Low £20 High Online, Shop
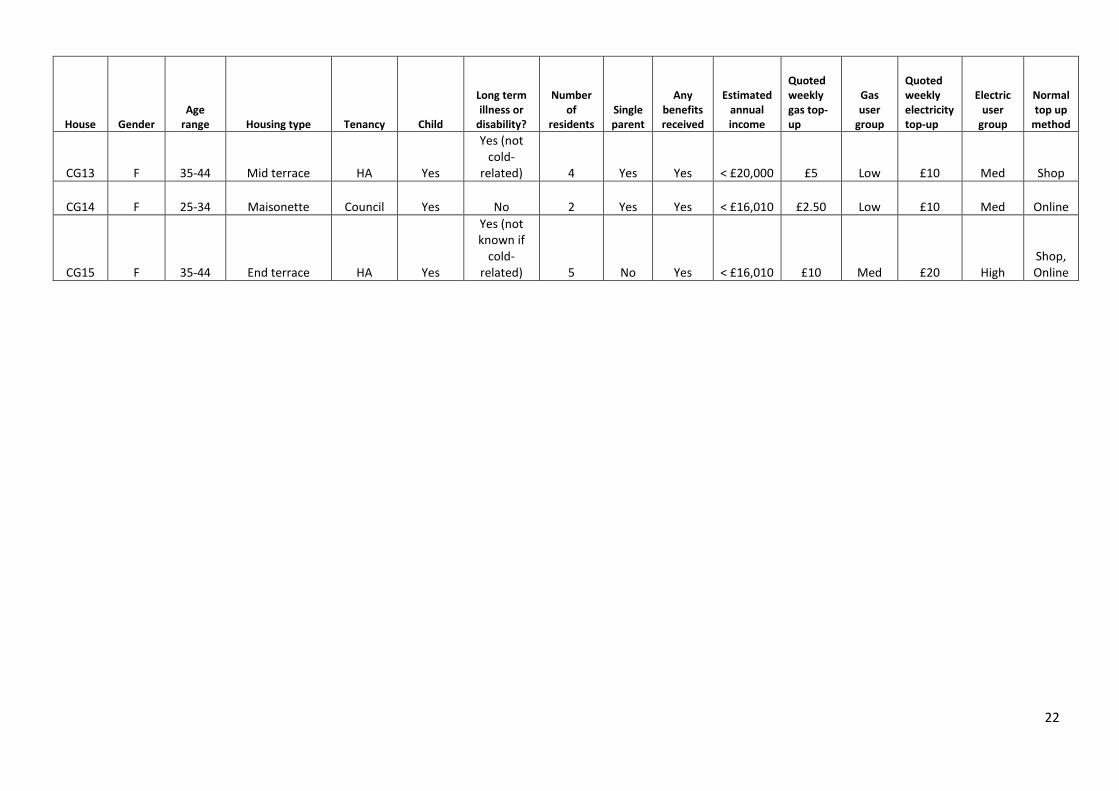
22
House Gender Age
range Housing type Tenancy Child
Long term illness or
disability?
Number of
residents Single parent
Any benefits received
Estimated annual income
Quoted weekly gas top-up
Gas user
group
Quoted weekly electricity top-up
Electric user
group
Normal top up
method
CG13 F 35-44 Mid terrace HA Yes
Yes (not cold-
related) 4 Yes Yes < £20,000 £5 Low £10 Med Shop
CG14 F 25-34 Maisonette Council Yes No 2 Yes Yes < £16,010 £2.50 Low £10 Med Online
CG15 F 35-44 End terrace HA Yes
Yes (not known if
cold-related) 5 No Yes < £16,010 £10 Med £20 High
Shop, Online
23
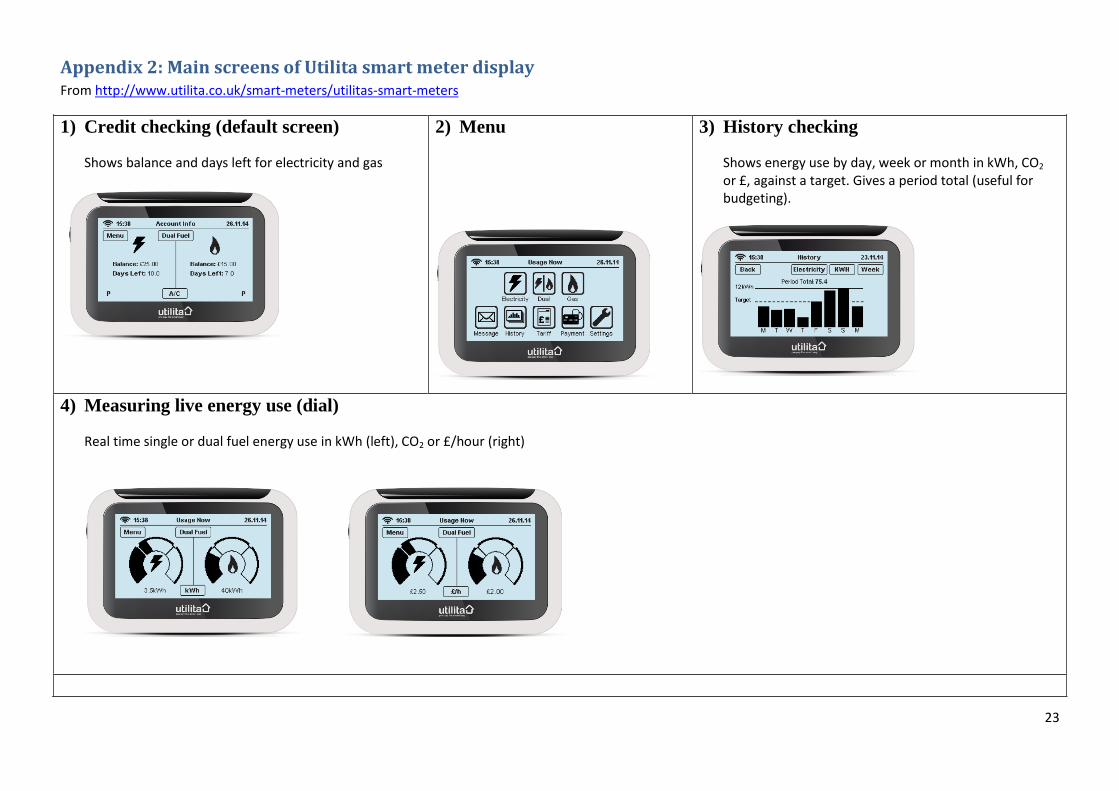
Appendix 2: Main screens of Utilita smart meter display From http://www.utilita.co.uk/smart-meters/utilitas-smart-meters
1) Credit checking (default screen)
Shows balance and days left for electricity and gas
2) Menu
3) History checking
Shows energy use by day, week or month in kWh, CO2 or £, against a target. Gives a period total (useful for budgeting).
4) Measuring live energy use (dial)
Real time single or dual fuel energy use in kWh (left), CO2 or £/hour (right)
24
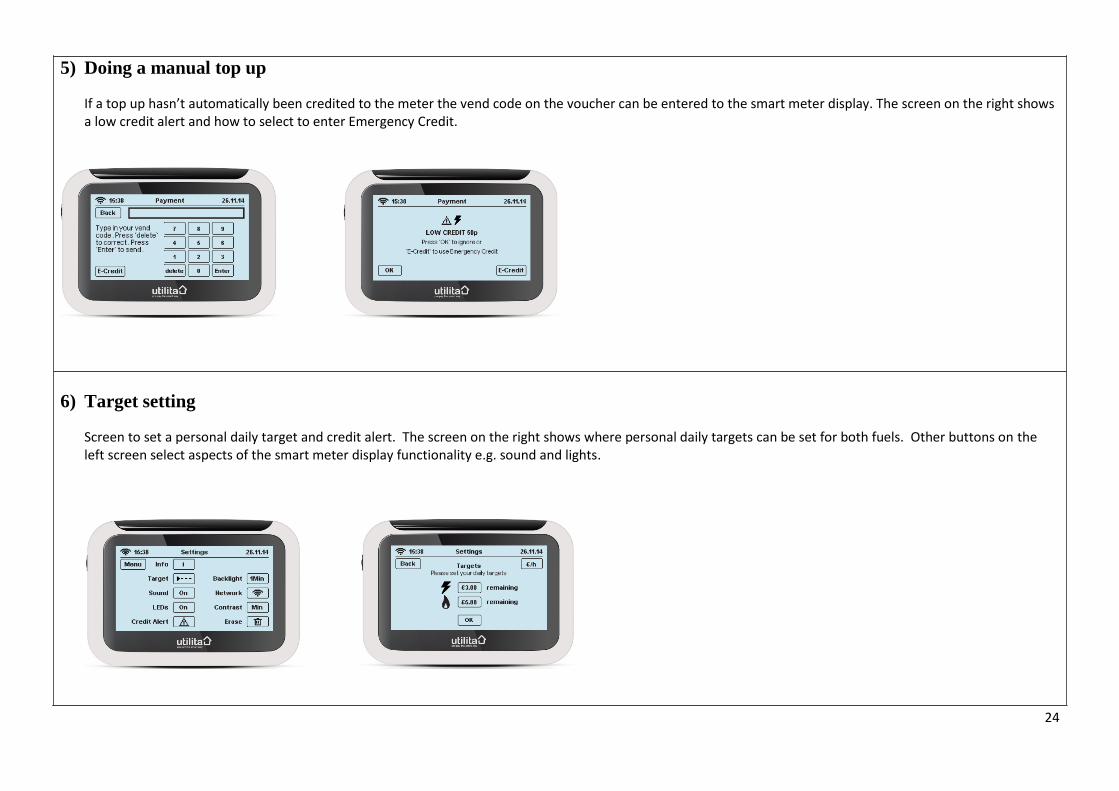
5) Doing a manual top up
If a top up hasn’t automatically been credited to the meter the vend code on the voucher can be entered to the smart meter display. The screen on the right shows a low credit alert and how to select to enter Emergency Credit.
6) Target setting
Screen to set a personal daily target and credit alert. The screen on the right shows where personal daily targets can be set for both fuels. Other buttons on the left screen select aspects of the smart meter display functionality e.g. sound and lights.
25
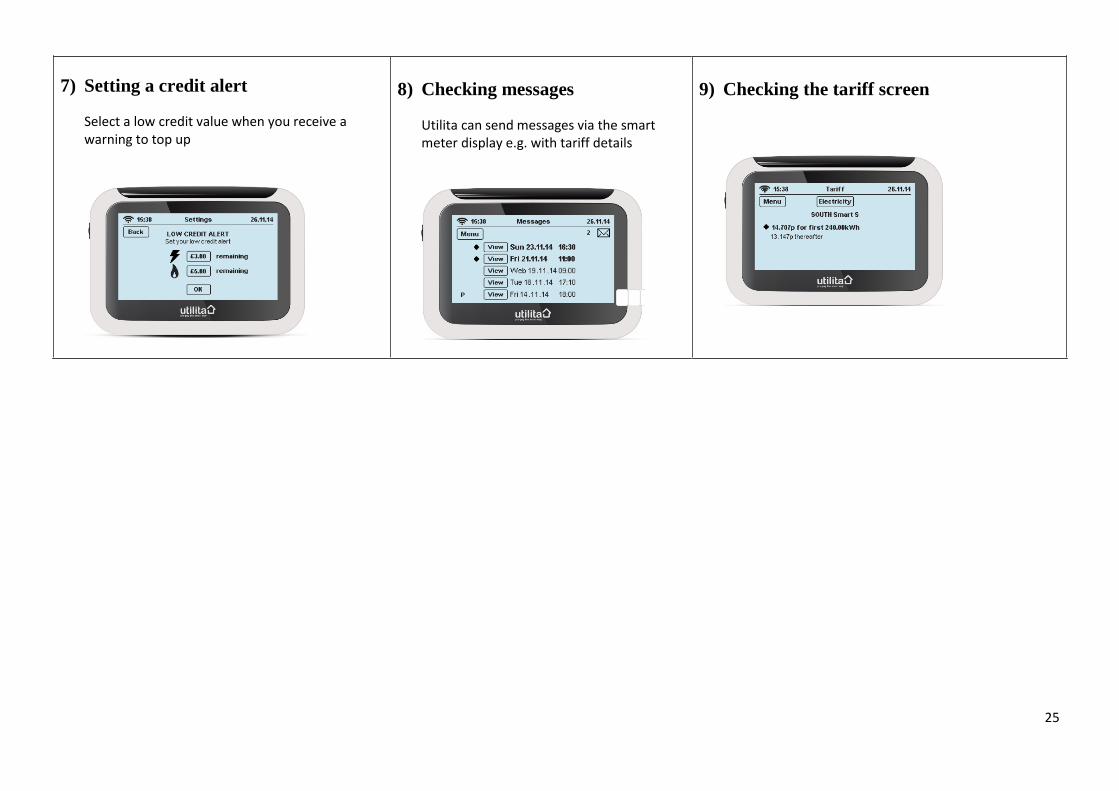
7) Setting a credit alert
Select a low credit value when you receive a warning to top up
8) Checking messages
Utilita can send messages via the smart meter display e.g. with tariff details
9) Checking the tariff screen
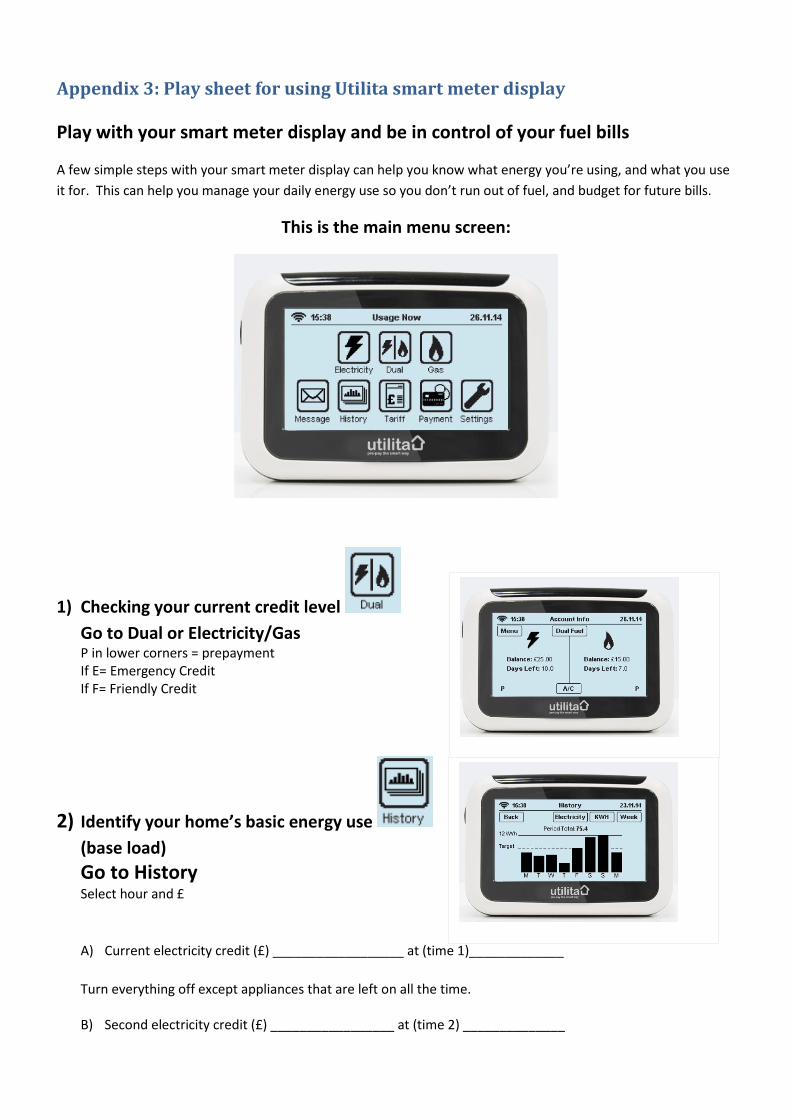
Appendix 3: Play sheet for using Utilita smart meter display
Play with your smart meter display and be in control of your fuel bills
A few simple steps with your smart meter display can help you know what energy you’re using, and what you use
it for. This can help you manage your daily energy use so you don’t run out of fuel, and budget for future bills.
This is the main menu screen:
1) Checking your current credit level
Go to Dual or Electricity/Gas P in lower corners = prepayment If E= Emergency Credit If F= Friendly Credit
2) Identify your home’s basic energy use (base load)
Go to History Select hour and £
A) Current electricity credit (£) __________________ at (time 1)_____________
Turn everything off except appliances that are left on all the time. B) Second electricity credit (£) _________________ at (time 2) ______________
27
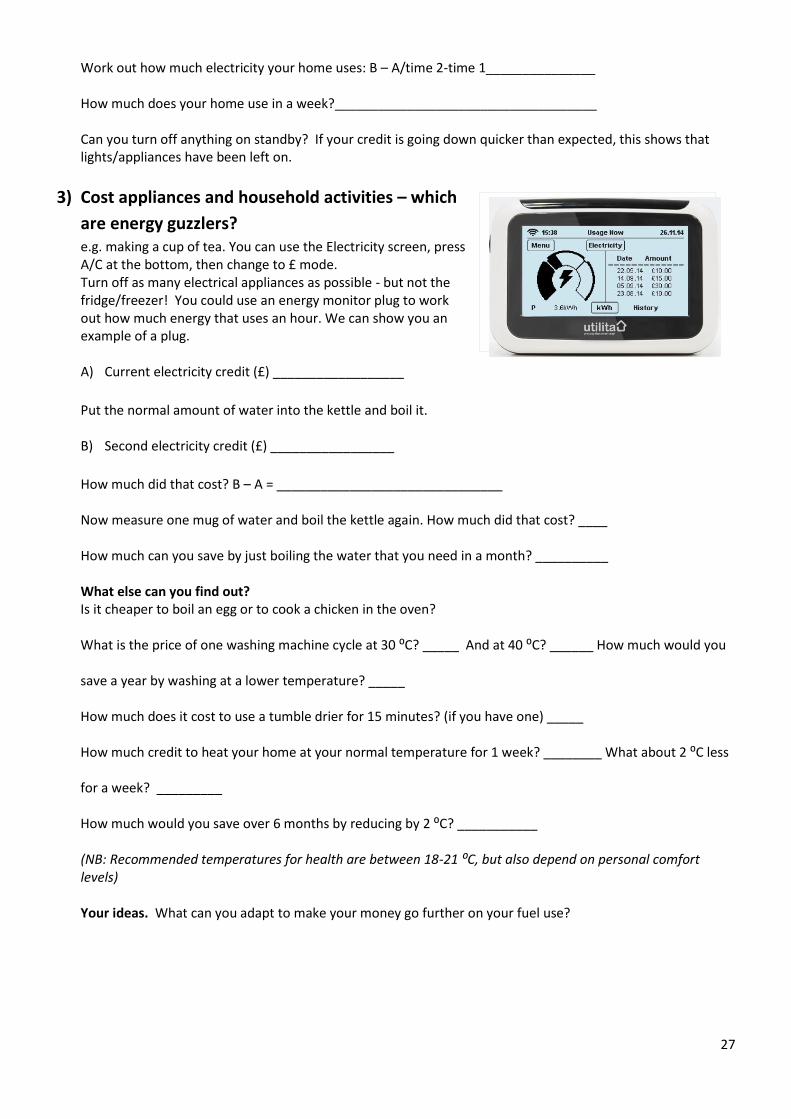
Work out how much electricity your home uses: B – A/time 2-time 1_______________ How much does your home use in a week?____________________________________ Can you turn off anything on standby? If your credit is going down quicker than expected, this shows that lights/appliances have been left on.
3) Cost appliances and household activities – which
are energy guzzlers? e.g. making a cup of tea. You can use the Electricity screen, press A/C at the bottom, then change to £ mode. Turn off as many electrical appliances as possible - but not the fridge/freezer! You could use an energy monitor plug to work out how much energy that uses an hour. We can show you an example of a plug. A) Current electricity credit (£) __________________
Put the normal amount of water into the kettle and boil it. B) Second electricity credit (£) _________________
How much did that cost? B – A = _______________________________ Now measure one mug of water and boil the kettle again. How much did that cost? ____ How much can you save by just boiling the water that you need in a month? __________ What else can you find out? Is it cheaper to boil an egg or to cook a chicken in the oven?
What is the price of one washing machine cycle at 30 ⁰C? _____ And at 40 ⁰C? ______ How much would you
save a year by washing at a lower temperature? _____
How much does it cost to use a tumble drier for 15 minutes? (if you have one) _____
How much credit to heat your home at your normal temperature for 1 week? ________ What about 2 ⁰C less
for a week? _________
How much would you save over 6 months by reducing by 2 ⁰C? ___________
(NB: Recommended temperatures for health are between 18-21 ⁰C, but also depend on personal comfort levels) Your ideas. What can you adapt to make your money go further on your fuel use?
28
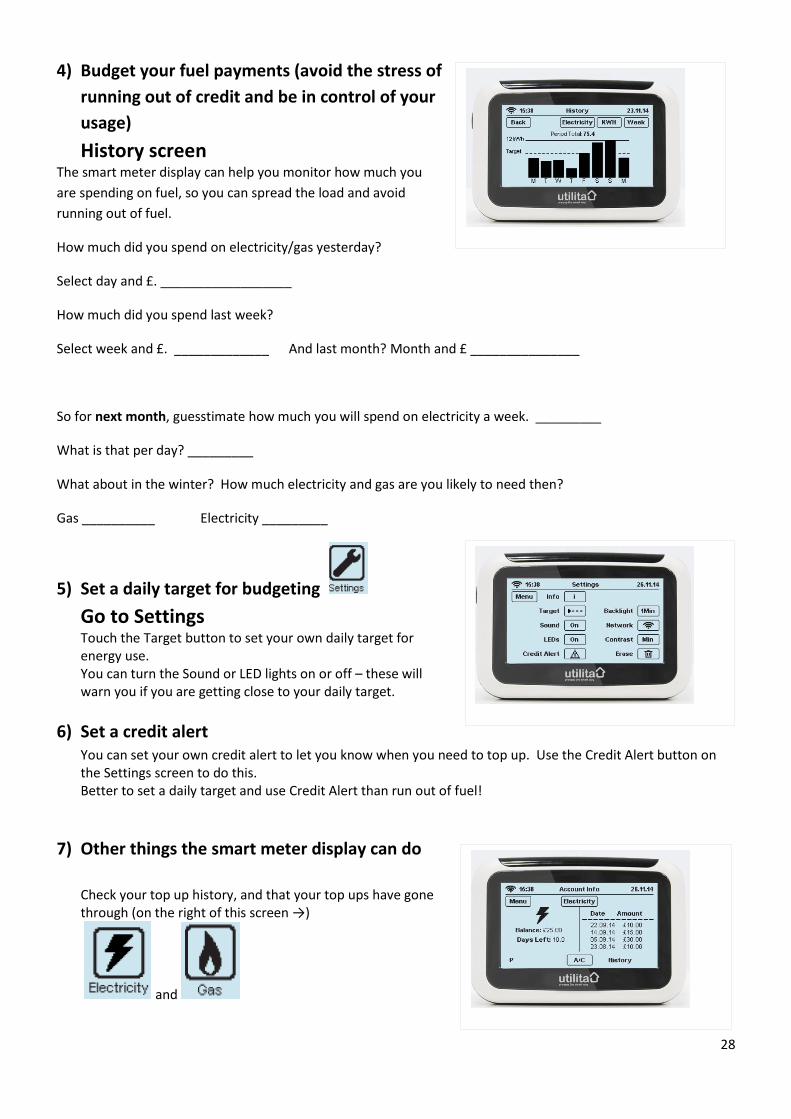
4) Budget your fuel payments (avoid the stress of
running out of credit and be in control of your
usage)
History screen The smart meter display can help you monitor how much you
are spending on fuel, so you can spread the load and avoid
running out of fuel.
How much did you spend on electricity/gas yesterday?
Select day and £. __________________
How much did you spend last week?
Select week and £. _____________ And last month? Month and £ _______________
So for next month, guesstimate how much you will spend on electricity a week. _________
What is that per day? _________
What about in the winter? How much electricity and gas are you likely to need then?
Gas __________ Electricity _________
5) Set a daily target for budgeting
Go to Settings Touch the Target button to set your own daily target for energy use. You can turn the Sound or LED lights on or off – these will warn you if you are getting close to your daily target.
6) Set a credit alert You can set your own credit alert to let you know when you need to top up. Use the Credit Alert button on the Settings screen to do this. Better to set a daily target and use Credit Alert than run out of fuel!
7) Other things the smart meter display can do
Check your top up history, and that your top ups have gone through (on the right of this screen →)
and
29
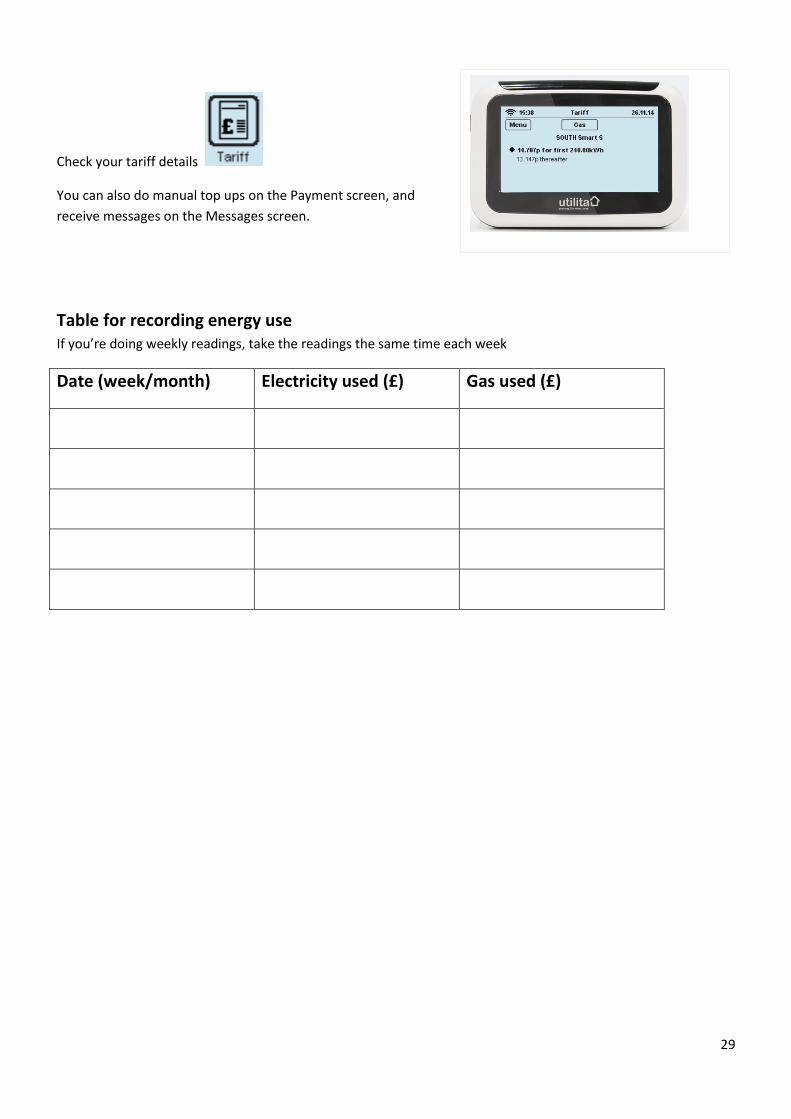
Check your tariff details
You can also do manual top ups on the Payment screen, and
receive messages on the Messages screen.
Table for recording energy use If you’re doing weekly readings, take the readings the same time each week
Date (week/month) Electricity used (£) Gas used (£)
30
Appendix 4: Additional participant comments Additional participant quotes are included here that speak directly to the research question indicated.
I = Interviewer, R = Respondent
1) What motivated households to switch to smart prepay?
Friendly Credit and flexible top up options
“I think it’s mainly because they said that if at the weekend you run out of money they wouldn’t cut you off. They’ll leave it on and you’ve just got to top up on the Monday. I thought that’s good because Brandon goes over to visit his parents at the weekend and if I can’t get to the shops because I was having a bad day I was stuck basically. So that persuaded me to go with them because I thought well that’s a really good idea…..….And the fact that I can actually charge it up over the phone as well because with not being that mobile I find it really easy and I don’t have to think Oh My God I’ve got to get up to the shops to get charged. So both those factors persuaded me.” [HV8]
Cost
“Cos before I knew about Utilita I was having lots of problems with the gas and electric. It would literally
go within two days and it was just stressing me out, so I thought “let me give this a go” and it’s been
amazing” [HV9]
No need to insert key into inaccessible meter, IHD in the home
“I had a phone call and they said about the meter it would be easier and more accessible to use, so that
was why I went for it” [CG15]
“Well one of the facts was we didn’t have to keep on rushing out with a key and a card and basically keep
having to bend over about opening the outside up and putting it in, it was all just laid out on a little meter
on the worktop in the kitchen so...” [CG15]
2) What information or support was provided to participants by the supplier in understanding how to use
their smart meter?
Shown a few screens
I: “Were you shown how to use the smart meter display, by the installer?”
R: “Only what the balance is, how to get the history, and the...is it targets?” [H12]
Thorough explanation
I: “And when they explained it did they explain any particular screens in more detail that might have been tricky?”
R: “They explained the tariff one and the account one and also the history one in quite a bit of detail, just to
get, like you said so I could monitor it if I needed to and just so that I was aware of different, that you did have different tariffs because I’d only recently moved out on my own so up to now I didn’t really know that electric and gas companies did different tariffs, I just thought once you were with a company you were all on the same and you know, so they did explain a bit more about that for me.” [CG12]
31
“They showed me most of them. They showed me the Dual; they should me how to put the money on; they
showed me how to put an emergency…where an alarm can go off and say that you’ve only got one pound
something on it and everything, yeah.” [CG13]
“Yeah, he did go through it a lot as well, but then a lot of it is trial and error and playing with it. Just like
anything, like any new phone you get or new gadget, you have to play along with it to know what you need
or what you’re looking for. But he showed me the basics and that obviously helped.” [CG11]
Brief as householder was busy
I2: “So when they came and installed the new meter, did they show you how to use the display and things?” R: “Sort of yeah.” I2: “Sort of as in not really good or…?” R: “Sort of, a bit of a mess up but he came while there was something going on, an emergency so it was a
case of…here it is, alright yeah, yeah.” I: “Yeah.” R: “Sorry life gets in the way sometimes...” [H11]
Householder unclear
I: “When the meters were installed did the installer show you how to use a smart meter display?” R: “No. Oh did he? I don’t know. No, [unclear 0:03:54]. Oh, unless, on, he did roughly, but he says and then
you go and, he probably went through it roughly, but I can’t remember him, like, when he showed me everything because I had to get someone in, my friend, to help me to show how to do it. I sort of worked it out myself, really. I found the booklet, so yeah.” [CG9]
3) How did participants use the smart meter display?
Householder unsure of some screens
“I only use it when I top up, just to make sure. Because I don't know how to use any of the other
functions.” [H12]
I: “You said one reason you went with it was because of ease of use, do you find it quite easy to use?” R: “Yes. I play with it. That one I wasn’t sure of.” I1: “Which one’s that?” R: “It says account. I wasn’t sure what those mean.” [H8]
Manual entry of top up code
“I topped up both the electric and gas, but the gas didn’t go on, so I looked on the receipt for the number
to pipe into the system, and it took a while for it to register, but I’m glad that I did do that, because if I
didn’t know I would have been going out without gas…” [H09]
32
History screen and Target Alert
“I’ve seen a lot of the different pie charts and stuff, but they don’t necessarily interest me so much, they
don’t give me the information I want. I’m more into the, looking at the week and day and oh, the other
screen where you can set what you’re trying to budget to.” [H10]
Costing appliances
I: “Have you played around with any other screens that you haven’t used before since we came to visit?” R: “Yes, the screen that looks a little bit like a speed display on your car.” I: “The dial.” R: “Previously I didn’t understand. I’ve been using that a little bit more when I’ve got things like the cooker
on and so on.” I: “Have you found it quite useful then?” R: “Yeah because you can actually see how much you’re using at the time and it makes you a bit more
conscious to go around and see if there’s anything else that you can turn off.” [H10]
4) Were households better able to reduce their energy expenditure?
“I think the benefit is for people who struggle with money and things, well for me it’s been amazing. I think people who struggle with money, I think will benefit from this a lot.” [H09] “The price really, just how cheap it is and convenient the fact that it is. You know you haven’t got to go to
the shop get your key out, your card and them come back and put it in the machine, you can just go
around the shop put it on and it’s done, or online if I, I’ve got four kids if it’s raining or they’re poorly I
can’t get out to put my electric on, I can do it online it’s so much better.” [H03]
“Yeah, it’s pence rather than pounds now [laughs]. Whereas before I used to leave everything on standby
it used to be £3 or £4 when I wasn’t here - as I said, I left everything on. But now I think it works out at 97
p, but when I’ve been out for an hour or so.” [H08]
5) Did households have improved control of energy use?
Energy experiments
“Before I had the meeting I think I was just using it because I knew I had money on the meter. I wouldn’t
have even thought of like cutting down on my usage on the electric or the gas.” [H2]
R: “So it was, it was interesting in the beginning because we had a microwave oven. Not a microwave but
it's the one with the oven.”
I: “Yeah I know what you mean.”
R: “And it was quite fascinating seeing how much electricity to cook like a pizza in there to the big oven.”
[H11]
33
Improved use/switching off
“So again, like I’m aware a bit more then I won’t, if I know I don’t fancy a cup of tea then I’m not gonna boil the kettle, am I? And again, I suppose they’ve [smart meter and IHD] brought up a bit more awareness as like there’s been times where I know I might be out of my home all day, I would switch off. Whereas before I used to keep everything on.” [CG11]
“Yes, I’ve noticed that my daughter, when it’s bedtime, she turns things off. Yes, I’ve noticed she’s turning
things off now [laughs].” [H09]
Budgeting and energy efficiency
I: “So what do you think the smart meter display is most useful for?” R: “For budgeting, never running out of either electric or gas. It’s not like the old-fashioned meter where you
have to go outside and check it. I think it’s better priced, the unit and I think it helps you use your energy and your gas more efficiently.” [H10]
“It helps with the household budgeting when you can tell roughly how many days it's going to last you.”
[H11]
Use Emergency Credit less
“I go in less since I’ve had the new one. I really do now whereas before I was always, always in emergency
credit.” [CG11]
6) Health-related points
Less stress
“All I’d say is I’d recommend it to people for ease because you know you can be anywhere in the country
and top up your meter, you don’t have to be at home or in the area of your home.” [H01]
“What has it, er, honestly like peace of mind. It’s easy……It’s actually visible to you what you’re using.”
[H02]
“Well, it’s just less stress so you know what you’re doing now, do you know what I mean? And it’s easy to
explain to somebody else, keep an eye on that. So if I was in hospital I could ask somebody, just keep an
eye on that meter, whereas before if it was under the stairs you had to have keys and cards and all this
malarkey, it’s a lot easier now.” [CG8]
“It is different because I don’t have to panic as much because the emergency is a lot more than it was on
the old meter, so if I do go into the emergency I don’t have to panic and go, “Oh”. If I’ve got a couple of
days until I get paid I can relax.” [CG14]
Potential health risk avoided for those with mobility issues
“I mean like you get like me, I can’t stand on steps very long I gets giddy. And you get older people. I’m 73
this year but you get people older than me trying to, if they’re using cards if they had it like I am they’ll
find it easier they haven’t got to worry about putting it in the meter itself like.” [CG01]
34
Appendix 5: Cases studies of home visits
Case study: H1 Occupancy Mr S is aged 35-44 years, and lives with his teenage son and daughter. His mum is a regular visitor. He was recently bereaved and is still trying to come to terms with his partner’s death (her ashes are in the front room and he doesn’t have the money to complete her final burial request). He is in receipt of Employment and Support Allowance, Personal Independence Payment, Council Tax and Housing benefits. The household income is less than £16,000 a year.
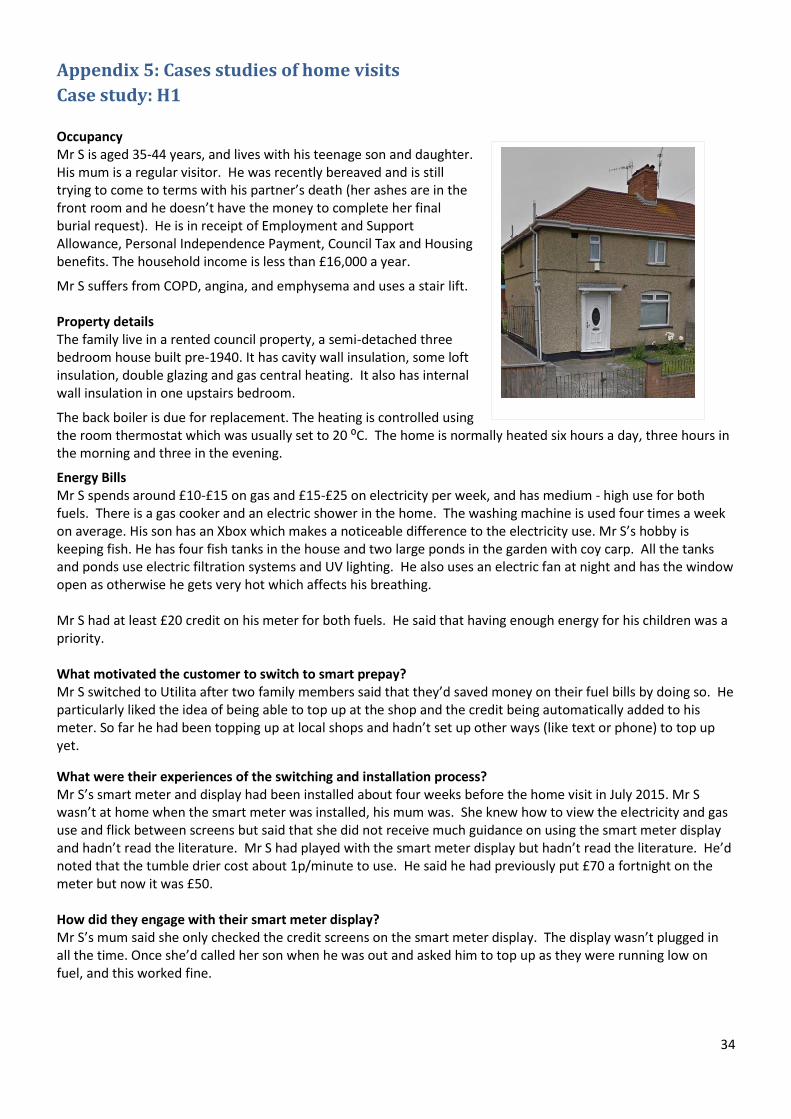
Mr S suffers from COPD, angina, and emphysema and uses a stair lift. Property details The family live in a rented council property, a semi-detached three bedroom house built pre-1940. It has cavity wall insulation, some loft insulation, double glazing and gas central heating. It also has internal wall insulation in one upstairs bedroom.
The back boiler is due for replacement. The heating is controlled using the room thermostat which was usually set to 20 ⁰C. The home is normally heated six hours a day, three hours in the morning and three in the evening.
Energy Bills Mr S spends around £10-£15 on gas and £15-£25 on electricity per week, and has medium - high use for both fuels. There is a gas cooker and an electric shower in the home. The washing machine is used four times a week on average. His son has an Xbox which makes a noticeable difference to the electricity use. Mr S’s hobby is keeping fish. He has four fish tanks in the house and two large ponds in the garden with coy carp. All the tanks and ponds use electric filtration systems and UV lighting. He also uses an electric fan at night and has the window open as otherwise he gets very hot which affects his breathing. Mr S had at least £20 credit on his meter for both fuels. He said that having enough energy for his children was a priority. What motivated the customer to switch to smart prepay? Mr S switched to Utilita after two family members said that they’d saved money on their fuel bills by doing so. He particularly liked the idea of being able to top up at the shop and the credit being automatically added to his meter. So far he had been topping up at local shops and hadn’t set up other ways (like text or phone) to top up yet.
What were their experiences of the switching and installation process? Mr S’s smart meter and display had been installed about four weeks before the home visit in July 2015. Mr S wasn’t at home when the smart meter was installed, his mum was. She knew how to view the electricity and gas use and flick between screens but said that she did not receive much guidance on using the smart meter display and hadn’t read the literature. Mr S had played with the smart meter display but hadn’t read the literature. He’d noted that the tumble drier cost about 1p/minute to use. He said he had previously put £70 a fortnight on the meter but now it was £50. How did they engage with their smart meter display? Mr S’s mum said she only checked the credit screens on the smart meter display. The display wasn’t plugged in all the time. Once she’d called her son when he was out and asked him to top up as they were running low on fuel, and this worked fine.
35
Did anything notable occur during the home visit around using the smart meter display to manage household energy use? During the visit advisors described how to measure the base load of the home, and costed boiling the kettle and use of the electric fan. They described how to cost the electricity use of the fish tanks when they were cleaned.
The smart meter display was used to check the household’s historical fuel use and daily targets of £1 for gas and £4 for electricity were set based on that information. This also informed a discussion about how fuel use might change in winter and planning for that.
Credit alerts of £5 for gas and £10 for electricity were set.
Did any changes in energy use occur after the home visit? Mr S said that it was quite entertaining, or eye-opening, exploring the new system. Whilst he said that there hadn’t been any change in use of appliances in the home, he said that his son was very careful on use of the Xbox, and that the children knew how to read the smart meter display to check how much credit was on the gas and electricity. He checked the credit five times a week, particularly the electricity credit as this directly related to whether his son could play on the Xbox.
He’d costed DIY power tools and had compared the energy use of a one cup kettle in his bedroom to his normal kettle (which was half the price of the normal kettle). He knew how much he was spending on electricity each week (£24), but hadn’t done this for gas as it was outside of the heating season.
Mr S said that he wasn’t using other smart meter display screens particularly, but had amended his daily target to £4.50 for each fuel. He’d also read the messages on the display, which was now left plugged in and was located where he could keep a regular eye on it. He commented that one benefit of the smart meter display was:
“The ease of using it really being able to do it, not having to go into the cupboard to look at it. You know it’s sat up on my shelf in the bedroom…..above the one cup sort of thing, so you know I can keep a check on it on a regular basis.”
Since changing to smart prepay Mr S hadn’t experienced a disconnection, which had previously happened occasionally.
He said that the advice given during the visit had been helpful, and that the play sheet was useful and easy to follow. The most useful advice was to check on the energy appliances used, and to budget for energy use.
“I would recommend that people you know encourage as many people as you can because it is a much better system than the old G meter.”
36
Case study: H2
Occupancy Miss A is in her late 50s and lives with her dog. Her eight grandchildren are frequent visitors, occasionally during school holidays visiting all at the same time. She receives Job Seekers Allowance, Housing Benefit and Council Tax Benefit, and has a household income of under £16,000 a year. Miss A had mobility issues and an osteopathy which lead to repeated fracturing of her ankle for which she wore a special shoe. The cold aggravated her health conditions.
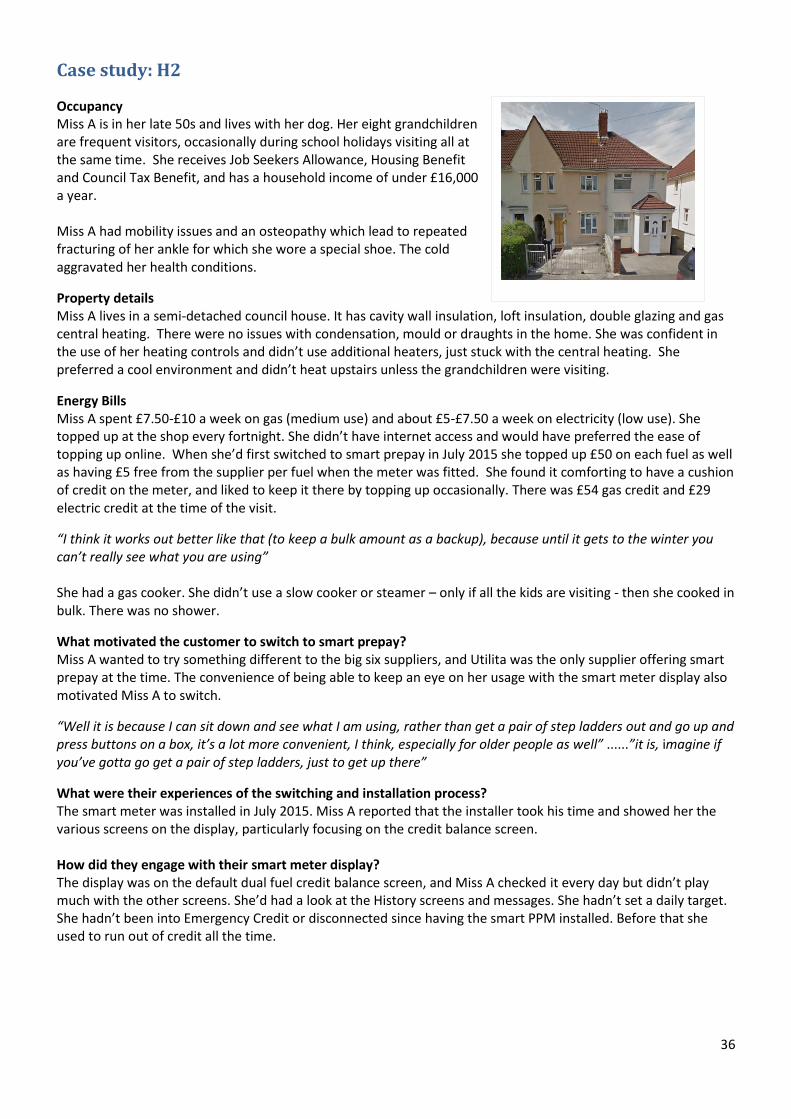
Property details Miss A lives in a semi-detached council house. It has cavity wall insulation, loft insulation, double glazing and gas central heating. There were no issues with condensation, mould or draughts in the home. She was confident in the use of her heating controls and didn’t use additional heaters, just stuck with the central heating. She preferred a cool environment and didn’t heat upstairs unless the grandchildren were visiting.
Energy Bills Miss A spent £7.50-£10 a week on gas (medium use) and about £5-£7.50 a week on electricity (low use). She topped up at the shop every fortnight. She didn’t have internet access and would have preferred the ease of topping up online. When she’d first switched to smart prepay in July 2015 she topped up £50 on each fuel as well as having £5 free from the supplier per fuel when the meter was fitted. She found it comforting to have a cushion of credit on the meter, and liked to keep it there by topping up occasionally. There was £54 gas credit and £29 electric credit at the time of the visit.
“I think it works out better like that (to keep a bulk amount as a backup), because until it gets to the winter you can’t really see what you are using” She had a gas cooker. She didn’t use a slow cooker or steamer – only if all the kids are visiting - then she cooked in bulk. There was no shower.
What motivated the customer to switch to smart prepay? Miss A wanted to try something different to the big six suppliers, and Utilita was the only supplier offering smart prepay at the time. The convenience of being able to keep an eye on her usage with the smart meter display also motivated Miss A to switch.
“Well it is because I can sit down and see what I am using, rather than get a pair of step ladders out and go up and press buttons on a box, it’s a lot more convenient, I think, especially for older people as well” ......”it is, imagine if you’ve gotta go get a pair of step ladders, just to get up there”
What were their experiences of the switching and installation process? The smart meter was installed in July 2015. Miss A reported that the installer took his time and showed her the various screens on the display, particularly focusing on the credit balance screen. How did they engage with their smart meter display? The display was on the default dual fuel credit balance screen, and Miss A checked it every day but didn’t play much with the other screens. She’d had a look at the History screens and messages. She hadn’t set a daily target. She hadn’t been into Emergency Credit or disconnected since having the smart PPM installed. Before that she used to run out of credit all the time.
37
Did anything notable occur during the home visit around using the smart meter display to manage household energy use? Advisers discussed various aspects of LED lighting with Miss A as she had a high energy (incandescent) lighting. She turned plugs off at the wall (like the kettle), but some devices like the Sky box, two TVs and stereo were left on most of the time. Advisers discussed base load and the cost of leaving appliances on standby. Miss A said that from noting how much electricity the kettle used on the display she’d cut down on the number of hot drinks she had a day, from ten to four cups. She filled the kettle full a few times a day rather than refilling it with just the amount she needed every time. Advisers costed use of the kettle and advised her on its efficient use. They also looked in detail at her previous usage. Miss A thought she’d get better use from the display in winter when she’d use more fuel. Did any changes in energy use occur after the home visit? Miss A had changed how she used her heating and hot water since the visit, attributing this to having the smart meter display. She was putting her heating on less and using a quilt to keep warm, and was washing up once a day to save firing up the boiler. She had turned everything except her TV off standby, and was now refilling the kettle every time she had a drink and was only boiling the water she needed. She was noting down from the smart meter display her credit balance from day to day and had looked through all the screens on her display since the visit. She thought that people could really benefit from having a smart meter display: “That’s what people like, especially the old people, is to actually see and work out what you’re using” She also said she had saved money on her fuel bills since having the smart PPM fitted: “I haven’t topped it up as much as I used to before I had the smart meter, so I knows it’s the money is lasting a lot longer” She thought the best aspect of having a smart meter display was that she could see what she was using, that it was visible and not hidden away. It was easy and gave her peace of mind:
“I suppose it’s less stressful having that, because as I said before you gotta keep getting up and down [to reach the old meter] and then I’ve just like chilled out because you know it’s there”
She said that she was now more aware of her heating and fuel use:
“Before I had the meter I think… I was just using it because I knew I had money on the meter. I wouldn’t have even thought of like cutting down on my usage, on the electric or the gas”
“I’m a hell of a lot more aware of what I’m using…. like, if you can’t see it you don’t really take a lot of notice of what you’re using”
She was really happy with the smart meter display and six of her friends and family had switched following her recommendation.
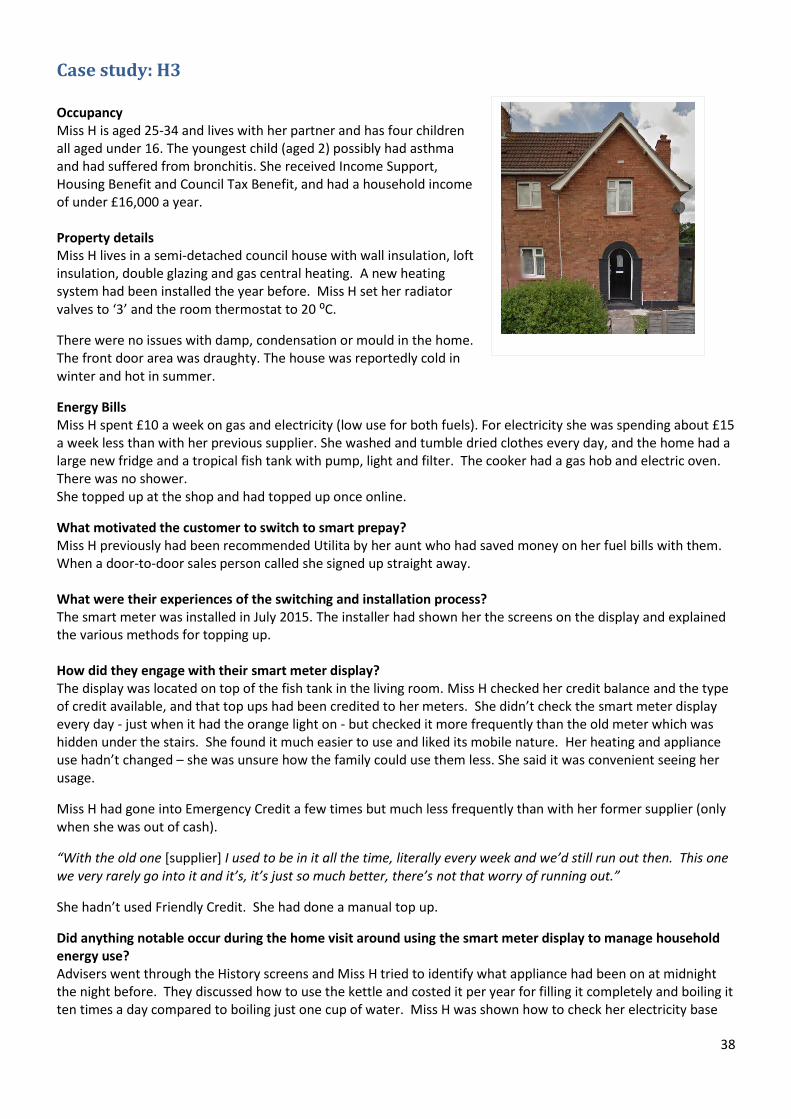
38
Case study: H3
Occupancy Miss H is aged 25-34 and lives with her partner and has four children all aged under 16. The youngest child (aged 2) possibly had asthma and had suffered from bronchitis. She received Income Support, Housing Benefit and Council Tax Benefit, and had a household income of under £16,000 a year. Property details Miss H lives in a semi-detached council house with wall insulation, loft insulation, double glazing and gas central heating. A new heating system had been installed the year before. Miss H set her radiator valves to ‘3’ and the room thermostat to 20 ⁰C.
There were no issues with damp, condensation or mould in the home. The front door area was draughty. The house was reportedly cold in winter and hot in summer.
Energy Bills Miss H spent £10 a week on gas and electricity (low use for both fuels). For electricity she was spending about £15 a week less than with her previous supplier. She washed and tumble dried clothes every day, and the home had a large new fridge and a tropical fish tank with pump, light and filter. The cooker had a gas hob and electric oven. There was no shower. She topped up at the shop and had topped up once online.
What motivated the customer to switch to smart prepay? Miss H previously had been recommended Utilita by her aunt who had saved money on her fuel bills with them. When a door-to-door sales person called she signed up straight away. What were their experiences of the switching and installation process? The smart meter was installed in July 2015. The installer had shown her the screens on the display and explained the various methods for topping up. How did they engage with their smart meter display? The display was located on top of the fish tank in the living room. Miss H checked her credit balance and the type of credit available, and that top ups had been credited to her meters. She didn’t check the smart meter display every day - just when it had the orange light on - but checked it more frequently than the old meter which was hidden under the stairs. She found it much easier to use and liked its mobile nature. Her heating and appliance use hadn’t changed – she was unsure how the family could use them less. She said it was convenient seeing her usage.
Miss H had gone into Emergency Credit a few times but much less frequently than with her former supplier (only when she was out of cash).
“With the old one [supplier] I used to be in it all the time, literally every week and we’d still run out then. This one we very rarely go into it and it’s, it’s just so much better, there’s not that worry of running out.”
She hadn’t used Friendly Credit. She had done a manual top up.
Did anything notable occur during the home visit around using the smart meter display to manage household energy use? Advisers went through the History screens and Miss H tried to identify what appliance had been on at midnight the night before. They discussed how to use the kettle and costed it per year for filling it completely and boiling it ten times a day compared to boiling just one cup of water. Miss H was shown how to check her electricity base
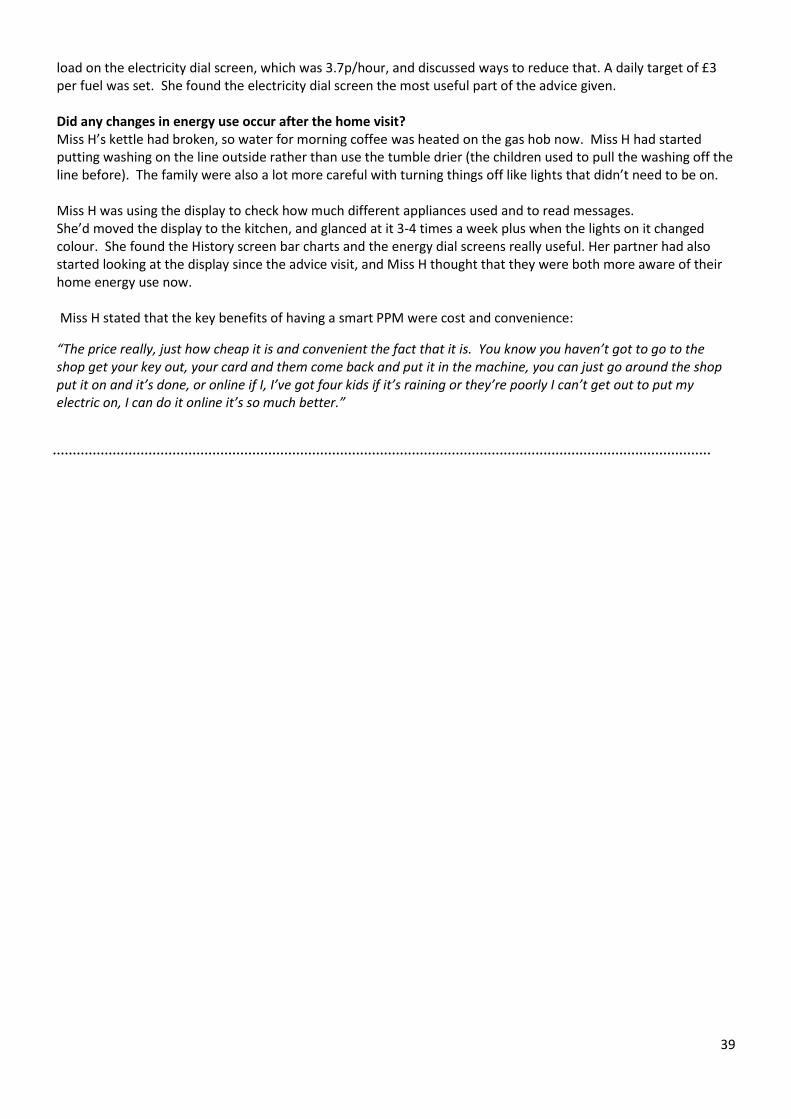
39
load on the electricity dial screen, which was 3.7p/hour, and discussed ways to reduce that. A daily target of £3 per fuel was set. She found the electricity dial screen the most useful part of the advice given. Did any changes in energy use occur after the home visit? Miss H’s kettle had broken, so water for morning coffee was heated on the gas hob now. Miss H had started putting washing on the line outside rather than use the tumble drier (the children used to pull the washing off the line before). The family were also a lot more careful with turning things off like lights that didn’t need to be on. Miss H was using the display to check how much different appliances used and to read messages. She’d moved the display to the kitchen, and glanced at it 3-4 times a week plus when the lights on it changed colour. She found the History screen bar charts and the energy dial screens really useful. Her partner had also started looking at the display since the advice visit, and Miss H thought that they were both more aware of their home energy use now. Miss H stated that the key benefits of having a smart PPM were cost and convenience:
“The price really, just how cheap it is and convenient the fact that it is. You know you haven’t got to go to the shop get your key out, your card and them come back and put it in the machine, you can just go around the shop put it on and it’s done, or online if I, I’ve got four kids if it’s raining or they’re poorly I can’t get out to put my electric on, I can do it online it’s so much better.”
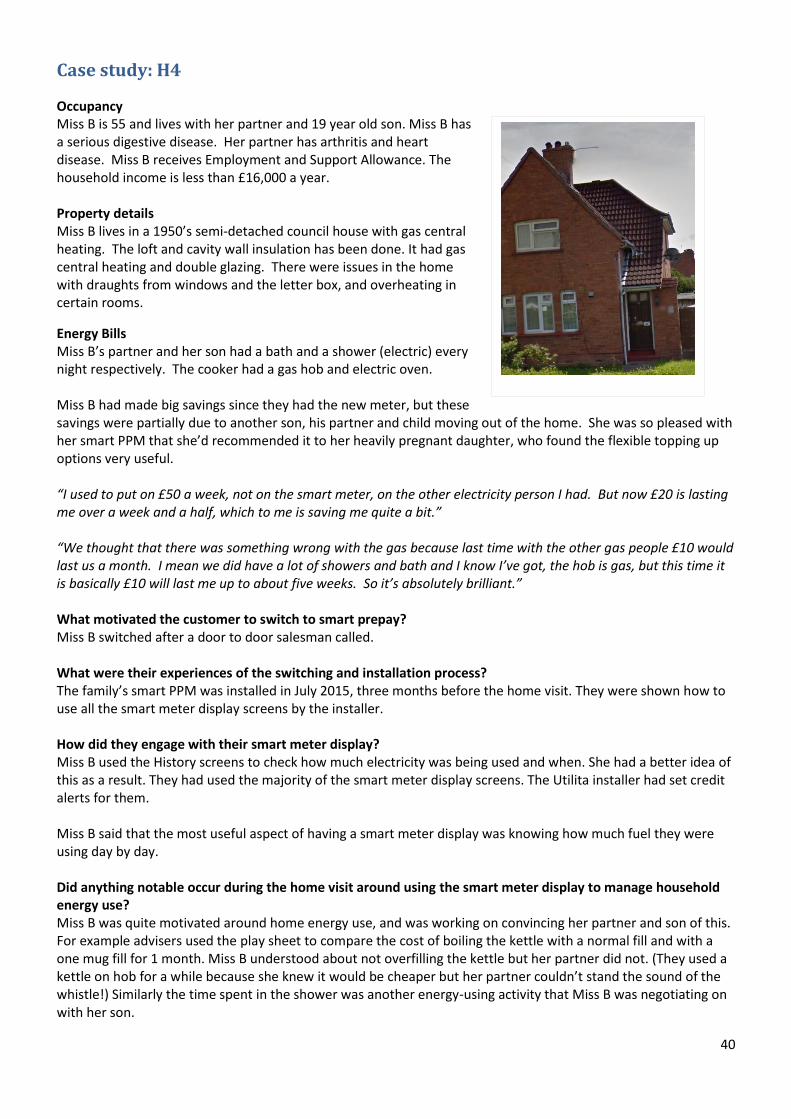
40
Case study: H4
Occupancy Miss B is 55 and lives with her partner and 19 year old son. Miss B has a serious digestive disease. Her partner has arthritis and heart disease. Miss B receives Employment and Support Allowance. The household income is less than £16,000 a year. Property details Miss B lives in a 1950’s semi-detached council house with gas central heating. The loft and cavity wall insulation has been done. It had gas central heating and double glazing. There were issues in the home with draughts from windows and the letter box, and overheating in certain rooms.
Energy Bills Miss B’s partner and her son had a bath and a shower (electric) every night respectively. The cooker had a gas hob and electric oven. Miss B had made big savings since they had the new meter, but these savings were partially due to another son, his partner and child moving out of the home. She was so pleased with her smart PPM that she’d recommended it to her heavily pregnant daughter, who found the flexible topping up options very useful. “I used to put on £50 a week, not on the smart meter, on the other electricity person I had. But now £20 is lasting me over a week and a half, which to me is saving me quite a bit.” “We thought that there was something wrong with the gas because last time with the other gas people £10 would last us a month. I mean we did have a lot of showers and bath and I know I’ve got, the hob is gas, but this time it is basically £10 will last me up to about five weeks. So it’s absolutely brilliant.” What motivated the customer to switch to smart prepay? Miss B switched after a door to door salesman called. What were their experiences of the switching and installation process? The family’s smart PPM was installed in July 2015, three months before the home visit. They were shown how to use all the smart meter display screens by the installer. How did they engage with their smart meter display? Miss B used the History screens to check how much electricity was being used and when. She had a better idea of this as a result. They had used the majority of the smart meter display screens. The Utilita installer had set credit alerts for them. Miss B said that the most useful aspect of having a smart meter display was knowing how much fuel they were using day by day. Did anything notable occur during the home visit around using the smart meter display to manage household energy use? Miss B was quite motivated around home energy use, and was working on convincing her partner and son of this. For example advisers used the play sheet to compare the cost of boiling the kettle with a normal fill and with a one mug fill for 1 month. Miss B understood about not overfilling the kettle but her partner did not. (They used a kettle on hob for a while because she knew it would be cheaper but her partner couldn’t stand the sound of the whistle!) Similarly the time spent in the shower was another energy-using activity that Miss B was negotiating on with her son.
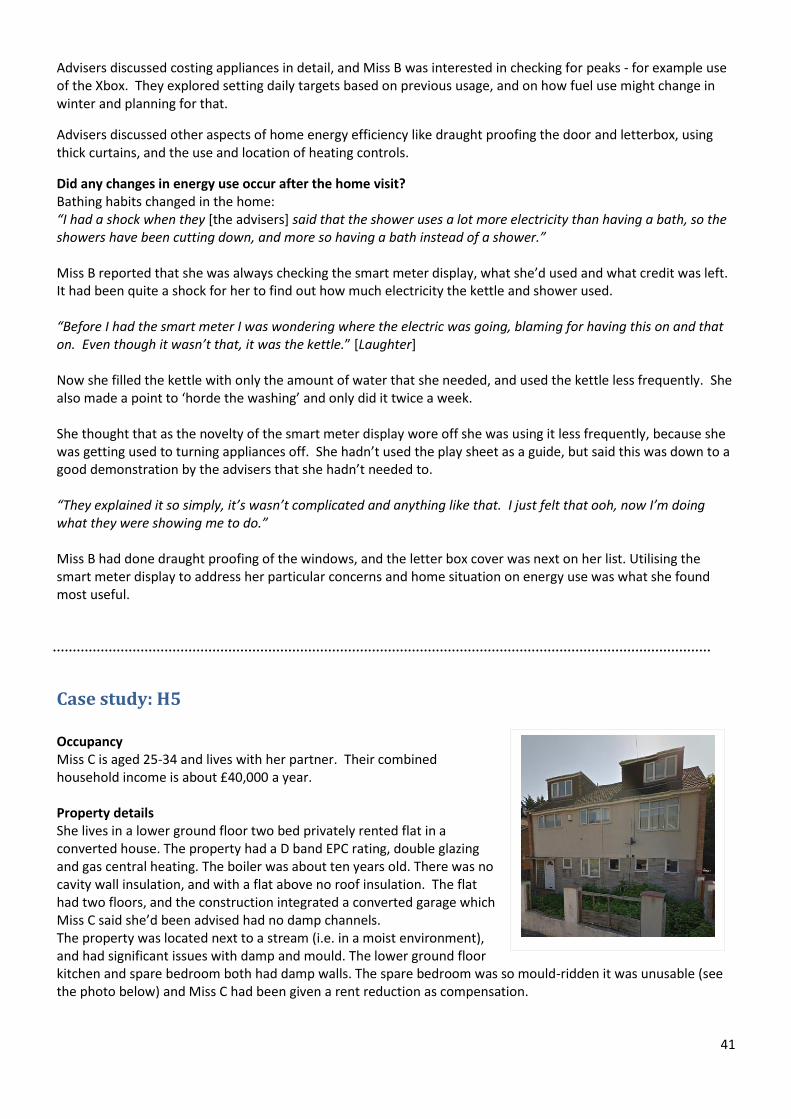
41
Advisers discussed costing appliances in detail, and Miss B was interested in checking for peaks - for example use of the Xbox. They explored setting daily targets based on previous usage, and on how fuel use might change in winter and planning for that.
Advisers discussed other aspects of home energy efficiency like draught proofing the door and letterbox, using thick curtains, and the use and location of heating controls.
Did any changes in energy use occur after the home visit? Bathing habits changed in the home: “I had a shock when they [the advisers] said that the shower uses a lot more electricity than having a bath, so the showers have been cutting down, and more so having a bath instead of a shower.” Miss B reported that she was always checking the smart meter display, what she’d used and what credit was left. It had been quite a shock for her to find out how much electricity the kettle and shower used. “Before I had the smart meter I was wondering where the electric was going, blaming for having this on and that on. Even though it wasn’t that, it was the kettle.” [Laughter] Now she filled the kettle with only the amount of water that she needed, and used the kettle less frequently. She also made a point to ‘horde the washing’ and only did it twice a week. She thought that as the novelty of the smart meter display wore off she was using it less frequently, because she was getting used to turning appliances off. She hadn’t used the play sheet as a guide, but said this was down to a good demonstration by the advisers that she hadn’t needed to. “They explained it so simply, it’s wasn’t complicated and anything like that. I just felt that ooh, now I’m doing what they were showing me to do.” Miss B had done draught proofing of the windows, and the letter box cover was next on her list. Utilising the smart meter display to address her particular concerns and home situation on energy use was what she found most useful.
Case study: H5
Occupancy Miss C is aged 25-34 and lives with her partner. Their combined household income is about £40,000 a year. Property details She lives in a lower ground floor two bed privately rented flat in a converted house. The property had a D band EPC rating, double glazing and gas central heating. The boiler was about ten years old. There was no cavity wall insulation, and with a flat above no roof insulation. The flat had two floors, and the construction integrated a converted garage which Miss C said she’d been advised had no damp channels. The property was located next to a stream (i.e. in a moist environment), and had significant issues with damp and mould. The lower ground floor kitchen and spare bedroom both had damp walls. The spare bedroom was so mould-ridden it was unusable (see the photo below) and Miss C had been given a rent reduction as compensation.
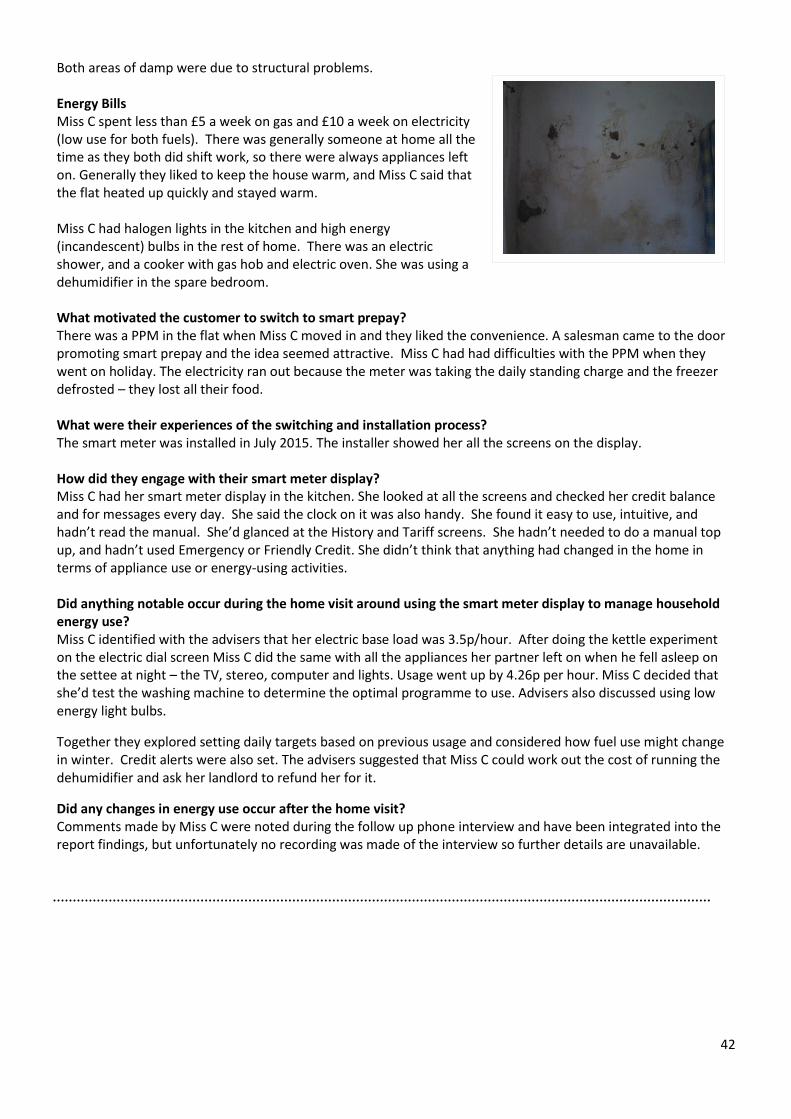
42
Both areas of damp were due to structural problems. Energy Bills Miss C spent less than £5 a week on gas and £10 a week on electricity (low use for both fuels). There was generally someone at home all the time as they both did shift work, so there were always appliances left on. Generally they liked to keep the house warm, and Miss C said that the flat heated up quickly and stayed warm. Miss C had halogen lights in the kitchen and high energy (incandescent) bulbs in the rest of home. There was an electric shower, and a cooker with gas hob and electric oven. She was using a dehumidifier in the spare bedroom. What motivated the customer to switch to smart prepay? There was a PPM in the flat when Miss C moved in and they liked the convenience. A salesman came to the door promoting smart prepay and the idea seemed attractive. Miss C had had difficulties with the PPM when they went on holiday. The electricity ran out because the meter was taking the daily standing charge and the freezer defrosted – they lost all their food. What were their experiences of the switching and installation process? The smart meter was installed in July 2015. The installer showed her all the screens on the display. How did they engage with their smart meter display? Miss C had her smart meter display in the kitchen. She looked at all the screens and checked her credit balance and for messages every day. She said the clock on it was also handy. She found it easy to use, intuitive, and hadn’t read the manual. She’d glanced at the History and Tariff screens. She hadn’t needed to do a manual top up, and hadn’t used Emergency or Friendly Credit. She didn’t think that anything had changed in the home in terms of appliance use or energy-using activities. Did anything notable occur during the home visit around using the smart meter display to manage household energy use? Miss C identified with the advisers that her electric base load was 3.5p/hour. After doing the kettle experiment on the electric dial screen Miss C did the same with all the appliances her partner left on when he fell asleep on the settee at night – the TV, stereo, computer and lights. Usage went up by 4.26p per hour. Miss C decided that she’d test the washing machine to determine the optimal programme to use. Advisers also discussed using low energy light bulbs.
Together they explored setting daily targets based on previous usage and considered how fuel use might change in winter. Credit alerts were also set. The advisers suggested that Miss C could work out the cost of running the dehumidifier and ask her landlord to refund her for it.
Did any changes in energy use occur after the home visit? Comments made by Miss C were noted during the follow up phone interview and have been integrated into the report findings, but unfortunately no recording was made of the interview so further details are unavailable.
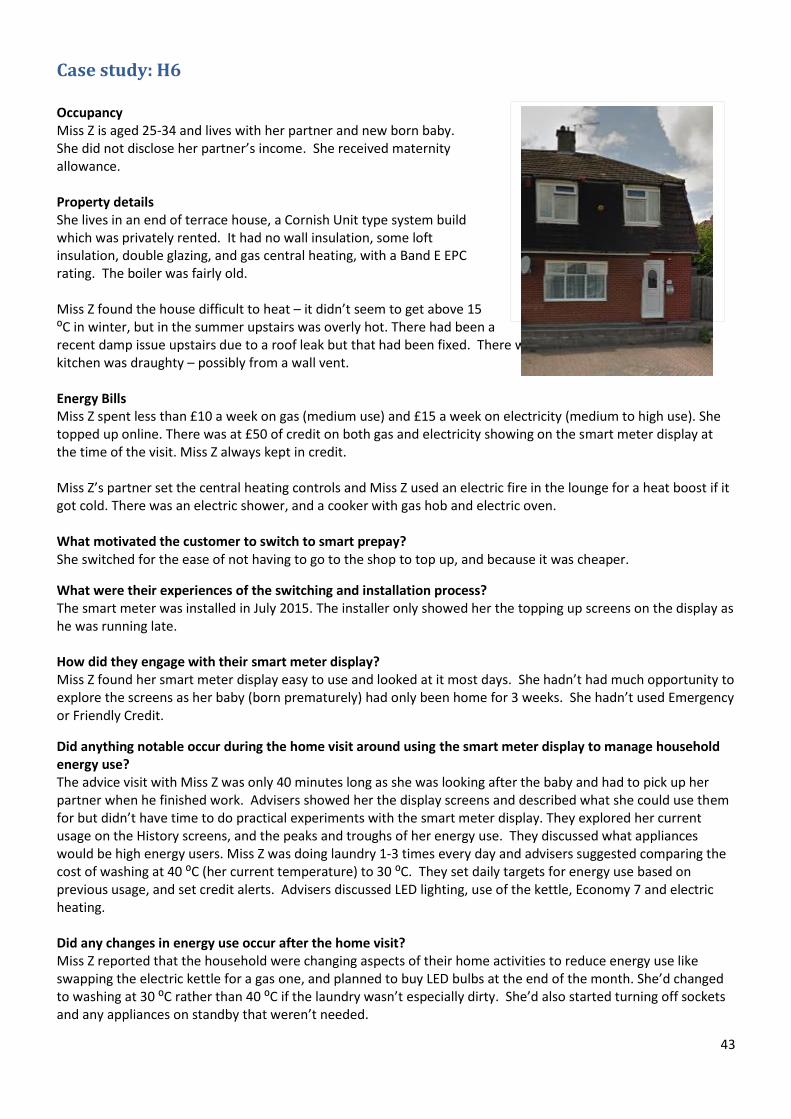
43
Case study: H6
Occupancy Miss Z is aged 25-34 and lives with her partner and new born baby. She did not disclose her partner’s income. She received maternity allowance. Property details She lives in an end of terrace house, a Cornish Unit type system build which was privately rented. It had no wall insulation, some loft insulation, double glazing, and gas central heating, with a Band E EPC rating. The boiler was fairly old. Miss Z found the house difficult to heat – it didn’t seem to get above 15 ⁰C in winter, but in the summer upstairs was overly hot. There had been a recent damp issue upstairs due to a roof leak but that had been fixed. There were no issues with mould. The kitchen was draughty – possibly from a wall vent. Energy Bills Miss Z spent less than £10 a week on gas (medium use) and £15 a week on electricity (medium to high use). She topped up online. There was at £50 of credit on both gas and electricity showing on the smart meter display at the time of the visit. Miss Z always kept in credit. Miss Z’s partner set the central heating controls and Miss Z used an electric fire in the lounge for a heat boost if it got cold. There was an electric shower, and a cooker with gas hob and electric oven. What motivated the customer to switch to smart prepay? She switched for the ease of not having to go to the shop to top up, and because it was cheaper.
What were their experiences of the switching and installation process? The smart meter was installed in July 2015. The installer only showed her the topping up screens on the display as he was running late. How did they engage with their smart meter display? Miss Z found her smart meter display easy to use and looked at it most days. She hadn’t had much opportunity to explore the screens as her baby (born prematurely) had only been home for 3 weeks. She hadn’t used Emergency or Friendly Credit.
Did anything notable occur during the home visit around using the smart meter display to manage household energy use? The advice visit with Miss Z was only 40 minutes long as she was looking after the baby and had to pick up her partner when he finished work. Advisers showed her the display screens and described what she could use them for but didn’t have time to do practical experiments with the smart meter display. They explored her current usage on the History screens, and the peaks and troughs of her energy use. They discussed what appliances would be high energy users. Miss Z was doing laundry 1-3 times every day and advisers suggested comparing the cost of washing at 40 ⁰C (her current temperature) to 30 ⁰C. They set daily targets for energy use based on previous usage, and set credit alerts. Advisers discussed LED lighting, use of the kettle, Economy 7 and electric heating. Did any changes in energy use occur after the home visit? Miss Z reported that the household were changing aspects of their home activities to reduce energy use like swapping the electric kettle for a gas one, and planned to buy LED bulbs at the end of the month. She’d changed to washing at 30 ⁰C rather than 40 ⁰C if the laundry wasn’t especially dirty. She’d also started turning off sockets and any appliances on standby that weren’t needed.
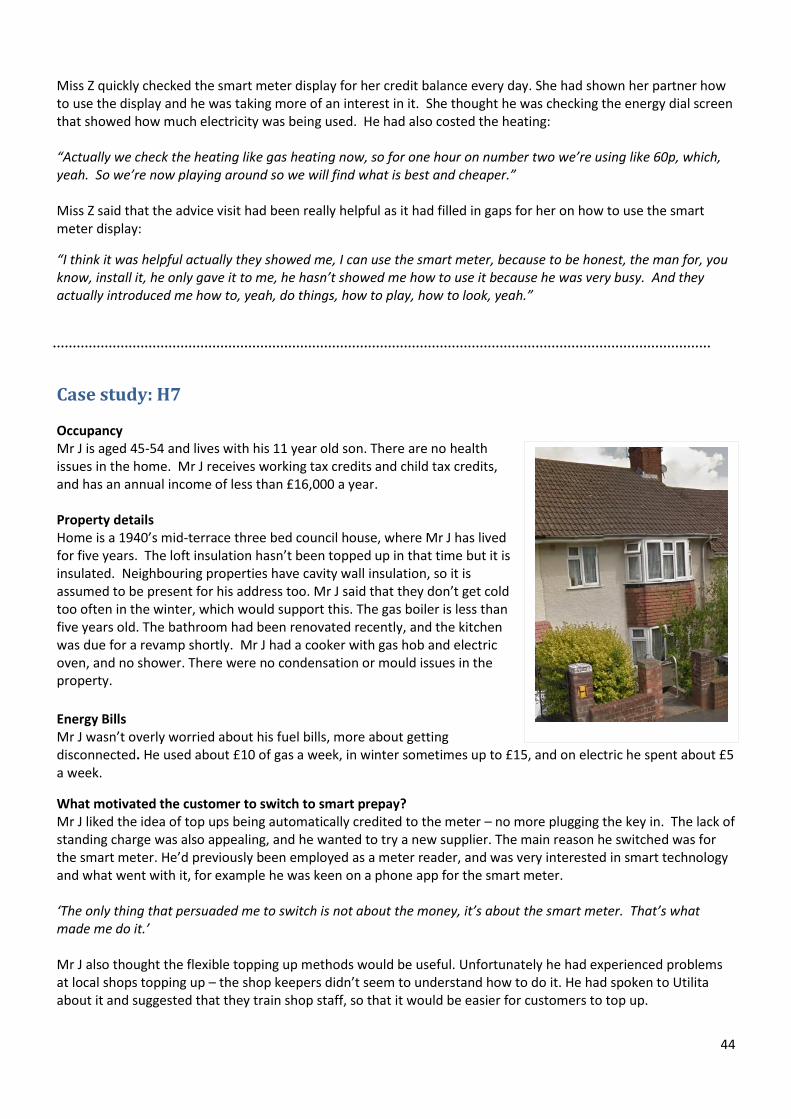
44
Miss Z quickly checked the smart meter display for her credit balance every day. She had shown her partner how to use the display and he was taking more of an interest in it. She thought he was checking the energy dial screen that showed how much electricity was being used. He had also costed the heating: “Actually we check the heating like gas heating now, so for one hour on number two we’re using like 60p, which, yeah. So we’re now playing around so we will find what is best and cheaper.” Miss Z said that the advice visit had been really helpful as it had filled in gaps for her on how to use the smart meter display:
“I think it was helpful actually they showed me, I can use the smart meter, because to be honest, the man for, you know, install it, he only gave it to me, he hasn’t showed me how to use it because he was very busy. And they actually introduced me how to, yeah, do things, how to play, how to look, yeah.”
Case study: H7
Occupancy Mr J is aged 45-54 and lives with his 11 year old son. There are no health issues in the home. Mr J receives working tax credits and child tax credits, and has an annual income of less than £16,000 a year. Property details Home is a 1940’s mid-terrace three bed council house, where Mr J has lived for five years. The loft insulation hasn’t been topped up in that time but it is insulated. Neighbouring properties have cavity wall insulation, so it is assumed to be present for his address too. Mr J said that they don’t get cold too often in the winter, which would support this. The gas boiler is less than five years old. The bathroom had been renovated recently, and the kitchen was due for a revamp shortly. Mr J had a cooker with gas hob and electric oven, and no shower. There were no condensation or mould issues in the property.
Energy Bills Mr J wasn’t overly worried about his fuel bills, more about getting disconnected. He used about £10 of gas a week, in winter sometimes up to £15, and on electric he spent about £5 a week.
What motivated the customer to switch to smart prepay? Mr J liked the idea of top ups being automatically credited to the meter – no more plugging the key in. The lack of standing charge was also appealing, and he wanted to try a new supplier. The main reason he switched was for the smart meter. He’d previously been employed as a meter reader, and was very interested in smart technology and what went with it, for example he was keen on a phone app for the smart meter. ‘The only thing that persuaded me to switch is not about the money, it’s about the smart meter. That’s what made me do it.’ Mr J also thought the flexible topping up methods would be useful. Unfortunately he had experienced problems at local shops topping up – the shop keepers didn’t seem to understand how to do it. He had spoken to Utilita about it and suggested that they train shop staff, so that it would be easier for customers to top up.
45
What were their experiences of the switching and installation process? The smart PPM was installed in July 2015, and Mr J was very pleased with it. He had been shown how to use the display by the installer. “Yeah, I was given good information, and to be honest even if he didn’t give me any information I still would have figured it out anyway. It’s not, I can’t understand how anyone would find it difficult to use. I mean my smart phone is harder than that.” The installer had also given Mr J a tip to making topping up easier. Mr J took a photo of his Utilita cards and kept them on his smart phone. He could then read out the card number to the shop assistant, which is all they needed to do the top up. How did they engage with their smart meter display? Mr J had the display plugged in near his phone and the front door, and had developed the habit of looking at it every day. “When I walk in I just have a quick nose because I don’t like running around to, I don’t like going low. I like to keep it topped up. So I like it where I can see it. When I open the door I have a quick look for a second and that’s it. I don’t have to worry about it then. I don’t like going on emergencies and running out of things. I just like to keep things topped up.” Mr J found the smart meter display very straightforward to use. He’d had one issue with the display in connection with Emergency Credit. He hadn’t realised that he had to press a button to enter Emergency Credit and got disconnected as a result. He liked going to the shop to top up for the exercise, but found topping up by phone convenient. The automatic credit to his meter was really good – he could top up as he was going to work or even whilst on holiday if he needed to. He hadn’t used the display to reduce his energy use, as he wasn’t overly concerned about his fuel bills. He didn’t set daily targets, cost appliances or use the History screen for budgeting. He mainly checked his credit and that top ups had gone through. Did anything notable occur during the home visit around using the smart meter display to manage household energy use? Mr J was already conscientious in his use of water and energy in the home. The main benefit to him of having the smart meter display was in keeping an eye on his usage. Previously he hadn’t checked his meter as frequently as it was in a cupboard. “That’s one good thing about it, I don’t have to mess about going in my dark cupboard pulling everything out, I just have a quick look.” Because he wasn’t worried about his fuel consumption he hadn’t realised that he could measure his base load and check what appliances were using the most energy. When the advisers showed him this he was quite surprised. Even though he was happy playing with the display he wasn’t aware of how to use it to reduce his fuel bills, and/or hadn’t been motivated to do so. Did any changes in energy use occur after the home visit? Mr J was still finding it difficult to enter Emergency Credit through the smart meter display and didn’t understand how to do it. He was actually ignoring the E-Credit button on the Low Credit Alert screen and selecting ‘Ignore’ instead. No behavioural changes were reported.
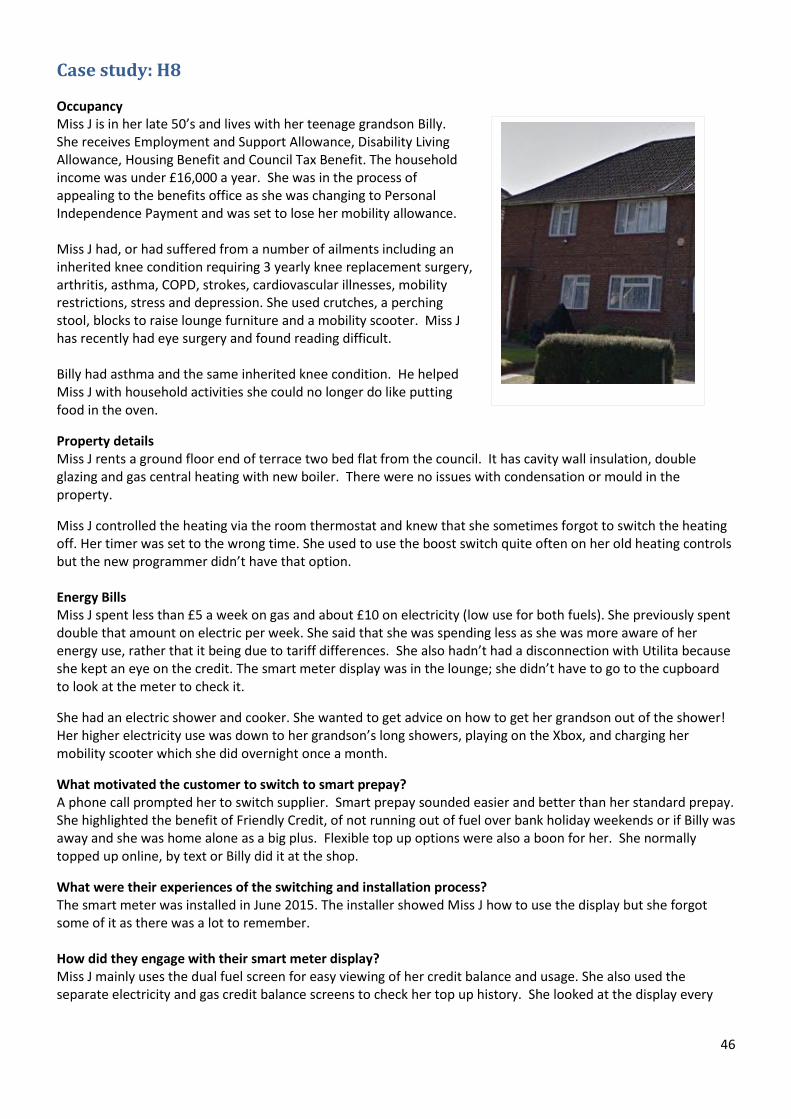
46
Case study: H8
Occupancy Miss J is in her late 50’s and lives with her teenage grandson Billy. She receives Employment and Support Allowance, Disability Living Allowance, Housing Benefit and Council Tax Benefit. The household income was under £16,000 a year. She was in the process of appealing to the benefits office as she was changing to Personal Independence Payment and was set to lose her mobility allowance. Miss J had, or had suffered from a number of ailments including an inherited knee condition requiring 3 yearly knee replacement surgery, arthritis, asthma, COPD, strokes, cardiovascular illnesses, mobility restrictions, stress and depression. She used crutches, a perching stool, blocks to raise lounge furniture and a mobility scooter. Miss J has recently had eye surgery and found reading difficult. Billy had asthma and the same inherited knee condition. He helped Miss J with household activities she could no longer do like putting food in the oven.
Property details Miss J rents a ground floor end of terrace two bed flat from the council. It has cavity wall insulation, double glazing and gas central heating with new boiler. There were no issues with condensation or mould in the property.
Miss J controlled the heating via the room thermostat and knew that she sometimes forgot to switch the heating off. Her timer was set to the wrong time. She used to use the boost switch quite often on her old heating controls but the new programmer didn’t have that option. Energy Bills Miss J spent less than £5 a week on gas and about £10 on electricity (low use for both fuels). She previously spent double that amount on electric per week. She said that she was spending less as she was more aware of her energy use, rather that it being due to tariff differences. She also hadn’t had a disconnection with Utilita because she kept an eye on the credit. The smart meter display was in the lounge; she didn’t have to go to the cupboard to look at the meter to check it.
She had an electric shower and cooker. She wanted to get advice on how to get her grandson out of the shower! Her higher electricity use was down to her grandson’s long showers, playing on the Xbox, and charging her mobility scooter which she did overnight once a month.
What motivated the customer to switch to smart prepay? A phone call prompted her to switch supplier. Smart prepay sounded easier and better than her standard prepay. She highlighted the benefit of Friendly Credit, of not running out of fuel over bank holiday weekends or if Billy was away and she was home alone as a big plus. Flexible top up options were also a boon for her. She normally topped up online, by text or Billy did it at the shop.
What were their experiences of the switching and installation process? The smart meter was installed in June 2015. The installer showed Miss J how to use the display but she forgot some of it as there was a lot to remember. How did they engage with their smart meter display? Miss J mainly uses the dual fuel screen for easy viewing of her credit balance and usage. She also used the separate electricity and gas credit balance screens to check her top up history. She looked at the display every
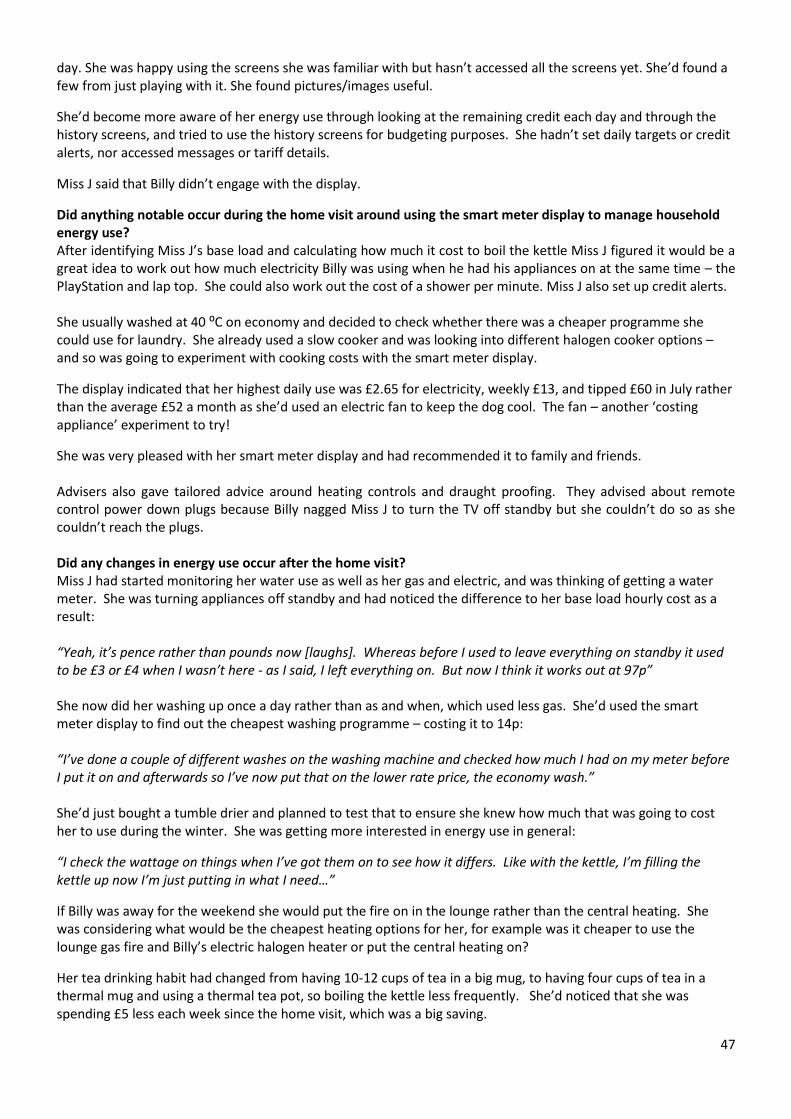
47
day. She was happy using the screens she was familiar with but hasn’t accessed all the screens yet. She’d found a few from just playing with it. She found pictures/images useful.
She’d become more aware of her energy use through looking at the remaining credit each day and through the history screens, and tried to use the history screens for budgeting purposes. She hadn’t set daily targets or credit alerts, nor accessed messages or tariff details.
Miss J said that Billy didn’t engage with the display.
Did anything notable occur during the home visit around using the smart meter display to manage household energy use? After identifying Miss J’s base load and calculating how much it cost to boil the kettle Miss J figured it would be a great idea to work out how much electricity Billy was using when he had his appliances on at the same time – the PlayStation and lap top. She could also work out the cost of a shower per minute. Miss J also set up credit alerts. She usually washed at 40 ⁰C on economy and decided to check whether there was a cheaper programme she could use for laundry. She already used a slow cooker and was looking into different halogen cooker options – and so was going to experiment with cooking costs with the smart meter display.
The display indicated that her highest daily use was £2.65 for electricity, weekly £13, and tipped £60 in July rather than the average £52 a month as she’d used an electric fan to keep the dog cool. The fan – another ‘costing appliance’ experiment to try!
She was very pleased with her smart meter display and had recommended it to family and friends. Advisers also gave tailored advice around heating controls and draught proofing. They advised about remote control power down plugs because Billy nagged Miss J to turn the TV off standby but she couldn’t do so as she couldn’t reach the plugs. Did any changes in energy use occur after the home visit? Miss J had started monitoring her water use as well as her gas and electric, and was thinking of getting a water meter. She was turning appliances off standby and had noticed the difference to her base load hourly cost as a result: “Yeah, it’s pence rather than pounds now [laughs]. Whereas before I used to leave everything on standby it used to be £3 or £4 when I wasn’t here - as I said, I left everything on. But now I think it works out at 97p” She now did her washing up once a day rather than as and when, which used less gas. She’d used the smart meter display to find out the cheapest washing programme – costing it to 14p: “I’ve done a couple of different washes on the washing machine and checked how much I had on my meter before I put it on and afterwards so I’ve now put that on the lower rate price, the economy wash.” She’d just bought a tumble drier and planned to test that to ensure she knew how much that was going to cost her to use during the winter. She was getting more interested in energy use in general:
“I check the wattage on things when I’ve got them on to see how it differs. Like with the kettle, I’m filling the kettle up now I’m just putting in what I need…”
If Billy was away for the weekend she would put the fire on in the lounge rather than the central heating. She was considering what would be the cheapest heating options for her, for example was it cheaper to use the lounge gas fire and Billy’s electric halogen heater or put the central heating on?
Her tea drinking habit had changed from having 10-12 cups of tea in a big mug, to having four cups of tea in a thermal mug and using a thermal tea pot, so boiling the kettle less frequently. She’d noticed that she was spending £5 less each week since the home visit, which was a big saving.
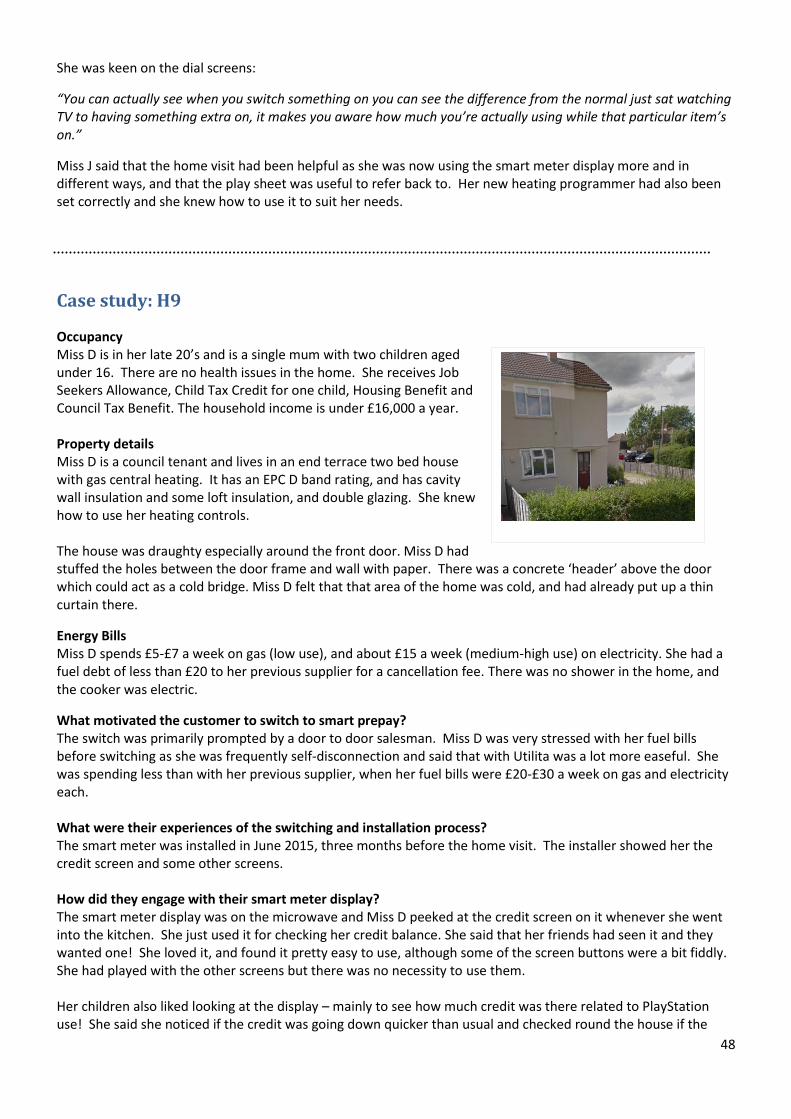
48
She was keen on the dial screens:
“You can actually see when you switch something on you can see the difference from the normal just sat watching TV to having something extra on, it makes you aware how much you’re actually using while that particular item’s on.”
Miss J said that the home visit had been helpful as she was now using the smart meter display more and in different ways, and that the play sheet was useful to refer back to. Her new heating programmer had also been set correctly and she knew how to use it to suit her needs.
Case study: H9
Occupancy Miss D is in her late 20’s and is a single mum with two children aged under 16. There are no health issues in the home. She receives Job Seekers Allowance, Child Tax Credit for one child, Housing Benefit and Council Tax Benefit. The household income is under £16,000 a year. Property details Miss D is a council tenant and lives in an end terrace two bed house with gas central heating. It has an EPC D band rating, and has cavity wall insulation and some loft insulation, and double glazing. She knew how to use her heating controls. The house was draughty especially around the front door. Miss D had stuffed the holes between the door frame and wall with paper. There was a concrete ‘header’ above the door which could act as a cold bridge. Miss D felt that that area of the home was cold, and had already put up a thin curtain there.
Energy Bills Miss D spends £5-£7 a week on gas (low use), and about £15 a week (medium-high use) on electricity. She had a fuel debt of less than £20 to her previous supplier for a cancellation fee. There was no shower in the home, and the cooker was electric.
What motivated the customer to switch to smart prepay? The switch was primarily prompted by a door to door salesman. Miss D was very stressed with her fuel bills before switching as she was frequently self-disconnection and said that with Utilita was a lot more easeful. She was spending less than with her previous supplier, when her fuel bills were £20-£30 a week on gas and electricity each. What were their experiences of the switching and installation process? The smart meter was installed in June 2015, three months before the home visit. The installer showed her the credit screen and some other screens. How did they engage with their smart meter display? The smart meter display was on the microwave and Miss D peeked at the credit screen on it whenever she went into the kitchen. She just used it for checking her credit balance. She said that her friends had seen it and they wanted one! She loved it, and found it pretty easy to use, although some of the screen buttons were a bit fiddly. She had played with the other screens but there was no necessity to use them. Her children also liked looking at the display – mainly to see how much credit was there related to PlayStation use! She said she noticed if the credit was going down quicker than usual and checked round the house if the
49
PlayStation or her daughter’s laptop had been left on. Otherwise she turned everything off. She thought that the smart meter display was useful for teaching her kids how much appliances like the PlayStation used. Miss D hadn’t used the History screens to check how much she was using, but had been keeping a note of how much she was spending and how much she was topping up. Did anything notable occur during the home visit around using the smart meter display to manage household energy use? Miss D’s electric base load was found to be 1.66p/hour using the smart meter display. The electricity dial shot up to more than 50p/hour to boil the kettle, and the actual cost of boiling the kettle with one cup of water was 1p. Her credit alert was set to £1 for each fuel. Miss D kept in credit but wasn’t aware of Emergency or Friendly Credit at all so these were discussed and the relevant screen for entering Emergency Credit shown. She topped up at the shops and found out how to do a manual top up with a voucher code if a top up didn’t go through. Advisers looked with her in the Utilita literature for what to do in the event of a disconnection. She said that sometimes the gas top up took a bit of time to go through but hadn’t been disconnected.
Looking back over previous monthly usage in the History screens, Miss D identified when she was away in the summer, and why there was high electricity use one month as she’d had her daughter’s birthday party with bouncy castle and music. This was linked to future fuel budgeting.
Miss D was very positive about the smart meter display and her switch to Utilita. She seemed keen to use the display a bit more, especially for budgeting.
Did any changes in energy use occur after the home visit? There weren’t any reported changes to energy using practices like cooking or laundry. Miss D glanced at the display more frequently after the visit to check her credit balance. She had used the manual top up screen as a gas top up hadn’t been credited to the meter. She’d also used Emergency Credit, something she’d not done before. It was useful for her to have the credit alert set, and she tried not to go past that £1 limit. She said that the smart meter display was really useful for that, and that she disconnected far less with the smart meter: “Before the smart meter, the thing that I had before, I never used to check until it’s bleeping and then when it’s bleeping is when it’s too late. So this is definitely a lot better.” She had started putting the heating on, and checked the smart meter display to work out roughly how much that was costing, which was 50p an hour. She hadn’t explored the History screens or messages. Miss D said that her daughter had picked up on reducing energy use in the home since she had been using the smart meter display: “I’ve noticed that my daughter, when it’s bedtime, she turns things off. Yes, I’ve noticed she’s turning things off now [laughs].” She reported that having the Utilita literature and play sheet had been very handy to refer to when she got stuck with no gas one night. She’d also made her own notes during the visit on how to use the display which she referred to. The most useful aspects of the advice visit for her were the manual top up and History screens for budgeting. She suggested that for people who hadn’t received a visit, an option to receive literature or post regular updates could help them use their display. She said about her smart PPM: “I think the benefit is for people who struggle with money and things; well for me it’s been amazing. I think people who struggle with money, I think will benefit from this a lot.”
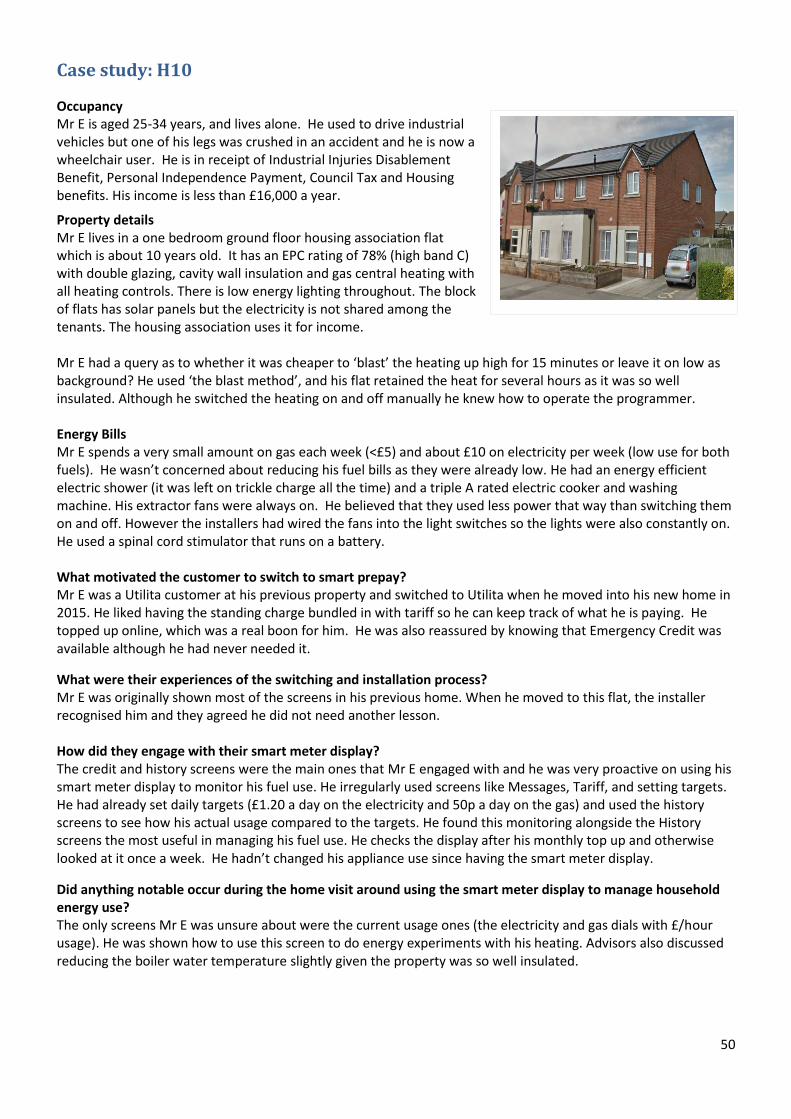
50
Case study: H10
Occupancy Mr E is aged 25-34 years, and lives alone. He used to drive industrial vehicles but one of his legs was crushed in an accident and he is now a wheelchair user. He is in receipt of Industrial Injuries Disablement Benefit, Personal Independence Payment, Council Tax and Housing benefits. His income is less than £16,000 a year.
Property details Mr E lives in a one bedroom ground floor housing association flat which is about 10 years old. It has an EPC rating of 78% (high band C) with double glazing, cavity wall insulation and gas central heating with all heating controls. There is low energy lighting throughout. The block of flats has solar panels but the electricity is not shared among the tenants. The housing association uses it for income. Mr E had a query as to whether it was cheaper to ‘blast’ the heating up high for 15 minutes or leave it on low as background? He used ‘the blast method’, and his flat retained the heat for several hours as it was so well insulated. Although he switched the heating on and off manually he knew how to operate the programmer. Energy Bills Mr E spends a very small amount on gas each week (<£5) and about £10 on electricity per week (low use for both fuels). He wasn’t concerned about reducing his fuel bills as they were already low. He had an energy efficient electric shower (it was left on trickle charge all the time) and a triple A rated electric cooker and washing machine. His extractor fans were always on. He believed that they used less power that way than switching them on and off. However the installers had wired the fans into the light switches so the lights were also constantly on. He used a spinal cord stimulator that runs on a battery. What motivated the customer to switch to smart prepay? Mr E was a Utilita customer at his previous property and switched to Utilita when he moved into his new home in 2015. He liked having the standing charge bundled in with tariff so he can keep track of what he is paying. He topped up online, which was a real boon for him. He was also reassured by knowing that Emergency Credit was available although he had never needed it.
What were their experiences of the switching and installation process? Mr E was originally shown most of the screens in his previous home. When he moved to this flat, the installer recognised him and they agreed he did not need another lesson. How did they engage with their smart meter display? The credit and history screens were the main ones that Mr E engaged with and he was very proactive on using his smart meter display to monitor his fuel use. He irregularly used screens like Messages, Tariff, and setting targets. He had already set daily targets (£1.20 a day on the electricity and 50p a day on the gas) and used the history screens to see how his actual usage compared to the targets. He found this monitoring alongside the History screens the most useful in managing his fuel use. He checks the display after his monthly top up and otherwise looked at it once a week. He hadn’t changed his appliance use since having the smart meter display.
Did anything notable occur during the home visit around using the smart meter display to manage household energy use? The only screens Mr E was unsure about were the current usage ones (the electricity and gas dials with £/hour usage). He was shown how to use this screen to do energy experiments with his heating. Advisors also discussed reducing the boiler water temperature slightly given the property was so well insulated.
51
Did any changes in energy use occur after the home visit? Mr E didn’t change any activities in the home as a result of becoming more acquainted with this smart meter display. He did engage more with the dial screen to observe the cost of using electrical appliances. ‘I have been playing about a little bit more because I’ve been using the screen that looks like a clock. I’ve been using that a bit more. So I think for other people I think it would definitely make them use their meter a little bit better.’ For him, the key benefits of a smart PPM were: “Budgeting, being more conscious with your money and the actual cost of electric and gas, what different appliances cost to run. You can make sure you’re warm in the winter, knowing… it can help you in a way to know what you need to put by for the winter to make sure you’re not cold. Just being more aware of what things are actually costing you and using the device to budget.” He found the costing appliances process of having to turn off everything except the appliance being costed a bit arduous. He hoped that advances in smart metering would enable measurement of energy use for different appliances without having to do this.
“On the smart meter itself I think they could make it a little bit more so that you can actually view different appliances in the home. You know, what they’re using at a time with several things running rather than using new screen that I was shown, with the dial and having to turn everything off bar the appliance itself to work out what that one appliance is using. I think that’s probably the next generation that in however many years to be honest, I don’t think it’s something, you know, I think that’s what the smart meter company need to provide.”
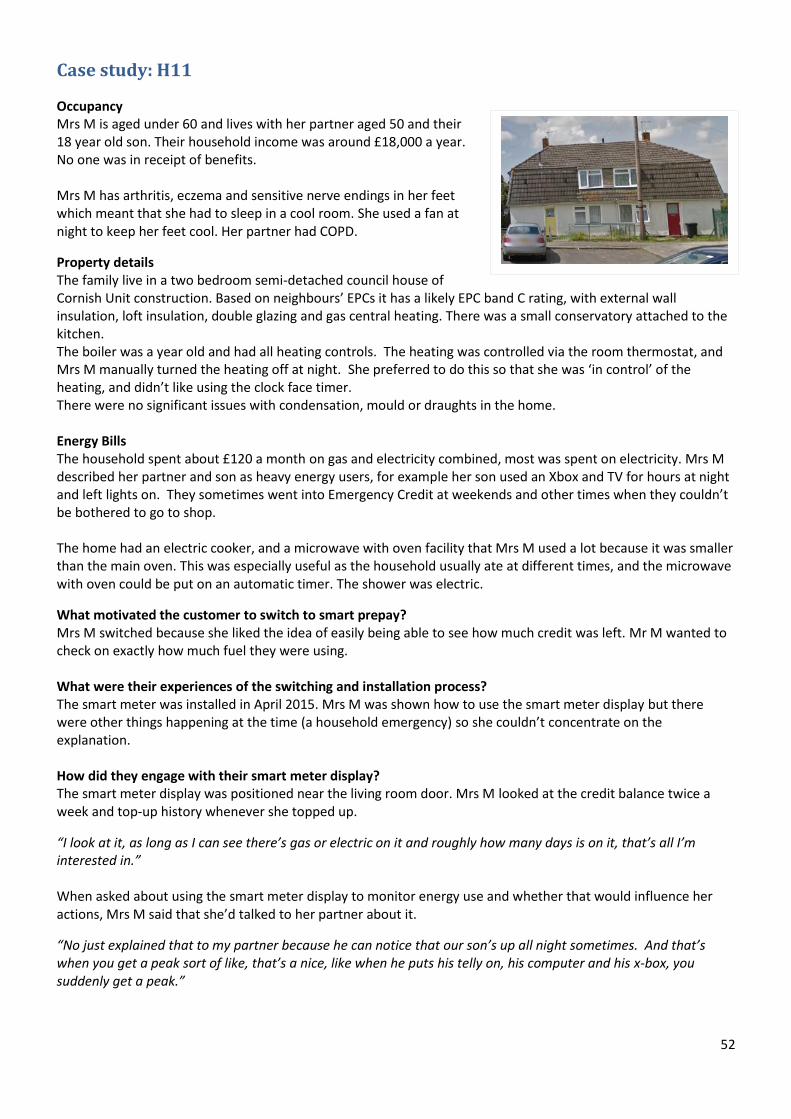
52
Case study: H11
Occupancy Mrs M is aged under 60 and lives with her partner aged 50 and their 18 year old son. Their household income was around £18,000 a year. No one was in receipt of benefits. Mrs M has arthritis, eczema and sensitive nerve endings in her feet which meant that she had to sleep in a cool room. She used a fan at night to keep her feet cool. Her partner had COPD.
Property details The family live in a two bedroom semi-detached council house of Cornish Unit construction. Based on neighbours’ EPCs it has a likely EPC band C rating, with external wall insulation, loft insulation, double glazing and gas central heating. There was a small conservatory attached to the kitchen. The boiler was a year old and had all heating controls. The heating was controlled via the room thermostat, and Mrs M manually turned the heating off at night. She preferred to do this so that she was ‘in control’ of the heating, and didn’t like using the clock face timer. There were no significant issues with condensation, mould or draughts in the home. Energy Bills The household spent about £120 a month on gas and electricity combined, most was spent on electricity. Mrs M described her partner and son as heavy energy users, for example her son used an Xbox and TV for hours at night and left lights on. They sometimes went into Emergency Credit at weekends and other times when they couldn’t be bothered to go to shop. The home had an electric cooker, and a microwave with oven facility that Mrs M used a lot because it was smaller than the main oven. This was especially useful as the household usually ate at different times, and the microwave with oven could be put on an automatic timer. The shower was electric.
What motivated the customer to switch to smart prepay? Mrs M switched because she liked the idea of easily being able to see how much credit was left. Mr M wanted to check on exactly how much fuel they were using. What were their experiences of the switching and installation process? The smart meter was installed in April 2015. Mrs M was shown how to use the smart meter display but there were other things happening at the time (a household emergency) so she couldn’t concentrate on the explanation. How did they engage with their smart meter display? The smart meter display was positioned near the living room door. Mrs M looked at the credit balance twice a week and top-up history whenever she topped up.
“I look at it, as long as I can see there’s gas or electric on it and roughly how many days is on it, that’s all I’m interested in.” When asked about using the smart meter display to monitor energy use and whether that would influence her actions, Mrs M said that she’d talked to her partner about it.
“No just explained that to my partner because he can notice that our son’s up all night sometimes. And that’s when you get a peak sort of like, that’s a nice, like when he puts his telly on, his computer and his x-box, you suddenly get a peak.”
53
Mr M was much more interested in the smart meter display and looked at the History screens for usage over time as well as checking on his son’s electricity use. Mr M started turning off lights on receipt of the smart meter display (but not very consistently).
Mrs M mentioned that she was aware of how much the tumble drier cost to run and how much having a shower used in credit since having the smart meter display.
“If you’re trying to budget, it’s good if you’re trying to budget you think ‘Hmm last time we used that to dry that amount of clothes’…”
She also mentioned that when they first got the display they had compared how much it cost to cook a pizza in the small microwave/oven compared to the large oven:
“It was quite fascinating seeing how much electricity to cook like a pizza in there [microwave with oven] to the big oven.”
She used the smaller oven more as a result. Mrs M hadn’t set credit alerts or daily targets, nor checked the tariff details or messages.
Did anything notable occur during the home visit around using the smart meter display to manage household energy use? Mrs M felt that she already knew which appliances were costing the most, and didn’t need to do the base load experiment. She said that she was aware of the effect of different washing cycles on energy use and used only appropriate ones. She didn’t have hot drinks herself, but used a kettle with one cup of water for her partner.
During the visit advisers showed Mrs M the history screens. She could identify what caused peaks on some days – for example in gas use when her son went out and left the heating on. She wasn’t interested in setting daily targets.
The advisers discussed using the dial screens and History screens of the smart meter display with Mrs M’s son to try and coax him into using less energy. She didn’t think it would work! (He didn’t contribute towards the bills).
Did any changes in energy use occur after the home visit? Mrs M had set a credit alert of £2 for both fuels. She didn’t know how much she had spent in the previous month on energy.
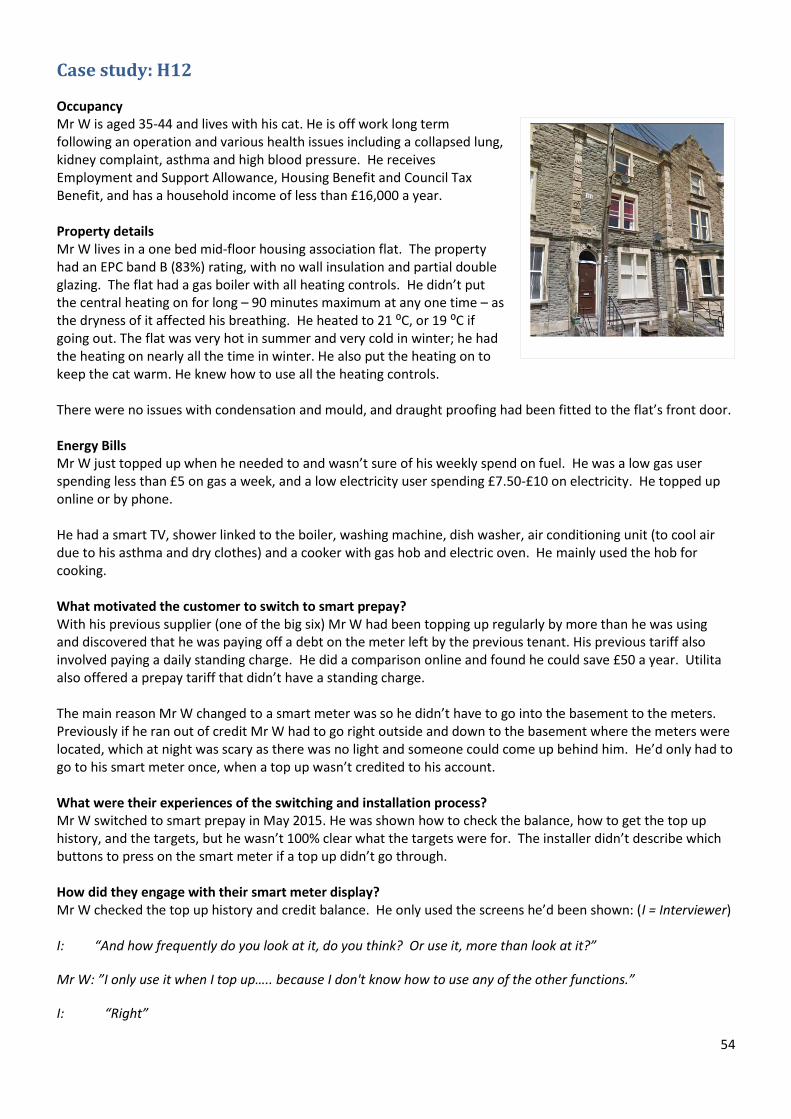
54
Case study: H12
Occupancy Mr W is aged 35-44 and lives with his cat. He is off work long term following an operation and various health issues including a collapsed lung, kidney complaint, asthma and high blood pressure. He receives Employment and Support Allowance, Housing Benefit and Council Tax Benefit, and has a household income of less than £16,000 a year. Property details Mr W lives in a one bed mid-floor housing association flat. The property had an EPC band B (83%) rating, with no wall insulation and partial double glazing. The flat had a gas boiler with all heating controls. He didn’t put the central heating on for long – 90 minutes maximum at any one time – as the dryness of it affected his breathing. He heated to 21 ⁰C, or 19 ⁰C if going out. The flat was very hot in summer and very cold in winter; he had the heating on nearly all the time in winter. He also put the heating on to keep the cat warm. He knew how to use all the heating controls. There were no issues with condensation and mould, and draught proofing had been fitted to the flat’s front door. Energy Bills Mr W just topped up when he needed to and wasn’t sure of his weekly spend on fuel. He was a low gas user spending less than £5 on gas a week, and a low electricity user spending £7.50-£10 on electricity. He topped up online or by phone. He had a smart TV, shower linked to the boiler, washing machine, dish washer, air conditioning unit (to cool air due to his asthma and dry clothes) and a cooker with gas hob and electric oven. He mainly used the hob for cooking. What motivated the customer to switch to smart prepay? With his previous supplier (one of the big six) Mr W had been topping up regularly by more than he was using and discovered that he was paying off a debt on the meter left by the previous tenant. His previous tariff also involved paying a daily standing charge. He did a comparison online and found he could save £50 a year. Utilita also offered a prepay tariff that didn’t have a standing charge. The main reason Mr W changed to a smart meter was so he didn’t have to go into the basement to the meters. Previously if he ran out of credit Mr W had to go right outside and down to the basement where the meters were located, which at night was scary as there was no light and someone could come up behind him. He’d only had to go to his smart meter once, when a top up wasn’t credited to his account. What were their experiences of the switching and installation process? Mr W switched to smart prepay in May 2015. He was shown how to check the balance, how to get the top up history, and the targets, but he wasn’t 100% clear what the targets were for. The installer didn’t describe which buttons to press on the smart meter if a top up didn’t go through. How did they engage with their smart meter display? Mr W checked the top up history and credit balance. He only used the screens he’d been shown: (I = Interviewer) I: “And how frequently do you look at it, do you think? Or use it, more than look at it?”
Mr W: ”I only use it when I top up….. because I don't know how to use any of the other functions.”
I: “Right”
55
Mr W: “Because there's one that's got, like a dial, do you know what it is. I haven't got a clue what that is.”
Home energy-use practices had changed as a result of having the smart meter installed, and his energy use had increased. Mr W knew roughly what some of his household appliances cost him to use and changed how he used them through observing how his credit balance changed. For example Mr W had bought a dishwasher, which he’d been planning to do for a while. With the smart meter he knew he could afford to have one after the tariff change and he could keep an eye on his electricity usage with the smart meter display. Knowing how much the dishwasher cost to use (from noting how much his credit decreased when he used it), one day he noticed that the fan oven guzzled electricity, so he used that less and cooked on the gas hob instead. “I used to use the oven quite a lot. But when I noticed the other day, it does go down quite quick with that, I don't hardly use it, I use the top plates, instead, because I don't use that much gas.” He had his own air conditioning unit as the heat aggravated his asthma, and was surprised that it didn’t cost that much to use. He was using it more as a result. He used the washing machine only once a week, but didn’t say whether that had changed since the smart meter installation. He hadn’t checked his tariff details, set credit alerts, or explored the History screens and setting a daily target for budgeting. Did anything notable occur during the home visit around using the smart meter display to manage household energy use? Advisers demonstrated via the energy dial screens what Mr W’s base load was in pence per hour, and how much his air conditioning unit cost to run. Together they looked at Mr W’s usage in the past week, identifying activities linked with peak energy use like laundry and cooking. The month screen also showed higher than expected electricity use in the summer, possibly due to use of the air conditioning. Advisers also touched on use of the Tariff and Messages screens on the smart meter display and set credit alerts after referencing Mr W’s daily energy use on the History screens. Mr W was keen to watch his usage in kilowatt hours on an ongoing basis. He appreciated being shown the other screens on the smart meter display and how to use it for monitoring energy usage, stating that ‘if you’re not told about it you’re not going to use it’. Once he’d got the gist of how to get a more accurate idea of his base load by turning all unnecessary appliances off, and of doing a proper costing of his dishwasher and washing machine, he realised he might be able to save money by change the washing programmes he selected for those appliances. The advisers also left Mr W a plug in energy monitor to use with his fridge freezer. Did any changes in energy use occur after the home visit? Mr W had got really interested in his smart meter display and had changed some of his home activities through engaging with it more. He was now putting the heating on and used the display to identify exactly when he did so. “I can tell you straight away because on this lovely meter of mine it will tell me when I increased my heating. Let me just press the button…history…gas…month, I would say according to this about the 10th.” He had bought a whistling gas kettle a few days after the home visit. He’d worked out that it cost him 7p to boil the electric kettle, and used it 4-5 times a day, so he decided to get a gas kettle instead. Mr W was also using the microwave more, as well as the gas hob and instead of his main oven. He’d calculated that to cook baked beans and jacket potato would cost no more than 60p in the microwave, but cost more than £2 in the main oven. He used the dishwasher every other day, which was quite expensive, and was washing up in between. Mr W particularly liked the energy dial screens to see what he was using in real time, and found it annoying that the display defaulted back to the credit balance screen after a while. He had noted that his electricity use had decreased compared to the month before. It had been useful to set daily targets, but Mr W said that he never reached them. He had never self-disconnected even as a standard PPM user, and always stayed in credit.
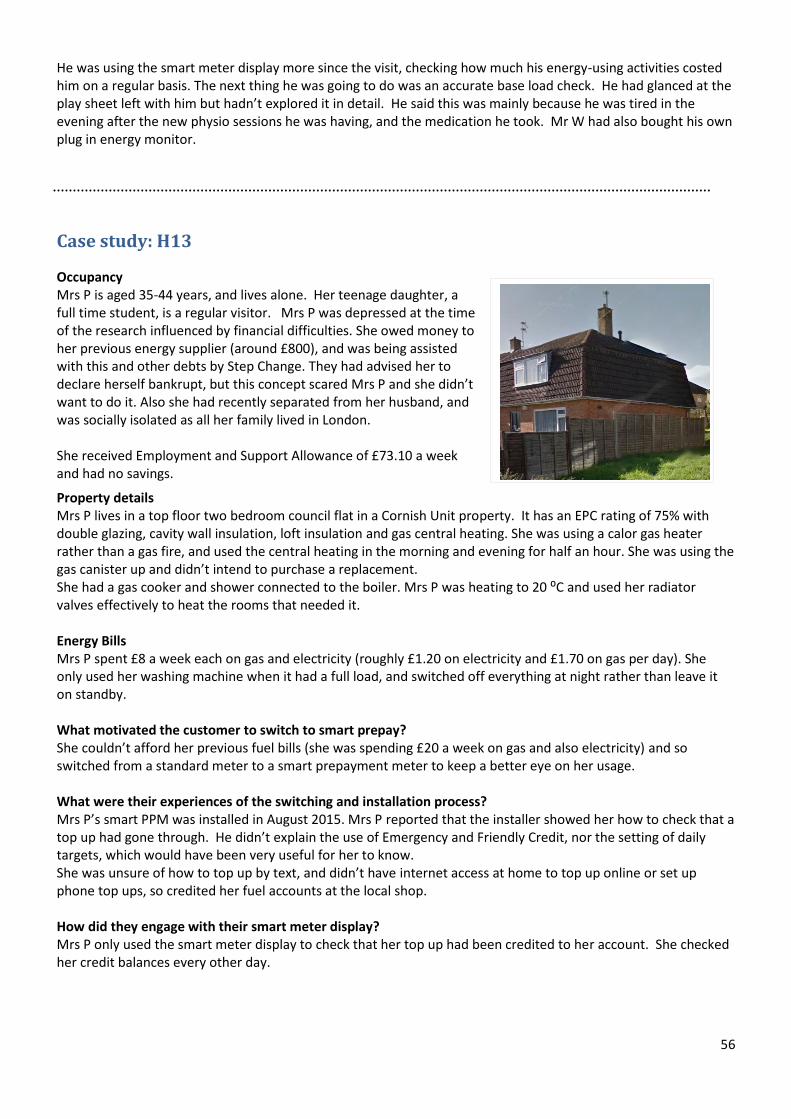
56
He was using the smart meter display more since the visit, checking how much his energy-using activities costed him on a regular basis. The next thing he was going to do was an accurate base load check. He had glanced at the play sheet left with him but hadn’t explored it in detail. He said this was mainly because he was tired in the evening after the new physio sessions he was having, and the medication he took. Mr W had also bought his own plug in energy monitor.
Case study: H13
Occupancy Mrs P is aged 35-44 years, and lives alone. Her teenage daughter, a full time student, is a regular visitor. Mrs P was depressed at the time of the research influenced by financial difficulties. She owed money to her previous energy supplier (around £800), and was being assisted with this and other debts by Step Change. They had advised her to declare herself bankrupt, but this concept scared Mrs P and she didn’t want to do it. Also she had recently separated from her husband, and was socially isolated as all her family lived in London. She received Employment and Support Allowance of £73.10 a week and had no savings.
Property details Mrs P lives in a top floor two bedroom council flat in a Cornish Unit property. It has an EPC rating of 75% with double glazing, cavity wall insulation, loft insulation and gas central heating. She was using a calor gas heater rather than a gas fire, and used the central heating in the morning and evening for half an hour. She was using the gas canister up and didn’t intend to purchase a replacement. She had a gas cooker and shower connected to the boiler. Mrs P was heating to 20 ⁰C and used her radiator valves effectively to heat the rooms that needed it. Energy Bills Mrs P spent £8 a week each on gas and electricity (roughly £1.20 on electricity and £1.70 on gas per day). She only used her washing machine when it had a full load, and switched off everything at night rather than leave it on standby. What motivated the customer to switch to smart prepay? She couldn’t afford her previous fuel bills (she was spending £20 a week on gas and also electricity) and so switched from a standard meter to a smart prepayment meter to keep a better eye on her usage. What were their experiences of the switching and installation process? Mrs P’s smart PPM was installed in August 2015. Mrs P reported that the installer showed her how to check that a top up had gone through. He didn’t explain the use of Emergency and Friendly Credit, nor the setting of daily targets, which would have been very useful for her to know. She was unsure of how to top up by text, and didn’t have internet access at home to top up online or set up phone top ups, so credited her fuel accounts at the local shop. How did they engage with their smart meter display? Mrs P only used the smart meter display to check that her top up had been credited to her account. She checked her credit balances every other day.
57
Did anything notable occur during the home visit around using the smart meter display to manage household energy use? The advisers showed Mrs P the dial screen and how to use it to check for her base load to make sure she’d not left anything on unnecessarily when she was going out, and for costing appliances like the kettle. They also explained the History screens and how to use them to check on previous usage, and for setting daily targets. She initially found it hard to understand the weekly and monthly screens showing previous usage. Mrs P was also unclear about the different topping up options. She wanted to top up by phone but needed to register to do this online first, which she couldn’t do at home as she had no internet access there. She wanted to know what she could do if she ran out of money and needed to top up, and the advisers described Emergency and Friendly Credit to her, and showed where this information was in the Utilita literature. It wasn’t possible for the advisers to set a daily target with Mrs P as she was obviously struggling with the amount of information, and said: “I’ve got a whole load of information I’m not understanding. I just want to rest now and just go to sleep for some time.” She needed short, ideally repeated instruction and assistance to register herself for phone top ups and learn how best to use the smart meter display to manage her fuel use. Advisers referred Mrs P to CSE for further support. Did any changes in energy use occur after the home visit? Mrs P said that she had made some changes to her energy use: making the most of natural light and leaving lights off, cooking only when necessary, and having a bath once a week rather than every other day. Her reduction in energy use is concerning and a reflection of her fuel poverty. She had used the dial screens to check her basic usage before going out, and was much more aware of the cost of using appliances, but in a worrying way. For example she now avoided using the kettle (see the quote below) and hadn’t costed other appliances to try to get a bigger picture of what was using energy in her home as she still didn’t fully understand how to use the smart meter display. “No, they [advisers] did explain to me, I think that in that sense I’m a bit weak with the technology, I don’t know how this thing works. The only thing I know, if I use the kettle a lot, then, you know, the thing will shoot up.” [laughter] Mrs P hadn’t set a daily target or credit alert, and didn’t refer to the History screen to track her usage. She had been unable to register for phone top ups despite calling Utilita customer services, and continued to top up at the shop. She used the smart meter display less than before, now only switching it on once every few days rather than it use electricity. She hadn’t self-disconnected in the previous four weeks. Mrs P reflected that the advice given during the home visit had been useful. She said that the play sheet with energy experiments was easy to use, but didn’t offer any instances of making use of it. Her main point was that the visit was too long and 30 minutes rather than an hour would have been better for her. Through a separate CSE project an application to a local crisis and prevention fund was made on her behalf for a replacement fridge freezer. She did not want additional support after that.
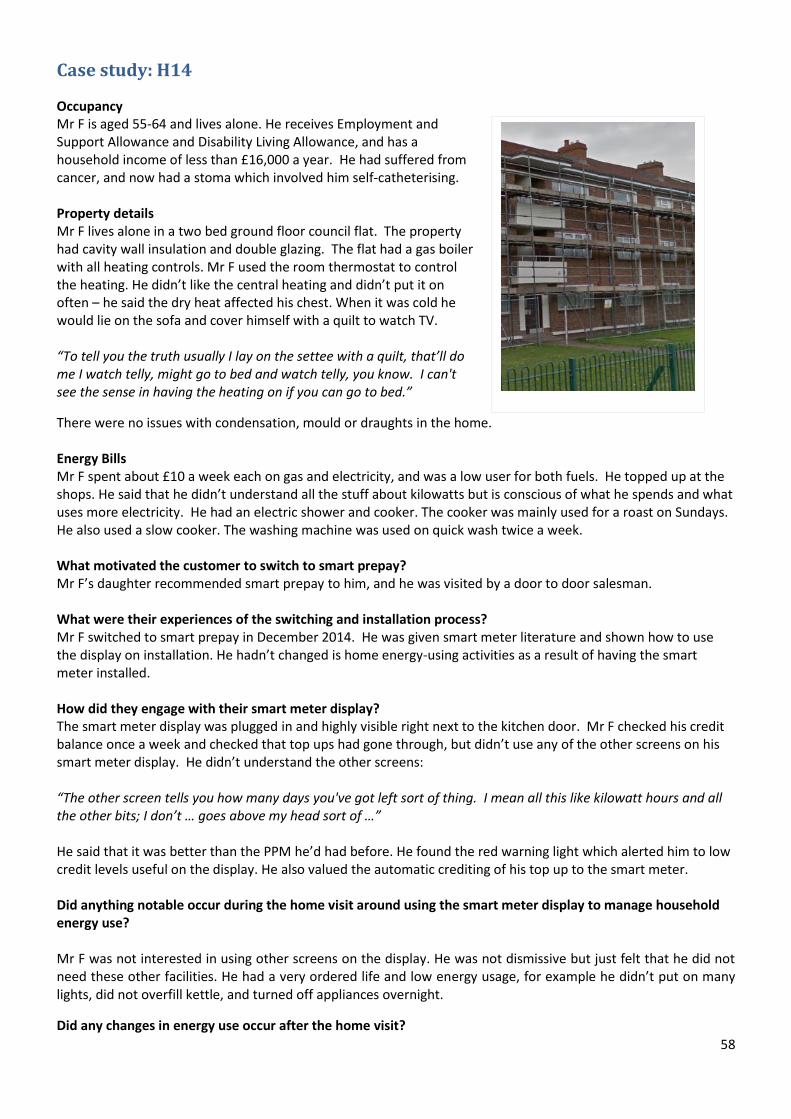
58
Case study: H14
Occupancy Mr F is aged 55-64 and lives alone. He receives Employment and Support Allowance and Disability Living Allowance, and has a household income of less than £16,000 a year. He had suffered from cancer, and now had a stoma which involved him self-catheterising. Property details Mr F lives alone in a two bed ground floor council flat. The property had cavity wall insulation and double glazing. The flat had a gas boiler with all heating controls. Mr F used the room thermostat to control the heating. He didn’t like the central heating and didn’t put it on often – he said the dry heat affected his chest. When it was cold he would lie on the sofa and cover himself with a quilt to watch TV. “To tell you the truth usually I lay on the settee with a quilt, that’ll do me I watch telly, might go to bed and watch telly, you know. I can't see the sense in having the heating on if you can go to bed.”
There were no issues with condensation, mould or draughts in the home. Energy Bills Mr F spent about £10 a week each on gas and electricity, and was a low user for both fuels. He topped up at the shops. He said that he didn’t understand all the stuff about kilowatts but is conscious of what he spends and what uses more electricity. He had an electric shower and cooker. The cooker was mainly used for a roast on Sundays. He also used a slow cooker. The washing machine was used on quick wash twice a week. What motivated the customer to switch to smart prepay? Mr F’s daughter recommended smart prepay to him, and he was visited by a door to door salesman. What were their experiences of the switching and installation process? Mr F switched to smart prepay in December 2014. He was given smart meter literature and shown how to use the display on installation. He hadn’t changed is home energy-using activities as a result of having the smart meter installed. How did they engage with their smart meter display? The smart meter display was plugged in and highly visible right next to the kitchen door. Mr F checked his credit balance once a week and checked that top ups had gone through, but didn’t use any of the other screens on his smart meter display. He didn’t understand the other screens: “The other screen tells you how many days you've got left sort of thing. I mean all this like kilowatt hours and all the other bits; I don’t … goes above my head sort of …” He said that it was better than the PPM he’d had before. He found the red warning light which alerted him to low credit levels useful on the display. He also valued the automatic crediting of his top up to the smart meter. Did anything notable occur during the home visit around using the smart meter display to manage household energy use? Mr F was not interested in using other screens on the display. He was not dismissive but just felt that he did not need these other facilities. He had a very ordered life and low energy usage, for example he didn’t put on many lights, did not overfill kettle, and turned off appliances overnight.
Did any changes in energy use occur after the home visit?
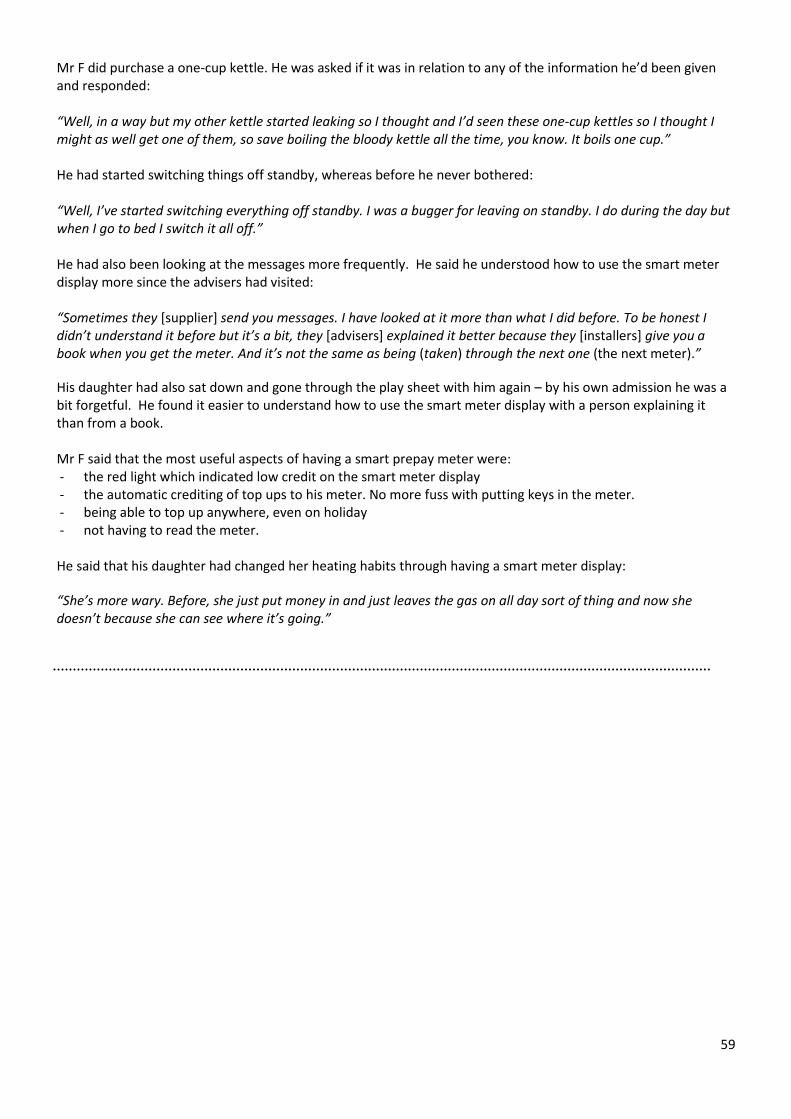
59
Mr F did purchase a one-cup kettle. He was asked if it was in relation to any of the information he’d been given and responded: “Well, in a way but my other kettle started leaking so I thought and I’d seen these one-cup kettles so I thought I might as well get one of them, so save boiling the bloody kettle all the time, you know. It boils one cup.” He had started switching things off standby, whereas before he never bothered: “Well, I’ve started switching everything off standby. I was a bugger for leaving on standby. I do during the day but when I go to bed I switch it all off.” He had also been looking at the messages more frequently. He said he understood how to use the smart meter display more since the advisers had visited: “Sometimes they [supplier] send you messages. I have looked at it more than what I did before. To be honest I didn’t understand it before but it’s a bit, they [advisers] explained it better because they [installers] give you a book when you get the meter. And it’s not the same as being (taken) through the next one (the next meter).”
His daughter had also sat down and gone through the play sheet with him again – by his own admission he was a bit forgetful. He found it easier to understand how to use the smart meter display with a person explaining it than from a book. Mr F said that the most useful aspects of having a smart prepay meter were: - the red light which indicated low credit on the smart meter display - the automatic crediting of top ups to his meter. No more fuss with putting keys in the meter. - being able to top up anywhere, even on holiday - not having to read the meter. He said that his daughter had changed her heating habits through having a smart meter display: “She’s more wary. Before, she just put money in and just leaves the gas on all day sort of thing and now she doesn’t because she can see where it’s going.”
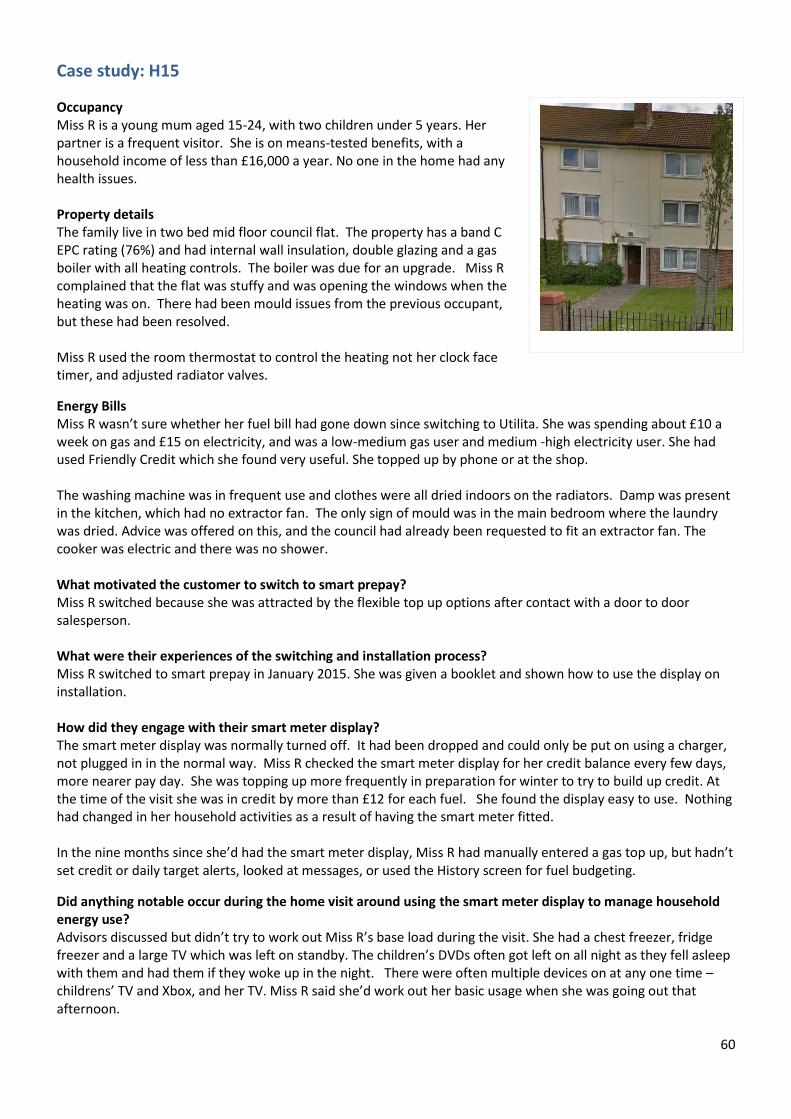
60
Case study: H15
Occupancy Miss R is a young mum aged 15-24, with two children under 5 years. Her partner is a frequent visitor. She is on means-tested benefits, with a household income of less than £16,000 a year. No one in the home had any health issues. Property details The family live in two bed mid floor council flat. The property has a band C EPC rating (76%) and had internal wall insulation, double glazing and a gas boiler with all heating controls. The boiler was due for an upgrade. Miss R complained that the flat was stuffy and was opening the windows when the heating was on. There had been mould issues from the previous occupant, but these had been resolved. Miss R used the room thermostat to control the heating not her clock face timer, and adjusted radiator valves.
Energy Bills Miss R wasn’t sure whether her fuel bill had gone down since switching to Utilita. She was spending about £10 a week on gas and £15 on electricity, and was a low-medium gas user and medium -high electricity user. She had used Friendly Credit which she found very useful. She topped up by phone or at the shop. The washing machine was in frequent use and clothes were all dried indoors on the radiators. Damp was present in the kitchen, which had no extractor fan. The only sign of mould was in the main bedroom where the laundry was dried. Advice was offered on this, and the council had already been requested to fit an extractor fan. The cooker was electric and there was no shower. What motivated the customer to switch to smart prepay? Miss R switched because she was attracted by the flexible top up options after contact with a door to door salesperson. What were their experiences of the switching and installation process? Miss R switched to smart prepay in January 2015. She was given a booklet and shown how to use the display on installation. How did they engage with their smart meter display? The smart meter display was normally turned off. It had been dropped and could only be put on using a charger, not plugged in in the normal way. Miss R checked the smart meter display for her credit balance every few days, more nearer pay day. She was topping up more frequently in preparation for winter to try to build up credit. At the time of the visit she was in credit by more than £12 for each fuel. She found the display easy to use. Nothing had changed in her household activities as a result of having the smart meter fitted. In the nine months since she’d had the smart meter display, Miss R had manually entered a gas top up, but hadn’t set credit or daily target alerts, looked at messages, or used the History screen for fuel budgeting.
Did anything notable occur during the home visit around using the smart meter display to manage household energy use? Advisors discussed but didn’t try to work out Miss R’s base load during the visit. She had a chest freezer, fridge freezer and a large TV which was left on standby. The children’s DVDs often got left on all night as they fell asleep with them and had them if they woke up in the night. There were often multiple devices on at any one time – childrens’ TV and Xbox, and her TV. Miss R said she’d work out her basic usage when she was going out that afternoon.
61
She also normally filled the kettle full in the morning just in case the sink was full and she couldn’t fill it later on. Advisers did the kettle experiment, demonstrating the price change from 9p/hr to 44p/hr on the electricity dial screen. They suggested having a water jug near the kettle and just boiling the water needed. Similar energy experiments were highlighted that Miss R could try with the deep fat fryer, washing machine, and TV.
During the visit the History screens were used to determine average usage to help with planning for winter. A credit alert of £2 per fuel was set.
During the visit Miss R was also advised about changing the boiler temperature settings to save money and make the flat less stuffy, and on appropriate ventilation.
Did any changes in energy use occur after the home visit? There were no reported changes in household energy-using behaviour. The smart meter display broke completely a few days after the home visit and Miss R had asked Utilita for a new one. She was now finding it inconvenient to check her usage and entered Emergency Credit via the smart meter in the cupboard. She hadn’t checked her basic usage or costed any appliances following the home visit. Miss R thought that the advice offered during the visit was alright but not especially useful, and that it was too much hassle to work out what individual appliances cost. She felt like she’d been shown the basics at installation, and that the additional information wasn’t of use to her. Miss R didn’t think that her knowledge of what used energy in her home had changed as a result of the visit. Her partner sometimes had used the display before its demise. She couldn’t remember how much she’d spent on fuel in the past month. She had used Emergency Credit but infrequently.