Embed Size (px)
Citation preview
SMART
Journal of Business Management Studies (An International Serial of Scientific Management and Advanced Research Trust)
Vol-8 Number- 2 July-December 2012 Rs.200
ISSN 0973-1598
M.SELVAM, M.Com, Ph.D
Founder – Publisher and Chief Editor
Scientific Management and Advanced Research Trust
(SMART) TIRUCHIRAPPALLI (INDIA)
www.smartjournalbms.org
SMART Journal is a Professional, Referred International and Indexed Journal. It
is indexed and abstracted by Ulrich’s International Periodicals Directory, Intute
Catalogue (University of Manchester) and CABELL’S Directory, USA, ABDC
Journal Quality List, Australia.
SMART Journal of Business Management Studies Vol. 8 No.2 July - December 2012
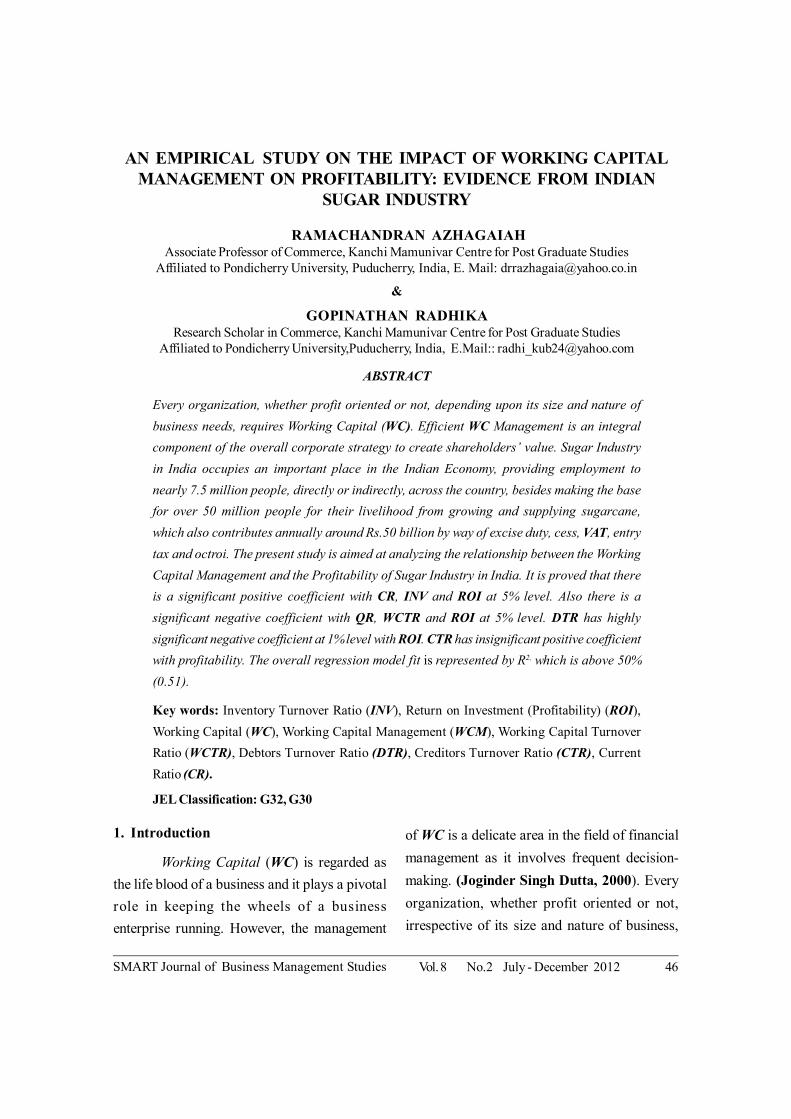
AN EMPIRICAL STUDY ON THE IMPACT OF WORKING CAPITALMANAGEMENT ON PROFITABILITY: EVIDENCE FROM INDIAN
SUGAR INDUSTRY
RAMACHANDRAN AZHAGAIAHAssociate Professor of Commerce, Kanchi Mamunivar Centre for Post Graduate Studies
Affiliated to Pondicherry University, Puducherry, India, E. Mail: [email protected]
&
GOPINATHAN RADHIKAResearch Scholar in Commerce, Kanchi Mamunivar Centre for Post Graduate Studies
Affiliated to Pondicherry University,Puducherry, India, E.Mail:: [email protected]
ABSTRACT
Every organization, whether profit oriented or not, depending upon its size and nature of
business needs, requires Working Capital (WC). Efficient WC Management is an integral
component of the overall corporate strategy to create shareholders’ value. Sugar Industry
in India occupies an important place in the Indian Economy, providing employment to
nearly 7.5 million people, directly or indirectly, across the country, besides making the base
for over 50 million people for their livelihood from growing and supplying sugarcane,
which also contributes annually around Rs.50 billion by way of excise duty, cess, VAT, entry
tax and octroi. The present study is aimed at analyzing the relationship between the Working
Capital Management and the Profitability of Sugar Industry in India. It is proved that there
is a significant positive coefficient with CR, INV and ROI at 5% level. Also there is a
significant negative coefficient with QR, WCTR and ROI at 5% level. DTR has highly
significant negative coefficient at 1% level with ROI. CTR has insignificant positive coefficient
with profitability. The overall regression model fit is represented by R2, which is above 50%
(0.51).
Key words: Inventory Turnover Ratio (INV), Return on Investment (Profitability) (ROI),
Working Capital (WC), Working Capital Management (WCM), Working Capital Turnover
Ratio (WCTR), Debtors Turnover Ratio (DTR), Creditors Turnover Ratio (CTR), Current
Ratio (CR).
JEL Classification: G32, G30
1. Introduction
Working Capital (WC) is regarded as
the life blood of a business and it plays a pivotal
role in keeping the wheels of a business
enterprise running. However, the management
of WC is a delicate area in the field of financial
management as it involves frequent decision-
making. (Joginder Singh Dutta, 2000). Every
organization, whether profit oriented or not,
irrespective of its size and nature of business,
46
SMART Journal of Business Management Studies Vol. 8 No.2 July - December 2012
needs a requisite amount of WC. The efficient
management of WC is crucial as it decides the
survival, liquidity, solvency and profitability of the
business organization concerned
(Mukhopadhyya, 2004). WC Management
(WCM) is recognized as an important concern
of the financial manger due to many reasons. A
typical manufacturing firm’s current assets
account for over half of its total assets and for a
distribution company, they account for even
more. The maintenance of excessive levels of
current assets can easily result in a substandard
return on a firm’s investment. However, firms
with inadequate levels of current assets may
incur shortages of funds and have difficulties in
smoothly maintaining day–to- day operations.
Efficient WCM involves planning and controlling
current assets and current liabilities in a manner
that eliminates the risk of inability to meet due to
short term obligations on the one hand and avoid
excessive investment in these assets on the other
(Eljelly, 2004).
2. Importance of Efficient WCM
The importance of efficient WCM is
indisputable as the WC is the difference between
resources in cash or which are readily
convertible into cash (current assets) and
organizational commitments for which cash will
soon be required:
The level of current assets changes
constantly and regularly depending upon the
level of actual and forecasted sales. This
requires that the decision to bring the levels
of current assets should be made at the
earliest opportunity and as frequently as
required.
The changing levels of current assets may
also require review of the financing pattern.
Current assets usually represent a substantial
portion of the total assets of a firm, resulting
in the investment of large chunk of funds in
the current assets.
There is an obvious and inevitable relationship
between the growth of sales and the level of
current assets. The target sales level can be
achieved only if supported by adequate WC.
3. Profile of Sugar Industry in India
India is the second largest producer of
sugar, after Brazil, in the world. The Sugar
Industry occupies an important place in the Indian
Economy. Nearly 7.5 million people across the
country are directly or indirectly employed in the
industry and over 50 million people depend on
their livelihood from growing and supplying
sugarcane. The Sugar Industry contributes
annually around Rs. 50 billion by way of excise
duty, cess, VAT, entry tax and octroi. The
discovery of sugar from sugarcane originated in
New Guinea and spread to Southeast-Asia and
India. The Sugar Industry is the second largest
agro-based industry, next to textiles, in India.
Sugar is produced from sugarcane and sugar
beet. Approximately 70 per cent of sugar is
produced from sugarcane and 30 per cent is
produced from sugar beet. Sugarcane is grown
in semitropical region while beet is grown in
temperate climate. Sugar Industry is cyclical in
nature. Ethanol, a by product of sugar, can be
used as a bio-fuel alternative to gasoline and it is
widely used in cars in Brazil. Bagasse, also a by
product of sugar, can be used as a bio-fuel and
as a renewable resource in manufacturing pulp,
47
SMART Journal of Business Management Studies Vol. 8 No.2 July - December 2012
paper-products, building materials and also as a
renewable energy for power generation. Sugar
in India is a politicized industry. The Centre
determines statutory minimum price for
sugarcane. The Governments of most of the
States, in which sugarcane is cultivated, fixes
what is dubbed as the State Advised Price (SAP)
that Mills of the State have to pay to the farmers.
3. a. Sugar Prices
According to the Indian Sugar
Manufacturers Association (ISMA), the cost of
production in North India, where sugar recovery
from cane is about 9.5 per cent, works out to
Rs. 29 per kilogram, even after factoring in
returns from by products such as ethanol and
losses incurred on levy sugar supplies at a low
fixed price of Rs.18.50 per kilogram. When
Government discontinued free sugar exports,
sugar prices fell from an ex-factory price of
about Rs.30 per kilogram to Rs.28 per kilogram
in Uttar Pradesh and to Rs.26 per kilogram in
Maharashtra. Despite good output, sugar prices
are expected to stay firm in 2011. Traders,
Analysts and Millers expect the ex-mill prices
to remain in the range of Rs.34-35 per kilogram
and the gap between demand and supply is
expected to be narrow.
3. b. Steps for Production of Sugar
Extracting juice by pressing sugarcane
Boiling the juice to obtain crystals
Creating raw sugar by spinning crystals in
extract
Taking raw sugar to a refinery for the process
of filtering and washing to discard remaining
non-sugar elements and hue
Crystallizing and drying sugar
Packaging the ready sugar.
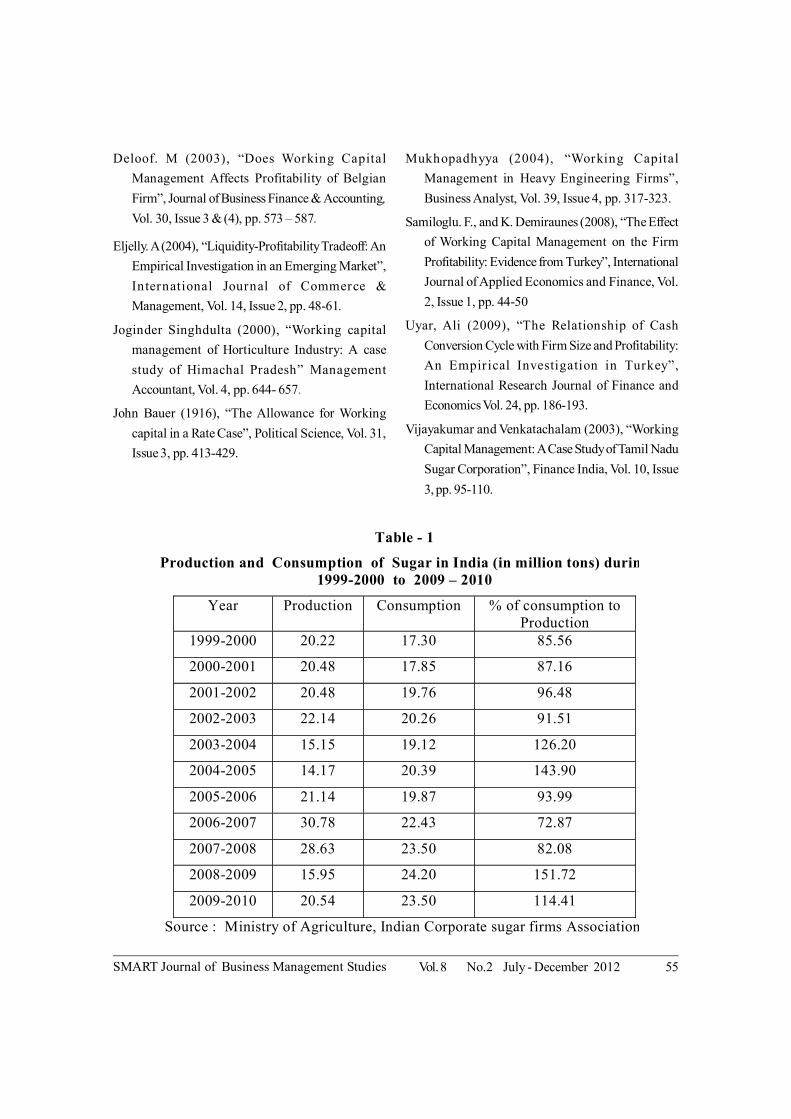
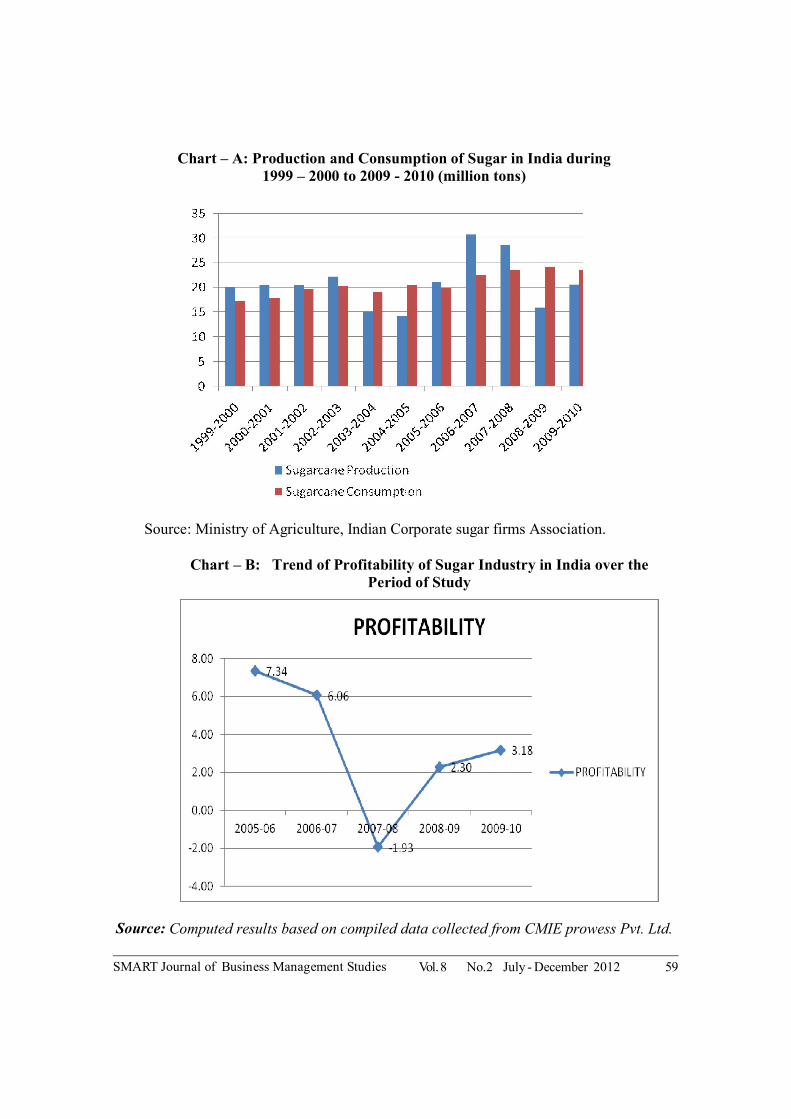
The production and consumption of sugar
in India during 1999-2000 to 2009 – 2010 are
shown in Table -1 and Chart – A. There was a
decline in consumption of sugar when compared
to the sugar production. For example, during the
period 2005-06 to 2007-08, the consumption of
sugar came down from 143.90% to 82.08%;
from 151.72% in 2008 – 09 to 114.41% in 2009
– 10 while the production had started to resurge
in 2008-2010 and it is likely to gain strongly in
2011-12. The trend of production and
consumption of sugar in India reveals that the
consumption surpasses the production, giving
room for scaling up of the sugar production as
well the opportunity to import sugar for domestic
consumption. The consumption price will
drastically rise in the years to come unless some
serious measures are taken by the policy makers
in this regard.
4. Literature Review
WCM is a very sensitive area in the field
of financial management. It involves the
quantification of various components of WC and
combination of Current Assets (CAs) and the
financing of these assets. Before entering into
the empirical study, we may throw a little light
on the existing literature on the Management of
Working Capital. During the last few decades,
several studies have been conducted, both in
India as well as abroad, regarding the various
aspects of Working Capital Management. A brief
explanation of some of the studies is shown
below.
48
SMART Journal of Business Management Studies Vol. 8 No.2 July - December 2012
The literature work on WCM was
pioneered by John Bauer (1916). He examined
the pattern of operating revenue for a year and
found that the average time taken by consumers
for paying service was two months. The
operating revenue for this period was $2, 00,000
and the expenses incurred were $1, 20,000. This
contributed to the necessity of Working Capital.
If the company is a new one, with its actual fixed
capital and volume of business, it would
practically have to provide this amount in its initial
investment. Thus, the company actually has to
tie up this sum in the business, which in turn
earns a return on the amount. Vijayakumar and
Venkatachalam (2003), in their paper entitled,
“Working Capital Management: A case study
of Tamil Nadu Sugar Corporation”, indicated a
moderate trend in the financial position and the
utilization of WC. They also suggested that
attempts should be made to use funds more
effectively to keep an optimum level of WC since
holding more current assets causes reduction in
profitability. Deloof (2003) evaluated WC
management effect on the profitability of
selected Belgian firms and stated that there are
companies which have large amount of cash
invested in WC and there is a significant negative
relation between gross operating income and the
number of days, accounts receivable, inventories
and accounts payable of firms. The study
suggested that the managers could create value
for the shareholders by reducing the number of
days for accounts receivable and inventories to
a reasonable level. The negative relation
between accounts payable and profitability is
consistent with the view that less profitable
companies wait longer to pay their bills.
Samiloglu and Demiraunes (2008), in their
study, “The effect of WC management on the
firm profitability in Turkey firms”, analyzed the
effect of WC management on the profitability
of the firms. They found that the accounts
receivable period, inventory period and leverage
affect the profitability of the firm negatively while
growth affects the firms’ profitability positively.
Uyar (2009), in his paper titled, “The
relationship of Cash Conversion Cycle (CCC)
with firm size and profitability: An empirical
investigation of Turkey firms”, examined the
industry benchmarks for CCC of merchandising
and manufacturing companies and found that
merchandising industry has shorter CCC than
manufacturing industries. Further, the study
examined the relationship between the length of
the CCC and the size of the firms and indicated
a significant negative correlation between the
length of CCC and the firm size, in terms of
both net sales and total assets. The study further
showed significant negative correlation between
the length of CCC and profitability. Azhagaiah
and Muralidharan (2009), in their paper entitled,
“The relationship between working capital
management efficiency and EBIT”, analysed
the relationship between working capital
management efficiency and earnings before
interest & taxes of the Paper Industry in India
during 1997–1998 to 2005–2006. To measure
the WCME, three index values viz.,
Performance Index, Utilization Index, and
Efficiency Index were computed and associated
with explanatory variables. Further, fixed
financial assets ratio, financial debt ratio and size
are considered as control variables in the analysis
and are associated with the EBIT. The study
49
SMART Journal of Business Management Studies Vol. 8 No.2 July - December 2012
reveals that the Paper Industry had managed
the WC satisfactorily. The accounts payable
period has a signifi cant negative relationship
with EBIT, which indicates that by deploying
payment to suppliers, they improve the EBIT.
Chinta Venkateswara Rao et al., (2010), in
their study, “Financial management focus on
working capital utilization in the Indian Cotton
Textile Industry: Methodological Analysis,”
analyzed the trends and patterns of efficiency
of WC utilization in respect of size of firms of
cotton textile sector in India by the application
of three indices viz., Performance Index (PI),
Utilization Index (UI), and Efficiency Index
(EI). The study reveals that Linear Growth Rate
(LGR) of PI, UI and EI in respect of WC
efficiency for small size firms is significant while
in the case of the medium size firms, the trend
of UI alone is significant. The trend of PI, EI
and UI for large size firms is insignificant.
After a thorough understanding of the
various studies undertaken by different authors
and the research techniques used for analyzing
the data on working capital management
determinants, efficiency, and working capital
utilization, relationship with cash conversion
cycle with firm size and profitability, the
Researcher has taken up the work of analyzing
data to study the impact of working capital
management ratios on profitability with regard
to listed Sugar Industry in India.
5. Significance of the Study
The study proposes to identify the impact
of WCM on profitability through empirical
analysis across Sugar Industry in India. Efficient
Management of WC is a fundamental part of
the overall corporate strategy in creating the
shareholders’ value. Today, management of WC
is one of the most important and challenging
aspects of the overall financial management.
Optimization of WC balance means minimizing
the WC requirements and realizing maximum
possible revenues. Efficient WCM increases
firm’s growth opportunities and returns to
shareholders. Very few studies have been made
on WCM relating it to profitability, that too in
Sugar Industry in India. Therefore, the present
study is a maiden attempt to analyze the impact
of WCM on Profitability of Sugar Industry in
India.
6. Objectives of the Study
To analyze the growth trend of returns on
investment (profitability) of sugar industry in
India over the period under study.
To analyze the determinants of profitability
by examining the sensitivity of returns on
investment (profitability) to changes in the
level of working capital of the corporate firms
in sugar industry in India.
7. Hypotheses Development
NH1: There is no significant relationship
between current ratio, liquid ratio, inventory
turnover ratio and profitability.
NH2: There is no significant relationship
between working capital turnover ratio as
well as debtors’ turnover ratio and
profitability.
NH3: There is no significant relationship
between cash turnover ratio and profitability.
50
SMART Journal of Business Management Studies Vol. 8 No.2 July - December 2012
8. Research Methodology
The purpose of the present study is to
contribute to a very important aspect of financial
management known as WCM, with reference
to Sugar Industry in India. The study tries to
provide new insights into the existing literature
in the field of finance, particularly the impact of
WCM on profitability. This research deals with
the analytical framework of data analysis, which
describes the industry and variables included in
the study, the distribution patterns of data and
statistical techniques employed in investigating
the relationship between WCM and profitability.
8. a. Data Collection and Period of the Study
Since the study is based on financial
data, the main sources of data were financial
statements such as balance sheets, income
statements of listed corporate firms for the period
from 2005-2010, which were collected from
secondary sources i.e., annual reports of the
company, CMIE prowess database and from
different websites concerned.
The data used for the study are related
to the selected Sugar Industry in India for a period
of five years, on a year to year basis, ranging
from 2005-2010. There are two basic reasons
behind the selection of the period as the period
of study:
This period relates to the post- liberalization
era of the Indian Economy.
This is the period for which the maximum
financial data were available in the database.
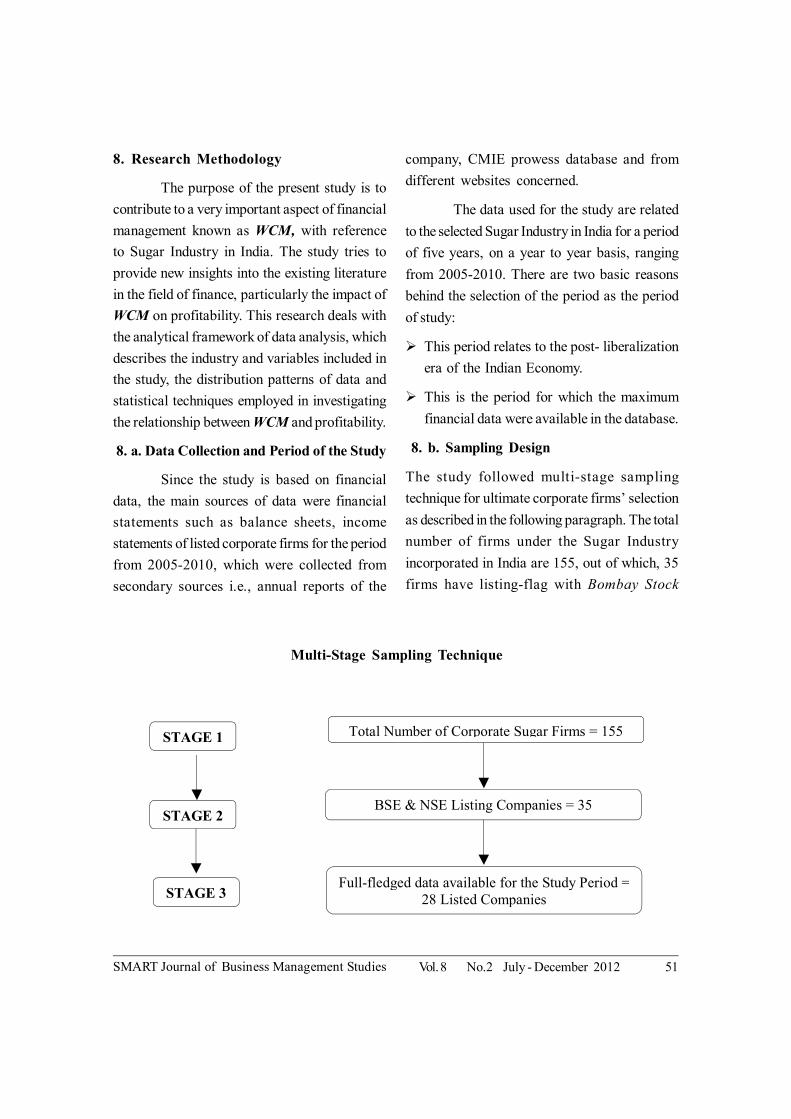
8. b. Sampling Design
The study followed multi-stage sampling
technique for ultimate corporate firms’ selection
as described in the following paragraph. The total
number of firms under the Sugar Industry
incorporated in India are 155, out of which, 35
firms have listing-flag with Bombay Stock
Total Number of Corporate Sugar Firms = 155
BSE & NSE Listing Companies = 35
Full-fledged data available for the Study Period = 28 Listed Companies
STAGE 1
STAGE 2
STAGE 3
Multi-Stage Sampling Technique
51
SMART Journal of Business Management Studies Vol. 8 No.2 July - December 2012
Exchange as well as with National Stock
Exchange. However, full-fledged data required
for the study were available for 28 corporate
firms only. Hence the final sample units
constitute 28 corporate firms of Sugar Industry
in India.
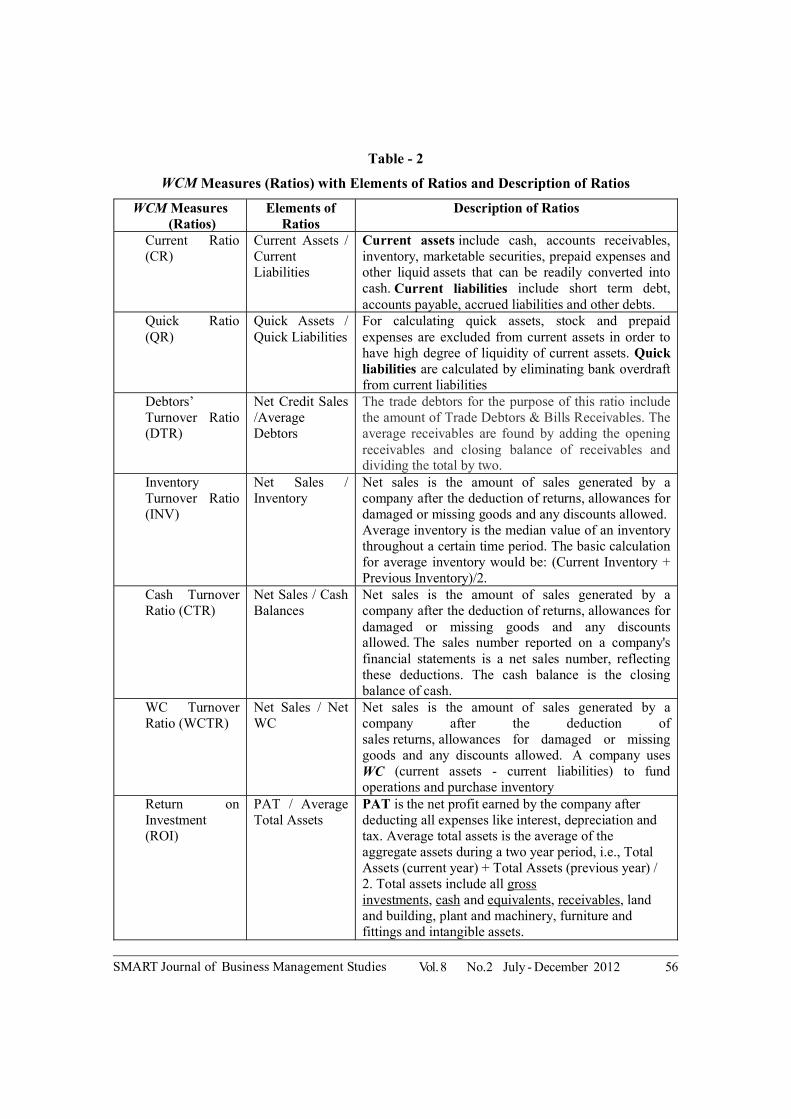
8. c. Research Methods
WCM Measures (Ratios)
For measuring the WCM, simple mathematical
tool, viz ratio, was extensively used. The ratios
relating to WCM, which have been computed
and used for the analysis, are shown in Table-2.
Regression Analysis
ROI = b0 + b
1CR + b
2QR + b
3WCTR +b
4DTR
+ b5CTR + b
6INV
Where b0 = constant
b1……
b6 = estimated coefficients
CR = Current Ratio
QR = Quick Ratio
WCTR = WC Turnover Ratio
DTR = Debtors Turnover Ratio
CTR = Creditors Turnover Ratio
INV = Inventory Turnover Ratio
9. Analysis and Interpretation
Chart-B shows that there was a steep
fall in profitability of Sugar corporate firms during
the year 2007-08 and afterwards there was a
rise in the profitability during the following years.
Some sample units recorded negative value in
the year 2008 and 2009 because the sugar prices
doubled over the years. Particularly in 2008-
2009, a larger part of the sugarcane was used
for making gur than in the earlier years so that
the world sugar production went down when
compared to the earlier season. The world sugar
balance for the period from October 2008 to
September 2009 puts world production at 16-
16.5 million tonnes, which was lower than the
world consumption of 20-22 million tonnes. Thus,
the distinctive global surplus phase ended and
the market moved into a deficit phase during
this period.
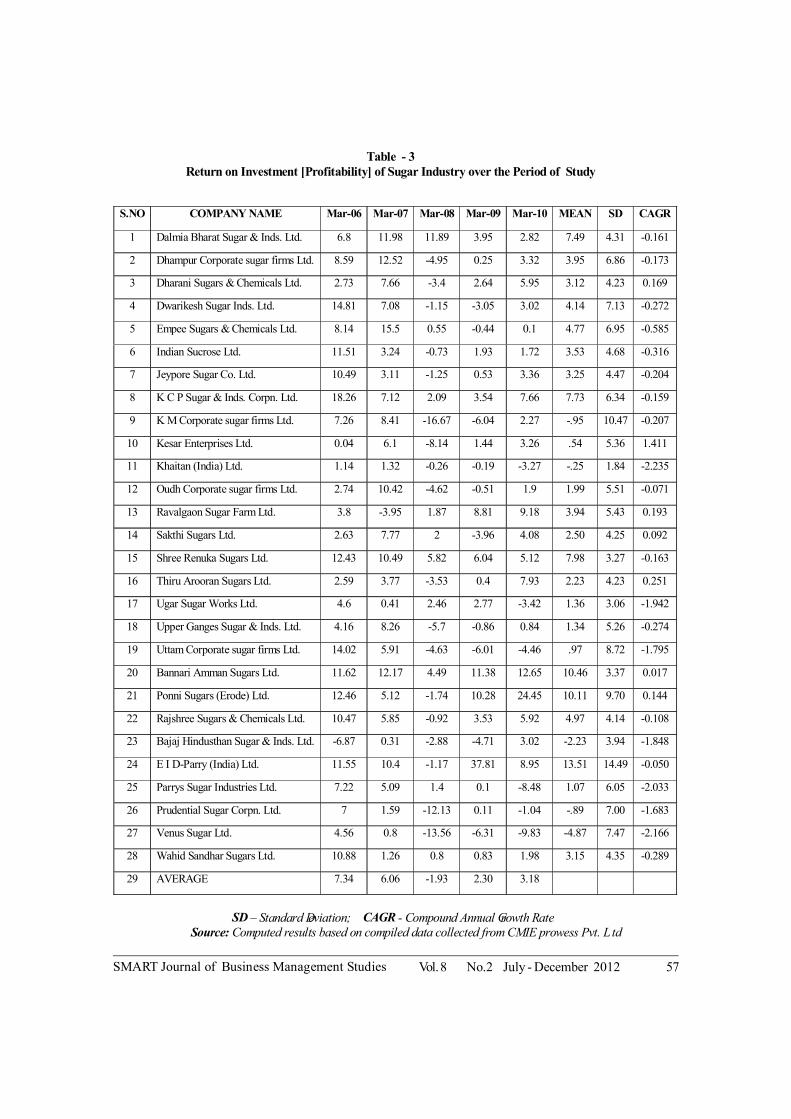
Table 3 shows that the overall profitability of
sample units in Sugar Industry was quite good
and the mean profitability of most of the
companies was positive over the years under
study. Even though EID Parry recorded the
highest mean profitability (13.51), its
Compounded Annual Growth Rate (CAGR) was
negative [-0.050] because its profitability was
fluctuating over the period under study. Bannari
Amman Sugars Ltd and Ponni Sugars Ltd,
recorded the next most highest mean profitability
(10.46 and 10.11) and the CAGR was positive
(0.017 and 0.144), indicating that the corporate
firms were able to maintain better profitability
level without any fluctuation over the years of
study.
The deviation of profitability was higher
in EID Parry (13.51) from the highest mean
profitability when compared with the other
companies. The KM Sugar Mill shows the next
highest deviation due to a lot of fluctuations and
negative values over the period 2008-2009 and
its mean profitability and CAGR was negative.
It is better to have lesser deviation in the
profitability level.
52
SMART Journal of Business Management Studies Vol. 8 No.2 July - December 2012
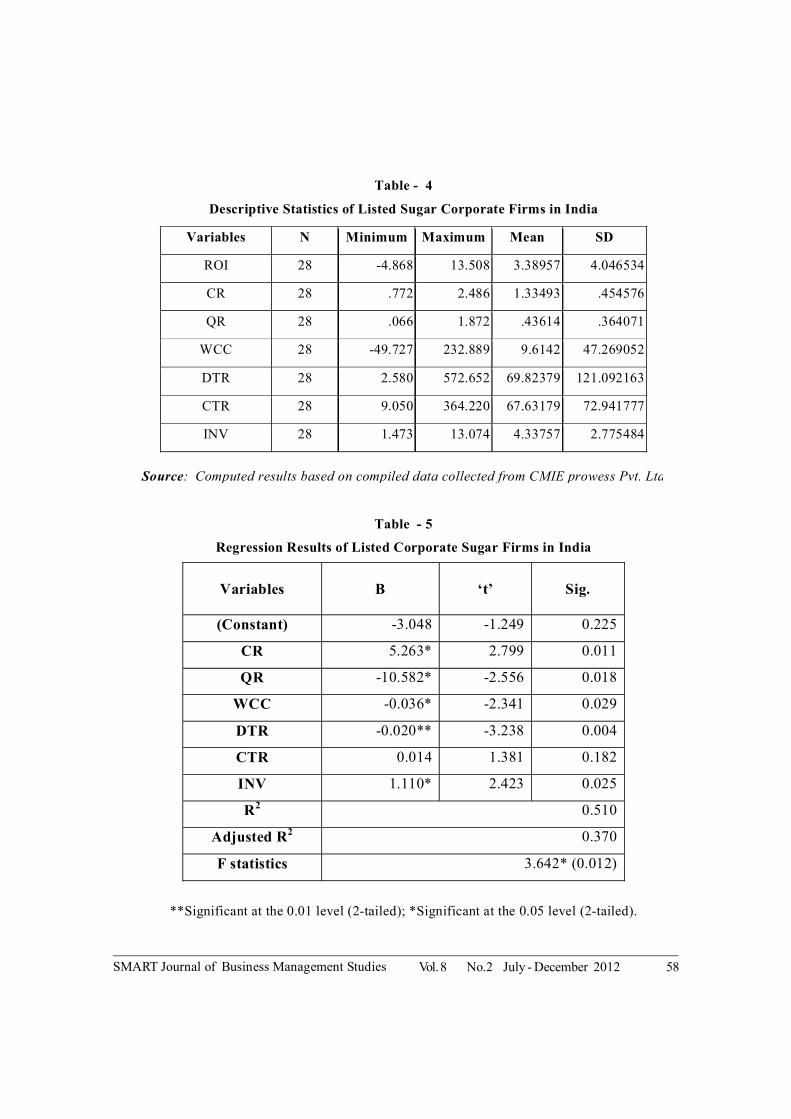
The Descriptive Statistics (see Table- 4)
shows that Debtors’ Turnover Ratio (DTR)
recorded the highest mean value. The standard
deviation from the mean was also high. The
DTRs also recorded higher standard deviation,
indicating that the debt collection period varied
highly within the industry. Creditors’ Turnover
Ratio (CTR) also registered high standard
deviation but the Current Ratio (CR) and the
Quick Ratio (QR) recorded low standard
deviation from the mean value, indicating that
there was not much of variation in the level of
CAs and Quick Assets (QAs)
Table-5 shows that CR experienced
significant positive coefficient (5.263) at 5% level
with Return On Investment (ROI), indicating
that higher CR increased the ROI and vice versa,
whereas QR experienced significant negative
coefficient (-10.582) at 5% level with ROI,
indicating that maintaining assets in terms of
ready cash, did not help in increasing profitability.
Hence it is better for the Sugar Industry to
maintain a lesser amount of ready cash and to
invest the money for productive purpose, which
ultimately increases the profitability. INV also
recorded significant positive coefficient (1.11)
at 5% level with ROI, which shows that as the
inventory decreased, the profitability of the
industry also increased over the period of study.
Hence, NH1: “There is no significant
relationship between current ratio, liquid
ratio as well as inventory turnover ratio and
profitability,” is rejected (5.263 0.05
with positive
relationship, -10.582 0.05
with negative
relationship and 1.11 0.05
with positive relationship
respectively for current ratio, liquid ratio and
inventory turnover ratio with profitability).
Working Capital Turnover Ratio
(WCTR) recorded significant negative
coefficient (-0.036) at 5% level with ROI, which
means that companies maintained a larger
proportion of net WC when compared to the
sales. Debtors’ Turnover Ratio (DTR) recorded
highly significant negative coefficient (-0.020)
at 1% level with ROI, indicating that longer the
period between credit sales and cash collection,
greater profitability of the industry. Hence, NH2:
“There is no significant relationship
between WCTR as well as DTR and
profitability,” is rejected (-0.036 0.05
and -0.020
0.01 with negative relationship respectively for
DTR as well as WCTR with profitability).
CTR recorded insignificant positive
coefficient (0.014) with profitability. Hence
NH3: “There is no significant relationship
between cash turnover ratio and
profitability”, is rejected.
The overall regression model fit, which
is represented by R2, is above 50% (0.51), which
shows that the explaining variables determine
more than 50% of the changes in profitability. F
stat (3.642*) is significant @ 5% level, indicating
that the variance in the dependent variable is
explained by the variance in the independent
variable.
10. Limitations and Scope for Further
Studies
The analysis was limited to five years only
(i.e. from 2005- 2010) and hence a detailed
trend covering a longer period could not be
made.
The study was based on secondary data
which were collected from CMIE Prowess.
53
SMART Journal of Business Management Studies Vol. 8 No.2 July - December 2012
The quality of the study depends purely on
the accuracy, reliability and quality of
secondary data source.
The study was limited to 28 corporate firms
of Sugar Industry in India and hence the
accuracy of results is purely based on the
data of sample firms for the study.
WCM is an important component of corporate
financial management but it has not been
recognized in financial literature unlike capital
structure, capital budgeting and dividend policies.
Because of this reason, the valid research
relating to WCM is found to be scanty in India.
Hence there is much to be done about WCM in
India and the following areas offer scope for
further studies.
Further research could be carried out on the
same area with a larger number of sample
companies, lengthening the years of study,
by referring to other data source like Capital
Plus etc.
Study on small and medium sized companies
could be undertaken by taking large sample,
covering more number of years.
Also studies of WCM in different sectors and
companies between sectors and cross sectors
would add to the existing literature.
11. Concluding Remarks
There is a significant positive coefficient
between CR and ROI (5.263), INV and ROI
(1.110) at 5% level. Also there is a significant
negative coefficient between QR and ROI (-
10.582), WCC and ROI (-0.036) at 5% level.
DTR recorded highly significant negative
coefficient (-0.020) at 1% level with ROI. CTR
registered insignificant positive coefficient
(0.014) with profitability. The overall regression
model fit, which is represented by R2, is above
50% (0.51). After the downtrend in the last two
years of the study period, the Sugar Industry in
India is poised to reap a rich harvest in the season
beginning October 2010. The sugar production
in the country experienced an increase in 2010-
11 against 19 million tonnes in 2009-10. The
production of sugarcane is cyclical in nature.
Hence the sugar production is also cyclical as it
depends on the sugarcane production in the
country. Dual Pricing System is adopted in Sugar
Industry in India, which includes sugar price in
the public distribution system and the free sale
sugar price. The sugar corporate firms are
overburdened with surplus inventories that most
of them do not have adequate storage facilities,
capacities and cash flows, which have led them
to resort to distress sale of sugar, which only
brings down the prices. There are more by-
products produced by sugarcane like ethanol,
molasses (used by breweries), biogases (used
by co-generation plants) and the remaining are
utilized by the gur and khandsari sectors.
References
Azhagaiah. R. and J. Muralidharan (2009), “The
Relationship between Working Capital
Management E?ciency and EBIT”. Managing
Global Transitions: International Research
Journal, Vol. 7, Issue 1, pp. 61–74.
ChintaVenkateswara Roa., ChandraSekhara Roa and
R. Azhagaiah (2010), “Financial Management
Focus on Working Capital Utilization in the Indian
Cotton Textile Industry: Methodological
Analysis”, Journal of Financial Management and
Analysis: International Review of Finance, Vol.23,
No.2, (July – December), pp.63-84.
54
SMART Journal of Business Management Studies Vol. 8 No.2 July - December 2012
Deloof. M (2003), “Does Working Capital
Management Affects Profitability of Belgian
Firm”, Journal of Business Finance & Accounting,
Vol. 30, Issue 3 & (4), pp. 573 – 587.
Eljelly. A (2004), “Liquidity-Profitability Tradeoff: An
Empirical Investigation in an Emerging Market”,
International Journal of Commerce &
Management, Vol. 14, Issue 2, pp. 48-61.
Joginder Singhdulta (2000), “Working capital
management of Horticulture Industry: A case
study of Himachal Pradesh” Management
Accountant, Vol. 4, pp. 644- 657.
John Bauer (1916), “The Allowance for Working
capital in a Rate Case”, Political Science, Vol. 31,
Issue 3, pp. 413-429.
Mukhopadhyya (2004), “Working Capital
Management in Heavy Engineering Firms”,
Business Analyst, Vol. 39, Issue 4, pp. 317-323.
Samiloglu. F., and K. Demiraunes (2008), “The Effect
of Working Capital Management on the Firm
Profitability: Evidence from Turkey”, International
Journal of Applied Economics and Finance, Vol.
2, Issue 1, pp. 44-50
Uyar, Ali (2009), “The Relationship of Cash
Conversion Cycle with Firm Size and Profitability:
An Empirical Investigation in Turkey”,
International Research Journal of Finance and
Economics Vol. 24, pp. 186-193.
Vijayakumar and Venkatachalam (2003), “Working
Capital Management: A Case Study of Tamil Nadu
Sugar Corporation”, Finance India, Vol. 10, Issue
3, pp. 95-110.
Table - 1
Production and Consumption of Sugar in India (in million tons) during 1999-2000 to 2009 – 2010
Year Production Consumption % of consumption to Production
1999-2000 20.22 17.30 85.56
2000-2001 20.48 17.85 87.16
2001-2002 20.48 19.76 96.48
2002-2003 22.14 20.26 91.51
2003-2004 15.15 19.12 126.20
2004-2005 14.17 20.39 143.90
2005-2006 21.14 19.87 93.99
2006-2007 30.78 22.43 72.87
2007-2008 28.63 23.50 82.08
2008-2009 15.95 24.20 151.72
2009-2010 20.54 23.50 114.41
Source : Ministry of Agriculture, Indian Corporate sugar firms Association.
55
SMART Journal of Business Management Studies Vol. 8 No.2 July - December 2012
Table - 2
WCM Measures (Ratios) with Elements of Ratios and Description of Ratios
WCM Measures (Ratios)
Elements of Ratios
Description of Ratios
Current Ratio (CR)
Current Assets / Current Liabilities
Current assets include cash, accounts receivables, inventory, marketable securities, prepaid expenses and other liquid assets that can be readily converted into cash. Current liabilities include short term debt, accounts payable, accrued liabilities and other debts.
Quick Ratio (QR)
Quick Assets / Quick Liabilities
For calculating quick assets, stock and prepaid expenses are excluded from current assets in order to have high degree of liquidity of current assets. Quick liabilities are calculated by eliminating bank overdraft from current liabilities
Debtors’ Turnover Ratio (DTR)
Net Credit Sales /Average Debtors
The trade debtors for the purpose of this ratio include the amount of Trade Debtors & Bills Receivables. The average receivables are found by adding the opening receivables and closing balance of receivables and dividing the total by two.
Inventory Turnover Ratio (INV)
Net Sales / Inventory
Net sales is the amount of sales generated by a company after the deduction of returns, allowances for damaged or missing goods and any discounts allowed. Average inventory is the median value of an inventory throughout a certain time period. The basic calculation for average inventory would be: (Current Inventory + Previous Inventory)/2.
Cash Turnover Ratio (CTR)
Net Sales / Cash Balances
Net sales is the amount of sales generated by a company after the deduction of returns, allowances for damaged or missing goods and any discounts allowed. The sales number reported on a company's financial statements is a net sales number, reflecting these deductions. The cash balance is the closing balance of cash.
WC Turnover Ratio (WCTR)
Net Sales / Net WC
Net sales is the amount of sales generated by a company after the deduction of sales returns, allowances for damaged or missing goods and any discounts allowed. A company uses WC (current assets - current liabilities) to fund operations and purchase inventory
Return on Investment (ROI)
PAT / Average Total Assets
PAT is the net profit earned by the company after deducting all expenses like interest, depreciation and tax. Average total assets is the average of the aggregate assets during a two year period, i.e., Total Assets (current year) + Total Assets (previous year) / 2. Total assets include all gross investments, cash and equivalents, receivables, land and building, plant and machinery, furniture and fittings and intangible assets.
56
SMART Journal of Business Management Studies Vol. 8 No.2 July - December 2012
Table - 3 Return on Investment [Profitability] of Sugar Industry over the Period of Study
SD – Standard eviationD CAGR ; Compound Annual -rowth Rate
Source: Computed results based on compiled data collected from CMIE prowess Pvt. Gtd
S.NO COMPANY NAME Mar-06 Mar-07 Mar-08 Mar-09 Mar-10 MEAN SD CAGR
1 Dalmia Bharat Sugar & Inds. Ltd. 6.8 11.98 11.89 3.95 2.82 7.49 4.31 -0.161
2 Dhampur Corporate sugar firms Ltd. 8.59 12.52 -4.95 0.25 3.32 3.95 6.86 -0.173
3 Dharani Sugars & Chemicals Ltd. 2.73 7.66 -3.4 2.64 5.95 3.12 4.23 0.169
4 Dwarikesh Sugar Inds. Ltd. 14.81 7.08 -1.15 -3.05 3.02 4.14 7.13 -0.272
5 Empee Sugars & Chemicals Ltd. 8.14 15.5 0.55 -0.44 0.1 4.77 6.95 -0.585
6 Indian Sucrose Ltd. 11.51 3.24 -0.73 1.93 1.72 3.53 4.68 -0.316
7 Jeypore Sugar Co. Ltd. 10.49 3.11 -1.25 0.53 3.36 3.25 4.47 -0.204
8 K C P Sugar & Inds. Corpn. Ltd. 18.26 7.12 2.09 3.54 7.66 7.73 6.34 -0.159
9 K M Corporate sugar firms Ltd. 7.26 8.41 -16.67 -6.04 2.27 -.95 10.47 -0.207
10 Kesar Enterprises Ltd. 0.04 6.1 -8.14 1.44 3.26 .54 5.36 1.411
11 Khaitan (India) Ltd. 1.14 1.32 -0.26 -0.19 -3.27 -.25 1.84 -2.235
12 Oudh Corporate sugar firms Ltd. 2.74 10.42 -4.62 -0.51 1.9 1.99 5.51 -0.071
13 Ravalgaon Sugar Farm Ltd. 3.8 -3.95 1.87 8.81 9.18 3.94 5.43 0.193
14 Sakthi Sugars Ltd. 2.63 7.77 2 -3.96 4.08 2.50 4.25 0.092
15 Shree Renuka Sugars Ltd. 12.43 10.49 5.82 6.04 5.12 7.98 3.27 -0.163
16 Thiru Arooran Sugars Ltd. 2.59 3.77 -3.53 0.4 7.93 2.23 4.23 0.251
17 Ugar Sugar Works Ltd. 4.6 0.41 2.46 2.77 -3.42 1.36 3.06 -1.942
18 Upper Ganges Sugar & Inds. Ltd. 4.16 8.26 -5.7 -0.86 0.84 1.34 5.26 -0.274
19 Uttam Corporate sugar firms Ltd. 14.02 5.91 -4.63 -6.01 -4.46 .97 8.72 -1.795
20 Bannari Amman Sugars Ltd. 11.62 12.17 4.49 11.38 12.65 10.46 3.37 0.017
21 Ponni Sugars (Erode) Ltd. 12.46 5.12 -1.74 10.28 24.45 10.11 9.70 0.144
22 Rajshree Sugars & Chemicals Ltd. 10.47 5.85 -0.92 3.53 5.92 4.97 4.14 -0.108
23 Bajaj Hindusthan Sugar & Inds. Ltd. -6.87 0.31 -2.88 -4.71 3.02 -2.23 3.94 -1.848
24 E I D-Parry (India) Ltd. 11.55 10.4 -1.17 37.81 8.95 13.51 14.49 -0.050
25 Parrys Sugar Industries Ltd. 7.22 5.09 1.4 0.1 -8.48 1.07 6.05 -2.033
26 Prudential Sugar Corpn. Ltd. 7 1.59 -12.13 0.11 -1.04 -.89 7.00 -1.683
27 Venus Sugar Ltd. 4.56 0.8 -13.56 -6.31 -9.83 -4.87 7.47 -2.166
28 Wahid Sandhar Sugars Ltd. 10.88 1.26 0.8 0.83 1.98 3.15 4.35 -0.289
29 AVERAGE 7.34 6.06 -1.93 2.30 3.18
57
SMART Journal of Business Management Studies Vol. 8 No.2 July - December 2012
Table - 4
Descriptive Statistics of Listed Sugar Corporate Firms in India
Variables N Minimum Maximum Mean SD
ROI 28 -4.868 13.508 3.38957 4.046534
CR 28 .772 2.486 1.33493 .454576
QR 28 .066 1.872 .43614 .364071
WCC 28 -49.727 232.889 9.6142 47.269052
DTR 28 2.580 572.652 69.82379 121.092163
CTR 28 9.050 364.220 67.63179 72.941777
INV 28 1.473 13.074 4.33757 2.775484
SourceL Computed results based on compiled data collected from CMIE prowess Pvt. Gtd.
Table - 5
Regression Results of Listed Corporate Sugar Firms in India
Variables
B
‘t’ Sig.
(Constant) -3.048 -1.249 0.225
CR 5.263* 2.799 0.011
QR -10.582* -2.556 0.018
WCC -0.036* -2.341 0.029
DTR -0.020** -3.238 0.004
CTR 0.014 1.381 0.182
INV 1.110* 2.423 0.025
R2 0.510
Adjusted R2 0.370
F statistics 3.642* (0.012)
**Significant at the 0.01 level (2-tailed); *Significant at the 0.05 level (2-tailed).
58
SMART Journal of Business Management Studies Vol. 8 No.2 July - December 2012
Chart – A: Production and Consumption of Sugar in India during 1999 – 2000 to 2009 - 2010 (million tons)
Source: Ministry of Agriculture, Indian Corporate sugar firms Association.
Chart – B: Trend of Profitability of Sugar Industry in India over the
Period of Study
Source: Computed results based on compiled data collected from CMIE prowess Pvt. Gtd.
59