Embed Size (px)
Citation preview
2012 Smart Grid R&D Program Peer Review Meeting
Real-Time Distribution Feeder Performance Monitoring, Advisory Control, and Health
Management System
James StoupisABB Inc., US Corporate Research Center
June 7, 2012
December 2008
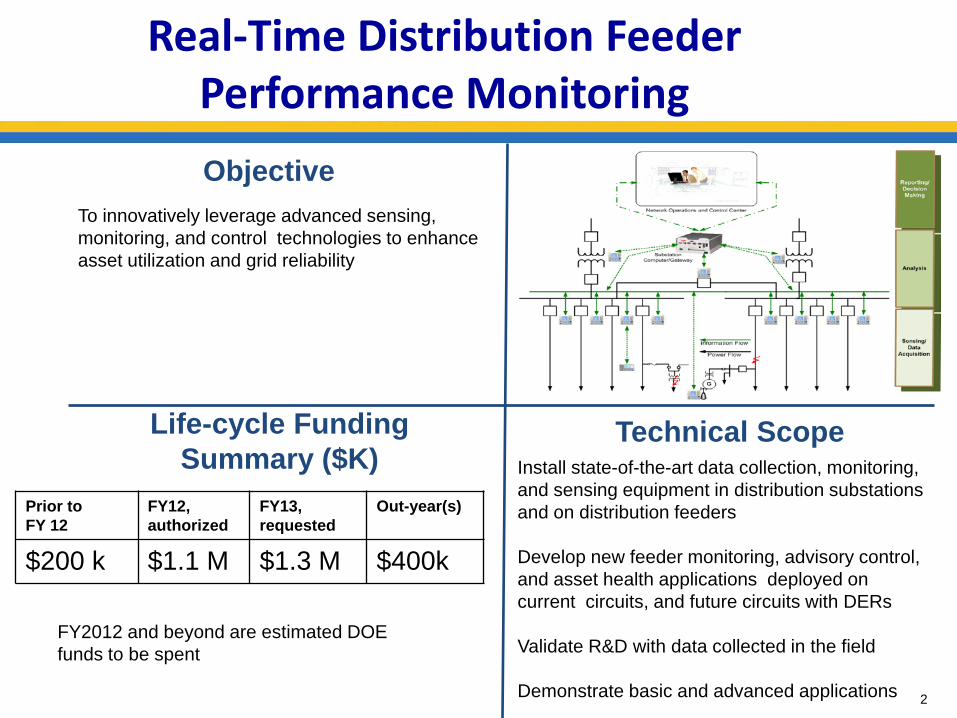
Real-Time Distribution Feeder Performance MonitoringObjective
Life-cycle Funding Summary ($K)
Prior to FY 12
FY12, authorized
FY13, requested
Out-year(s)
$200 k $1.1 M $1.3 M $400k
Technical Scope
To innovatively leverage advanced sensing, monitoring, and control technologies to enhance asset utilization and grid reliability
Install state-of-the-art data collection, monitoring, and sensing equipment in distribution substations and on distribution feeders
Develop new feeder monitoring, advisory control, and asset health applications deployed on current circuits, and future circuits with DERs
Validate R&D with data collected in the field
Demonstrate basic and advanced applications 2
FY2012 and beyond are estimated DOE funds to be spent
December 2008
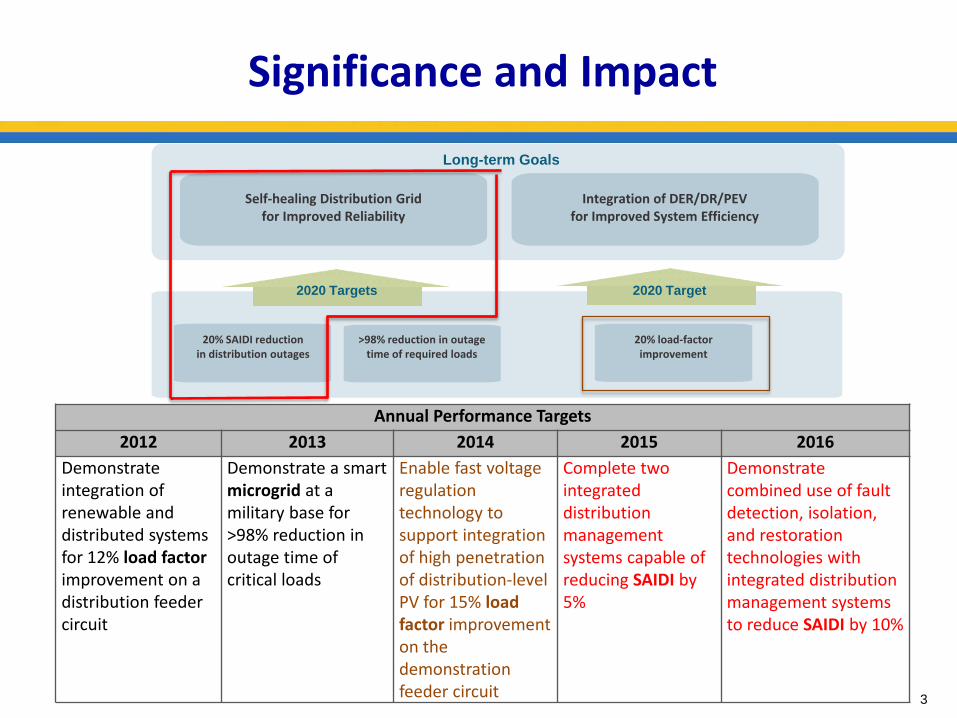
Significance and Impact
3
Self-healing Distribution Grid for Improved Reliability
Integration of DER/DR/PEVfor Improved System Efficiency
Long-term Goals
2020 Targets
>98% reduction in outage time of required loads
20% load-factorimprovement
20% SAIDI reductionin distribution outages
2020 Target
Annual Performance Targets2012 2013 2014 2015 2016
Demonstrate integration of renewable and distributed systems for 12% load factor improvement on a distribution feeder circuit
Demonstrate a smart microgrid at a military base for >98% reduction in outage time of critical loads
Enable fast voltage regulation technology to support integration of high penetration of distribution-level PV for 15% load factor improvement on the demonstration feeder circuit
Complete two integrated distribution management systems capable of reducing SAIDI by 5%
Demonstrate combined use of fault detection, isolation, and restoration technologies with integrated distribution management systems to reduce SAIDI by 10%
December 2008
Significance and Impact
4
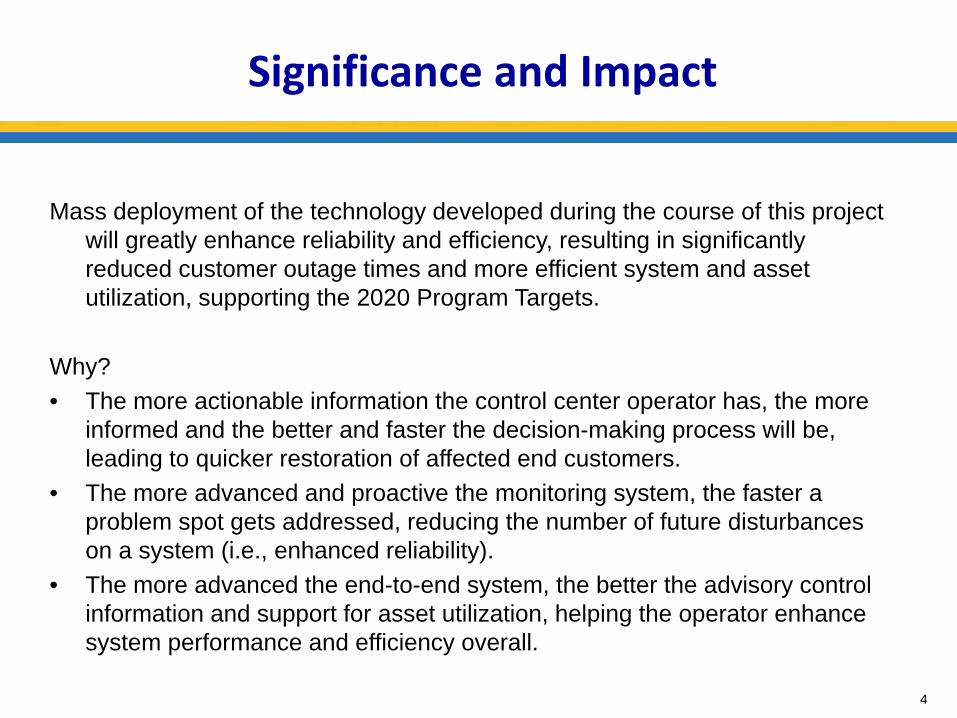
Mass deployment of the technology developed during the course of this project will greatly enhance reliability and efficiency, resulting in significantly reduced customer outage times and more efficient system and asset utilization, supporting the 2020 Program Targets.
Why?• The more actionable information the control center operator has, the more
informed and the better and faster the decision-making process will be, leading to quicker restoration of affected end customers.
• The more advanced and proactive the monitoring system, the faster aproblem spot gets addressed, reducing the number of future disturbances on a system (i.e., enhanced reliability).
• The more advanced the end-to-end system, the better the advisory control information and support for asset utilization, helping the operator enhance system performance and efficiency overall.
December 2008
Significance and Impact
5
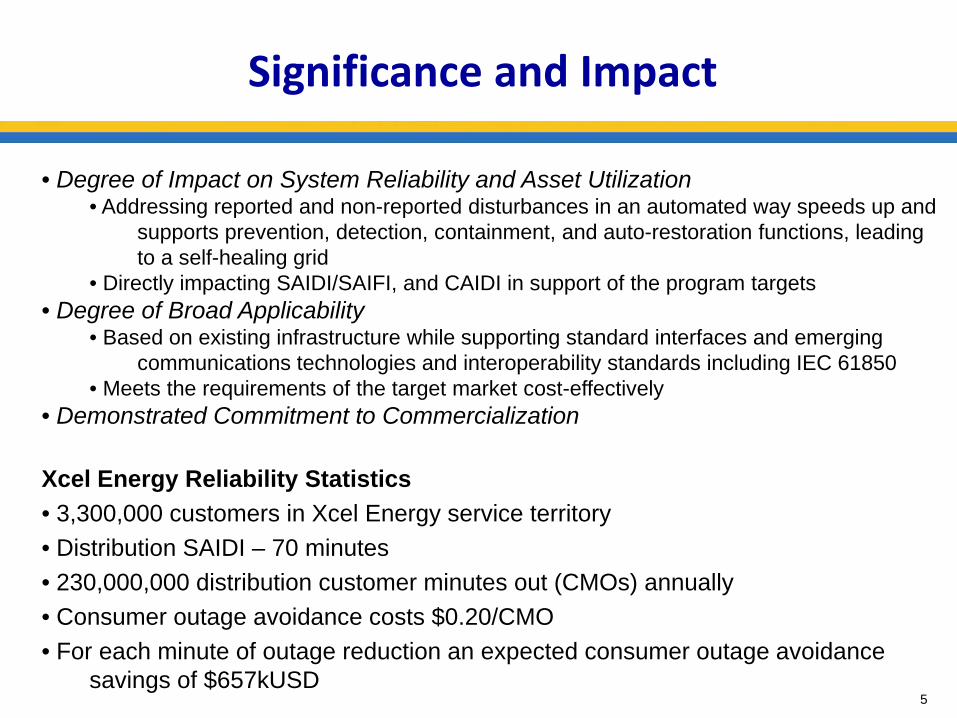
• Degree of Impact on System Reliability and Asset Utilization • Addressing reported and non-reported disturbances in an automated way speeds up and
supports prevention, detection, containment, and auto-restoration functions, leading to a self-healing grid
• Directly impacting SAIDI/SAIFI, and CAIDI in support of the program targets• Degree of Broad Applicability
• Based on existing infrastructure while supporting standard interfaces and emerging communications technologies and interoperability standards including IEC 61850
• Meets the requirements of the target market cost-effectively• Demonstrated Commitment to Commercialization
Xcel Energy Reliability Statistics• 3,300,000 customers in Xcel Energy service territory• Distribution SAIDI – 70 minutes• 230,000,000 distribution customer minutes out (CMOs) annually• Consumer outage avoidance costs $0.20/CMO• For each minute of outage reduction an expected consumer outage avoidance
savings of $657kUSD
December 2008
Technical Approach & Transformational R&D
6
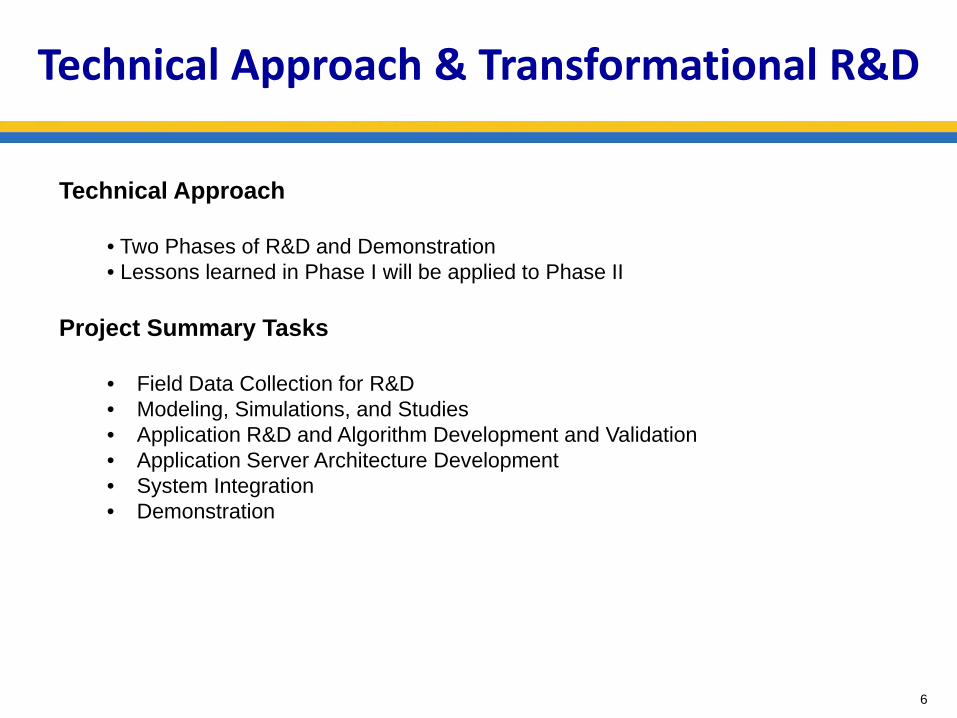
Technical Approach
• Two Phases of R&D and Demonstration• Lessons learned in Phase I will be applied to Phase II
Project Summary Tasks
• Field Data Collection for R&D• Modeling, Simulations, and Studies• Application R&D and Algorithm Development and Validation • Application Server Architecture Development• System Integration• Demonstration
December 2008
Technical Approach & Transformational R&D
7
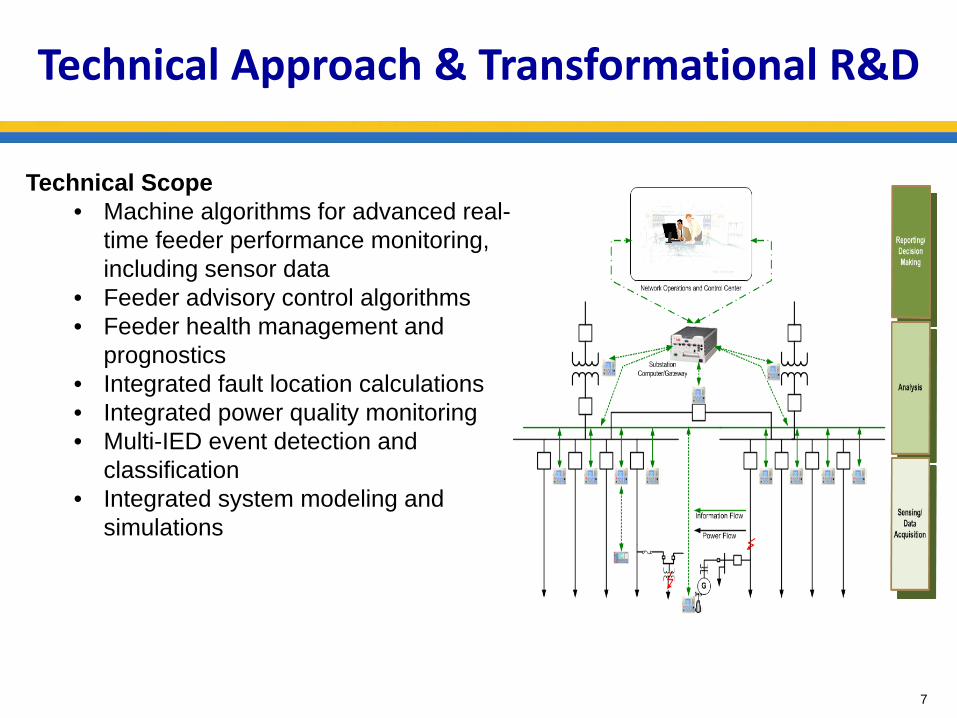
Technical Scope• Machine algorithms for advanced real-
time feeder performance monitoring, including sensor data
• Feeder advisory control algorithms• Feeder health management and
prognostics• Integrated fault location calculations• Integrated power quality monitoring• Multi-IED event detection and
classification• Integrated system modeling and
simulations
December 2008
Technical Approach & Transformational R&D
8
Technical Innovations• Proactive vs. Reactive Situational Awareness
• The operator will know what is happening before receiving customer trouble calls, or when no/late calls are made.
• Example: “OK on arrival” and “Incipient Faults”• Online vs. off-line data analysis
• Real-time monitoring, advisory control, and health management system• Example: Asset management vs. real-time monitoring
• Event MRI vs. X-Ray Alarms • Provides comprehensive set of information to operators to help them enhance
the decision-making process• Example: SCADA alarm vs. pertinent data/waveform snapshot
• Multi-Feeder vs. Individual feeder approach• Gives a system-wide view and analysis• Example: Fault on one feeder causes voltage sag on adjacent feeders
• ALL disturbances vs. fault events• Gives concluding information on all events including non-fault events• Example: Switching event confirmations or transformer inrush events
December 2008
Technical Accomplishments
9
2011 Key Accomplishments
Field Data Collection for R&D• First substation installation achieved in March 2011 (see next slide)• Held 2 workshops with Xcel Energy to finalize substation and feeder selections for
the project• 5 existing and 2 new substations with expanded number of feeders
• Mix of overhead and underground feeders• 3 feeder monitoring points outside substation maintained• Several banks of feeders to detect both primary and adjacent events• One solar farm installation monitoring both at the point of common coupling
(PCC) and at the substation• One substation transformer monitor installation
Application R&D and Algorithm Development • Fault location by segment
• ABB preliminary algorithm under development for the last year• Feeder connectivity models being tested using GIS files• Deployment target is within 3 months
December 2008
Technical Accomplishments
10
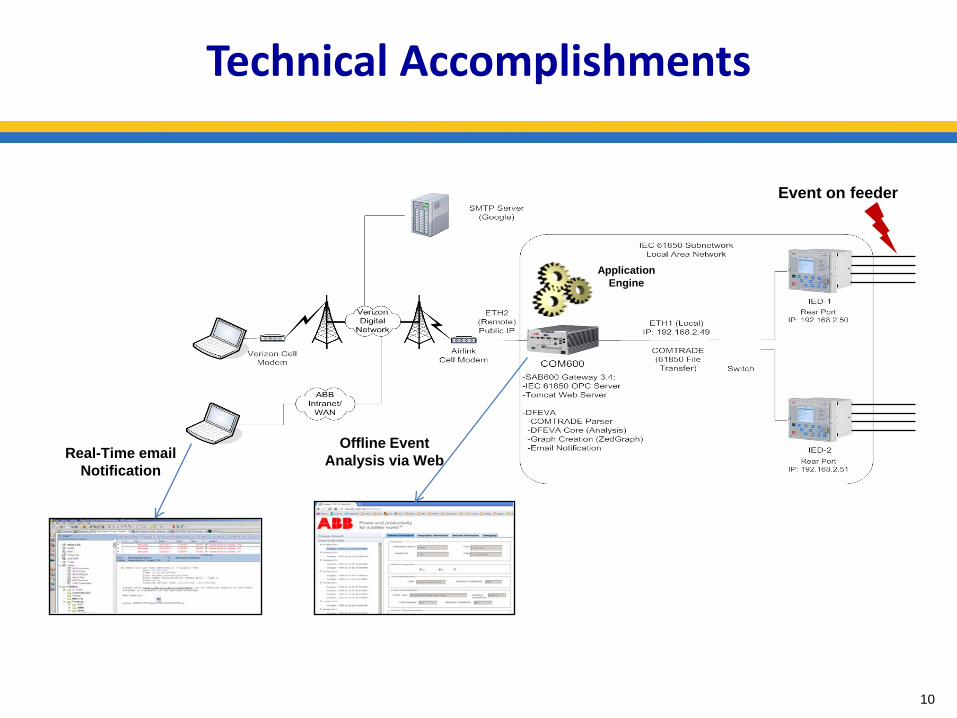
Real-Time email Notification
Offline Event Analysis via Web
Event on feeder
Application Engine
December 2008
Technical Accomplishments
11
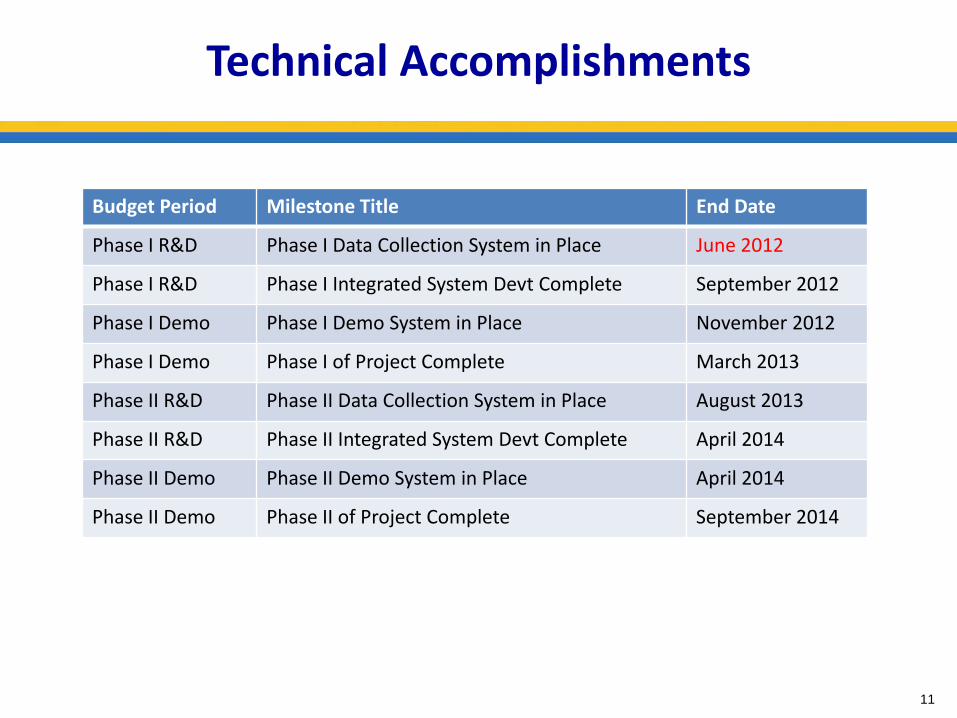
Budget Period Milestone Title End Date
Phase I R&D Phase I Data Collection System in Place June 2012
Phase I R&D Phase I Integrated System Devt Complete September 2012
Phase I Demo Phase I Demo System in Place November 2012
Phase I Demo Phase I of Project Complete March 2013
Phase II R&D Phase II Data Collection System in Place August 2013
Phase II R&D Phase II Integrated System Devt Complete April 2014
Phase II Demo Phase II Demo System in Place April 2014
Phase II Demo Phase II of Project Complete September 2014
December 2008
Project Team Capabilities & Funding Leverage
12
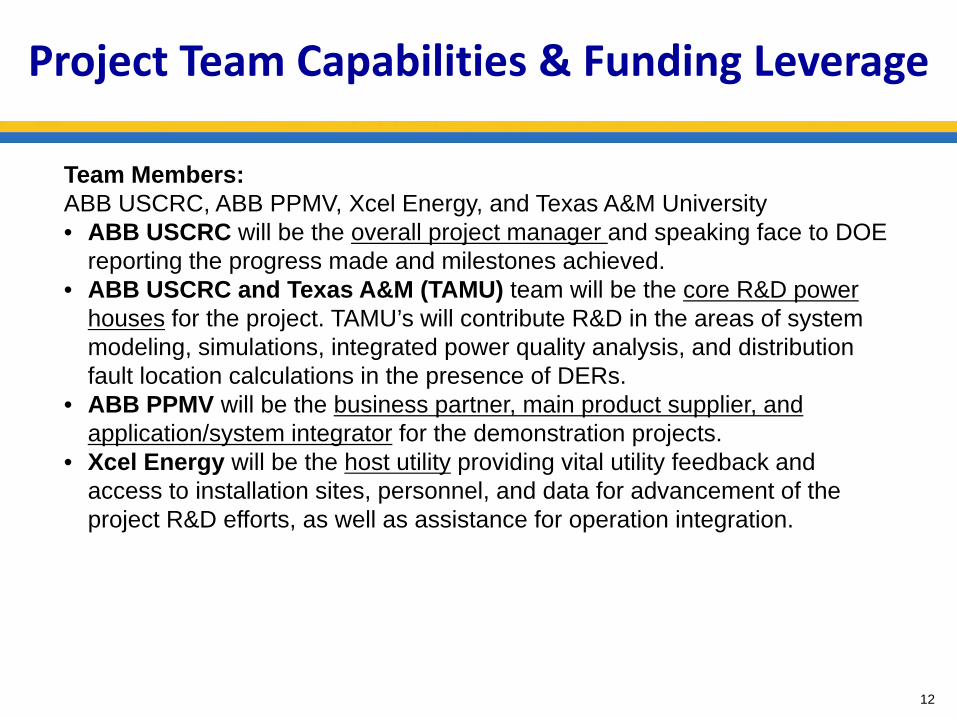
Team Members: ABB USCRC, ABB PPMV, Xcel Energy, and Texas A&M University• ABB USCRC will be the overall project manager and speaking face to DOE
reporting the progress made and milestones achieved.• ABB USCRC and Texas A&M (TAMU) team will be the core R&D power
houses for the project. TAMU’s will contribute R&D in the areas of system modeling, simulations, integrated power quality analysis, and distribution fault location calculations in the presence of DERs.
• ABB PPMV will be the business partner, main product supplier, and application/system integrator for the demonstration projects.
• Xcel Energy will be the host utility providing vital utility feedback and access to installation sites, personnel, and data for advancement of the project R&D efforts, as well as assistance for operation integration.
December 2008
Project Team Capabilities & Funding Leverage
13
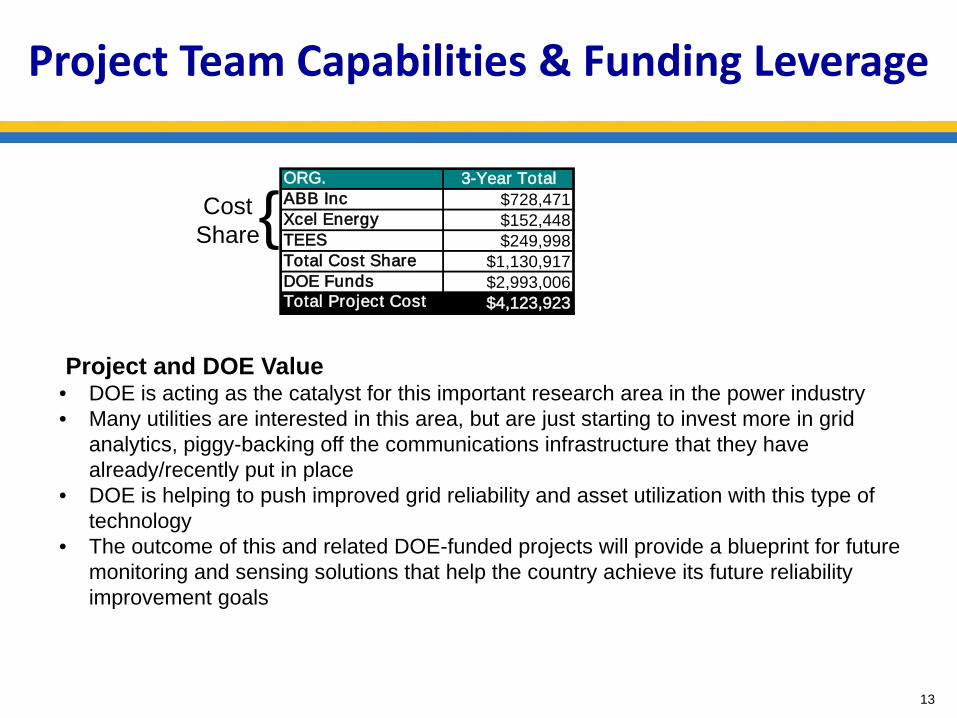
ORG. 3-Year TotalABB Inc $728,471Xcel Energy $152,448TEES $249,998
$1,130,917DOE Funds $2,993,006
$4,123,923Total Project Cost
Total Cost Share
CostShare{
Project and DOE Value• DOE is acting as the catalyst for this important research area in the power industry• Many utilities are interested in this area, but are just starting to invest more in grid
analytics, piggy-backing off the communications infrastructure that they have already/recently put in place
• DOE is helping to push improved grid reliability and asset utilization with this type of technology
• The outcome of this and related DOE-funded projects will provide a blueprint for future monitoring and sensing solutions that help the country achieve its future reliability improvement goals
December 2008
Contact Information
James StoupisABB Inc.940 Main Campus Drive, Suite 200Raleigh, NC 27606Phone: 919-856-2417Email: [email protected]
14
December 2008
Include any back-up slides you would like to provide to the peer reviewers and DOE program managers for additional information. The back-up slides will not be shared with others, unless specifically stated by the presenter.
Back-up Slides
15
December 2008
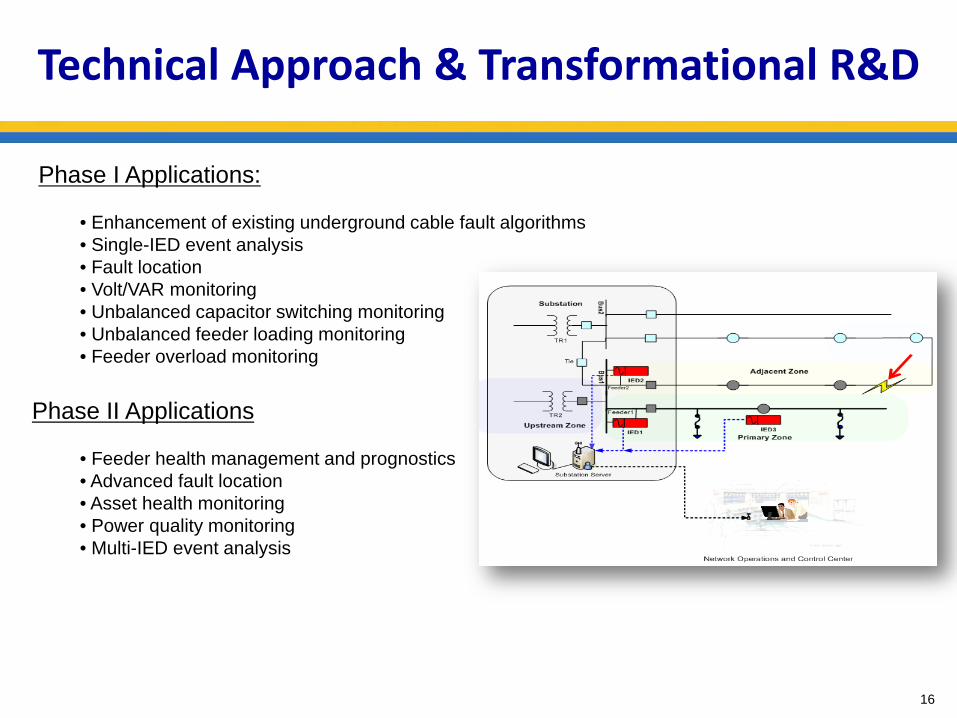
Technical Approach & Transformational R&D
16
Phase I Applications:
• Enhancement of existing underground cable fault algorithms• Single-IED event analysis• Fault location • Volt/VAR monitoring• Unbalanced capacitor switching monitoring• Unbalanced feeder loading monitoring• Feeder overload monitoring
Phase II Applications
• Feeder health management and prognostics• Advanced fault location• Asset health monitoring• Power quality monitoring• Multi-IED event analysis


![System Optimization On Smart Grid - Journal · 5]. Smart Grid applications require monitoring grid and data management, simulations and all grids instantly. In order to the fact that](https://img.pdfslide.us/doc/110x75/5fb13e63cb2cc5213c0bc39c/system-optimization-on-smart-grid-5-smart-grid-applications-require-monitoring.jpg)