Embed Size (px)
Citation preview

Smart Driving Cars: Where Are We Going? Why Are We Going? Where Are We Now?
What Is In It For Whom? How Might We Get There? Where might We End Up?
Alain L. Kornhauser Professor, Operations Research & Financial Engineering
Director, Program in Transportation Faculty Chair, PAVE (Princeton Autonomous Vehicle Engineering
Princeton University
Board Chair, Advanced Transit Association (ATRA)
Presented at
2013 TransAction Conference Atlantic City, NJ
April 18, 2013

Where Are We Going?


Why Are We Going?
Save our Cities????

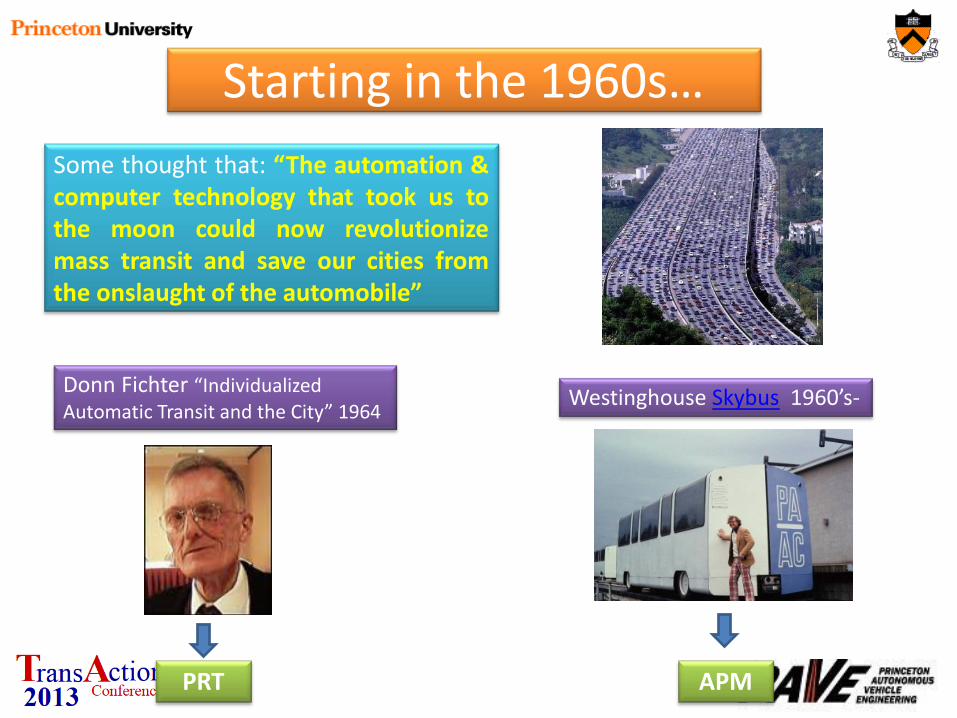
Starting in the 1960s… Some/I thought that: “The automation & computer technology that took us to the moon could now revolutionize mass transit and save our cities from the onslaught of the automobile”
Westinghouse Skybus 1960’s-
APM

Now exist in essentially every Major Airport
APM Automated People Movers
Milan
Beijing
Paris
and a growing number of Driverless Metros
1971 Tampa JFK
Newark
Starting in the 1960s… Some thought that: “The automation & computer technology that took us to the moon could now revolutionize mass transit and save our cities from the onslaught of the automobile”
Westinghouse Skybus 1960’s- Donn Fichter “Individualized Automatic Transit and the City” 1964
APM PRT
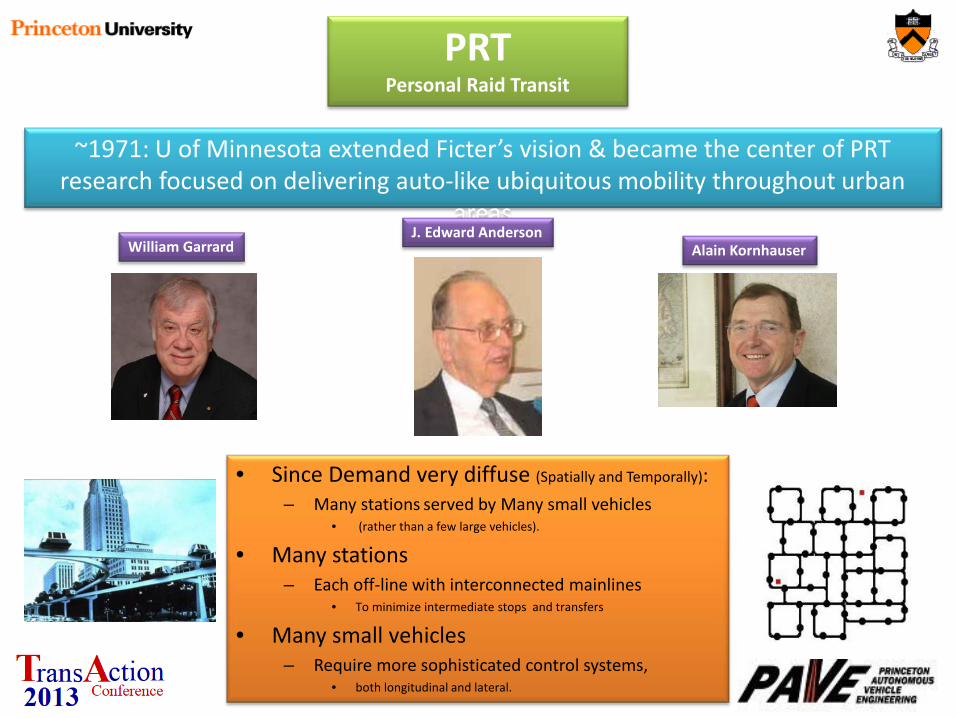
~1971: U of Minnesota extended Ficter’s vision & became the center of PRT research focused on delivering auto-like ubiquitous mobility throughout urban
areas
PRT Personal Raid Transit
• Since Demand very diffuse (Spatially and Temporally):
– Many stations served by Many small vehicles • (rather than a few large vehicles).
• Many stations – Each off-line with interconnected mainlines
• To minimize intermediate stops and transfers
• Many small vehicles – Require more sophisticated control systems,
• both longitudinal and lateral.
J. Edward Anderson Alain Kornhauser William Garrard

Morgantown 1975 Video1 Video2
Early “victory”

– About 40 years ago: Exec. Director of APTA* said to me:
“Alain: PRT is the transportation system of the future… And Always will be!!!” Well after 40 years..… …are we finally approaching the promised land???
*American Public Transit Association

Morgantown 1975
Remains a critical mobility system today & planning an expansion
Today…

And Today… • Masdar & Heathrow are operational
Video

– About 40 years ago: Exec. Director of APTA* said to me:
“Alain: PRT is the transportation system of the future… And Always will be!!!” Well after 40 years..… …are we finally approaching the promised land???
*American Public Transit Association
But implementation progress has been excruciatingly slow …

What he was saying was…
• Final Region-wide Systems would be really great,
but… • Any great final system MUST evolve from some initial
system and be great at EVERY step of the way, otherwise… • It will always be “a system of the future”. • The dedicated grade-separated guideway infrastructure
requirement of PRT may simply be too onerous and risky for it to ever serve a significant share of the urban mobility market.


Why Are We Going?
Its NOT Save our Cities
…..NOT Yet!

Maybe it is simply the fact that…
We really don’t want to drive…
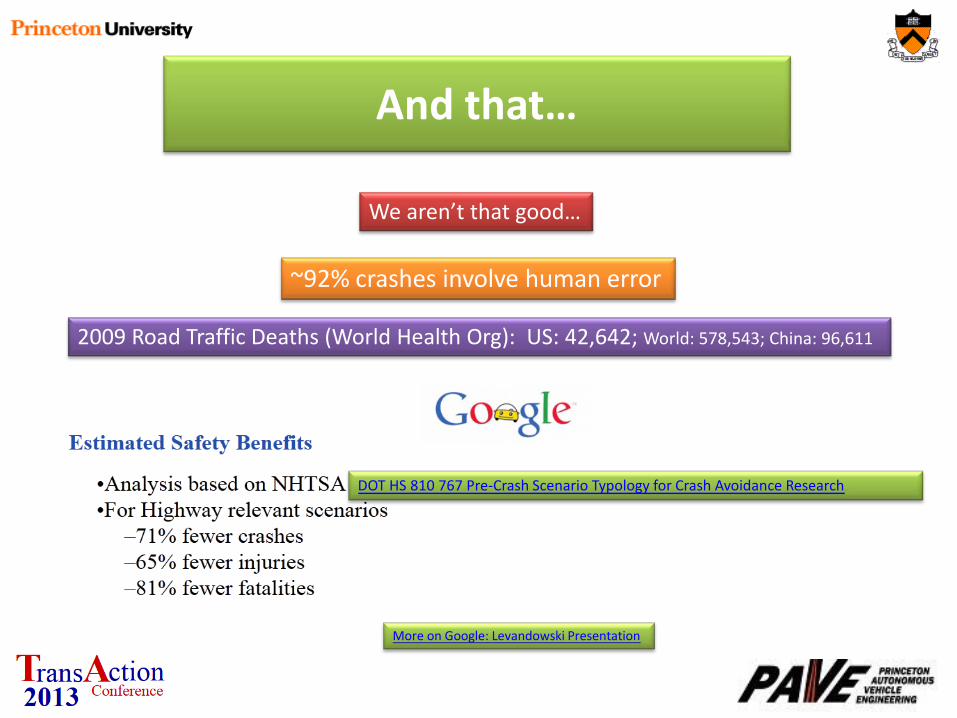
We aren’t that good…
~92% crashes involve human error
2009 Road Traffic Deaths (World Health Org): US: 42,642; World: 578,543; China: 96,611
And that…
DOT HS 810 767 Pre-Crash Scenario Typology for Crash Avoidance Research
More on Google: Levandowski Presentation

Where Are We Now?

Intelligent Transportation Systems
• Coined by Fed DoT in early ‘90s to include: – ATMS (Adv. Transp. Management Systems)
• Intelligent Traffic Control Systems and Value Pricing Systems ( EZ Pass mid 80s)
– ATIS (Adv. Transp. Information Systems) • Turn-by-Turn GPS Route Guidance Systems (‘97 CoPilot Live)
– ARTS (Adv. Rural Transp. Systems)
– ATS (Automated Transit Systems) • Automated People Movers and Personal Rapid Transit (Ficter ‘64, W. Alden ’71, WWU ‘75 )
– AHS (Automated Highway Systems) (1939 World’s Fair, RCA-Sarnoff late 50s*, R.Fenton ‘72 OSU)
• Autonomous vehicles – * VK Zworykin & L Flory “Electronic Control of Motor Vehicles on Highways” Proc. 37th Annual Mtg Highway Research Board, 1958

Evolution of AHS Concept
• GM Futurama @ 1939 World’s Fair
• Zworykin & Flory @ RCA-Sarnoff in Princeton, Late 50s* * VK Zworykin & L Flory “Electronic Control of Motor Vehicles on Highways” Proc. 37th Annual Mtg Highway Research Board, 1958
• Robert E Fenton @ OSU, Early 70s* * “A Headway Safety Policy for Automated Highway Operations” R.E. Fenton 1979

• AHS Studies by FHWA in late 70’s and mid 90’s
2005 2007 2004
Military: Absolutely NOT interested in building Infrastructure
Must Operate in “Harshest” Environment
~ 2000: Military: Mandate to automate ground logistics
Evolution of AHS Concept (Automated Highway System)

2005 2007
Link to Presentation Not Easy 2007 2005 Old House
Beginning of Serious Vehicle Automation
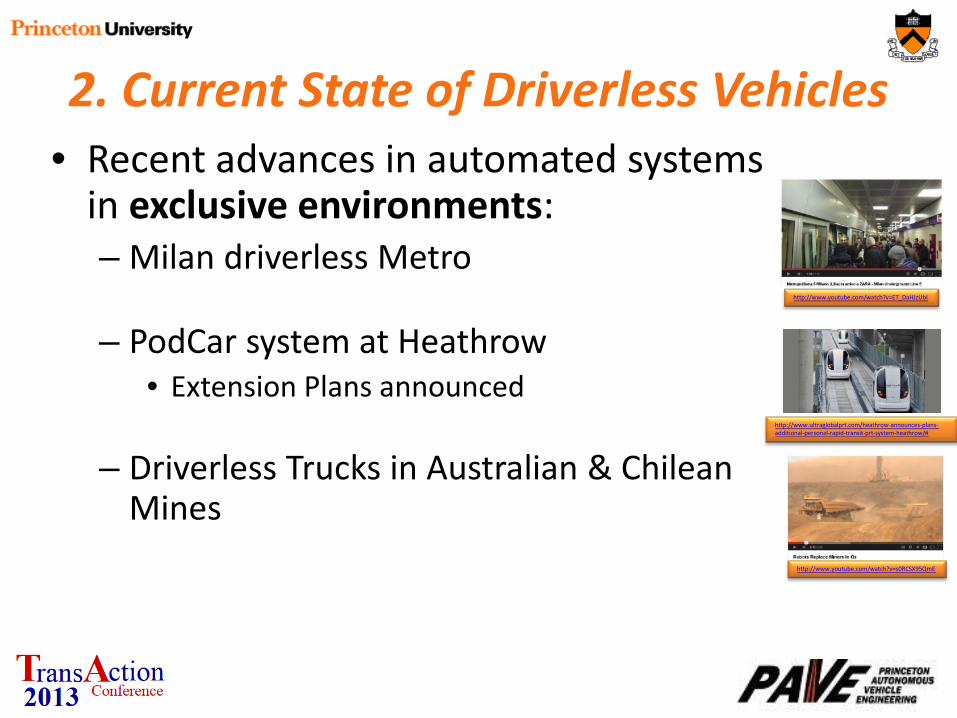
2. Current State of Driverless Vehicles • Recent advances in automated systems
in exclusive environments: – Milan driverless Metro
– PodCar system at Heathrow • Extension Plans announced
– Driverless Trucks in Australian & Chilean Mines
http://www.youtube.com/watch?v=ET_DaHJzUbI
http://www.youtube.com/watch?v=s0RCSX95QmE
http://www.ultraglobalprt.com/heathrow-announces-plans-additional-personal-rapid-transit-prt-system-heathrow/#

2. Current State of Driverless Cars • Much of the public interest has been
promoted by the car. http://www.youtube.com/watch?v=cdgQpa1pUUE
– It is not driverless… • Not yet
– But substantial advancements have focused on: • Development of a self-driving vehicle that can operate in
the existing environment. – Motivated by fact: >90% of road traffic accidents involve
human error. So… remove the human from the loop. » FAA Sept 2007 Operator’s Manual “ Majority of ramp
accidents involve Human error” – Also… People often really do not want to drive.
• Driven over 500,000 miles in self-driving mode • http://gawker.com/5825012/how-a-top-google-executive-nearly-killed-a-guy

2. Current State of Driverless Cars, cont. • Substantial advances by auto industry:
– Automated parking
http://www.youtube.com/watch?feature=player_embedded&v=WEh7qIon36s

http://www.youtube.com/watch?v=MZ3s_cdk_yE&feature=player_embedded
Audi

http://www.youtube.com/watch?v=0D0ZN2tPihQ&feature=player_embedded
Bosch

http://www.youtube.com/watch?v=4tpI0S6XWvY
Mercedes-Benz Brake-assist

http://www.mbusa.com/mercedes/vehicles/build/class-S/model-S400HV%23performance#performance

2. Current State of Driverless Cars, cont. • Substantial advances by auto industry:
– Automated parking – Jam Assist (lane keeping + collision avoidance)
• Currently available as a $3K option @ Mercedes Dealers
http://www.youtube.com/watch?v=i7aTbSf1Lyo
Mercedes-Benz Steering-assist

2. Current State of Driverless Cars, cont. • Substantial advances by auto industry:
– Automated parking – Jam Assist (lane keeping + collision avoidance)
• Currently available as a $3K option @ Mercedes Dealers – Partnership arrangement btwn Parts suppliers and
manufacturers (ex: Continental + BMW) suggests that such options will become common place.
– Recent successful completion of a collaborative European research initiatives demonstrating automated driving systems using low-cost sensing components

2. Current State of Driverless Cars, cont. • Substantial advances by Federal Regulators:
– NHTSA Administrator David Strickland:
• NHTSA extending vehicle crash oversight from Mitigation to Avoidance
– Mitigation: Airbags, Seatbelts, CrumpleZones – Avoidance: AntiLockBrakes, ActiveStabilityControl, V2X,
CollisionAvoidance, LaneKeeping, DriverMonitoring, AutomatedDriving


http://www.youtube.com/watch?v=MZ3s_cdk_yE&feature=player_embedded
http://www.youtube.com/watch?v=0D0ZN2tPihQ&feature=player_embedded
http://orfe.princeton.edu/~alaink/SmartDrivingCars/Videos/VolvoPlatooningConcept.wmv
http://www.youtube.com/watch?v=ridS396W2BY&feature=player_detailpage
Assorted Videos of Self-Driving Cars http://orfe.princeton.edu/~alaink/SmartDrivingCars/Videos/1_FrozenLakeVID_onlySteeringWoIndividualWheelBraking.mp4
http://orfe.princeton.edu/~alaink/SmartDrivingCars/Videos/2_FrozenLakeVID_onlySteeringWoIndividualWheelBraking.mp4
http://orfe.princeton.edu/~alaink/SmartDrivingCars/Videos/3_FrozenLakeVID_onlySteeringWoIndividualWheelBraking.mp4
http://orfe.princeton.edu/~alaink/SmartDrivingCars/Videos/4_FrozenLakeVID_onlySteeringWoIndividualWheelBraking.mp4

http://www.youtube.com/watch?v=cdgQpa1pUUE

Initial Demonstration of Autonomous Transit
• Autonomous Buses at La Rochelle (CyberCars/Cybus/INRIA) http://www.youtube.com/watch?v=72-PlSFwP5Y
– Simple virtual non-exclusive roadway • Virtual vehicle-based longitudinal (collision avoidance) and
lateral (lane keeping) systems

2. Current State of Driverless Cars, cont. • Technology forecasts by the European Researchers:
– Looks to Full Automation ~ 2030

What is in it for whom? • Players
– Consumers – Automobile Companies – Infrastructure Providers/Managers (DoT, NJTPA, PANYNJ) – Transit Operators – Insurance Companies – Society/The Economy

What is in it for whom? • Consumers
– Main Values: Increased Safety, Comfort and Convenience. – AAA:

What is in it for whom? • Consumers
– Main Values: Increased Safety, Comfort and Convenience.
DOT HS 810 767 Pre-Crash Scenario Typology for Crash Avoidance Research

What is in it for whom? • Consumers
– Main Values: Increased Safety, Comfort and Convenience.
DOT HS 810 767 Pre-Crash Scenario Typology for Crash Avoidance Research

What is in it for whom? • Consumer
– Main Values: Increased Safety, Comfort and Convenience.
DOT HS 810 767 Pre-Crash Scenario Typology for Crash Avoidance Research
$475 are Pass-through Dollars

$475 are “Pass-through” Dollars
$450 Discount for You
$25 for Flo or the Gecko
Could Discount Finance?:
Assume: Emergence of “Price Leading” Insurer
What is in it for whom?

Probably only 2/3rds the safety of Google Car
$300/yr to Mercedes
$20/yr for Flo or the Gecko
Could “Pass-through” Finance Mercedes Lane Keeping + Jam Assist
to be Available in 2014 Models
$475 Pass-through becomes: $320
You get (for free): • Prob. of your car killing you reduced factor: 2/3*.81= 0.54 (half) • Prob. of your car injuring you reduced factor: 2/3*.65= 0.44 • “Save” expected “deductible self-insurance”: $247/yr • Comfort • Convenience • “Anxiety” relief

What is in it for whom? • New Jersey Consumers
What is in if for whom? • Society
Can’t really place value on the
injuries and lives that will be saved
Priceless! Self-driving Technology has a REAL business model!

How Might We Get There?

• Fact: For over 40 years New Jersey has had the World’s Best “Bus Rapid Transit” System!
• It Consists of: • Efficient Boarding/Alighting @ Port Authority Bus Terminal
– 223 Departure Gates – Readily Accommodates 700 Buses/hr
The World’s Best Bus Rapid Transit System

• Fact: For over 40 years New Jersey has had the World’s Best “Bus Rapid Transit” System!
• It Consists of: • Efficient Boarding/Alighting @ PA Bus Terminal • Direct Access/Egress to Exclusive Lanes in the
Lincoln Tunnel
The World’s Best Bus Rapid Transit System

• Fact: For over 40 years New Jersey has had the World’s Best “Bus Rapid Transit” System!
• It Consists of: • Efficient Boarding/Alighting @ PA Bus Terminal • Direct Access/Egress to Exclusive Lanes in the Lincoln
Tunnel • 3+ HOV Lanes on the NJ Turnpike that are, by default,
essentially bus-only
The World’s Best Bus Rapid Transit System

• Fact: For over 40 years New Jersey has had the World’s Best “Bus Rapid Transit” System!
• It Consists of: • Efficient Boarding/Alighting @ PA Bus Terminal • Direct Access/Egress to Exclusive Lanes in the Lincoln
Tunnel • 3+ HOV Lanes on the NJ Turnpike that are, by default, essentially bus-only • Many Strategically Located Park&Ride Lots
The World’s Best Bus Rapid Transit System

• Pieces are Connected by: • “495-viaduct” Counter-flow Exclusive Bus Lane
(XBL) – 2.5 miles
The World’s Best Bus Rapid Transit System

• Pieces are Connected by: • “495-viaduct” Counter-flow Exclusive Bus Lane
(XBL) – Lane Segregation is by Removable Plastic Peg – Yet exceedingly Safe
» 3 (?) accidents in 41 years, no fatalities.
The World’s Best Bus Rapid Transit System

• Pieces are Connected by: • “495-viaduct” Counter-flow Exclusive Bus Lane
(XBL Movie) – Daily (6am->10am): 1,800 Buses; 65,000 pax – Peak Hour: 700 Buses; 35,000 pax – Peak Hour: At Capacity!
» Physical Driver Limit » Av. 5 sec. headway
The World’s Best Bus Rapid Transit System

– Additional Demand Exists for “BRT 2 NYC” – How to increase capacity of XBL?
• “Take a 2nd Lane”? – Political suicide!
• Widen the Viaduct and Helix? – Very expensive/disruptive
• How about Driver Assistance? – Extend Bus 2.0 Technology
Improving The World’s Best Bus Rapid Transit System

• add Intelligent Cruise Control with Lane Assist to the 3,000 buses…
• e.g. Daimler Benz Distronic Plus with Traffic Jam Assist • even at an incremental $100,000/bus this is just $200M
• Could achieve sustained 3.0 second headways – Increases practical throughput by 50%
• from 700 -> 1,000 buses/hr; 35,000 -> 50,000 pax/hr
– Increased passenger capacity comparable to what would have been provided by $10B ARC rail tunnel
• Institutionally manageable: – All Express Buses are leased for 1$/yr from PANY&NJ – Facilities (XBL, LT, PABT) are controlled by PANY&NJ DoT
• Ideal test facility available: – Ft. Monmouth
Improving The World’s Best Bus Rapid Transit System

• Concept Not New:
• Concept Makes Even More Sense Now!
Improving The World’s Best Bus Rapid Transit System

Near-term Opportunity for a Substantive Extension of Autonomous Transit
• Specific: General Mobility for Fort Monmouth Redevelopment – Currently: Decommissioned Ft. Monmouth is vacant .
• Ft. Monmouth Economic Revitalization Authority (FMERA) is redeveloping the 3 sq. mile “city” • Focus is on attracting high-tech industry • The “Fort” needs a mobility system. • FMEDA is receptive to incorporating an innovative mobility system • Next generation “La Rochelle” system would be ideal • Because it is being redeveloped as a “new town” it can accommodate itself to be an ideal site for testing
more advanced driverless systems.

How about Saving “The State”??? • Each year my students lay out a NJ-wide PRT
network • Objective: to effectively serve essentially all
NJ travel demand (all 30x106 daily non-walk trips)
• Place “every” demand point within “5 minute walk” of a station; all stations interconnected; maintain existing NJ Transit Rail and express bus operations )
• Typically: – ~10,000 stations (> $25B) – ~10,000 miles of guideway (>$100B) – ~750,000 PRT vehicles (>$75B) – Optimistic cost: ~$200B

Far-term Opportunities for Driverless Transit
• Biggest Issues – How to get started – How to evolve – Cost & complexity of guideway
• What if ???? – Use existing streets automatedTaxi (aTaxi) – Curb-side aTaxi stands offering on-demand shared-ride services
• Ability to get started and evolve to – ~10,000 aTaxi stands – ~750,000 aTaxis – Offering
• peak hours: stand2stand shared aTaxi service • else: stand2stand shared services and door2door premium service

Where might We End Up?

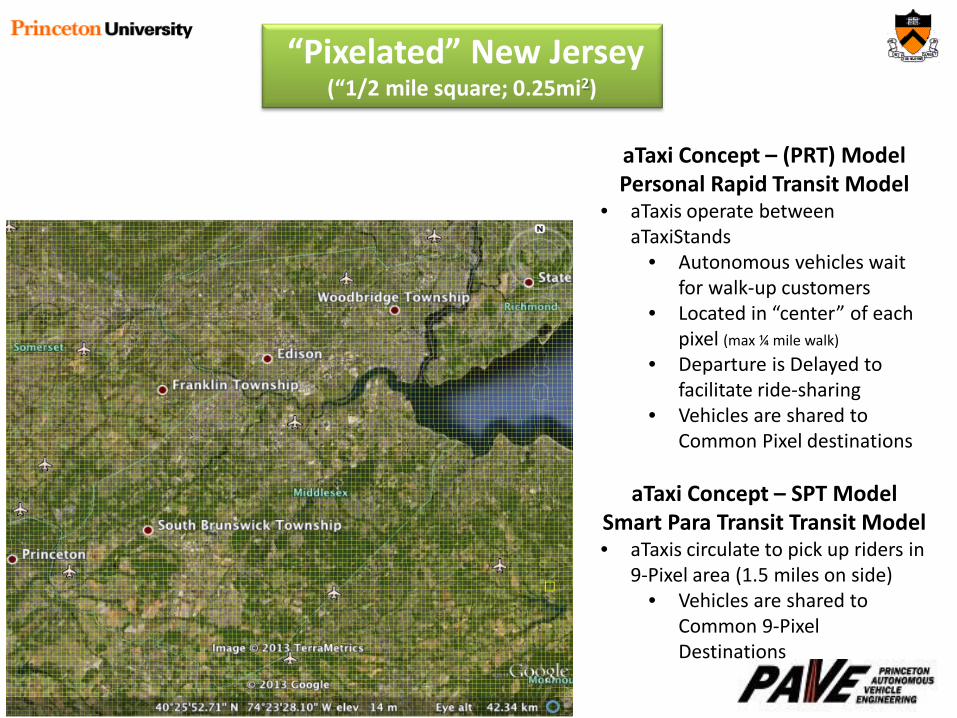
“Pixelated” New Jersey (“1/2 mile square; 0.25mi2)
aTaxi Concept – (PRT) Model Personal Rapid Transit Model
• aTaxis operate between aTaxiStands
• Autonomous vehicles wait for walk-up customers
• Located in “center” of each pixel (max ¼ mile walk)
• Departure is Delayed to facilitate ride-sharing
• Vehicles are shared to Common Pixel destinations
aTaxi Concept – SPT Model Smart Para Transit Transit Model • aTaxis circulate to pick up riders in
9-Pixel area (1.5 miles on side) • Vehicles are shared to
Common 9-Pixel Destinations

“Pixelated” New Jersey (“1/2 mile square; 0.25mi2)
aTaxi Concept – SPT Model Smart Para Transit Transit Model
aTaxi Concept – (PRT) Model Personal Rapid Transit Model
Ref: http://orfe.princeton.edu/~alaink/Theses/2013/Brownell,%20Chris%20Final%20Thesis.pdf

State-wide automatedTaxi (aTaxi)
• Serves essentially all NJ travel demand (32M trips/day) • Shared ridership potential:

State-wide automatedTaxi (aTaxi)
• Serves essentially all NJ travel demand (32M trips/day) • Shared ridership potential:
State-wide automatedTaxi (aTaxi)
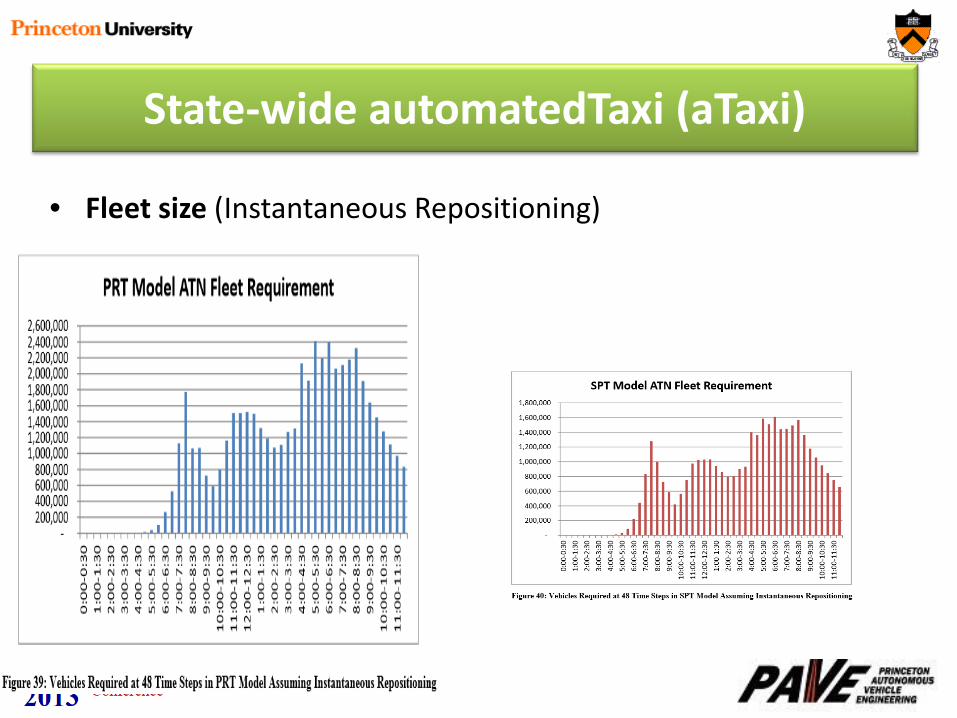
• Fleet size (Instantaneous Repositioning)

State-wide automatedTaxi (aTaxi)
• Abel to serve essentially all NJ travel demand (32M trips/day) • Shared ridership allows
– Peak hour; peak direction: Av. vehicle occupancies to can reach ~ 3 p/v and eliminate much of the congestion
– Essentially all congestion disappears with appropriate implications on the environment
– Required fleet-size under 2M aTaxis (about half) • (3.71 registered automobiles in NJ (2009)
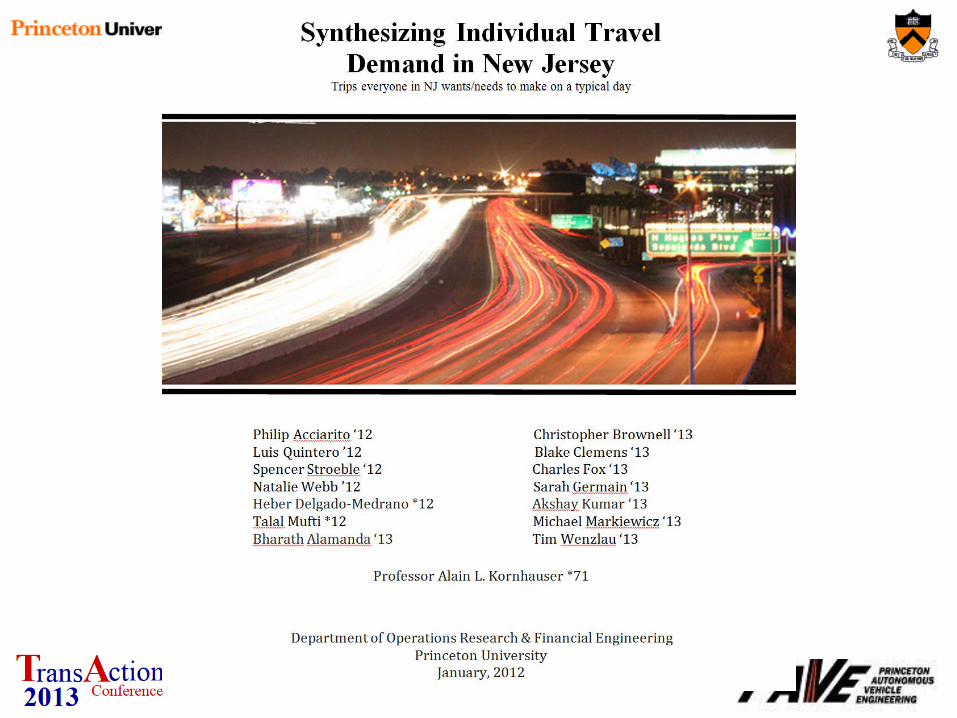

Most every day…
• Almost 9 Million NJ residents • 0.25 Million of out of state commuters • Make 30+ Million trips • Throughout the 8,700 sq miles of NJ • Where/when do they start? • Where do they go? • Does anyone know???
– I certainly don’t • Not to sufficient precision for credible analysis

• I’ve harvested one of the largest troves of GPS tracks – Literally billions of individual trips, – Unfortunately, they are spread throughout the western
world, throughout the last decade. – Consequently, I have only a very small ad hoc sample of
what happens in NJ on a typical day.
I’ve Tried…
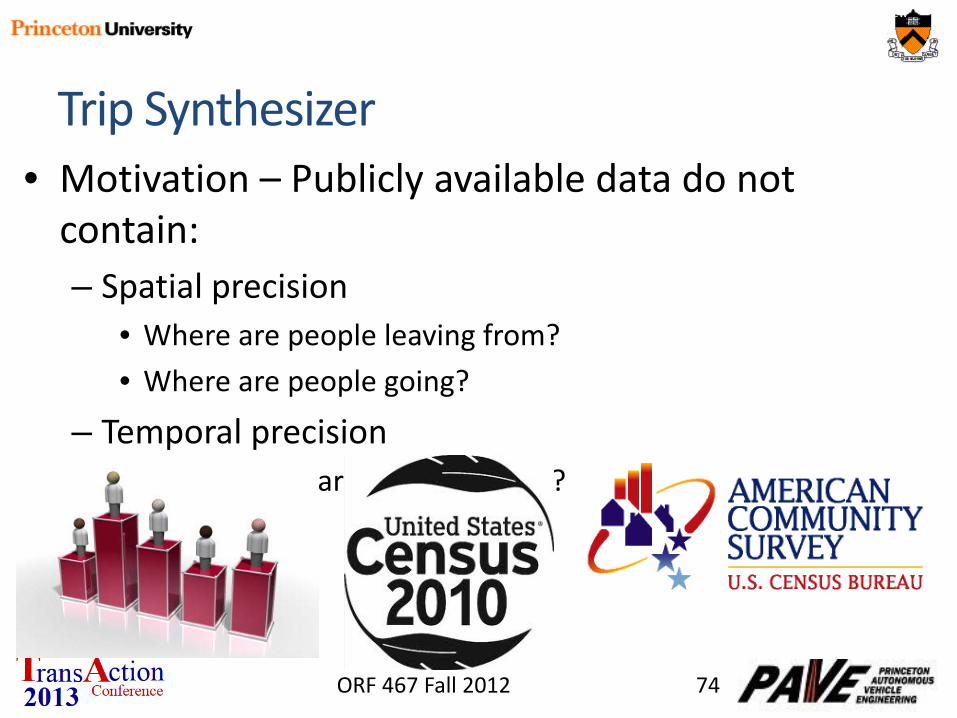
• Motivation – Publicly available data do not contain: – Spatial precision
• Where are people leaving from? • Where are people going?
– Temporal precision • At what time are they travelling?
ORF 467 Fall 2012 74
Trip Synthesizer
Project Overview
Why do I want to know every trip?
• Academic Curiosity • If offered an alternative, which ones would likely
“buy it” and what are the implications. • More specifically:
– If an alternative transport system were available, which trips would be diverted to it and what operational requirements would those trip impose on the new system?
• In the end… – a transport system serves individual decision makers.
It’s patronage is an ensemble of individuals, – I would prefer analyzing each individual trip patronage
opportunity.

Synthesize from publically available data: • “every” NJ Traveler on a typical day NJ_Resident file
– Containing appropriate demographic and spatial characteristics that reflect trip making
• “every” trip that each Traveler is likely to make on a typical day. NJ_PersonTrip file
– Containing appropriate spatial and temporal characteristics for each trip

Creating the NJ_Resident file
for “every” NJ Traveler on a typical day NJ_Resident file
Start with Publically available data:

2010 Population census @Block Level
– 8,791,894 individuals distributed 118,654 Blocks. County Population Census Blocks Median Pop/ Block Average Pop/Block
ATL 274,549 5,941 26 46 BER 905,116 11,171 58 81 BUR 448,734 7,097 41 63 CAM 513,657 7,707 47 67 CAP 97,265 3,610 15 27 CUM 156,898 2,733 34 57 ESS 783,969 6,820 77 115 GLO 288,288 4,567 40 63 HUD 634,266 3,031 176 209 HUN 128,349 2,277 31 56 MER 366,513 4,611 51 79 MID 809,858 9,845 50 82 MON 630,380 10,067 39 63 MOR 492,276 6,543 45 75 OCE 576,567 10,457 31 55 PAS 501,226 4,966 65 101 SAL 66,083 1,665 26 40 SOM 323,444 3,836 51 84 SUS 149,265 2,998 28 50 UNI 536,499 6,139 61 87 WAR 108,692 2,573 23 42 Total 8,791,894 118,654 74.1

Publically available data:
• Distributions of Demographic Characteristics – Age – Gender – Household size – Name (Last, First)
Ages (varying linearly over interval): input: output: [0,49] 67.5% 67.5% [50,64] 18.0% 17.9% [65,79] 12.0% 12.1% [80,100] 2.5% 2.5%
Gender: Input: Output: female 51.3% 51.3%
Household: Size: Probability: cdf: Expectation: couple 2 0.30 0.300 0.6 couple + 1 3 0.08 0.380 0.24 couple + 2 4 0.06 0.440 0.24 couple + 3 5 0.04 0.480 0.2 couple + 4 6 0.04 0.520 0.24 couple + grandparent: 3 0.01 0.525 0.015 single woman 1 0.16 0.685 0.16 single mom + 1 2 0.07 0.755 0.14 single mom + 2 3 0.05 0.805 0.15 single mom + 3 4 0.03 0.835 0.12 single mom + 4 5 0.03 0.865 0.15 single man 1 0.12 0.985 0.12 single dad + 1 2 0.01 0.990 0.01 single dad + 2 3 0.005 0.995 0.015 single dad + 3 4 0.005 1.000 0.02 2.42

Final NJ_Resident file Home County Person Index Household Index Full Name Age Gender Worker Type Index Worker Type String Home lat, lon Work or School lat,lon Work County Work or School Index NAICS code Work or School start/end time
ATL 274,549 BER 905,116 BUR 448,734
CAM 513,657 CAP 97,265
CUM 156,898 ESS 783,969
GLO 288,288 HUD 634,266 HUN 128,349 MER 366,513 MID 809,858
MON 630,380 MOR 492,276 OCE 576,567 PAS 501,226 SAL 66,083
SOM 323,444 SUS 149,265 UNI 536,499
WAR 108,692 NYC 86,418 PHL 18,586 BUC 99,865 SOU 13,772 NOR 5,046 WES 6,531 ROC 32,737
Total: 9,054,849

Assigning a Daily Activity (Trip) Tour to Each Person
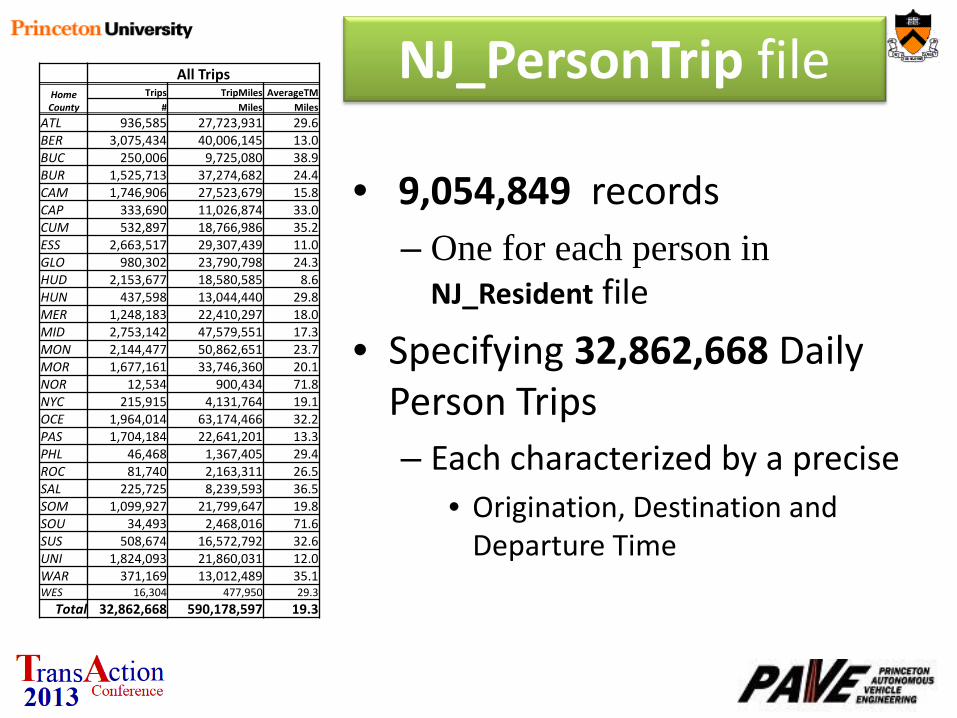
NJ_PersonTrip file
• 9,054,849 records – One for each person in
NJ_Resident file
• Specifying 32,862,668 Daily Person Trips – Each characterized by a precise
• Origination, Destination and Departure Time
All Trips Home County
Trips TripMiles AverageTM # Miles Miles
ATL 936,585 27,723,931 29.6 BER 3,075,434 40,006,145 13.0 BUC 250,006 9,725,080 38.9 BUR 1,525,713 37,274,682 24.4 CAM 1,746,906 27,523,679 15.8 CAP 333,690 11,026,874 33.0 CUM 532,897 18,766,986 35.2 ESS 2,663,517 29,307,439 11.0 GLO 980,302 23,790,798 24.3 HUD 2,153,677 18,580,585 8.6 HUN 437,598 13,044,440 29.8 MER 1,248,183 22,410,297 18.0 MID 2,753,142 47,579,551 17.3 MON 2,144,477 50,862,651 23.7 MOR 1,677,161 33,746,360 20.1 NOR 12,534 900,434 71.8 NYC 215,915 4,131,764 19.1 OCE 1,964,014 63,174,466 32.2 PAS 1,704,184 22,641,201 13.3 PHL 46,468 1,367,405 29.4 ROC 81,740 2,163,311 26.5 SAL 225,725 8,239,593 36.5 SOM 1,099,927 21,799,647 19.8 SOU 34,493 2,468,016 71.6 SUS 508,674 16,572,792 32.6 UNI 1,824,093 21,860,031 12.0 WAR 371,169 13,012,489 35.1 WES 16,304 477,950 29.3
Total 32,862,668 590,178,597 19.3

Overview of Data Production
1. Generate population 2. Assign work places 3. Assign schools 4. Assign tours / activity patterns 5. Assign other trips 6. Assign arrival / departure times
ORF 467 Fall 2012 83
Project Overview

Warren County Population: 108,692

New Jersey Summary Data Item Value
Area (mi2) 8,061
# of Pixels Generating at Least One O_Trip 21,643
Area of Pixels (mi2) 5,411
% of Open Space 32.9%
# of Pixels Generating 95% of O_Trips 9,519
# of Pixels Generating 50% of O_Trips 1,310
# of Intra-Pixel Trips 447,102
# of O_Walk Trips 1,943,803
# of All O_Trips 32,862,668
Avg. All O_TripLength (miles) 19.6
# of O_aTaxi Trips 30,471,763
Avg. O_aTaxiTripLength (miles) 20.7
Median O_aTaxiTripLength (miles) 12.5
95% O_aTaxiTripLength (miles) 38.0

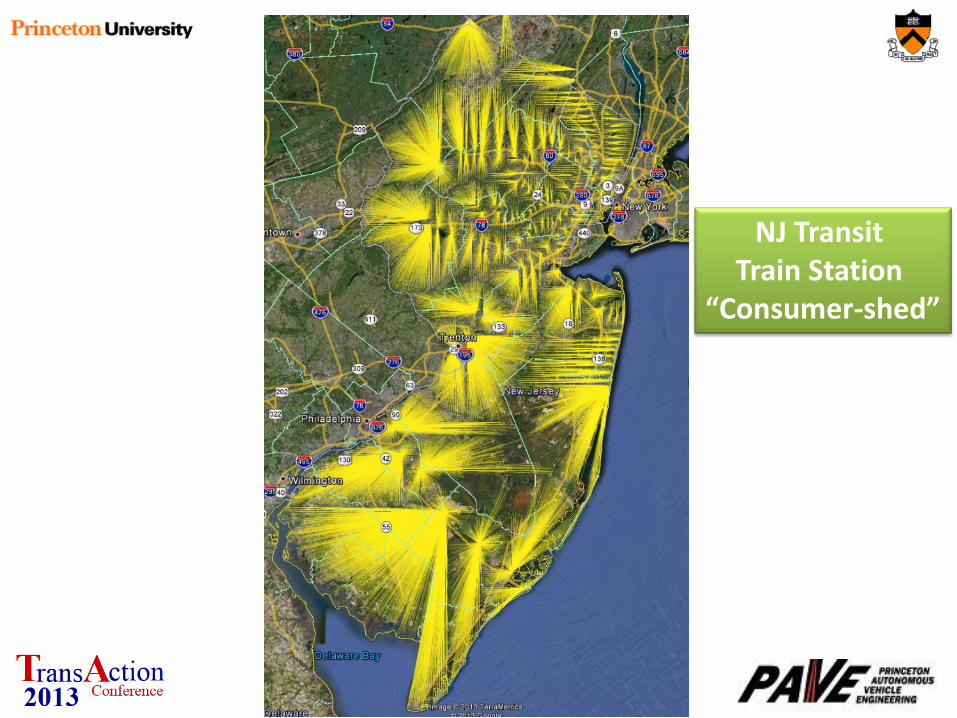
NJ Transit Train Station
“Consumer-shed”
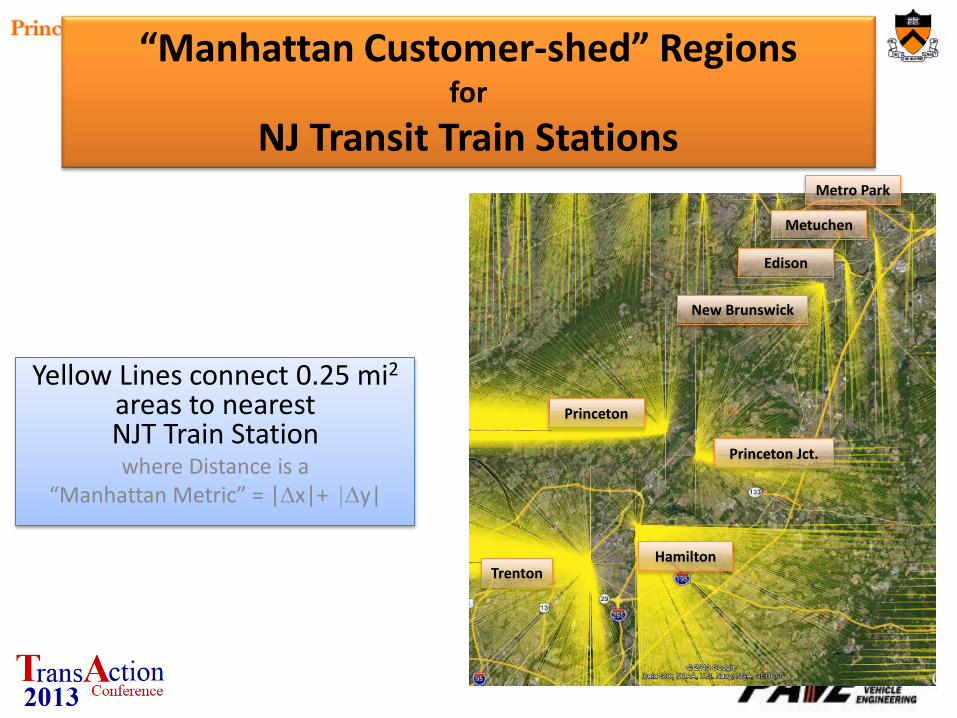
“Manhattan Customer-shed” Regions for
NJ Transit Train Stations
Yellow Lines connect 0.25 mi2 areas to nearest NJT Train Station where Distance is a
“Manhattan Metric” = |∆x|+ |∆y|
Trenton
Princeton
Hamilton
New Brunswick
Princeton Jct.
Metuchen
Edison
Metro Park

“Manhattan Customer-shed”
Regions for
NJ Transit Train Stations
Yellow Lines connect 0.25 mi2 areas to nearest NJT Train Station where Distance is a
“Manhattan Metric” = |∆x|+ |∆y|
Princeton
Hamilton
New Brunswick
Princeton Jct.
Edison

Discussion!

Thank You