Embed Size (px)
Citation preview

Scholars' Mine Scholars' Mine
Masters Theses Student Theses and Dissertations
Fall 2018
Smart augmented reality instructional system for mechanical Smart augmented reality instructional system for mechanical
assembly assembly
Ze-Hao Lai
Follow this and additional works at: https://scholarsmine.mst.edu/masters_theses
Part of the Computer Sciences Commons, and the Mechanical Engineering Commons
Department: Department:
Recommended Citation Recommended Citation Lai, Ze-Hao, "Smart augmented reality instructional system for mechanical assembly" (2018). Masters Theses. 7827. https://scholarsmine.mst.edu/masters_theses/7827
This thesis is brought to you by Scholars' Mine, a service of the Missouri S&T Library and Learning Resources. This work is protected by U. S. Copyright Law. Unauthorized use including reproduction for redistribution requires the permission of the copyright holder. For more information, please contact [email protected].

SMART AUGMENTED REALITY INSTRUCTIONAL SYSTEM
FOR MECHANICAL ASSEMBLY
by
ZE-HAO LAI
A THESIS
Presented to the Faculty of the Graduate School of the
MISSOURI UNIVERSITY OF SCIENCE AND TECHNOLOGY
In Partial Fulfillment of the Requirements for the Degree
MASTER OF SCIENCE IN MANUFACTURING ENGINEERING
2018
Approved by:
Ming C. Leu, Advisor
Zhaozheng Yin
Ruwen Qin

© 2018
Ze-Hao Lai
All Rights Reserved
iii
ABSTRACT
Quality and efficiency are pivotal indicators of a manufacturing company. Many
companies are suffering from shortage of experienced workers across the production line
to perform complex assembly tasks such as assembly of an aircraft engine. This could
lead to a significant financial loss. In order to further reduce time and error in an
assembly, a smart system consisting of multi-modal Augmented Reality (AR)
instructions with the support of a deep learning network for tool detection is introduced.
The multi-modal smart AR is designed to provide on-site information including various
visual renderings with a fine-tuned Region-based Convolutional Neural Network, which
is trained on a synthetic tool dataset. The dataset is generated using CAD models of tools
augmented onto a 2D scene without the need of manually preparing real tool images. By
implementing the system to mechanical assembly of a CNC carving machine, the result
has shown that the system is not only able to correctly classify and localize the physical
tools but also enables workers to successfully complete the given assembly tasks. With
the proposed approaches, an efficiently customizable smart AR instructional system
capable of sensing, characterizing the requirements, and enhancing worker’s performance
effectively has been built and demonstrated.

iv
ACKNOWLEDGMENTS
I would like to express my greatest gratitude to my advisor, Dr. Ming C. Leu, for
his support and guidance in every aspect throughout my graduate study. I would like to
thank my committee members, Dr. Yin and Dr. Qin, for all the research advice regarding
machine learning and engineering system.
I would like to acknowledge and thank all the funding sources granted from
National Science Foundation CMMI-1646162 and the Intelligent Systems Center at
Missouri University of Science and Technology.
Furthermore, I would like to thank Dr. Randy Moss for helping me in exploring
the field of machine vision, and my previous colleagues in Aerospace Industrial
Development Corporation for providing practical insights from the industry.
Finally, I would like to thank my family for always being supportive along the
way of my study. In addition, I would like to thank Wenjin Tao for his help of the work
and valuable suggestions. I would also like to thank Md. Moniruzzaman, Chia-Hung
Hung, Viraj Gajjar, Whamsy Kryshna, and all the members of Innovative Additive
Manufacturing lab for all the support.

v
TABLE OF CONTENTS
Page
ABSTRACT ....................................................................................................................... iii
ACKNOWLEDGMENTS ................................................................................................. iv
LIST OF ILLUSTRATIONS ............................................................................................ vii
LIST OF TABLES ............................................................................................................. ix
SECTION
1. INTRODUCTION ...................................................................................................... 1
1.1. BACKGROUND AND MOTIVATION ............................................................ 1
1.2. RELATED WORK ............................................................................................. 3
1.3.OVERVIEW OF THE PROPOSED SYSTEM ................................................... 5
2. TECHNOLOGY COMPONENTS AND SYSTEM OVERVIEW ............................ 6
2.1. MULTI-MODAL AUGMENTED REALITY ................................................... 6
2.1.1. Feature Extraction .................................................................................... 7
2.1.2. Camera Pose Estimation for Augmented Reality ..................................... 8
2.1.3. Multi-modal AR Realization .................................................................. 11
2.2. DEEP LEARNING FOR TOOL DETECTION ............................................... 13
2.2.1. Detection Approach ................................................................................ 13
2.2.2. Synthetic Dataset .................................................................................... 14
2.2.3. Faster R-CNN ......................................................................................... 17
2.3. SYSTEM OVERVIEW .................................................................................... 21
3. EXPERIMENT ......................................................................................................... 23

vi
3.1. EXPERIMENTAL SETUP ............................................................................... 23
3.2. SYSTEM EVALUATION ................................................................................ 26
3.2.1. Subject Selection and Testing Procedure ............................................... 26
3.2.2. Evaluation Metric ................................................................................... 27
4. RESULTS ................................................................................................................. 29
4.1. TOOL DETECTOR AND SMART AR RENDERING ................................... 30
4.2. SYSTEM EVALUATION AND DISCUSSION.............................................. 34
5. CONCLUSION ........................................................................................................ 41
APPENDIX ....................................................................................................................... 42
BIBLIOGRAPHY ............................................................................................................. 48
VITA ................................................................................................................................ 52

vii
LIST OF ILLUSTRATIONS
Figure Page
1.1. Highly complex assembly of an aircraft engine ......................................................... 1
1.2. Overview of the proposed system ............................................................................... 5
2.1. The proposed multi-modal AR instructional system .................................................. 6
2.2. A selected image for the target marker ....................................................................... 7
2.3. The detected features (corners) on the marker ............................................................ 8
2.4. The pipeline of realizing AR....................................................................................... 9
2.5. The homography transformation between the two coordinate systems .................... 10
2.6. An example frame of an AR effect ........................................................................... 11
2.7. An example frame of multi-modal AR for a mechanical assembly.......................... 12
2.8. The system workflow of deep learning supported AR for tooling in assembly ....... 13
2.9. Synthetic dataset for R-CNN pipeline ...................................................................... 14
2.10. Synthetic data: 5 classes of CAD models of the synthetic tool dataset .................. 15
2.11. A synthetic tool rotates about three different axes .................................................. 16
2.12. Synthetic data for R-CNN ....................................................................................... 17
2.13. Region proposal network (RPN) ............................................................................. 18
2.14. Faster R-CNN architecture ..................................................................................... 18
2.15. The workflow of the integrated system .................................................................. 21
2.16. The derived transformation matrix maps the coordinate to a video frame of AR .. 22
3.1. A workstation setup for the experiment .................................................................... 23
3.2. The z-axis mechanism of the spindle assembly ........................................................ 24

viii
3.3. The installed spindle with the z-axis ......................................................................... 24
3.4. The Intersection over Union (IoU) ........................................................................... 28
4.1. A subject is performing the experiment using the paper manual.............................. 29
4.2. A subject is performing the experiment using the Smart AR system ....................... 29
4.3. Tool detection using Faster R-CNN with a surveillance camera .............................. 30
4.4. The results of detecting real tools with various orientations .................................... 31
4.5. Example frames of False Positive (FP) ..................................................................... 33
4.6. AR integrated with the tool detector for Step 3 of the assembly task ....................... 33
4.7. AR integrated with the tool detector for Step 4 of the assembly task ....................... 34
4.8. The mean completion time of two groups ................................................................ 36
4.9. The mean number of errors of two groups................................................................ 36
4.10. The comparison of three types of error ................................................................... 37
4.11. Two subjects perform Step 2 with two different instructional guidance ................ 39
4.12. The wear of a V-wheel mechanism caused by the installation error ...................... 39

ix
LIST OF TABLES
Table Page
3.1. The spindle assembly task ........................................................................................ 25
3.2. Three types of assembly errors ................................................................................. 27
4.1. Average Precision on detecting different real tools .................................................. 32
4.2. Results of the group using paper manual .................................................................. 34
4.3. Results of the group using smart AR instructional system ....................................... 35
4.4. Percentage reduction for each type of errors using the AR instruction .................... 37
4.5. Error analysis of the experiment with the paper manual .......................................... 38
4.6. Error analysis of the experiment with the smart AR system .................................... 38

1. INTRODUCTION
1.1. BACKGROUND AND MOTIVATION
In the Industry 4.0 era, consumer needs towards products of high quality, high
complexity and mass customization have been growing in a fast-moving pace. Many
companies are seeking solutions that could increase the efficacy. However, the state of
having shortage of experienced workforce has always been a critical problem while
employers are facing the rapid transition of industry. According to a Honeywell news [1],
78% of the modern technology is considered important, 65% of the technological
advances are restrained by the outdated work styles, and 38% of the current workers are
actively looking for a different position. That has reflected the urgent needs for the
system update and flexibility for workforce training. Also, the quality of products plays a
vital role as the difficulty of assembly increases, e.g., a jet engine is comprised of more
than 10,000 individual parts. Figure 1.1. shows the photo of an aircraft engine assembly
that contains a wide variety of machine parts.
Figure 1.1. Highly complex assembly of an aircraft engine [2]
2
As reported by GE [3], the company loses millions of dollars each year because
nuts and hoses that seal fluid lines are not fastened right for the jet engine, which leads to
an unnecessary cost from repairing, not to mention the safety of passengers. Therefore, to
improve the productivity, the ability to sense, monitor, characterize, and support the
workers for highly complex assembly has become even more imperative, especially when
conducting unpleasant, unsafe, exhausting tasks. To remain competitive, companies and
researchers have been attempting for solutions toward smart manufacturing by applying
emerging technologies such as Artificial Intelligence (AI), Internet-of-Things (IoT) and
industrial digital twin [4]. Many leading manufacturing companies have already noticed
the potential and started piloting Virtual Reality (VR) and Augmented Reality (AR)
technologies, which has been successfully utilized in various fields ranging from medical
area [5], to the assembly line. The significant reduction of errors, time, and training
requirements have been measured and proven by the Augmented Reality for Enterprise
Alliance (AREA) of Boeing. “This has tremendous potential to minimize errors, cut
down on costs and improve product quality” [3]. GE has witnessed the improvement in
productivity and efficiency by implementing AR. Honeywell also proved the success in
worker training with the usage of AR [1].
Although AR rendering for assembly has been demonstrated for its promising
potential, industries still do not have real-world solutions aiming at further increasing the
productivity by minimizing the assembly time and error with the assistance of AR. There
are five challenges that need to be addressed as follows:
1. The commercialized AR supported devices are usually too heavy to wear and too
expensive. This may cause concerns for practical industry use of AR devices,

3
especially at the assembly line. The accessibility and usability of the selected
resources for system development is important.
2. Besides the potential of implementing AR in the assembly industry, how an AR
guiding system need to be further improved to assist workers.
3. The capability of onsite multi-modal AR instructions needs to be provided to
enhance the knowledge transfer.
4. The capability of sensing, tracking and characterizing a working environment
needs to be advanced to provide natural, interactive feedback while workers are
performing an assembly.
5. The high flexibility and efficiency of system update in terms of data acquisition
are imperative, which are the essentials for Internet of Things (IoT) in smart
manufacturing.
1.2. RELATED WORK
In the scientific perspective, many researchers have emphasized the benefits that
AR could bring to the industry. Tao et al. [6] discussed the state-of-the-art VR/AR
technologies for assembly simulations including modeling, sensing, and interaction.
Caudell et al. [7] proposed an AR application for manual manufacturing processes.
Azuma et al. [8] presented the potential of AR with head-mounted display (HMD). Over
the past decade, more and more research regarding engineering assembly has become
popular as engineers have applied AR to different engineering scenarios [9-13]. For AR
training, Webel et al. [14] raised the problem of handheld device during assembly. Leu et
al. [15] pointed out research efforts needed to improve the realism of virtual assembly,

4
such as high-fidelity dynamic graphic displays, low-cost sensor fusion techniques, haptic
devices, and multi-modal rendering such as audio rendering [16]. Also, the lack of
natural, interactive mechanisms between the assembly operators, the assembly of
components, and the instructions being rendered need to be addressed. Werrlich et al.
[17, 18] presented an overview of evaluations using AR training, identifying the current
limitations pertaining to high similarities of existing designed experiments that need to be
improved.
With the advancement of technologies in machine learning, machines are now
able to recognize and classify objects and activities by using different classification
methods [19, 20]. Davide et al. [21, 22] successfully recognized basic motions using
signals captured from a smartphone by extracting features using classification. Ward et
al. [23] proposed a strategy for recognizing assembly motions. Tao et al. [24] developed a
Convolutional Neural Networks (CNN) model to recognize the worker activity using
IMU and sEMG signals captured from an armband. Al-Amin et al. [25] used a Kinect
sensor to perceive the worker’s activity for workforce modeling and management.
Overall, the number of research papers regarding deep learning [26] methods, such as
pattern recognition using CNN [27], R-CNN [28, 29] for object detection, have been
growing rapidly. In addition, the research pertaining to learning features from synthetic
dataset using data augmentation was presented [30, 31] for 3D object and pedestrian
detection, which identifies the utility when training data is limited.

5
1.3. OVERVIEW OF THE PROPOSED SYSTEM
A smart AR instructional system with the support of deep learning is introduced
in this study, which is intended to further improve the performance of a worker through
assistive smart instruction. To develop the system, a combination of sensors is applied to
capture the information of a working area while the augmented view is rendered via an
onsite display. Once the environmental data has been obtained, the captured information
are sent to a fine-tuned deep learning model for decision making. After that, the predicted
results are transmitted to the AR system through an Internet Protocol (IP) as the system
will superimpose AR information accordingly in a worker’s view for assembly
instruction rendering. Figure 1.2 summarizes the overall system workflow.
Figure 1.2. Overview of the proposed system
Augmented Reality Guidance
Sensors
Deep Learning
Decision making
Multi-modal Augmented Reality Display
Assembly
Knowledge Transfer
Task
Worker
Guiding/TrainingEnvironmental Perception

6
2. TECHNOLOGY COMPONENTS AND SYSTEM OVERVIEW
2.1. MULTI-MODAL AUGMENTED REALITY
To visualize and understand onsite instructions, an AR instructional system which
offers multi-threading display including texts, graphics, animations by applying data
fusion needs to be created. With multi-modal AR instructions, workers are able to
directly sense and comprehend the physical environment while following the AR
instructions step by step. Figure 2.1. illustrates the proposed multi-modal AR system.
Figure 2.1. The proposed multi-modal AR instructional system
To realize the multi-modal AR display, a marker is attached to a workbench so
the webcam can perceive the information of the patterns from the marker for feature
recognition and tracking, so as to superimpose the computer-generated (CG) data in a
worker’s view. To successfully achieve the data overlaying process, an effective camera
pose estimation approach for coordinate transformation is required. The process of
Multi-modal AR system
Video Animation
Graphics-based Instruction
Text-based Instruction

7
achieving multi-modal AR involves several technology components as described in the
following sections.
2.1.1. Feature Extraction. Features (corners) are first to be extracted for target
recognition. Corners are regions within the image with large variations in intensity, which
can be detected using a sliding window to measure intensity change. The equation of the
sliding window is:
𝐸(𝑢, 𝑣) = ∑𝑤(𝑥, 𝑦)[𝐼(𝑥 + 𝑢, 𝑦 + 𝑣) − 𝐼(𝑥, 𝑦)]2
𝑥,𝑦
where 𝑤(𝑥, 𝑦) is the window function on the position of x and y within an image.
𝐼(𝑥, 𝑦) is the gradient at (𝑥, 𝑦). 𝑢 and 𝑣 are represented as the shifting distances in 𝑥 and
𝑦 directions, respectively. To find the features (corners) that yield the highest 𝐸(𝑢, 𝑣), the
second term needs to be maximized, meaning the largest change in intensity 𝐸(𝑢, 𝑣).
Figure 2.2 presents a selected image for the target marker in this study due to its large
number of features (corners).
Figure 2.2. A selected image for the target marker
(1)

8
Figure 2.3 illustrates the corners on the marker which are detected as features for
target recognition and tracking, which can be utilized for developing a 3D world
coordinate system based on the target marker for camera pose estimation.
Figure 2.3. The detected features (corners) on the marker. Corners represent the
regions which have the highest change in intensity in all directions, which are
highlighted with yellow ‘+’.
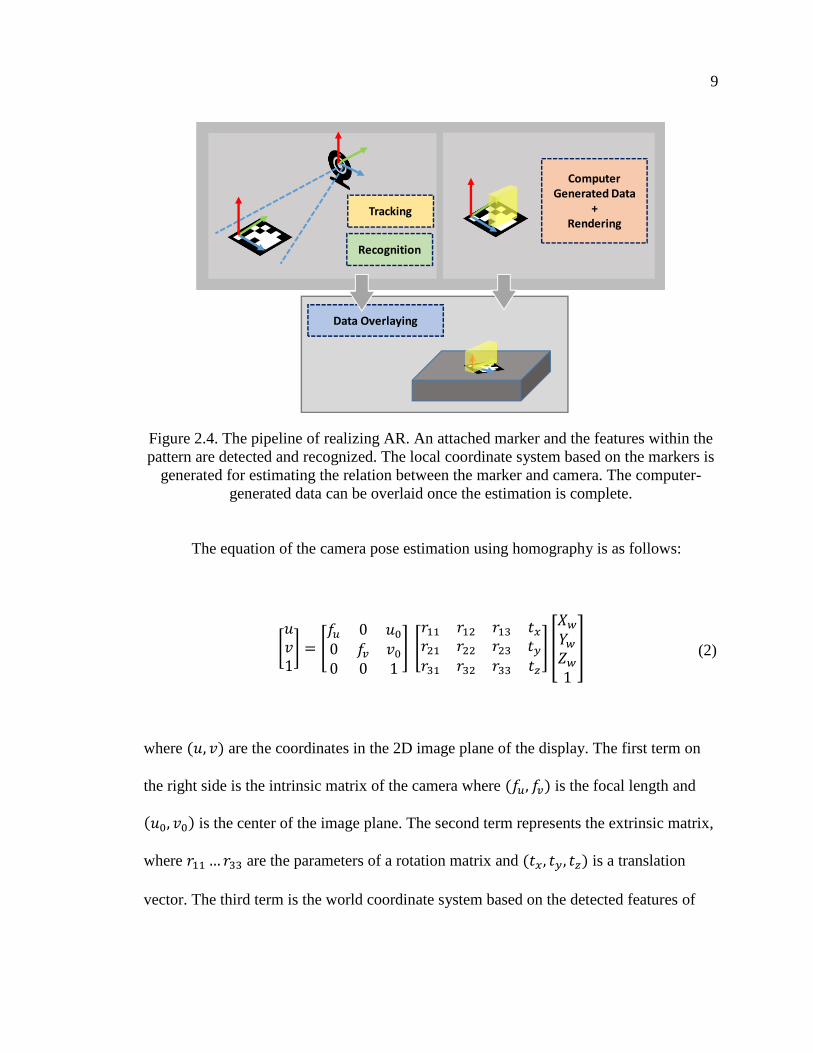
2.1.2. Camera Pose Estimation for Augmented Reality. After finishing
extracting features from a single frame, the estimation for camera pose using
homography transformation begins in order to realize AR effect. Figure 2.4. illustrates
the pipeline of realizing AR. To augment a computer-generated data onto a scene, a
homography transformation is applied to estimate the camera pose for overlaying data
spatially using a projection matrix. In this method, the calculation is initiated based on the
pinhole model assumption of the RGB webcam. The projection matrix is an integrated
matrix that combines an intrinsic matrix of the camera and an extrinsic matrix which is
comprised of a 3x3 rotation matrix and a 3x1 translation vector.
9
Figure 2.4. The pipeline of realizing AR. An attached marker and the features within the
pattern are detected and recognized. The local coordinate system based on the markers is
generated for estimating the relation between the marker and camera. The computer-
generated data can be overlaid once the estimation is complete.
The equation of the camera pose estimation using homography is as follows:
[𝑢𝑣1] = [
𝑓𝑢 0 𝑢0
0 𝑓𝑣 𝑣0
0 0 1
] [
𝑟11 𝑟12 𝑟13 𝑡𝑥𝑟21 𝑟22 𝑟23 𝑡𝑦𝑟31 𝑟32 𝑟33 𝑡𝑧
] [
𝑋𝑤
𝑌𝑤𝑍𝑤
1
]
where (𝑢, 𝑣) are the coordinates in the 2D image plane of the display. The first term on
the right side is the intrinsic matrix of the camera where (𝑓𝑢, 𝑓𝑣) is the focal length and
(𝑢0, 𝑣0) is the center of the image plane. The second term represents the extrinsic matrix,
where 𝑟11 …𝑟33 are the parameters of a rotation matrix and (𝑡𝑥, 𝑡𝑦, 𝑡𝑧) is a translation
vector. The third term is the world coordinate system based on the detected features of
Tracking
Recognition
Computer Generated Data
+Rendering
Data Overlaying
(2)

10
the target marker, which contains (𝑋𝑤, 𝑌𝑤, 𝑍𝑤). The homography transformation the
between two coordinate systems is illustrated in Figure 2.5.
Figure 2.5. The homography transformation between the two coordinate systems
Moreover, since 𝑍𝑤 in the world coordinate system can be set to zero as the 𝑍𝑤 of
the feature points on the surface of the target marker is zero, providing a convience by
replacing the third column of the extrinsic matrix to zero. Hence, the estimation equation
is simplified as follows:
[𝑢𝑣1] = [
ℎ11 ℎ12 ℎ13
ℎ21 ℎ22 ℎ23
ℎ31 ℎ32 ℎ33
] [
𝑋𝑤
𝑌𝑤𝑍𝑤
]
where the first term on the right side is the projection matrix and ℎ11 …ℎ33 are its
parameters. With the aid of the derived projection matrix, a 3D model can be accurately
overlaid onto a 2D image plane as a composite view by using coordinate transformation.
As an example, an AR composite view using homography is shown in Figure 2.6.
(3)

11
Figure 2.6. An example frame of an AR effect. A computer-generated cube is
superimposed on the target marker using homography.
2.1.3. Multi-modal AR Realization. By utilizing homography, an augmented
visual display can be realized to provide instructions for the assembly guidance through a
composite view based on the coordinate system of the marker. Therefore, an AR visual
queue can be established and deployed to a sequence of engineering assembly operations.
With the aid of visual rendering, various types of detailed instructions are shown and
augmented on the corresponding machine part through an AR display. Figure 2.7. shows
an example frame of a multi-modal AR display for a mechanical assembly. To provide
better understanding for training and performance, various types of visual AR renderings
are provided in the system, e.g., texts, videos and 3D animations for instructions. Texts and
videos are rendered through a 2D canvas of the display and AR 3D renderings are realized
by superimposing 3D models with respect to the world coordinate system based on the
target marker.

12
Figure 2.7. An example frame of multi-modal AR for a mechanical assembly. Multiple
types of instructions are rendered through displays including text, graphics, and 3D
animations.
Different colors and textures are arranged for different components, indicating
their functional uses. In addition, animations and other spatially interactive behaviors of
AR objects are realized via C# scripting in a Unity3D scene. With the augmented
instructions informed in a visual display, subjects are able to sense and understand the
operations through the provided information. However, without the tooling assistance
message, the instructions are still limited when specific tools are required to finish the
tasks correctly. To leverage it as a smart AR instructional system, a proposed tool
detector with deep learning for decision making will be discussed in the following
section.

13
2.2. DEEP LEARNING FOR TOOL DETECTION
During the manual assembly operation, how to efficiently secure every
component in order to correctly assemble the entire product is crucial. To prevent from
using wrong tools, a deep learning-based tool detector trained on a synthetic dataset is
proposed, to help workers follow AR instructions. A webcam is mounted on top of the
workbench to support workers in decision making. The camera captures video frames of
the working area for the tool detector to classify and localize the target tools. The
workflow of the proposed tool detector is presented in Figure 2.8.
Figure 2.8. The system workflow of deep learning supported AR for tooling in assembly
2.2.1. Detection Approach. This section describes the tool detector development
using a Region-based Convolutional Network (R-CNN) [28]. The detection approach
incorporates a webcam that captures 2D frames of the working area and feeds the data
into the model, which is trained on a synthetic dataset [30, 31] using Faster R-CNN [32]
…
Tooldetector
Worker
Tooling
AR tooling feedback
Task?
Tool?

14
for target classification and localization. By using CNN [27], detailed features such as
colors, contours and textures of the synthetic models are learned from the responded
weights. Given an image or a video, the detection model is able to make inferences with
the learned weights. Figure 2.9. illustrates the pipeline of R-CNN model trained on a
synthetic dataset. By data augmentation, a detector for real tools is developed using CAD
models for the tools, without the use of real tool image data.
Figure 2.9. Synthetic dataset for R-CNN pipeline
2.2.2. Synthetic Tool Dataset. Considering the expensive cost of collecting real
tool images and labeling the instances manually for a training model, a Computer-Aided
Design (CAD) model based synthetic tool dataset is adopted. The objective is to classify
and localize real tools in an assembly scenario by using only CAD models, which is
efficient when training a new classifier and the amount of real data is limited [30]. The
synthetic data for each class of tools is obtained by generating their CAD models with
Data augmentation
Tool CAD model
Synthetic dataset
Real tool detection
…
R-CNN
…
…
…
Classification+
Localization Decision making
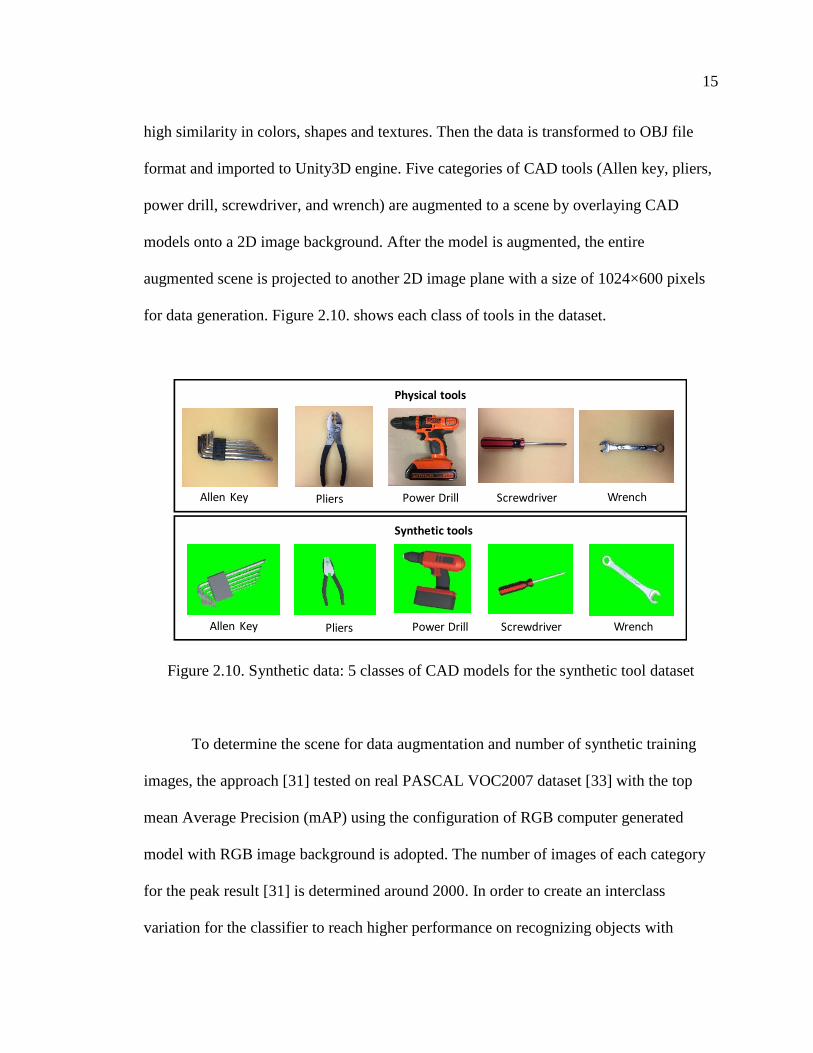
15
high similarity in colors, shapes and textures. Then the data is transformed to OBJ file
format and imported to Unity3D engine. Five categories of CAD tools (Allen key, pliers,
power drill, screwdriver, and wrench) are augmented to a scene by overlaying CAD
models onto a 2D image background. After the model is augmented, the entire
augmented scene is projected to another 2D image plane with a size of 1024×600 pixels
for data generation. Figure 2.10. shows each class of tools in the dataset.
Figure 2.10. Synthetic data: 5 classes of CAD models for the synthetic tool dataset
To determine the scene for data augmentation and number of synthetic training
images, the approach [31] tested on real PASCAL VOC2007 dataset [33] with the top
mean Average Precision (mAP) using the configuration of RGB computer generated
model with RGB image background is adopted. The number of images of each category
for the peak result [31] is determined around 2000. In order to create an interclass
variation for the classifier to reach higher performance on recognizing objects with
PliersAllen Key Power Drill Screwdriver Wrench
Synthetic tools
PliersAllen Key Power Drill Screwdriver Wrench
Physical tools

16
different orientations within a scene [30, 31], a spatially varying generator is scripted and
applied to models, which enables synthetic tools to constantly alter poses within the scene
while the data is being collected. Figure 2.11. shows a synthetic tool that rotates about
three different axes. By using the approach, an efficient data generation process is
achieved. Once the augmentation is complete, a synthetic dataset with a resolution of
1024×600 of tools is developed for the deep learning model. Figure 2.12. illustrates the
process of generating synthetic dataset for each class of tools using the data
augmentation.
Figure 2.11. A synthetic tool rotates about three different axes. To create inter-class
variation for purpose of higher recognition rate, a spatially varying generator is scripted
for each class of synthetic tools.
YX
Z
…
Pose 1
Pose 2
Pose 3

17
Figure 2.12. Synthetic data for R-CNN. By using data augmentation, the synthetic dataset
can be generated with CAD models and an RGB scene (background).
2.2.3. Faster R-CNN. To build a tool detector, Faster R-CNN [32] is applied to
achieve a higher recognition rate for high resolution images [34]. Given a video frame or
an image, the detector is able to output classifications and localization results of tools.
Faster R-CNN is developed based on a CNN and has been validated as a robust network
for different levels of feature extraction [27]. After extracting features using a CNN, a
Region Proposal Network (RPN) [32] is assigned for producing high quality proposals
(bounding boxes) based on the extracted features of the convolutional feature map output
from the CNN. RPN is a small network that generates proposals with multiple scales and
aspect ratios and slide them through the convolutional feature map to detect objects.
Figure 2.13. illustrates the generated region proposals with multiple scales and aspect
ratios.
Real RGB scene
Tool CAD model renderings
Synthetic data

18
Figure 2.13. Region proposal network (RPN). An RPN generates multiple proposals and
slides through the convolutional feature map output from a CNN.
Instead of feeding multiple unselected proposals computed from the external
approach such as the selective search method [34] by merging adjacent pixels, RPN
detects whether if there is an object in the proposal (bounding-box). It will pass forward
for object classification and bounding-box regression only if there is an object detected
within the proposal. Figure 2.14. summarizes the overall workflow of the Faster R-CNN
architecture.
Figure 2.14. Faster R-CNN architecture.
Region Proposal Network (RPN)
ROI pooling
Classification loss
Bounding-box regression loss
Classification loss
Bounding-box regression loss
Region proposals
CNN
Object or not
BB proposal
Object class
BB refinementDataset

19
An image frame is fed into a deep convolutional neural network for feature
extraction. Then a Region Proposal Network is implemented to compute high-quality
region proposals and pass forward to classification and bounding box regression. The
model is trained by optimizing a set of weights, which minimizes the loss (cost) as the
objective function while learning. The objective function is given below:
𝐿({𝑝𝑖}, {𝑡𝑖}) = 1
𝑁𝑐𝑙𝑠∑𝐿𝑐𝑙𝑠(𝑝𝑖, 𝑝𝑖
∗)
𝑖
+ 𝜆1
𝑁𝑟𝑒𝑔∑𝑝𝑖
∗𝐿𝑟𝑒𝑔(𝑡𝑖, 𝑡𝑖∗)
𝑖
The two terms on the right side represent classification and bounding-box
regression, respectively. Symbol 𝑖 indicates the index of proposals generated while using
RPN. 𝑝𝑖∗ is the binary classification label where it returns 1 when the object in the
proposal is detected, and 0 otherwise. The bounding-box regression loss is activated only
when 𝑝𝑖∗ = 1, which contains 𝑡𝑖 and 𝑡𝑖
∗, attributing to four parameterized coordinates of
the predicted box and the ground-truth box. After computing the object score using RPN,
an ROI (Region of Interest) pooling layer is inserted to reduce the computation of the
network by down-sampling the spatial size of the parameters. The classification of the
detected object in the bounding-box is achieved by using a softmax function to predict
classification scores over 5 classes of tools as follows:
𝑃(𝑦𝑖|𝑥𝑖) = exp(𝑆𝑖)
∑ exp(𝑆𝑘)5𝑘=1
(4)
(5)

20
where 𝑃(𝑦𝑖|𝑥𝑖) is the predicted probability of a given image 𝑥𝑖 and 𝑆𝑖, 𝑖 ∈ [1,5] is a 5-
dimensional score vector representing the five different classes of tools. These five
probability scores are normalized between zero and one as confidence scores that sum to
one. For the bounding-box regression of the detected object, the bounding-box regressor
is adopted from [28]. During training, N pairs of ground-truth boxes G and proposed
boxes P are defined as training inputs, which are denoted as {(𝑃𝑖 , 𝐺𝑖)}𝑖=1,…,𝑁, where 𝑃𝑖 =
(𝑃𝑥𝑖 , 𝑃𝑦
𝑖 , 𝑃𝑤𝑖 , 𝑃ℎ
𝑖 ) represents the pixel coordinates of the center, width, and height of 𝑃𝑖. The
ground-truth boxes are also represented as 𝐺𝑖 = (𝐺𝑥𝑖 , 𝐺𝑦
𝑖 , 𝐺𝑤𝑖 , 𝐺ℎ
𝑖 ). The training process is to
learn the transformation and map the proposed box 𝑃 to 𝐺, which is denoted as four
functions: 𝑑𝑥(𝑃), 𝑑𝑦(𝑃), 𝑑𝑤(𝑃), 𝑑ℎ(𝑃). After the transformation is learned, the
predicted box �̂� can be generated by using the following transformations:
�̂�𝑥 = 𝑃𝑤𝑑𝑥(𝑃) + 𝑃𝑥
�̂�𝑦 = 𝑃ℎ𝑑𝑦(𝑃) + 𝑃𝑦
�̂�𝑤 = 𝑃𝑤 exp (𝑑𝑤(𝑃))
�̂�𝑥 = 𝑃ℎ exp (𝑑ℎ(𝑃))
In the above equation, each 𝑑∗(𝑃) (where ∗ is one of 𝑥, 𝑦, ℎ, 𝑤) is denoted as
𝑤∗𝑇ϕ(𝑃), where ϕ(𝑃) is modeled as a linear function of the features of a proposal and 𝑤∗
is a vector of learnable model parameters [28]. After adopting the approach of object
detection for AR tooling message, the system development and a designed experiment
are determined for the evaluation, which will be discussed in the following sections.
(6)
(7)
(8)
(9)

21
2.3. SYSTEM OVERVIEW
For the smart AR instructional system development, two proposed systems are
integrated through a connection of a User Datagram Protocol (UDP) socket. To provide
ab AR tooling message, the detection results of the tool detector are transmitted through a
scripted internet protocol (IP) listener to the AR domain, activating computer-generated
visuals augmented on the corresponding tools for workers to locate. Figure 2.15. presents
the workflow of the integrated system. Two RGB webcams are responsible for providing
image data for multi-modal AR rendering and tool detection, respectively. The system
integration is achieved with a UDP/IP socket, which is assigned for data transmission.
Figure 2.15. The workflow of the integrated system
Since the integrated system runs with two different webcams, mapping the
coordinates from the 2D image plane of R-CNN to the 2D image frame of AR is
AR + Deep Learning
Integrated system
Webcam 1
Webcam 2
Given task
Multi-modal AR instruction
R-CNN for tool detection
UDP/IP
Internet communication protocol

22
required. An affine transformation is utilized for coordinate transformation. The function
of the transformation is:
[𝑥′𝑦′
𝑤′
] = [𝑎1 𝑎2 𝑎3𝑎4 𝑎5 𝑎60 0 1
] [𝑥𝑦𝑤]
where (𝑥, 𝑦, 𝑤) represents three center points of three drawn bounding-boxes in the
image plane of R-CNN, respectively. (𝑥′, 𝑦′, 𝑤′) indicates three corresponding points in
a video frame of AR. 𝑎1…𝑎6 are the target parameters of the transformation matrix.
Once the transformation matrix is computed through two sets of points from two different
coordinate systems, the coordinate transformation can be achieved through the derived
matrix. Figure 2.16. shows the workflow of mapping an AR visual with coordinate
transformation.
Figure 2.16. The derived transformation matrix maps the coordinate to a video frame of
AR. By using affine transformation, the coordinates of the detected tool in R-CNN can be
converted to the coordinates in AR through a computed transformation matrix.
Video frame of R-CNN Video frame of AR
Coordinate transformation
Detected tool position Mapped AR visual
(10)
0)

23
3. EXPERIMENT
3.1. EXPERIMENTAL SETUP
To evaluate the performance of the proposed system, an experimental setup with
two webcams and one monitor for the on-site display is designed. One top-down webcam
is mounted on top of the workbench as a surveillance camera to capture the working area
for tool detection and the other webcam is situated on a neighboring tripod for the AR
display. To simulate the assembly scenario in the industry, a given toolkit for the
assembly task is arranged aside. A photo of the full workstation setup for the designed
experiment is shown in Figure 3.1.
Figure 3.1. A workstation setup for the experiment. One webcam is mounted on top of
the workbench as a surveillance camera and the other camera is situated on a neighboring
tripod. A monitor for the onsite display is attached to the workbench. All the required
components and the toolkit are also arranged aside.
Toolkit for the assembly
Webcam for tool detection
Marker for homography transformation
Spindle carriage
Webcam for AR
AR onsite display
Z-Axis
Box for components
24
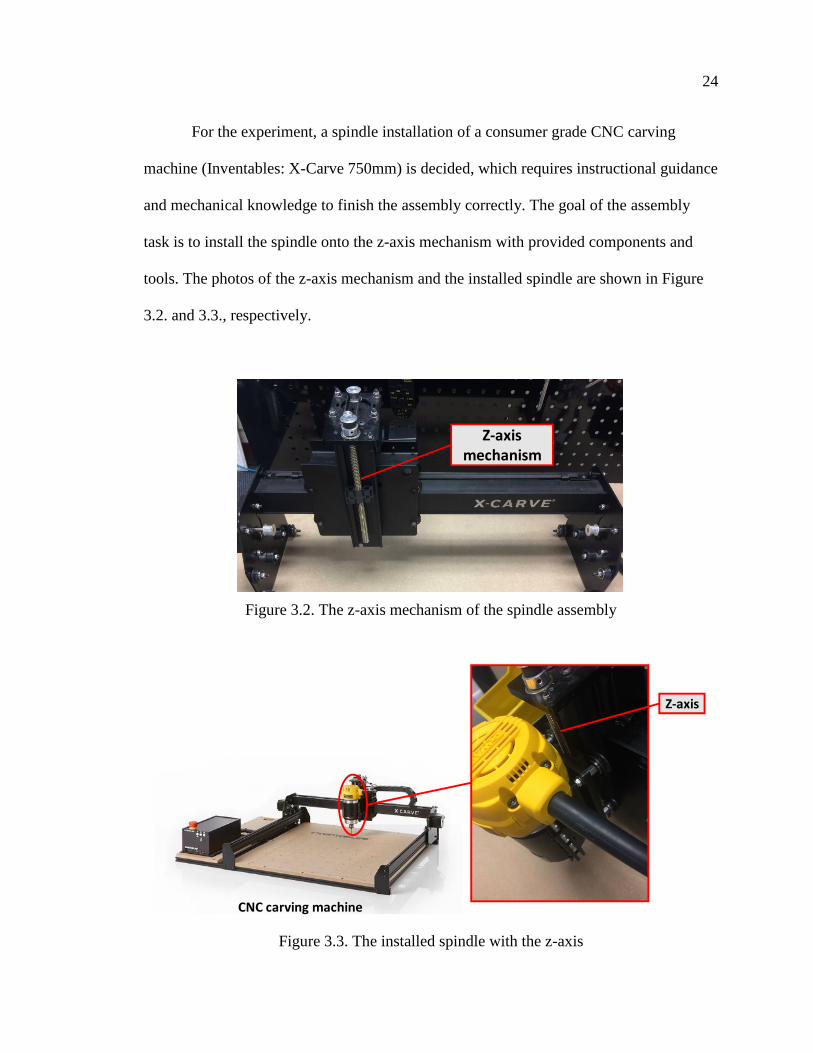
For the experiment, a spindle installation of a consumer grade CNC carving
machine (Inventables: X-Carve 750mm) is decided, which requires instructional guidance
and mechanical knowledge to finish the assembly correctly. The goal of the assembly
task is to install the spindle onto the z-axis mechanism with provided components and
tools. The photos of the z-axis mechanism and the installed spindle are shown in Figure
3.2. and 3.3., respectively.
Figure 3.2. The z-axis mechanism of the spindle assembly
Figure 3.3. The installed spindle with the z-axis
Z-axis mechanism
CNC carving machine
Z-axis

25
The spindle installation contains seven steps. Each step consists of multiple
operations that require different tools or components for the assembly. The summarized
information provided on the instructional manual is given in Table 3.1. along with its
graphical illustrations [36]. With the defined engineering tasks, the experimental setup is
determined. The experimental procedure will be discussed in the next section.
Table 3.1. The spindle assembly task [36]
Step
No.
Name Graphic
instruction
Tool/Component Instruction
1
Insert
spindle
carriage
clamping
bolts
Tool: Allen key
Component:
Socket head
screw M4 x
16mm
Thread in three of the M4 x
16mm socket head screws.
2
Attach
spindle
Carriage
to Z-axis
(1)
None Starting from the bottom of
the Z axis, slide on the
spindle carriage.
3
Attach
spindle
Carriage
to Z-axis
(2)
Tool: Allen key
Component:
Button head cap
screw M5 x
16mm
Use two M5x16mm button
head cap screws to attach the
carriage to the delrin nut of
the leadscrew.
4
Attach
spindle
Carriage
to Z-axis
(3)
Tool: 8mm
wrench
Component:
Lock nut
Use an 8mm wrench to adjust
the variable wheels so they
ride snugly on the carriage,
but not so tight that they
cannot be moved by hand.

26
Table 3.1. The spindle assembly task [36] (Cont.)
5
Attach
Z-axis
home
switch
Tool: Allen key
& pliers
Component:
screw, nut
Thread on an M3 nylock nut
and tighten it against the plate
with either a 5.5mm socket as
pictured here, or with the
appropriate wrench/pliers.
6
Spindle
(1)
Tool: Screw
driver
Component:
Spindle
Use a screwdriver or other
prying tool to gently pry the
spindle mount open and insert
the router until the yellow
button shows through on the
bottom of the spindle mount.
7
Spindle
(2)
Tool: Allen key
Component:
Socket head
screw M4 x
16mm
Tighten the three M4x16mm
screws to hold the router in
place.
3.2. SYSTEM EVALUATION
The completion time and number of errors are the most crucial indicators to
evaluate the performance of an assembly operation [37], thus two kinds of data are
recorded for evaluation.
3.2.1. Subject Selection and Testing. To collect data, 20 physically
and cognitively healthy subjects, including male and female graduate students and
faculties at the average age of 28 at Missouri S&T are recruited. All the subjects are
confirmed having no prior knowledge of the experiment. They are divided into two
groups of 10 subjects to conduct the experiment. One group is asked to perform the
assembly by using the paper manual available from the manufacturer, and the other group

27
performs the assembly with the smart AR system developed. During the experiment, each
of the subjects is asked to stand in front of the workbench to perform the assembly task.
The elapsed time is recorded with a stopwatch and the number and type of errors is
documented if a mistake occurs. Three types of assembly errors are in Table 3.2, which
are considered the most generic errors in a mechanical manual assembly process [37].
Table 3.2. Three types of assembly errors
No. Error type Description
1 Tool/Part selection Misuse the tool/part to conduct the assembly
2 Assembly order Assemble with incorrect sequence
3 Installation Assemble with incorrect installation/fixation
As shown in Table 3.2., the tool/part selection error occurs when a subject
misuses incorrect tool/part to perform the assembly tasks. The assembly order error could
be caused by mistakenly following the sequence of instructional guidance or assemble
components in an incorrect order. The installation error takes place when a subject install
parts with incorrect fixation, which includes mismatching components or securing them
improperly.
3.2.2. Evaluation Metric. For the quantitative evaluation of the tool detector
developed, the Intersection over Union (IoU) metric [33] is adopted. If a ground-truth
box and a predicted box are overlapped by 0.5 or larger, then the prediction is a True
Positive (TP). The formula is denoted by:
𝑎𝑜 =𝑎𝑟𝑒𝑎(𝐵𝑝 ∩ 𝐵𝑔𝑡)
𝑎𝑟𝑒𝑎(𝐵𝑝 ∪ 𝐵𝑔𝑡) (11)
0)

28
where 𝑎𝑜 represents the overlap ratio between the ground-truth box 𝐵𝑔𝑡 and predicted
box 𝐵𝑝. 𝐵𝑝 ∩ 𝐵𝑔𝑡 and 𝐵𝑝 ∪ 𝐵𝑔𝑡 are the intersection and union of them, respectively.
Figure 3.4. provides an illustration of IoU.
Figure 3.4. The Intersection over Union (IoU)
To calculate Average Precision (AP), the Precision metric [33] is defined as:
𝑃𝑟𝑒𝑐𝑖𝑠𝑖𝑜𝑛 = 𝑇𝑃
𝑇𝑃 + 𝐹𝑃
where True Positive (TP) represents an instance from the target class that is correctly
classified as the target class. False Positive (FP) represents an instance from a class other
than the target class that is misclassified as the target class.
Intersection
Union
(12)
0)

29
4. RESULTS
In this section, the experimental results are discussed, including the tool detector
and smart AR rendering, as well as the evaluation of the integrated system. Figures 4.1.
and 4.2. show two snapshots of two subjects performing the assembly experiment using
two different methods (paper manual vs. Smart AR) for system evaluation.
Figure 4.1. A subject is performing the experiment using the paper manual
Figure 4.2. A subject is performing the experiment using the Smart AR system

30
4.1. TOOL DETECTOR AND SMART AR RENDERING
The tool detector is achieved by fine-tuning a Faster R-CNN pre-trained model
using TensorFlow object detection API with approximately 64K iterations and the
learning rate of 3×10⁻⁴. The classification layer of the Faster R-CNN algorithm is
modified to output softmax probability scores in [0, 1] over 5 classes of tools. Once the
tools are detected in a video frame, the detector draws bounding-boxes around the located
tools using bounding box regression. Figure 4.3. shows two example detection results of
all the classes of tools of the experimental setup.
(a)
(b)
Figure 4.3. Tool detection using Faster R-CNN with a surveillance camera
31
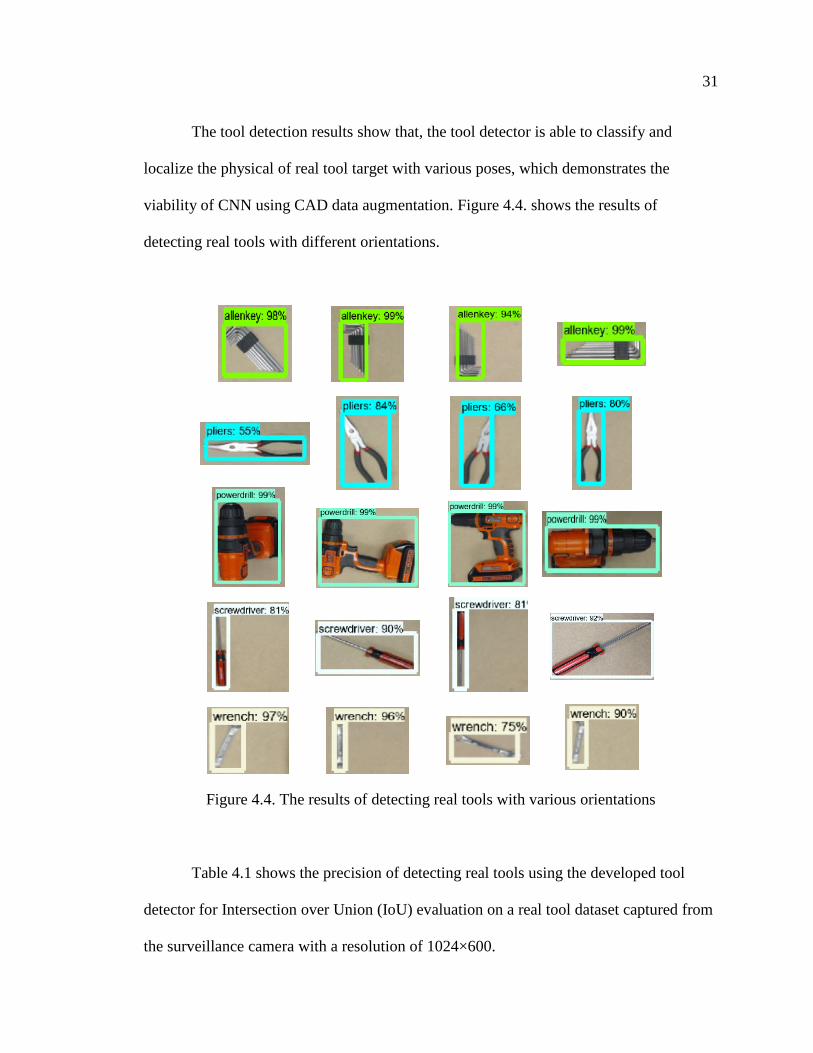
The tool detection results show that, the tool detector is able to classify and
localize the physical of real tool target with various poses, which demonstrates the
viability of CNN using CAD data augmentation. Figure 4.4. shows the results of
detecting real tools with different orientations.
Figure 4.4. The results of detecting real tools with various orientations
Table 4.1 shows the precision of detecting real tools using the developed tool
detector for Intersection over Union (IoU) evaluation on a real tool dataset captured from
the surveillance camera with a resolution of 1024×600.

32
Table 4.1. Average Precision on detecting different real tools
Tool Average Precision
Allen Key 64.7%
Pliers 95.9%
Power drill 72.4%
Screwdriver 97.2%
Wrench 93.5%
mean 84.7%
The mean of the Average Precision for the five tools is 84.7%, indicating a strong
performance of utilizing synthetic data for real object detection. As shown in Table 4.1.,
screwdriver outperforms all the other tools, likely due to the unique tool shape and color
of the grip. Allen key has the lowest score of precision, which is possibly caused by its
shape and color that may result in a confusion with other non-tool objects in the
background. Figure 4.5. shows the example frames of False Positive (FP), which lead to
decrease in precision of predicting Allen key and power drill. Two irrelevant objects in
the bounding-boxes are misclassified as Allen key and power drill with the detection
scores of 51% and 53% that are output from the softmax function, indicating a lower
confidence of predicted classes inside the bounding-boxes. Clearly, the background
affects the precision of tool recognition as False Positive occurs. Also, a decrease in the
precision there are more objects within the captured frame.

33
Figure 4.5. Example frames of False Positive (FP). The misclassification occurs when
video frames include non-tool objects in the background
According to the assembly requirements, subjects need to fasten the components
with the required tools while following the AR assembly instruction. By combing multi-
modal AR rendering and the tool detector, AR visuals of tooling message are provided. In
Figure 4.6. and 4.7., two example frames representing two instances of the integrated
system during the assembly are shown. The red rectangle in the figure highlights the
position of the tool generated by the of tool detector while the AR assembly instructions
are also rendered in each frame, displaying a current state of the operation.
Figure 4.6. AR integrated with the tool detector for Step 3 of the assembly task
AR tool detector

34
Figure 4.7. AR integrated with the tool detector for Step 4 of the assembly task
4.2. SYSTEM EVALUATION RESULT AND DISCUSSION
To evaluate the validity of the integrated system, assembly completion time and
number of errors of the two groups are presented in Tables 4.2. and 4.3.
Table 4.2. Results of the group using paper manual
Subject
Gender
Total
number of
errors
Number
of error
type 1
Number
of error
type 2
Number
of error
type 3
Completion
time (s)
1 Male 6 1 1 4 725
2 Male 2 2 616
3 Female 3 1 2 729
4 Male 2 2 596
5 Male 4 2 2 1057
6 Male 6 1 5 712
7 Male 2 1 1 689
8 Male 3 3 605
9 Male 3 1 2 708
10 Female 3 2 1 1113
Mean — 34 — — — 755
AR tool detector

35
Table 4.3. Results of the group using smart AR instructional system
Subject
Gender
Total
number of
errors
Number
of error
type 1
Number
of error
type 2
Number
of error
type 3
Completion
time (s)
11 Male 1 1 424
12 Male 2 2 359
13 Male 2 2 531
14 Male 1 1 531
15 Male 5 1 4 600
16 Female 4 4 914
17 Male 2 1 1 421
18 Male 1 1 573
19 Male 3 3 413
20 Female 2 1 1 278
Mean — 23 — — — 504.4
As shown above, the two results of using different instructional guidance are
recorded and analyzed. Also, Figures 4.8. and 4.9. compare the mean completion time
and the mean number of errors using ANOVA for the two groups. By following the smart
AR instruction, the completion time is reduced by 33.2%, and the assembly error of using
the proposed system is reduced by 32.4% comparing to the conventional method of using
a paper manual. These reductions are mainly due to the paper manual difficult to
interpret, resulting in the subject spending more time on retrials and understanding the
instructions in order to assemble correctly.

36
Figure 4.8. The mean completion time of two groups
Figure 4.9. The mean number of errors of two groups

37
Figure 4.10. The comparison of three types of error
Table 4.4. Percentage reduction for each type of errors using the AR instruction
Error type 1 2 3
Reduction 72.7% 100% 4.8%
Figure 4.10. and Table 4.4. present a comparison and the percentage of reduction
for each type of errors with the assistance of the smart AR instructional system. As
shown, two types of errors including tool/part selection (Type 1) and assembly sequential
order (Type 2) errors are reduced by 72.7% and 100% respectively, with the aid of
dynamic AR queue and tool detection. The installation error is recorded as the most
error-prone from both groups, which also has the least improvement in error reduction
with the use of AR assistance. Tables 4.5. and 4.6. present a more detailed summary of
errors from the two different groups, which contain error type and how the errors are
made in each step along with the documented description of the spindle assembly task.

38
Table 4.5. Error analysis of the experiment with the paper manual
Type
Step
1 2 3 Description
1 3 1 8 Type 1: Should use an Allen key, instead of a screwdriver
Type 2: Incorrect assembly sequence
Type 3: Should leave the screws loose
2 12 Type 3: Mismatch the carriage and the track
3 2 1 Type 1: Should use an Allen key, instead of a screwdriver
Type 2: Should tighten the screws first
4 1 Type 3: Securing incorrect nuts
5 1 Type 3: Apply too much torque while securing the screw
6 1 Type 1: Should use a screwdriver, instead of a screwdriver
7 4 Type 1: Should use an Allen key, instead of a screwdriver
Table 4.6. Error analysis of the experiment with the smart AR system
Type
Step
1 2 3 Description
1 3 Type 3: Should leave the screws loose
2 12 Type 3: Mismatch the carriage and the track
3 2 2 Type 1: Should use an Allen key, instead of a screwdriver
Type 3: Mismatch the carriage and the delrin nut
5 1 Type 1: Should use pliers, instead of a wrench
6 3 Type 3: Pry at an incorrect position
According to the analysis, Type 3 errors in Step 2 are the most recorded type of
error using either the manual or the smart AR system. Examining those errors provides
the following insight: although AR rendering is able to provide spatial information
regarding the geometry of the parts to be assembled, improvement in the AR system still
needed in order to help workers comprehend the relationships among different parts, e.g.,
matching a V-wheel mechanism of the carriage to the track on the z-axis. Figure 4.11.
shows two snapshots of two subjects performing Step 2 with two different guiding

39
instructions in the assembly process. Moreover, a quality assembly should be finished in
one-time installation to avoid damage from retrials. Figure 4.12. shows a snapshot of the
wear on a V-wheel mechanism that is damaged by repeated failure at mounting the
carriage on the z-axis track from Step 2, which may downgrade the quality of the
assembly. The proposed AR guiding system can be further improved based on the
recorded errors.
Figure 4.11. Two subjects perform Step 2 with two different instructional guidance
Figure 4.12. The wear of a V-wheel mechanism caused by the installation error
Smart AR Paper manual

40
To sum up, the experimental results indicate a considerable improvement in the
assembly performance by implementing smart AR instructions to mechanical assembly
tasks in comparison to the conventional method of using paper manuals. The developed
AR guiding system has demonstrated the promising potential of integrating AR and deep
learning for manual assembly.

41
5. CONCLUSION
This thesis presents the development of a smart Augmented Reality (AR) worker
assembly instructional system aiming at improving the worker’s performance by
incorporating deep learning into augmented reality for mechanical assembly. The
developed system consists of multi-modal AR instructions allowing workers to respond
intuitively and a tool detector using deep learning. The multi-modal AR rendering that
provides various types of on-site instructions (texts, videos, 3D animations) is realized
with the aid of homography in Unity3D. The tool detector is developed with a Faster R-
CNN trained on a CAD based synthetic tool dataset, which is able to classify and localize
real physical tools with a mean Average Precision of 84.7%. Evaluating the integrated
smart AR system on the assembly of a motor spindle shows the result that it reduces the
assembly completion time by 33.2% and assembly errors by 32.4%. Thus, the integrated
AR system has demonstrated its potential in assisting human operators when performing
complex assembly tasks.

42
APPENDIX
AUGMENTED REALITY IN UNITY3D AND UDP SOCKET OPERATION
1. UNITY3D
Unity3D is a gaming engine developed by Unity Technologies that allows users to
design and build games that comprise multiple scenes with desired models and various
visual effects including 2D and 3D graphics, textures, lighting and shading. To apply the
CAD model to the scene, users need to convert the file format so it could be imported to
Unity3D and then simply load to the scene by using import asset from the drop-down
menu. The imported 3D model would be categorized as game objects and be sorted on
the hierarchy panel once it has been assigned to the scene. Figure A.1 shows the designed
part modeled in the CAD software NX 12 [38] and Figure A.2 shows the drop-down
menu for importing process.
Figure A.1. The deigned CAD model of the spindle carriage
43
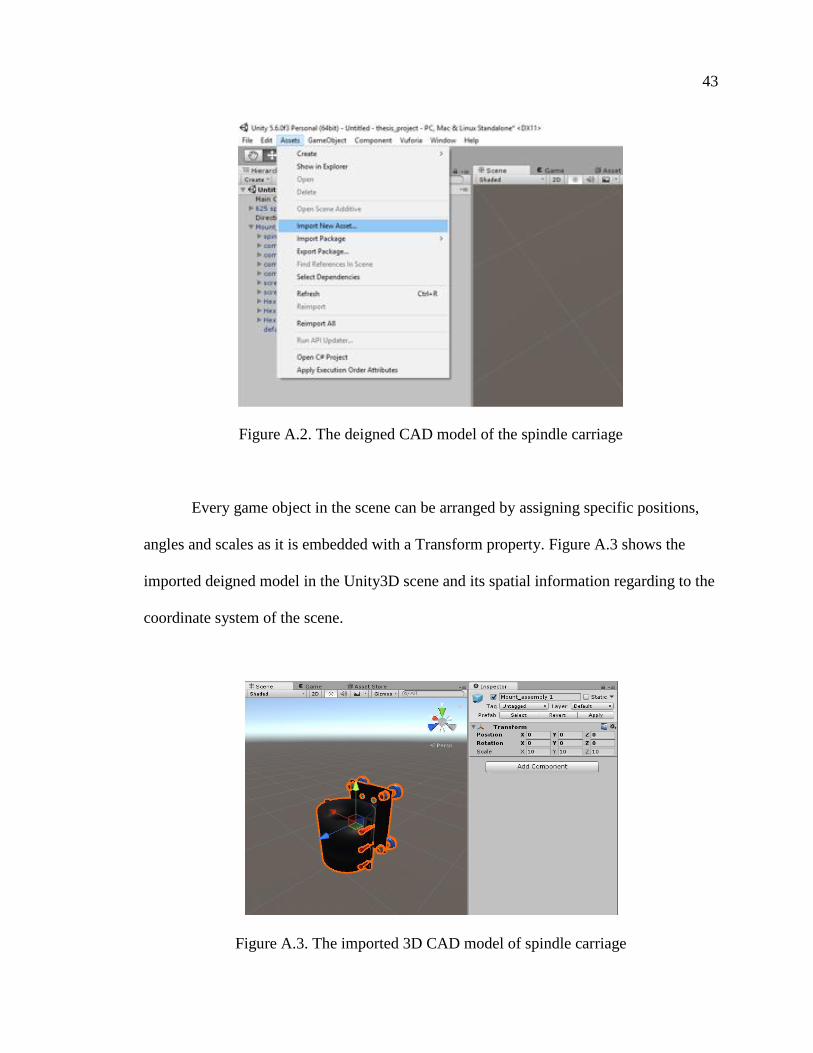
Figure A.2. The deigned CAD model of the spindle carriage
Every game object in the scene can be arranged by assigning specific positions,
angles and scales as it is embedded with a Transform property. Figure A.3 shows the
imported deigned model in the Unity3D scene and its spatial information regarding to the
coordinate system of the scene.
Figure A.3. The imported 3D CAD model of spindle carriage

44
In addition, the engine platform also supports scripting via programming
languages such as C# and JavaScript, enabling the physics and dynamic behavior of the
game object. The overall game scene and its description is illustrated in Figure A.4. After
the desired scene is developed, the user can launch the play mode to activate all of the
settings for the game objects. Also, the console of the main project panel could show the
update for the current status while under the play mode.
Figure A.5. The imported CAD model of spindle carriage.

45
2. VUFORIA
Vuforia is a Software Development Kit (SDK) for Augmented Reality that can be
directly applied as an asset for Unity3D. It provides the functionalities that offer target
recognition and tracking through the built-in Computer Vision (CV) algorithm, enabling
users to situate Computer Generated (CG) 3D visuals with respect to the world
coordinates as data registration. To define targets, users can assign markers by importing
the desired images for data augmentation with a variety of configurations for
marker-based AR. Moreover, the SDK has included several prefabs which provide a wide
variety of uses as needed, e.g., virtual button prefab for human-computer interface
without physical hardwire needed. Figure A.5. shows the applicable prefabs of Vuforia in
Unity3D.
Figure A.6. Vuforia prefab in Unity3D
To realize the AR effect, two prefabs are required for data augmentation, which
are ARCamera and ImageTarget prefabs. The ARCamera prefab would need to be
activated using provided license key from the developer portal, so the marker data can be
loaded in through the embedded Vuforia Behavior script. Once the data has been loaded,

46
the user will need to activate the Image Target Behavior of the ImageTarget prefab by
setting the dataset and image target. After the setting is finished, the augmented view can
be visualized through the display while the marker is being captured by the camera.
Figures A.6. and A.7. illustrate the two prefabs and the AR visual.
(a) (b)
Figure A.6. (a) The ARCamera prefab (b) The ImageTarget prefab
3. USER DATAGRAM PROTOCOL (UDP) SOCKET
To connect AR system with deep learning network for system implementation, a
User Datagram Protocol (UDP) socket is selected for fast speed data transmission for its
characteristics of low-latency and low bandwidth. For the system connection, the UDP
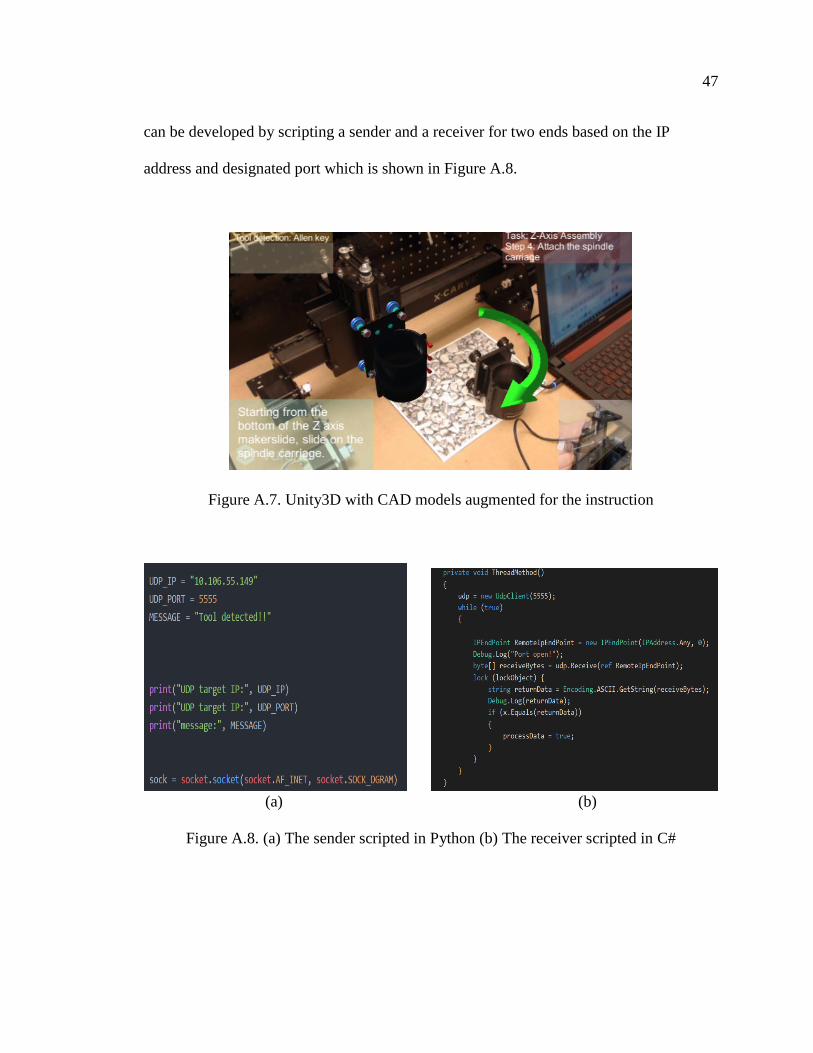
47
can be developed by scripting a sender and a receiver for two ends based on the IP
address and designated port which is shown in Figure A.8.
Figure A.7. Unity3D with CAD models augmented for the instruction
(a) (b)
Figure A.8. (a) The sender scripted in Python (b) The receiver scripted in C#

48
BIBLIOGRAPHY
[1] https://www.honeywell.com/newsroom/news/2018/02/how-ar-and-vr-are
revolutionizing-job-training
[2] https: //runwaygirlnetwork.com/2017/05/17/air-lease-corp-very-disturbed-with-
airbus-and-pratt-whitney/
[3] https://www.ge.com/reports/smart-specs-ok-glass-fix-jet-engine/
[4] Hu, Liwen, Ngoc-Tu Nguyen, Wenjin Tao, Ming C. Leu, Xiaoqing Frank Liu, Md
Rakib Shahriar, and SM Nahian Al Sunny. "Modeling of Cloud-Based Digital Twins
for Smart Manufacturing with MT Connect." Procedia Manufacturing 26 (2018):
1193-1203.
[5] Leu, Ming C., Wenjin Tao, Qiang Niu, and Xiaoyi Chi. "Virtual Bone Surgery." Bio-
Materials and Prototyping Applications in Medicine, Second Edition (2018).
[6] Tao, Wenjin, Ze-Hao Lai, and Ming C. Leu. "Manufacturing Assembly Simulations
in Virtual and Augmented Reality." Augmented, Virtual, and Mixed Reality
Applications in Advanced Manufacturing (2018).
[7] Caudell, Thomas P., and David W. Mizell. "Augmented reality: An application of
heads-up display technology to manual manufacturing processes." In System
Sciences, .1992. Proceedings of the Twenty-Fifth Hawaii International Conference
on, vol. 2, pp. 659-669. IEEE, 1992.
[8] Azuma, Ronald T. "A survey of augmented reality." Presence: Teleoperators &
Virtual Environments 6, no. 4 (1997): 355-385.
[9] Tang, Arthur, Charles Owen, Frank Biocca, and Weimin Mou. "Comparative
effectiveness of augmented reality in object assembly." In Proceedings of the SIGCHI
conference on Human factors in computing systems, pp. 73-80. ACM, 2003.
[10] Khuong, Bui Minh, Kiyoshi Kiyokawa, Andrew Miller, Joseph J. La Viola,
Tomohiro Mashita, and Haruo Takemura. "The effectiveness of an AR-based
context-aware assembly support system in object assembly." In Virtual Reality (VR),
2014 iEEE, pp. 57-62. IEEE, 2014.

49
[11] Syberfeldt, Anna, Oscar Danielsson, Magnus Holm, and Lihui Wang. "Visual
assembling guidance using augmented reality." Procedia Manufacturing 1 (2015):
98-109.
[12] Sanna, Andrea, Federico Manuri, Fabrizio Lamberti, Gianluca Paravati, and P.
Pezzolla. "Using handheld devices to support augmented reality-based maintenance
and assembly tasks." In Consumer Electronics (ICCE), 2015 IEEE International
Conference on, pp. 178-179. IEEE, 2015.
[13] Dalle Mura, Michela, Gino Dini, and Franco Failli. "An integrated environment
based on augmented reality and sensing device for manual assembly workstations."
Procedia CIRP 41 (2016): 340-345.
[14] Webel, Sabine, Uli Bockholt, Timo Engelke, Nirit Gavish, Manuel Olbrich, and
Carsten Preusche. "An augmented reality training platform for assembly and
maintenance skills." Robotics and Autonomous Systems 61, no. 4 (2013): 398-403.
[15] Leu, Ming C., Hoda A. ElMaraghy, Andrew YC Nee, Soh Khim Ong, Michele
Lanzetta, Matthias Putz, Wenjuan Zhu, and Alain Bernard. "CAD model based
virtual assembly simulation, planning and training." CIRP Annals 62, no. 2 (2013):
799-822.
[16] Wu, Shuang, Wenjin Tao, Ming C. Leu, and Suzanna Long. "Engine Sound
Simulation and Generation in Driving Simulator." IISE Annual Conference and
Expo 2018, pp. 611-616.
[17] Werrlich, S., E. Eichstetter, K. Nitsche, and G. Notni. "An Overview of Evaluations
Using Augmented Reality for Assembly Training Tasks." World Academy of
Science, Engineering and Technology, International Journal of Computer,
Electrical, Automation, Control and Information Engineering 11, no. 10 (2017):
1074-1080.
[18] Werrlich, Stefan, Kai Nitsche, and Gunther Notni. "Demand Analysis for an
Augmented Reality based Assembly Training." In Proceedings of the 10th
International Conference on PErvasive Technologies Related to Assistive
Environments, pp. 416-422. ACM, 2017.
[19] Tao, Wenjin, Ming C. Leu, and Zhaozheng Yin. "American Sign Language alphabet
recognition using Convolutional Neural Networks with multiview augmentation and
inference fusion." Engineering Applications of Artificial Intelligence 76 (2018):
202-213.

50
[20] Tao, Wenjin, Ze-Hao Lai, Ming C. Leu, and Zhaozheng Yin. "American Sign
Language Alphabet Recognition Using Leap Motion Controller." IISE Annual
Conference and Expo 2018, pp. 599-604.
[21] Anguita, Davide, Alessandro Ghio, Luca Oneto, Xavier Parra, and Jorge Luis Reyes-
Ortiz. "A Public Domain Dataset for Human Activity Recognition using
Smartphones." In ESANN. 2013.
[22] Anguita, Davide, Alessandro Ghio, Luca Oneto, Francesc Xavier Llanas Parra, and
Jorge Luis Reyes Ortiz. "Energy efficient smartphone-based activity recognition
using fixed-point arithmetic." Journal of universal computer science 19, no. 9
(2013): 1295-1314.
[23] Ward, Jamie A., Paul Lukowicz, Gerhard Troster, and Thad E. Starner. "Activity
recognition of assembly tasks using body-worn microphones and accelerometers."
IEEE transactions on pattern analysis and machine intelligence 28, no. 10 (2006):
1553-1567.
[24] Tao, Wenjin, Ze-Hao Lai, Ming C. Leu, and Zhaozheng Yin. "Worker Activity
Recognition in Smart Manufacturing Using IMU and sEMG Signals with
Convolutional Neural Networks." Procedia Manufacturing 26 (2018): 1159-1166.
[25] Al-Amin, Md, Wenjin Tao, Ruwen Qin, and Ming C. Leu. "Sensor Data Based
Models for Workforce Management in Smart Manufacturing." IISE Annual
Conference and Expo 2018, pp. 1955-1960.
[26] LeCun, Yann, Yoshua Bengio, and Geoffrey Hinton. "Deep learning." nature 521,
no. 7553 (2015): 436.
[27] Krizhevsky, Alex, Ilya Sutskever, and Geoffrey E. Hinton. "Imagenet classification
with deep convolutional neural networks." In Advances in neural information
processing systems, pp. 1097-1105. 2012.
[28] Girshick, Ross, Jeff Donahue, Trevor Darrell, and Jitendra Malik. "Rich feature
hierarchies for accurate object detection and semantic segmentation." In
Proceedings of the IEEE conference on computer vision and pattern recognition, pp.
580-587. 2014.
[29] Girshick, Ross. "Fast r-cnn." arXiv preprint arXiv:1504.08083(2015).

51
[30] Hattori, Hironori, Vishnu Naresh Boddeti, Kris Kitani, and Takeo Kanade.
"Learning scene-specific pedestrian detectors without real data." In Computer Vision
and Pattern Recognition (CVPR), 2015 IEEE Conference on, pp. 3819-3827. IEEE,
2015.
[31] Peng, Xingchao, Baochen Sun, Karim Ali, and Kate Saenko. "Learning deep object
detectors from 3d models." In Computer Vision (ICCV), 2015 IEEE International
Conference on, pp. 1278-1286. IEEE, 2015.
[32] Ren, Shaoqing, Kaiming He, Ross Girshick, and Jian Sun. "Faster r-cnn: Towards
real-time object detection with region proposal networks." In Advances in neural
information processing systems, pp. 91-99. 2015.
[33] Everingham, Mark, Luc Van Gool, Christopher KI Williams, John Winn, and
Andrew Zisserman. "The pascal visual object classes (voc) challenge." International
journal of computer vision 88, no. 2 (2010): 303-338.
[34] Uijlings, Jasper RR, Koen EA Van De Sande, Theo Gevers, and Arnold WM
Smeulders. "Selective search for object recognition." International journal of
computer vision 104, no. 2 (2013): 154-171.
[35] Huang, Jonathan, Vivek Rathod, Chen Sun, Menglong Zhu, Anoop Korattikara,
Alireza Fathi, Ian Fischer et al. "Speed/accuracy trade-offs for modern convolutional
object detectors." In IEEE CVPR, vol. 4. 2017.
[36] http://x-carve-instructions.inventables.com/750mm/
[37] Hou, Lei, Xiangyu Wang, Leonhard Bernold, and Peter ED Love. "Using animated
augmented reality to cognitively guide assembly." Journal of Computing in Civil
Engineering 27, no. 5 (2013): 439-451.
[38] Leu, Ming C., Wenjin Tao, Amir Ghazanfari, and Krishna Kolan. "NX 12 for
Engineering Design." Missouri University of Science and Technology (2017).

52
VITA
The author of the thesis, Ze-Hao Lai was born in 1991. He received his Bachelor
of Science degree in Bio-industrial Mechatronics Engineering from National Chung
Hsing University in Taichung City, Taiwan in July 2015. He started pursuing the study
for the Master of Science program of Manufacturing Engineering in the Department of
Mechanical and Aerospace Engineering at Missouri University of Science and
Technology, Rolla, Missouri in August 2016. He received the Master of Science degree
in Manufacturing Engineering at Missouri University of Science and Technology in
December 2018.


![State of Augmented Reality, Virtual Reality and Mixed Reality · State of Augmented Reality, Virtual Reality and Mixed Reality [Microsoft Hololen] [Ready Player One] Augmented Reality](https://img.pdfslide.us/doc/110x75/5f82ab6da2d89130b90d78c7/state-of-augmented-reality-virtual-reality-and-mixed-reality-state-of-augmented.jpg)