Embed Size (px)
Citation preview
Smallholder Adoption of Soil and Water Conservation Practices in
Northern Ghana
PAUL K. NKEGBE
Department of Agricultural & Food Economics, University of Reading, UK
BHAVANI SHANKAR
London International Development Centre, School of Oriental & African Studies, UK
GRAZIANO M. CEDDIA
Department of Agricultural & Food Economics, University of Reading, UK
Paper prepared for presentation at the EAAE 2011 Congress
Change and Uncertainty Challenges for Agriculture,
Food and Natural Resources
August 30 to September 2, 2011 ETH Zurich, Zurich, Switzerland
Copyright 2011 by the authors. All rights reserved. Readers may make verbatim copies of
this document for non-commercial purposes by any means, provided that this copyright
notice appears on all such copies.
1
Smallholder Adoption of Soil and Water Conservation Practices in Northern Ghana
Abstract
Both governmental and non-governmental organizations are engaged in the promotion of soil
and water conservation practices in northern Ghana, but adoption is believed to be low. This
study thus examines the determinants of conservation practices by farming households in the
area. Data for the study was collected from 445 households located in 15 communities in
northern Ghana. Univariate, bivariate and multivariate probit models were used to analyse the
decision to adopt six conservation practices in the area. Results show the major determinants
of adoption are plot and cropping characteristics such as location; and socio-economic and
institutional variables such as number of contacts with extension officers, membership in
farmer association and distance to major market. A major policy implication of the study is
the strengthening of extension service in the area to significantly boost conservation
adoption.
Keywords: Conservation practice, multivariate, selectivity bias, Ghana.
Introduction
Ghana’s economy continues to be heavily dependent on agriculture and a critical challenge
that remains is how to increase agricultural output while at the same time maintaining the
natural resource base supporting agricultural production. The agriculture sector is a major
contributor to Ghana’s gross domestic product (GDP) with its contribution standing at 34.7
percent in 2007 at constant 1993 prices (ISSER, 2008) and also employing over 56.0 percent
of the total labour force (FAO, 2007).
Northern Ghana, which comprises Northern, Upper East and Upper West regions, is a major
food production area and the poorest in the country despite the fact that it is known to abound
in so many natural resources. According to the most recent living standards survey, the
incidence of poverty in the three northern regions of Ghana remains as high as 52.0 percent,
70.0 percent, and 88.0 percent respectively in the Northern, Upper East and Upper West
regions (GSS, 2008). The poverty in the area is caused partly by deteriorating soil conditions
and inadequate water availability for crop, livestock and other enterprises.
Food production in Ghana is concentrated in the savannah and forest zones with the three
northern regions producing a substantial portion of the national output. The three regions
have the potential for increased agricultural production, but to realize this potential requires
that the deteriorating soil conditions be addressed. Against this background, governmental
and non-governmental organizations in northern Ghana are engaged in promoting soil and
water conservation practices, such as grass stripping, composting, stone and soil bunds,
among farmers in the area. But adoption of the practices among farmers is believed to be low.
In the light of the above, the objective of this paper is to identify factors that motivate farmers
to adopt various resource conservation practices so the adoption process can be enhanced by
targeting those factors. Specifically, the paper examines the adoption of six conservation
practices viz. stone bund, soil bund, grass strip, agroforestry, cover crops and composting
using data collected in the 2008/2009 agricultural year from 445 households in northern
Ghana.
The paper makes a contribution to the literature on adoption studies, especially in northern
Ghana. Adoption of innovation or technology can generally be said not to be a random
process as farmers usually self-select into treatment (Faltermeier & Abdulai, 2009). A sound

2
approach thus requires that such selectivity issue is taken into account. The methodological
approach in this paper incorporates selectivity and also analyses all six conservation practices
simultaneously. The analysis shows that the major determinants of soil and water
conservation in the area are the farm/plot and cropping characteristics and socio-economic
and institutional variables.
The paper is organized as follows. The next section briefly reviews studies on conservation
adoption to help identify relevant variables in conservation decision making. The model is
specified in the third section. Whilst the fourth section describes the data and variables used
in the model, the penultimate section presents and discusses the results. The last section then
concludes the paper.
Previous Studies on Adoption Decisions
Empirical studies in developing countries on the adoption of soil and water conservation
practices by farmers have considered a broad range of factors. These can be loosely
categorised into personal and household attributes, farm/plot and cropping characteristics,
socio-economic and institutional factors (Knowler & Bradshaw, 2007).
The personal and household attributes include factors like education, age, family size, gender
among others. In general, education has been observed to have positive effects on
conservation (Ersado, Amacher, & Alwang, 2004; Ervin & Ervin, 1982; Pender & Kerr,
1998). However, as observed by Scherr & Hazell (1994), education might offer alternative
livelihood opportunities in off-farm activities thereby increasing the opportunity cost of
labour and competing with labour use for agricultural production. Ersado et al. (2004) find
age has a significantly negative effect on adoption of productivity enhancing technology only
as well as sequential adoption of productivity enhancing technology followed by resource
conserving technology. Amsalu & de Graaff (2007) who conducted their study in an
Ethiopian highland watershed find a weakly significant positive relation between age and
adoption of stone terraces bringing to the fore the inconsistency of evidence about the
relationship between age and innovativeness (Baidu-Forson, 1999). Contrary to their
expectations Bekele & Drake (2003) find family size to have a significantly negative relation
with certain adoption choices. But Amsalu & de Graaff (2007) who did not find statistically
significant relationship between family size and adoption of stone terraces find the continued
use of the practice was negatively impacted by the size of the family. Pender & Kerr (1998)
report evidence of labour market imperfections in one of their study villages by observing
significantly more conservation investment occurs in households having more adult males
and those with fewer females. But Bekele & Drake (2003), Nkonya et al. (2005) and Amsalu
& de Graaff (2007) do not find any significant effect of gender of household head on the
adoption of conservation practices.
Farm size and slope have been considered under farm/plot and cropping characteristics. Farm
size is found to have mixed effects on adoption of soil and water conservation practices.
While various studies (Amsalu & de Graaff, 2007; Bekele & Drake, 2003; Ersado et al.,
2004) find positive relation between adoption of conservation measures and farm size, Pender
& Kerr (1998) find differential effects of farm size on conservation investment across the
three villages they studied in India. Studies in different parts of Ethiopia (including Amsalu
& de Graaff, 2007; Bekele & Drake, 2003; Gebremedhin & Swinton, 2003; Shiferaw &
Holden, 1998) also find a significantly positive effect of the slope variable on the adoption of
soil and water conservation measures. Similar results have been reported elsewhere by
Pender & Kerr (1998) and Lapar & Pandey (1999).
3
The effects of tenure security on conservation measures adoption and investment have been
investigated by various studies. Examples of such studies include Besley (1995) in Ghana,
Gebredmehin & Swinton (2003) in Ethiopia, Pender & Kerr (1998) in India, Clay et al.
(1995) in Rwanda, and Gavian & Fafchamps (1996) in Niger. Better market access has been
observed to increase the adoption probabilities of conservation methods (Ersado et al., 2004;
Nkonya et al., 2005; Tiffen et al., 1994). Farmers’ access to information, usually measured by
contact with extension officers, has been reported to have mixed effects at different places.
Bekele & Drake (2003) find this to have a significant effect on the decision to adopt soil and
water conservation practices in the eastern highlands of Ethiopia, but Nkonya et al. (2005),
Gebremedhin & Swinton (2003), and Amsalu & de Graaff (2007) do not find any effect of
extension contact on the adoption of conservation measures.
The attitudes and behaviour of farmers towards certain technologies tend to influence the
discrete choice decisions of their neighbours. This interdependence in farm households’
adoption choices is what is referred to as ‘neighbourhood effect’. Case (1992) find strong
evidence of the influence of neighbours in the adoption of sickle harvesting technology by
Indonesian rice farmers. In their study to demonstrate the applicability of Bayesian spatial
probit estimation in agricultural economics, Holloway et al. (2002) also find strong evidence
of neighbourhood effects in the adoption of high yielding varieties among rice producers in
Bangladesh. Both studies come to the conclusion that neighbourhood effects play an
important role in the adoption decisions of smallholders, and failure to control for them could
lead to biased and unreliable estimates as well as policy conclusions. In this study, the
influence of nearby farmers is considered attitudinal since ultimately it leads to a change in
attitude towards a given conservation practice.
From the foregoing discussion, it is clear that different factors determine the adoption of
conservation practices in different parts of the world or even in different locations within a
given country due to differences in agro-ecological as well as socio-economic setting under
which production takes place (Bekele & Drake, 2003; Kessler, 2006). Conclusions emanating
from most of the studies have tended to be case-specific and in some cases contradictory
thereby justifying the proposed study.
Model and Estimation
In this study, as in other adoption studies, the choice decision of a given household is
considered to be discrete so that the choice variable is qualitative in nature. For a rational
household, if each conservation practice is seen as a possible adoption, then such a household
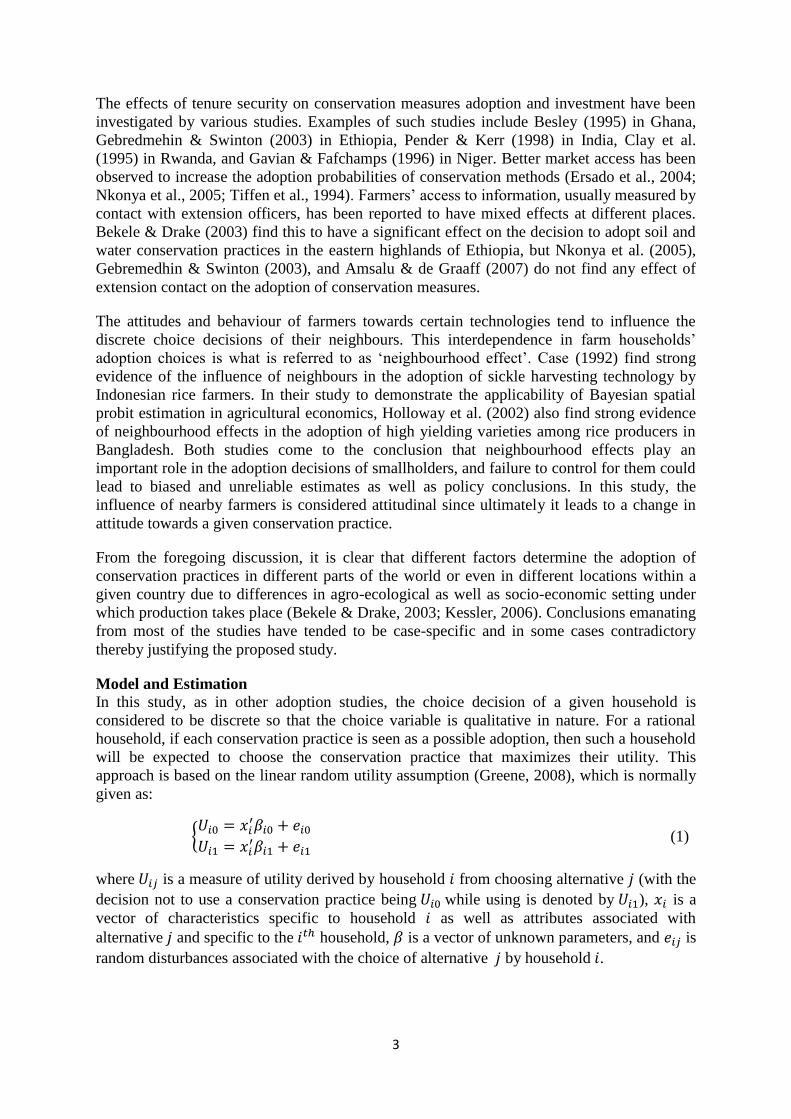
will be expected to choose the conservation practice that maximizes their utility. This
approach is based on the linear random utility assumption (Greene, 2008), which is normally
given as:
(1)
where is a measure of utility derived by household from choosing alternative (with the
decision not to use a conservation practice being while using is denoted by ), is a
vector of characteristics specific to household as well as attributes associated with
alternative and specific to the household, is a vector of unknown parameters, and is
random disturbances associated with the choice of alternative by household .
4
The probability that household chooses a particular alternative (i.e. ) versus another
(i.e. ) is associated with the probability distribution of the error differences in the
expected utilities from the choices and given by:
. (2)
From (2), is the cumulative distribution function of evaluated at ,
and is a latent variable, since it is unobservable, and is linked to , the
observed binary variable, through the relation below:
. (3)
The specification of a model to describe the relation between the probability of choosing an
alternative and the explanatory variables is dependent on the assumption made regarding the
distribution of the error term.1 Because this is a non-linear model, the effect of the
explanatory variable is measured in terms of marginal effect defined as partial change in the
probability of the outcome attributable a change in the variable.
A number of studies have observed that the adoption choice by farm households is
multivariate in nature and so the appropriate modelling procedure should not be binary, but
must instead take into account the interactions and possible simultaneity of the adoption
decisions. As a result methods such as the bivariate or multivariate probit (Amsalu & de
Graaff, 2007; Dorfman, 1996; Fuglie & Bosch, 1995), and multinomial logit (Bekele &
Drake, 2003; Burton et al., 1999; Ersado et al., 2004) for multiple choice problem have been
used in the analysis of farmer adoption decisions. In the light of this, the analysis here is
pursued at the univariate, bivariate and to some extent the multivariate levels to account for
possible contemporaneous correlation or correlated disturbances among the models as well as
selectivity effects.
If the error term in the utility model is assumed to be normally distributed, the analysis can be
carried out using a probit model. Following from (2), in the framework of the simple
(univariate) probit model, the probability function of choosing an alternative versus another is
given by:
, (4)
with and being the density and cumulative distribution
functions respectively of a standard normal random variable.
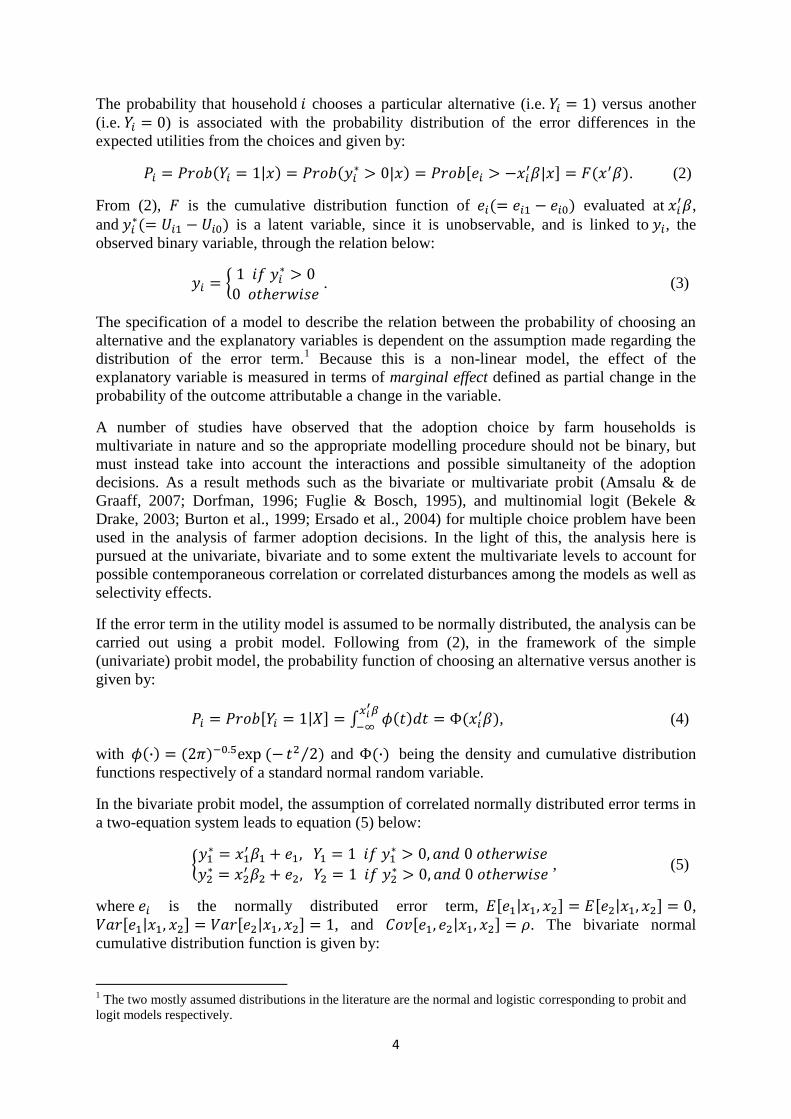
In the bivariate probit model, the assumption of correlated normally distributed error terms in
a two-equation system leads to equation (5) below:
, (5)
where is the normally distributed error term, ,
, and . The bivariate normal
cumulative distribution function is given by:
1 The two mostly assumed distributions in the literature are the normal and logistic corresponding to probit and
logit models respectively.
5
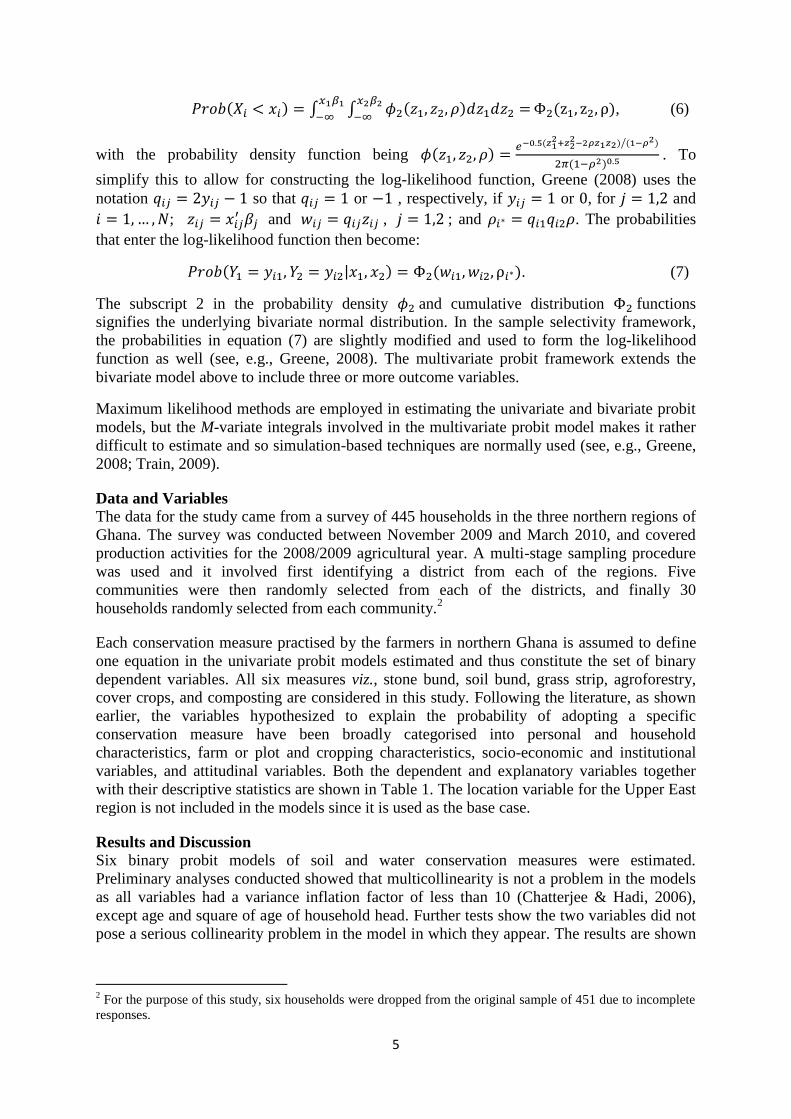
, (6)
with the probability density function being
. To
simplify this to allow for constructing the log-likelihood function, Greene (2008) uses the
notation so that or , respectively, if or , for and
; and , ; and . The probabilities
that enter the log-likelihood function then become:
. (7)
The subscript 2 in the probability density and cumulative distribution functions
signifies the underlying bivariate normal distribution. In the sample selectivity framework,
the probabilities in equation (7) are slightly modified and used to form the log-likelihood
function as well (see, e.g., Greene, 2008). The multivariate probit framework extends the
bivariate model above to include three or more outcome variables.
Maximum likelihood methods are employed in estimating the univariate and bivariate probit
models, but the M-variate integrals involved in the multivariate probit model makes it rather
difficult to estimate and so simulation-based techniques are normally used (see, e.g., Greene,
2008; Train, 2009).
Data and Variables
The data for the study came from a survey of 445 households in the three northern regions of
Ghana. The survey was conducted between November 2009 and March 2010, and covered
production activities for the 2008/2009 agricultural year. A multi-stage sampling procedure
was used and it involved first identifying a district from each of the regions. Five
communities were then randomly selected from each of the districts, and finally 30
households randomly selected from each community.2
Each conservation measure practised by the farmers in northern Ghana is assumed to define
one equation in the univariate probit models estimated and thus constitute the set of binary
dependent variables. All six measures viz., stone bund, soil bund, grass strip, agroforestry,
cover crops, and composting are considered in this study. Following the literature, as shown
earlier, the variables hypothesized to explain the probability of adopting a specific
conservation measure have been broadly categorised into personal and household
characteristics, farm or plot and cropping characteristics, socio-economic and institutional
variables, and attitudinal variables. Both the dependent and explanatory variables together
with their descriptive statistics are shown in Table 1. The location variable for the Upper East
region is not included in the models since it is used as the base case.
Results and Discussion
Six binary probit models of soil and water conservation measures were estimated.
Preliminary analyses conducted showed that multicollinearity is not a problem in the models
as all variables had a variance inflation factor of less than 10 (Chatterjee & Hadi, 2006),
except age and square of age of household head. Further tests show the two variables did not
pose a serious collinearity problem in the model in which they appear. The results are shown
2 For the purpose of this study, six households were dropped from the original sample of 451 due to incomplete
responses.
6
in Tables 2, 3, and 4. A Lagrange multiplier test for heteroscedasticity produced values less
than the critical value of 5.991 in all models, implying this is not a problem.
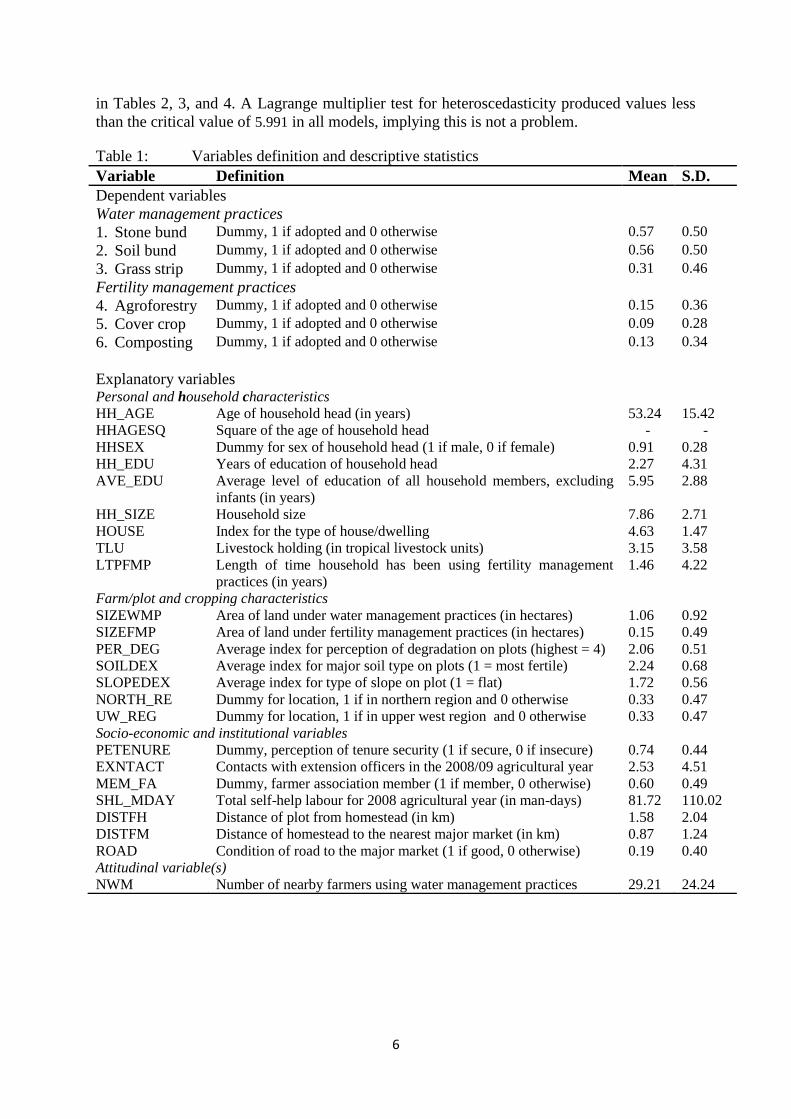
Table 1: Variables definition and descriptive statistics
Variable Definition Mean S.D.
Dependent variables
Water management practices
1. Stone bund Dummy, 1 if adopted and 0 otherwise 0.57 0.50
2. Soil bund Dummy, 1 if adopted and 0 otherwise 0.56 0.50
3. Grass strip Dummy, 1 if adopted and 0 otherwise 0.31 0.46
Fertility management practices
4. Agroforestry Dummy, 1 if adopted and 0 otherwise 0.15 0.36
5. Cover crop Dummy, 1 if adopted and 0 otherwise 0.09 0.28
6. Composting Dummy, 1 if adopted and 0 otherwise 0.13 0.34
Explanatory variables Personal and household characteristics HH_AGE Age of household head (in years) 53.24 15.42
HHAGESQ Square of the age of household head - -
HHSEX Dummy for sex of household head (1 if male, 0 if female) 0.91 0.28
HH_EDU Years of education of household head 2.27 4.31
AVE_EDU Average level of education of all household members, excluding
infants (in years)
5.95 2.88
HH_SIZE Household size 7.86 2.71
HOUSE Index for the type of house/dwelling 4.63 1.47
TLU Livestock holding (in tropical livestock units) 3.15 3.58
LTPFMP Length of time household has been using fertility management
practices (in years)
1.46 4.22
Farm/plot and cropping characteristics SIZEWMP Area of land under water management practices (in hectares) 1.06 0.92
SIZEFMP Area of land under fertility management practices (in hectares) 0.15 0.49
PER_DEG Average index for perception of degradation on plots (highest = 4) 2.06 0.51
SOILDEX Average index for major soil type on plots (1 = most fertile) 2.24 0.68
SLOPEDEX Average index for type of slope on plot (1 = flat) 1.72 0.56
NORTH_RE Dummy for location, 1 if in northern region and 0 otherwise 0.33 0.47
UW_REG Dummy for location, 1 if in upper west region and 0 otherwise 0.33 0.47
Socio-economic and institutional variables PETENURE Dummy, perception of tenure security (1 if secure, 0 if insecure) 0.74 0.44
EXNTACT Contacts with extension officers in the 2008/09 agricultural year 2.53 4.51
MEM_FA Dummy, farmer association member (1 if member, 0 otherwise) 0.60 0.49
SHL_MDAY Total self-help labour for 2008 agricultural year (in man-days) 81.72 110.02
DISTFH Distance of plot from homestead (in km) 1.58 2.04
DISTFM Distance of homestead to the nearest major market (in km) 0.87 1.24
ROAD Condition of road to the major market (1 if good, 0 otherwise) 0.19 0.40
Attitudinal variable(s) NWM Number of nearby farmers using water management practices 29.21 24.24
7
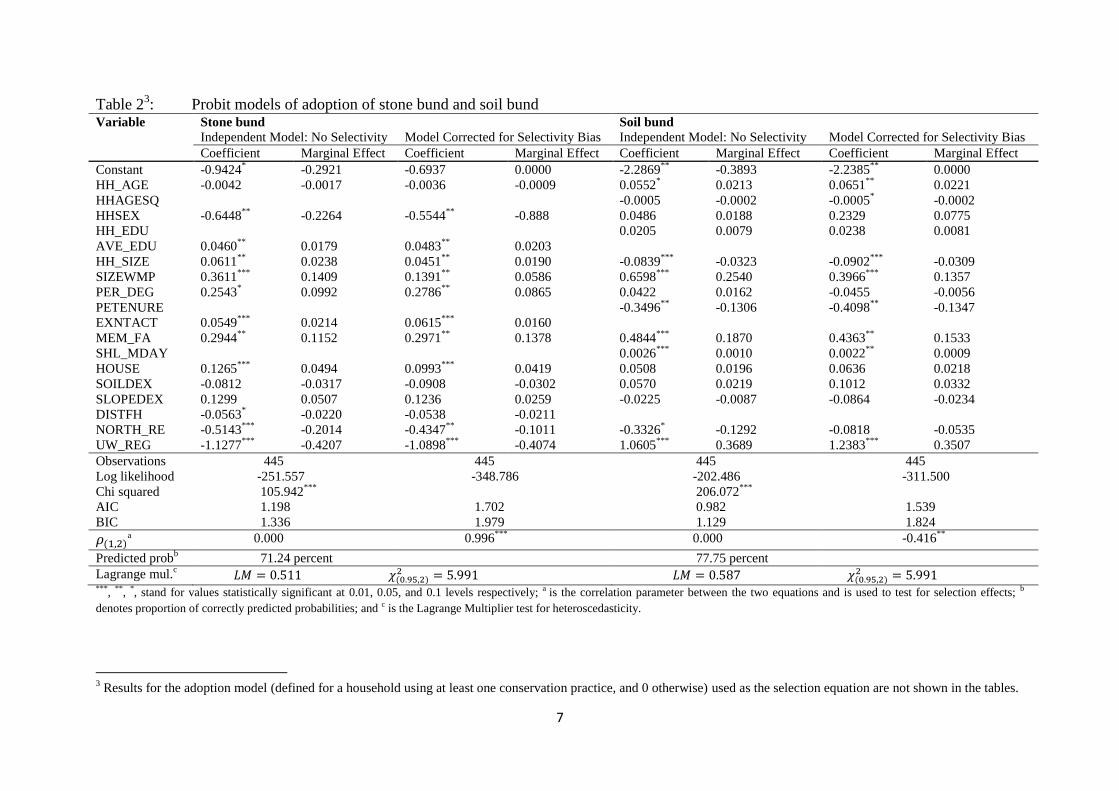
Table 23: Probit models of adoption of stone bund and soil bund
Variable Stone bund Soil bund
Independent Model: No Selectivity Model Corrected for Selectivity Bias Independent Model: No Selectivity Model Corrected for Selectivity Bias
Coefficient Marginal Effect Coefficient Marginal Effect Coefficient Marginal Effect Coefficient Marginal Effect
Constant -0.9424* -0.2921 -0.6937 0.0000 -2.2869
** -0.3893 -2.2385
** 0.0000
HH_AGE -0.0042 -0.0017 -0.0036 -0.0009 0.0552*
0.0213 0.0651**
0.0221
HHAGESQ -0.0005 -0.0002 -0.0005*
-0.0002
HHSEX -0.6448**
-0.2264 -0.5544**
-0.888 0.0486 0.0188 0.2329 0.0775
HH_EDU 0.0205 0.0079 0.0238 0.0081
AVE_EDU 0.0460**
0.0179 0.0483**
0.0203
HH_SIZE 0.0611**
0.0238 0.0451**
0.0190 -0.0839***
-0.0323 -0.0902***
-0.0309
SIZEWMP 0.3611***
0.1409 0.1391**
0.0586 0.6598***
0.2540 0.3966***
0.1357
PER_DEG 0.2543*
0.0992 0.2786**
0.0865 0.0422 0.0162 -0.0455 -0.0056
PETENURE -0.3496**
-0.1306 -0.4098**
-0.1347
EXNTACT 0.0549***
0.0214 0.0615***
0.0160
MEM_FA 0.2944**
0.1152 0.2971**
0.1378 0.4844***
0.1870 0.4363**
0.1533
SHL_MDAY 0.0026***
0.0010 0.0022**
0.0009
HOUSE 0.1265***
0.0494 0.0993***
0.0419 0.0508 0.0196 0.0636 0.0218
SOILDEX -0.0812 -0.0317 -0.0908 -0.0302 0.0570 0.0219 0.1012 0.0332
SLOPEDEX 0.1299 0.0507 0.1236 0.0259 -0.0225 -0.0087 -0.0864 -0.0234
DISTFH -0.0563*
-0.0220 -0.0538 -0.0211
NORTH_RE -0.5143***
-0.2014 -0.4347**
-0.1011 -0.3326*
-0.1292 -0.0818 -0.0535
UW_REG -1.1277***
-0.4207 -1.0898***
-0.4074 1.0605***
0.3689 1.2383***
0.3507
Observations 445 445 445 445
Log likelihood -251.557 -348.786 -202.486 -311.500
Chi squared 105.942***
206.072***
AIC 1.198 1.702 0.982 1.539
BIC 1.336 1.979 1.129 1.824
a 0.000 0.996
*** 0.000 -0.416
**
Predicted probb
71.24 percent 77.75 percent
Lagrange mul.c
***, **, *, stand for values statistically significant at 0.01, 0.05, and 0.1 levels respectively; a is the correlation parameter between the two equations and is used to test for selection effects; b
denotes proportion of correctly predicted probabilities; and c is the Lagrange Multiplier test for heteroscedasticity.
3 Results for the adoption model (defined for a household using at least one conservation practice, and 0 otherwise) used as the selection equation are not shown in the tables.
8
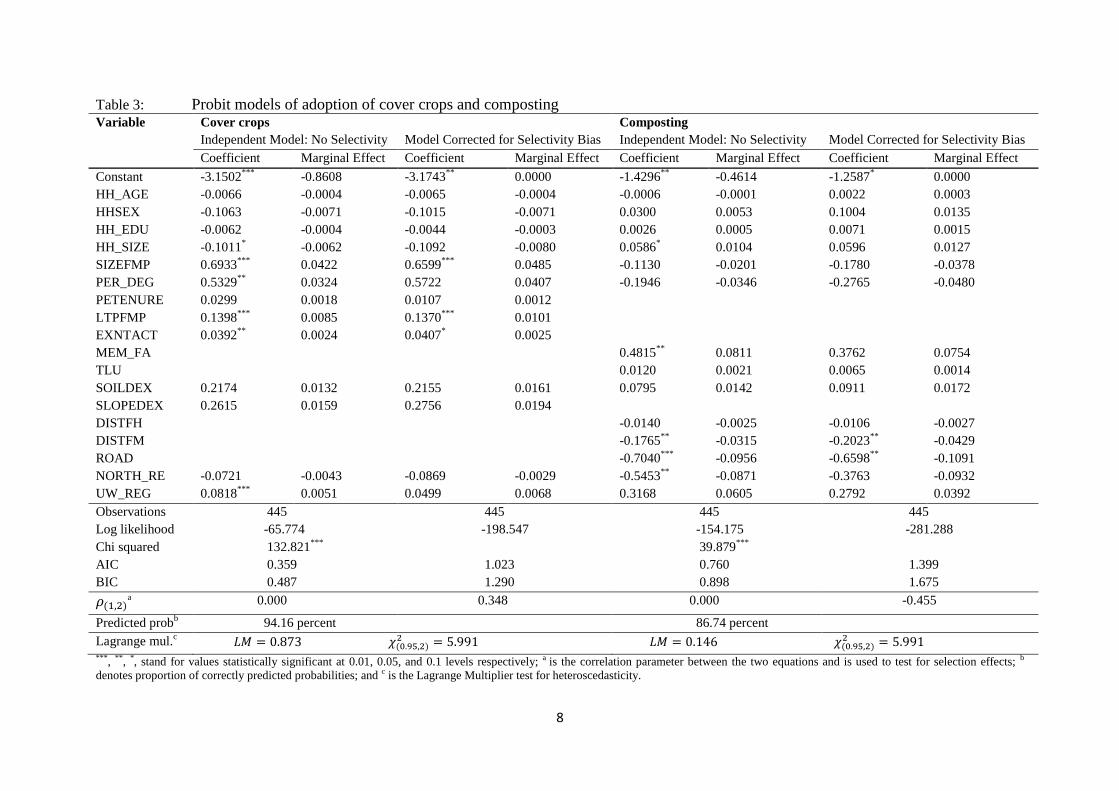
Table 3: Probit models of adoption of cover crops and composting
Variable Cover crops Composting
Independent Model: No Selectivity Model Corrected for Selectivity Bias Independent Model: No Selectivity Model Corrected for Selectivity Bias
Coefficient Marginal Effect Coefficient Marginal Effect Coefficient Marginal Effect Coefficient Marginal Effect
Constant -3.1502***
-0.8608 -3.1743**
0.0000 -1.4296**
-0.4614 -1.2587*
0.0000
HH_AGE -0.0066 -0.0004 -0.0065 -0.0004 -0.0006 -0.0001 0.0022 0.0003
HHSEX -0.1063 -0.0071 -0.1015 -0.0071 0.0300 0.0053 0.1004 0.0135
HH_EDU -0.0062 -0.0004 -0.0044 -0.0003 0.0026 0.0005 0.0071 0.0015
HH_SIZE -0.1011*
-0.0062 -0.1092 -0.0080 0.0586*
0.0104 0.0596 0.0127
SIZEFMP 0.6933***
0.0422 0.6599***
0.0485 -0.1130 -0.0201 -0.1780 -0.0378
PER_DEG 0.5329**
0.0324 0.5722 0.0407 -0.1946 -0.0346 -0.2765 -0.0480
PETENURE 0.0299 0.0018 0.0107 0.0012
LTPFMP 0.1398***
0.0085 0.1370***
0.0101
EXNTACT 0.0392**
0.0024 0.0407*
0.0025
MEM_FA
0.4815**
0.0811 0.3762 0.0754
TLU
0.0120 0.0021 0.0065 0.0014
SOILDEX 0.2174 0.0132 0.2155 0.0161 0.0795 0.0142 0.0911 0.0172
SLOPEDEX 0.2615 0.0159 0.2756 0.0194
DISTFH -0.0140 -0.0025 -0.0106 -0.0027
DISTFM -0.1765**
-0.0315 -0.2023**
-0.0429
ROAD
-0.7040***
-0.0956 -0.6598**
-0.1091
NORTH_RE -0.0721 -0.0043 -0.0869 -0.0029 -0.5453**
-0.0871 -0.3763 -0.0932
UW_REG 0.0818***
0.0051 0.0499 0.0068 0.3168 0.0605 0.2792 0.0392
Observations 445 445 445 445
Log likelihood -65.774 -198.547 -154.175 -281.288
Chi squared 132.821***
39.879***
AIC 0.359 1.023 0.760 1.399
BIC 0.487 1.290 0.898 1.675
a 0.000 0.348 0.000 -0.455
Predicted probb
94.16 percent 86.74 percent
Lagrange mul.c
***, **, *, stand for values statistically significant at 0.01, 0.05, and 0.1 levels respectively; a is the correlation parameter between the two equations and is used to test for selection effects; b
denotes proportion of correctly predicted probabilities; and c is the Lagrange Multiplier test for heteroscedasticity.
9
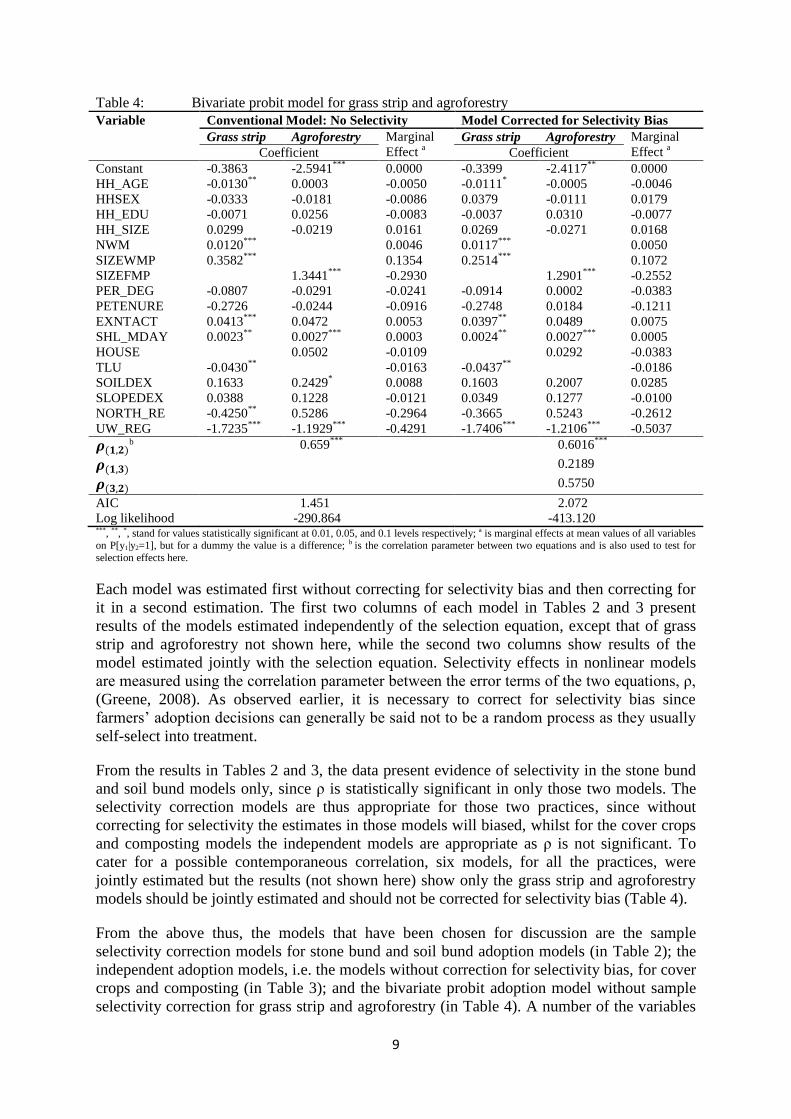
Table 4: Bivariate probit model for grass strip and agroforestry
Variable Conventional Model: No Selectivity Model Corrected for Selectivity Bias Grass strip Agroforestry Marginal
Effect a
Grass strip Agroforestry Marginal
Effect a Coefficient Coefficient
Constant -0.3863 -2.5941***
0.0000 -0.3399 -2.4117**
0.0000
HH_AGE -0.0130**
0.0003 -0.0050 -0.0111*
-0.0005 -0.0046
HHSEX -0.0333 -0.0181 -0.0086 0.0379 -0.0111 0.0179
HH_EDU -0.0071 0.0256 -0.0083 -0.0037 0.0310 -0.0077
HH_SIZE 0.0299 -0.0219 0.0161 0.0269 -0.0271 0.0168
NWM 0.0120***
0.0046 0.0117***
0.0050
SIZEWMP 0.3582***
0.1354 0.2514***
0.1072
SIZEFMP 1.3441***
-0.2930 1.2901***
-0.2552
PER_DEG -0.0807 -0.0291 -0.0241 -0.0914 0.0002 -0.0383
PETENURE -0.2726 -0.0244 -0.0916 -0.2748 0.0184 -0.1211
EXNTACT 0.0413***
0.0472 0.0053 0.0397**
0.0489 0.0075
SHL_MDAY 0.0023**
0.0027***
0.0003 0.0024**
0.0027***
0.0005
HOUSE
0.0502 -0.0109 0.0292 -0.0383
TLU -0.0430**
-0.0163 -0.0437**
-0.0186
SOILDEX 0.1633 0.2429*
0.0088 0.1603 0.2007 0.0285
SLOPEDEX 0.0388 0.1228 -0.0121 0.0349 0.1277 -0.0100
NORTH_RE -0.4250**
0.5286 -0.2964 -0.3665 0.5243 -0.2612
UW_REG -1.7235***
-1.1929***
-0.4291 -1.7406***
-1.2106***
-0.5037
b 0.659
*** 0.6016***
0.2189
0.5750
AIC 1.451 2.072 Log likelihood -290.864 -413.120 ***, **, *, stand for values statistically significant at 0.01, 0.05, and 0.1 levels respectively; a is marginal effects at mean values of all variables on P[y1|y2=1], but for a dummy the value is a difference; b is the correlation parameter between two equations and is also used to test for
selection effects here.
Each model was estimated first without correcting for selectivity bias and then correcting for
it in a second estimation. The first two columns of each model in Tables 2 and 3 present
results of the models estimated independently of the selection equation, except that of grass
strip and agroforestry not shown here, while the second two columns show results of the
model estimated jointly with the selection equation. Selectivity effects in nonlinear models
are measured using the correlation parameter between the error terms of the two equations, ρ,
(Greene, 2008). As observed earlier, it is necessary to correct for selectivity bias since
farmers’ adoption decisions can generally be said not to be a random process as they usually
self-select into treatment.
From the results in Tables 2 and 3, the data present evidence of selectivity in the stone bund
and soil bund models only, since ρ is statistically significant in only those two models. The
selectivity correction models are thus appropriate for those two practices, since without
correcting for selectivity the estimates in those models will biased, whilst for the cover crops
and composting models the independent models are appropriate as ρ is not significant. To
cater for a possible contemporaneous correlation, six models, for all the practices, were
jointly estimated but the results (not shown here) show only the grass strip and agroforestry
models should be jointly estimated and should not be corrected for selectivity bias (Table 4).
From the above thus, the models that have been chosen for discussion are the sample
selectivity correction models for stone bund and soil bund adoption models (in Table 2); the
independent adoption models, i.e. the models without correction for selectivity bias, for cover
crops and composting (in Table 3); and the bivariate probit adoption model without sample
selectivity correction for grass strip and agroforestry (in Table 4). A number of the variables
10
hypothesized to explain farmers’ decision to adopt conservation measures are significant and
shed more light on farmer adoption of conservation practices in northern Ghana.
Personal and household characteristics play a marginal role in the adoption decisions of
farmers. The age of the household head, household size and wealth proxied by livestock and
dwelling type are the significant determinants in this category, even though their effects
remain mixed. In particular, the bigger the herd of livestock in the household the less willing
such a household is in adopting grass strips. This could be explained by the fact that grass is
required for feeding the animals, especially during the long dry season. Again, household size
while reducing the probability of adopting soil bund and cover crops consistent with the
finding of Bekele & Drake (2003), increases the probability of adopting stone bund and
composting. This could be attributed to the fact that stone bunds and composting are more
labour intensive and are only within the reach of households that are well endowed in terms
of labour. Generally, the findings here are consistent with that of Wossink & van Wenum
(2003) who find farmer characteristics only explained marginally the participation decision of
Dutch arable farmers in biodiversity conservation programmes.
The farm and cropping characteristics play an important role in the choice of conservation
practices in the study area. As expected, the probability of undertaking stone bund, soil bund
and grass strip on plot increases as water management becomes the priority (as shown by the
significance of the SIZEWMP variable). But adoption of agroforestry, cover crops and
composting increases when the priority is to manage soil fertility. Adoption of any of the
conservation practices is less likely for farmers located in Northern region compared to those
in the Upper East, probably because environmental conditions in the former might not be as
severe as in the latter. The probability of adopting soil bund and cover crops is higher for
farmers in the Upper West region than those in the Upper East.
A number of socio-economic and institutional variables are significant determinants of the
probability to adopt conservation measures in the study area. Number of contacts with
extension officers in the previous year remains a significant determinant of the adoption
decision in all the models in which it appears. This is because extension officers remain the
main source of information on improved production methods. In particular, the two variables
signifying social capital, that is membership in farmer association (MEM_FA) and use of self-
help labour (SHL_MDAY), positively affect adoption of conservation measures. Farmers in
the area constitute themselves into worker groups and take turns to work on members’ farms
without members making any payment. This kind of labour is what is referred to as ‘self-
help’ labour. The findings on the variables in this category are consistent with previous
studies from elsewhere (including Baidu-Forson, 1999; Bekele & Drake, 2003; Lapar &
Pandey, 1999). Distance of homestead to the nearest major market has an inverse relation
with the probability of adoption of composting by households, and it is consistent with the
finding of Gebremedhin & Swinton (2003) in Ethiopia. This is not surprising as nearness to
major markets guarantees market participation as a result of decreasing transactions cost
(Lapar & Pandey, 1999) thereby encouraging the production of market crops. However, the
negative sign on the ROAD variable, a dummy for road quality remains unclear. This is
because it is expected that good roads will increase market participation and hence adoption.
The only variable which is a proxy for social attitude of farmers, NWM, has a positively
significant effect on the probability of adoption. The probability of adopting grass strip
increases significantly as more neighbouring farmers use practices aimed at water
management. This agrees with the result of Rahelizatovo (2002) who finds positive attitude
11
of farmers increased the likelihood of adopting best management practices in the dairy
industry.
Conclusions
This study is unique in the sense that it studies multivariate conservation adoption decisions
of farm households in the three regions of northern Ghana; a previous study by Faltermeier
and Abdulai (2009) examined adoption of soil bund and dibbling by rice farmers in only the
northern region. The results in this study demonstrate the need to study local incentives and
determinants of conservation adoption since these differ greatly under different agro-
ecological and socio-economic settings. It also makes the point that in analysing adoption
decisions of households care should be taken in lumping different practices as their adoption
is influenced by different variables. It is further shown in the current study that use of binary
models does not always prove adequate in the analysis of household conservation decisions.
An unclear result in the study is the fact that good road network reduces the probability of
adopting composting. What this might imply for policy is that good roads alone might not be
enough to ensure the adoption of conservation practices. Besides developing infrastructure in
the underprivileged parts of the country, policies should also aim to improve market
incentives for producers. A major policy implication of the study is that extension service in
the area should be strengthened to ensure efficient delivery. This way, adoption of
conservation measures will be greatly enhanced.
The role of tenure rights on conservation adoption in northern Ghana remains unclear and
even tends to negatively affect adoption of soil bunds. This could be as a result of lack of
well defined tenure rights in the area. Ongoing projects aimed at clarifying the land tenure
system are thus laudable. It will also be insightful for future research efforts to be focused in
this regard.
References Amsalu, A., & de Graaff, J. (2007). Determinants of adoption and continued use of stone terraces for
soil and water conservation in an Ethiopian highland watershed. Ecological Economics, 61(2-
3), 294-302.
Baidu-Forson, J. (1999). Factors influencing adoption of land-enhancing technology in the Sahel:
lessons from a case study in Niger. Agricultural Economics, 20(3), 231-239.
Bekele, W., & Drake, L. (2003). Soil and water conservation decision behavior of subsistence farmers
in the Eastern Highlands of Ethiopia: a case study of the Hunde-Lafto area. Ecological
Economics, 46(3), 437-451.
Besley, T. (1995). Property rights and investment incentives: theory and evidence from Ghana.
Journal of Political Economy, 103(5), 903-937.
Burton, M., Rigby, D., & Young, T. (1999). Analysis of the determinants of adoption of organic
horticultural techniques in the UK. Journal of Agricultural Economics, 50(1), 47-63.
Case, A. (1992). Neighborhood influence and technological change. Regional Science and Urban
Economics, 22(3), 491-508.
Chatterjee, S., Hadi, A. S. (2006). Regression Analysis by Example (4th ed.). Hoboken, New Jersey:
John Wiley & Sons, Inc.
Clay, D., Byiringiro, F., Kangasniemi, J., Reardon, T., Sibomana, B., & Uwamariya, L. (1995).
Promoting Food Security in Rwanda through Sustainable Agricultural Productivity: Meeting
the Challenges of Population Pressure, Land Degradation and Poverty: Department of
Agricultural Economics Staff Paper No. 95-08. Michigan State University.
Dorfman, J. H. (1996). Modeling multiple adoption decisions in a joint framework. American Journal
of Agricultural Economics, 78(3), 547-557.
12
Ersado, L., Amacher, G., & Alwang, J. (2004). Productivity and land enhancing technologies in
northern Ethiopia: health, public investments, and sequential adoption. American Journal of
Agricultural Economics, 86(2), 321-331.
Ervin, C. A., & Ervin, D. E. (1982). Factors affecting the use of soil conservation practices:
hypotheses, evidence, and policy implications. Land Economics, 58(3), 277.
Faltermeier, L., & Abdulai, A. (2009). The impact of water conservation and intensification
technologies: empirical evidence for rice farmers in Ghana. Agricultural Economics, 40(3),
365-379.
FAO. (2007). Food and Agricultural Organization Statistical Yearbook (1 ed., Vol. 2). Rome: FAO
Statistics Division.
Fuglie, K. O., & Bosch, D. J. (1995). Economic and environmental implications of soil nitrogen
testing: A switching-regression analysis. American Journal of Agricultural Economics, 77(4),
891-900.
Gavian, S., & Fafchamps, M. (1996). Land tenure and allocative efficiency in Niger. American
Journal of Agricultural Economics, 78(2), 460-471.
Gebremedhin, B., & Swinton, S. M. (2003). Investment in soil conservation in northern Ethiopia: the
role of land tenure security and public programs. Agricultural Economics, 29(1), 69-84.
Greene, W. H. (2008). Econometric Analysis (6th ed.). New Jersey: Prentice Hall.
GSS. (2008). Ghana Living Standards Survey Report of the Fifth Round (GLSS V). Accra: Ghana
Statistical Service.
Holloway, G., Shankar, B., & Rahman, S. (2002). Bayesian spatial probit estimation: a primer and an
application to HYV rice adoption. Agricultural Economics, 27(3), 383-402.
ISSER. (2008). The State of the Ghanaian Economy in 2007. Legon, Accra: Institute of Statistical,
Social and Economic Research, University of Ghana.
Kessler, C. A. (2006). Decisive key-factors influencing farm households' soil and water conservation
investments. Applied Geography, 26(1), 40-60.
Knowler, D., & Bradshaw, B. (2007). Farmers' adoption of conservation agriculture: A review and
synthesis of recent research. Food Policy, 32(1), 25-48.
Lapar, M. L. A., & Pandey, S. (1999). Adoption of soil conservation: the case of the Philippine
uplands. Agricultural Economics, 21(3), 241-256.
Nkonya, E., Pender, J., Kaizzi, C., Edward, K., & Mugarura, S. (2005). Policy Options for Increasing
Crop Productivity and Reducing Soil Nutrient Depletion and Poverty in Uganda.
Washington, DC: International Food Policy Research Institute (IFPRI) Environment and
Production Technology Division (EPT) Discussion Paper 134.
Pender, J. L., & Kerr, J. M. (1998). Determinants of farmers' indigenous soil and water conservation
investments in semi-arid India. Agricultural Economics, 19(1-2), 113-125.
Rahelizatovo, N. C. (2002). Adoption of Best Management Practices in the Louisiana Dairy Industry
Louisiana State University, Louisiana.
Scherr, S., & Hazell, P. (1994). Sustainable Agricultural Development Strategies in Fragile Lands.
Washington, DC: Environment and Production Technology Division Discussion Paper 1,
International Food Policy Research Institute.
Shiferaw, B., & Holden, S. T. (1998). Resource degradation and adoption of land conservation
technologies in the Ethiopian Highlands: A case study in Andit Tid, North Shewa.
Agricultural Economics, 18(3), 233-247.
Tiffen, M., Mortimer, M., & Gichuki, F. (1994). More People – Less Erosion: Environmental
Recovery in Kenya. London, UK: Wiley and Sons.
Train, K. E. (2009). Discrete Choice Methods with Simulation (2 ed.). New York: Cambridge
University Press.
Wossink, G. A. A., & van Wenum, J. H. (2003). Biodiversity conservation by farmers: analysis of
actual and contingent participation. European Review of Agricultural Economics, 30(4), 461-
485.