Embed Size (px)
Citation preview
Feed the Future Soil Fertility Technology (SFT) Adoption, Policy Reform and
Knowledge Management Project
Semi-Annual Performance Report
October 1, 2017 – March 31, 2018
Cooperative Agreement No. AID-BFS-IO-15-00001
April 2018
i
Contents
Progress Toward Cooperative Agreement Award Objectives...................................................1
1. Workstream 1 – Developing and Validating Technologies, Approaches, and
Practices ....................................................................................................................................4
1.1 Technologies Refined and Adapted for Mitigating Stress and Improving
Nutrient Use Efficiency ...................................................................................................4
1.1.1 Can Fertilizer Best Management Practices Improve Stress Tolerance? .......... 4
1.1.2 Improved Nutrient Use Efficiency with Subsurface Fertilizer
Application .................................................................................................... 15
1.1.3 Improving Nitrogen Use Efficiency of Organic and Inorganic
Fertilizers ....................................................................................................... 20
1.1.4 CO2 Mitigation Role of Enhanced Efficiency Fertilizers and Practices ....... 22
1.2 Balanced Plant Nutrition Through Improved Fertilizer Product
Recommendations (Cross-Cutting with Workstream 2.3) ............................................23
1.2.1 Facilitate Site- and Crop-Specific Fertilizer Recommendations for
Increased Economic and Environmental Benefits from Fertilizer Use ......... 24
1.2.2 Workshop on the State of Soil Fertility in Northern Ghana, Fertilizer
Recommendations, Utilization, and Farm-Level Access .............................. 28
1.2.3 Improved Nutrient Delivery from Multi-Nutrient Fertilizer Granules
for Improved Yield, Quality, and Nutrition................................................... 29
1.2.4 International Training Program on Bringing Balanced Crop Nutrition
to Smallholder Farmers in Africa .................................................................. 31
1.2.5 Improved Efficiency and Accessibility of Phosphatic Fertilizers ................. 31
1.3 Fertilizer Quality Assessments: Support Policy Efforts to Harmonize Fertilizer
Regulations (Cross-Cutting with Workstream 2.3) .......................................................33
1.3.1 Complete Ongoing Assessments for Stakeholder Consultations and
Dissemination ................................................................................................ 33
1.3.2 Training Program on Improving Fertilizer Quality for Highly
Productive Agriculture and Balanced Nutrition ............................................ 35
1.4 Agronomic and Socioeconomic Database Management and Decision Support
Systems – Cross-Cutting with Workstream 2 ...............................................................36
2. Workstream 2 – Supporting Policy Reform Processes, Advocacy, and
Market Development .............................................................................................................37
2.1 Document Policy Reforms and Market Development...................................................37
2.1.1 Support for Kenya Fertilizer Roundtable Meeting and Policy Reform
Processes ....................................................................................................... 38
2.1.2 Capacity-Building Activities: Policy Reforms .............................................. 39
ii
2.1.3 Documenting Fertilizer Trends and Outlook: Code of Conduct for
Fertilizer Management................................................................................... 40
2.1.4 Partnership for Enabling Market Environments for Fertilizer in Africa ....... 41
2.1.5 Review of Input Subsidy Program Design in SSA ........................................ 42
2.1.6 Policy Briefs on Fertilizer Policies and Market Development ...................... 42
2.2 Impact Assessment Studies ...........................................................................................43
2.2.1 Impact Assessment Study on the Kenya Fertilizer Subsidy Program ........... 43
2.2.2 Effectiveness of Agro-Dealer Development Programs Toward
Sustainable Input Supply and Technology Transfer in Sub-Saharan
African Countries .......................................................................................... 44
2.3 Economic and Market Studies .......................................................................................44
2.3.1 Fertilizer Quality Assessments (FQA): Support Policy Efforts to
Harmonize Fertilizer Regulations (with Workstream 1) ............................... 45
2.3.2 Fertilizer Cost Buildup Studies and Marketing Margin Analysis ................. 45
2.3.3 The African Fertilizer Access Index.............................................................. 48
2.3.4 Economic and Environmental Implications of Fertilizer Technologies
Using Life Cycle Analysis Approach ............................................................ 48
2.3.5 Economic Estimation of Fertilization Methods for Rice Paddy in
Bangladesh – A Production Function Analysis ............................................. 48
2.3.6 Enhancing the M&E Capacities of Soil Fertility Research Projects in
IFDC .............................................................................................................. 49
2.3.7 Encouraging Agribusiness Development in Sub-Saharan Africa:
Fertilizer Value Chains and Policy Implications ........................................... 49
2.3.8 Improving Fertilizer Use, Access, and Market Development ....................... 50
Annexes
Annex 1. University Partnership .......................................................................................... 51
Annex 2. List of Publications and Presentations .................................................................. 55
Annex 3. Comments and Clarifications about the Report .................................................... 58
iii
Tables
Table 1. Experimental treatments used for drought and submergence trials in
Bangladesh during Aman 2017. .............................................................................. 7
Table 2. Comparison of plant height, number of panicles, and grain yields with
farmers’ practice, recommended practice, prilled UDP, and UDP (briquette)
under local improved varieties (LIV) and stress-tolerant varieties (STV) at
drought-prone areas in Bangladesh. ........................................................................ 9
Table 3. Comparison of plant height, number of panicles, and grain yields with
farmers’ practice, prilled UDP, and UDP (briquette) under local improved
varieties and stress-tolerant varieties at submergence-prone areas in
Bangladesh. ........................................................................................................... 10
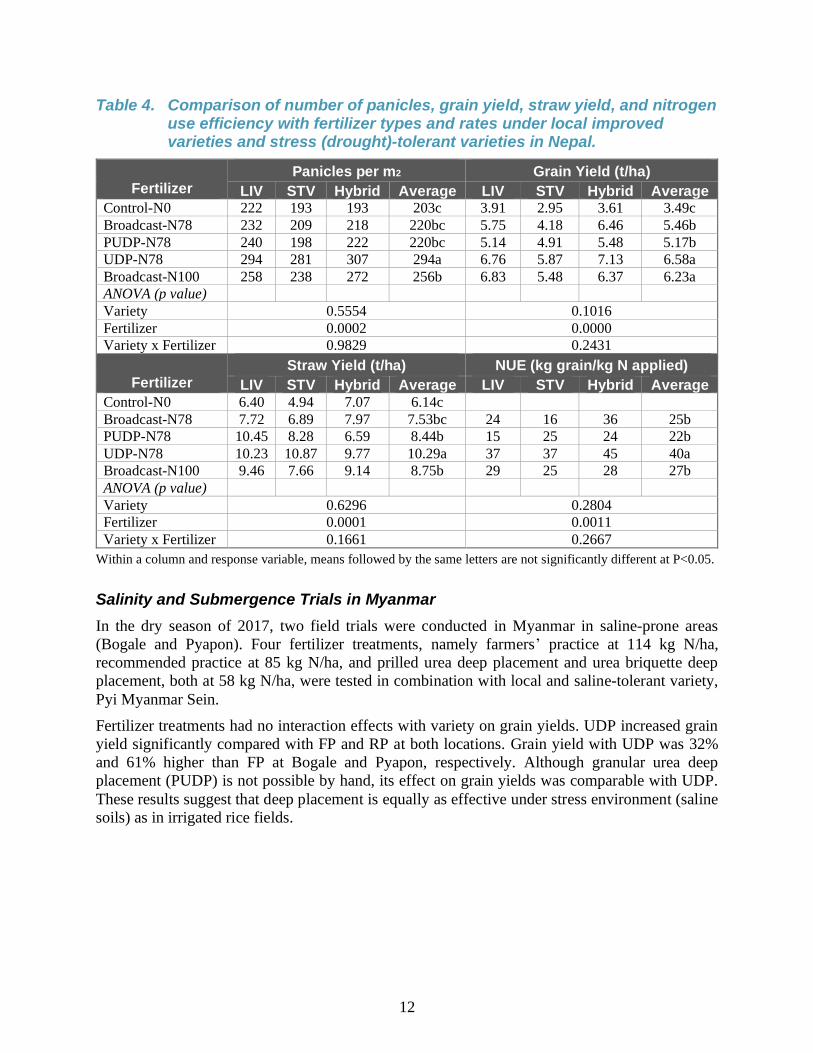
Table 4. Comparison of number of panicles, grain yield, straw yield, and nitrogen use
efficiency with fertilizer types and rates under local improved varieties and
stress (drought)-tolerant varieties in Nepal. .......................................................... 12
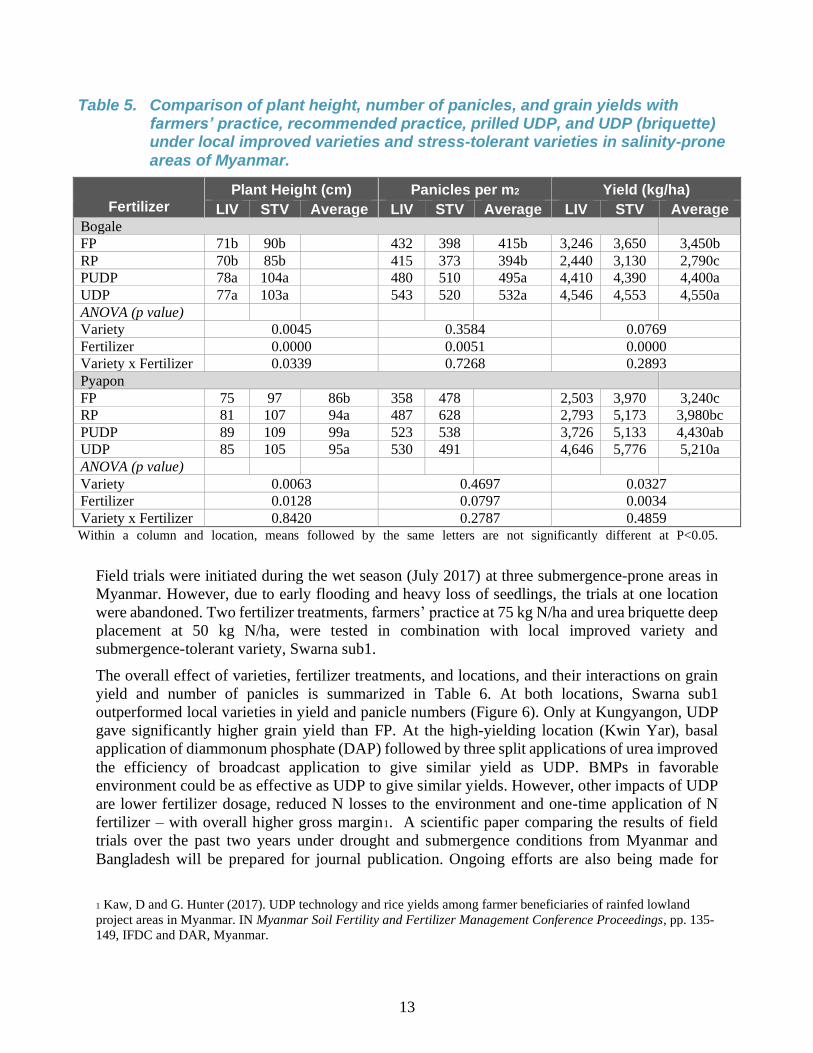
Table 5. Comparison of plant height, number of panicles, and grain yields with
farmers’ practice, recommended practice, prilled UDP, and UDP (briquette)
under local improved varieties and stress-tolerant varieties in salinity-prone
areas of Myanmar. ................................................................................................ 13
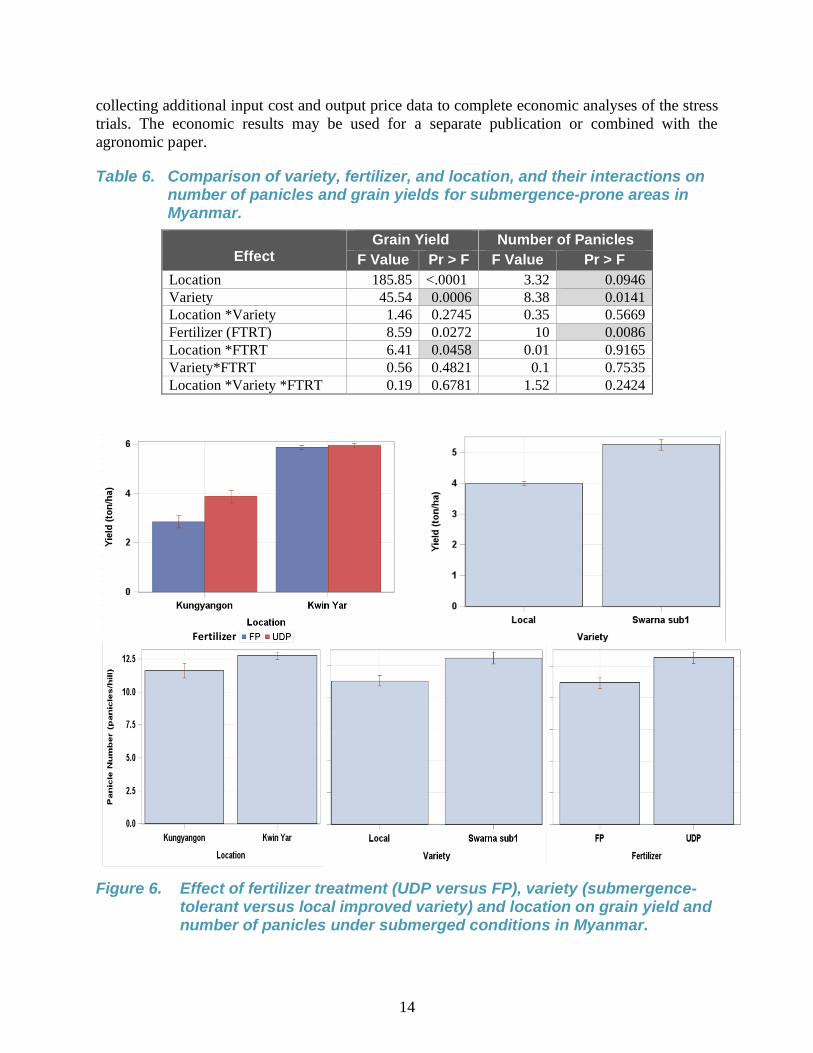
Table 6. Comparison of variety, fertilizer, and location, and their interactions on
number of panicles and grain yields for submergence-prone areas in
Myanmar. .............................................................................................................. 14
Table 7. Experiment description for greenhouse trial on rice comparing subsurface
application of prilled urea with urea briquettes (UDP) on flooded and
saturated soils. ....................................................................................................... 17
Table 8. Contrast means of floodwater urea-N and ammonium-N comparing
subsurface application of prilled urea and urea briquettes (UDP) on flooded
and saturated soils. ................................................................................................ 19
Table 9. Contrast means of rice grain yield and grain N uptake comparing subsurface
application of prilled urea and urea briquettes (UDP) on flooded and
saturated soils. ....................................................................................................... 19
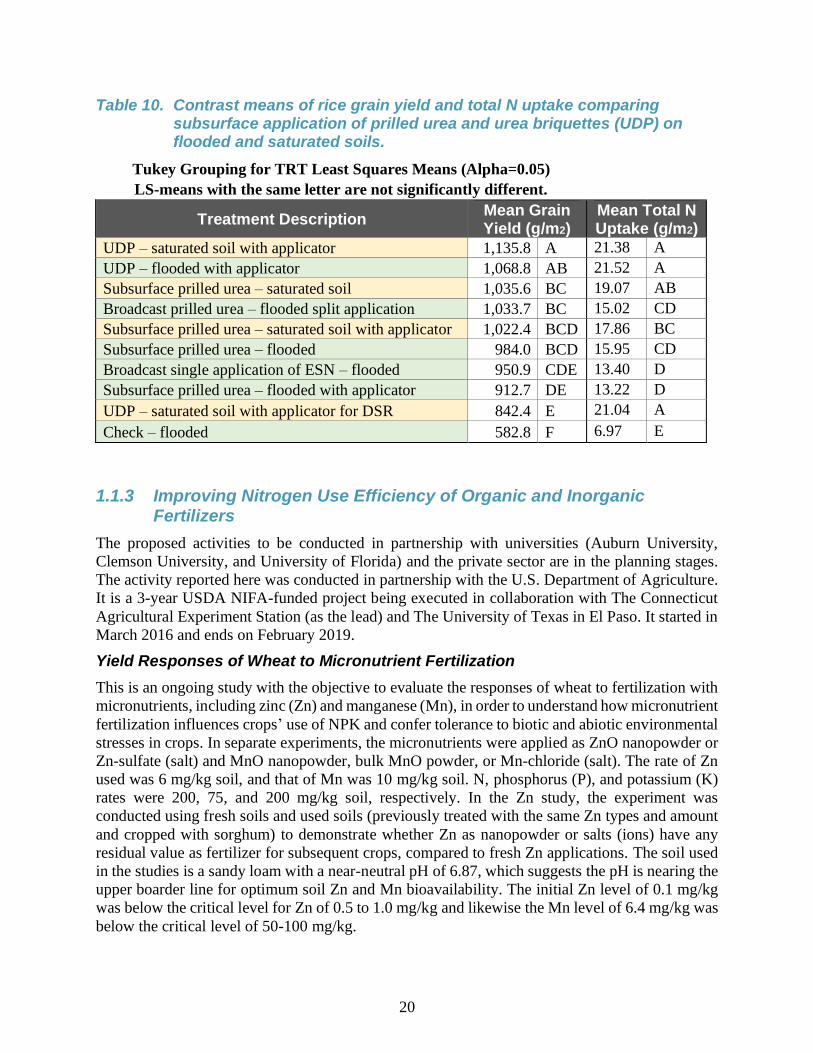
Table 10. Contrast means of rice grain yield and total N uptake comparing subsurface
application of prilled urea and urea briquettes (UDP) on flooded and
saturated soils. ....................................................................................................... 20
Table 11. Fertilizer supply cost buildup analyses for Ghana and Mali comparing 2006,
2009, and 2015-16. ............................................................................................... 47
iv
Figures
Figure 1. Average grain yield (mt/ha) of submergence-tolerant rice varieties grown at
three locations each in the (A) Northern, (B) Upper West, and (C) Upper East
regions of Ghana under UDP, MD, and LRP treatments. Bars represent
average of 3 locations X 4 replicates; error bars represent standard error. ............. 6
Figure 2. Average N uptake (kg/ha) of submergence-tolerant rice varieties grown at
three locations each in the (A) Northern, (B) Upper West, and (C) Upper East
regions of Ghana under UDP, MD, and LRP treatments. Bars represent
average of 3 locations X 4 replicates; error bars represent standard error. ............. 6
Figure 3. Transplanting rice seedlings at a drought trial in Meharpur district,
Bangladesh. ............................................................................................................. 7
Figure 4. Transplanting rice seedlings (left) and granular urea deep placement under
submerged condition in Barisal region in Bangladesh. .......................................... 8
Figure 5. Deep placement of granular urea and urea briquette in drought trial, Nepal. ....... 11
Figure 6. Effect of fertilizer treatment (UDP versus FP), variety (submergence-tolerant
versus local improved variety) and location on grain yield and number of
panicles under submerged conditions in Myanmar. ............................................. 14
Figure 7. Effect of subsurface application of urea and urea briquettes on urea-N and
ammonium-N concentration when applied on saturated versus flooded soils. ..... 18
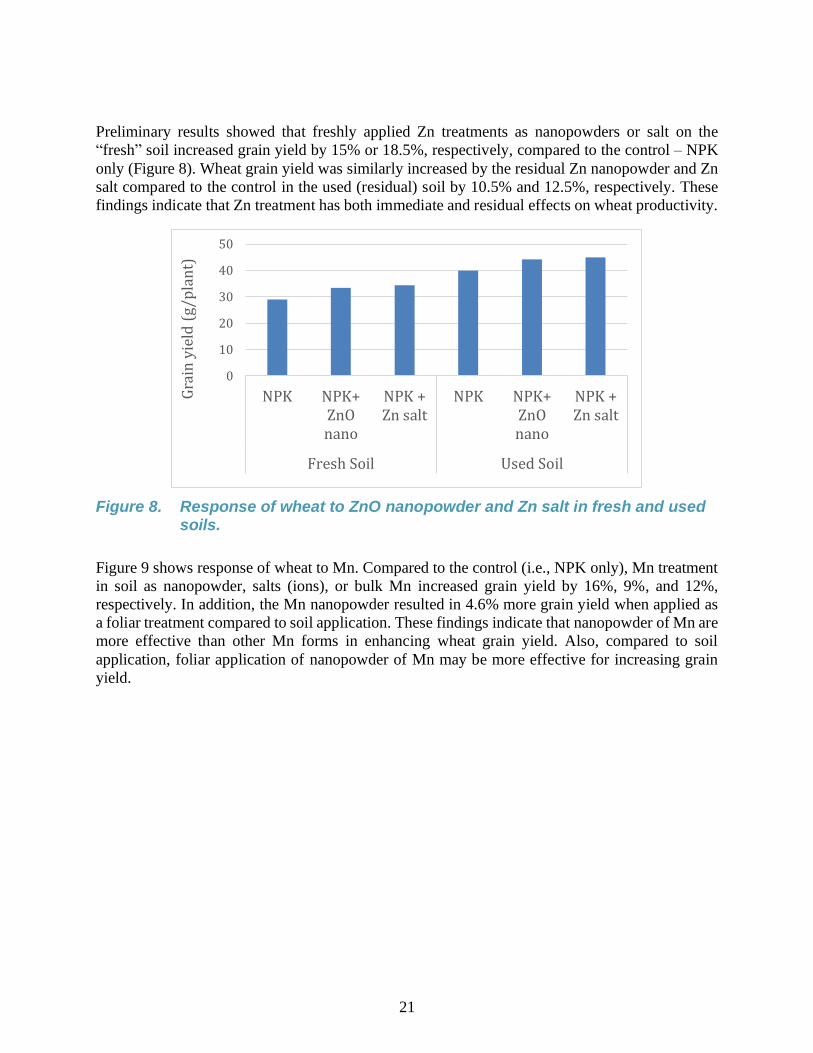
Figure 8. Response of wheat to ZnO nanopowder and Zn salt in fresh and used soils. ....... 21
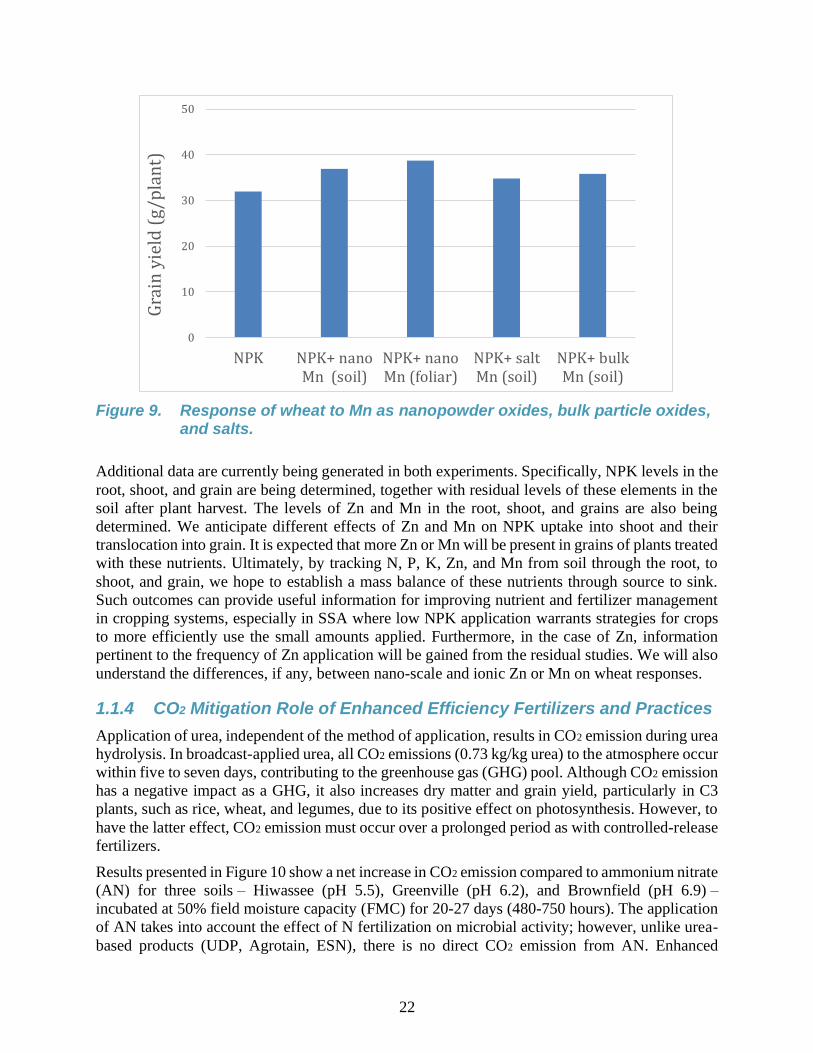
Figure 9. Response of wheat to Mn as nanopowder oxides, bulk particle oxides, and
salts. ...................................................................................................................... 22
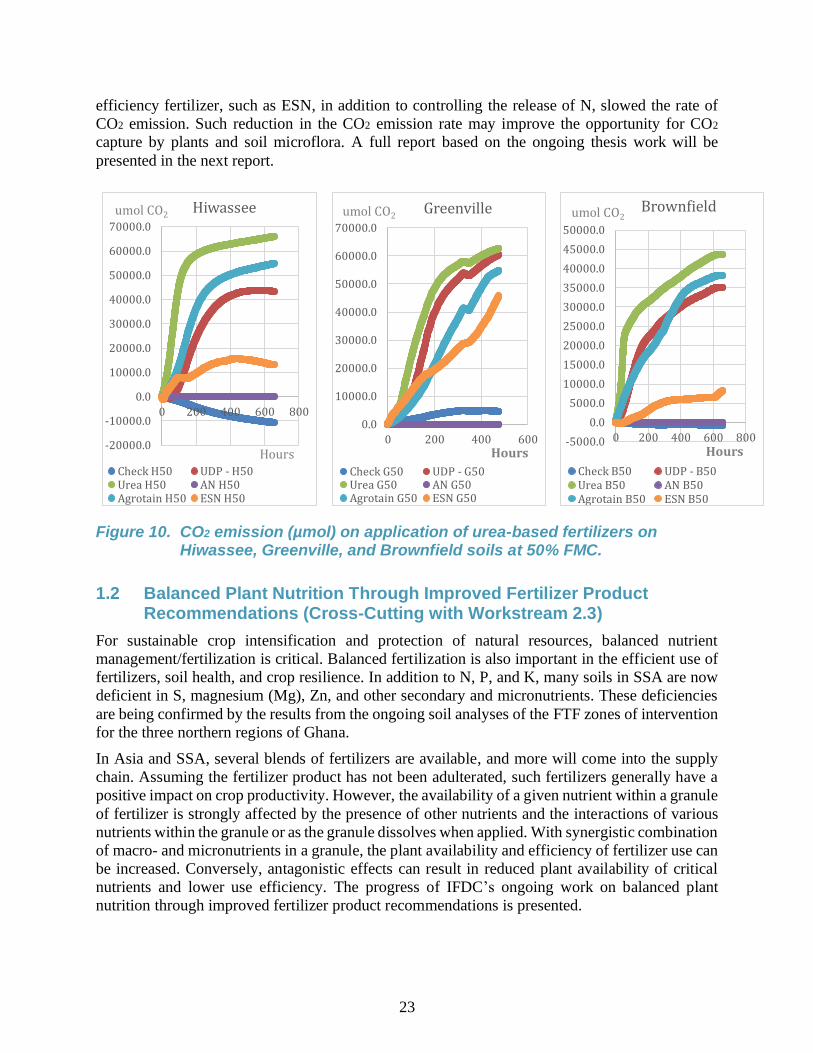
Figure 10. CO2 emission (µmol) on application of urea-based fertilizers on Hiwassee,
Greenville, and Brownfield soils at 50% FMC. .................................................... 23
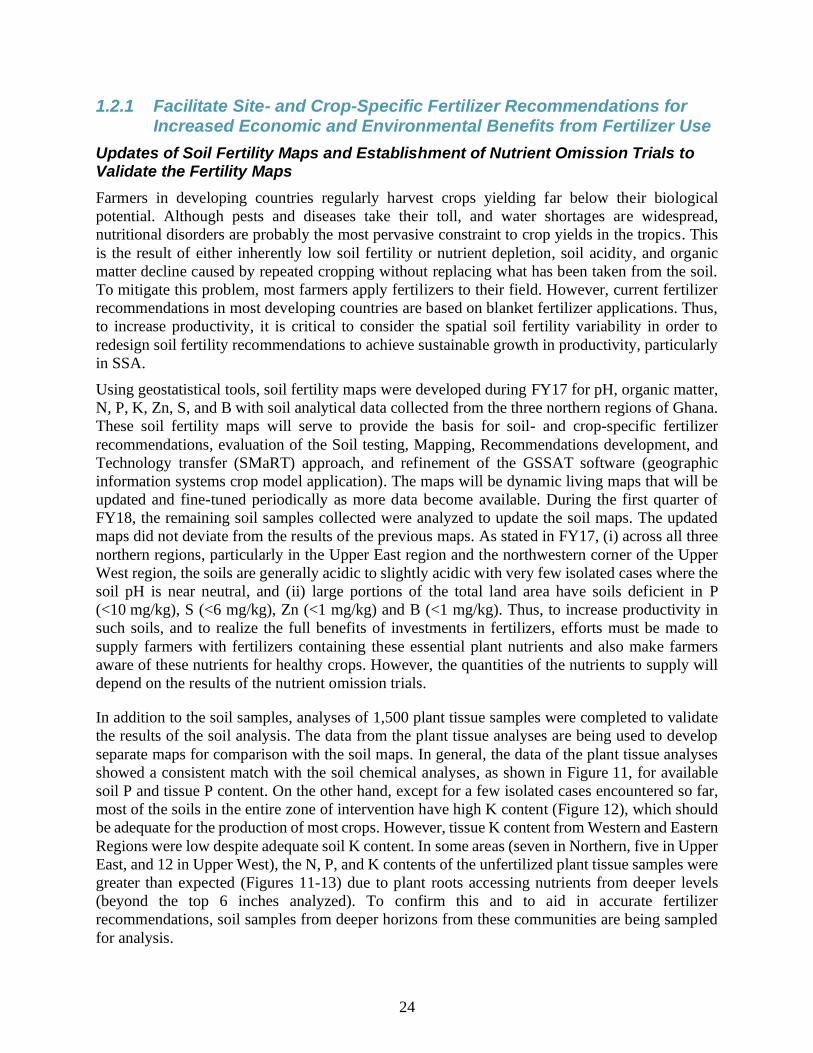
Figure 11. Comparison of soil P and plant P content (ppm) maps of the three northern
regions of Ghana. .................................................................................................. 26
Figure 12. Comparison of soil K and plant K content (ppm) maps of the three northern
regions of Ghana. .................................................................................................. 27
Figure 13. Plant N content (ppm) map of the three northern regions of Ghana. .................... 28
Figure 14. Soil Zn content (mg/kg) as influenced by Zn product and incubation period in
Hartsells, Greenville, and Sumter soils. ................................................................ 30
Figure 15. Total Zn uptake in maize and grain Zn uptake in soybean (mg Zn/plant) as
influenced by Zn rate and Zn products on Brownfield soil (pH 6.9). ................... 31
Figure 16. Comparison of wheat growth on Hartsells soil with Cabinda PR, reactive
Namphos PR, MAP (25 mg P/kg), and activated Cabinda dust with MAP at
75:25 and 50:50 P ratio. ........................................................................................ 33
Figure 17. Observing the bag weight controls in a granulation plant in Myanmar. ............... 36
v
List of Acronyms
AAPI Accelerating Agriculture Productivity Improvement
AFAP African Fertilizer and Agribusiness Partnership
AFU Agricultural and Forestry University
AgMIP Agricultural Model Intercomparison and Improvement Project
AGRA Alliance for a Green Revolution in Africa
AGRIFOP Agribusiness Focused Partnership Organization
Al Aluminum
AN Ammonium Nitrate
AS Ammonium Sulfate
AU African Union
B Boron
BARI Bangladesh Agricultural Research Institute
BFS Bureau for Food Security
BRRI Bangladesh Rice Research Institute
CA Cooperative Agreement
CAADP Comprehensive Africa Agriculture Development Programme
CERES Crop-Environment Resource Synthesis
CIF Cost, Insurance, and Freight
cm centimeter
cm centimeter
CO2 Carbon Dioxide
CoCoFe Code of Conduct for Fertilizer Management
COMESA Common Market for Eastern and Southern Africa
DAP Diammonium Phosphate
DRA Direction Regionale de l’Agriculture
DSR Direct-Seeded Rice
DTPA Diethylenetriaminepentaacetic Acid
FAO Food and Agriculture Organization of the United Nations
FDP Fertilizer Deep Placement
FMC Field Moisture Capacity
FP Farmers’ Practice
FQA Fertilizer Quality Assessment
FTF Feed the Future
FTRT Fertilizer
FY Fiscal Year
g gram
GHG Greenhouse Gas
ha hectare
HOI Honduras Outreach Inc.
IFA International Fertilizer Association
IFDC International Fertilizer Development Center
IFPRI International Food Policy Research Institute
ISFM Integrated Soil Fertility Management
ISP Input Subsidy Program
K Potassium
vi
Ke-Fert Kenya Fertilizer Roundtable
kg kilogram
LCA Life Cycle Analysis
LCC Leaf Color Chart
LCI Life Cycle Inventory
LIV Local Improved Varieties
LRP Locally Recommended Fertilizer
m meter
M&E Monitoring and Evaluation
MAP Monoammonium Phosphate
MD Microdosing
MELS Monitoring, Evaluation, Learning and Sharing
Mg Magnesium
mg milligrams
Mn Manganese
MOALF Ministry of Agriculture, Livestock and Fisheries
MOU Memorandum of Understanding
MSU Michigan State University
MSU Michigan State University
mt metric tons
N Nitrogen
N2O Nitrous Oxide
NARES National Agricultural Research Extension Systems
NGO Non-Governmental Organization
NO Nitric Oxide
NP Nitrogen and Phosphorus
NPK Nitrogen, Phosphate, and Potassium
NUE Nitrogen Use Efficiency
OS Optical Sensor
P Phosphorus
PEMEFA Partnership for Enabling Market Environments for Fertilizer in Africa
ppm parts per million
PR Phosphate Rock
PS Permanent Secretary
PU Prilled Urea
PUDP Prilled Urea Deep Placement
PVoC Pre-Export Verification of Conformity
RADD Rwanda Agro-Dealer Development
RCBD Randomized Complete Block Design
ReNAPRI Regional Network of Agricultural Policy Research Institutes
RP Recommended Practice
S Sulfur
SARI Savanna Agricultural Research Institute
SIRS Strickland Irrigation Research Station
SMaRT Soil Testing, Mapping, Recommendations Development, and Technology
Transfer
SOP Potassium Sulfate
vii
SOW Scope of Work
SRI Survey Research Institute
SSA Sub-Saharan Africa
STV Stress-Tolerant Varieties
TAFAI The Africa Fertilizer Access Index
TASAI The African Seed Access Index
ToR Term of Reference
TSP Triple Superphosphate
UB Urea Briquette
UDP Urea Deep Placement
UGA University of Georgia
USAID U.S. Agency for International Development
WSP Water-Soluble Phosphorus
Zn Zinc
ZnO Zinc Oxide
ZnSO4 Zinc Sulfate
ZOI Zone of Intervention
1
Progress Toward Cooperative Agreement Award Objectives
The International Fertilizer Development Center (IFDC) enables smallholder farmers in
developing countries to increase agricultural productivity, generate economic growth, and practice
environmental stewardship by enhancing their ability to manage mineral and organic fertilizers
responsibly and participate profitably in input and output markets. On March 1, 2015, the U.S.
Agency for International Development (USAID) and IFDC entered into a new cooperative
agreement (CA) designed to more directly support the Bureau for Food Security (BFS) objectives,
particularly as related to Feed the Future (FTF).
Under the awarded agreement and in collaboration with USAID, IFDC conducted a range of
activities and interventions prioritized from each annual work plan for the agreed-upon
workstreams. The current reporting period reflects a transition to more coordinated field-based
work in FTF countries with scientific support and expertise from IFDC headquarters. Some of the
activities reported here are a continuation of work initiated in FY17. A summary description of the
major activities is presented below.
Workstream 1: Developing and Validating Technologies, Approaches, and Practices
Under Workstream 1, IFDC continued to develop and validate technologies, approaches and
practices that address nutrient management issues and advance sustainable agricultural
intensification. These technologies are important for building climate resilience at the smallholder
level as well as for improving agricultural productivity and nutrition. During this reporting period,
IFDC devoted time and resources to:
• Technologies refined and adapted for mitigating stress and improving nutrient use efficiency,
particularly for crops grown in areas subject to drought, submergence, salinity, acidity, and
other constraints. This included:
o Adaptive trials to evaluate the effectiveness of fertilizer management practices on rice
production in submergence-prone areas in Ghana.
o Field trials to determine the best management options for stress-tolerant rice varieties in
Bangladesh, Nepal, and Myanmar.
o Field and greenhouse experiments on methods to improve nutrient use efficiency with
subsurface application of fertilizer, particularly in sub-Saharan Africa.
o Study to evaluate wheat response to micronutrient fertilization.
o Experiment to determine the role of enhanced efficiency fertilizer products and practices
in slowing carbon dioxide emission and improving carbon sequestration.
• Balanced plant nutrition research to improve fertilizer recommendations that increase crop
yields, protect soil health, and improve farmer profitability. This included:
o Soil testing and plant tissue analysis to validate and update soil fertility maps in SSA.
o Planning for a workshop on the status of soils in northern Ghana and fertilizer types,
availability, and farm-level utilization in the country.
2
o Laboratory incubation and greenhouse studies to quantify the efficiency of secondary and
micronutrients and their delivery.
o Greenhouse trial on the efficiency of phosphatic fertilizers and activation of phosphate
rock.
• Fertilizer quality assessments for East and Southern Africa and Myanmar. Progress included:
o Fertilizer quality assessment for Uganda in final stages of completion.
o Fertilizer quality and value chain analysis for Myanmar completed.
o Organization of a training program in Tanzania on improving fertilizer quality and
balanced nutrition.
Workstream 2: Supporting Policy Reforms and Market Development
Under Workstream 2, evidence-based policy analysis was conducted to support reform processes
and other initiatives that are focused on accelerating agricultural growth through the use of
improved technologies, particularly fertilizers and complementary inputs. This analytical approach
enables IFDC to support the development of fertilizer markets and value chains that allow greater
private sector participation and investment with appropriate public sector regulatory oversight.
The following is a summary of activities during the reporting period:
• Documenting policy reform processes and fertilizer market development. Activities included:
o Support for a fertilizer roundtable meeting and policy reform in Kenya.
o Presentation on agricultural input policies for a USAID BFS agriculture core course.
o Workshop on the design and implementation of subsidy programs.
o Contribution to a global consultation on the Code of Conduct for Fertilizer Management.
o Participation as a consortium member of the Partnership for Enabling Market
Environments for Fertilizer in Africa.
o Review of input subsidy programs in SSA.
• Impact assessment studies on the performance of policy changes and supporting programs and
lessons learned for future policy reforms and implementation. The following activities were
conducted:
o Assessment of Kenya fertilizer subsidy program.
o Assessment of agro-dealer development programs in Rwanda.
• Economic studies to inform public and private decision-making and identify policy-relevant
areas for intervention to streamline the flow of fertilizers at reduced prices for smallholder
farmers. Activities included:
o Organization of a workshop to disseminate findings of a Myanmar fertilizer quality,
regulatory system, and value chain analysis.
o Initiation of a consolidated report on West African fertilizer supply cost buildup
assessments.
3
o Initiation of a graduate research study on greenhouse gas emissions under a rice-paddy
system in Bangladesh and IFDC headquarters.
Cross-Cutting Issues Including Learning Agendas and Knowledge Management
Under the awarded agreement, IFDC conducted a range of activities and interventions prioritized
by the 2018 annual work plan, including greater partnership with U.S. universities. This section
summarizes the various associated outreach activities and the methods of disseminating research
outcomes and findings. These are reported in Annexes 1 and 2.
4
1. Workstream 1 – Developing and Validating Technologies, Approaches, and Practices
Since technology/methodology development and field evaluation generally take more than a year,
some of the activities reported are a continuation of work from the previous year. This report is
therefore transitional and covers completing previous commitments and conducting new research
with greater focus on testing new and innovative technologies that can improve the productivity
and profitability of smallholder farmers while providing a greater degree of resilience to abiotic
and biotic stresses. All reported activities are being conducted in FTF countries or targeted for FTF
countries, and the majority are field evaluations. The research activities carried out at IFDC
headquarters support and complement field activities. Below is a summary of activities for this
reporting period.
1.1 Technologies Refined and Adapted for Mitigating Stress and Improving Nutrient Use Efficiency
Fertilizer management is a major challenge for crop production in stress-prone environments
subject to drought, submergence, salinity, acidity, and other constraints. The research trials
reported here were conducted under on-farm, greenhouse, and laboratory conditions to:
(1) evaluate whether fertilizer best management practices can improve stress tolerance,
(2) quantify the effect of subsurface fertilizer application on improved nutrient use efficiency,
(3) improve nitrogen (N) use efficiency of organic and inorganic fertilizers, and (4) quantify the
carbon dioxide (CO2) mitigation role of enhanced efficiency fertilizers and practices.
1.1.1 Can Fertilizer Best Management Practices Improve Stress Tolerance?
Rice Production in Submergence-Prone Areas – Ghana
Most rice cultivars die within days of complete submergence, which often results in total crop loss.
These losses disproportionately affect rice farmers in rainfed and flood-affected areas where
alternative livelihood and food security options are limited. Optimal nutrition of rice seedlings
before submergence and post-submergence is necessary to equip plants with cellular and metabolic
requirements essential for survival of flooding and for fast recovery after floodwater recedes. The
use of N-efficient urea briquettes could be an effective means of supplying N to submergence-
tolerant rice cultivars to cope better under the vagaries of the flooded conditions. Previous efforts
to improve rice productivity in submergence-prone areas focused mainly on varietal improvement.
However, there is the need to find a technological fit between genotypes and identify the most
fitting and best agricultural practices based on specific environmental conditions.
In collaboration with AfricaRice and Savanna Agricultural Research Institute (SARI), IFDC is
developing appropriate soil fertility management technology tailored for submergence-prone areas
using submergence-tolerant rice varieties. During FY17, adaptive trials were established in nine
communities in northern Ghana to evaluate the effectiveness of urea deep placement (UDP)
technology in improving rice productivity in submergence-prone areas using submergence-
tolerant rice varieties, NERICA L-19 and NERICA L-49, as test varieties. In each trial, the
effectiveness of UDP technology was compared with microdosing (MD) technology and the
locally recommended fertilizer management practice (LRP). Although the preliminary results
5
suggested that UDP technology could be an appropriate soil fertility management technology for
submergence-tolerant rice varieties in submergence-prone areas, these were results from only one
season. Therefore, during the last quarter of FY17, the trials were repeated at nine locations to
validate the results, draw conclusions, and make recommendations. For this second season, the
LRP treatment was modified whereby the granular urea was incorporated into the soil rather than
surface application.
Each plot was appropriately bonded and had independent drainage points to prevent the spread of
water and fertilizers between plots. The rice seedlings were transplanted in a 20-x-20-centimeter
(cm) area with one seedling per hill. For all treatments, basal NPK (15-15-15) fertilizer was applied
at a recommended rate of 250 kilograms per hectare (kg/ha) (two 50-kg bags/acre) three days after
transplanting. For the UDP-treated plots, the 1.8-gram (g) urea briquette was applied seven days
after transplanting. One briquette was placed between four rice plants (resulting in an application
rate of 113 kg/ha) at a depth of 7-10 cm. For the MD treatment, granular urea was applied six
weeks after transplanting, if applicable; otherwise, the application was delayed until the field had
drained enough to allow for fertilizer application. For this treatment, the granular urea was
measured using a “beer top” and applied per plant by incorporating it into the root zone of the rice
plant (resulting in an application rate of 96 kg/ha). Similarly, for the LRP treatment, granular urea
was applied six weeks after transplanting, if applicable; otherwise, it was delayed until the field
had drained enough to allow for fertilizer application. For this treatment, 1.5 kg of granular urea
was used (resulting in an application rate of 150 kg/ha). A furrow was made in between two rows
and a pre-determined quantity of granular urea (150 kg/ha) was placed in the furrows and covered
with soil. Although the urea application rates differed with each technology, no attempt was made
to equalize the application rate because the intent of the trial was to compare the different
technologies on rice production in submergence-prone areas. During the first quarter of FY18,
these nine trials were harvested (at anthesis and at maturity to determine N content and grain yield,
respectively). The total above-ground N uptake and nutrient use efficiency were determined.
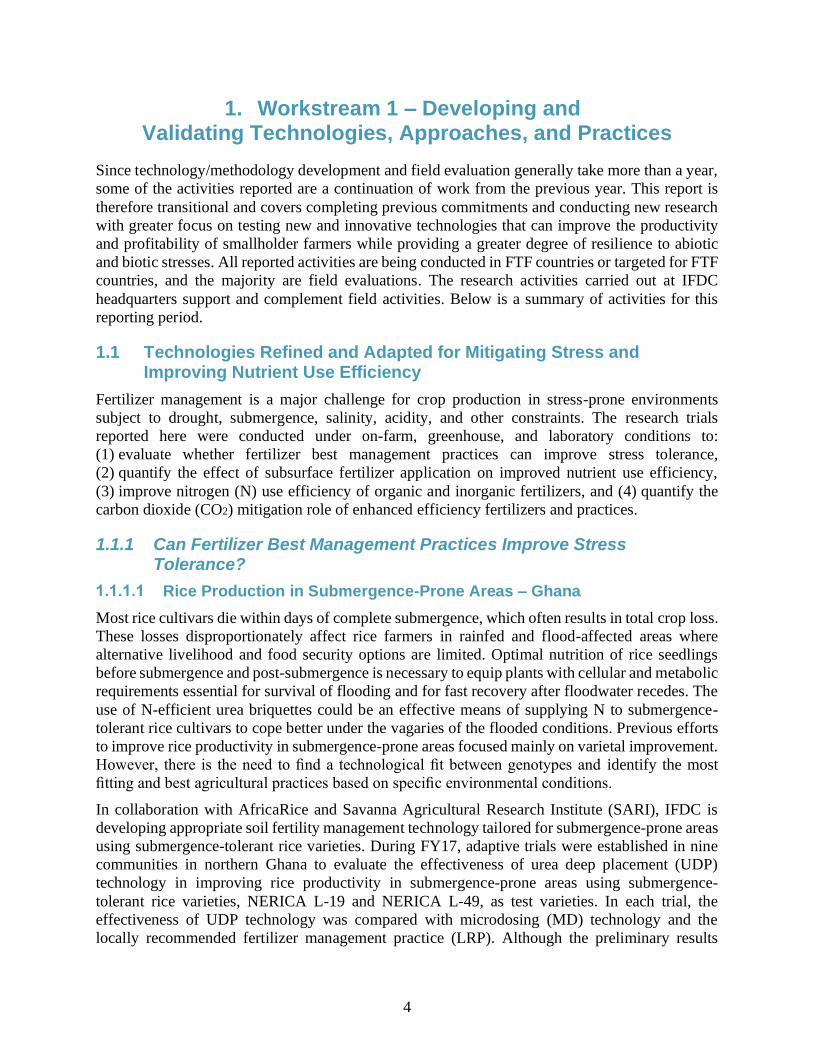
Results obtained in the second year were consistent with the first year. The average yields across
all nine locations showed that the greatest yields were obtained from the UDP treatment, followed
by the subsurface-applied LRP and the MD treatments in that order (Figure 1). However, the
differences in yield between the UDP treatment and the subsurface-applied LRP were not
statistically different. Regardless, the fact that about 25% less urea was utilized in the UDP
treatment than in the LRP treatment still makes the UDP technology superior to the LRP treatment.
An economic analysis is being performed on the data to ascertain the profitability associated with
each treatment. The results of the economic analysis will be presented in the annual report.
Improvements in applicators will be beneficial to both subsurface placed granular fertilizer and
briquettes.
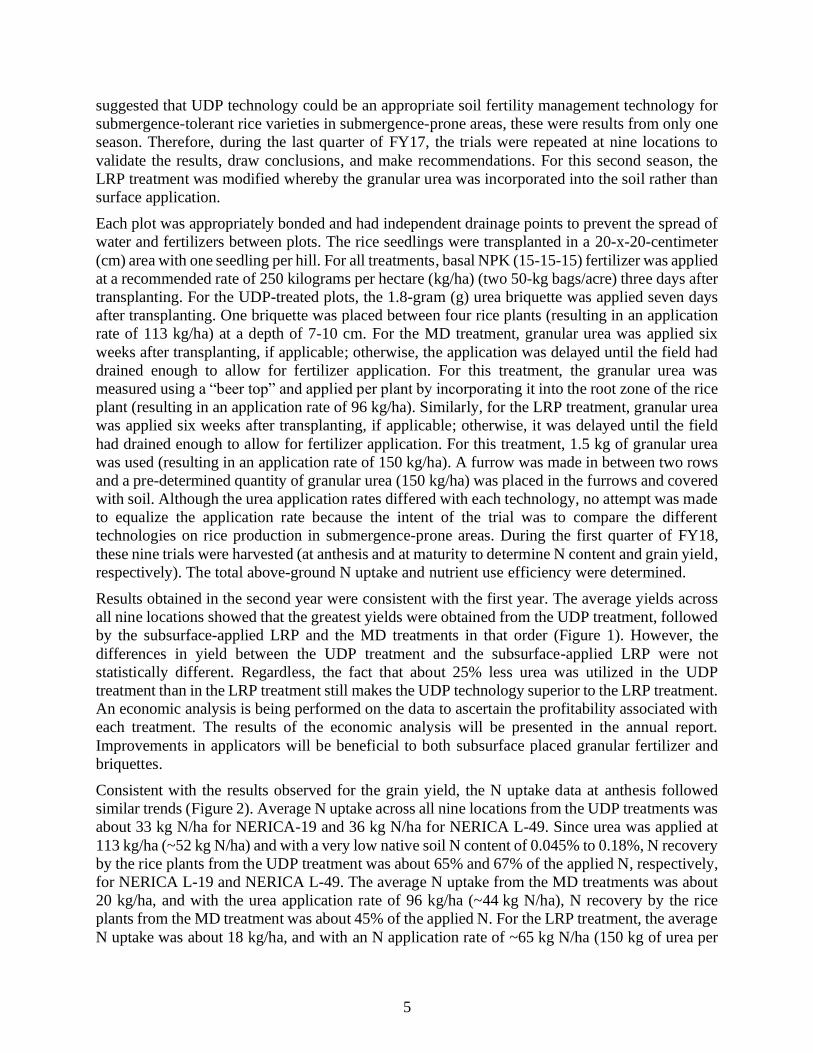
Consistent with the results observed for the grain yield, the N uptake data at anthesis followed
similar trends (Figure 2). Average N uptake across all nine locations from the UDP treatments was
about 33 kg N/ha for NERICA-19 and 36 kg N/ha for NERICA L-49. Since urea was applied at
113 kg/ha (~52 kg N/ha) and with a very low native soil N content of 0.045% to 0.18%, N recovery
by the rice plants from the UDP treatment was about 65% and 67% of the applied N, respectively,
for NERICA L-19 and NERICA L-49. The average N uptake from the MD treatments was about
20 kg/ha, and with the urea application rate of 96 kg/ha (~44 kg N/ha), N recovery by the rice
plants from the MD treatment was about 45% of the applied N. For the LRP treatment, the average
N uptake was about 18 kg/ha, and with an N application rate of ~65 kg N/ha (150 kg of urea per
6
hectare), N recovery from this treatment was less than 40% of the applied N. From the results, it
is obvious that the response of both submergence-tolerant rice varieties to UDP technology was
consistent and produced significantly greater yields and N uptake than their response to
microdosing and the locally recommended fertilizer management practice. Thus, from the
combined results of the past two years, it can be concluded that UDP technology could be an
appropriate soil fertility management technology for submergence-prone areas, using
submergence-tolerant rice varieties.
A B C
Figure 1. Average grain yield (mt/ha) of submergence-tolerant rice varieties grown at three locations each in the (A) Northern, (B) Upper West, and (C) Upper East regions of Ghana under UDP, MD, and LRP treatments. Bars represent average of 3 locations X 4 replicates; error bars represent standard error.
A B C
Figure 2. Average N uptake (kg/ha) of submergence-tolerant rice varieties grown at three locations each in the (A) Northern, (B) Upper West, and (C) Upper East regions of Ghana under UDP, MD, and LRP treatments. Bars represent average of 3 locations X 4 replicates; error bars represent standard error.
0.00.51.01.52.02.53.03.54.04.55.05.56.06.57.0
NERICA-19 NERICA-49
UDP MD LRP
0.00.51.01.52.02.53.03.54.04.55.05.56.06.57.0
NERICA-19 NERICA-49
UDP MD LRP
0.00.51.01.52.02.53.03.54.04.55.05.56.06.57.0
NERICA-19 NERICA-49
UDP MD LRP
0.0
10.0
20.0
30.0
40.0
50.0
NERICA-19 NERICA-49
UDP MD LRP
0.0
10.0
20.0
30.0
40.0
50.0
NERICA-19 NERICA-49
UDP MD LRP
0.0
10.0
20.0
30.0
40.0
50.0
NERICA-19 NERICA-49
UDP MD LRP
7
Developing Appropriate Soil Fertility Management Technologies for Stress-Tolerant Rice Cultivars – Bangladesh, Myanmar, and Nepal
Drought and Submergence Trials in Bangladesh
During the 2017 wet season (called “Aman” season in Bangladesh), eight field trials were
established (four drought trials and four submergence trials) in Bangladesh. Six to eight treatment
combinations of fertilizer practice and rice varieties (Table 1) were tested in each trial to compare
the performance of UDP with farmers’ practice (FP). The deep placement of prilled urea was added
to the trials to compare it with the deep placement of urea briquettes. The deep placement of both
urea briquettes and prilled urea was done by hand under drought trials and by an “injector-type”
applicator under submergence trials.
Table 1. Experimental treatments used for drought and submergence trials in Bangladesh during Aman 2017.
Treatments N Rates (kg/ha)
Variety Fertilizer Drought Submergence
Local improved (LIV) Farmers’ practice 90±5 60±10
Recommended practice 60 -
PU deep placement 52 52
UB deep placement 52 52
Stress-tolerant (STV) Farmers’ practice 90±5 60±10
Recommended practice 60 -
PU deep placement 52 52
UB deep placement UDP 52 52
The treatments are combinations of fertilizer practices and rice varieties.
PU: prilled urea; UB: urea briquette.
N rates for farmers’ practice varied with trials.
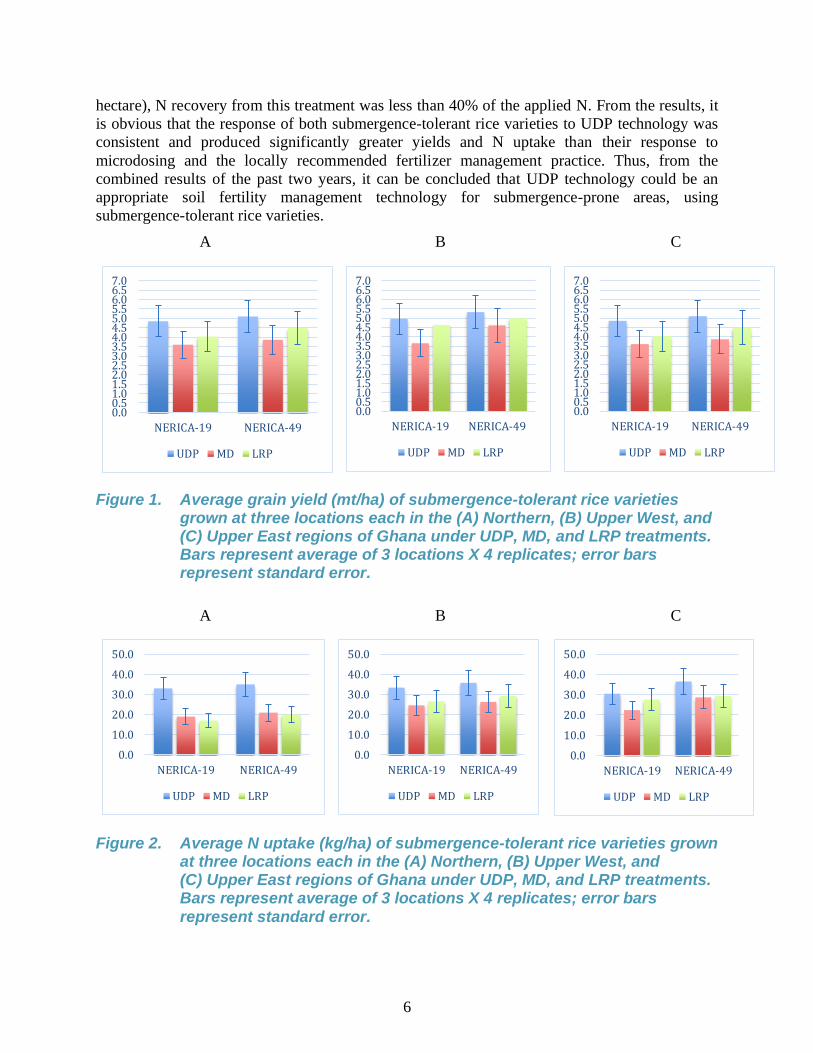
Figure 3. Transplanting rice seedlings at a drought trial in Meharpur district, Bangladesh.
8
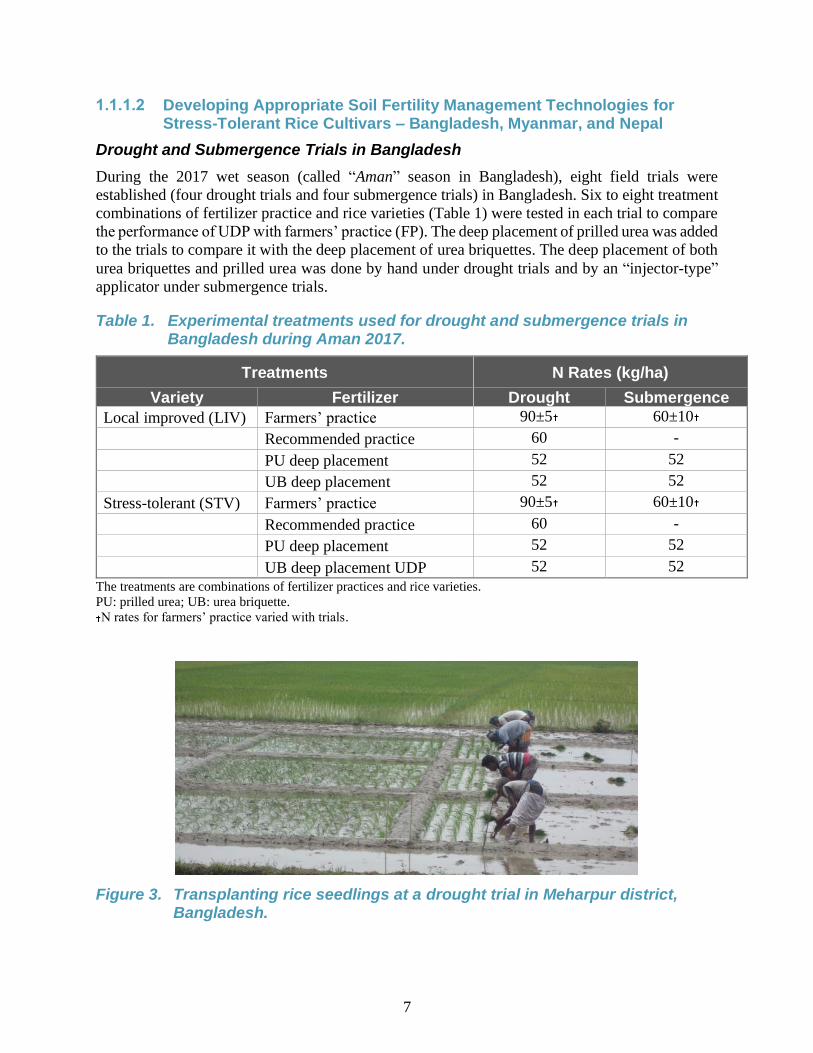
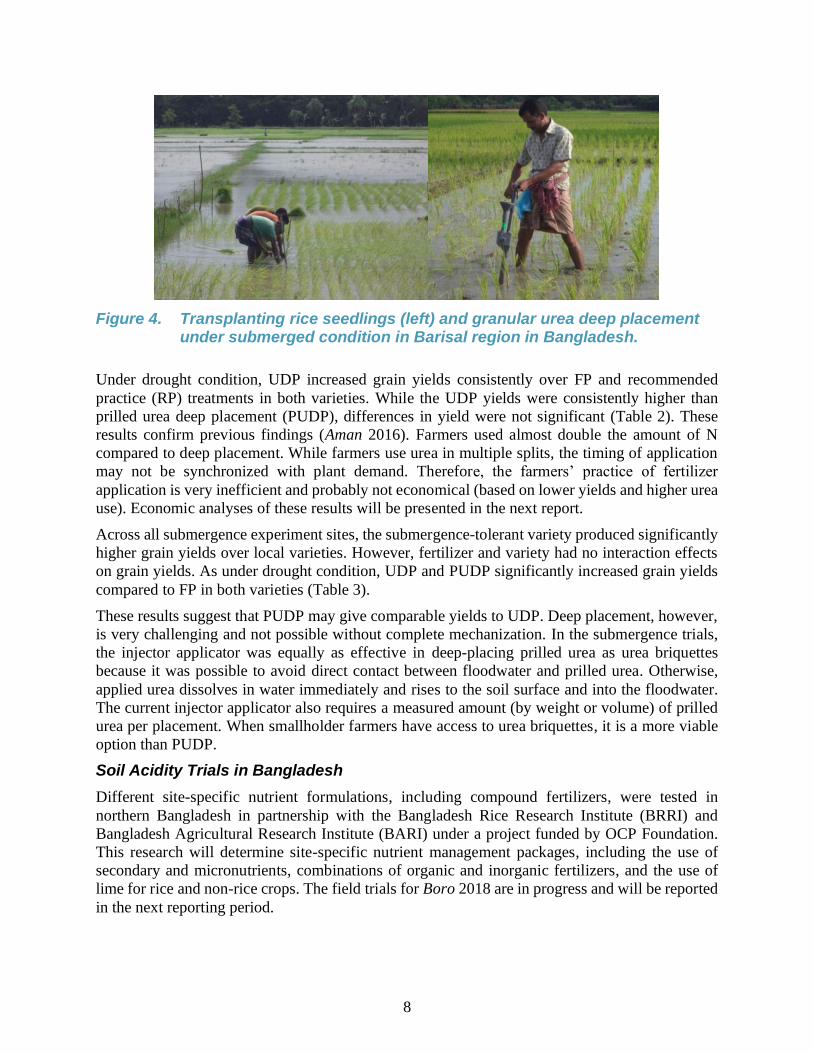
Figure 4. Transplanting rice seedlings (left) and granular urea deep placement under submerged condition in Barisal region in Bangladesh.
Under drought condition, UDP increased grain yields consistently over FP and recommended
practice (RP) treatments in both varieties. While the UDP yields were consistently higher than
prilled urea deep placement (PUDP), differences in yield were not significant (Table 2). These
results confirm previous findings (Aman 2016). Farmers used almost double the amount of N
compared to deep placement. While farmers use urea in multiple splits, the timing of application
may not be synchronized with plant demand. Therefore, the farmers’ practice of fertilizer
application is very inefficient and probably not economical (based on lower yields and higher urea
use). Economic analyses of these results will be presented in the next report.
Across all submergence experiment sites, the submergence-tolerant variety produced significantly
higher grain yields over local varieties. However, fertilizer and variety had no interaction effects
on grain yields. As under drought condition, UDP and PUDP significantly increased grain yields
compared to FP in both varieties (Table 3).
These results suggest that PUDP may give comparable yields to UDP. Deep placement, however,
is very challenging and not possible without complete mechanization. In the submergence trials,
the injector applicator was equally as effective in deep-placing prilled urea as urea briquettes
because it was possible to avoid direct contact between floodwater and prilled urea. Otherwise,
applied urea dissolves in water immediately and rises to the soil surface and into the floodwater.
The current injector applicator also requires a measured amount (by weight or volume) of prilled
urea per placement. When smallholder farmers have access to urea briquettes, it is a more viable
option than PUDP.
Soil Acidity Trials in Bangladesh
Different site-specific nutrient formulations, including compound fertilizers, were tested in
northern Bangladesh in partnership with the Bangladesh Rice Research Institute (BRRI) and
Bangladesh Agricultural Research Institute (BARI) under a project funded by OCP Foundation.
This research will determine site-specific nutrient management packages, including the use of
secondary and micronutrients, combinations of organic and inorganic fertilizers, and the use of
lime for rice and non-rice crops. The field trials for Boro 2018 are in progress and will be reported
in the next reporting period.
9
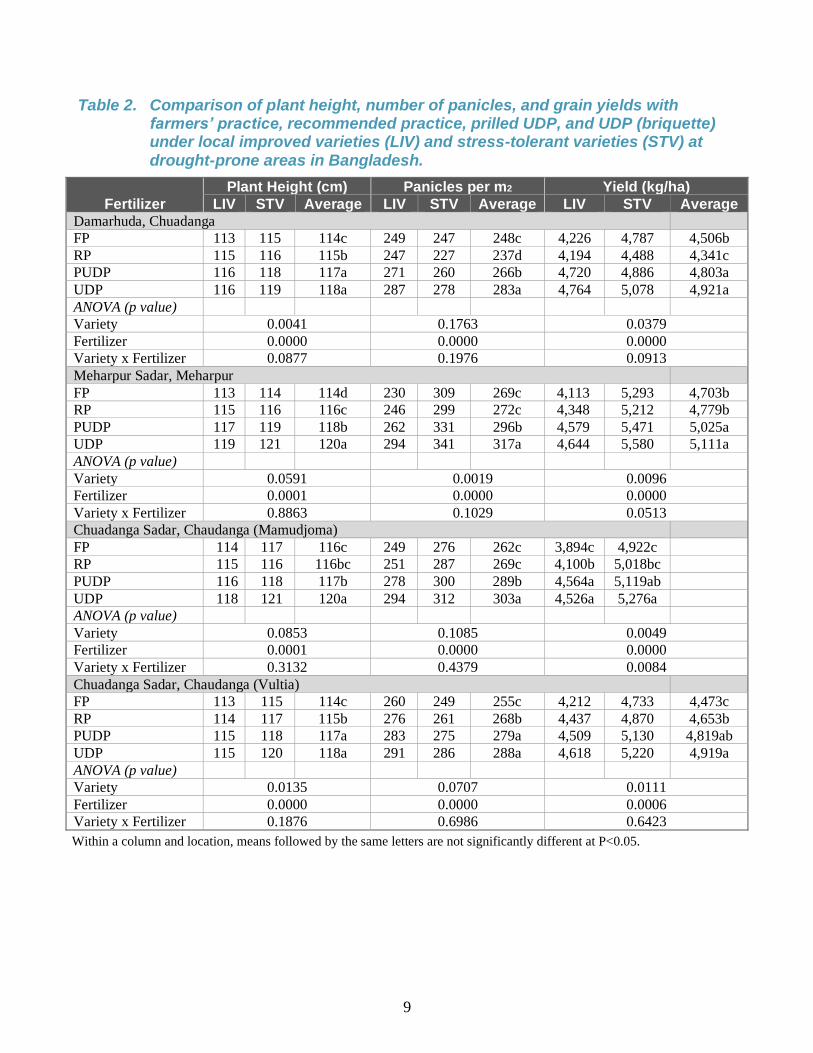
Table 2. Comparison of plant height, number of panicles, and grain yields with farmers’ practice, recommended practice, prilled UDP, and UDP (briquette) under local improved varieties (LIV) and stress-tolerant varieties (STV) at drought-prone areas in Bangladesh.
Fertilizer
Plant Height (cm) Panicles per m2 Yield (kg/ha)
LIV STV Average LIV STV Average LIV STV Average Damarhuda, Chuadanga
FP 113 115 114c 249 247 248c 4,226 4,787 4,506b
RP 115 116 115b 247 227 237d 4,194 4,488 4,341c
PUDP 116 118 117a 271 260 266b 4,720 4,886 4,803a
UDP 116 119 118a 287 278 283a 4,764 5,078 4,921a
ANOVA (p value)
Variety 0.0041 0.1763 0.0379
Fertilizer 0.0000 0.0000 0.0000
Variety x Fertilizer 0.0877 0.1976 0.0913
Meharpur Sadar, Meharpur
FP 113 114 114d 230 309 269c 4,113 5,293 4,703b
RP 115 116 116c 246 299 272c 4,348 5,212 4,779b
PUDP 117 119 118b 262 331 296b 4,579 5,471 5,025a
UDP 119 121 120a 294 341 317a 4,644 5,580 5,111a
ANOVA (p value)
Variety 0.0591 0.0019 0.0096
Fertilizer 0.0001 0.0000 0.0000
Variety x Fertilizer 0.8863 0.1029 0.0513
Chuadanga Sadar, Chaudanga (Mamudjoma)
FP 114 117 116c 249 276 262c 3,894c 4,922c
RP 115 116 116bc 251 287 269c 4,100b 5,018bc
PUDP 116 118 117b 278 300 289b 4,564a 5,119ab
UDP 118 121 120a 294 312 303a 4,526a 5,276a
ANOVA (p value)
Variety 0.0853 0.1085 0.0049
Fertilizer 0.0001 0.0000 0.0000
Variety x Fertilizer 0.3132 0.4379 0.0084
Chuadanga Sadar, Chaudanga (Vultia)
FP 113 115 114c 260 249 255c 4,212 4,733 4,473c
RP 114 117 115b 276 261 268b 4,437 4,870 4,653b
PUDP 115 118 117a 283 275 279a 4,509 5,130 4,819ab
UDP 115 120 118a 291 286 288a 4,618 5,220 4,919a
ANOVA (p value)
Variety 0.0135 0.0707 0.0111
Fertilizer 0.0000 0.0000 0.0006
Variety x Fertilizer 0.1876 0.6986 0.6423
Within a column and location, means followed by the same letters are not significantly different at P<0.05.
10
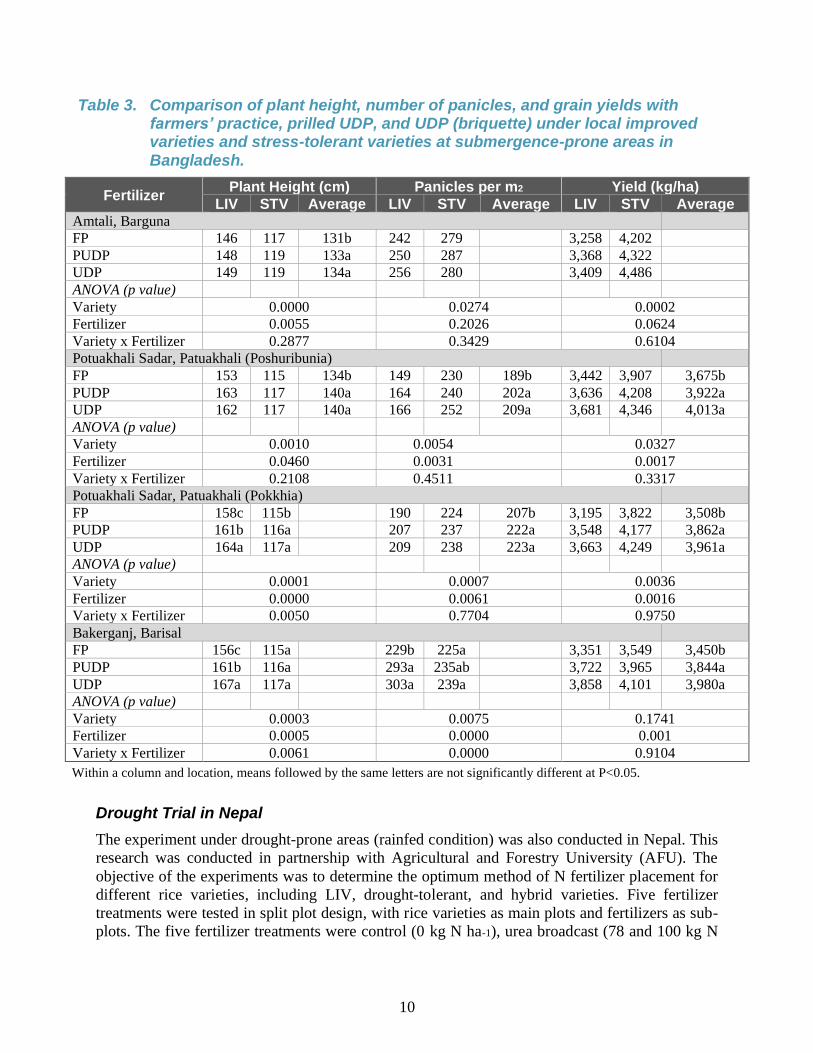
Table 3. Comparison of plant height, number of panicles, and grain yields with farmers’ practice, prilled UDP, and UDP (briquette) under local improved varieties and stress-tolerant varieties at submergence-prone areas in Bangladesh.
Fertilizer Plant Height (cm) Panicles per m2 Yield (kg/ha)
LIV STV Average LIV STV Average LIV STV Average Amtali, Barguna FP 146 117 131b 242 279 3,258 4,202
PUDP 148 119 133a 250 287 3,368 4,322
UDP 149 119 134a 256 280 3,409 4,486
ANOVA (p value)
Variety 0.0000 0.0274 0.0002
Fertilizer 0.0055 0.2026 0.0624
Variety x Fertilizer 0.2877 0.3429 0.6104
Potuakhali Sadar, Patuakhali (Poshuribunia) FP 153 115 134b 149 230 189b 3,442 3,907 3,675b
PUDP 163 117 140a 164 240 202a 3,636 4,208 3,922a
UDP 162 117 140a 166 252 209a 3,681 4,346 4,013a
ANOVA (p value)
Variety 0.0010 0.0054 0.0327
Fertilizer 0.0460 0.0031 0.0017
Variety x Fertilizer 0.2108 0.4511 0.3317
Potuakhali Sadar, Patuakhali (Pokkhia) FP 158c 115b 190 224 207b 3,195 3,822 3,508b
PUDP 161b 116a 207 237 222a 3,548 4,177 3,862a
UDP 164a 117a 209 238 223a 3,663 4,249 3,961a
ANOVA (p value)
Variety 0.0001 0.0007 0.0036
Fertilizer 0.0000 0.0061 0.0016
Variety x Fertilizer 0.0050 0.7704 0.9750
Bakerganj, Barisal
FP 156c 115a 229b 225a 3,351 3,549 3,450b
PUDP 161b 116a 293a 235ab 3,722 3,965 3,844a
UDP 167a 117a 303a 239a 3,858 4,101 3,980a
ANOVA (p value)
Variety 0.0003 0.0075 0.1741
Fertilizer 0.0005 0.0000 0.001
Variety x Fertilizer 0.0061 0.0000 0.9104
Within a column and location, means followed by the same letters are not significantly different at P<0.05.
Drought Trial in Nepal
The experiment under drought-prone areas (rainfed condition) was also conducted in Nepal. This
research was conducted in partnership with Agricultural and Forestry University (AFU). The
objective of the experiments was to determine the optimum method of N fertilizer placement for
different rice varieties, including LIV, drought-tolerant, and hybrid varieties. Five fertilizer
treatments were tested in split plot design, with rice varieties as main plots and fertilizers as sub-
plots. The five fertilizer treatments were control (0 kg N ha-1), urea broadcast (78 and 100 kg N
11
ha-1), and granular and urea briquette deep placement (78 kg N ha-1). Both granular and briquette
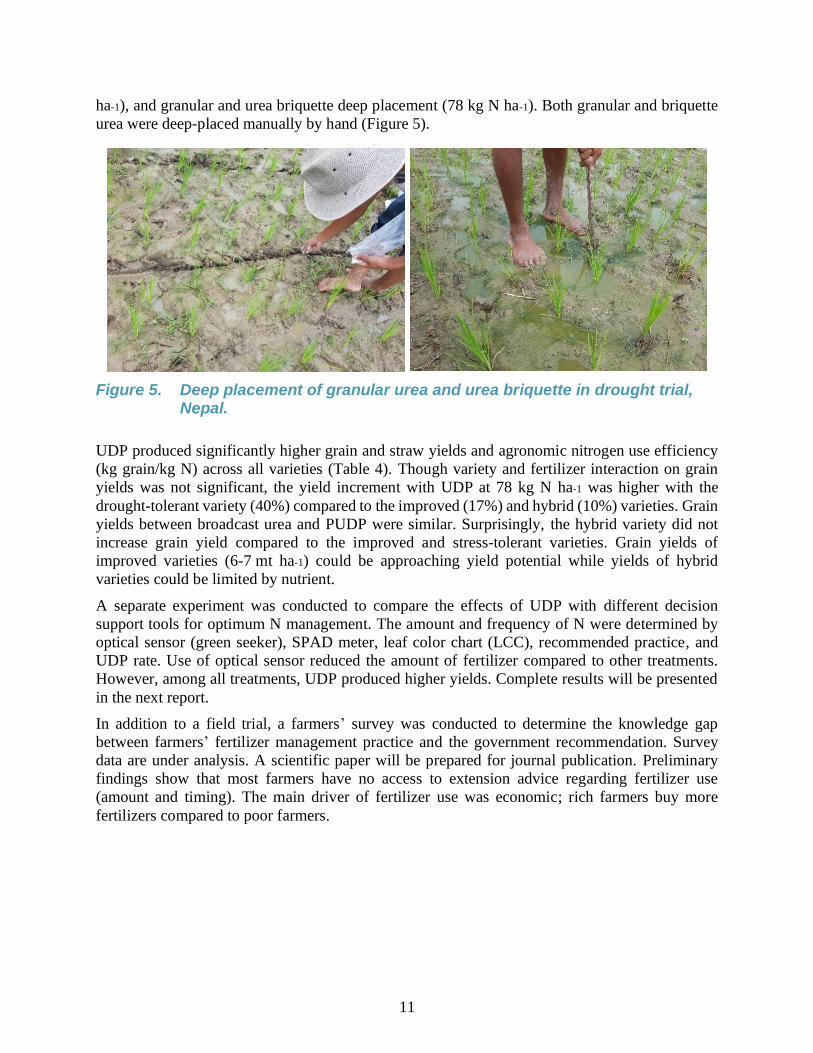
urea were deep-placed manually by hand (Figure 5).
Figure 5. Deep placement of granular urea and urea briquette in drought trial, Nepal.
UDP produced significantly higher grain and straw yields and agronomic nitrogen use efficiency
(kg grain/kg N) across all varieties (Table 4). Though variety and fertilizer interaction on grain
yields was not significant, the yield increment with UDP at 78 kg N ha-1 was higher with the
drought-tolerant variety (40%) compared to the improved (17%) and hybrid (10%) varieties. Grain
yields between broadcast urea and PUDP were similar. Surprisingly, the hybrid variety did not
increase grain yield compared to the improved and stress-tolerant varieties. Grain yields of
improved varieties (6-7 mt ha-1) could be approaching yield potential while yields of hybrid
varieties could be limited by nutrient.
A separate experiment was conducted to compare the effects of UDP with different decision
support tools for optimum N management. The amount and frequency of N were determined by
optical sensor (green seeker), SPAD meter, leaf color chart (LCC), recommended practice, and
UDP rate. Use of optical sensor reduced the amount of fertilizer compared to other treatments.
However, among all treatments, UDP produced higher yields. Complete results will be presented
in the next report.
In addition to a field trial, a farmers’ survey was conducted to determine the knowledge gap
between farmers’ fertilizer management practice and the government recommendation. Survey
data are under analysis. A scientific paper will be prepared for journal publication. Preliminary
findings show that most farmers have no access to extension advice regarding fertilizer use
(amount and timing). The main driver of fertilizer use was economic; rich farmers buy more
fertilizers compared to poor farmers.
12
Table 4. Comparison of number of panicles, grain yield, straw yield, and nitrogen use efficiency with fertilizer types and rates under local improved varieties and stress (drought)-tolerant varieties in Nepal.
Fertilizer Panicles per m2 Grain Yield (t/ha)
LIV STV Hybrid Average LIV STV Hybrid Average Control-N0 222 193 193 203c 3.91 2.95 3.61 3.49c
Broadcast-N78 232 209 218 220bc 5.75 4.18 6.46 5.46b
PUDP-N78 240 198 222 220bc 5.14 4.91 5.48 5.17b
UDP-N78 294 281 307 294a 6.76 5.87 7.13 6.58a
Broadcast-N100 258 238 272 256b 6.83 5.48 6.37 6.23a
ANOVA (p value)
Variety 0.5554 0.1016
Fertilizer 0.0002 0.0000
Variety x Fertilizer 0.9829 0.2431
Fertilizer
Straw Yield (t/ha) NUE (kg grain/kg N applied)
LIV STV Hybrid Average LIV STV Hybrid Average Control-N0 6.40 4.94 7.07 6.14c
Broadcast-N78 7.72 6.89 7.97 7.53bc 24 16 36 25b
PUDP-N78 10.45 8.28 6.59 8.44b 15 25 24 22b
UDP-N78 10.23 10.87 9.77 10.29a 37 37 45 40a
Broadcast-N100 9.46 7.66 9.14 8.75b 29 25 28 27b
ANOVA (p value)
Variety 0.6296 0.2804
Fertilizer 0.0001 0.0011
Variety x Fertilizer 0.1661 0.2667
Within a column and response variable, means followed by the same letters are not significantly different at P<0.05.
Salinity and Submergence Trials in Myanmar
In the dry season of 2017, two field trials were conducted in Myanmar in saline-prone areas
(Bogale and Pyapon). Four fertilizer treatments, namely farmers’ practice at 114 kg N/ha,
recommended practice at 85 kg N/ha, and prilled urea deep placement and urea briquette deep
placement, both at 58 kg N/ha, were tested in combination with local and saline-tolerant variety,
Pyi Myanmar Sein.
Fertilizer treatments had no interaction effects with variety on grain yields. UDP increased grain
yield significantly compared with FP and RP at both locations. Grain yield with UDP was 32%
and 61% higher than FP at Bogale and Pyapon, respectively. Although granular urea deep
placement (PUDP) is not possible by hand, its effect on grain yields was comparable with UDP.
These results suggest that deep placement is equally as effective under stress environment (saline
soils) as in irrigated rice fields.
13
Table 5. Comparison of plant height, number of panicles, and grain yields with farmers’ practice, recommended practice, prilled UDP, and UDP (briquette) under local improved varieties and stress-tolerant varieties in salinity-prone areas of Myanmar.
Fertilizer Plant Height (cm) Panicles per m2 Yield (kg/ha)
LIV STV Average LIV STV Average LIV STV Average Bogale FP 71b 90b 432 398 415b 3,246 3,650 3,450b
RP 70b 85b 415 373 394b 2,440 3,130 2,790c
PUDP 78a 104a 480 510 495a 4,410 4,390 4,400a
UDP 77a 103a 543 520 532a 4,546 4,553 4,550a
ANOVA (p value)
Variety 0.0045 0.3584 0.0769
Fertilizer 0.0000 0.0051 0.0000
Variety x Fertilizer 0.0339 0.7268 0.2893
Pyapon FP 75 97 86b 358 478 2,503 3,970 3,240c
RP 81 107 94a 487 628 2,793 5,173 3,980bc
PUDP 89 109 99a 523 538 3,726 5,133 4,430ab
UDP 85 105 95a 530 491 4,646 5,776 5,210a
ANOVA (p value)
Variety 0.0063 0.4697 0.0327
Fertilizer 0.0128 0.0797 0.0034
Variety x Fertilizer 0.8420 0.2787 0.4859
Within a column and location, means followed by the same letters are not significantly different at P<0.05.
Field trials were initiated during the wet season (July 2017) at three submergence-prone areas in
Myanmar. However, due to early flooding and heavy loss of seedlings, the trials at one location
were abandoned. Two fertilizer treatments, farmers’ practice at 75 kg N/ha and urea briquette deep
placement at 50 kg N/ha, were tested in combination with local improved variety and
submergence-tolerant variety, Swarna sub1.
The overall effect of varieties, fertilizer treatments, and locations, and their interactions on grain
yield and number of panicles is summarized in Table 6. At both locations, Swarna sub1
outperformed local varieties in yield and panicle numbers (Figure 6). Only at Kungyangon, UDP
gave significantly higher grain yield than FP. At the high-yielding location (Kwin Yar), basal
application of diammonum phosphate (DAP) followed by three split applications of urea improved
the efficiency of broadcast application to give similar yield as UDP. BMPs in favorable
environment could be as effective as UDP to give similar yields. However, other impacts of UDP
are lower fertilizer dosage, reduced N losses to the environment and one-time application of N
fertilizer – with overall higher gross margin1. A scientific paper comparing the results of field
trials over the past two years under drought and submergence conditions from Myanmar and
Bangladesh will be prepared for journal publication. Ongoing efforts are also being made for
1 Kaw, D and G. Hunter (2017). UDP technology and rice yields among farmer beneficiaries of rainfed lowland
project areas in Myanmar. IN Myanmar Soil Fertility and Fertilizer Management Conference Proceedings, pp. 135-
149, IFDC and DAR, Myanmar.
14
collecting additional input cost and output price data to complete economic analyses of the stress
trials. The economic results may be used for a separate publication or combined with the
agronomic paper.
Table 6. Comparison of variety, fertilizer, and location, and their interactions on number of panicles and grain yields for submergence-prone areas in Myanmar.
Effect
Grain Yield Number of Panicles
F Value Pr > F F Value Pr > F
Location 185.85 <.0001 3.32 0.0946
Variety 45.54 0.0006 8.38 0.0141
Location *Variety 1.46 0.2745 0.35 0.5669
Fertilizer (FTRT) 8.59 0.0272 10 0.0086
Location *FTRT 6.41 0.0458 0.01 0.9165
Variety*FTRT 0.56 0.4821 0.1 0.7535
Location *Variety *FTRT 0.19 0.6781 1.52 0.2424
Figure 6. Effect of fertilizer treatment (UDP versus FP), variety (submergence-tolerant versus local improved variety) and location on grain yield and number of panicles under submerged conditions in Myanmar.
Fertilizer
15
1.1.2 Improved Nutrient Use Efficiency with Subsurface Fertilizer Application
Subsurface fertilizer application improves nutrient use efficiency by improving the availability of
nutrients for crop uptake and/or reducing nutrient losses.
Comparison of Agronomic and Economic Performance of FDP (NP, NPK, and Urea Briquettes) on Paddy Rice Under Irrigated and Lowland Cropping Systems in Mali
Since 2014, the FTF USAID Scaling Up Fertilizer Deep Placement and Microdosing Technologies
in Mali (FDP MD) project has been demonstrating and promoting the use of UDP in rice
production systems, particularly in lowland and irrigated systems, in Mali. Results for FY17
showed an average increase in rice paddy yield of 1.2 mt/ha and 2.3 mt/ha for lowland and irrigated
systems, respectively, relative to farmers’ practice (the conventional broadcast of prilled urea).
The increase in gross margin was $340/ha for lowland paddy rice and $1,376/ha for irrigated rice,
demonstrating a clear profitability increase associated with the use of UDP in rice farming systems.
Similar results were reported in previous years under the FDP MD project.
Additional field work in selected locations is being conducted in FY18 in partnership with
Direction Regionale de l’Agriculture (DRA) and non-governmental organizations (NGOs).
Adapting Balanced FDP (NP and NPK Briquettes) to Intensive Rice Cropping Systems (SRI) in West Africa (Mali, Togo, and Burkina Faso)
The proposed activity will be conducted for two seasons starting in FY18 in partnership with the
Cornell SRI initiative, national agricultural research extension systems (NARES), and NGO
extension services. The FY18 season activities will be supported partially by the FDP MD project.
Preparation for the field activities include interacting with partners to finalize the demonstration
protocol as well as developing an activity budget to support the FDP SRI activity.
Agronomic and Economic Evaluation of Deep Placement on Maize and Winter and Off-Season Vegetables in Mali and Ghana
Vegetable Trials in Mali
The vegetable trials in Mali began in the winter season of 2017, but the experiment suffered from
improper application of fertilizer treatments in the field. There was a discrepancy between the
NPK fertilizer used to make the briquettes and the one used for basal broadcasting in the control
treatments. Therefore, the data resulting from the test for that season did not receive full statistical
analysis.
The FY18 on-station trials are being conducted in partnership with the World Vegetable Center
(WorldVeg) through the FDP MD project to improve fertilizer use on vegetables in Mali. The
activity will quantify vegetable crop yield and quality as affected by rate and placement of fertilizer
briquettes (NP and NPK).
For the off-season crops, eggplant, onion, and tomato were grown at three locations. For each crop
species, the field layout was a split plot design with four replicates. The main plot was placement
of fertilizer with three levels (surface, 5-cm deep, and 10-cm deep) and four subplots for the rate
of fertilizer application (no fertilizer, RP – broadcast incorporated, two-thirds of the RP rate as
briquettes, and one-half of the RP rate as briquettes).
16
Data collection is in progress and data include crop yield, fruit number and mean weight per
treatment, quality of fruits as measured by size, fiber, and nutrient content. In addition, data for
economic assessment of treatments are being collected. The off-season vegetable trials are
expected to end in early April.
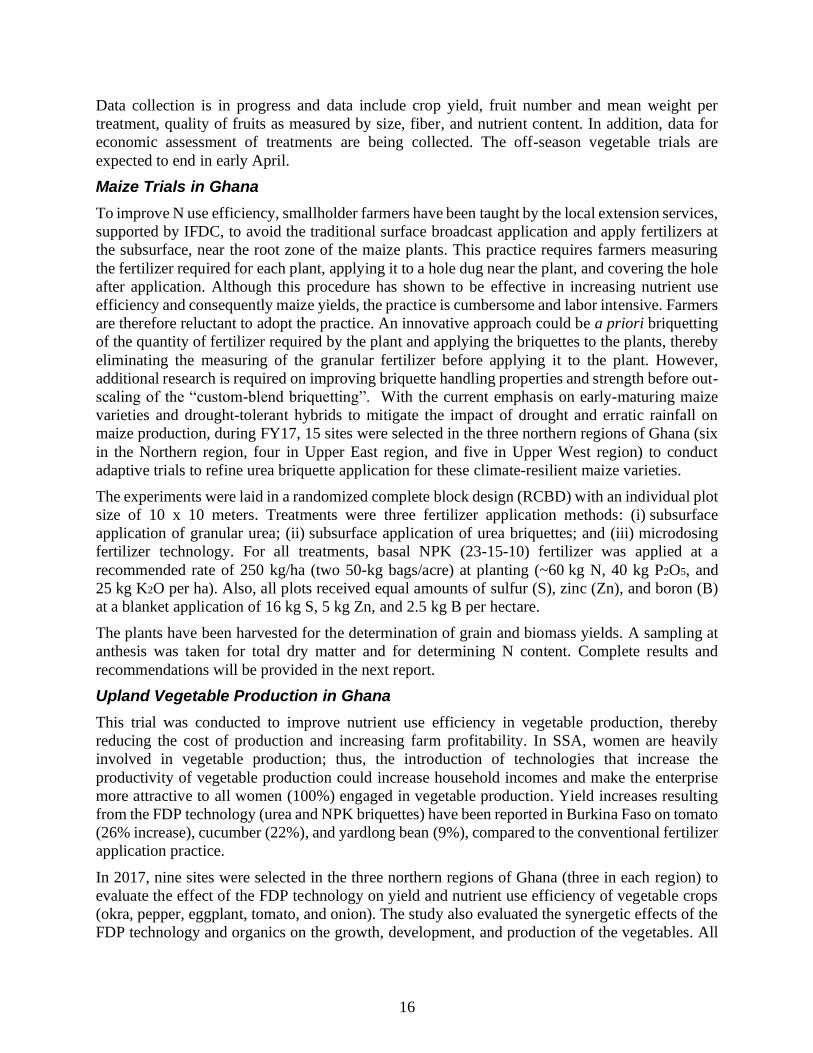
Maize Trials in Ghana
To improve N use efficiency, smallholder farmers have been taught by the local extension services,
supported by IFDC, to avoid the traditional surface broadcast application and apply fertilizers at
the subsurface, near the root zone of the maize plants. This practice requires farmers measuring
the fertilizer required for each plant, applying it to a hole dug near the plant, and covering the hole
after application. Although this procedure has shown to be effective in increasing nutrient use
efficiency and consequently maize yields, the practice is cumbersome and labor intensive. Farmers
are therefore reluctant to adopt the practice. An innovative approach could be a priori briquetting
of the quantity of fertilizer required by the plant and applying the briquettes to the plants, thereby
eliminating the measuring of the granular fertilizer before applying it to the plant. However,
additional research is required on improving briquette handling properties and strength before out-
scaling of the “custom-blend briquetting”. With the current emphasis on early-maturing maize
varieties and drought-tolerant hybrids to mitigate the impact of drought and erratic rainfall on
maize production, during FY17, 15 sites were selected in the three northern regions of Ghana (six
in the Northern region, four in Upper East region, and five in Upper West region) to conduct
adaptive trials to refine urea briquette application for these climate-resilient maize varieties.
The experiments were laid in a randomized complete block design (RCBD) with an individual plot
size of 10 x 10 meters. Treatments were three fertilizer application methods: (i) subsurface
application of granular urea; (ii) subsurface application of urea briquettes; and (iii) microdosing
fertilizer technology. For all treatments, basal NPK (23-15-10) fertilizer was applied at a
recommended rate of 250 kg/ha (two 50-kg bags/acre) at planting (~60 kg N, 40 kg P2O5, and
25 kg K2O per ha). Also, all plots received equal amounts of sulfur (S), zinc (Zn), and boron (B)
at a blanket application of 16 kg S, 5 kg Zn, and 2.5 kg B per hectare.
The plants have been harvested for the determination of grain and biomass yields. A sampling at
anthesis was taken for total dry matter and for determining N content. Complete results and
recommendations will be provided in the next report.
Upland Vegetable Production in Ghana
This trial was conducted to improve nutrient use efficiency in vegetable production, thereby
reducing the cost of production and increasing farm profitability. In SSA, women are heavily
involved in vegetable production; thus, the introduction of technologies that increase the
productivity of vegetable production could increase household incomes and make the enterprise
more attractive to all women (100%) engaged in vegetable production. Yield increases resulting
from the FDP technology (urea and NPK briquettes) have been reported in Burkina Faso on tomato
(26% increase), cucumber (22%), and yardlong bean (9%), compared to the conventional fertilizer
application practice.
In 2017, nine sites were selected in the three northern regions of Ghana (three in each region) to
evaluate the effect of the FDP technology on yield and nutrient use efficiency of vegetable crops
(okra, pepper, eggplant, tomato, and onion). The study also evaluated the synergetic effects of the
FDP technology and organics on the growth, development, and production of the vegetables. All
17
vegetables have been harvested to determine crop yields and quality. The full description of the
trials and the results will be presented in the next report.
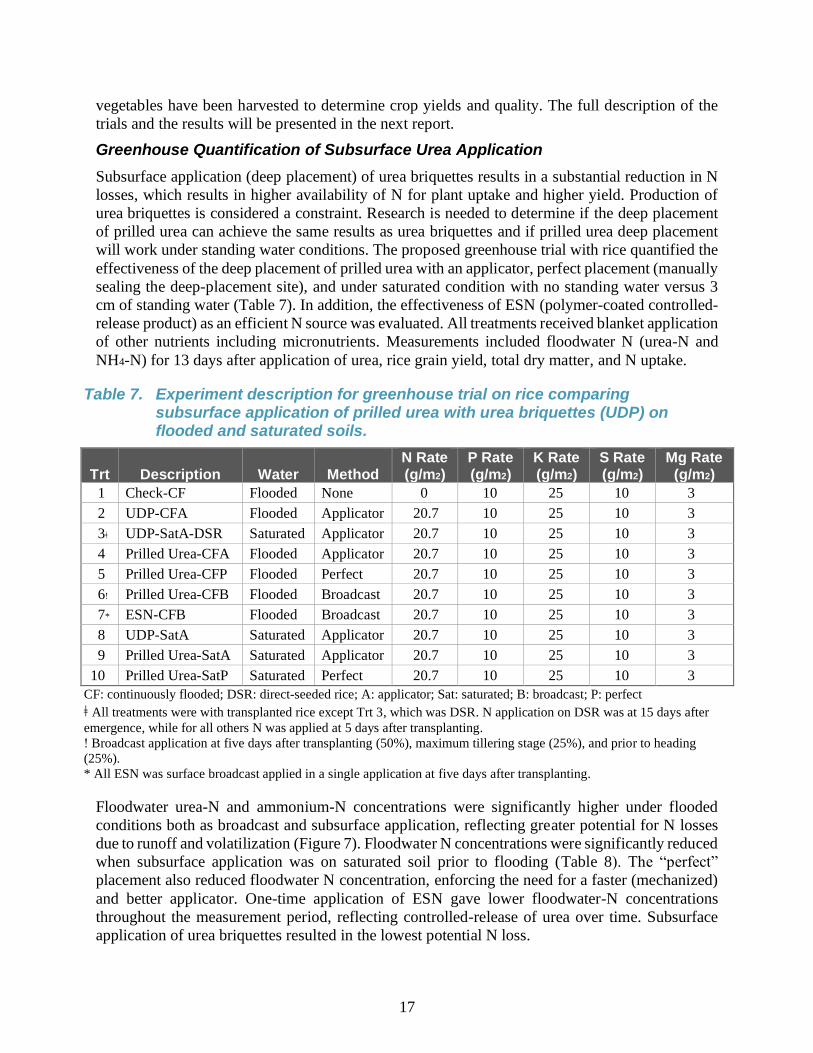
Greenhouse Quantification of Subsurface Urea Application
Subsurface application (deep placement) of urea briquettes results in a substantial reduction in N
losses, which results in higher availability of N for plant uptake and higher yield. Production of
urea briquettes is considered a constraint. Research is needed to determine if the deep placement
of prilled urea can achieve the same results as urea briquettes and if prilled urea deep placement
will work under standing water conditions. The proposed greenhouse trial with rice quantified the
effectiveness of the deep placement of prilled urea with an applicator, perfect placement (manually
sealing the deep-placement site), and under saturated condition with no standing water versus 3
cm of standing water (Table 7). In addition, the effectiveness of ESN (polymer-coated controlled-
release product) as an efficient N source was evaluated. All treatments received blanket application
of other nutrients including micronutrients. Measurements included floodwater N (urea-N and
NH4-N) for 13 days after application of urea, rice grain yield, total dry matter, and N uptake.
Table 7. Experiment description for greenhouse trial on rice comparing subsurface application of prilled urea with urea briquettes (UDP) on flooded and saturated soils.
Trt Description Water Method N Rate (g/m2)
P Rate (g/m2)
K Rate (g/m2)
S Rate (g/m2)
Mg Rate (g/m2)
1 Check-CF Flooded None 0 10 25 10 3
2 UDP-CFA Flooded Applicator 20.7 10 25 10 3
3ǂ UDP-SatA-DSR Saturated Applicator 20.7 10 25 10 3
4 Prilled Urea-CFA Flooded Applicator 20.7 10 25 10 3
5 Prilled Urea-CFP Flooded Perfect 20.7 10 25 10 3
6ǃ Prilled Urea-CFB Flooded Broadcast 20.7 10 25 10 3
7* ESN-CFB Flooded Broadcast 20.7 10 25 10 3
8 UDP-SatA Saturated Applicator 20.7 10 25 10 3
9 Prilled Urea-SatA Saturated Applicator 20.7 10 25 10 3
10 Prilled Urea-SatP Saturated Perfect 20.7 10 25 10 3
CF: continuously flooded; DSR: direct-seeded rice; A: applicator; Sat: saturated; B: broadcast; P: perfect ǂ All treatments were with transplanted rice except Trt 3, which was DSR. N application on DSR was at 15 days after
emergence, while for all others N was applied at 5 days after transplanting.
ǃ Broadcast application at five days after transplanting (50%), maximum tillering stage (25%), and prior to heading
(25%).
* All ESN was surface broadcast applied in a single application at five days after transplanting.
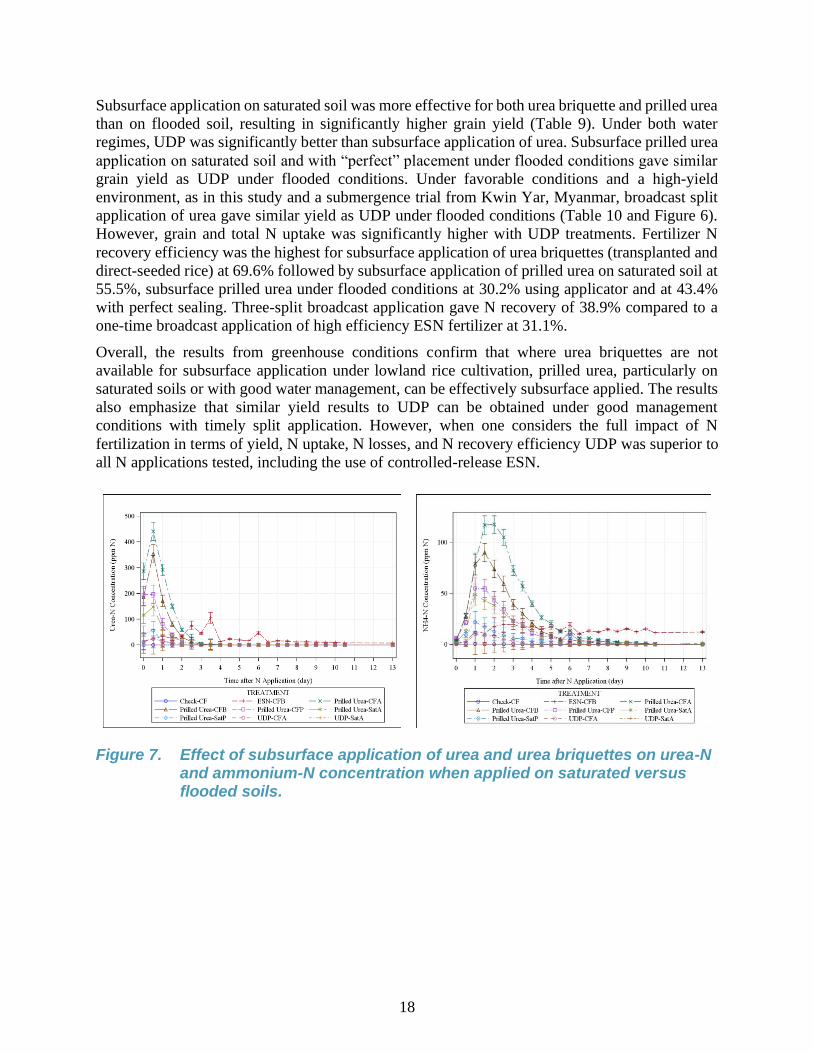
Floodwater urea-N and ammonium-N concentrations were significantly higher under flooded
conditions both as broadcast and subsurface application, reflecting greater potential for N losses
due to runoff and volatilization (Figure 7). Floodwater N concentrations were significantly reduced
when subsurface application was on saturated soil prior to flooding (Table 8). The “perfect”
placement also reduced floodwater N concentration, enforcing the need for a faster (mechanized)
and better applicator. One-time application of ESN gave lower floodwater-N concentrations
throughout the measurement period, reflecting controlled-release of urea over time. Subsurface
application of urea briquettes resulted in the lowest potential N loss.
18
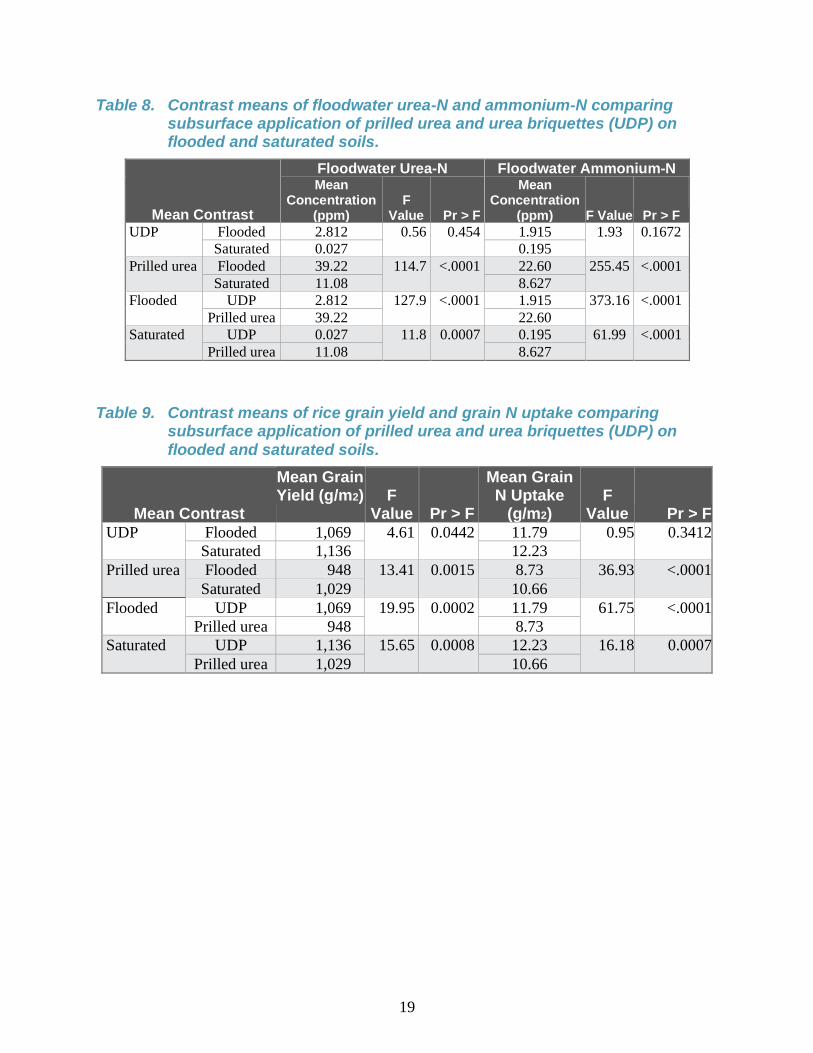
Subsurface application on saturated soil was more effective for both urea briquette and prilled urea
than on flooded soil, resulting in significantly higher grain yield (Table 9). Under both water
regimes, UDP was significantly better than subsurface application of urea. Subsurface prilled urea
application on saturated soil and with “perfect” placement under flooded conditions gave similar
grain yield as UDP under flooded conditions. Under favorable conditions and a high-yield
environment, as in this study and a submergence trial from Kwin Yar, Myanmar, broadcast split
application of urea gave similar yield as UDP under flooded conditions (Table 10 and Figure 6).
However, grain and total N uptake was significantly higher with UDP treatments. Fertilizer N
recovery efficiency was the highest for subsurface application of urea briquettes (transplanted and
direct-seeded rice) at 69.6% followed by subsurface application of prilled urea on saturated soil at
55.5%, subsurface prilled urea under flooded conditions at 30.2% using applicator and at 43.4%
with perfect sealing. Three-split broadcast application gave N recovery of 38.9% compared to a
one-time broadcast application of high efficiency ESN fertilizer at 31.1%.
Overall, the results from greenhouse conditions confirm that where urea briquettes are not
available for subsurface application under lowland rice cultivation, prilled urea, particularly on
saturated soils or with good water management, can be effectively subsurface applied. The results
also emphasize that similar yield results to UDP can be obtained under good management
conditions with timely split application. However, when one considers the full impact of N
fertilization in terms of yield, N uptake, N losses, and N recovery efficiency UDP was superior to
all N applications tested, including the use of controlled-release ESN.
Figure 7. Effect of subsurface application of urea and urea briquettes on urea-N and ammonium-N concentration when applied on saturated versus flooded soils.
19
Table 8. Contrast means of floodwater urea-N and ammonium-N comparing subsurface application of prilled urea and urea briquettes (UDP) on flooded and saturated soils.
Mean Contrast
Floodwater Urea-N Floodwater Ammonium-N Mean
Concentration (ppm)
F Value Pr > F
Mean Concentration
(ppm) F Value Pr > F
UDP Flooded 2.812 0.56 0.454 1.915 1.93 0.1672
Saturated 0.027 0.195
Prilled urea Flooded 39.22 114.7 <.0001 22.60 255.45 <.0001
Saturated 11.08 8.627
Flooded UDP 2.812 127.9 <.0001 1.915 373.16 <.0001
Prilled urea 39.22 22.60
Saturated UDP 0.027 11.8 0.0007 0.195 61.99 <.0001
Prilled urea 11.08 8.627
Table 9. Contrast means of rice grain yield and grain N uptake comparing subsurface application of prilled urea and urea briquettes (UDP) on flooded and saturated soils.
Mean Contrast
Mean Grain Yield (g/m2) F
Value Pr > F
Mean Grain N Uptake
(g/m2) F
Value Pr > F UDP Flooded 1,069 4.61 0.0442 11.79 0.95 0.3412
Saturated 1,136 12.23
Prilled urea Flooded 948 13.41 0.0015 8.73 36.93 <.0001
Saturated 1,029 10.66
Flooded UDP 1,069 19.95 0.0002 11.79 61.75 <.0001
Prilled urea 948 8.73
Saturated UDP 1,136 15.65 0.0008 12.23 16.18 0.0007
Prilled urea 1,029 10.66
20
Table 10. Contrast means of rice grain yield and total N uptake comparing subsurface application of prilled urea and urea briquettes (UDP) on flooded and saturated soils.
Tukey Grouping for TRT Least Squares Means (Alpha=0.05)
LS-means with the same letter are not significantly different.
Treatment Description Mean Grain Yield (g/m2)
Mean Total N Uptake (g/m2)
UDP – saturated soil with applicator 1,135.8 A 21.38 A
UDP – flooded with applicator 1,068.8 AB 21.52 A
Subsurface prilled urea – saturated soil 1,035.6 BC 19.07 AB
Broadcast prilled urea – flooded split application 1,033.7 BC 15.02 CD
Subsurface prilled urea – saturated soil with applicator 1,022.4 BCD 17.86 BC
Subsurface prilled urea – flooded 984.0 BCD 15.95 CD
Broadcast single application of ESN – flooded 950.9 CDE 13.40 D
Subsurface prilled urea – flooded with applicator 912.7 DE 13.22 D
UDP – saturated soil with applicator for DSR 842.4 E 21.04 A
Check – flooded 582.8 F 6.97 E
1.1.3 Improving Nitrogen Use Efficiency of Organic and Inorganic Fertilizers
The proposed activities to be conducted in partnership with universities (Auburn University,
Clemson University, and University of Florida) and the private sector are in the planning stages.
The activity reported here was conducted in partnership with the U.S. Department of Agriculture.
It is a 3-year USDA NIFA-funded project being executed in collaboration with The Connecticut
Agricultural Experiment Station (as the lead) and The University of Texas in El Paso. It started in
March 2016 and ends on February 2019.
Yield Responses of Wheat to Micronutrient Fertilization
This is an ongoing study with the objective to evaluate the responses of wheat to fertilization with
micronutrients, including zinc (Zn) and manganese (Mn), in order to understand how micronutrient
fertilization influences crops’ use of NPK and confer tolerance to biotic and abiotic environmental
stresses in crops. In separate experiments, the micronutrients were applied as ZnO nanopowder or
Zn-sulfate (salt) and MnO nanopowder, bulk MnO powder, or Mn-chloride (salt). The rate of Zn
used was 6 mg/kg soil, and that of Mn was 10 mg/kg soil. N, phosphorus (P), and potassium (K)
rates were 200, 75, and 200 mg/kg soil, respectively. In the Zn study, the experiment was
conducted using fresh soils and used soils (previously treated with the same Zn types and amount
and cropped with sorghum) to demonstrate whether Zn as nanopowder or salts (ions) have any
residual value as fertilizer for subsequent crops, compared to fresh Zn applications. The soil used
in the studies is a sandy loam with a near-neutral pH of 6.87, which suggests the pH is nearing the
upper boarder line for optimum soil Zn and Mn bioavailability. The initial Zn level of 0.1 mg/kg
was below the critical level for Zn of 0.5 to 1.0 mg/kg and likewise the Mn level of 6.4 mg/kg was
below the critical level of 50-100 mg/kg.
21
Preliminary results showed that freshly applied Zn treatments as nanopowders or salt on the
“fresh” soil increased grain yield by 15% or 18.5%, respectively, compared to the control – NPK
only (Figure 8). Wheat grain yield was similarly increased by the residual Zn nanopowder and Zn
salt compared to the control in the used (residual) soil by 10.5% and 12.5%, respectively. These
findings indicate that Zn treatment has both immediate and residual effects on wheat productivity.
Figure 8. Response of wheat to ZnO nanopowder and Zn salt in fresh and used soils.
Figure 9 shows response of wheat to Mn. Compared to the control (i.e., NPK only), Mn treatment
in soil as nanopowder, salts (ions), or bulk Mn increased grain yield by 16%, 9%, and 12%,
respectively. In addition, the Mn nanopowder resulted in 4.6% more grain yield when applied as
a foliar treatment compared to soil application. These findings indicate that nanopowder of Mn are
more effective than other Mn forms in enhancing wheat grain yield. Also, compared to soil
application, foliar application of nanopowder of Mn may be more effective for increasing grain
yield.
0
10
20
30
40
50
NPK NPK+ZnOnano
NPK +Zn salt
NPK NPK+ZnOnano
NPK +Zn salt
Fresh Soil Used Soil
Gra
in y
ield
(g/
pla
nt)
22
Figure 9. Response of wheat to Mn as nanopowder oxides, bulk particle oxides, and salts.
Additional data are currently being generated in both experiments. Specifically, NPK levels in the
root, shoot, and grain are being determined, together with residual levels of these elements in the
soil after plant harvest. The levels of Zn and Mn in the root, shoot, and grains are also being
determined. We anticipate different effects of Zn and Mn on NPK uptake into shoot and their
translocation into grain. It is expected that more Zn or Mn will be present in grains of plants treated
with these nutrients. Ultimately, by tracking N, P, K, Zn, and Mn from soil through the root, to
shoot, and grain, we hope to establish a mass balance of these nutrients through source to sink.
Such outcomes can provide useful information for improving nutrient and fertilizer management
in cropping systems, especially in SSA where low NPK application warrants strategies for crops
to more efficiently use the small amounts applied. Furthermore, in the case of Zn, information
pertinent to the frequency of Zn application will be gained from the residual studies. We will also
understand the differences, if any, between nano-scale and ionic Zn or Mn on wheat responses.
1.1.4 CO2 Mitigation Role of Enhanced Efficiency Fertilizers and Practices
Application of urea, independent of the method of application, results in CO2 emission during urea
hydrolysis. In broadcast-applied urea, all CO2 emissions (0.73 kg/kg urea) to the atmosphere occur
within five to seven days, contributing to the greenhouse gas (GHG) pool. Although CO2 emission
has a negative impact as a GHG, it also increases dry matter and grain yield, particularly in C3
plants, such as rice, wheat, and legumes, due to its positive effect on photosynthesis. However, to
have the latter effect, CO2 emission must occur over a prolonged period as with controlled-release
fertilizers.
Results presented in Figure 10 show a net increase in CO2 emission compared to ammonium nitrate
(AN) for three soils – Hiwassee (pH 5.5), Greenville (pH 6.2), and Brownfield (pH 6.9) –
incubated at 50% field moisture capacity (FMC) for 20-27 days (480-750 hours). The application
of AN takes into account the effect of N fertilization on microbial activity; however, unlike urea-
based products (UDP, Agrotain, ESN), there is no direct CO2 emission from AN. Enhanced
0
10
20
30
40
50
NPK NPK+ nanoMn (soil)
NPK+ nanoMn (foliar)
NPK+ saltMn (soil)
NPK+ bulkMn (soil)
Gra
in y
ield
(g/
pla
nt)
23
efficiency fertilizer, such as ESN, in addition to controlling the release of N, slowed the rate of
CO2 emission. Such reduction in the CO2 emission rate may improve the opportunity for CO2
capture by plants and soil microflora. A full report based on the ongoing thesis work will be
presented in the next report.
Figure 10. CO2 emission (µmol) on application of urea-based fertilizers on Hiwassee, Greenville, and Brownfield soils at 50% FMC.
1.2 Balanced Plant Nutrition Through Improved Fertilizer Product Recommendations (Cross-Cutting with Workstream 2.3)
For sustainable crop intensification and protection of natural resources, balanced nutrient
management/fertilization is critical. Balanced fertilization is also important in the efficient use of
fertilizers, soil health, and crop resilience. In addition to N, P, and K, many soils in SSA are now
deficient in S, magnesium (Mg), Zn, and other secondary and micronutrients. These deficiencies
are being confirmed by the results from the ongoing soil analyses of the FTF zones of intervention
for the three northern regions of Ghana.
In Asia and SSA, several blends of fertilizers are available, and more will come into the supply
chain. Assuming the fertilizer product has not been adulterated, such fertilizers generally have a
positive impact on crop productivity. However, the availability of a given nutrient within a granule
of fertilizer is strongly affected by the presence of other nutrients and the interactions of various
nutrients within the granule or as the granule dissolves when applied. With synergistic combination
of macro- and micronutrients in a granule, the plant availability and efficiency of fertilizer use can
be increased. Conversely, antagonistic effects can result in reduced plant availability of critical
nutrients and lower use efficiency. The progress of IFDC’s ongoing work on balanced plant
nutrition through improved fertilizer product recommendations is presented.
-20000.0
-10000.0
0.0
10000.0
20000.0
30000.0
40000.0
50000.0
60000.0
70000.0
0 200 400 600 800
Hiwassee
Check H50 UDP - H50Urea H50 AN H50Agrotain H50 ESN H50
Hours
umol CO2
0.0
10000.0
20000.0
30000.0
40000.0
50000.0
60000.0
70000.0
0 200 400 600
Greenville
Check G50 UDP - G50Urea G50 AN G50Agrotain G50 ESN G50
Hours
umol CO2
-5000.0
0.0
5000.0
10000.0
15000.0
20000.0
25000.0
30000.0
35000.0
40000.0
45000.0
50000.0
0 200 400 600 800
Brownfield
Check B50 UDP - B50Urea B50 AN B50Agrotain B50 ESN B50
Hours
umol CO2
24
1.2.1 Facilitate Site- and Crop-Specific Fertilizer Recommendations for Increased Economic and Environmental Benefits from Fertilizer Use
Updates of Soil Fertility Maps and Establishment of Nutrient Omission Trials to Validate the Fertility Maps
Farmers in developing countries regularly harvest crops yielding far below their biological
potential. Although pests and diseases take their toll, and water shortages are widespread,
nutritional disorders are probably the most pervasive constraint to crop yields in the tropics. This
is the result of either inherently low soil fertility or nutrient depletion, soil acidity, and organic
matter decline caused by repeated cropping without replacing what has been taken from the soil.
To mitigate this problem, most farmers apply fertilizers to their field. However, current fertilizer
recommendations in most developing countries are based on blanket fertilizer applications. Thus,
to increase productivity, it is critical to consider the spatial soil fertility variability in order to
redesign soil fertility recommendations to achieve sustainable growth in productivity, particularly
in SSA.
Using geostatistical tools, soil fertility maps were developed during FY17 for pH, organic matter,
N, P, K, Zn, S, and B with soil analytical data collected from the three northern regions of Ghana.
These soil fertility maps will serve to provide the basis for soil- and crop-specific fertilizer
recommendations, evaluation of the Soil testing, Mapping, Recommendations development, and
Technology transfer (SMaRT) approach, and refinement of the GSSAT software (geographic
information systems crop model application). The maps will be dynamic living maps that will be
updated and fine-tuned periodically as more data become available. During the first quarter of
FY18, the remaining soil samples collected were analyzed to update the soil maps. The updated
maps did not deviate from the results of the previous maps. As stated in FY17, (i) across all three
northern regions, particularly in the Upper East region and the northwestern corner of the Upper
West region, the soils are generally acidic to slightly acidic with very few isolated cases where the
soil pH is near neutral, and (ii) large portions of the total land area have soils deficient in P
(<10 mg/kg), S (<6 mg/kg), Zn (<1 mg/kg) and B (<1 mg/kg). Thus, to increase productivity in
such soils, and to realize the full benefits of investments in fertilizers, efforts must be made to
supply farmers with fertilizers containing these essential plant nutrients and also make farmers
aware of these nutrients for healthy crops. However, the quantities of the nutrients to supply will
depend on the results of the nutrient omission trials.
In addition to the soil samples, analyses of 1,500 plant tissue samples were completed to validate
the results of the soil analysis. The data from the plant tissue analyses are being used to develop
separate maps for comparison with the soil maps. In general, the data of the plant tissue analyses
showed a consistent match with the soil chemical analyses, as shown in Figure 11, for available
soil P and tissue P content. On the other hand, except for a few isolated cases encountered so far,
most of the soils in the entire zone of intervention have high K content (Figure 12), which should
be adequate for the production of most crops. However, tissue K content from Western and Eastern
Regions were low despite adequate soil K content. In some areas (seven in Northern, five in Upper
East, and 12 in Upper West), the N, P, and K contents of the unfertilized plant tissue samples were
greater than expected (Figures 11-13) due to plant roots accessing nutrients from deeper levels
(beyond the top 6 inches analyzed). To confirm this and to aid in accurate fertilizer
recommendations, soil samples from deeper horizons from these communities are being sampled
for analysis.

25
Given the above results, a nutrient omission plot technique is needed to verify the soil test and
plant tissue results and estimate fertilizer requirements. During the second quarter of FY18,
separate omission plots are being established for each nutrient for the FTF crops of interest in
northern Ghana (maize, rice, and soybean). Seventy-five sites were selected and demarcated for
the establishment of the nutrient omission trial during the rainy season in the three northern regions
of Ghana.
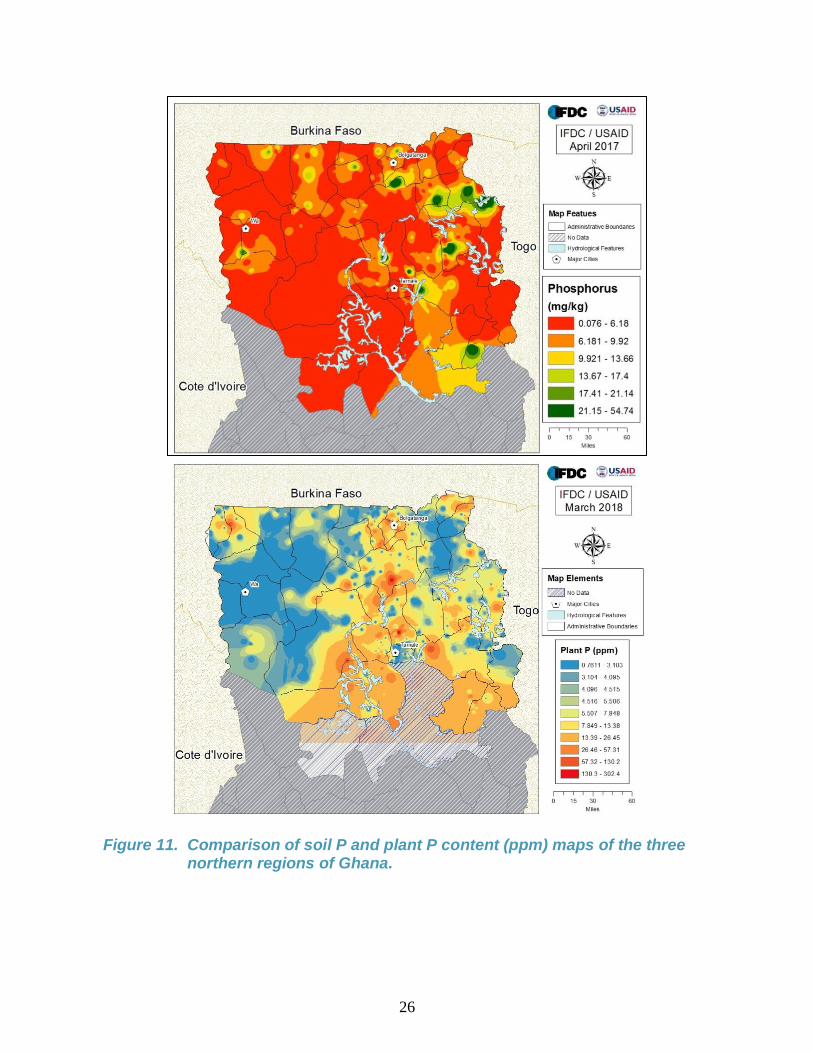
26
Figure 11. Comparison of soil P and plant P content (ppm) maps of the three northern regions of Ghana.
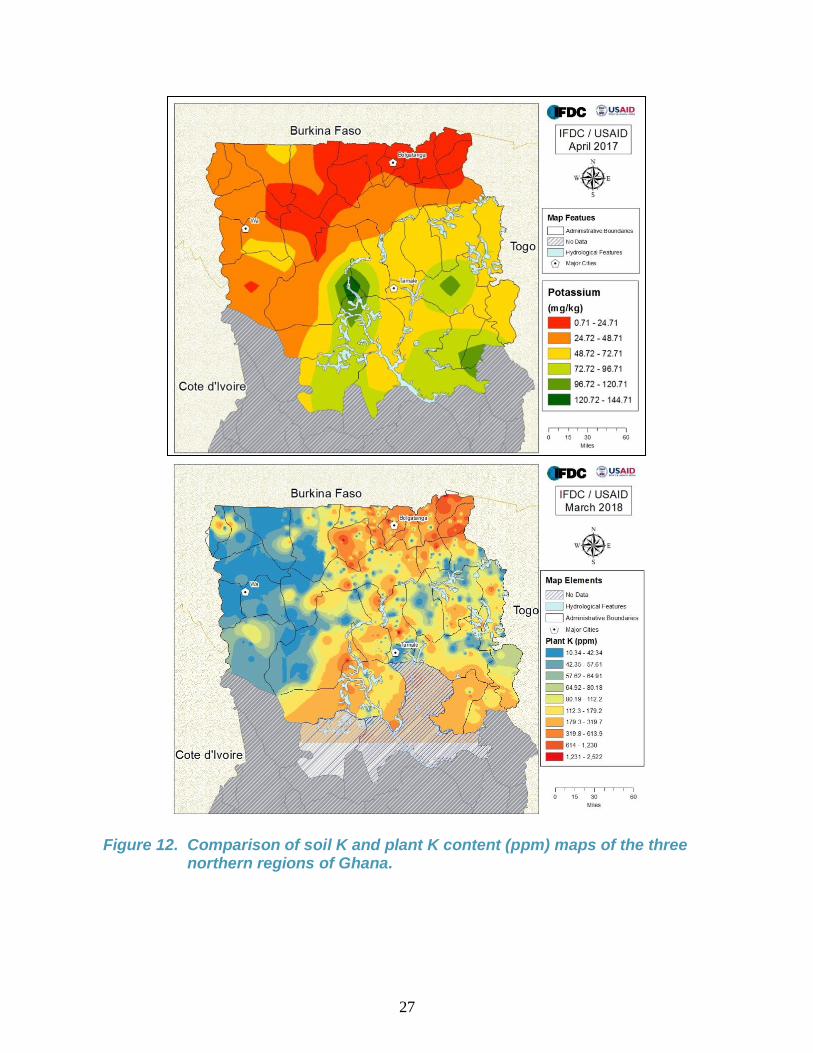
27
Figure 12. Comparison of soil K and plant K content (ppm) maps of the three northern regions of Ghana.
28
Figure 13. Plant N content (ppm) map of the three northern regions of Ghana.
1.2.2 Workshop on the State of Soil Fertility in Northern Ghana, Fertilizer Recommendations, Utilization, and Farm-Level Access
A workshop was proposed to be conducted in collaboration with the USAID Feed the Future
Ghana Agriculture Technology Transfer project and the African Fertilizer and Agribusiness
Partnership (AFAP) in March 2018. However, due to scheduling issues and the availability of key
stakeholders, the workshop has been moved to the week of April 9, 2018. The purpose is to inform
the agricultural community, government policymakers, and industry leaders about the status of
soils in northern Ghana based on the latest scientific analyses and to raise awareness of fertilizer
recommendations, practices, and availability. Expected participants that cut across the fertilizer
industry will include policymakers (Plant Protection and Regulatory Services Directorate,
Ministry of Food and Agriculture, Ghana Environmental Protection Agency), importers and
blenders, distributors, researchers (SARI, Soil Research Institute), private soil labs, retailers,
farmers, and special government initiatives (Planting for Food and Jobs, Youth Initiative in
Agriculture). During this workshop, “undisclosed” information on the status of northern Ghana’s
soils as well as fertilizer types, availability, and farm-level utilization will be shared with forum
participants, expanding their understanding of soil fertility and fertilizer issues in the region.
Selected presentations will stimulate dialogue among forum participants regarding identified soil
deficiencies and fertilizer recommendations, usage, and availability. It is anticipated that any gaps
and weaknesses in the fertilizer value chain in northern Ghana will be identified by the workshop
participants. They will adopt a proposed Action Plan to be implemented by identified responsible
parties to address highlighted priority issues in the fertilizer value chain.
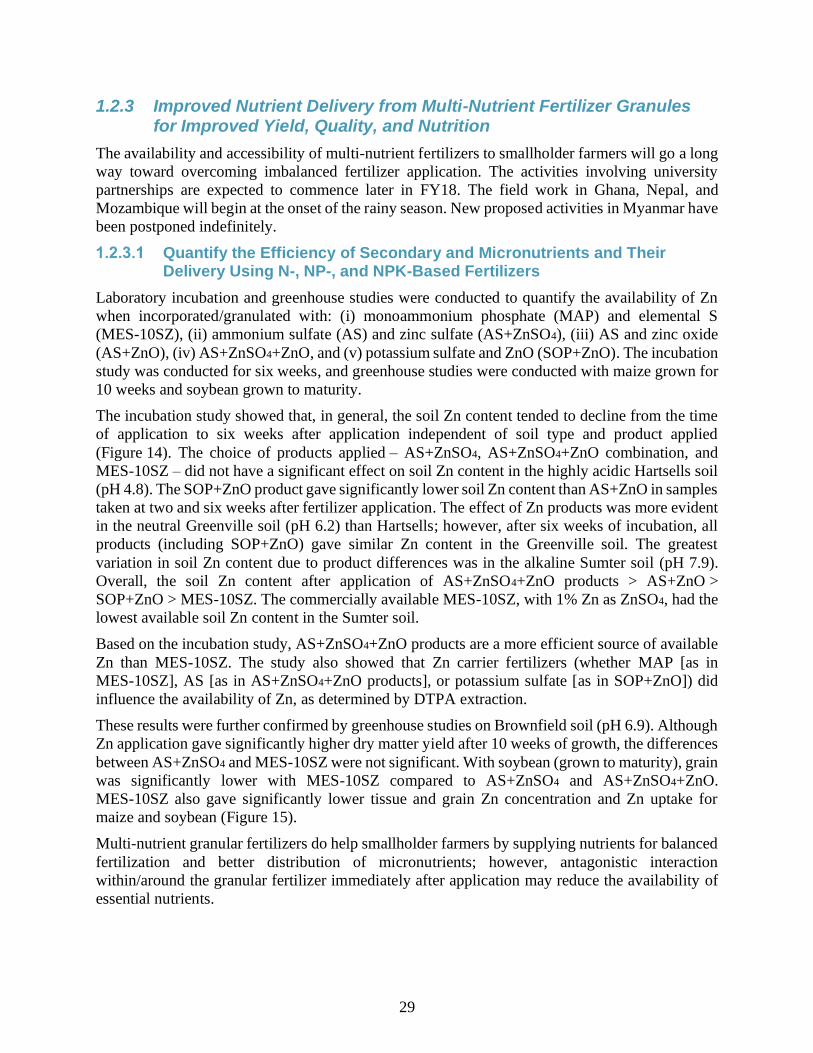
29
1.2.3 Improved Nutrient Delivery from Multi-Nutrient Fertilizer Granules for Improved Yield, Quality, and Nutrition
The availability and accessibility of multi-nutrient fertilizers to smallholder farmers will go a long
way toward overcoming imbalanced fertilizer application. The activities involving university
partnerships are expected to commence later in FY18. The field work in Ghana, Nepal, and
Mozambique will begin at the onset of the rainy season. New proposed activities in Myanmar have
been postponed indefinitely.
Quantify the Efficiency of Secondary and Micronutrients and Their Delivery Using N-, NP-, and NPK-Based Fertilizers
Laboratory incubation and greenhouse studies were conducted to quantify the availability of Zn
when incorporated/granulated with: (i) monoammonium phosphate (MAP) and elemental S
(MES-10SZ), (ii) ammonium sulfate (AS) and zinc sulfate (AS+ZnSO4), (iii) AS and zinc oxide
(AS+ZnO), (iv) AS+ZnSO4+ZnO, and (v) potassium sulfate and ZnO (SOP+ZnO). The incubation
study was conducted for six weeks, and greenhouse studies were conducted with maize grown for
10 weeks and soybean grown to maturity.
The incubation study showed that, in general, the soil Zn content tended to decline from the time
of application to six weeks after application independent of soil type and product applied
(Figure 14). The choice of products applied – AS+ZnSO4, AS+ZnSO4+ZnO combination, and
MES-10SZ – did not have a significant effect on soil Zn content in the highly acidic Hartsells soil
(pH 4.8). The SOP+ZnO product gave significantly lower soil Zn content than AS+ZnO in samples
taken at two and six weeks after fertilizer application. The effect of Zn products was more evident
in the neutral Greenville soil (pH 6.2) than Hartsells; however, after six weeks of incubation, all
products (including SOP+ZnO) gave similar Zn content in the Greenville soil. The greatest
variation in soil Zn content due to product differences was in the alkaline Sumter soil (pH 7.9).
Overall, the soil Zn content after application of AS+ZnSO4+ZnO products > AS+ZnO >
SOP+ZnO > MES-10SZ. The commercially available MES-10SZ, with 1% Zn as ZnSO4, had the
lowest available soil Zn content in the Sumter soil.
Based on the incubation study, AS+ZnSO4+ZnO products are a more efficient source of available
Zn than MES-10SZ. The study also showed that Zn carrier fertilizers (whether MAP [as in
MES-10SZ], AS [as in AS+ZnSO4+ZnO products], or potassium sulfate [as in SOP+ZnO]) did
influence the availability of Zn, as determined by DTPA extraction.
These results were further confirmed by greenhouse studies on Brownfield soil (pH 6.9). Although
Zn application gave significantly higher dry matter yield after 10 weeks of growth, the differences
between AS+ZnSO4 and MES-10SZ were not significant. With soybean (grown to maturity), grain
was significantly lower with MES-10SZ compared to AS+ZnSO4 and AS+ZnSO4+ZnO.
MES-10SZ also gave significantly lower tissue and grain Zn concentration and Zn uptake for
maize and soybean (Figure 15).
Multi-nutrient granular fertilizers do help smallholder farmers by supplying nutrients for balanced
fertilization and better distribution of micronutrients; however, antagonistic interaction
within/around the granular fertilizer immediately after application may reduce the availability of
essential nutrients.
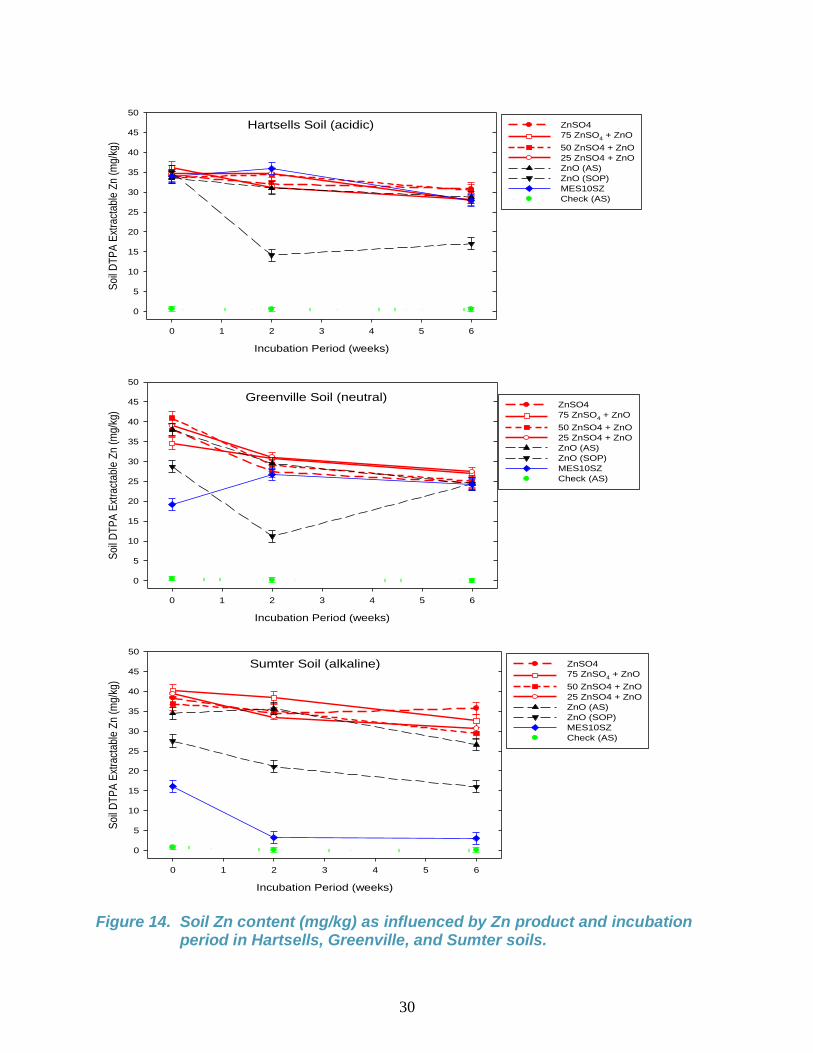
30
Hartsells Soil (acidic)
Incubation Period (weeks)
0 1 2 3 4 5 6
Soi
l DT
PA
Ext
ract
able
Zn
(mg/
kg)
0
5
10
15
20
25
30
35
40
45
50
ZnSO4
75 ZnSO4 + ZnO
50 ZnSO4 + ZnO
25 ZnSO4 + ZnO
ZnO (AS)
ZnO (SOP)
MES10SZ
Check (AS)
Greenville Soil (neutral)
Incubation Period (weeks)
0 1 2 3 4 5 6
Soi
l DT
PA
Ext
ract
able
Zn
(mg/
kg)
0
5
10
15
20
25
30
35
40
45
50
ZnSO4
75 ZnSO4 + ZnO
50 ZnSO4 + ZnO
25 ZnSO4 + ZnO
ZnO (AS)
ZnO (SOP)
MES10SZ
Check (AS)
Sumter Soil (alkaline)
Incubation Period (weeks)
0 1 2 3 4 5 6
Soi
l DT
PA
Ext
ract
able
Zn
(mg/
kg)
0
5
10
15
20
25
30
35
40
45
50
ZnSO4
75 ZnSO4 + ZnO
50 ZnSO4 + ZnO
25 ZnSO4 + ZnO
ZnO (AS)
ZnO (SOP)
MES10SZ
Check (AS)
Figure 14. Soil Zn content (mg/kg) as influenced by Zn product and incubation period in Hartsells, Greenville, and Sumter soils.
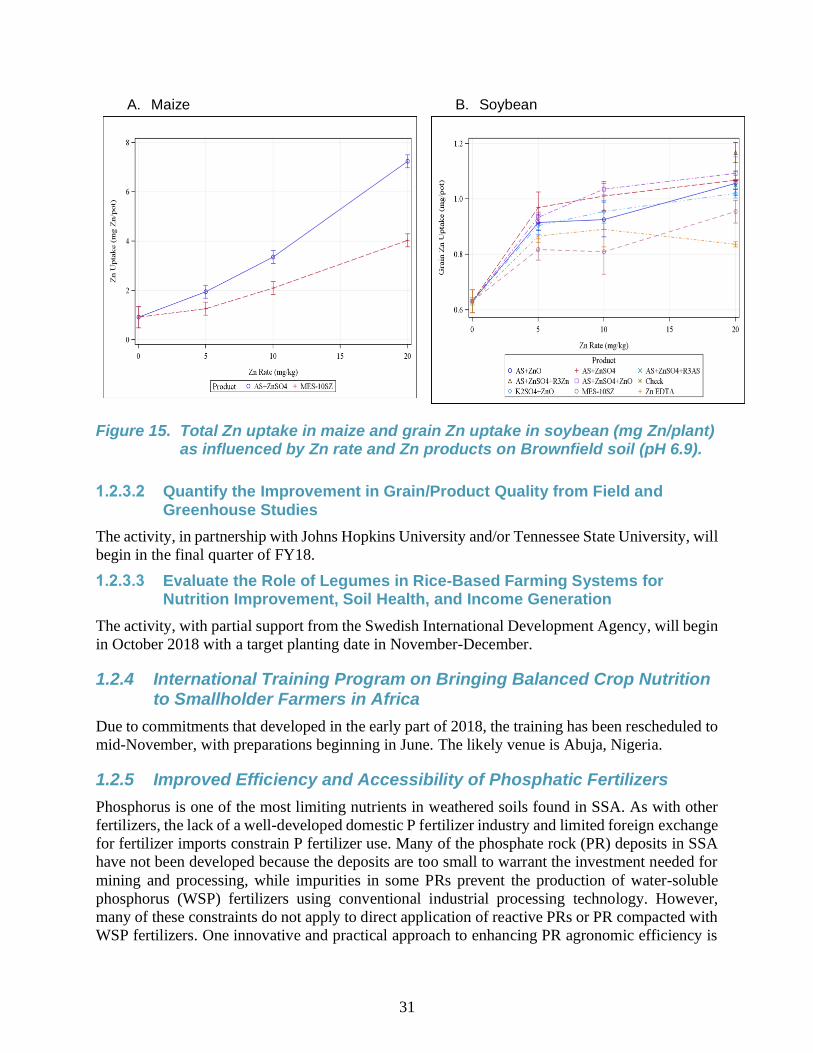
31
A. Maize B. Soybean
Figure 15. Total Zn uptake in maize and grain Zn uptake in soybean (mg Zn/plant) as influenced by Zn rate and Zn products on Brownfield soil (pH 6.9).
Quantify the Improvement in Grain/Product Quality from Field and Greenhouse Studies
The activity, in partnership with Johns Hopkins University and/or Tennessee State University, will
begin in the final quarter of FY18.
Evaluate the Role of Legumes in Rice-Based Farming Systems for Nutrition Improvement, Soil Health, and Income Generation
The activity, with partial support from the Swedish International Development Agency, will begin
in October 2018 with a target planting date in November-December.
1.2.4 International Training Program on Bringing Balanced Crop Nutrition to Smallholder Farmers in Africa
Due to commitments that developed in the early part of 2018, the training has been rescheduled to
mid-November, with preparations beginning in June. The likely venue is Abuja, Nigeria.
1.2.5 Improved Efficiency and Accessibility of Phosphatic Fertilizers
Phosphorus is one of the most limiting nutrients in weathered soils found in SSA. As with other
fertilizers, the lack of a well-developed domestic P fertilizer industry and limited foreign exchange
for fertilizer imports constrain P fertilizer use. Many of the phosphate rock (PR) deposits in SSA
have not been developed because the deposits are too small to warrant the investment needed for
mining and processing, while impurities in some PRs prevent the production of water-soluble
phosphorus (WSP) fertilizers using conventional industrial processing technology. However,
many of these constraints do not apply to direct application of reactive PRs or PR compacted with
WSP fertilizers. One innovative and practical approach to enhancing PR agronomic efficiency is
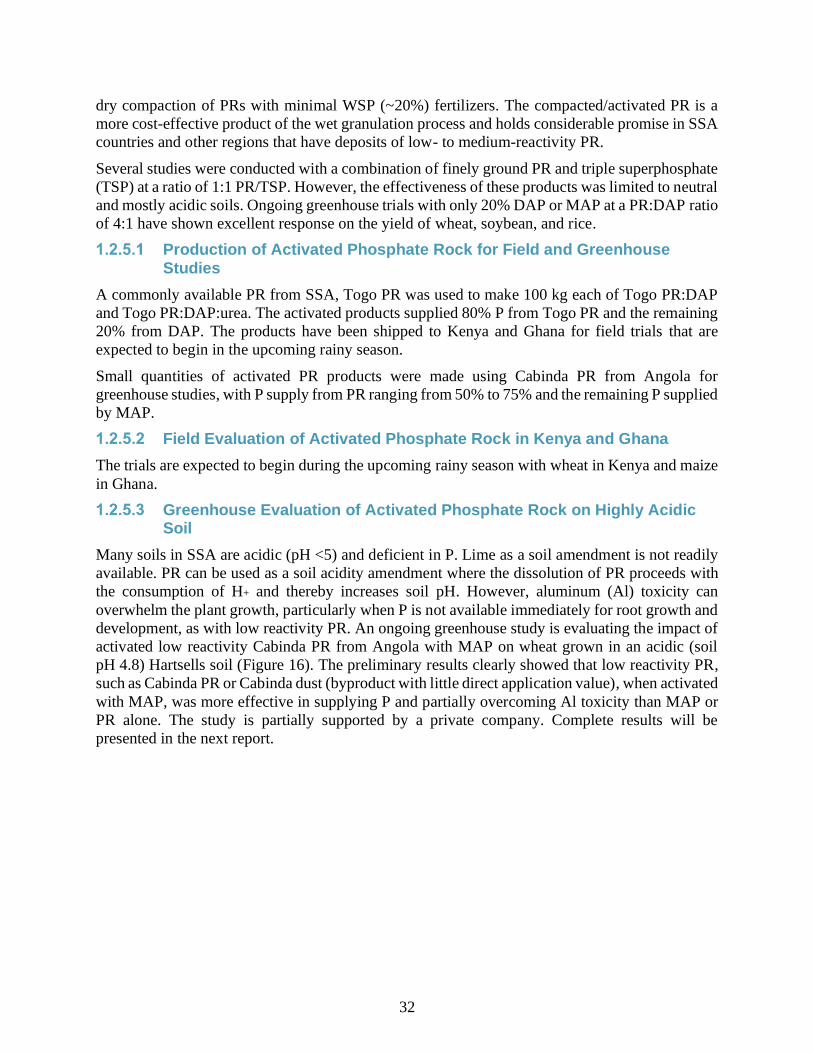
32
dry compaction of PRs with minimal WSP (~20%) fertilizers. The compacted/activated PR is a
more cost-effective product of the wet granulation process and holds considerable promise in SSA
countries and other regions that have deposits of low- to medium-reactivity PR.
Several studies were conducted with a combination of finely ground PR and triple superphosphate
(TSP) at a ratio of 1:1 PR/TSP. However, the effectiveness of these products was limited to neutral
and mostly acidic soils. Ongoing greenhouse trials with only 20% DAP or MAP at a PR:DAP ratio
of 4:1 have shown excellent response on the yield of wheat, soybean, and rice.
Production of Activated Phosphate Rock for Field and Greenhouse Studies
A commonly available PR from SSA, Togo PR was used to make 100 kg each of Togo PR:DAP
and Togo PR:DAP:urea. The activated products supplied 80% P from Togo PR and the remaining
20% from DAP. The products have been shipped to Kenya and Ghana for field trials that are
expected to begin in the upcoming rainy season.
Small quantities of activated PR products were made using Cabinda PR from Angola for
greenhouse studies, with P supply from PR ranging from 50% to 75% and the remaining P supplied
by MAP.
Field Evaluation of Activated Phosphate Rock in Kenya and Ghana
The trials are expected to begin during the upcoming rainy season with wheat in Kenya and maize
in Ghana.
Greenhouse Evaluation of Activated Phosphate Rock on Highly Acidic Soil
Many soils in SSA are acidic (pH <5) and deficient in P. Lime as a soil amendment is not readily
available. PR can be used as a soil acidity amendment where the dissolution of PR proceeds with
the consumption of H+ and thereby increases soil pH. However, aluminum (Al) toxicity can
overwhelm the plant growth, particularly when P is not available immediately for root growth and
development, as with low reactivity PR. An ongoing greenhouse study is evaluating the impact of
activated low reactivity Cabinda PR from Angola with MAP on wheat grown in an acidic (soil
pH 4.8) Hartsells soil (Figure 16). The preliminary results clearly showed that low reactivity PR,
such as Cabinda PR or Cabinda dust (byproduct with little direct application value), when activated
with MAP, was more effective in supplying P and partially overcoming Al toxicity than MAP or
PR alone. The study is partially supported by a private company. Complete results will be
presented in the next report.
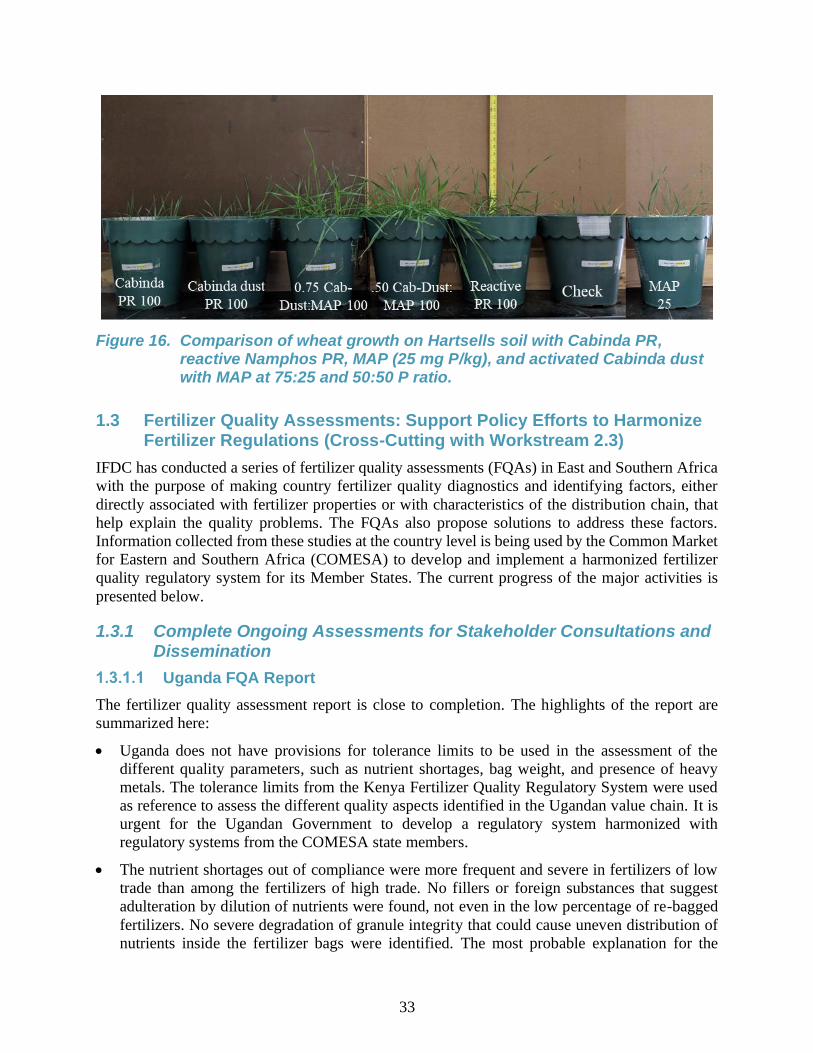
33
Figure 16. Comparison of wheat growth on Hartsells soil with Cabinda PR, reactive Namphos PR, MAP (25 mg P/kg), and activated Cabinda dust with MAP at 75:25 and 50:50 P ratio.
1.3 Fertilizer Quality Assessments: Support Policy Efforts to Harmonize Fertilizer Regulations (Cross-Cutting with Workstream 2.3)
IFDC has conducted a series of fertilizer quality assessments (FQAs) in East and Southern Africa
with the purpose of making country fertilizer quality diagnostics and identifying factors, either
directly associated with fertilizer properties or with characteristics of the distribution chain, that
help explain the quality problems. The FQAs also propose solutions to address these factors.
Information collected from these studies at the country level is being used by the Common Market
for Eastern and Southern Africa (COMESA) to develop and implement a harmonized fertilizer
quality regulatory system for its Member States. The current progress of the major activities is
presented below.
1.3.1 Complete Ongoing Assessments for Stakeholder Consultations and Dissemination
Uganda FQA Report
The fertilizer quality assessment report is close to completion. The highlights of the report are
summarized here:
• Uganda does not have provisions for tolerance limits to be used in the assessment of the
different quality parameters, such as nutrient shortages, bag weight, and presence of heavy
metals. The tolerance limits from the Kenya Fertilizer Quality Regulatory System were used
as reference to assess the different quality aspects identified in the Ugandan value chain. It is
urgent for the Ugandan Government to develop a regulatory system harmonized with
regulatory systems from the COMESA state members.
• The nutrient shortages out of compliance were more frequent and severe in fertilizers of low
trade than among the fertilizers of high trade. No fillers or foreign substances that suggest
adulteration by dilution of nutrients were found, not even in the low percentage of re-bagged
fertilizers. No severe degradation of granule integrity that could cause uneven distribution of
nutrients inside the fertilizer bags were identified. The most probable explanation for the
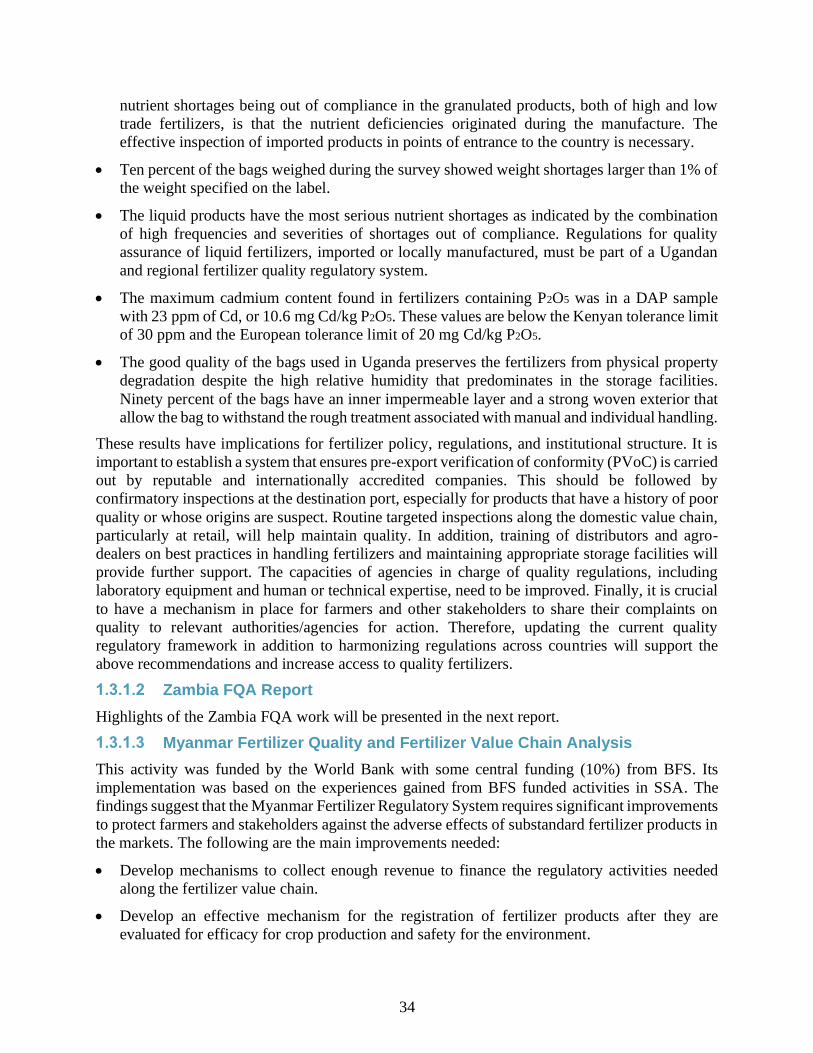
34
nutrient shortages being out of compliance in the granulated products, both of high and low
trade fertilizers, is that the nutrient deficiencies originated during the manufacture. The
effective inspection of imported products in points of entrance to the country is necessary.
• Ten percent of the bags weighed during the survey showed weight shortages larger than 1% of
the weight specified on the label.
• The liquid products have the most serious nutrient shortages as indicated by the combination
of high frequencies and severities of shortages out of compliance. Regulations for quality
assurance of liquid fertilizers, imported or locally manufactured, must be part of a Ugandan
and regional fertilizer quality regulatory system.
• The maximum cadmium content found in fertilizers containing P2O5 was in a DAP sample
with 23 ppm of Cd, or 10.6 mg Cd/kg P2O5. These values are below the Kenyan tolerance limit
of 30 ppm and the European tolerance limit of 20 mg Cd/kg P2O5.
• The good quality of the bags used in Uganda preserves the fertilizers from physical property
degradation despite the high relative humidity that predominates in the storage facilities.
Ninety percent of the bags have an inner impermeable layer and a strong woven exterior that
allow the bag to withstand the rough treatment associated with manual and individual handling.
These results have implications for fertilizer policy, regulations, and institutional structure. It is
important to establish a system that ensures pre-export verification of conformity (PVoC) is carried
out by reputable and internationally accredited companies. This should be followed by
confirmatory inspections at the destination port, especially for products that have a history of poor
quality or whose origins are suspect. Routine targeted inspections along the domestic value chain,
particularly at retail, will help maintain quality. In addition, training of distributors and agro-
dealers on best practices in handling fertilizers and maintaining appropriate storage facilities will
provide further support. The capacities of agencies in charge of quality regulations, including
laboratory equipment and human or technical expertise, need to be improved. Finally, it is crucial
to have a mechanism in place for farmers and other stakeholders to share their complaints on
quality to relevant authorities/agencies for action. Therefore, updating the current quality
regulatory framework in addition to harmonizing regulations across countries will support the
above recommendations and increase access to quality fertilizers.
Zambia FQA Report
Highlights of the Zambia FQA work will be presented in the next report.
Myanmar Fertilizer Quality and Fertilizer Value Chain Analysis
This activity was funded by the World Bank with some central funding (10%) from BFS. Its
implementation was based on the experiences gained from BFS funded activities in SSA. The
findings suggest that the Myanmar Fertilizer Regulatory System requires significant improvements
to protect farmers and stakeholders against the adverse effects of substandard fertilizer products in
the markets. The following are the main improvements needed:
• Develop mechanisms to collect enough revenue to finance the regulatory activities needed
along the fertilizer value chain.
• Develop an effective mechanism for the registration of fertilizer products after they are
evaluated for efficacy for crop production and safety for the environment.
35
• Prepare a body of professional inspectors to identify and quantify the presence of substandard
fertilizers in the markets.
• Equip laboratories and train personnel to analyze large numbers of fertilizer samples during
the implementation of a regulatory system.
The following are the main findings from the FQA:
1. There is an excessive number of fertilizer products in Myanmar; 11 products account for about
50% of the fertilizer trade while 144 products account for the remaining trade share. Many of
the 144 products of low trade are very similar in composition and grade. The highest
frequencies and severities of nutrient shortages happen among the products of low trade. Still,
the 11 products of high trade have nutrient shortages out of compliance that are explained by
deficient manufacture of imported products and serious deficiencies in product registration and
port inspections by the Myanmar Government.
2. Secondary and micronutrient shortages out of compliance were found with high frequencies
and severities across granulated, powder, and liquid fertilizers. Under these conditions, the
fertilizers available in Myanmar are not appropriate to deliver balanced crop nutrition.
3. Twelve percent of the bags were underweight by at least half a kilogram. While this practice
deceives individual farmers in an apparent low quantity, it substantially defrauds society as a
whole, with some manufacturers deriving large profits from this fraud.
4. Evidence of the risks associated with heavy metal contamination in the fertilizers has been
found. This risk is higher in fertilizers with a high organic component, especially if they are
imported from China. The regulators should be attentive to the heavy metal contamination that
can occur both in organic fertilizers and in fertilizers manufactured with phosphate rock.
In addition to the improvements listed above, capacity building of agro-input dealers, extension
staff, and NGOs involved in agriculture is critical for improving the quality of fertilizers and other
agri-chemicals and for educating farmers on good agricultural practices, such as ISFM and
balanced nutrition.
1.3.2 Training Program on Improving Fertilizer Quality for Highly Productive Agriculture and Balanced Nutrition
The international training program on improving fertilizer quality for highly productive agriculture
and balanced nutrition is planned for May 7-11, 2018, in Arusha, Tanzania. The training program
will include the complete process for fertilizer quality and value chain analyses and a synthesis of
results from multiple locations (Kenya, Myanmar, Uganda, and Zambia). Training preparation is
in progress with 47 participants already registered.
A manuscript containing a summary of IFDC fertilizer quality assessments and achievements in
Africa and Asia is in preparation. The manuscript will be submitted to a scientific journal.
36
Figure 17. Observing the bag weight controls in a granulation plant in Myanmar.
1.4 Agronomic and Socioeconomic Database Management and Decision Support Systems – Cross-Cutting with Workstream 2
Over the years, IFDC has lost expertise in database management and programming. In partnership
with the University of Florida, IFDC will utilize a database platform developed for the global
Agricultural Model Intercomparison and Improvement Project (AgMIP). The partnership with the
University of Florida will also be used to improve the existing soil dynamics model in the Decision
Support System for Agrotechnology Transfer (DSSAT) program using the soils and agronomic
data generated by IFDC over the past years. The geospatial addition to the DSSAT software,
GSSAT, was originally developed by IFDC and will be refined and validated using spatial soil
data from Ghana and Burkina Faso. The database and decision support tools will help in making
timely and reliable recommendations on fertilizers, sowing dates, and other management inputs
covering a wide range biophysical and socioeconomic conditions. This activity will continue upon
availability of funds.
37
2. Workstream 2 – Supporting Policy Reform Processes, Advocacy, and
Market Development
Under Workstream 2, IFDC conducts research and analysis for evidence-based policies and to
support reform initiatives for market development focused on accelerating agricultural growth
through the use of improved technologies, particularly fertilizers and complementary inputs. All
the activities under this workstream are implemented through partnerships with different
stakeholders with similar interests, namely, in promoting policies and reforms aimed at improving
fertilizer access, availability and use among small holders in the FTF focus countries, under varied
political, social, economic, and environmental conditions. IFDC being the ‘go to institution for
soil and fertilizer technologies, policies and advocacy’, most of the activities and associated
outcomes are identified by IFDC scientists and economists for further exploration in partnership
with leading stakeholder institutions (academic, research, policy think tanks, public and private
firms) to present evidence-based research studies for further scaling up and dissemination.
The costs associated with BFS to fund the activities under this workstream are shared either on
cost or kind basis from the partnering institutions to achieve the maximum outreach and impact in
the following three major areas of focus. The three broad categories related to soil technologies
and fertilizer management taken up under this workstream include:
a. Support developing and implementation of fertilizer / soil related policies, reforms and
regulations;
b. Assessing impacts of soil and fertilizer related technologies, policies and market
interventions to improve access and use by farmers; and
c. Conducting studies to show the economic and financial feasibility of soil/fertilizer related
technologies, fertilizer access and market systems (incl. fertilizer demand and supply and
associated margins)
Together with Workstream 1 and other field-based IFDC operations, these studies add to IFDC’s
knowledge management system, contributing to databases that provide useful information to draw
lessons learned and identify gaps for further action or research. The data and output from these
efforts provide a strong foundation for IFDC to join and participate in partnerships with other
research and policy institutions in areas of mutual interest, including policy dialogue with decision-
makers and other stakeholders in various countries.
2.1 Document Policy Reforms and Market Development
The work on policy processes is to support efforts that provide the necessary impetus to catalyze
reforms to existing policies in these countries to create an environment that encourages private
sector investments that will result in increased access to input markets by smallholder farm
households. With BFS support, IFDC worked with organizations and stakeholders at various levels
in countries that showed high potential for policy change to: (i) support the reform processes,
utilizing evidence-based approaches, and (ii) build the capacity of stakeholders toward effective
implementation of reforms. Details are provided below.
38
2.1.1 Support for Kenya Fertilizer Roundtable Meeting and Policy Reform Processes
During the last quarter of 2017, the Kenya Ministry of Agriculture, Livestock and Fisheries
(MoALF), in collaboration with IFDC, commenced the planning of a Kenya roundtable fertilizer
(Ke-Fert) stakeholder workshop. The objective of the roundtable workshop was to review the
major constraints to farmer access and use of fertilizers and soil amendments (particularly lime)
and reach consensus on the need to address these challenges through the formation of a multi-
disciplinary Kenya Fertilizer Platform. The fertilizer platform is a public-private mechanism
composed of key stakeholders involved in fertilizer access, quality, and use, whose purpose is to
resolve issues and facilitate dialogue, coordination, and information exchange. The intended
fertilizer platform is to facilitate policy actions around key fertilizer issues through multi-
stakeholder dialogues and public-private task force consultations periodically to influence
fertilizer policies in Kenya. The above objective is in line with the 2016 signed memorandum of
understanding (MOU) between the MoALF and IFDC in which the two parties agreed on:
• Developing increased agricultural productivity through introduction of appropriate
technologies toward increased productivity.
• Developing innovative and economically sound interventions in agribusiness approaches.
• Developing the fertilizer sector.
• Integrating soil fertility management interventions.
In addition to a working MOU, a more formalized Kenya-Fertilizer Workshop has been planned
in Nairobi in May-June 2018, for which preparatory work has been undertaken. Meetings have
been held across private and public stakeholders from the fertilizer sector through several formal
and informal consultations by IFDC and MoALF officials, explaining the motive behind the
workshop. In turn, stakeholders responded by forming a steering committee to spearhead the
process at the higher level, with elected representatives, and exclusively put together a sub-
committee for actual planning of the proposed workshop. The sub-committee responsible for the
workshop is in constant contact with other members of the steering committee, who have
completed the task of developing a concept note and outlining the objectives and intended
outcomes from such a workshop. Following the concept note, a memorandum was drafted and has
been presented to the Permanent Secretary (PS) of MoALF, stating the intention of the workshop
and requesting him to invite the President of Kenya as the guest of honor; currently, the steering
committee is waiting for feedback from the PS. IFDC also engaged a consultant to spearhead the
process of finalizing the agenda of the workshop and budget, in addition to holding consultative
meetings with partners to operationalize both the Ke-Fert and Fertilizer platform.
Ongoing/pending activities include the following:
• Finalizing the date of the workshop and the plenary speaker, once the PS has confirmed the
availability of the guest of honor. The Ke-Fert workshop is expected to take place in the second
half of 2018.
• Inviting speakers/stakeholders. The participants will be invited once all the logistics
preparation is finalized.
• Finalizing the budget and other logistics; a meeting with the partners has been scheduled to
discuss budget and have partners commit to it.
39
Expected outcomes: The outcome of the Ke-Fert workshop will be the formation of the Fertilizer
Platform. The fertilizer roundtable will be used to develop priorities for the fertilizer sector leading
to an action plan for the Fertilizer Platform. More than 200 stakeholders from the public and private
sectors will provide input and the roundtable is expected to become an annual event, as it was in
previous years.
2.1.2 Capacity-Building Activities: Policy Reforms
USAID BFS Agriculture Core Course: Policy, Governance, and Standards – Agriculture Input Policy Analysis
At the request of BFS policy advisors in Washington, D.C., and in partnership with the Rutgers
University FTF Policy Research Consortium, a presentation was given on the importance and
impact of agricultural input policies during the USAID BFS-sponsored agriculture core course for
staff from inter- and intra-agencies involved in U.S. Government international development
activities. The training covered the importance of agro-input policies for seeds, fertilizers,
pesticides, and agricultural machinery and discussed key impacts of input policy reforms on the
respective sectors for better food security and improved incomes and welfare among smallholder
farmers in specific countries. The training session content was prepared in collaboration with the
BFS policy team and the Rutgers consortium.
The training was conducted as a participatory discussion on December 13, 2017, in Washington,
D.C. The input policy session was attended by nine experienced development staff members
posted in missions abroad and in the United States by the U.S. Government. A PowerPoint
presentation along with a set of discussion questions were provided to the participants during the
training program.
Developing Private Sector Agro-Input Markets: Lessons Learned and Emerging Perspectives on Subsidy Programs
At the request of Uganda’s Ministry of Agriculture, Animal Industry and Fisheries, IFDC provided
technical support by building the capacity of ministry staff and other stakeholders on aspects of
the design and implementation of subsidy programs. IFDC invited expert speakers to share lessons
learned and best practices from the latest research findings and recommendations from various
research and assessments.
The five-day workshop was held on February 19-23 in Jinja, Uganda, on “Developing Private-
Sector Agro-Input Markets: Lessons Learned and Emerging Perspectives in Subsidy Programs.”
More than 50 participants (primarily from the ministry and some donors and private sector
representatives) were made aware of case studies from several SSA countries, the strengths and
weaknesses of subsidy programs, and options for improving them to become “smart” subsidy
programs. The workshop incorporated a one-day session on the importance of an enabling
environment for private sector investment. This session was conducted jointly by a team from
AFAP, IFDC, Michigan State University, New Markets Lab, and the Regional Network of
Agricultural Policy Research Institutes (ReNAPRI).
The participants visited Uganda's only fertilizer blender, GrainPulse Ltd, in Mukono, and the
adjacent Savannah Commodities to learn more about how the private sector is addressing fertilizer
needs in the region. The company is manufacturing blended fertilizers that are targeted to specific
crop needs and soil nutrient requirements with the objective of improving farmers’ yields.
40
Based on the workshop evaluation feedback, the participants indicated they had gained more
knowledge, made networking connections, and acquired better skills to help them in their jobs as
a result of their participation in the workshop. More details regarding the program can be found at
https://ifdc.org/developing-private-sector-agro-input-markets-designing-and-implementing-
targeted-subsidy-programs/.
2.1.3 Documenting Fertilizer Trends and Outlook: Code of Conduct for Fertilizer Management
As part of the initial global consultation on the Code of Conduct for Fertilizer Management
(CoCoFe), IFDC contributed toward the scope of the CoCoFe. The key issues are presented here.
IFDC believes the judicious use of fertilizer calls for a holistic approach, starting with good quality
fertilizer products with reduced contaminants, which greatly depends on the source of nutrients,
beneficiation of mined feedstock, and the production process. When supplied with good quality
products and knowledge on their proper application, farmers can judiciously use fertilizer to
produce sufficient, quality, nutritious, and safe food for a fast-growing population while addressing
environmental concerns and human health hazards. With a finite amount of resources – land, fertile
soil, and fresh water – and in the context of climate change, additional factors to consider for
promoting the appropriate use of fertilizer are:
1. Increased investment for revamping agronomic and soil research for resilient agriculture, for
innovating on nutrient cycling in the context of a circular economy, and for developing the
next generation of fertilizer products with lower contaminants, greater efficiency, and balanced
nutrients; congruent with advances in crop genetics, cropping technologies, and soil
conditions.
2. A better policy, legal, and regulatory framework to guarantee the best quality fertilizer
products, their distribution and rational use.
3. The revamping of extension services for better technical assistance and training to encourage
responsible fertilizer recommendations by the supply chain stakeholders and fertilizer use by
farmers.
In the context of developing the CoCoFe, IFDC suggests establishing clearer goals with fewer
objectives to simplify its elaboration and facilitate its mainstreaming among stakeholders. The
following objectives were suggested, which embrace the CoCoFe stated goals:
1. Increase food production by boosting yields to close the yield gap in developing countries and
to supply the increasing global need of more, nutritious, and safer food.
2. Optimize the efficient use of (organic and inorganic) nutrients to maximize benefits of better
natural resource conservation (land, soil, and water) and effectively promote sustainable
agriculture production systems.
3. Minimize nutrient losses and the accumulation in the soil and in vegetative materials of
contaminants and trace elements present in inorganic fertilizer and organic nutrient sources.
Considering the effects of climate change on agriculture, IFDC suggested a fourth objective:
4. Support the adaptation of crops to imminent environmental changes for more resilient
agriculture production systems, considering balanced nutrient fertilizer products, nutrient
recycling, and carbon sequestration.
41
In the context of optimizing the efficient use of inorganic and organic nutrient sources, considering
the nature of organic materials – which comprises multiple sources with erratic nutrient content
depending on the source – makes it difficult to standardize them and therefore regulate them. On
the contrary, the standard physical and chemical characteristics of inorganic nutrient
sources/fertilizer facilitate their regulation. Still, it is crucial to regulate organic materials
(biosolids, compost, etc.) for contaminants and hazardous chemicals (heavy metals, pathogens,
toxic organics etc.) – including pesticides. To that end, IFDC suggests developing a subset within
the CoCoFe, clearly addressing the recycling of organic materials to be used as a source of
nutrients for food crops.
In addition, recognizing that organic materials can be a valuable source of nutrients, in the
traditional intensive production systems, they should be seen as soil amendments to improve soil
structure and increase microbial activity, water retention, and cation exchange, among others, all
of which facilitate the absorption of nutrients by the plant root; and second, as a source of nutrient
supply to the soil and the plants. Nutrient supply from organic materials can be considered a
positive externality in the context of a circular economy; therefore, organic materials should be
supplementary to inorganic sources, not the main source of nutrients. The exception can be purely
organic agricultural systems in which organic materials can be both soil amendments and the main
source of nutrients. To improve nutrient use efficiency and to help achieve the stated
environmental and perhaps human hazards objectives, the CoCoFe should also address the use of
bio-stimulants, nitrification inhibitors, urease inhibitors, etc.
Furthermore, although IFDC recognizes the importance of policy and regulations for the
responsible use of fertilizer, it is also important to recognize the regulatory burden of the CoCoFe
implementation and the impact on the cost of supplying and using fertilizer. This has greater
implications for developing countries, such as in SSA, considering that fertilizer production in
these countries is almost non-existent, and its use is low to negligible, especially among small-
scale agricultural producers, due in part to fertilizers’ relatively high retail price resulting from
high transaction costs along the international and domestic supply chains. Therefore, the resulting
regulatory burden could hinder the efforts of international donors and government programs to
reduce the cost of fertilizer at retail. Economic analyses may be needed to weigh the impact from
the potential burden introduced by the CoCoFe as opposed to the impact of a lax regulatory system
that will make countries vulnerable to questionable nutrient content in organic products and to
hazardous contaminants and non-nutritious trace elements in inorganic fertilizers and organic
products.
2.1.4 Partnership for Enabling Market Environments for Fertilizer in Africa
IFDC, as part of the Partnership for Enabling Market Environments for Fertilizer in Africa
(PEMEFA), a Michigan State University (MSU)-led consortium of five organizations,2 met on
February 19-23 in Jinja, Uganda, to:
1. Present a draft synthesis report on the status of SSA enabling environment, which also
identified existing gaps for further research.
2. Initiate activity on writing a proposal for funding the group’s activities going forward.
2 MSU, AFAP, ReNAPRI, New Markets Lab, and IFDC.
42
This synthesis report provides a brief summary of the existing policy and regulatory systems in
SSA and identifies gaps that the group will provide information/recommendations to policymakers
after successfully soliciting for funding. PEMEFA also has been conducting a lecture series to
build consensus and get other organizations involved to build on synergies. A seminar was held
on April 5, 2018 at MSU, East Lansing, Michigan, on “Agricultural Policy and Regulation in Sub-
Saharan Africa: Lessons for Increasing Investment’. This meeting had 25 people in attendance
including professors from the agricultural economics and other departments, graduate students,
and staff from the Feed The Future Innovation Lab For Food Security Policy. Three presentations
were made by PEMEFA principal investigators from IFDC, MSU, and NML. Another meeting is
scheduled for April 17, 2018 (Georgetown University, Washington, D.C.) on “Understanding the
Enabling Environment: How Laws, Regulations, and Government Programs Support Trade and
Agricultural Development”. Staff from the World Bank, International Food Policy Research
Institute (IFPRI), and other relevant institutions will be invited.
2.1.5 Review of Input Subsidy Program Design in SSA
IFDC has been involved in collaborative policy and market research on fertilizer issues with other
organizations, such as MSU, AFAP, and the Alliance for a Green Revolution in Africa (AGRA).
From an assessment of various reports or studies, experiences and lessons learned from subsidy
programs in SSA, IFDC and MSU reviewed these works to generate suitable policy
recommendations. A peer-reviewed journal article (“Taking Stock of Africa’s Second-Generation
Agricultural Input Subsidy Programs [ISPs]”) based on evidence of the impact of input subsidy
programs with regard to targeting beneficiaries and private sector involvement in SSA has been
accepted for publication in Food Policy and is expected to be published by mid-2018. The article
provides the most comprehensive review of recent evidence to date regarding the performance of
these second-generation ISPs, synthesizing nearly 70 ISP-related studies from seven countries
(Ghana, Nigeria, Kenya, Tanzania, Malawi, Zambia, and Ethiopia). The review specifically
evaluated ISPs’ impacts on total fertilizer use, food production, commercial input distribution
systems, food prices, wages, and poverty. Measures enabling ISPs to more cost-effectively achieve
their objectives were also considered.
The key findings indicate that ISPs can quickly raise national food production, and that receiving
subsidized inputs raises beneficiary households’ grain yields and production levels at least in the
short-term. However, the overall production and welfare effects of subsidy programs tend to be
less than expected. Two characteristics of program implementation consistently mitigate the
intended effects of ISPs: (1) subsidy programs partially crowd out commercial fertilizer demand
due to difficulties associated with targeting and sale of inputs by program implementers, and
(2) lower than expected crop yield response to fertilizer on smallholder-managed fields is often
experienced. If these challenges could be addressed, ISPs could more effectively mitigate the
concurrent challenges of rapid population growth and climate-induced stresses in SSA.
2.1.6 Policy Briefs on Fertilizer Policies and Market Development
IFDC’s engagement in the fertilizer and input policy reform processes, particularly interventions
or policies that have had significant impact on poverty and food security, will be captured and
documented as short policy briefs, either through the IFDC team or through engagement with
partners in Africa, Asia, and Latin America and the Caribbean (LAC), for wider dissemination.
43
Since 2015, policy briefs focusing on fertilizer market development through private sector
participation were initiated (Ghana, Uganda, and Mali).
For the final reporting in FY18, IFDC anticipates one or two policy briefs to be generated through
our partnership with several organizations in these countries.
2.2 Impact Assessment Studies
To support policy reforms for the development of input markets and value chains, IFDC conducts
impact assessment studies not only to provide feedback on the performance of policy changes and
supporting programs but also to provide lessons learned for future policy reforms and
implementation. During FY18, this sub-activity will include research activities on (a) assessing
the impact of Kenya’s fertilizer subsidy program and (b) assessing the effectiveness and impact of
agro-dealer development/input supplier networks toward improved access to and use of
technologies among farmers and effects of market interventions in Rwanda.
2.2.1 Impact Assessment Study on the Kenya Fertilizer Subsidy Program
It is estimated that nearly 30-40% of the fertilizer consumed by Kenyan farmers is facilitated
through the input subsidy programs; by the end of the 2016 long rainy season, the Kenyan subsidy
program had distributed 928,430 mt at an estimated cost of Kshs. 24.7 billion or an average annual
budget of Kshs. 3.1 billion (approximately U.S. $310 million). However, no comprehensive study
has been undertaken evaluating the effectiveness of such subsidy program, detailing the costs of
implementing such enormous initiatives, the benefits accrued, and the gains to smallholder farmers
and the national economy. To get insights in these issues, Kenya’s MoALF requested IFDC’s
support in carrying out an impact assessment of fertilizer subsidy program in the country. The
purpose of such impact study is to re-evaluate the program and redesign the subsidy model to
maximize impact by focusing on specific farmer needs. This was followed by several consultation
meetings between IFDC and MoALF since October 2017. During this process, IFDC also decided
to bring in Tegemeo Institute to support MoALF in conducting this assessment. Tegemeo Institute
is a policy research institute under the division of research and extension of Egerton University. It
was therefore agreed that the impact study will be carried out as a consortium of three institutions,
namely IFDC, Tegemeo Institute, and MoALF, with a well-established approach developed by
IFDC in consultation with the partner institutions.
The approach consists of the following elements:
1. Developing a concept note – in this context an initial concept note of ideas was developed by
the MoALF officials and was shared with IFDC and Tegemeo for further review, refinement,
and implementation. The MoALF wanted such an assessment to ensure scientific validity with
experience drawn from global best practices on fertilizer subsidies for effective policy
evidence and recommendations.
2. Followed by the initial concept note, IFDC and Tegemeo engaged in reviewing the ideas
proposed by MOALF and prepared a detailed concept note based on an extensive literature
review of the fertilizer subsidy programs in Kenya, SSA, and elsewhere.
3. IFDC, Tegemeo Institute, and ministry officials also are having discussions on the research
tools to be used, guidance on qualitative and quantitative data collection, and geographical
coverage of the study.
44
4. The terms of reference (ToR)/scope of work (SoW) draft was finalized in March 2018 after
extensive consultations among the partners on various details of the SoW, including
implementation, timeline, budget, and methodological approach toward final implementation
of surveys in Kenya for the proposed study.
5. The TOR/SOW will be shared with MoALF for further feedback and way forward.
This activity was jointly conducted with IFDC staff in East and Southern Africa.
2.2.2 Effectiveness of Agro-Dealer Development Programs Toward Sustainable Input Supply and Technology Transfer in Sub-Saharan African Countries
The assessments focus on determinants of sustainability of input suppliers in general and their
impact on input market development in selected countries in SSA. The analysis seeks to identify
the attributes of successful agro-dealers; the existing input market policies and their effect on these
supplier networks; and the role of input financing in building efficient networks.
During FY18, it was proposed to continue the field-level impact assessment of the Rwanda Agro-
Dealer Development (RADD) programs implemented in two phases, during 2010-13 and 2014-16.
This activity will be initiated with the Agribusiness-Focused Partnership Organization
(AGRIFOP), a local Rwandan community service organization involved in capacity building of
agro-dealer programs in Rwanda, and AGRA, who are engaged actively toward implementing
agro-dealer development programs in Rwanda and elsewhere in Africa. The following progress
was made during the first half of FY18.
In November 2017, consultations were initiated with Mr. Jean Bosco Safari, head of AGRIFOP,
to seek his assistance in implementing the agro-dealer assessment study through his organization.
Further, in this context, IFDC has been in discussions with AGRA’s Nairobi office to seek their
partnership and collaboration in conducting such study, which can mutually benefit IFDC and
AGRA. Detailed discussions were held during January 2018 with Mr. Fred Muhuku, Agro-Dealer
Programs Specialist at AGRA, through IFDC’s East and Southern Africa regional office in
Nairobi, to request AGRA’s assistance in enabling logistics in Rwanda and data documentation
(baseline and endline survey data from previous programs in Rwanda). AGRA has agreed in
principle to share any relevant information regarding agro-dealer programs in Rwanda for this
proposed study.
During the second half of FY18, IFDC plans to finalize the ToR for the proposed assessment with
AGRA and AGRIFOP and initiate activities, such as sampling and survey details, to implement
the research study in Rwanda.
2.3 Economic and Market Studies
IFDC’s economic studies provide useful information for public and private decision-making and
identify policy-relevant areas for intervention to streamline the flow of fertilizers at reduced prices
for smallholder farmers. The economic studies include evaluation of various soil fertility-
enhancing technologies in terms of economic returns and efficiency for small farm adoption and
also financial returns to various actors in the value chain; conducting stakeholder analyses and
assessment of cost buildups and market margins to identify value chain constraints; and market
analysis of the supply and demand of fertilizers. IFDC’s FY18 work in this sub-activity involves
the following key areas; (a) documenting data on fertilizer cost buildups and market margins
45
across different countries in SSA; (b) identifying select indicators of fertilizer use and access in
SSA; (c) supporting policy efforts to harmonize fertilizer quality regulations, based on evidence-
based scientific analysis; and (d) initiating a series of micro-economic research studies related to
fertilizer technology use, markets, value chains, and environmental implications in partnership
with land-grant universities, such as MSU, Rutgers, and the University of Georgia.
2.3.1 Fertilizer Quality Assessments (FQA): Support Policy Efforts to Harmonize Fertilizer Regulations (with Workstream 1)
This activity was conducted jointly with Workstream 1. The FQA draft report for Uganda is being
shared with the Ugandan Ministry of Agriculture, Animal Industry and Fisheries. The final report
for the Myanmar FQA was submitted to the World Bank. In addition to the FQA report, a training
manual on building the capacity of stakeholders in Myanmar was developed based on weaknesses
that were identified from the survey.
A workshop to disseminate findings of the report on “Myanmar Fertilizer Quality, Regulatory
System, and Value Chain Analysis” is scheduled for April 30 in Nay Pyi Taw, Myanmar. The
workshop participants are from the Myanmar Government and the private sector as well as
representatives of the World Bank, USAID, and other international donors operating in Myanmar.
An additional workshop will be conducted during May 2-4, 2018 in Yangon, consisting mostly
ministry staff, with the objective of building their capacity in the following areas:
• Improvements of the Myanmar fertilizer quality regulatory system.
• Identification of factors from the value chain that affect fertilizer quality.
• Scientific methodology for fertilizer quality assessment along the value chain.
2.3.2 Fertilizer Cost Buildup Studies and Marketing Margin Analysis
Literature on agro-input markets in SSA shows low consumption of fertilizer is partly due to high
transaction costs of supply, which limit its access, especially to resource-poor farmers. Though
there is information available on the physical and other structural constraints that contribute to
high transaction costs along the fertilizer supply chain, little is known about the current cost
structure of supplying fertilizers in SSA. Considering that similar studies have been implemented
in the past, tracking changes in the supply cost structure over time will help trace the impact of
policy reforms affecting the fertilizer sector and provide lessons learned for other countries to
adopt. The objectives of this activity are: (a) to assess the cost of supplying fertilizer from
procurement and importation to distribution to farmers in selected SSA countries; (b) to identify
issues and constraints that are contributing to higher transaction costs; and (c) to envision
recommendations that could lead to additional policy changes and the implementation of programs
and investments.
West Africa Fertilizer Supply Cost Buildup Consolidated Report
Advances are being made to assemble a consolidated report for the West African region, based on
country-specific fertilizer supply cost buildup assessments implemented between 2015 and 2016.
The report also will make an inter-temporal analysis of the changes in the cost of supplying
fertilizer, taking into consideration work done by IFDC since 2006 with Chemonics, later in 2009
with IFPRI, and more recently in 2015-16 under BFS funding.
46
Preliminary results indicate that fertilizer prices in the international markets have been declining,
reflected in the reduction in cost of importation (Table 11). However, domestic supply cost has
increased, especially at wholesale and retail, perhaps reflecting the increase in the cost of bagging
and storage, domestic transportation, and financing, and to a minor extent, due to increases in port
charges and overhead and margins. Differences in the increases or reductions in cost structure
between countries are greatly influenced by how fertilizer subsidies are being implemented and
whether the country is landlocked.
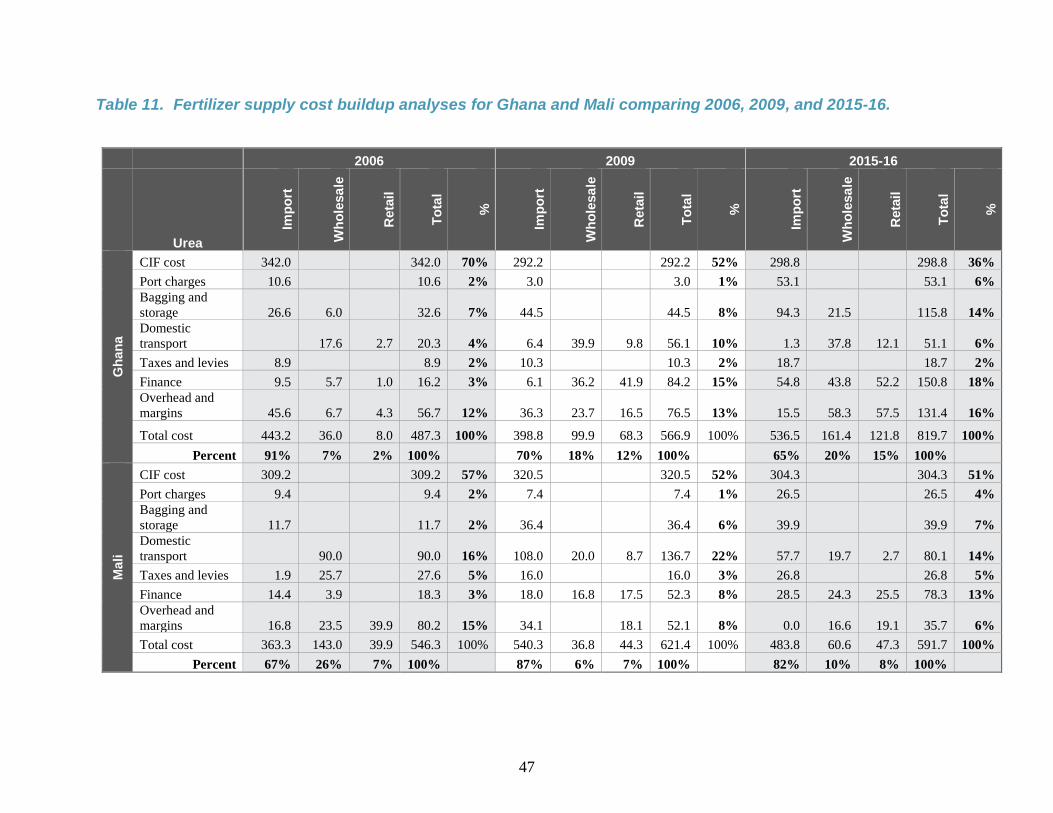
47
Table 11. Fertilizer supply cost buildup analyses for Ghana and Mali comparing 2006, 2009, and 2015-16.
2006 2009 2015-16
Urea
Imp
ort
Wh
ole
sa
le
Reta
il
To
tal
%
Imp
ort
Wh
ole
sa
le
Reta
il
To
tal
%
Imp
ort
Wh
ole
sa
le
Reta
il
To
tal
%
Gh
an
a
CIF cost 342.0 342.0 70% 292.2 292.2 52% 298.8 298.8 36%
Port charges 10.6 10.6 2% 3.0 3.0 1% 53.1 53.1 6%
Bagging and
storage 26.6 6.0 32.6 7% 44.5 44.5 8% 94.3 21.5 115.8 14%
Domestic
transport 17.6 2.7 20.3 4% 6.4 39.9 9.8 56.1 10% 1.3 37.8 12.1 51.1 6%
Taxes and levies 8.9 8.9 2% 10.3 10.3 2% 18.7 18.7 2%
Finance 9.5 5.7 1.0 16.2 3% 6.1 36.2 41.9 84.2 15% 54.8 43.8 52.2 150.8 18%
Overhead and
margins 45.6 6.7 4.3 56.7 12% 36.3 23.7 16.5 76.5 13% 15.5 58.3 57.5 131.4 16%
Total cost 443.2 36.0 8.0 487.3 100% 398.8 99.9 68.3 566.9 100% 536.5 161.4 121.8 819.7 100%
Percent 91% 7% 2% 100% 70% 18% 12% 100% 65% 20% 15% 100%
Mali
CIF cost 309.2 309.2 57% 320.5 320.5 52% 304.3 304.3 51%
Port charges 9.4 9.4 2% 7.4 7.4 1% 26.5 26.5 4%
Bagging and
storage 11.7 11.7 2% 36.4 36.4 6% 39.9 39.9 7%
Domestic
transport 90.0 90.0 16% 108.0 20.0 8.7 136.7 22% 57.7 19.7 2.7 80.1 14%
Taxes and levies 1.9 25.7 27.6 5% 16.0 16.0 3% 26.8 26.8 5%
Finance 14.4 3.9 18.3 3% 18.0 16.8 17.5 52.3 8% 28.5 24.3 25.5 78.3 13%
Overhead and
margins 16.8 23.5 39.9 80.2 15% 34.1 18.1 52.1 8% 0.0 16.6 19.1 35.7 6%
Total cost 363.3 143.0 39.9 546.3 100% 540.3 36.8 44.3 621.4 100% 483.8 60.6 47.3 591.7 100%
Percent 67% 26% 7% 100% 87% 6% 7% 100% 82% 10% 8% 100%
48
2.3.3 The African Fertilizer Access Index
The key objective of The African Fertilizer Access Index (TAFAI) is to promote the creation and
maintenance of an enabling environment for competitive fertilizer systems serving smallholder
farmers. The proposed TAFAI will be a consolidated measure of various factors (policy, market,
research, and development) that influence and are responsible for creating an enabling
environment. The activity will take advantage of the presence of partner organizations, such as
AFAP, the International Fertilizer Association (IFA), and other private and public sector
organizations in East and West Africa, for the purposes of data documentation and consultations.
No activities were conducted during this reporting period.
2.3.4 Economic and Environmental Implications of Fertilizer Technologies Using Life Cycle Analysis Approach
Under Workstream 1 and in collaboration with the completed USAID-funded Accelerating
Agriculture Productivity Improvement (AAPI) project, an ongoing activity was conducted to
document GHG emissions from UDP use along with different agronomic and crop management
practices in paddy rice in Bangladesh. The results from the ongoing GHG mitigation research have
shown that nitrous oxide (N2O) and nitric oxide (NO) Life Cycle Inventory (LCI) emissions from
fertilizers can be controlled via application strategy to levels associated with unfertilized plots.
Thus, the quantification and reduction of GHG emissions associated with management practices
in rice fields in Bangladesh may provide opportunities for farmers and policymakers to gain carbon
credits. This work will complement the agronomic work carried out on the quantification of GHG
emissions by the life cycle analysis (LCA) approach in quantification of energy equivalents (in
turn, carbon credits and associated monetary terms) consumed across different types of fertilization
in a paddy-rice system in Bangladesh.
For the purpose of the research study, a graduate student will use the data generated on GHG
emissions under a rice-paddy system through greenhouse experiments in Muscle Shoals and in
Bangladesh. In addition, the student also will utilize the economic data (primarily costing aspects)
from urea briquette production and urea briquette uses (cost of cultivation) for calculating the
economic and energy equivalents of different formulations of urea production and urea in the entire
value chain to estimate the GHG emissions through the entire rice production process.
The following progress has been made toward implementing this activity: (i) a graduate-level
student (Mr. Ming Zhe) from Rutgers University has been selected to carry out this research study
as a part of his thesis requirement; (ii) a ToR has been developed with Rutgers for the proposed
research collaboration; (iii) the graduate student has already initiated a detailed literature review
on LCA approaches and is finalizing the approach for the present study; and (iv) a final detailed
proposal along with methods and preliminary analysis will be provided near the end of FY18.
2.3.5 Economic Estimation of Fertilization Methods for Rice Paddy in Bangladesh – A Production Function Analysis
Data on the adoption and uptake of UDP by farmer households in Bangladesh have been
documented by IFDC projects implemented in Bangladesh, with funding from USAID and
Walmart over the last seven years. UDP technology has been adopted by rice paddy farmers and
vegetable growers in Bangladesh, along with other crop management practices and fertilization
49
methods (broadcasting, alternate wetting and drying, seed varieties, etc.). This research will utilize
the existing data available from IFDC surveys on fertilizer adoption/use in Bangladesh to
understand both technical efficiency of the uptake and sustenance of technology use by
smallholders in adopting the UDP method of fertilizer application.
The following progress has been made during the first half of FY18: (i) a graduate student from
Rutgers University (Ms. Selen Atilok) has been identified to undertake this as a part of her
dissertation research and a ToR between Rutgers and IFDC is being finalized with SoW and budget
details; (ii) the graduate student has already completed an extensive review of literature for the
proposed study; (iii) a graduate thesis committee with representatives from Rutgers and IFDC has
been further identified and is in the process of finalizing the research plan for the student; the first
meeting was held March 8, 2018, with Rutgers Faculty; (iv) data sets from IFDC’s Bangladesh
office have been obtained to facilitate the research work of the student; it has been further proposed
that the student will work with data sets from the AAPI project, a USAID-funded project from
2011 to 2016, for the conduct of the survey, utilizing the household farm-level information
collected through the project during the baseline, mid, and final term of the project for the
econometric investigations; and (v) the graduate student is expected to complete her preliminary
analysis of the data and report toward the end of September 2018 for submission.
2.3.6 Enhancing the M&E Capacities of Soil Fertility Research Projects in IFDC
(Crosscutting all BFS-funded activities)
Professor Kay Kelsey from the University of Georgia (UGA) has been advising IFDC toward the
design and establishment of exclusive monitoring, evaluation, learning, and sharing (MELS)
systems within IFDC. In this regard, IFDC has an MOU with UGA to obtain Kelsey’s advisory
services for MELS conceptualization, capacity building services, and the design of evaluation tools
and techniques for the program.
Under BFS, IFDC proposes to build the internal capacity of the field operations staff on MELS.
An IFDC M&E specialist from Togo has been identified to enroll for a PhD program at UGA from
Fall 2018 onward, to specialize in M&E approaches, gaining comprehensive knowledge on various
evaluation tools and techniques to be applied in IFDC field operations upon training.
2.3.7 Encouraging Agribusiness Development in Sub-Saharan Africa: Fertilizer Value Chains and Policy Implications
In efforts to collaborate with universities, discussions have been initiated with faculty of MSU’s
Department of Agricultural, Food, and Resource Economics to conduct an economic research
study on fertilizer-related issues using empirical and other data, applying scientific methods to
generate policy-relevant briefs and reports that can be used for agricultural reforms and advocacy.
The proposed research aims to collate available evidence on the performance of fertilizer input
markets and value chains in SSA, identify challenges and gaps, and provide policy
recommendations.
A number of Skype meetings were held with MSU to agree on topics and develop a scope of work.
An in-person meeting was held on April 5 during a PEMEFA meeting at MSU (see Activity 2.1.4).
The specifics of the joint effort and further development of ToRs were discussed with two
professors and a graduate student. The idea is to utilize MSU analytical capacity to strengthen
50
outputs, and therefore the partnership will harness the synergies between the two programs. Further
discussions and development of TOR is on-going.
2.3.8 Improving Fertilizer Use, Access, and Market Development
Honduras
In early 2017, IFDC, in coordination with Honduras Outreach Inc. (HOI), a private NGO based in
Georgia, undertook an outreach activity with the overall goal to help develop public-private
partnerships and expand business outside IFDC’s current regions of influence. Critical issues
facing the Honduran agriculture sector that IFDC could address based on its institutional
experiences were identified. HOI, in collaboration with the Government of Honduras, is in the
process of establishing a research and demonstration farm on irrigation systems in the Agalta
Valley, Honduras.
In February 2018, IFDC and HOI personnel and collaborators met at the University of Georgia
Strickland Irrigation Research Station (SIRS) to: (i) observe Strickland’s research activities,
including irrigation and soil and crop fertility management; (ii) explore the possibility of forming
a three-institution consortium (HOI, IFDC, UGA/SIRS); and (iii) seek funding opportunities for
collaborative work in Honduras.
Guatemala
As initial steps toward implementing programs in Guatemala, a training program on fertilizer
technologies and quality assurance is in the planning stages. This will be a joint effort between
IFDC and a fertilizer industry partner in Guatemala. A meeting in May 2018 is scheduled at IFDC
to develop the training program and other potential collaboration in FTF recipient countries in
Central America.
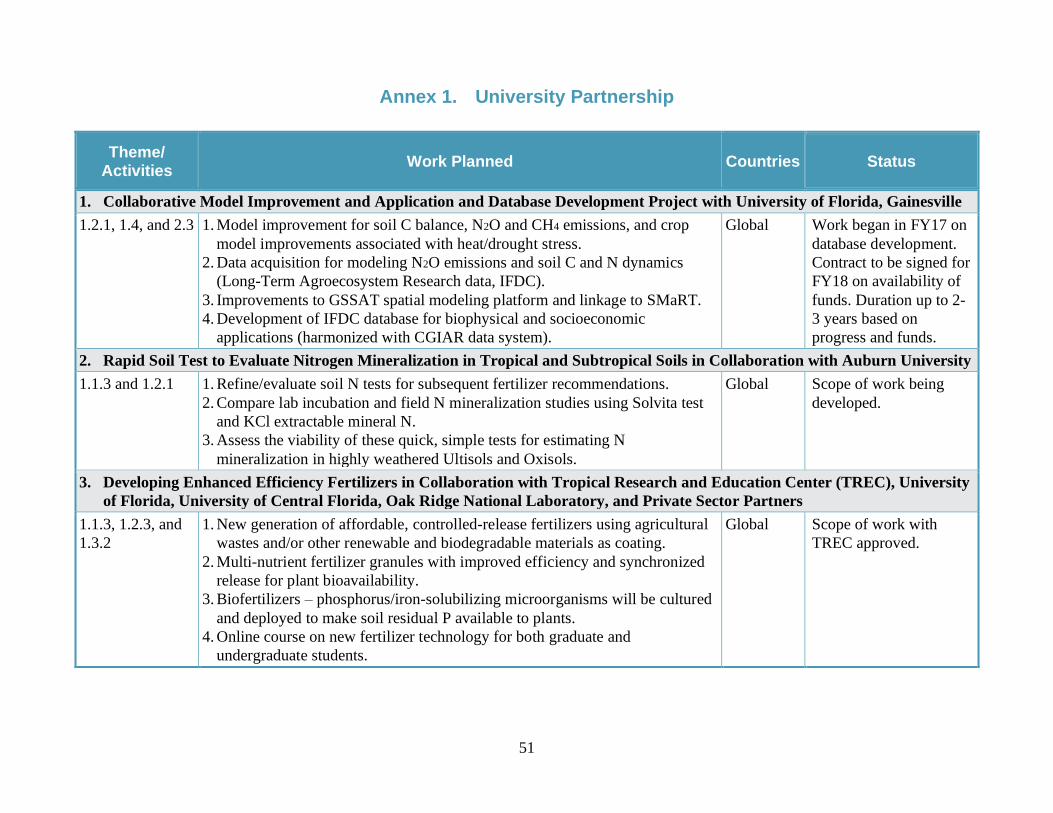
51
Annex 1. University Partnership
Theme/ Activities
Work Planned Countries Status
1. Collaborative Model Improvement and Application and Database Development Project with University of Florida, Gainesville
1.2.1, 1.4, and 2.3 1. Model improvement for soil C balance, N2O and CH4 emissions, and crop
model improvements associated with heat/drought stress.
2. Data acquisition for modeling N2O emissions and soil C and N dynamics
(Long-Term Agroecosystem Research data, IFDC).
3. Improvements to GSSAT spatial modeling platform and linkage to SMaRT.
4. Development of IFDC database for biophysical and socioeconomic
applications (harmonized with CGIAR data system).
Global Work began in FY17 on
database development.
Contract to be signed for
FY18 on availability of
funds. Duration up to 2-
3 years based on
progress and funds.
2. Rapid Soil Test to Evaluate Nitrogen Mineralization in Tropical and Subtropical Soils in Collaboration with Auburn University
1.1.3 and 1.2.1 1. Refine/evaluate soil N tests for subsequent fertilizer recommendations.
2. Compare lab incubation and field N mineralization studies using Solvita test
and KCl extractable mineral N.
3. Assess the viability of these quick, simple tests for estimating N
mineralization in highly weathered Ultisols and Oxisols.
Global Scope of work being
developed.
3. Developing Enhanced Efficiency Fertilizers in Collaboration with Tropical Research and Education Center (TREC), University
of Florida, University of Central Florida, Oak Ridge National Laboratory, and Private Sector Partners
1.1.3, 1.2.3, and
1.3.2
1. New generation of affordable, controlled-release fertilizers using agricultural
wastes and/or other renewable and biodegradable materials as coating.
2. Multi-nutrient fertilizer granules with improved efficiency and synchronized
release for plant bioavailability.
3. Biofertilizers – phosphorus/iron-solubilizing microorganisms will be cultured
and deployed to make soil residual P available to plants.
4. Online course on new fertilizer technology for both graduate and
undergraduate students.
Global Scope of work with
TREC approved.
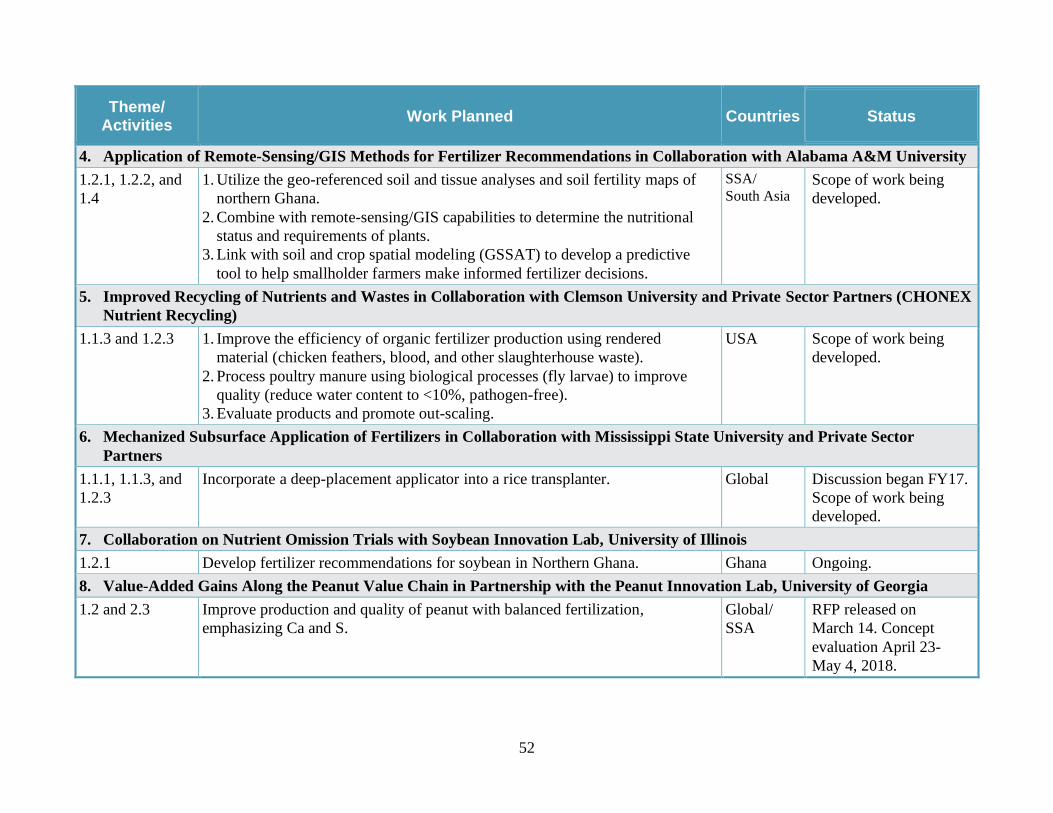
52
Theme/ Activities
Work Planned Countries Status
4. Application of Remote-Sensing/GIS Methods for Fertilizer Recommendations in Collaboration with Alabama A&M University
1.2.1, 1.2.2, and
1.4
1. Utilize the geo-referenced soil and tissue analyses and soil fertility maps of
northern Ghana.
2. Combine with remote-sensing/GIS capabilities to determine the nutritional
status and requirements of plants.
3. Link with soil and crop spatial modeling (GSSAT) to develop a predictive
tool to help smallholder farmers make informed fertilizer decisions.
SSA/
South Asia Scope of work being
developed.
5. Improved Recycling of Nutrients and Wastes in Collaboration with Clemson University and Private Sector Partners (CHONEX
Nutrient Recycling)
1.1.3 and 1.2.3 1. Improve the efficiency of organic fertilizer production using rendered
material (chicken feathers, blood, and other slaughterhouse waste).
2. Process poultry manure using biological processes (fly larvae) to improve
quality (reduce water content to <10%, pathogen-free).
3. Evaluate products and promote out-scaling.
USA Scope of work being
developed.
6. Mechanized Subsurface Application of Fertilizers in Collaboration with Mississippi State University and Private Sector
Partners
1.1.1, 1.1.3, and
1.2.3
Incorporate a deep-placement applicator into a rice transplanter. Global Discussion began FY17.
Scope of work being
developed.
7. Collaboration on Nutrient Omission Trials with Soybean Innovation Lab, University of Illinois
1.2.1 Develop fertilizer recommendations for soybean in Northern Ghana. Ghana Ongoing.
8. Value-Added Gains Along the Peanut Value Chain in Partnership with the Peanut Innovation Lab, University of Georgia
1.2 and 2.3 Improve production and quality of peanut with balanced fertilization,
emphasizing Ca and S.
Global/
SSA
RFP released on
March 14. Concept
evaluation April 23-
May 4, 2018.
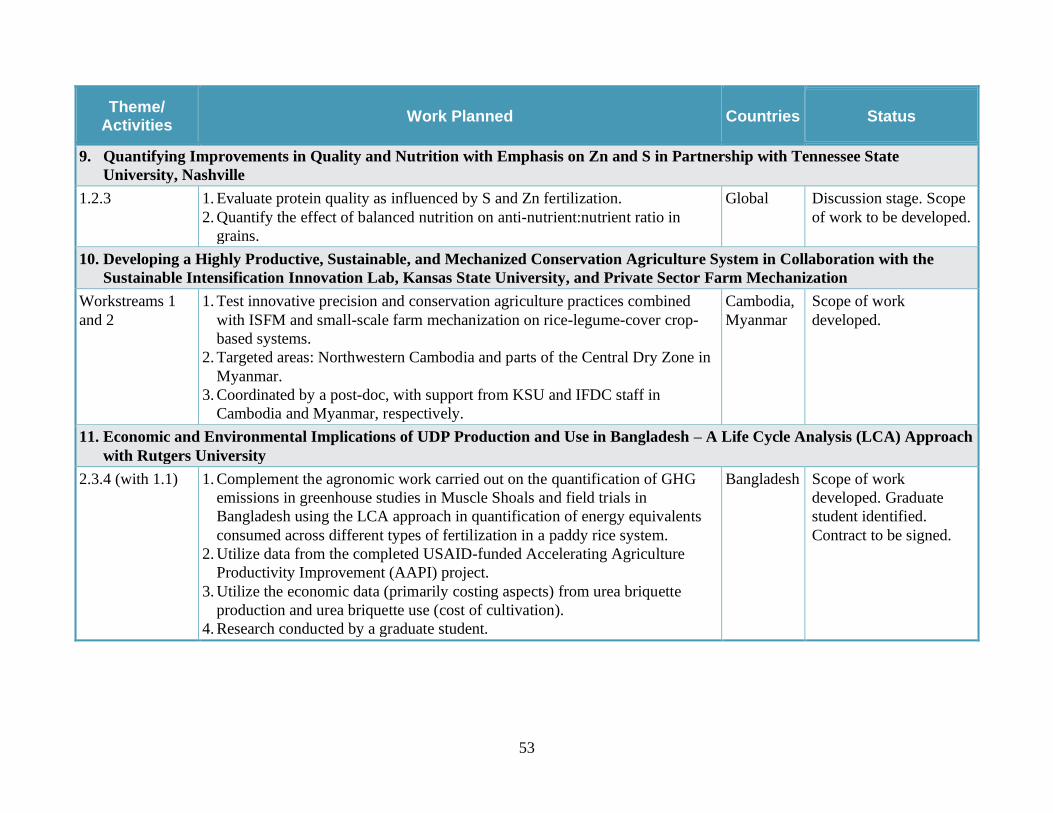
53
Theme/ Activities
Work Planned Countries Status
9. Quantifying Improvements in Quality and Nutrition with Emphasis on Zn and S in Partnership with Tennessee State
University, Nashville
1.2.3 1. Evaluate protein quality as influenced by S and Zn fertilization.
2. Quantify the effect of balanced nutrition on anti-nutrient:nutrient ratio in
grains.
Global Discussion stage. Scope
of work to be developed.
10. Developing a Highly Productive, Sustainable, and Mechanized Conservation Agriculture System in Collaboration with the
Sustainable Intensification Innovation Lab, Kansas State University, and Private Sector Farm Mechanization
Workstreams 1
and 2
1. Test innovative precision and conservation agriculture practices combined
with ISFM and small-scale farm mechanization on rice-legume-cover crop-
based systems.
2. Targeted areas: Northwestern Cambodia and parts of the Central Dry Zone in
Myanmar.
3. Coordinated by a post-doc, with support from KSU and IFDC staff in
Cambodia and Myanmar, respectively.
Cambodia,
Myanmar
Scope of work
developed.
11. Economic and Environmental Implications of UDP Production and Use in Bangladesh – A Life Cycle Analysis (LCA) Approach
with Rutgers University
2.3.4 (with 1.1) 1. Complement the agronomic work carried out on the quantification of GHG
emissions in greenhouse studies in Muscle Shoals and field trials in
Bangladesh using the LCA approach in quantification of energy equivalents
consumed across different types of fertilization in a paddy rice system.
2. Utilize data from the completed USAID-funded Accelerating Agriculture
Productivity Improvement (AAPI) project.
3. Utilize the economic data (primarily costing aspects) from urea briquette
production and urea briquette use (cost of cultivation).
4. Research conducted by a graduate student.
Bangladesh Scope of work
developed. Graduate
student identified.
Contract to be signed.
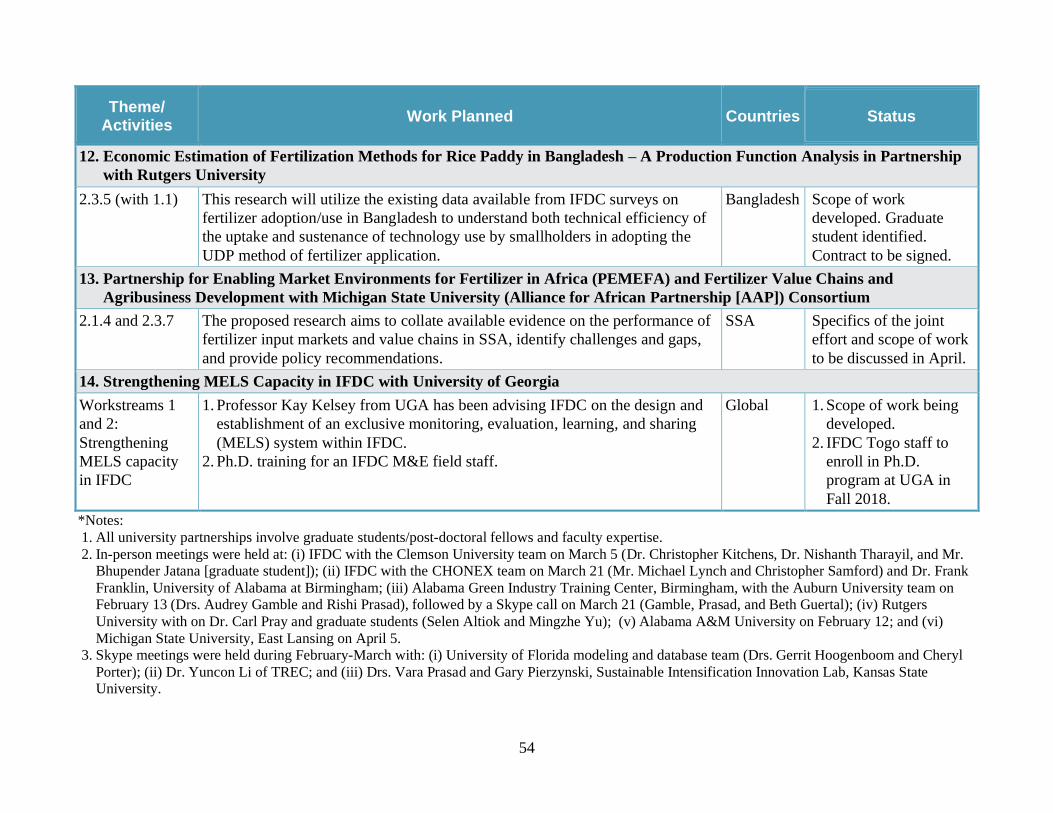
54
Theme/ Activities
Work Planned Countries Status
12. Economic Estimation of Fertilization Methods for Rice Paddy in Bangladesh – A Production Function Analysis in Partnership
with Rutgers University
2.3.5 (with 1.1) This research will utilize the existing data available from IFDC surveys on
fertilizer adoption/use in Bangladesh to understand both technical efficiency of
the uptake and sustenance of technology use by smallholders in adopting the
UDP method of fertilizer application.
Bangladesh Scope of work
developed. Graduate
student identified.
Contract to be signed.
13. Partnership for Enabling Market Environments for Fertilizer in Africa (PEMEFA) and Fertilizer Value Chains and
Agribusiness Development with Michigan State University (Alliance for African Partnership [AAP]) Consortium
2.1.4 and 2.3.7 The proposed research aims to collate available evidence on the performance of
fertilizer input markets and value chains in SSA, identify challenges and gaps,
and provide policy recommendations.
SSA Specifics of the joint
effort and scope of work
to be discussed in April.
14. Strengthening MELS Capacity in IFDC with University of Georgia
Workstreams 1
and 2:
Strengthening
MELS capacity
in IFDC
1. Professor Kay Kelsey from UGA has been advising IFDC on the design and
establishment of an exclusive monitoring, evaluation, learning, and sharing
(MELS) system within IFDC.
2. Ph.D. training for an IFDC M&E field staff.
Global 1. Scope of work being
developed.
2. IFDC Togo staff to
enroll in Ph.D.
program at UGA in
Fall 2018.
*Notes:
1. All university partnerships involve graduate students/post-doctoral fellows and faculty expertise.
2. In-person meetings were held at: (i) IFDC with the Clemson University team on March 5 (Dr. Christopher Kitchens, Dr. Nishanth Tharayil, and Mr.
Bhupender Jatana [graduate student]); (ii) IFDC with the CHONEX team on March 21 (Mr. Michael Lynch and Christopher Samford) and Dr. Frank
Franklin, University of Alabama at Birmingham; (iii) Alabama Green Industry Training Center, Birmingham, with the Auburn University team on
February 13 (Drs. Audrey Gamble and Rishi Prasad), followed by a Skype call on March 21 (Gamble, Prasad, and Beth Guertal); (iv) Rutgers
University with on Dr. Carl Pray and graduate students (Selen Altiok and Mingzhe Yu); (v) Alabama A&M University on February 12; and (vi)
Michigan State University, East Lansing on April 5.
3. Skype meetings were held during February-March with: (i) University of Florida modeling and database team (Drs. Gerrit Hoogenboom and Cheryl
Porter); (ii) Dr. Yuncon Li of TREC; and (iii) Drs. Vara Prasad and Gary Pierzynski, Sustainable Intensification Innovation Lab, Kansas State
University.
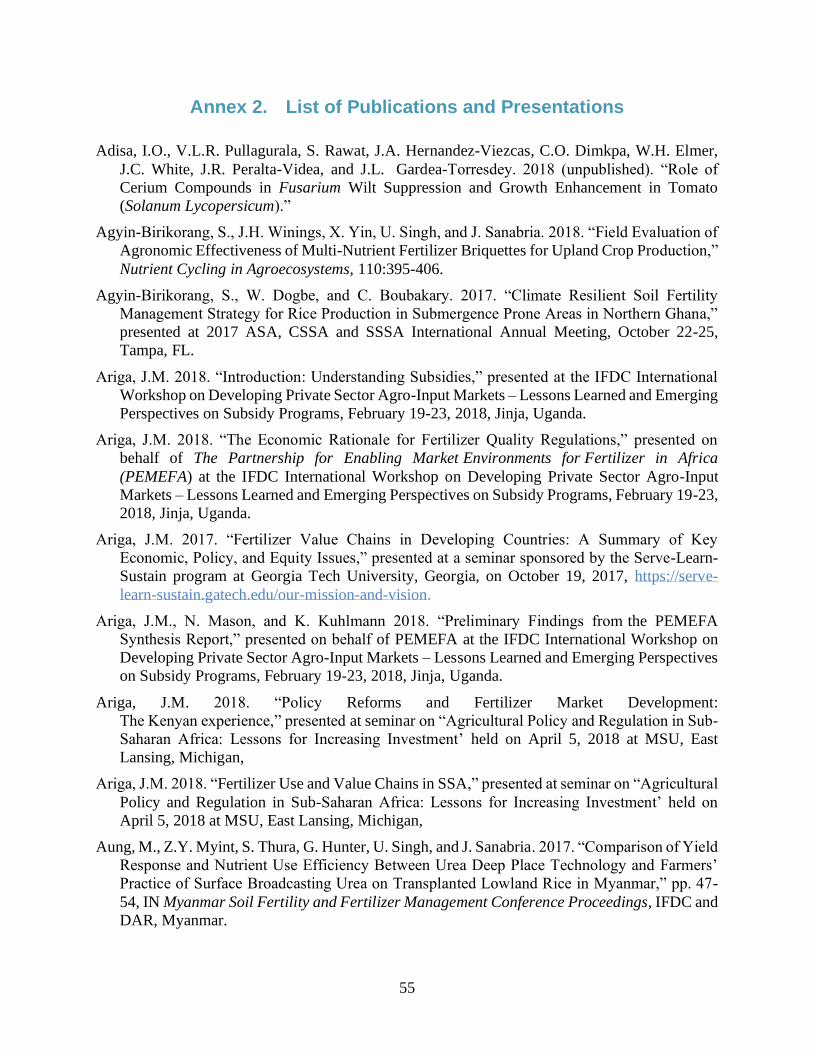
55
Annex 2. List of Publications and Presentations
Adisa, I.O., V.L.R. Pullagurala, S. Rawat, J.A. Hernandez-Viezcas, C.O. Dimkpa, W.H. Elmer,
J.C. White, J.R. Peralta-Videa, and J.L. Gardea-Torresdey. 2018 (unpublished). “Role of
Cerium Compounds in Fusarium Wilt Suppression and Growth Enhancement in Tomato
(Solanum Lycopersicum).”
Agyin-Birikorang, S., J.H. Winings, X. Yin, U. Singh, and J. Sanabria. 2018. “Field Evaluation of
Agronomic Effectiveness of Multi-Nutrient Fertilizer Briquettes for Upland Crop Production,”
Nutrient Cycling in Agroecosystems, 110:395-406.
Agyin-Birikorang, S., W. Dogbe, and C. Boubakary. 2017. “Climate Resilient Soil Fertility
Management Strategy for Rice Production in Submergence Prone Areas in Northern Ghana,”
presented at 2017 ASA, CSSA and SSSA International Annual Meeting, October 22-25,
Tampa, FL.
Ariga, J.M. 2018. “Introduction: Understanding Subsidies,” presented at the IFDC International
Workshop on Developing Private Sector Agro-Input Markets – Lessons Learned and Emerging
Perspectives on Subsidy Programs, February 19-23, 2018, Jinja, Uganda.
Ariga, J.M. 2018. “The Economic Rationale for Fertilizer Quality Regulations,” presented on
behalf of The Partnership for Enabling Market Environments for Fertilizer in Africa
(PEMEFA) at the IFDC International Workshop on Developing Private Sector Agro-Input
Markets – Lessons Learned and Emerging Perspectives on Subsidy Programs, February 19-23,
2018, Jinja, Uganda.
Ariga, J.M. 2017. “Fertilizer Value Chains in Developing Countries: A Summary of Key
Economic, Policy, and Equity Issues,” presented at a seminar sponsored by the Serve-Learn-
Sustain program at Georgia Tech University, Georgia, on October 19, 2017, https://serve-
learn-sustain.gatech.edu/our-mission-and-vision.
Ariga, J.M., N. Mason, and K. Kuhlmann 2018. “Preliminary Findings from the PEMEFA
Synthesis Report,” presented on behalf of PEMEFA at the IFDC International Workshop on
Developing Private Sector Agro-Input Markets – Lessons Learned and Emerging Perspectives
on Subsidy Programs, February 19-23, 2018, Jinja, Uganda.
Ariga, J.M. 2018. “Policy Reforms and Fertilizer Market Development:
The Kenyan experience,” presented at seminar on “Agricultural Policy and Regulation in Sub-
Saharan Africa: Lessons for Increasing Investment’ held on April 5, 2018 at MSU, East
Lansing, Michigan,
Ariga, J.M. 2018. “Fertilizer Use and Value Chains in SSA,” presented at seminar on “Agricultural
Policy and Regulation in Sub-Saharan Africa: Lessons for Increasing Investment’ held on
April 5, 2018 at MSU, East Lansing, Michigan,
Aung, M., Z.Y. Myint, S. Thura, G. Hunter, U. Singh, and J. Sanabria. 2017. “Comparison of Yield
Response and Nutrient Use Efficiency Between Urea Deep Place Technology and Farmers’
Practice of Surface Broadcasting Urea on Transplanted Lowland Rice in Myanmar,” pp. 47-
54, IN Myanmar Soil Fertility and Fertilizer Management Conference Proceedings, IFDC and
DAR, Myanmar.
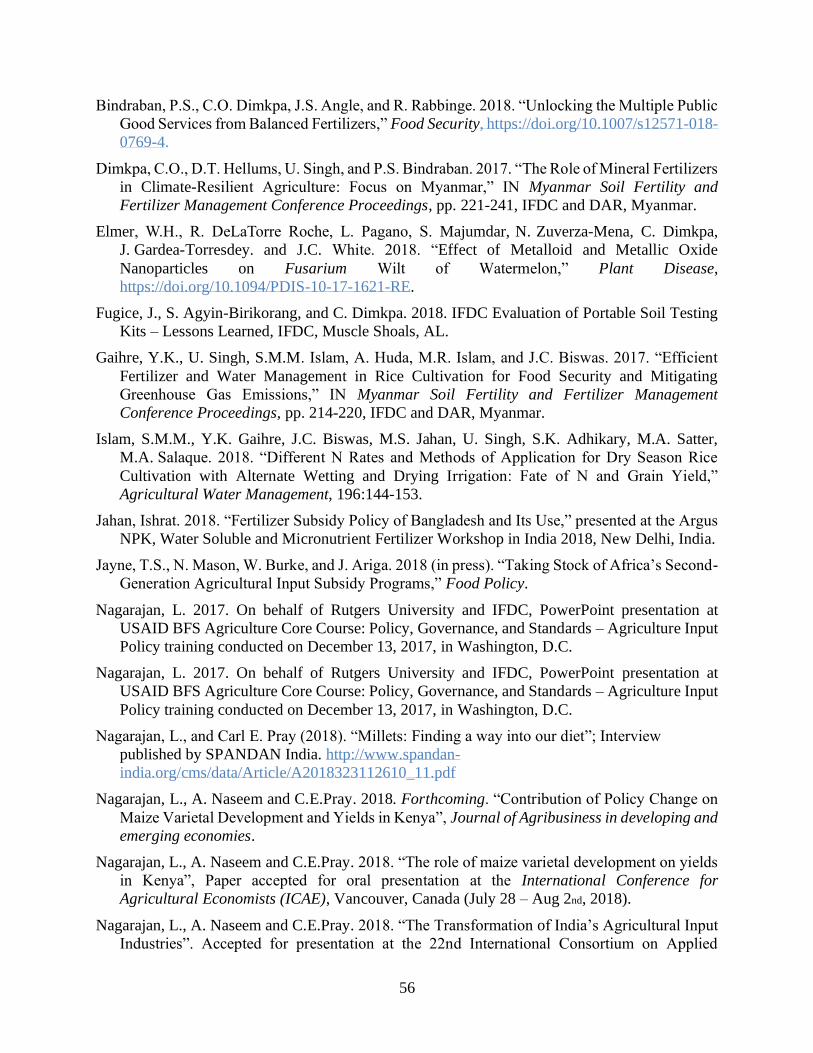
56
Bindraban, P.S., C.O. Dimkpa, J.S. Angle, and R. Rabbinge. 2018. “Unlocking the Multiple Public
Good Services from Balanced Fertilizers,” Food Security, https://doi.org/10.1007/s12571-018-
0769-4.
Dimkpa, C.O., D.T. Hellums, U. Singh, and P.S. Bindraban. 2017. “The Role of Mineral Fertilizers
in Climate-Resilient Agriculture: Focus on Myanmar,” IN Myanmar Soil Fertility and
Fertilizer Management Conference Proceedings, pp. 221-241, IFDC and DAR, Myanmar.
Elmer, W.H., R. DeLaTorre Roche, L. Pagano, S. Majumdar, N. Zuverza-Mena, C. Dimkpa,
J. Gardea-Torresdey. and J.C. White. 2018. “Effect of Metalloid and Metallic Oxide
Nanoparticles on Fusarium Wilt of Watermelon,” Plant Disease,
https://doi.org/10.1094/PDIS-10-17-1621-RE.
Fugice, J., S. Agyin-Birikorang, and C. Dimkpa. 2018. IFDC Evaluation of Portable Soil Testing
Kits – Lessons Learned, IFDC, Muscle Shoals, AL.
Gaihre, Y.K., U. Singh, S.M.M. Islam, A. Huda, M.R. Islam, and J.C. Biswas. 2017. “Efficient
Fertilizer and Water Management in Rice Cultivation for Food Security and Mitigating
Greenhouse Gas Emissions,” IN Myanmar Soil Fertility and Fertilizer Management
Conference Proceedings, pp. 214-220, IFDC and DAR, Myanmar.
Islam, S.M.M., Y.K. Gaihre, J.C. Biswas, M.S. Jahan, U. Singh, S.K. Adhikary, M.A. Satter,
M.A. Salaque. 2018. “Different N Rates and Methods of Application for Dry Season Rice
Cultivation with Alternate Wetting and Drying Irrigation: Fate of N and Grain Yield,”
Agricultural Water Management, 196:144-153.
Jahan, Ishrat. 2018. “Fertilizer Subsidy Policy of Bangladesh and Its Use,” presented at the Argus
NPK, Water Soluble and Micronutrient Fertilizer Workshop in India 2018, New Delhi, India.
Jayne, T.S., N. Mason, W. Burke, and J. Ariga. 2018 (in press). “Taking Stock of Africa’s Second-
Generation Agricultural Input Subsidy Programs,” Food Policy.
Nagarajan, L. 2017. On behalf of Rutgers University and IFDC, PowerPoint presentation at
USAID BFS Agriculture Core Course: Policy, Governance, and Standards – Agriculture Input
Policy training conducted on December 13, 2017, in Washington, D.C.
Nagarajan, L. 2017. On behalf of Rutgers University and IFDC, PowerPoint presentation at
USAID BFS Agriculture Core Course: Policy, Governance, and Standards – Agriculture Input
Policy training conducted on December 13, 2017, in Washington, D.C.
Nagarajan, L., and Carl E. Pray (2018). “Millets: Finding a way into our diet”; Interview
published by SPANDAN India. http://www.spandan-
india.org/cms/data/Article/A2018323112610_11.pdf
Nagarajan, L., A. Naseem and C.E.Pray. 2018. Forthcoming. “Contribution of Policy Change on
Maize Varietal Development and Yields in Kenya”, Journal of Agribusiness in developing and
emerging economies.
Nagarajan, L., A. Naseem and C.E.Pray. 2018. “The role of maize varietal development on yields
in Kenya”, Paper accepted for oral presentation at the International Conference for
Agricultural Economists (ICAE), Vancouver, Canada (July 28 – Aug 2nd, 2018).
Nagarajan, L., A. Naseem and C.E.Pray. 2018. “The Transformation of India’s Agricultural Input
Industries”. Accepted for presentation at the 22nd International Consortium on Applied
57
Bioeconomy Research (ICABR) Conference "Disruptive Innovations, Value Chains, and Rural
Development" World Bank, Washington DC (June 12-15, 2018).
Rietra, R.P., J.J., M. Heinen, C.O. Dimkpa, and P.S. Bindraban. 2017. “Effects of Nutrient
Antagonism and Synergism on Yield and Fertilizer Use Efficiency,” Communications in Soil
Science and Plant Analysis, 48:16.
Sanabria, J., J. Wendt, and O. Nduwimana. 2017. “Modeling Spatial Variability across Farms to
Estimate the Error in Experiments Replicated across Numerous Farms,” presented at the ASA,
CSSA and SSA 2017 Annual Meeting, October 22-25, Tampa, FL.
Sanabria, J. 2016. “Fertilizer Quality Assessment in the Myanmar Dry Zone,” IN Myanmar Soil
Fertility and Fertilizer Management Conference Proceedings, pp. 243-255, IFDC and DAR,
Myanmar.
Singh, U. 2017. “Fertilizer, Soil, Plant and Nutrient Dynamics Research at IFDC,” presented at
Kingenta’s Research Center on Slow and Control Release Fertilizer, November 16, Shandong,
China.
Singh, U. 2017. “Past, Present and Future of Fertilizer Technology Development,” presented at
the International Symposium of Fertilizer Technology and Nutrient Management,
November 21, organized by Shandong Agricultural University, Shandong, China.
Singh, U., M. Aung, and J. Fugice. 2017. “Role of Yield Potential and Yield-Gap Analyses on
Resource-Use Efficiency Improvement,” IN Myanmar Soil Fertility and Fertilizer
Management Conference Proceedings, pp. 22-37, IFDC and DAR, Myanmar.
Singh, U., D. Hellums, W. Bible, V. Henry, J. Sanabria, and F. Yin. 2017. “Performance of Urea
Enhanced with Sulfur,” presented at the ASA, CSSA and SSA 2017 Annual Meeting,
October 22-25, 2017, Tampa, FL.
Thigpen, J. 2018. “Ongoing Improvements and Applications of the CERES-Rice Model,”
Agrilinks Newsletter, February 28, 2018. https://www.agrilinks.org/post/ongoing-
improvements-and-applications-ceres-rice-model.
Wendt, J., and L.W. Mbuthia. 2017. “A Conceptual Framework for Delivering Improved
Fertilizers to Smallholder Farmers in Africa,” IN Myanmar Soil Fertility and Fertilizer
Management Conference Proceedings, pp. 169-175, IFDC and DAR, Myanmar.
58
Annex 3. Comments and Clarifications about the Report
1. Workstream 1 – Developing and Validating Technologies, Approaches, and Practices
1.1.1.1 Rice Production in Submergence-Prone Areas – Ghana
BFS: It would be interesting to see the impact of labor on the economic viability of the various
treatments. Also, is there greater potential to subsurface place granular fertilizer than briquettes?
Response: (Incorporated in above section of the Report). An economic analysis is being
performed on the data to ascertain the profitability associated with each treatment. The results of
the economic analysis will be presented in the annual report. Improvements in applicators will be
beneficial to both subsurface placed granular fertilizer and briquettes.
1.1.1.2 Developing Appropriate Soil Fertility Management Technologies for Stress-Tolerant
Rice Cultivars – Bangladesh, Myanmar, and Nepal
Drought Trial in Nepal
Preliminary findings show that most farmers have no access to extension advice regarding
fertilizer use (amount and timing).
BFS: Perhaps we should place a greater focus on extension. We could consider a pilot joint
activity with our centrally funded extension mechanism led by Digital Green and IFPRI to see how
information dissemination could be improved leading to better project outcomes.
Response: Yes, it is a good idea. IFDC has started disseminating this information under CIMMYT
led project ‘Nepal Seed and Fertilizer (NSAF)’ by training of trainers – the intermediary service
providers (agro-dealers/retailers) on ISFM (including balanced fertilization) and BMPs. NSAF is
working in collaboration with another USAID project ‘Knowledge-Based Integrated Sustainable
Agriculture in Nepal (KISAN II)’ to scale improved ISFM practices to farmers. Linking this work
with other partners such as Digital Green would be pursued in FY 19 Workplan.
Salinity and Submergence Trials in Myanmar
At the high-yielding location (Kwin Yar), basal application of diammonium phosphate (DAP)
followed by three split applications of urea improved the efficiency of broadcast application to
give similar yield as UDP.
BFS: It seems that combining multiple BMP’s can have as great an impact as UDP. This is similar
to the situation in Burma that we talked about with Grahame with the FSI+ activity
Response: In general, nutrient management is highly site- and season-specific. However, UDP
has been shown to perform equally well in stress and favorable environment. BMPs in favorable
environment could be as effective as UDP to give similar yields. However, other impacts of UDP
are lower fertilizer dosage, reduced N losses to the environment, one-time application of N
fertilizer, and higher gross margin.3
3Kaw, D and G. Hunter (2017). UDP technology and rice yields among farmer beneficiaries of rainfed lowland
project areas in Myanmar. IN Myanmar Soil Fertility and Fertilizer Management Conference Proceedings, pp. 135-
149, IFDC and DAR, Myanmar.
59
1.1.2.3 Agronomic and Economic Evaluation of Deep Placement on Maize and Winter and
Off-Season Vegetables in Mali and Ghana
Maize Trials in Ghana
To improve N use efficiency, smallholder farmers have been taught to avoid the traditional surface
broadcast application and apply fertilizers at the subsurface, near the root zone of the maize
plants.
BFS: Taught by who, the project or traditional extension efforts?
Response: Extension and IFDC (included in the Report). To improve N use efficiency,
smallholder farmers have been taught by the local extension services, supported by IFDC, to avoid
the traditional surface broadcast application and apply fertilizers at the subsurface, near the root
zone of the maize plants.
An innovative approach could be a priori briquetting of the quantity of fertilizer required by the
plant and applying the briquettes to the plants, thereby eliminating the measuring of the granular
fertilizer before applying it to the plant.
BFS: Unless there was an opportunity for “custom blend briquetting” this would require a fairly
generic blend and not be very site or soil specific.
Response: (Incorporated in the Report). The opportunity to produce custom-blend multi-nutrient
briquettes exist (see Annex 2: Agyin-Birikorang et al., 2018); however, issues associated with
briquette strength need fine-tuning before out-scaling of the process.
Upland Vegetable Production in Ghana
In SSA, women are heavily involved in vegetable production; thus, the introduction of
technologies that increase the productivity of vegetable production could increase household
incomes and make the enterprise more attractive to several women.
BFS: Several does not sound like a very ambitious goal.
Response: (Incorporated in above section of the Report). In SSA, women are heavily involved
in vegetable production; thus, the introduction of technologies that increase the productivity of
vegetable production could increase household incomes and make the enterprise more attractive
to all women engaged in vegetable production.
1.1.3 Improving Nitrogen Use Efficiency of Organic and Inorganic Fertilizers
The activity reported here was conducted in partnership with the U.S. Department of Agriculture.
BFS: What is the length of this relationship with USDA?
Response: (Incorporated in the Report). It is a 3-year USDA NIFA-funded project being executed
in collaboration with The Connecticut Agricultural Experiment Station (as the lead) and The
University of Texas in El Paso. It started in March 2016 and ends on February 2019.
60
These findings indicate that Zn treatment has both immediate and residual effects on wheat
productivity.
BFS: What were initial soil test levels, pH, Zn, texture, etc.? Impact of soil test levels and
especially pH with Mn response.
Response: (Incorporated in the Report). The soil used in the studies is a sandy loam with a near-
neutral pH of 6.87, which suggests the pH is nearing the upper boarder line for optimum soil Zn
and Mn bioavailability. The initial Zn level of 0.1 mg/kg was below the critical level for Zn of 0.5
to 1.0 mg/kg and likewise the Mn level of 6.4 mg/kg was below the critical level of 50-100 mg/kg.
1.2.1 Facilitate Site- and Crop-Specific Fertilizer Recommendations for Increased
Economic and Environmental Benefits from Fertilizer Use
This is the result of either inherently low soil fertility or nutrient depletion and organic matter
decline caused by repeated cropping without replacing what has been taken from the soil.
BFS: I would add acidity to that list.
Response: (Incorporated in the Report). This is the result of either inherently low soil fertility or
nutrient depletion, soil acidity, and organic matter decline caused by repeated cropping without
replacing what has been taken from the soil.
N, P, and K contents of the unfertilized plant tissue samples were greater than expected (Figures
11-13) due to plant roots accessing nutrients from deeper levels (beyond the top 6 inches
analyzed).
BFS: One of the main advantages of tissue testing is that it accounts for nutrients that are not
reflected in soil testing including nutrients from deeper horizons that are sampled. Were the tissue
samples all taken at the proper diagnostic stage of growth and at the same locations as the soil
samples? Setting up a massive number of omission studies seems like a big lift. I would check to
make sure tissue sampling protocols were followed and sample handling was done properly.
Response: Tissue samples were taken at the proper diagnostic stage of growth and at the same
locations as the soil samples. Tissue sampling and sample handling protocols will be followed in
the nutrient omission trials.
1.2.5.3 Greenhouse Evaluation of Activated Phosphate Rock on Highly Acidic Soil
PR can be used as a soil acidity amendment;
BFS: How is PR being used as a soil acidity amendment?
Response: PR dissolution reaction (Khasawneh and Doll, 1978; Kirk and Nye, 1986), results in
the release of H2PO4− and Ca2+.
Ca10(PO4)6F2 + 12H+ ↔ 10Ca2+ + 6H2PO4− + 2F−
The consumption of H+ would increase soil pH. Calcium can also reduce acidity by complexing
Al-Fe oxides as on application of gypsum.
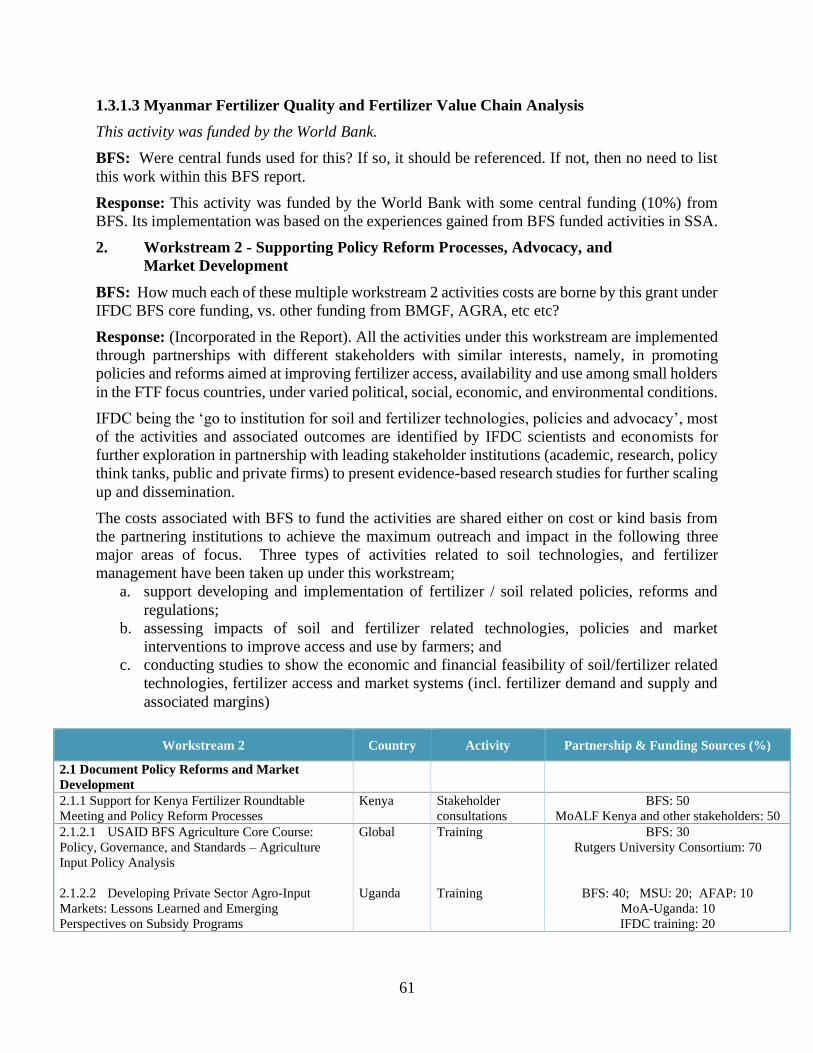
61
1.3.1.3 Myanmar Fertilizer Quality and Fertilizer Value Chain Analysis
This activity was funded by the World Bank.
BFS: Were central funds used for this? If so, it should be referenced. If not, then no need to list
this work within this BFS report.
Response: This activity was funded by the World Bank with some central funding (10%) from
BFS. Its implementation was based on the experiences gained from BFS funded activities in SSA.
2. Workstream 2 - Supporting Policy Reform Processes, Advocacy, and
Market Development
BFS: How much each of these multiple workstream 2 activities costs are borne by this grant under
IFDC BFS core funding, vs. other funding from BMGF, AGRA, etc etc?
Response: (Incorporated in the Report). All the activities under this workstream are implemented
through partnerships with different stakeholders with similar interests, namely, in promoting
policies and reforms aimed at improving fertilizer access, availability and use among small holders
in the FTF focus countries, under varied political, social, economic, and environmental conditions.
IFDC being the ‘go to institution for soil and fertilizer technologies, policies and advocacy’, most
of the activities and associated outcomes are identified by IFDC scientists and economists for
further exploration in partnership with leading stakeholder institutions (academic, research, policy
think tanks, public and private firms) to present evidence-based research studies for further scaling
up and dissemination.
The costs associated with BFS to fund the activities are shared either on cost or kind basis from
the partnering institutions to achieve the maximum outreach and impact in the following three
major areas of focus. Three types of activities related to soil technologies, and fertilizer
management have been taken up under this workstream;
a. support developing and implementation of fertilizer / soil related policies, reforms and
regulations;
b. assessing impacts of soil and fertilizer related technologies, policies and market
interventions to improve access and use by farmers; and
c. conducting studies to show the economic and financial feasibility of soil/fertilizer related
technologies, fertilizer access and market systems (incl. fertilizer demand and supply and
associated margins)
Workstream 2 Country Activity Partnership & Funding Sources (%)
2.1 Document Policy Reforms and Market
Development
2.1.1 Support for Kenya Fertilizer Roundtable
Meeting and Policy Reform Processes
Kenya Stakeholder
consultations
BFS: 50
MoALF Kenya and other stakeholders: 50
2.1.2.1 USAID BFS Agriculture Core Course:
Policy, Governance, and Standards – Agriculture
Input Policy Analysis
2.1.2.2 Developing Private Sector Agro-Input
Markets: Lessons Learned and Emerging
Perspectives on Subsidy Programs
Global
Uganda
Training
Training
BFS: 30
Rutgers University Consortium: 70
BFS: 40; MSU: 20; AFAP: 10
MoA-Uganda: 10
IFDC training: 20
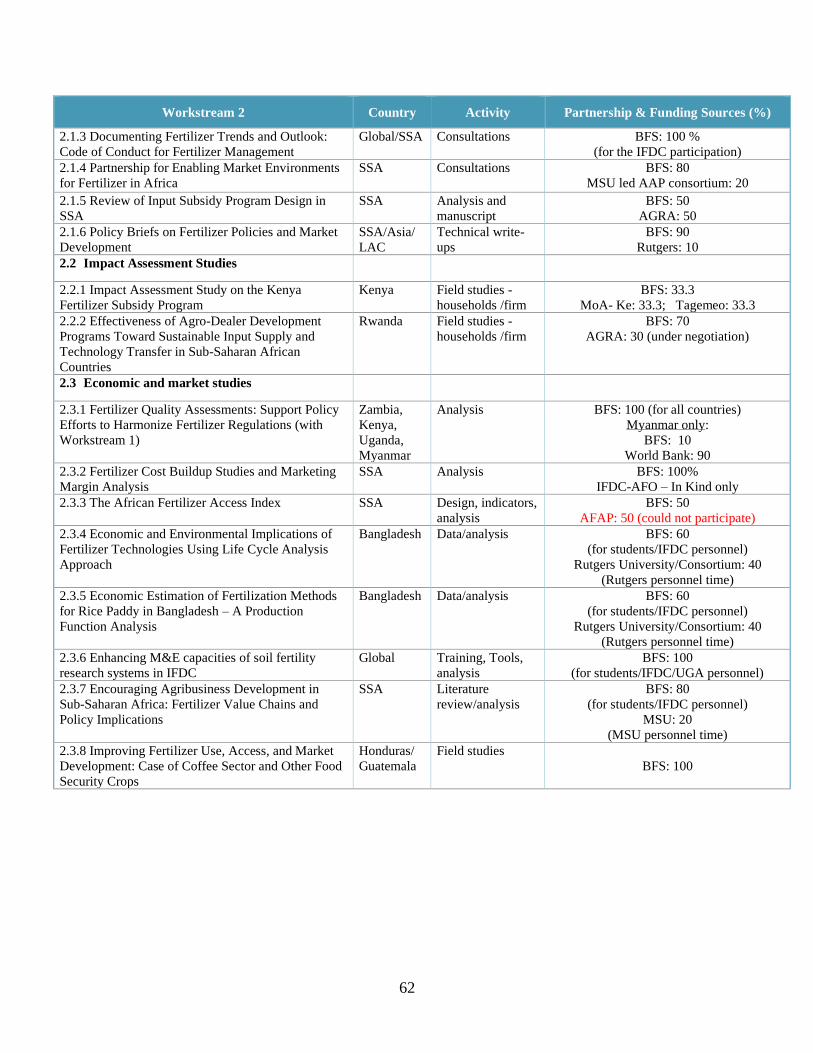
62
Workstream 2 Country Activity Partnership & Funding Sources (%)
2.1.3 Documenting Fertilizer Trends and Outlook:
Code of Conduct for Fertilizer Management
Global/SSA Consultations BFS: 100 %
(for the IFDC participation)
2.1.4 Partnership for Enabling Market Environments
for Fertilizer in Africa
SSA Consultations BFS: 80
MSU led AAP consortium: 20
2.1.5 Review of Input Subsidy Program Design in
SSA
SSA Analysis and
manuscript
BFS: 50
AGRA: 50
2.1.6 Policy Briefs on Fertilizer Policies and Market
Development
SSA/Asia/
LAC
Technical write-
ups
BFS: 90
Rutgers: 10
2.2 Impact Assessment Studies
2.2.1 Impact Assessment Study on the Kenya
Fertilizer Subsidy Program
Kenya Field studies -
households /firm
BFS: 33.3
MoA- Ke: 33.3; Tagemeo: 33.3
2.2.2 Effectiveness of Agro-Dealer Development
Programs Toward Sustainable Input Supply and
Technology Transfer in Sub-Saharan African
Countries
Rwanda Field studies -
households /firm
BFS: 70
AGRA: 30 (under negotiation)
2.3 Economic and market studies
2.3.1 Fertilizer Quality Assessments: Support Policy
Efforts to Harmonize Fertilizer Regulations (with
Workstream 1)
Zambia,
Kenya,
Uganda,
Myanmar
Analysis BFS: 100 (for all countries)
Myanmar only:
BFS: 10
World Bank: 90
2.3.2 Fertilizer Cost Buildup Studies and Marketing
Margin Analysis
SSA Analysis BFS: 100%
IFDC-AFO – In Kind only
2.3.3 The African Fertilizer Access Index SSA Design, indicators,
analysis
BFS: 50
AFAP: 50 (could not participate)
2.3.4 Economic and Environmental Implications of
Fertilizer Technologies Using Life Cycle Analysis
Approach
Bangladesh Data/analysis BFS: 60
(for students/IFDC personnel)
Rutgers University/Consortium: 40
(Rutgers personnel time)
2.3.5 Economic Estimation of Fertilization Methods
for Rice Paddy in Bangladesh – A Production
Function Analysis
Bangladesh Data/analysis BFS: 60
(for students/IFDC personnel)
Rutgers University/Consortium: 40
(Rutgers personnel time)
2.3.6 Enhancing M&E capacities of soil fertility
research systems in IFDC
Global Training, Tools,
analysis
BFS: 100
(for students/IFDC/UGA personnel)
2.3.7 Encouraging Agribusiness Development in
Sub-Saharan Africa: Fertilizer Value Chains and
Policy Implications
SSA Literature
review/analysis
BFS: 80
(for students/IFDC personnel)
MSU: 20
(MSU personnel time)
2.3.8 Improving Fertilizer Use, Access, and Market
Development: Case of Coffee Sector and Other Food
Security Crops
Honduras/
Guatemala
Field studies
BFS: 100
63
BFS: Strategic approach: It's not clear what this all adds up to, or how these activities were
selected, or what the medium term priorities or plan are?
Response:
The overall (strategic) approach for the work stream activities since beginning of the project in
2015 were to:
(1) Produce evidence – based research studies of economic nature on fertilizer policy reforms,
market related interventions, and soil and fertilizer technologies
(2) Engage actively in advocacy forums and capacity building activities to influence
stakeholders in fertilizer sector and soil management to improve access, availability and
use of proven soil/fertilizer technologies and products through sustainable interventions
considering economic and environmental implications
(3) Disseminate information and knowledge on soil and fertilizer related issues
The selection of activities (FY 2015-2018) since project initiation were based on extensive
consultations with Activity Manager for the project and the Senior Policy Advisor (BFS) to reflect
the emerging as well to fill in the void in producing evidence based economic, policy research on
soil and fertilizer sector across the FTF countries, along with partners (academic, policy think-
tanks, other public and private stakeholders).
Medium term priorities / plans (since FY 2018) and expected outcomes: As of now, the project
has crossed midpoint of its implementation. Further to coordinate with the current strategic vision
of IFDC since 2017 and to align with new BFS priorities (GFSS strategy etc.,) we have re-
organized ourselves to focus on few key initiatives during the remaining part of the project; and
consolidate activities to allow for organizing learning events. Thus, from mid FY 2018, new
activities with focused outputs are being implemented.
Activities that are expected to be completed by 2018 funding cycle include:
(1) Cost-build up (market margin analysis) for fertilizer supply. Initiated in 2015 with BFS
funding, four country-level studies have been documented under this sub-activity in Kenya,
Tanzania, Mali, and Ghana. With information been collected by AFO-IFDC and recently
concluded USAID funded WAFP study, we propose to consolidate these studies for further
dissemination.
(2) Fertilizer quality assessment studies. Conducted with Workstream 1 (laboratory and
statistical analysis) with exclusive BFS funding in 3 countries – we further expect to
consolidate the findings from all the 3 countries + Myanmar (complemented by WB
funding)
Activities for focus in 2018/19 funding cycle include;
(1) Focus on producing evidence-based (empirical) policy briefs and reports on fertilizer
market development; and soil/fertilizer policy reforms in FTF countries (in collaboration
with networks and partners) – including ministry of agriculture in selected FTF countries,
policy think tanks (AFAP, Tagemeo, AGRA) and regional economic forums (ECOWAS,
COMESA, etc.).
(2) Expanding economic research on soil and fertilizer technologies with University
partnerships: (including adoption studies, empirical economic studies etc,) with land-grant
university partnerships (Rutgers, MSU, UGA etc.)
64
(3) Compliment workstream 1 activities with focus on: extension and improved information
dissemination and conducting economic feasibility that lead to better project outcomes.
Providing solid economic/financial basis for scaling adaptive technologies for wider
adoption.

65
www.feedthefuture.gov