Embed Size (px)
Citation preview

Vol. VI • No. 4 • January-March 2010
Small States – Large StatesWith the forces favaouring a large number of smaller states gathering momentum, this study endeavours to analyse the performance of small states empirically by focusing on economic growth.
- Sumita Kale and Lavesh Bhandari
India and the Global Productivity RaceIndia’s growth story has been recognised and appreciated internationally. However, there are still a large number of issues that need immediate attention to achieve a balanced growth.
- Sumit K. Majumdar
GST - A revolutionary Tax or VAT plus?The new tax called GST is a dual tax system, uniformly levied by both the Centre and the States. It is however perceived that the Centre and States are not talking about a new hassle free indirect tax system, i.e. GST but a system which is VAT Plus!
- S. M. Kulkarni

Message
The Bombay Chamber of Commerce and Industry Trust for Economic and Management Studies was constituted in 1996 by the Bombay Chamber of Commerce and Industry to undertake independent research activities on various economic and management issues and for providing analytical views on macro-economic scenario, industrial performance and other issues of topical interest.
The trust started publishing the quarterly magazine ‘AnalytiQue’ for the quarter October-December in the year of 1999 to serve as an effective vehicle of communication between the government, industry, economists, thinkers, management consultants and scholars. In its short journey the magazine had some trying spells and for reasons beyond our control, there has been no issue of ‘AnalytiQue’ after the issue of January-March, 2006. However, after four years, we are now determined to revive the publication in the form of a journal, while retaining its basic purpose and character. It will continue to serve members, who are drawn mainly from the world of business and commerce and will deal with contemporary economic issues while documenting some of the important developments of the Indian economy.
Bharat Doshi, President
Bombay Chamber of Commerce and Industry and
Trustee, Bombay Chamber of Commerce and Industry Trust for Economic and Management Studies
1
Analytique • Vol. VI • No. 4 • January-March 2010
From the Editor’s Desk
India is considered to be one of the most important emerging markets in the world today and is projected to become one of the top five economic nations by the year 2020. India’s economic success is evidenced by its sustained GDP growth, rapid increase in industrial output, steady agricultural production, fast growing exports and comfortable foreign exchange reserves position. In addition, part, India has a strong and well-developed legal system, an organized and responsive capital market, natural resources, skills and professional services, and a favorable geographical location in Asia; all contributing factors for sustained economic development in the near future. India has emerged as a major economic player and it is no surprise that there is an abiding interest in developments taking place in the Indian economy.
It is against this backdrop that we seek contributions from the business and academic community for publication in Analytique to provide analysis and views on the Indian economy and to contribute to policy making on contemporary economic and business issues. We offer Analytique as a research oriented but not strictly academic journal in the hope that it will help our members as well as others to understand the emerging India better.
We take this opportunity to convey our deep sense of gratitude to all who are and have
been with us as members, referees, and contributors and look forward to
your continued support and contributions.
Published and Printed by Dr. Atindra Sen, Bombay Chamber of Commerce & Industry Trust for Economic and Management Studies,Mackinnon Mackenzie Building, Ballard Estate, Mumbai 400 001 • Tel.: (91-22) 2261 4681 • Fax: 2261 1213 • Email: [email protected]
Contents
Editorial Board
Special ThemeSmall States – Large States 03- Sumita Kale and Lavesh Bhandari
India and the Global Productivity 17Race- Sumit K. Majumdar
Current AffairsGST - A revolutionary Tax orVAT plus? 22- S. M. Kulkarni
Current Economic Senario
Quarterly Overview 26
Selected Economic Indicators 35
Dr. Atindra Sen
Ms. Manju Sood
Dr. Sugeeta Upadhyay
Ms. Piyusha Hukeri
Mr. Pravin Rane
Disclaimer - The articles published in Analytique do not necessarily reflect the view of the Bombay Chamber of Commerce and Industry Trust for Economic and Management Studies.
Printed at Uchitha Graphic Printers Pvt. Ltd.
Vol. VI • No. 4 • January-March 2010

2
Analytique • Vol. VI • No. 4 • January-March 2010
About Authors and their Contributions
This issue contains three articles on three different contemporary economic issues.
In the first one while testing the hypothesis ‘Is there an economic case for smaller states’ the paper “Small States-Large states” co-authored by Sumita Kale, Chief Economist and Laveesh Bhandari, Director of Indicus Analytics concludes that provided some specific socio-economic parameters are addressed, purely economic considerations would favor the creation of smaller entities. And it is true both empirically and politically.
The second article, “India and the Global Productivity Race”, written by Sumit Majumder, Professor of Technology Strategy, School of Management, University of Texas at Dallas, USA, argues that India has experienced extensive growth but not intensive growth till date. While quantitatively India may have grown in output generation, in qualitative terms India’s productivity growth during the overall period has been stagnant.
The third one “GST-A Revolutionary Tax or VAT Plus?” by S.M. Kulkarni, Vice President, Corporate Sales Tax Department, Mahindra and Mahindra Limited and Group Companies, considers the fact that the present indirect taxes levied by both the Centre and the States have their own problems. The paper suggests some important measures so that the new tax called Goods and Services Tax (GST) may not further lead to a VAT Plus Regime. The paper concludes a new, revolutionary tax regime should not be continuing with the old problems of the industry.

3
Analytique • Vol. VI • No. 4 • January-March 2010
Small States - Large StatesSumita Kale
Laveesh Bhandari
* Sumita Kale ([email protected]) is Chief Economist at Indicus Analytics and Laveesh Bhandari ([email protected]) is Director of Indicus Analytics.
Introduction
As forces favouring a larger number of smaller states gather momentum, the question of whether they indeed perform better needs to be answered empirically. We focus on economic growth, and find that there is some evidence that growth, post reorganisation into smaller states, is higher. However, in each of the cases of past reorganisations exogenous factors have played an important role in enabling (or disabling) higher growth.
At the time of independence, in 1947, India chose to be a federal state, with significant power to the state governments in response to the diversity in socio-economic conditions across the country. Over the last 60 years, the number of states and their boundaries has changed frequently and India now has 35 states and union territories, with strident demands for more still coming in. While the first major reorganisation of states was done in 1956 on linguistic lines, the economic rationale for the existence of a state was extensively debated then. However, in recent times, this strand of thought has had little analysis, despite the creation of new states since the sixties.
This paper therefore looks at the following issues: is there an economic case for smaller states? Or alternatively, would the states perform better after they break up from into smaller states? The motivation for this paper comes from the new states of this decade, which have left their parent states behind in growth rates and governance initiatives. This paper does not aim to find the ‘correct’ size of a state, however it makes the point that there are two countervailing forces – one, smaller states may do better as administration can be more responsive to local needs and regional differences combined with greater homogeneity. And two, smaller states have access to lesser human capital and civil society institutions and therefore might be susceptible to the problem of poorer institutions and susceptible to ‘take-over’ by non-desirable forces.
This paper also focuses only on economic growth, not on other socio-economic parameters. However, since most socio-economic factors that are used to measure progress are highly correlated with economic growth, arguably, economic growth should be one of the most important parameters
Smal
l Sta
tes
- Lar
ge S
tate
sSp
ecia
l The
me

4
Analytique • Vol. VI • No. 4 • January-March 2010
Andhra was the first state to be delineated on a purely linguistic basis in 1953 when the 16 northern Telugu speaking districts were separated from Tamil-speaking parts of Madras State. With the formation of the State Reorganisation Commission the same year, the question arose whether to merge Telangana, the Telugu speaking districts of Hyderabad state, with this state of Andhra to form a new state on purely linguistic grounds. Interestingly, the Commission merged the two entities giving the following reasoning on economic, and not linguistic, grounds:
The advantages of a larger Andhra State were that it would bring into existence a State of about 32 million population, with a considerable hinterland, with large water and power resources, adequate mineral wealth and valuable raw materials. The ‘vexing problem’ of finding a permanent capital for Andhra would be resolved by the twin cities of Hyderabad and Secunderabad, which lay in Hyderabad state.
River resources would be better managed, as the development of the Krishna and Godavari rivers would be brought under unified control.
Telangana usually had sizeable food supply deficit during drought years, while Andhra normally had surplus.
Similarly, the existing State of Andhra had no coal, but would be able to get its supplies from Singareni in Telangana.
Human capital was greater in Andhra state, while Telangana was revenue rich; there was therefore complementarity of resources.
Though Telangana pressed for a separate existence, arguing that it formed a stable and viable unit by itself, the Commission recommended a merger, with a caveat.
“Andhra and Telangana have common interests and we hope these interests will tend to bring the people closer to each other. If, however, our hopes for the development of the environment and conditions congenial to the unification of the two areas do not materialise and if public sentiment in Telangana crystallises itself against the unification of the two states, Telangana will have to continue as a separate unit.”
The Commission therefore tried to balance the more compelling need for economically disadvantaged Andhra to merge with Telangana with the desire of the Telangana people to maintain separate states despite a common language.
Box 1: History of Telangana and Andhra
Smal
l Sta
tes
- Lar
ge S
tate
s
to look at. That admittedly does not imply that growth is the only parameter to study.
Rationale behind reorganisation of states
At the time of independence, India had more than 500 states, most of which were extremely small, unviable to function as independent economic entities. By 1950, these states were organised into 28 units, by merging tiny states into larger entities. For instance, in 1948, 30 princely states occupying a combined territory of 27,000 sq km came together to form Himachal Pradesh. States were multi-lingual, raising severe administrative and social
issues. The initial demarcation of state boundaries was therefore contested, with demands for reorganisation on linguistic grounds. There was intense debate and though the State Reorganisation Commission set up in 1953 accepted the rationale of language as a basis of state composition, it also went into the criterion of size and resources in different regions while forming the states. The case of Telangana and Andhra illustrates these issues best (see Box).
With the State Reorganisation Act 1956, linguistic basis became the benchmark for state creation. But not without severe criticism. Dr. Ambedkar’s note, ‘Thoughts on
5
Analytique • Vol. VI • No. 4 • January-March 2010
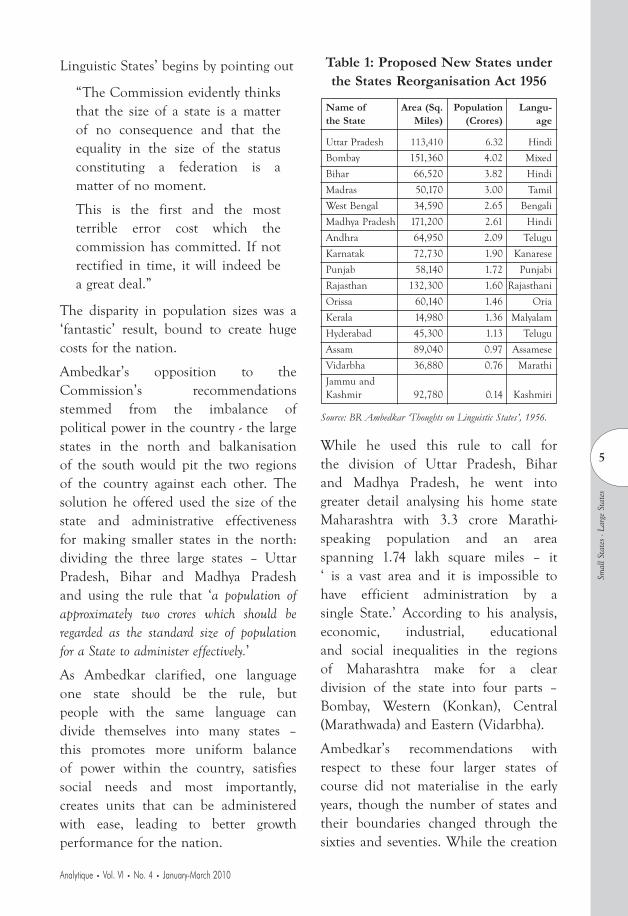
Table 1: Proposed New States under the States Reorganisation Act 1956
Name of Area (Sq. Population Langu-the State Miles) (Crores) age
Uttar Pradesh 113,410 6.32 HindiBombay 151,360 4.02 Mixed
Bihar 66,520 3.82 Hindi
Madras 50,170 3.00 Tamil
West Bengal 34,590 2.65 Bengali
Madhya Pradesh 171,200 2.61 Hindi
Andhra 64,950 2.09 Telugu
Karnatak 72,730 1.90 Kanarese
Punjab 58,140 1.72 Punjabi
Rajasthan 132,300 1.60 Rajasthani
Orissa 60,140 1.46 Oria
Kerala 14,980 1.36 Malyalam
Hyderabad 45,300 1.13 Telugu
Assam 89,040 0.97 Assamese
Vidarbha 36,880 0.76 Marathi
Jammu and Kashmir 92,780 0.14 Kashmiri
Source: BR Ambedkar ‘Thoughts on Linguistic States’, 1956.
While he used this rule to call for the division of Uttar Pradesh, Bihar and Madhya Pradesh, he went into greater detail analysing his home state Maharashtra with 3.3 crore Marathi-speaking population and an area spanning 1.74 lakh square miles – it ‘ is a vast area and it is impossible to have efficient administration by a single State.’ According to his analysis, economic, industrial, educational and social inequalities in the regions of Maharashtra make for a clear division of the state into four parts – Bombay, Western (Konkan), Central (Marathwada) and Eastern (Vidarbha).
Ambedkar’s recommendations with respect to these four larger states of course did not materialise in the early years, though the number of states and their boundaries changed through the sixties and seventies. While the creation
Smal
l Sta
tes
- Lar
ge S
tate
s
Linguistic States’ begins by pointing out
“The Commission evidently thinks that the size of a state is a matter of no consequence and that the equality in the size of the status constituting a federation is a matter of no moment.
This is the first and the most terrible error cost which the commission has committed. If not rectified in time, it will indeed be a great deal.”
The disparity in population sizes was a ‘fantastic’ result, bound to create huge costs for the nation.
Ambedkar’s opposition to the Commission’s recommendations stemmed from the imbalance of political power in the country - the large states in the north and balkanisation of the south would pit the two regions of the country against each other. The solution he offered used the size of the state and administrative effectiveness for making smaller states in the north: dividing the three large states – Uttar Pradesh, Bihar and Madhya Pradesh and using the rule that ‘a population of approximately two crores which should be regarded as the standard size of population for a State to administer effectively.’
As Ambedkar clarified, one language one state should be the rule, but people with the same language can divide themselves into many states – this promotes more uniform balance of power within the country, satisfies social needs and most importantly, creates units that can be administered with ease, leading to better growth performance for the nation.

6
Analytique • Vol. VI • No. 4 • January-March 2010
of Jharkhand, Chhattisgarh and Uttarakhand in 2000 showed that the rationale for smaller states could not be suppressed, there are still, and growing, demands to break up Uttar Pradesh and Maharashtra.1
‘Small’ and ‘big’ are relative terms and while Ambedkar put two crores as a viable population size for administration, with India’s current population, this would now translate into more than fifty states for the Indian Union, a political impossibility. Is there a viable middle path? One suggestion is to use some combination of the 77 agro-climatic regions as an administrative unit within the state, which could prove more efficient than the current system. Another could be to ensure that a combination of criteria - minimum population of (say 5 crores) and with some economic-cultural-social homegeniety (as reflected in agro-climatic regions) – be used.
Indeed there can be many different criteria that can be evolved, each leading to a different set of new states with differing sizes. But what has been the empirical evidence on the states that have been divided in the past? The next section briefly reviews that element.
Economic Growth and State FormationEmpiricism demands the following (a) a sufficiently long enough time should have elapsed after the reorganisation, (b) a number of cases of such reorganisation should have occurred, (c) measures across a range of economic, socio-economic and governance
parameters need to be available, and (d) such measures need to be available both before and after the reorganisation at the sub-state level. Indeed, none of these conditions are fully met in the case of India. However, all of these conditions are met partially to facilitate some indicative analysis.
First, consider the criteria of major cases of state reorganisation. Post independence, the organization of states between the period 1947 and 1950 occurred under Sardar Patel. At the time hundreds of small princely states were very rapidly integrated into 28 units. The objective, at the time, was to ensure rapid integration of otherwise diverse states into the Indian Union. It was well recognized that this was not a long term solution and a more sustainable solution was essential. This resulted in the formation of the State Reorganisation Commission in 1953, which gave its well known language based states’ recommendations in 1956.2 Since the mid-sixties,3 three cases of major state reorganisations have occurred.
1966: Haryana was carved out of Punjab and some districts went to Himachal Pradesh
1971: Arunachal Pradesh, Meghalaya and Mizoram were separated from the state of Assam
2000: Uttaranchal (re-named Uttarakhand in 2007) created from Uttar Pradesh, Jharkhand from Bihar and Chhattisgarh from Madhya Pradesh
There was also the separation of the UT – Goa, Daman and Diu into the state of Goa and the UT of Daman and Diu.
Smal
l Sta
tes
- Lar
ge S
tate
s

7
Analytique • Vol. VI • No. 4 • January-March 2010
Thus we can at-best have three years or five cases of reorganisations. The first criterion of a significant number of cases is therefore met only partially.
Second, consider the time period. Apart from the cases of Punjab and Assam, less than a decade has elapsed after the reorganisation of UP, MP and Bihar into six smaller units. But the full benefits and costs of state-level reorganisations are likely to take many years to play out. Economic policies, administrative systems, human capital creation etc., take many years to re-orient and another few years to have a significant impact. Moreover, data is also available with some gap. Having said that ten, years is not entirely an insignificant time period, and some insights can be obtained about the performance of these states as well.
Third and fourth, consider the availability of the relevant measures at the sub-state level for the period before and after the reorganisation. And here as well the picture is not entirely sparse. The various surveys of the NSSO have identifiers that enable the researcher if she so desires to estimate a range of socio-economic conditions over time. For the Punjab and Assam cases, this may be difficult as the older years data do not have large enough sample sizes. But post 1980s the data are of decent enough depth and quality to enable measuring socio-economic performance of various regions or sub-states. Moreover, the CSO has also released some data on state level NDP for the six new states created in 2000. It is not clear how, but state level NDP has been estimated for all the six entities
(spanning the older UP, MP and Bihar) from 1993-94 onwards - about 6 years before these states came into existence.
Overall, therefore, we have some evidence that can better help understand the performance of these states, pre- and post-reorganisation. We focus on only one parameter, economic growth as measured by the NSDP or net state domestic product.
We seek, as much as data permits, to answer four questions:
• Do states grow faster after theybreak away from larger states?
• Do the erstwhile larger states grow faster after the smaller unit has broken off?
• Does the overall entity grow faster after the reorganisation?
• How does this state-level growth compare with the rest of the country pre- and post-reorganisation?
Data: A brief
Ideally, all instances of major reorganisation should be examined. However, there are severe data limitations; state income series published by the CSO begin only from 1960-61 and have missing values for new states in early years. For instance, Meghalaya and Mizoram series begin in 1980-81, while constant prices are not available for Mizoram till 1999-00. Himachal’s reorganisation occurred at the district level, and district level series are not available, Haryana’s data before the reorganisation is also not available, etc. Analysis is therefore conducted on a case by case basis with the most
Smal
l Sta
tes
- Lar
ge S
tate
s

8
Analytique • Vol. VI • No. 4 • January-March 2010
Figure 1: Growth performance prior and post reorganisation
0
1
2
3
4
5
6
Trend growth in 10 years period prior toreorganisation
Trend growth in 10 years post reorganisation
Per
cent
Punjab, Haryana and Himachal Pradesh IndiaSource: CSO
appropriate data points available, and there are important qualifiers in each of these.4
Punjab, Haryana and Himachal Pradesh 5
Since separate estimates of the constituent states are not available for the period prior to reorganisation, the available state incomes of Himachal, Haryana and Punjab (before and after its reorganisation) were combined to create a single entity named Greater Punjab that could be comparable across time. Trend growth ten years, before and after 1966, was estimated using the GSDP series created for the larger state (named as mentioned, Greater Punjab and comprising of Punjab, Haryana and Himachal).6
The table and graph below show that indeed, the Greater Punjab region saw much more rapid growth after the reorganisation than before. Moreover, though the available data do not allow for a state-wise comparison we can comfortably argue that all three states of Himachal, Punjab and Haryana have
not performed worse than the national average in terms of economic growth after their reorganisation into smaller independent entities.
Since the reorganisation also broadly coincided with the Green Revolution in the states of Punjab and Haryana, it could be argued that the single example of the success of Punjab should be ascribed to the Green Revolution and not to the reorganisation into smaller states.
But that would be fallacious. The success of the Green Revolution cannot be treated as an exogenous shock. Rather it could be quite convincingly argued that a smaller, more homogenous Punjab, could better work with the central government in ensuring the success of the Green Revolution – something that a state like UP could not manage7. In other words, the smaller state of Punjab was better able to focus its efforts towards a single objective of ensuring rapid increase in agriculture productivity.
Smal
l Sta
tes
- Lar
ge S
tate
s

9
Analytique • Vol. VI • No. 4 • January-March 2010
We do however admit that there is a counter-argument - a Greater Punjab may have been better able to spread the benefits of the Green Revolution. That is, the time taken for the Green Revolution to spread through Haryana could have been lower had it remained a part of the Greater Punjab. It would generally be very difficult to obtain unambiguous empirical evidence supporting or opposing the creation of smaller states because of such counterfactuals. But Punjab’s story is not the only one.
Assam
What we call ‘Greater’ Assam was reorganized into Assam, Arunachal Pradesh, Meghalaya and Mizoram in 1971. For most of the smaller states, data are not available for the years pre, or immediately post, reorganisation – Meghalaya and Mizoram data begin in 1980-81, Mizoram income series at constant prices begins only from 1999-00. We therefore are constrained to use
only the state that we call new Assam for the analysis.8
Table 2: Comparison of economic growth – Assam and India
Time Period Assam India
Pre-reorgani- sation trend growth 1961-62 to 1970-71 3.8% 3.4%
Post Reorgani- sation trend growth 1971-72 to 1980-81 2.7% 3.5%
Post Reorgani- sation trend growth 1971-72 to 1985-86 4.0% 3.8%
Source: Author estimates of annualized growth rates using CSO data.
As the figures show, there is some cause to believe that though Assam may not have gained post its reorganisation, it was not inordinately harmed from the perspective of economic growth.
Note that Assam has suffered inordinately due to various law and order problems throughout the seventies, eighties and even later. These have affected its growth significantly in
Smal
l Sta
tes
- Lar
ge S
tate
s
Source: Author estimates using CSO data

10
Analytique • Vol. VI • No. 4 • January-March 2010
the post-reorganisation years. It would be difficult to correct for the impact of these elements.
It could be argued that the smaller size of the state made it more difficult for the state to garner enough resources and expertise to be able to put together a more robust opposition to the various militant elements. Hence, like the Green Revolution should not be treated as exogenous to the reorganisation of Punjab, the persistence (if not the emergence) of militant elements, it can be argued, should not be treated as independent of the state’s reorganisation in 1971. However, in later sections we argue that the presence and persistence of militancy in larger states, strongly indicates that greater size is not a good enough criteria to judge a states’ ability to counter militancy.
This admittedly is incomplete analysis, as we are unable to estimate growth for the smaller states that constituted
Greater Assam, pre and post reoragization. The available evidence for Assam therefore seems to indicate that though reorganisation may not have boosted economic growth, it did not harm it either on a long term basis. Other factors were more important.
The Reorganisation of 2000 - Uttar Pradesh and Uttarakhand, MP and Chhattisgarh, and Bihar and Jharkhand
The CSO has been able to estimate and put in the public domain NSDP data on the new states formed in 2000 for the period 1993-94 onwards. Separate state incomes have been provided by the CSO from 1993-94 and these have been used to compare the states for a seven year period prior and post reorganisation. Hence the numbers are largely comparable, and though the time periods are not really adequate enough to capture the pre- and post- trends, this is the best that is possible.
Smal
l Sta
tes
- Lar
ge S
tate
s
Figure 3: NSDP Growth Pre and Post Reorganization of Assam
0
200,000
400,000
600,000
800,000
1,000,000
1,200,000
1,400,000
1,600,000
1,800,000
2,000,000
19
60
-61
1961-6
2
19
62-
63
19
63
-64
19
64
-65
19
65
-66
196
6-6
7
19
67
-68
19
68
-69
19
69
-70
197
0-7
1
19
71
-72
19
72
-73
19
73
-74
197
4-7
5
19
75
-76
19
76
-77
19
77
-78
1978-7
9
19
79-
80
19
80
-81
0
10,000,000
20,000,000
30,000,000
40,000,000
50,000,000
60,000,000
70,000,000
Assam GSDP (1999-00 Prices) India GDP (1999-00 Prices)
11
Analytique • Vol. VI • No. 4 • January-March 2010
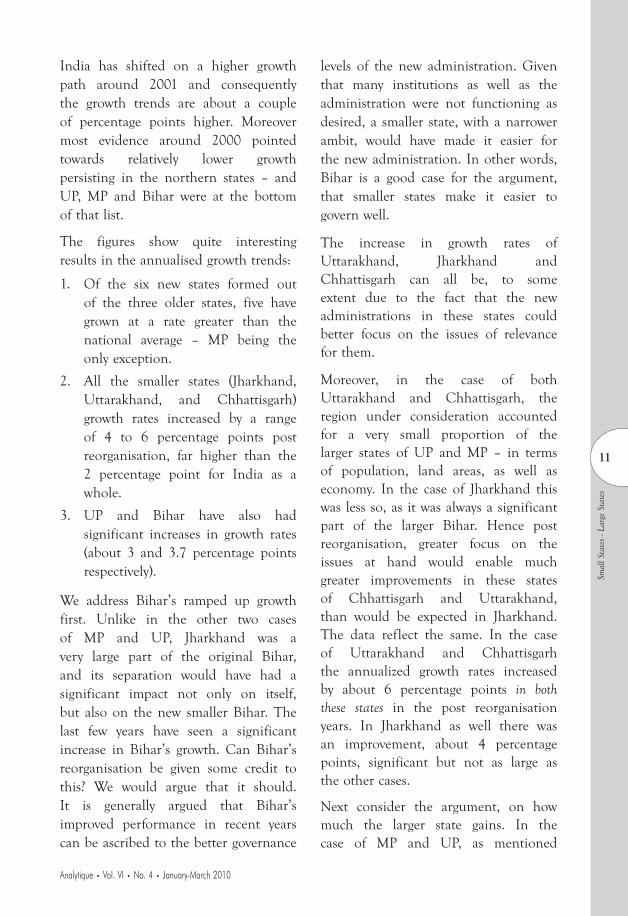
India has shifted on a higher growth path around 2001 and consequently the growth trends are about a couple of percentage points higher. Moreover most evidence around 2000 pointed towards relatively lower growth persisting in the northern states – and UP, MP and Bihar were at the bottom of that list.
The figures show quite interesting results in the annualised growth trends:
1. Of the six new states formed out of the three older states, five have grown at a rate greater than the national average – MP being the only exception.
2. All the smaller states (Jharkhand, Uttarakhand, and Chhattisgarh) growth rates increased by a range of 4 to 6 percentage points post reorganisation, far higher than the 2 percentage point for India as a whole.
3. UP and Bihar have also had significant increases in growth rates (about 3 and 3.7 percentage points respectively).
We address Bihar’s ramped up growth first. Unlike in the other two cases of MP and UP, Jharkhand was a very large part of the original Bihar, and its separation would have had a significant impact not only on itself, but also on the new smaller Bihar. The last few years have seen a significant increase in Bihar’s growth. Can Bihar’s reorganisation be given some credit to this? We would argue that it should. It is generally argued that Bihar’s improved performance in recent years can be ascribed to the better governance
levels of the new administration. Given that many institutions as well as the administration were not functioning as desired, a smaller state, with a narrower ambit, would have made it easier for the new administration. In other words, Bihar is a good case for the argument, that smaller states make it easier to govern well.
The increase in growth rates of Uttarakhand, Jharkhand and Chhattisgarh can all be, to some extent due to the fact that the new administrations in these states could better focus on the issues of relevance for them.
Moreover, in the case of both Uttarakhand and Chhattisgarh, the region under consideration accounted for a very small proportion of the larger states of UP and MP – in terms of population, land areas, as well as economy. In the case of Jharkhand this was less so, as it was always a significant part of the larger Bihar. Hence post reorganisation, greater focus on the issues at hand would enable much greater improvements in these states of Chhattisgarh and Uttarakhand, than would be expected in Jharkhand. The data reflect the same. In the case of Uttarakhand and Chhattisgarh the annualized growth rates increased by about 6 percentage points in both these states in the post reorganisation years. In Jharkhand as well there was an improvement, about 4 percentage points, significant but not as large as the other cases.
Next consider the argument, on how much the larger state gains. In the case of MP and UP, as mentioned
Smal
l Sta
tes
- Lar
ge S
tate
s

12
Analytique • Vol. VI • No. 4 • January-March 2010
earlier, the broken off states were a small proportion of the total. The benefits would therefore be limited. Not surprisingly, UP’s increase in growth was by a magnitude of 1.9 percentage points – about similar to that observed nationally. In the case of MP however, the growth rates have further fallen – a result that is likely due to other factors, and not so much the break-up.
Table 3: Annualized Trend Growth pre and post Reorganisation of 2000
1993-94 to 2001-02 to Percent Point2000-01 2008-09 Change post
re-organi- sation
India 6.2% 8.1% +2.0%UP 3.9% 5.8% +1.9%
Uttarakhand 3.1% 9.0% +5.9%
UP + Uttarakhand 3.8% 6.1% +2.2%
MP 5.1% 4.7% - 0.4%
Chhattisgarh 1.6% 7.9% +6.3%
MP + Chhattisgarh 4.1% 5.6% +1.5%
Bihar 4.8% 8.5% +3.7%
Jharkhand 4.6% 8.7% +4.1%
Bihar + Jharkhand 4.8% 8.6% +3.8%
From the limited data that is available, therefore we can postulate that when states break up, the smaller regions have the capability to work on their strengths and correct their weaknesses in a more efficient and cohesive manner towards higher growth. At the same time smaller states may also be more susceptible to other forces that can cause systemic disruptions.
We find that among all the cases studied, there is no evidence to suggest that breaking a state into smaller states has a directly harmful impact on the economy. The exception being the
possibility of MP. We pursue the matter further by studying the experiences of the districts that form the border between Chhattisgarh and the new MP in the next section.
The Case of MP - District Analysis
Most states in India do not provide district level income data. Indicus has been estimating district wise GDP using a method quite similar to that recommended by the CSO to the states. Broadly this requires us to estimate output and/or value added at the district level using a range of public data sources and then calibrating the result with the state level GSDP published and updated by the CSO.9
The same methodology and data sources are used every year to ensure comparability of results across time.
We begin by examining the per capita income levels at two points in time - 2001-02, the year following the state reorganisation, and at 2007-08, the latest year for which estimates are available. Districts that lie on the border of the parent and new states are compared with each other – this is to analyse whether the governance has made any difference in districts that are adjacent to each other and are likely to have some similarities. The hypothesis to be checked is whether districts across the borders started out with similar levels of development and took different growth trajectories due to different governance modes.
At a preliminary level, looking at per capita income, we find a clear
Smal
l Sta
tes
- Lar
ge S
tate
s

13
Analytique • Vol. VI • No. 4 • January-March 2010
Conclusion
We find evidence that the reorganisation of states in the past has been followed by higher economic growth. Moreover we find that states that have been a small part or on the periphery of a larger entity gain much more, than states that were significant parts of the larger states. We also argue that exogenous shocks (whether positive – like the Green Revolution, or negative – such as militancy), have a differential impact on smaller states than larger ones.
However, whether all of India’s large states should be broken into smaller entities requires much more analysis – on socio-economic performance, on governance, on the ability of the new states to access relevant human capital, on their ability to ensure that democratic and governance institutions can withstand forces that would like to take-over the functioning of the states.
But provided these issues are addressed, purely economic considerations would favour the creation of smaller entities.
Increasingly it is being argued that smaller states are less likely to be able to deal with the ever-growing threat of militancy. The examples of Punjab, Assam and north-east, Jharkhand and Chhattisgarh provide some evidence supporting this argument. However, there have been significant and sustained militancy movements in other larger states as well – J&K, West Bengal, Andhra are some, but not the only examples. Hence we do not see the threat of militancy as a convincing
case supporting our hypothesis in Chattisgarh - Madhya Pradesh, where bordering districts began with similar levels of per capita income, but the districts in Chhattisgarh soared way ahead of those across the border in Madhya Pradesh.
Table 4: District-level growth in border states of MP and Chhattisgarh
2001-02 2001-02 2007-08 to
2007-08
Per capita Per capita AnnualisedDDP DDP growth in
(1999-00 (1999-00 per capitaprices) prices) DDP over
the period
Madhya Pradesh Border Districts: Balaghat Dindori Shahdol Sidhi 10,322 10,721 0.6%
Chhattisgarh Border Districts: Bilaspur Kawardha Koriya Rajnandgaon 10,541 17,145 8.4%
Source: District Domestic Product of India, 2007-08. Figures are provisional.
Why might this have occurred? Chhattisgarh immediately in its post creation years went in for significant reforms. Privatization of poorly-functional PSEs, closing down of non-functional entities within the government, an emphasis on public-private partnerships, and perhaps the most important, significant road building activity are some examples. This contributed in part to the initial surge of investments and resultant economic growth. In other words, the problem of MP is a larger problem of poor governance and not so much due to its reorganisation.
Smal
l Sta
tes
- Lar
ge S
tate
s
14
Analytique • Vol. VI • No. 4 • January-March 2010
enough reason to oppose the creation of smaller states.
Overall therefore, the case for smaller states is building up, both empirically and politically. This however is not sufficient to break-up large states into an ever-growing number of smaller states. The way forward therefore needs to be on two fronts.
First, on a long term basis, we need to strengthen democratic institutions and other governance mechanisms at the regional level. Deepening of civil society in various parts of India (and not just at the state level) needs to be a policy objective. Second, a smoother system that is more responsive to the demands of sub-state ambitions needs to be built. This system needs to take into consideration a certain minimum and maximum population size, the issue of resource availability and resource sharing, agro-climatic homogeneity and most important the wishes of the people within the region for achieving state-hood. This need not be considered as a one time action, rather, as and if demands for statehood grow a set of factors should be studied, before state-hood is granted.
Overall, the one major consistent result we obtain, whether on a short or long term basis, is that no new state has seen a complete unravelling of institutions or growth post re-organization. That should be sufficient enough evidence to not blindly oppose the formation of smaller states, but to promote them on a case by case basis.
Notes
[This was initially a part of a larger piece of work that has been cannibalized in view of the recent political developments. We accept all errors and would welcome comments. The underlying data sheets used for the analysis can be accessed by those who are interested. We would like to thank Meenakshi Chakraborty for her research assistance.]
1 Mayawati’s support for the dismemberment of UP into Poorvanchal (Eastern UP), Harit Pradesh or Pashchimanchal (Western UP), and Bundelkhand (Southern UP) can be traced to Ambedkar’s strong views on the matter.
2 Language was the predominant criteria for the State Reorganisation Commission, but not the only one – economy, population, synergies between different regions, all played some role.
3 The 1960 Bombay Reorganisation Act that created the states of Maharashtra and Gujarat have not been included in our analysis due to paucity of data from the pre-reorganisation period. Our analysis therefore begins from the mid-sixties.
4 Our data-set can be accessed as a separate MS Excel file.
5 For Punjab, Haryana and Himachal Pradesh, data is available to some extent from the Punjab and Himachal Pradesh Statistical Abstracts from 1950-51. However, there are missing values in the series, which were intrapolated using other sources e.g Himachal Pradesh series for 1960s was created using the 3% growth rate for the period 1961-1974 given by the Planning Department, Government of Himachal Pradesh.
6 Trend growth is less susceptible to the end-point problem, and is estimated using the logest command in MS Excel.
7 The Green Revolution in Uttar Pradesh was and has remained restricted to the western districts and is not sufficient to yield higher growth rates for the state as a whole. Again, if details of the district incomes of the state had been available for these years, it would have made for more illuminating analysis.
8 And here as well there is some amount of ambiguity of what the data covers. Assam NSDP series is generally available only from 1971 onwards. However we found one table
Smal
l Sta
tes
- Lar
ge S
tate
s

15
Analytique • Vol. VI • No. 4 • January-March 2010
in www.indiastat.com that shows the NSDP for Assam for the years 1961, 1965 and 1971 but it was not clear which Planning Commission document it was sourced from. More importantly, it was not clear whether the NSDP figure was only for the state of new Assam or for greater Assam. We however utilize the growth figures and would welcome corrections and additions to the data.
9 See www.indicus.net for details on the methodology.
Appendix States Reorganisation since 1950
The Constitution of India, which went into effect on January 26, 1950, made India a sovereign, democratic republic, and a union of states (replacing provinces) and territories. The states would have extensive autonomy and complete democracy in the Union, while the Union territories would be administered by the Government of India. The constitution of 1950 distinguished between three types of states.
Part A states, which were the former governors’ provinces of British India, were ruled by an elected governor and state legislature. The nine Part A states were Assam, West Bengal, Bihar, Bombay, Madhya Pradesh (formerly Central Provinces and Berar), Madras, Orissa, Punjab, and Uttar Pradesh (formerly United Provinces).
The eight Part B states were former princely states or groups of princely states, governed by a rajpramukh, who was often a former prince, along with an elected legislature. The rajpramukh was appointed by the President of India. The Part B states were Hyderabad, Saurashtra, Mysore, Travancore-Cochin, Madhya Bharat, Vindhya Pradesh,
Smal
l Sta
tes
- Lar
ge S
tate
s
Patiala and East Punjab States Union (PEPSU), and Rajasthan.
The ten (nine according to ambedkar.org) Part C states included both the former chief commissioners’ provinces and princely states, and were governed by a chief commissioner. The chief commissioner was appointed by the President of India. The Part C states included Delhi, Kutch, Himachal Pradesh, Bilaspur, Coorg, Bhopal, Manipur, Ajmer-Merwara, and Tripura.
Jammu and Kashmir had special status until 1957. The Andaman and Nicobar Islands was established as a union territory, ruled by a lieutenant governor appointed by the central government.
Source: http://en.wikipedia.org/wiki/States_Reorganisation_Act
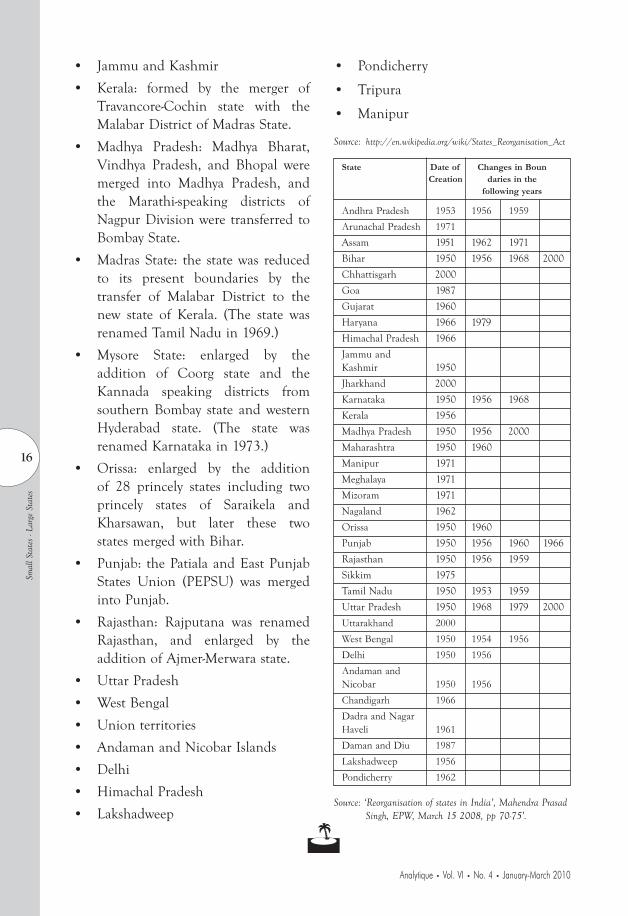
On November 1, 1956, India was divided into the following states and union territories:
States:
• Andhra Pradesh: Andhra wasrenamed Andhra Pradesh, and enlarged by the addition of the Telangana region of erstwhile Hyderabad State.
• Assam
• Bihar
• Bombay State: the state was enlarged by the addition of Saurashtra and Kutch, the Marathi-speaking districts of Nagpur Division of Madhya Pradesh, and the Marathwada region of Hyderabad. The southernmost districts of Bombay were transferred to Mysore State. (In 1960, the state was split into the modern states of Maharashtra and Gujarat.)
16
Analytique • Vol. VI • No. 4 • January-March 2010
Smal
l Sta
tes
- Lar
ge S
tate
s
• Jammu and Kashmir
• Kerala: formed by the merger of Travancore-Cochin state with the Malabar District of Madras State.
• Madhya Pradesh: Madhya Bharat, Vindhya Pradesh, and Bhopal were merged into Madhya Pradesh, and the Marathi-speaking districts of Nagpur Division were transferred to Bombay State.
• Madras State: the state was reduced to its present boundaries by the transfer of Malabar District to the new state of Kerala. (The state was renamed Tamil Nadu in 1969.)
• Mysore State: enlarged by the addition of Coorg state and the Kannada speaking districts from southern Bombay state and western Hyderabad state. (The state was renamed Karnataka in 1973.)
• Orissa: enlarged by the addition of 28 princely states including two princely states of Saraikela and Kharsawan, but later these two states merged with Bihar.
• Punjab: the Patiala and East Punjab States Union (PEPSU) was merged into Punjab.
• Rajasthan: Rajputana was renamed Rajasthan, and enlarged by the addition of Ajmer-Merwara state.
• Uttar Pradesh
• West Bengal
• Union territories
• Andaman and Nicobar Islands
• Delhi
• Himachal Pradesh
• Lakshadweep
• Pondicherry
• Tripura
• Manipur
Source: http://en.wikipedia.org/wiki/States_Reorganisation_Act
State Date of Changes in BounCreation daries in the
following years
Andhra Pradesh 1953 1956 1959Arunachal Pradesh 1971Assam 1951 1962 1971
Bihar 1950 1956 1968 2000
Chhattisgarh 2000
Goa 1987
Gujarat 1960
Haryana 1966 1979
Himachal Pradesh 1966
Jammu and Kashmir 1950
Jharkhand 2000
Karnataka 1950 1956 1968
Kerala 1956
Madhya Pradesh 1950 1956 2000
Maharashtra 1950 1960
Manipur 1971
Meghalaya 1971
Mizoram 1971
Nagaland 1962
Orissa 1950 1960
Punjab 1950 1956 1960 1966
Rajasthan 1950 1956 1959
Sikkim 1975
Tamil Nadu 1950 1953 1959
Uttar Pradesh 1950 1968 1979 2000
Uttarakhand 2000West Bengal 1950 1954 1956Delhi 1950 1956Andaman and Nicobar 1950 1956Chandigarh 1966Dadra and Nagar Haveli 1961Daman and Diu 1987Lakshadweep 1956Pondicherry 1962
Source: ‘Reorganisation of states in India’, Mahendra Prasad Singh, EPW, March 15 2008, pp 70-75’.
J

17
Analytique • Vol. VI • No. 4 • January-March 2010
I ndia and the Global Productivity Race
Sumit K. Majumdar
Indi
a an
d th
e G
loba
l Pro
duct
ivity
Rac
e
India can be justly proud of her growth story, and there is no absolutely no doubt that the income of her residents have risen substantially over the course of the last two decades. Especially in the last ten years several mega-fortunes have been made. Some have never had it so good! Yet, there are many millions who still struggle on as if nothing had ever happened.
Also, has the quality of life improved in a substantially meaningful and substantive way? If money incomes have risen, in several cases over ten times, with real incomes also rising, the physical quality of life has perhaps improved only marginally. The same infrastructure, the same organizations and the same set of administrative processes remain to serve a burgeoning population with rising incomes. To put it mildly, India is an extremely inefficient country.
Why sing a song about efficiency? Efficiency means discipline and hard work. That is so boring! Yet, productivity is the key to economic performance and resource utilization the ultimate measure of success. Productivity drives growth. If resources from economic activities are not
properly utilized, then further resources are simply unavailable to make further investments and future growth has to be based on continuous borrowings.
If India does become a nation of substantial borrowing, and every indication shows this to be the case, the likely consequences are catastrophic as the current United States malaise reveals. Growth without productivity is growth without sustainability.
That rising productivity levels is the principal growth driver is the lesson from all of economic history. The economic history of mankind is a history of productivity driven growth. The great nations of the world reached a pre-eminent position only because of being efficient in utilizing resources.
The massive growth spurts that Britain experienced in the first half of the 19th
century, that Germany and the United States experienced in the second half of the 19th century, that Japan experienced from the 1950s onwards, that South Korea is experiencing from the 1970s, and that China is experiencing from the 1980s have been driven by rising productivity levels.
* Sumit K. Majumdar ([email protected]) is Professor of Techonology Strategy, School of Management, University of Texas at Dallas, USA.

18
Analytique • Vol. VI • No. 4 • January-March 2010
Figure 1: Global Comparative Productive Efficiency from 1978 to 2001:
How Does India Compare?
0.11
0.320.37
0.47
0.66 0.680.73
0.77 0.77 0.79 0.79 0.800.84
0.89 0.90 0.90
0.000.05
0.100.150.20
0.250.300.35
0.400.450.50
0.550.60
0.650.700.75
0.800.850.90
0.951.00
IND
IA
KO
RE
A
AU
ST
RA
LIA
ITA
LY
FIN
LA
ND
SW
ED
EN
BR
ITA
IN
FR
AN
CE
BE
LG
IUM
CA
NA
DA
SP
AIN
AU
ST
RIA
NE
TH
ER
LA
ND
S
NO
RW
AY
US
A
GE
RM
AN
Y
Countries
Eff
icie
nc
yP
ara
me
ter
Indi
a an
d th
e G
loba
l Pro
duct
ivity
Rac
e
These countries leapfrogged all other nations in their performance. Thereafter, they charged ahead in their abilities to increase the incomes of their residents while simultaneously enhancing the quality of their residents’ lives.
How does India fare? My research compared India’s productivity relative to that of OECD countries, such as the United States, the United Kingdom, Germany, France, Netherlands and Spain. I evaluated the manufacturing sector, which accounts for a substantial portion of India’s GDP.
I used data from the International Monetary Fund (IMF), the Organization for Economic Cooperation and Development (OECD) and the Reserve Bank of India (RBI). These data were suitably translated into real terms and to an appropriate exchange rate. Thus, comparability between countries has been achieved.
In comparison to the OECD countries, India’s industrial productivity, as evaluated, is just one-eighth of the overall productivity levels of those countries. Other sectors in India, such as agriculture, education, infrastructure and services are no different and are likely to be worse in comparison.
The figure below tells the whole story. Countries are ranked from the lowest to highest productivity parameter on the X scale, read from left to right. The productivity measure is an average for the several years, measured on a scale of 0 to 1. No guesses are, I am sure, necessary as to where India’s position is!
How may Indian performance compare over the time period as a whole. Is there enhancement of the productivity parameter or is there stagnation? Relative to Commonwealth sisters, Australia, Britain and Canada, India compares no better.

19
Analytique • Vol. VI • No. 4 • January-March 2010
Indi
a an
d th
e G
loba
l Pro
duct
ivity
Rac
e
Again Figure 2 tells the story. India is not relatively badly off, in manner of speaking, relative to her latest nemesis: Australia. Compared to her North American commonwealth sister, Canada, or her European commonwealth sister, United Kingdom, Indian manufacturing productivity is simply appallingly low.
If one compares India to the newly emerged economic powerhouses, such as South Korea and Finland, the picture is no different. These new economies started on their journey of economic development and industrialization only in the 1960s and the 1970s, decades after India started hers in 1947. India’s productivity is just a fourth to a thirdof the productivity of these countries.
Also, it is best to keep in mind that countries such as Finland and South
Korea have made mind-bogglingly substantial quantities of investments in their human capital, in education, knowledge, individual and corporate capabilities. They will be the economic powerhouses of tomorrow, controlling the contours of technology-driven growth, as well as the conversation on corporate and economic policy.
India, on the education, knowledge, individual and corporate capability development front, stands absolutely nowhere. The investments that the Indian state and the Indian corporate sector make are just a drop in the ocean.
Almost all nations, of the twenty three that I analyzed for an overall period of thirty plus years, I am just showing the findings from 1978 onwards, also experienced rising levels of productivity

20
Analytique • Vol. VI • No. 4 • January-March 2010
Indi
a an
d th
e G
loba
l Pro
duct
ivity
Rac
e
over time. As countries have caught up with each other, there are many instances of countries charging ahead because of leapfrogging. But, India is simply lagging.
India’s comparative productivity growth during the overall period was stagnant. Other than a small rising blip just after the 1991 liberalization, by 1994 India’s productivity levels had fallen back and had settled back at the levels that they had been in the past!
The implications are absolutely frightful. As other countries have become more efficient, India has stagnated and the gap between India and the OECD countries is steadily increasing. Hence, while quantitatively India may
have grown in output generation, in qualitative terms the benefits of this growth has been absolutely non-existent.
Both government and business are singularly culpable for this state of affairs, as it is ultimately the firms that use the resources to generate the output within a framework defined by government.
India has experienced extensive growth but not intensive growth. As outputs have risen, inputs have risen equally fast to match the additional resource needed to generate the additional outputs. This phenomenon has simply left no resources to be re-invested for the future. Growth without productivity is hollow. It is growth without sustainability.

21
Analytique • Vol. VI • No. 4 • January-March 2010
Indi
a an
d th
e G
loba
l Pro
duct
ivity
Rac
e
J
As all other countries march ahead, with their productivity levels consistently rising, India remains desperately trying to catch up. The possibilities of India leapfrogging and charging ahead, leading the global pack, are simply a theoretical dream or a set of delusional ideas divorced from reality. They are based on an absence of facts, insights and genuine knowledge of what matters, and, most palpably, on an ignorance of history.
India is undergoing an economic transformation, accompanied by a social revolution along multiple dimensions, but the key institutional and organizational transformations needed, that influence productivity growth, have been completely trivial, inadequate or non-existent. Yet, if these transformations are not forthcoming, India will be condemned to be the laggard in the world’s economic and social league tables.

22
Analytique • Vol. VI • No. 4 • January-March 2010
G ST -- A Revolutionary Tax orVAT Plus ?S.M. Kulkarni
GST
-- A
Rev
olut
iona
ry T
ax o
r VA
T P
lus
?C
urre
nt A
ffai
rs
The indirect taxes presently levied by both the Centre and the States have their own limitations. The Excise Duty has rates and exemption issues while Service Tax has Cenvat credit and refund issues. There is neither a separate law for Service Tax nor any definition of services. These taxes levied by the Central Government are not comfortably settled so far. Similarly, the Value Added Tax (VAT) and the Central Sales Tax (CST) levied by the State Governments have their own issues. There are still multiple rates. All the states are freely deviating from the decided uniform rates and there is no legal restriction on such deviations. Many exemptions still exist. Procedures differ from state to state. The main hurdle for smooth flow of credit is the CST. The CST is always a cost as no credit is available against CST paid by the interstate buyer and the main concern of the industry is always the CST declaration forms.
In this background of present indirect taxes levied by the Centre and the States, news flashed all over that a Revolutionary Indirect Tax System would soon be introduced by the Central and the State Governments which would take care of all the
problems currently faced by industry. The industry was excited and happy. This new tax, called Goods & Services Tax (GST) is a dual tax system, uniformly levied by both the Centre and the States. The key features of the proposed GST system were announced as under:
• Commonthresholdlimits.
• Single rate of tax, common to theCentre & States.
• Veryfewexemptions.
• Novel IGST system for interstatesupply of goods & services.
• Simple, uniform procedures forregistrations.
• Nodeviationsby the stateson ratesof GST.
With these key features, the industry was excited and happy as its long term demand was met. As days passed, every week news started appearing in the media on the implementation of GST, the discussions between the Empowered Committee (EC) of State Finance Ministers and the Central Government, various decisions taken and so on.
As months passed by, many issues emerged where there has been no consensus. The richer states and the
* S.M. Kulkarni ([email protected]) is Vice President, Corporate Sales Tax Department of Mahindra and Mahindra Limited and Group Companies.

23
Analytique • Vol. VI • No. 4 • January-March 2010
GST
-- A
Rev
olut
iona
ry T
ax o
r VA
T P
lus
?
poorer states are in disagreement on various issues with no matching on various issues between the Centre and the States. The first discussion paper made by the Empowered Committee (EC) covering mainly the SGST came out with specific decisions but the report published by the Central Revenue Department was not in agreement with the decisions made by the EC. It appears that Centre is working only for Central GST (CGST) and the EC (States) is working for State GST (SGST), without any common thought and common working.
The industry is worried at this juncture as on all the major areas, there are different views taken by the Centre and the States. The industry can very well make out from the news items that this news is coming from the Centre and the other is from the EC. This causes confusion as no combined decisions on proposed GST are published by the Centre and the EC. This may lead to a VAT Plus Regime and not a new revolutionary tax regime, thus continuing with the old problems faced by industry.
I would like to support my statement with the following arguments:
• Common Threshold Limits: In the initial reports, it was mentioned that there would be common, threshold limits under CGST and SGST for registration of the dealers / companies. But now the Centre and the EC are differing on this point. One says 1.5 crores for CGST, 10 lakhs for SGST and no decision on threshold for Services; the other says common
threshold limit under both CGST and the SGST including same for the Services. The industry needs common thresholds both under CGST and SGST including the same for the Services. If the thresholds turn out to be different, then it would be VAT plus!
• Single Rate of GST: The initial reports said that there would be a single rate of GST which was good news for industry as that was a long pending demand. Now, the Central Government Report says there should be a single rate of GST but the EC declared in the first discussion paper that the present VAT Rates would continue in the new GST Regime also. The Rates in GST would also comprise the lower rate (at present, 4%) and the higher rate (at present 12.5%) while the exceptional rate of 1% would continue for precious goods. If two rates of GST is continued to be imposed then it is again a case of VAT plus!
• Very Few Exemptions: In the initial reports, it was contended that there would be very few exemptions under the proposed GST regime. However, latest reports mention that the exemptions under VAT laws would continue to exist in the new GST laws also. This would lead to lobbying by industry as all of them would like their products to be taxed at the lower rate than the general higher rate. This would again distort the economy. Whether industry likes it or not, there should be very few exemptions, based on social criterion only. If the large

24
Analytique • Vol. VI • No. 4 • January-March 2010
GST
-- A
Rev
olut
iona
ry T
ax o
r VA
T P
lus
?
list of exemptions continue in the proposed GST regime also, then again it would be VAT plus!
• Novel IGST System for interstate supply of goods & services: The first discussion paper of the EC came out with a novel concept of IGST i.e. Integrated GST applicable to interstate supply of goods & services with full credit available against input IGST paid. IGST would be handled by the Central Government with the help of the Central Agency (clearing house). The companies will have to make net payment to the supplying state only and this Central Agency would monitor the transfer of funds from the supplying state to the consuming state as the GST is a destination based consumption tax. This IGST model suits the industry. The industry welcomed the same but now the model and mechanism thereof is yet to be decided. The EC is now considering only SGST to be the part of IGST and CGST would not be part of it. This would lead to the similar scenario under the present CST laws namely full CST on interstate sales of goods (may be called as IGST under new regime) including on interstate depot / branch transfers of goods. The final model of IGST should be simplified, easy to operate and common under both CGST and SGST. Otherwise, it would again be a case of levy of full CST. A case of VAT plus again!
• Simple procedures of Registrations under CGST & SGST: Initially, it was stated by the Centre and
States that there would be a very simple procedure of Registration under GST laws. The smaller companies / dealers would have a Single Window Clearance under GST. Such companies can apply only to the concerned State GST authorities for both the Registrations under CGST & SGST. However, there is no further news on this even in the first discussion paper published by the EC. It again points to a VAT plus situation in this area also!
• No deviations by the States on Rates of SGST: It was mentioned in the first discussion paper released by the Empowered Committee (EC) that there would be relevant amendments to the Constitution of India in order to provide for the restrictions on the States with regards to rates of SGST. A specific body of the Centre & the EC was to be formed which would be empowered by the Constitution of India to restrict States from deviations from the SGST rates. This is a major concern for the industry since recently most of the States have deviated from the decided uniform rates under VAT by increasing the rates of VAT. Till date, no specific and comprehensive decision has been taken on this serious issue by the Centre and the EC. In India, under the Federal system, the States have jurisdiction over “tax on sales of goods”. The states are not ready to forego such empowerment. Therefore, it is a critical task before the Centre and the EC to resolve this issue of restrictions on the

25
Analytique • Vol. VI • No. 4 • January-March 2010
GST
-- A
Rev
olut
iona
ry T
ax o
r VA
T P
lus
?
States under GST. Industry would not accept the new GST system without such amendments to the Constitution of India which would restrict States to deviate from the decided rates of SGST. Otherwise, this would be a very clear case of VAT plus regime!
In the light of the above observations, it is clear that at this juncture, the Centre and the States (EC) are not talking about a new hassle free indirect tax system i.e. Goods & Services Tax (GST) but a system which is VAT Plus!
The Centre and the EC should sit together at the earliest to resolve these issues. The industry expects a combined discussion paper on the new GST and not separate dictates issued by them. So far nothing has been released on levying of SGST / IGST on local and interstate supply of services including taxation on “Works Contracts and Lease transactions”. This would also be a very critical area for industry since the States do not have any past experience of levying Service Tax. If not handled properly
from the initial stages, it would lead to much litigation.
The date of implementation of the GST is also an issue. The industry wants GST to be implemented from 1st April i.e. from the first day of the new financial year and not from the middle of the year. The Budget Speech of the Hon’ble Finance Minister, Mr. Pranab Mukherjee has brought clarity in this regard by announcing April 1, 2011 as the target date.
Both the Centre and the States should work together at a faster speed so that the new GST does not end up as “ VAT Plus” and perpetuate similar concerns for industry that have been present in the VAT Regime. Also, industry should be given a minimum six month period for preparation after the draft Act & Rules are released.
Industry is hopeful that both the Central Government and the Empowered Committee of State Finance Ministers would not hurry to implement the new Goods and Services Tax, without duly considering the industry concerns outlined above.
J
26
Analytique • Vol. VI • No. 4 • January-March 2010
Introduction
It is agreed that the performance of five basic components of the Indian economy, GDP growth, inflation, the external sector, financial sector and fiscal situation all confirm that the recovery is consolidating. For example, data on industrial production currently available up to January 2010 show that the uptrend is being maintained. The manufacturing sector, in particular, has recorded robust growth. The sharp acceleration in the growth of the capital goods sector points to the revival of investment activity. After contracting for 13 straight months, exports have expanded since November 2009. That the recovery is gaining momentum is also evident from the sustained increase in bank credit and the resources raised by the commercial sector from non-bank sources. Even as this is happening against the backdrop of improving global conditions, recent real GDP and industrial production clearly suggest that the positive trend is predominantly due to domestic factors (RBI on Monetary policy measures, February, 2010).
On the inflation front, it has been stated that the inflationary pressures have accentuated and have been spilling over to the wider inflationary process. The recent industrial production data suggest revival of private demand, which
could potentially add to inflationary pressures further. Year-on-year WPI non-food manufacturing products (weight: 52.2 per cent) inflation, which was negative (-0.4 per cent) in November 2009, turned marginally positive (0.7 per cent) in December 2009 and rose sharply thereafter to 2.8 per cent in January 2010 and further to 4.3 per cent in February 2010. Year-on-year fuel price inflation also surged from (-)0.8 per cent in November 2009 to 5.9 per cent in December 2009, to 6.9 per cent in January 2010 and further to 10.2 per cent in February 2010. Headline WPI inflation on a year-on-year basis at 9.9 per cent in February 2010 indicates, with rising demand side pressures, there is risk that WPI inflation may cross double digit in recent future. Moreover, even as food prices are showing signs of moderation, they remain elevated. More importantly, the rate of increase in the prices of non-food manufactured goods has accelerated quite sharply. Furthermore, increasing capacity utilization and rising commodity and energy prices are exerting pressure on overall inflation. Taken together, these factors heighten the risks of supply-side pressures translating into a generalized inflationary process.
The RBI’s Third Quarter Review had mentioned that in the emergent scenario, low policy rates can complicate the inflation outlook and impair
Qua
rter
ly O
verv
iew
Curr
ent E
cono
mic
Scen
ario
Q uarterly Overview

27
Analytique • Vol. VI • No. 4 • January-March 2010
inflationary expectations, particularly given the recent escalation in the prices of non-food manufactured goods. At the macro level, besides the industrial and overall recovery in growth, the overall business confidence has improved significantly. While capital inflows have resumed after the period of net outflows in the second half of 2008-09, there is a perception that India may experience surges in capital inflows again, because of easy global liquidity conditions and superior growth prospects of India in the global economy.
In general, on the credit flows one can say on the one hand bank credit itself is not moving very fast asserting the fact that the credit growth is certainly below what is expected from the GDP figures, on the other hand, bank credit has become less important in the overall flow of funds as other channels are opening up. However, in view of the increased availability of funds from domestic, non-bank and external sources the adjusted non-food credit growth projection for 2009-10 is now reduced to 16 per cent. Based on this projected credit growth and the remaining very marginal market borrowing of the government, the broad money growth has been estimated as of 16.5% as on January 15,2010.The deposit growth of scheduled commercial banks are projected to grow by 17% for the coming fiscal (Third Quarter Review of Monetary Policy 2009-10,RBI).
On the Policy Measures
On the global front, headline inflation in major advanced economies during the
first two quarter of 2009-10 remained negative on account of the significant contraction in demand. The sharp fall in global commodity prices (fuel, metals and food) during the second half of 2008-09 worked its way to the consumer prices in advanced economies, exerting further downward pressure on inflation. Since September 2009, CPI inflation in most advanced economies recorded increases, yet remained significantly moderate. Most advanced economies, except Japan, registered positive CPI inflation in December 2009 (Table 1).The recent increase in inflation in the advanced economies is attributable to the base effect of sharp decline in consumer prices registered a year ago and the recent increases in commodity prices. Producer Price Index(PPI) inflation declined sharply both in the advanced as well as emerging market economies (EMEs). PPI inflation in the OECD countries continued to remain negative(-1.0 per cent in November, 2009).Inflation risks may be more in emerging economies, where output gaps are smaller and the recovery may be stronger. Most Central Banks in the advanced economies kept their policy rates unchanged at near zero levels to facilitate the recovery of their economies from recession or significant slowdown in growth. Policy rates in advanced economies such as the US and Japan, which had reached near zero levels in 2008 were left unchanged during 2009.Policy rate acts were affected by Central Banks in other advanced economies such as the U.K, and Canada between March-May, 2009, with no subsequent changes. As inflationary pressures started to emerge, the Reserve Bank of
Qua
rter
ly O
verv
iew
28
Analytique • Vol. VI • No. 4 • January-March 2010
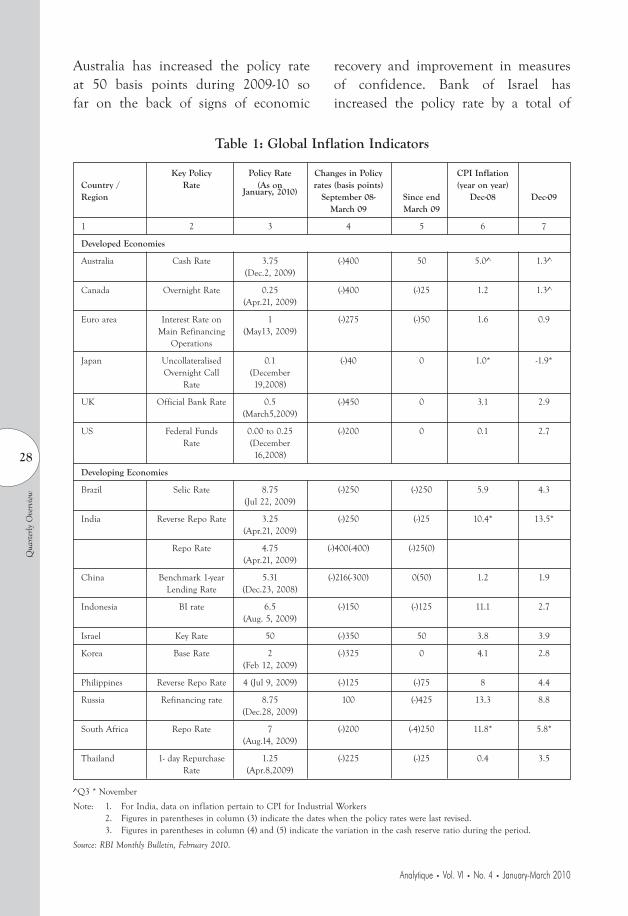
Table 1: Global Inflation Indicators
Key Policy Policy Rate Changes in Policy CPI Inflation Country / Rate (As on rates (basis points) (year on year)Region January, 2010) September 08- Since end Dec-08 Dec-09
March 09 March 09
1 2 3 4 5 6 7
Developed Economies
Australia Cash Rate 3.75 (-)400 50 5.0^ 1.3^ (Dec.2, 2009)
Canada Overnight Rate 0.25 (-)400 (-)25 1.2 1.3^ (Apr.21, 2009)
Euro area Interest Rate on 1 (-)275 (-)50 1.6 0.9 Main Refinancing (May13, 2009)
Operations
Japan Uncollateralised 0.1 (-)40 0 1.0* -1.9* Overnight Call (December
Rate 19,2008)
UK Official Bank Rate 0.5 (-)450 0 3.1 2.9 (March5,2009)
US Federal Funds 0.00 to 0.25 (-)200 0 0.1 2.7 Rate (December
16,2008)
Developing Economies
Brazil Selic Rate 8.75 (-)250 (-)250 5.9 4.3 (Jul 22, 2009)
India Reverse Repo Rate 3.25 (-)250 (-)25 10.4* 13.5* (Apr.21, 2009)
Repo Rate 4.75 (-)400(-400) (-)25(0) (Apr.21, 2009)
China Benchmark 1-year 5.31 (-)216(-300) 0(50) 1.2 1.9 Lending Rate (Dec.23, 2008)
Indonesia BI rate 6.5 (-)150 (-)125 11.1 2.7 (Aug. 5, 2009)
Israel Key Rate 50 (-)350 50 3.8 3.9
Korea Base Rate 2 (-)325 0 4.1 2.8 (Feb 12, 2009)
Philippines Reverse Repo Rate 4 (Jul 9, 2009) (-)125 (-)75 8 4.4
Russia Refinancing rate 8.75 100 (-)425 13.3 8.8 (Dec.28, 2009)
South Africa Repo Rate 7 (-)200 (-4)250 11.8* 5.8* (Aug.14, 2009)
Thailand 1- day Repurchase 1.25 (-)225 (-)25 0.4 3.5 Rate (Apr.8,2009)
^Q3 * November
Note: 1. For India, data on inflation pertain to CPI for Industrial Workers2. Figures in parentheses in column (3) indicate the dates when the policy rates were last revised.3. Figures in parentheses in column (4) and (5) indicate the variation in the cash reserve ratio during the period.
Source: RBI Monthly Bulletin, February 2010.
Australia has increased the policy rate at 50 basis points during 2009-10 so far on the back of signs of economic
recovery and improvement in measures of confidence. Bank of Israel has increased the policy rate by a total of
Qua
rter
ly O
verv
iew

29
Analytique • Vol. VI • No. 4 • January-March 2010
75 basis points since September 2009. Among the other major Central Banks, Peoples Bank of China raised the reserve requirement ratio by 50 basis points with effect from 18 January, 2010 while Bank of Russia reduced the policy rate by a total of 125 basis points during the third quarter of 2009-10(World Economic Update, IMF, January 26, 2010).
On the domestic front, the negative WPI inflation number in June 2009 was due to the statistical base effect and was not indicative of a contraction of demand. It also observed that the sharp decline in WPI had not brought about a commensurate decline in inflationary expectations. During October 2009 the upside risk of deficient monsoon projected earlier had materialized. It exacerbated the price pressures in primary food items and manufactured food products. Although both inflation episodes were driven by supply side pressures, the inflation in 2008 was triggered largely by a sharp increase in the prices of basic metals and minerals oil. In the current episode, however, price pressures are from domestic sources and concentrated on food articles and food products. The current phase of inflation in India is driven by increases in prices of a few commodities, sugar, oil cakes, food grains, eggs, meat and fish and drugs and medicines, which have a combined weight of 14.8 per cent in overall WPI, explain a significant part of the inflation during the recent months. In terms of contribution to overall inflation by the major groups, primary articles group continues to drive the overall WPI inflation, besides the manufactured food products. The
contribution of non- food manufactured products group has also started to increase in recent months. The contribution of the fuel group, which was significantly negative since January 2009, showed a reversal of trend in recent months and now contributes positively to overall inflation. The inflation risk looms larger when viewed in the context of global price movements. Going by the available estimates the global rates of increase in the prices of sugar, cereals and edible oils are now appreciably higher than domestic rates (Table 2).
Table 2: Key Commodity Prices- Global vis-a-vis Domestic
Item Annual Inflation Recent Trends (y-o-y, December 2009
December 2009) over March 2009
Global India Global India
Rice 11.1 12.3 0.5 7.5
Wheat -6.3 12 -10.7 10.5
Raw Cotton 38.3 4.9 48.9 16.5
Oilseeds 25.3 6.7 19 8.2
Iron Ore -28.2 -8.6 -28.2 -18.8
Coal mining 4.3 0 34.4 0
Minerals oil 81.1 6.3 60.5 10.4
Edible Oils 57.3 -2.2 32.3 0.7
Oil Cakes 33.7 56.9 16.6 16.3
Sugar 96.1 54 72 37.5
Basic Metals, 44.5 -7.3 54.9 0.7 Alloys and Products#
Iron and Steel -27.6 -9.5 -19.7 0.8
# Represented by IMF metals price index, which covers copper, aluminium, iron ore, tin, nickel, zinc, lead and uranium.
Note: Global price increases are based on the World Bank and IMF primary commodity prices data.
At present in India, at the macro level, different indicators namely the Wholesale Price Index (WPI), Consumer Price Index and the GDP
Qua
rter
ly O
verv
iew

30
Analytique • Vol. VI • No. 4 • January-March 2010
deflator are used for measuring inflation. It goes without saying that WPI and CPI are specific in their coverage and the weighting diagrams, with the result that neither of them reflects price variations for the entire economy and are restrictive measures. Exploring the inflation dynamics following a purely statistical approach has limitations as it does not capture the behavioral structure of the economy. The measure of inflation used in the Economic Survey released by the Ministry of Finance is the percentage difference between moving averages of the price index over the latest 12 months when compared with the identical value of a year ago. As a thumb-rule, in the present environment, inflation of roughly 3% is considered acceptable and inflation of 6% and above is considered an alarming high inflation episode.
Table 3: Salient Features of the Price Indices
Sl. Features CPI- CPI-IW CPI-AL No. UNME
1 Weights allocated on First First First the basis of Consumer 1956-59, 1950-54, 1956-57, Eependiture survey Latest Latest Latest
1982-83 2001 1983
2 Base year for current 1984-85 2001 1986-87 Series
3 No of Items/ 146-365 120-160 260 Commodities in the Basket
4 No of Centres/ 59 76 600 Villages
5 Time lag of the Index 2 weeks 1 month 3 weeks
6 Frequency Monthly Monthly Monthly
Note: The above-mentioned indices are being compiled in terms of general standards and guidelines set by International Labour Organisation (ILO) for all the member countries. The CPI-UNME is compiled and released by the Central Statistical Organisation (CSO) and the rest are compiled by Labour Bureau, Ministry of Labour.
Source: Economic Survey 2008-09, Government of India, New Delhi.
As is seen from Table 3, CPI numbers presently compiled relate to different base years and cater to specific segments of the population. Again, the procedures for compilation of price indices do not systematically incorporate new products and adjust for quality improvements. This means that indices do not reflect a true picture of the price behavior and effect of price fluctuations of various goods and services consumed by the population over a period of time (National Statistical Commission, 2001).
In December 1996, a study on CPI conducted in US by an advisory commission, argues that this measure is biased and overstated. One element of the bias has been described as ‘substitution bias’. It asserts the fact that as time passes some prices rise more than others. The CPI, however, assumes that the market basket that households buy does not change. As a result the economies that households obtain by substituting cheaper items for more expensive ones are not captured by the index, which, as a result, shows more inflation than households actually suffer. The second bias occurs as CPI ignores price changes which occur when customers switch between outlets. Third and the most difficult parts of price level measurement are how to handle changes in the quality of goods and services and how to deal with completely new items. Even if the quantities of goods and services that households purchased remained the same over time, a bias would remain if their quality changed.
In India, CPI-IW measures the cost of living for a fixed basket representing
Qua
rter
ly O
verv
iew
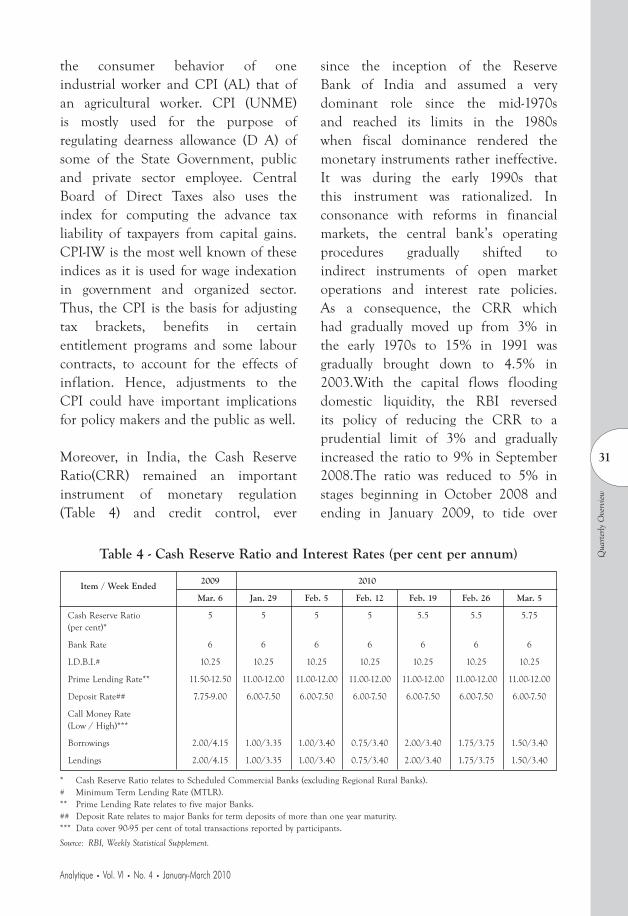
31
Analytique • Vol. VI • No. 4 • January-March 2010
the consumer behavior of one industrial worker and CPI (AL) that of an agricultural worker. CPI (UNME) is mostly used for the purpose of regulating dearness allowance (D A) of some of the State Government, public and private sector employee. Central Board of Direct Taxes also uses the index for computing the advance tax liability of taxpayers from capital gains. CPI-IW is the most well known of these indices as it is used for wage indexation in government and organized sector. Thus, the CPI is the basis for adjusting tax brackets, benefits in certain entitlement programs and some labour contracts, to account for the effects of inflation. Hence, adjustments to the CPI could have important implications for policy makers and the public as well.
Moreover, in India, the Cash Reserve Ratio(CRR) remained an important instrument of monetary regulation (Table 4) and credit control, ever
since the inception of the Reserve Bank of India and assumed a very dominant role since the mid-1970s and reached its limits in the 1980s when fiscal dominance rendered the monetary instruments rather ineffective. It was during the early 1990s that this instrument was rationalized. In consonance with reforms in financial markets, the central bank’s operating procedures gradually shifted to indirect instruments of open market operations and interest rate policies. As a consequence, the CRR which had gradually moved up from 3% in the early 1970s to 15% in 1991 was gradually brought down to 4.5% in 2003.With the capital flows flooding domestic liquidity, the RBI reversed its policy of reducing the CRR to a prudential limit of 3% and gradually increased the ratio to 9% in September 2008.The ratio was reduced to 5% in stages beginning in October 2008 and ending in January 2009, to tide over
Table 4 - Cash Reserve Ratio and Interest Rates (per cent per annum)
Item / Week Ended 2009 2010
Mar. 6 Jan. 29 Feb. 5 Feb. 12 Feb. 19 Feb. 26 Mar. 5
Cash Reserve Ratio 5 5 5 5 5.5 5.5 5.75 (per cent)*
Bank Rate 6 6 6 6 6 6 6
I.D.B.I.# 10.25 10.25 10.25 10.25 10.25 10.25 10.25
Prime Lending Rate** 11.50-12.50 11.00-12.00 11.00-12.00 11.00-12.00 11.00-12.00 11.00-12.00 11.00-12.00
Deposit Rate## 7.75-9.00 6.00-7.50 6.00-7.50 6.00-7.50 6.00-7.50 6.00-7.50 6.00-7.50
Call Money Rate (Low / High)***
Borrowings 2.00/4.15 1.00/3.35 1.00/3.40 0.75/3.40 2.00/3.40 1.75/3.75 1.50/3.40
Lendings 2.00/4.15 1.00/3.35 1.00/3.40 0.75/3.40 2.00/3.40 1.75/3.75 1.50/3.40
* Cash Reserve Ratio relates to Scheduled Commercial Banks (excluding Regional Rural Banks).# Minimum Term Lending Rate (MTLR).** Prime Lending Rate relates to five major Banks.## Deposit Rate relates to major Banks for term deposits of more than one year maturity.*** Data cover 90-95 per cent of total transactions reported by participants.
Source: RBI, Weekly Statistical Supplement.
Qua
rter
ly O
verv
iew
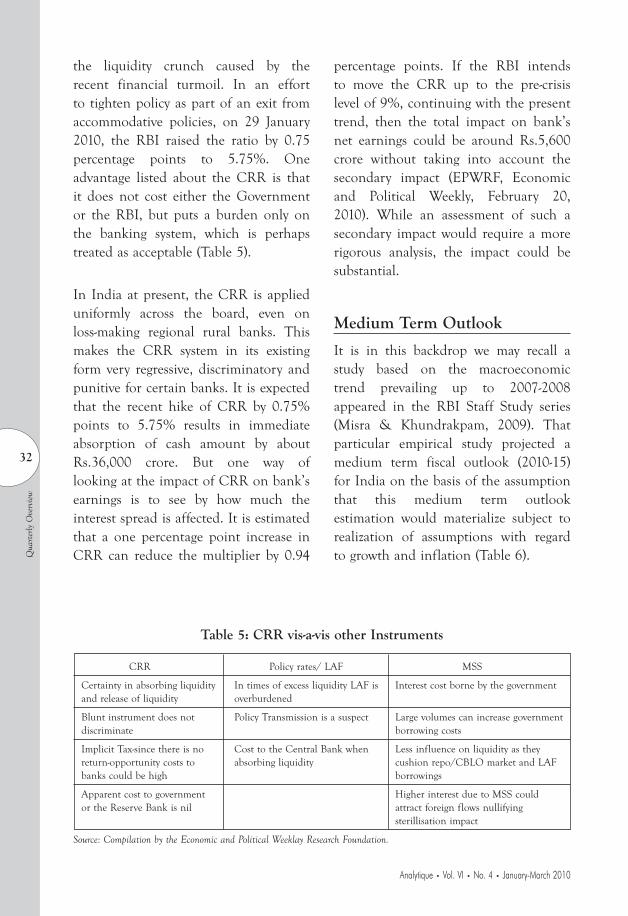
32
Analytique • Vol. VI • No. 4 • January-March 2010
the liquidity crunch caused by the recent financial turmoil. In an effort to tighten policy as part of an exit from accommodative policies, on 29 January 2010, the RBI raised the ratio by 0.75 percentage points to 5.75%. One advantage listed about the CRR is that it does not cost either the Government or the RBI, but puts a burden only on the banking system, which is perhaps treated as acceptable (Table 5).
In India at present, the CRR is applied uniformly across the board, even on loss-making regional rural banks. This makes the CRR system in its existing form very regressive, discriminatory and punitive for certain banks. It is expected that the recent hike of CRR by 0.75% points to 5.75% results in immediate absorption of cash amount by about Rs.36,000 crore. But one way of looking at the impact of CRR on bank’s earnings is to see by how much the interest spread is affected. It is estimated that a one percentage point increase in CRR can reduce the multiplier by 0.94
percentage points. If the RBI intends to move the CRR up to the pre-crisis level of 9%, continuing with the present trend, then the total impact on bank’s net earnings could be around Rs.5,600 crore without taking into account the secondary impact (EPWRF, Economic and Political Weekly, February 20, 2010). While an assessment of such a secondary impact would require a more rigorous analysis, the impact could be substantial.
Medium Term Outlook
It is in this backdrop we may recall a study based on the macroeconomic trend prevailing up to 2007-2008 appeared in the RBI Staff Study series (Misra & Khundrakpam, 2009). That particular empirical study projected a medium term fiscal outlook (2010-15) for India on the basis of the assumption that this medium term outlook estimation would materialize subject to realization of assumptions with regard to growth and inflation (Table 6).
Table 5: CRR vis-a-vis other Instruments
CRR Policy rates/ LAF MSS
Certainty in absorbing liquidity In times of excess liquidity LAF is Interest cost borne by the government and release of liquidity overburdened
Blunt instrument does not Policy Transmission is a suspect Large volumes can increase government discriminate borrowing costs
Implicit Tax-since there is no Cost to the Central Bank when Less influence on liquidity as they return-opportunity costs to absorbing liquidity cushion repo/CBLO market and LAF banks could be high borrowings
Apparent cost to government Higher interest due to MSS could or the Reserve Bank is nil attract foreign flows nullifying sterillisation impact
Source: Compilation by the Economic and Political Weeklay Research Foundation.
Qua
rter
ly O
verv
iew

33
Analytique • Vol. VI • No. 4 • January-March 2010
Table 6: Medium Term Outlook of Central Government: Gross Fiscal Deficit (GFD) under Alternative Baseline Scenario*
(Per cent to GDP)
Fiscal Indicators 2010-11 2011-12 2012-13 2013-14 2014-15 2010-15 average
1 2 3 4 5 6 7
I. Gross Tax Revenue 13.75 14.17 14.62 15.1 15.6 14.65
a Income Tax 2.79 2.88 2.98 3.08 3.19 2.99
b Corporate Tax 4.88 5.23 5.6 6.01 6.44 5.63
c Exercise Duty 2.52 2.45 2.39 2.33 2.27 2.39
d Customs Duty 2.28 2.3 2.32 2.33 2.34 2.31
e Other Tax 1.28 1.31 1.33 1.35 1.37 1.33
II. Share of State in Central Taxes 3.64 3.76 3.87 4 4.14 3.88
III. Net Tax Revenue (I-II) 10.11 10.42 10.74 11.09 11.47 10.77
IV. Non-Tax Revenue 1.98 1.97 1.97 1.96 1.95 1.97
V. Revenue Receipts 12.08 12.39 12.71 13.06 13.42 12.73
VI. Revenue Expenditure 13.04 13.18 13.31 13.44 13.57 13.31
a Interest Payments 3.74 3.76 3.78 3.81 3.85 3.79
b Non-Interest Revenue 9.3 9.42 9.53 9.63 9.73 9.52 Expenditure
c Grants to states 2.33 2.35 2.38 2.41 2.43 2.38
VII. Revenue Deficit 0.95 0.79 0.6 0.38 0.15 0.58
VIII. Capital Expenditure 1.55 1.71 1.9 2.12 2.35 1.92
IX. Gross Fiscal Deficit 2.5 2.5 2.5 2.5 2.5 2.5
X. Debt 63.91 64.3 64.8 65.41 66.14 64.91
XI. Interest Payments to Revenue 30.92 30.33 29.75 29.19 28.66 29.77 Receipts
Note: * Assumptions: GFD = 2.5% of GDP, Growth rate 8% and Inflation rate 4%.
Source: Fiscal Consolidation by Central and State Governments: The Medium Term Outlook, B.M. Misra and J.K. Khundrakpam, RBI Staff Study, Department of Economic Analysis and Policy, 2009.
ConclusionVarious current surveys on Indian economy confirm that the recovery in growth has proceeded broadly along expected lines, but the inflationary pressures have intensified which appears a source of growing concern. This is at par with the Union Budget 2010’s forecast on the economic growth. Which has been also optimistic about the economy’s movement towards stabilization, but did not rule out the
possibility of the downside risks of the growth and the upside risks to inflation. Available data confirms the fiscal correction both at the Centre and States has been significant during the current phase of fiscal reform but the fiscal consolidation has been inadequate at least in terms of qualitative expenditure management, for example, achievement of sustainable level of debt GDP ratio and the moderate level of fiscal deficit to mention a few.
Qua
rter
ly O
verv
iew
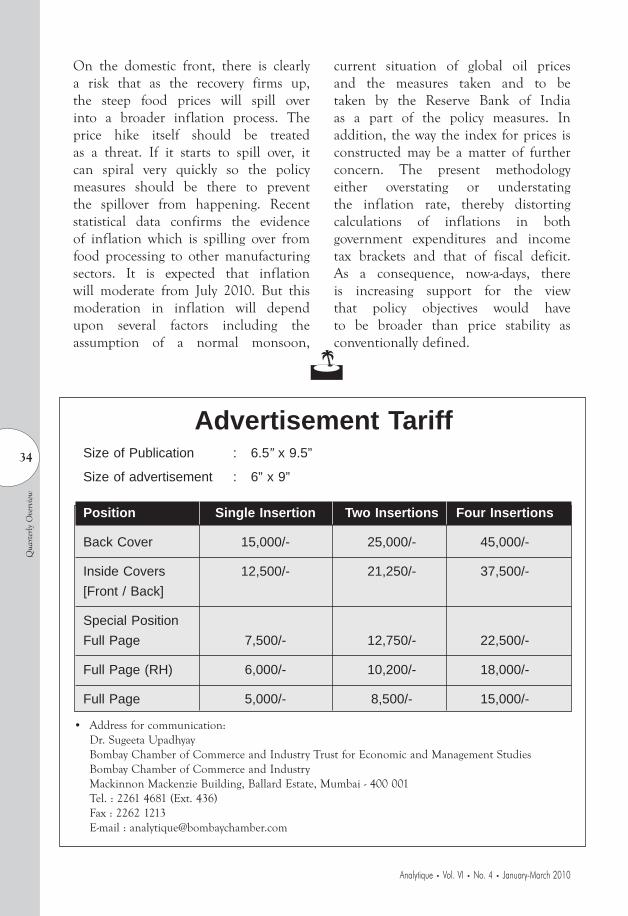
34
Analytique • Vol. VI • No. 4 • January-March 2010
On the domestic front, there is clearly a risk that as the recovery firms up, the steep food prices will spill over into a broader inflation process. The price hike itself should be treated as a threat. If it starts to spill over, it can spiral very quickly so the policy measures should be there to prevent the spillover from happening. Recent statistical data confirms the evidence of inflation which is spilling over from food processing to other manufacturing sectors. It is expected that inflation will moderate from July 2010. But this moderation in inflation will depend upon several factors including the assumption of a normal monsoon,
current situation of global oil prices and the measures taken and to be taken by the Reserve Bank of India as a part of the policy measures. In addition, the way the index for prices is constructed may be a matter of further concern. The present methodology either overstating or understating the inflation rate, thereby distorting calculations of inflations in both government expenditures and income tax brackets and that of fiscal deficit. As a consequence, now-a-days, there is increasing support for the view that policy objectives would have to be broader than price stability as conventionally defined.
J
Qua
rter
ly O
verv
iew
Advertisement TariffSize of Publication : 6.5” x 9.5”
Size of advertisement : 6” x 9”
Position Single Insertion Two Insertions Four Insertions
Back Cover 15,000/- 25,000/- 45,000/-
Inside Covers 12,500/- 21,250/- 37,500/- [Front / Back]
Special PositionFull Page 7,500/- 12,750/- 22,500/-
Full Page (RH) 6,000/- 10,200/- 18,000/-
Full Page 5,000/- 8,500/- 15,000/-
• Addressforcommunication: Dr. Sugeeta Upadhyay
Bombay Chamber of Commerce and Industry Trust for Economic and Management Studies Bombay Chamber of Commerce and Industry Mackinnon Mackenzie Building, Ballard Estate, Mumbai - 400 001 Tel. : 2261 4681 (Ext. 436) Fax : 2262 1213 E-mail : [email protected]

35
Analytique • Vol. VI • No. 4 • January-March 2010
Q3 of Q2 of Q1 of Q3 of Q2 of Q1 of 2009-10 2009-10 2009-10 2008-09 2008-09 2008-09
Gross Domestic Product at Constant (2004-05) Prices
GDP at factor cost (Rs. Crore) 1158764 1048985 1040091 1093167 971982 979838
GDP at 2004-05 market prices (Rs. Crore) 1228201 1129182 1105641 1159298 1057115 1042528
Growth Rate (Per cent)
GDP at factor cost 6 7.9 6.1 6.2 7.5 7.6
GDP at 2004-05 market prices 100 100 100 100 100 100
Private Final Consumption Expenditure 59.8 57 56.8 60.3 56.9 57.4
Government final consumption expenditure 12.5 11.1 11.2 14.1 9.2 10.3
Gross Fixed capital formation 31.7 34.1 31.7 31.6 34.8 32.7
Change in Stocks 0.7 0.7 1.3 1.3 1.4 1.4
Valuables 0.9 1 1.2 1.5 1.4 1.1
Exports 19.8 20.6 21.1 21.9 26.1 25.6
Less Imports 24.4 29.1 26.6 28.4 33.9 30.1
Discrepancies -1 4.7 3.1 -2.2 4 1.5
Source: Central Statistical Organisation, Government of India
Sector-wise Growth Rate at 2004-05 constant prices (per cent)
Agriculture
Agriculture, forestry & fishing -2.8 0.9 2.4 -1.4 2.4 3.2
Industry
Mining & Quarrying 9.6 9.5 7.9 2.8 1.6 2.6
Manufacturing 14.3 9.2 3.4 1.3 5.5 5.9
Electricity, gas & water supply 4.9 7.4 6.2 4 4.3 3.3
Services
Construction 8.7 6.5 7.1 3 8 7.1
Trade, hostels, transport & communication 10 8.5 8.1 4.4 10 10.8
Financing, institutions, real estates & 7.8 7.7 8.1 10.2 8.5 9.1
Business services
Community, social & Personal services -2.2 12.7 6.8 28.7 10.4 8.7
Source: Central Statistical Organisation, Government of India
Performance of Core Industries
Sector-wise Growth Rate (%) in Production
(Weight in IIP : 26.68%)
Overall Index 5.4 4.76 4.42 1.28 3.77 4.49
Crude Oil Production 0.87 1.16 -1.27 0 -1.48 -0.14
Petroleum Refinery Products -4.2 -2.93 4.27
Coal 3.98 9.65 12.65 10.51 7.52 25.39
Electricity 4.9 7.57 6.06 2.87 3.17 1.96
Cement Production 8.47 12.64 12.12 8.84 5.17 1.1
Compilation by the Bombay Chamber of Commerce and Industry Trust: Source of Data Ministries/Departments/Organisation(s)
S elected Economic Indicators
Sele
cted
Eco
nom
ic I
ndic
ator
s

36
Analytique • Vol. VI • No. 4 • January-March 2010
-2.00
0.00
2.00
4.00
6.00
8.00
10.00
12.00
14.00
16.00
CPI -2008
CPI - 2009
WPI -2008
WPI -2009
Note: The solid lines represent CPI and dotted lines represent WPI. The respective series of CPI & WPI
has been marked with triangular and square markers.
Office of the Economic Advisor, Ministry of CommerceSource:
Point to Point Rate of Growth
INFLATION
Decadal Average
Decades WPI CPI-IW GDP Deflator PFCE Deflator
1971-72 to 1980-81 10.3 8.3 8.8 8.4
1981-82 to 1990-91 7.1 9 8.7 8.3
1991-92 to 2000-01 7.8 8.7 8.1 8.5
2001-02 to 2008-09 5.2 5.3 4.6 4.4
Long-term Trend
1971-72 to 2008-09 7.7 8 7.7 7.6
Source: Reserve Bank of India, Government of India.
Sele
cted
Eco
nom
ic I
ndic
ator
s
Notes for ContributorsGeneral Guidelines• Analytique welcomes original articles or essays on any subject of interest related to
commerce and industry such as the macro economy, industrial performance, etc.
• Contributionsmustbenomore than8,000words, includingnotes and references,accompanied by an abstract of a maximum of 150 words and in MS word. Tables should be in MS Excel format.
• Contributions should be sent perferably by e-mail. All correspondence shall be ine-mail.
• Papers should not have been simultaneously submitted for publication to anotherJournal.
• Writersarerequestedto providefulldetails forcorrespondence:postaladdress,day-time phone numbers and e-mail address for our records. Only author’s affiliation and e-mail address will be published unless otherwise directed.

About Bombay Chamber
The Bombay Chamber of Commerce and Industry is India’s premier Chamber of Commerce and Industry situated in Mumbai, the industrial, financial and commercial capital of India. Established in 1836, it is one of the oldest Chambers in the country and has a long and illustrious history of continuous service to Trade and Industry.
The Chamber can boast not only of its longevity but also of its impeccable lineage. With more than 2000 prime companies as its members, the Chamber represents the cream of Indian Industry, Commerce and Services. While the name `Bombay Chamber’ conjures images of an organization representing exclusively a city-based membership, in reality it represents a wide spectrum of highly reputed and professionally run companies which are based in the city of Mumbai, but whose manufacturing facilities and commercial influence spread not only all over India but also internationally.
It comes as no surprise that the Bombay Chamber’s membership represents as much as a third of the country’s GDP in the manufacturing and services sectors. The Chamber uniquely represents large and medium sized corporations, banking and financial institutions, professional consulting companies and a large number of multinationals.
Bombay Chamber of Commerce and IndustryMackinnon Mackenzie Building, Ballard Estate, Mumbai 400 001
Tel: 2261 4681, Fax: 2262 1213,E-mail: [email protected]: www.bombaychamber.com