Embed Size (px)
Citation preview
SMALL BUSINESS &CUSTOMER RESEARCH
UPDATE
Matthew JamesResearch Manager
Thursday, 7th June 2007

OVERVIEW
• SME Update
• Customer Survey
• Exit Survey
• Churn indicators
• Key relationships

SMALL BUSINESS
TRENDS
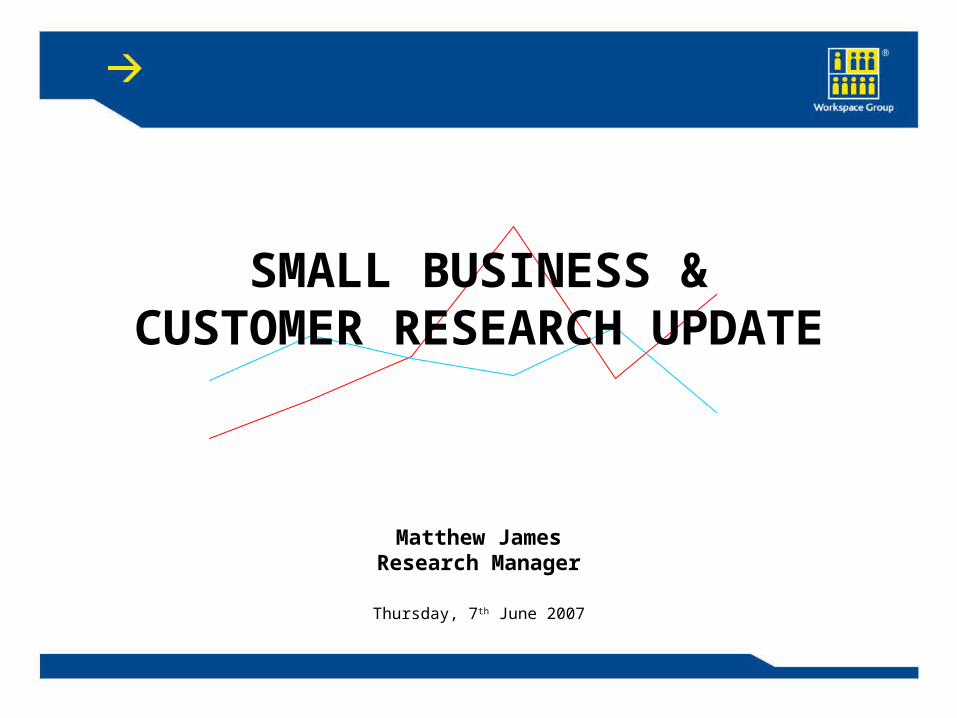
37% OF TOTAL GVA
“London and the South East make a disproportionately heavy contribution
to economic activity. In 2005, these two regions accounted for 37% of the
goods and services (measured by GVA) produced in the country, even
though only 30% of the working age population lived in this area.”
MIX OF BUSINESS ACTIVITY
“However, the economies of London and the South East stand out not only
because of their scale, but also in terms of the mix of business activity.
The industrial composition of output is noticeably different to that found
elsewhere in England & Wales, particularly in the case of London.”
LONDON’S CONTRIBUTION
Source: Barclays Business Customer Economic Focus, Jan 2007
SMALL BUSINESS TRENDS
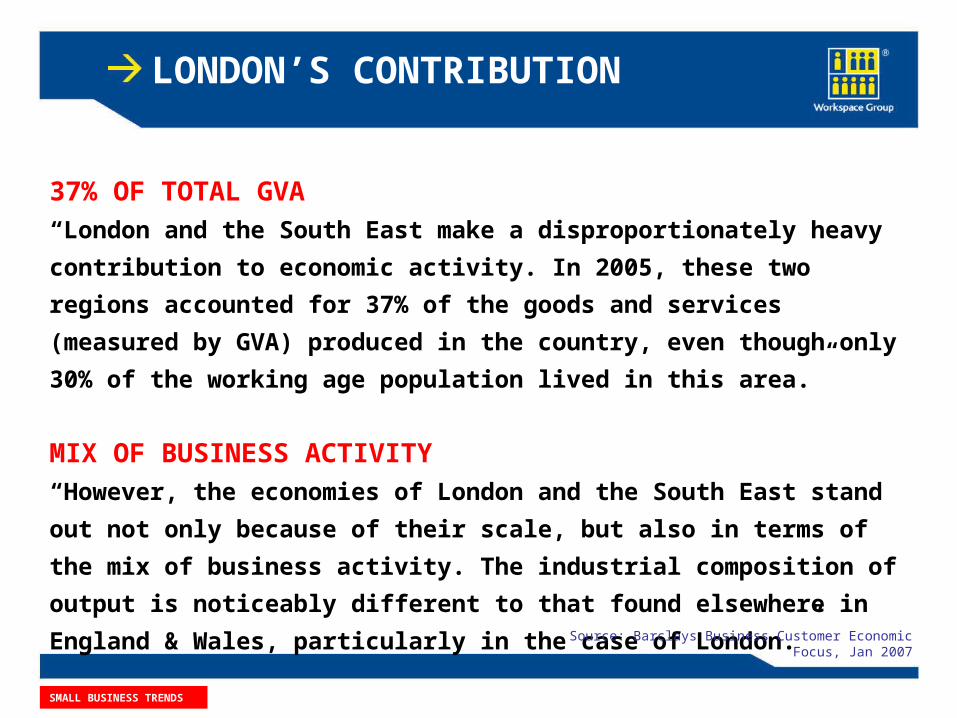
VAT REGISTRATIONS
Source: Regional Competitiveness and State of the Regions, DTI, May 2007NB: Great Britain & Northern Ireland
179,
000
VAT Registrations per 10,000 of the population
60 59 56
0
10
20
30
40
50
60
70
2003 2004 2005
United Kingdom South East London
SMALL BUSINESS TRENDS
N

BUSINESS STARTS
Expecting to start a business in the next 3 years
1615
11
0
2
4
6
8
10
12
14
16
18
2004 2005 2006
United Kingdom South East London
SMALL BUSINESS TRENDS
%
Source: Global Entrepreneurship Monitor, 2006NB: Great Britain & Northern Ireland

REGISTRATIONS & DE-REGISTRATIONS
SMALL BUSINESS TRENDS
%
Source: Regional Competitiveness and State of the Regions, DTI, May 2007NB: Great Britain & Northern Ireland
London: Registrations & De-registrations
33,400
32,955
35,750
35,320
33,915
30,825
32,625
31,760
32,145
30,230
20,000 25,000 30,000 35,000 40,000
2001
2002
2003
2004
2005
Registrations De-registrations
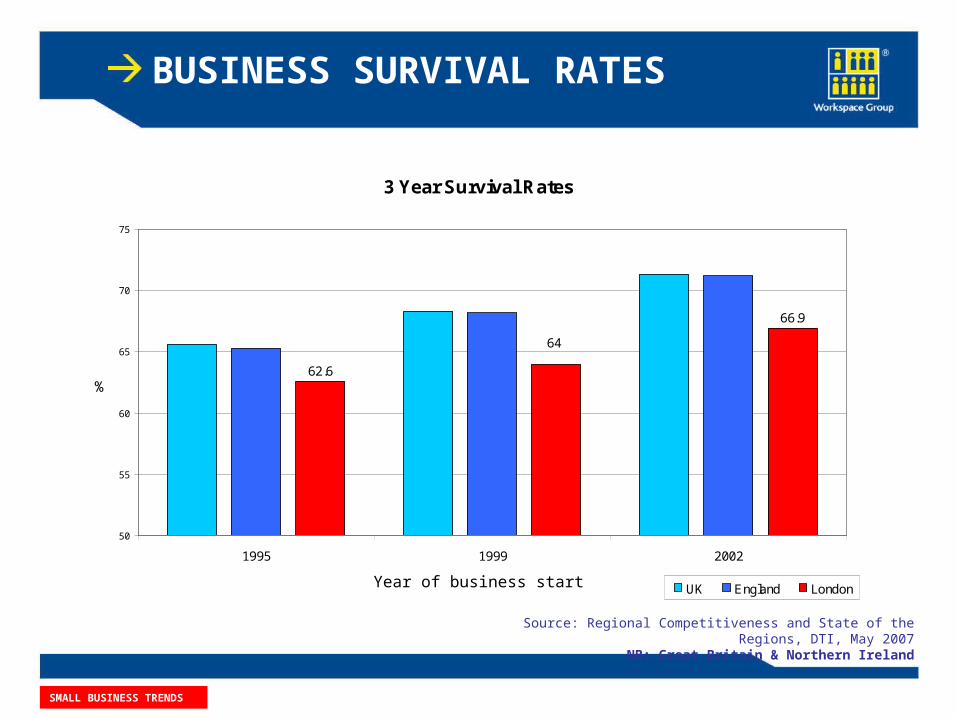
BUSINESS SURVIVAL RATES
SMALL BUSINESS TRENDS
Source: Regional Competitiveness and State of the Regions, DTI, May 2007NB: Great Britain & Northern Ireland
3 Year Survival Rates
62.6
66.9
64
50
55
60
65
70
75
1995 1999 2002
UK England London
%
Year of business start

At end of 2005 – 4.342m
0
0.5
1
1.5
2
2.5
3
3.5
4
4.5
1980 1983 1986 1988 1990 1992 1994 1996 1998 2000 2002 2003 2004 2005
Business Population (m)
Source: Small Business Service, 2006NB: Great Britain & Northern Ireland
EFFECT ON UK BUSINESS STOCK
SMALL BUSINESS TRENDS
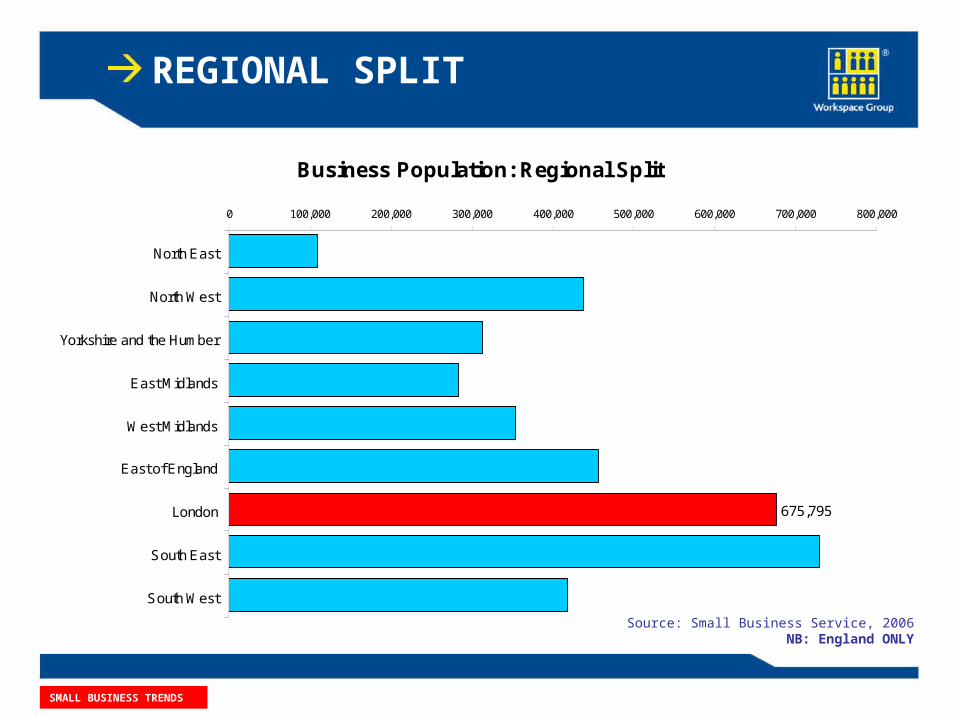
REGIONAL SPLIT
Business Population: Regional Split
675,795
0 100,000 200,000 300,000 400,000 500,000 600,000 700,000 800,000
North East
North West
Yorkshire and the Humber
East Midlands
West Midlands
East of England
London
South East
South West
Source: Small Business Service, 2006NB: England ONLY
SMALL BUSINESS TRENDS
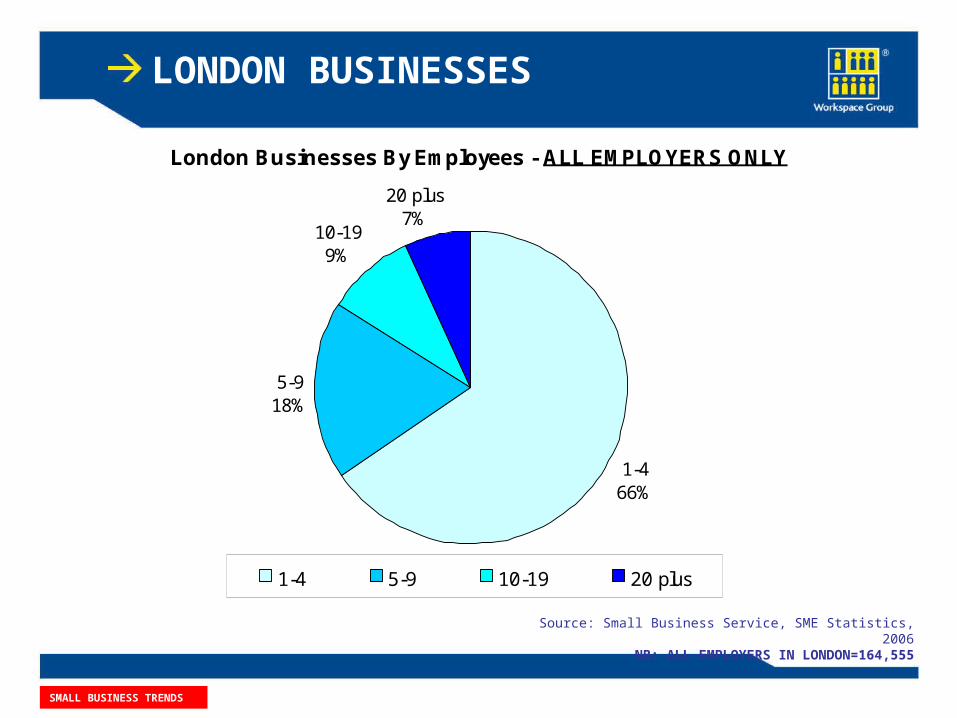
LONDON BUSINESSES
Source: Small Business Service, SME Statistics, 2006NB: ALL EMPLOYERS IN LONDON=164,555
London Businesses By Employees - ALL EMPLOYERS ONLY
1-466%
5-918%
10-199%
20 plus7%
1-4 5-9 10-19 20 plus
SMALL BUSINESS TRENDS
ANNUAL CUSTOMERSATISFACTION SURVEY

CONSIDERATIONS
• What are the key issues & areas for improvement?
• What are the actions?
• What are the key relationships?
• What do customers expect of Workspace? Do we deliver?
• Is there anything we don’t know but should?
CUSTOMER SURVEY

CUSTOMER SURVEY
CUSTOMER SURVEY: AIMS
1. Demographics
2. About business premises
3. Contact & communications
4. Assessment of brand values 5. Business performance
CUSTOMER SURVEY
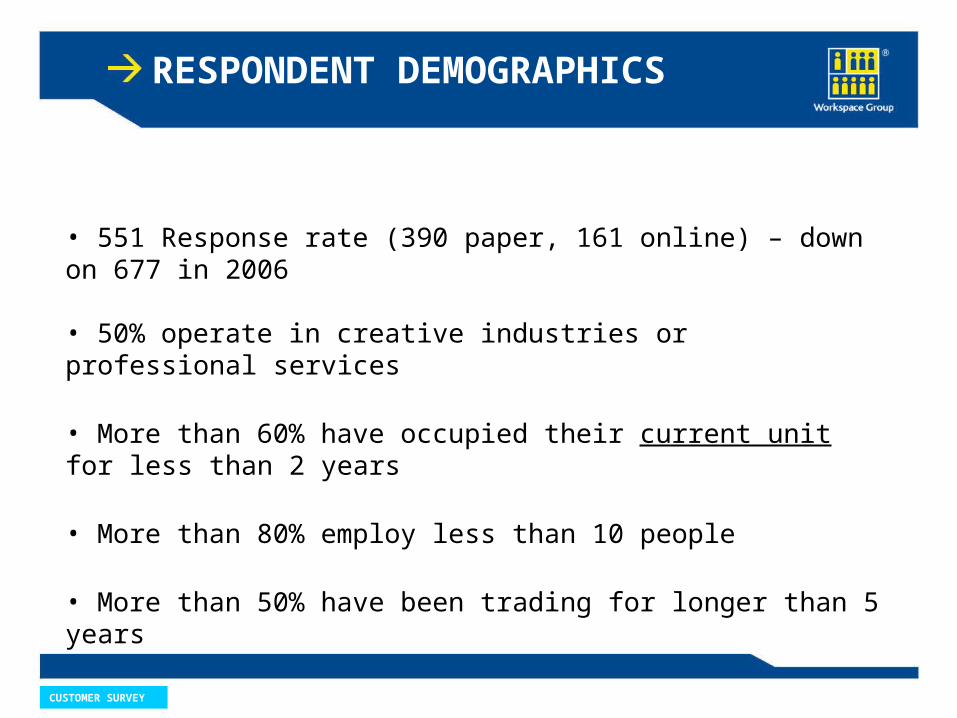
RESPONDENT DEMOGRAPHICS
• 551 Response rate (390 paper, 161 online) – down on 677 in 2006
• 50% operate in creative industries or professional services
• More than 60% have occupied their current unit for less than 2 years
• More than 80% employ less than 10 people
• More than 50% have been trading for longer than 5 years
CUSTOMER SURVEY
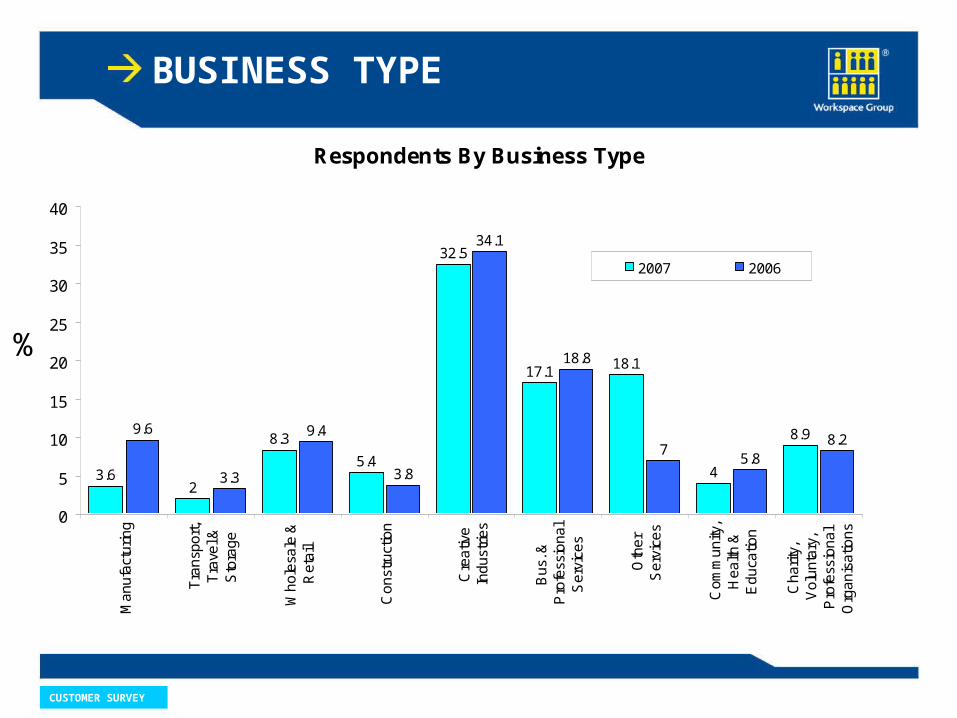
BUSINESS TYPE
Respondents By Business Type
3.62
8.3
5.4
32.5
17.118.1
4
8.99.6
3.3
9.4
3.8
34.1
18.8
75.8
8.2
0
5
10
15
20
25
30
35
40
Ma
nu
fact
uri
ng
Tra
nsp
ort
,T
rave
l &S
tora
ge
Wh
ole
sale
&R
eta
il
Co
nst
ruct
ion
Cre
ativ
eIn
du
stri
es
Bu
s. &
Pro
fess
ion
al
Se
rvic
es
Oth
er
Se
rvic
es
Co
mm
un
ity,
He
alth
&E
du
catio
n
Ch
ari
ty,
Vo
lun
tary
,P
rofe
ssio
na
lO
rga
nis
atio
ns
2007 2006
%

ABOUT YOUR PREMISES
CUSTOMER SURVEY
• Cost & location remain most important factors in taking space
• 87% are satisfied with local service
• “It feels like a personal service - very good & friendly”
• “This is not a criticism of the staff (who are very good) but the standard of lift maintenance is appalling and needs to be addressed.”
• 80% would recommend current business premises
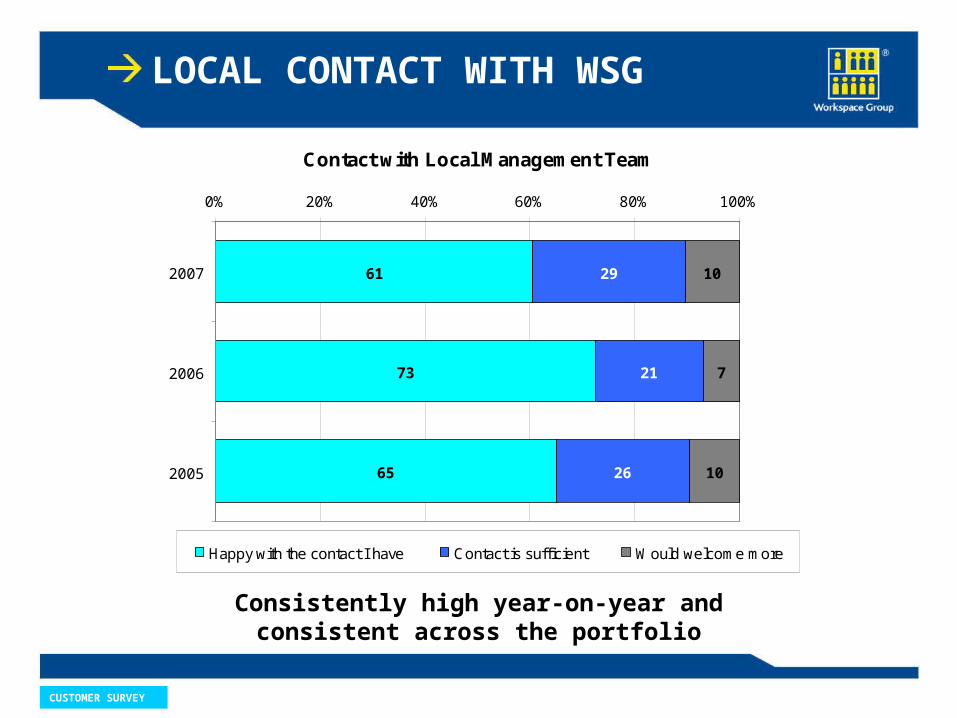
LOCAL CONTACT WITH WSG
CUSTOMER SURVEY
Contact with Local Management Team
61
73
65
29
21
26
10
7
10
0% 20% 40% 60% 80% 100%
2007
2006
2005
Happy with the contact I have Contact is sufficient Would welcome more
Consistently high year-on-year andconsistent across the portfolio

CUSTOMER SURVEY
SERVICE ISSUES
45% had experienced service issues over the last 12 months, but...
94
50
57
64
6
50
43
36
0% 20% 40% 60% 80% 100%
I was able to speak tosomeone at Workspace
regarding my issue
Any service issues havebeen resolved quickly
Any service issues havebeen resolved satisfactorily
The reasons for any actiontaken by Workspace were
fully explained to me
Agree Disagree

WORKSPACE VALUES
CUSTOMER SURVEY
To what extent do you agree with the following...
86
82
74
77
94
90
76
61
87
14
18
26
23
6
11
25
39
13
0% 10% 20% 30% 40% 50% 60% 70% 80% 90%100%
Workspace provides good value for money
Workspace is committed to high standards of service
Workspace builds relationships with its customers
Workspace delivers all I expect from a landlord
Workspace staff are committed, reliable and honest
I feel I am fairly treated by Workspace
I feel I am valued as a customer
Workspace’s offer is about more than just business space
Overall, Workspace offers a competitive package
Agree Disagree

RESPONSIBLE COMPANY
CUSTOMER SURVEY
Workspace as a sustainable & responsible company
82
55
99
18
45
0% 10% 20% 30% 40% 50% 60% 70% 80% 90% 100%
Workspace recognises itsresponsibility to society
I am aware of the actionWorkspace is taking
It is important to me and mybusiness that my landlordbehaves in a responsible
manner
Agree Disagree

SATISFACTION WITH…
CUSTOMER SURVEY
SERVICE
87% are satisfied with the service they receive from Workspace
• “Very quick & efficient – always a friendly voice at the other end of the phone”
COMMUNICATIONS
93% are satisfied with communications from Workspace
• “Newsletter is good - nice to know what's going on. Idea of TradeLink is excellent”.
WORKSPACE AS A LANDLORD
91% are satisfied with Workspace as a landlord
• “The service is fuss free which for small businesses is ideal. We receive a friendly
service from the landlord and its staff. It’s a pleasure to be here.”
82% WOULD RECOMMEND WORKSPACE; 6% WOULD NOT

CUSTOMERBUSINESS OUTLOOK
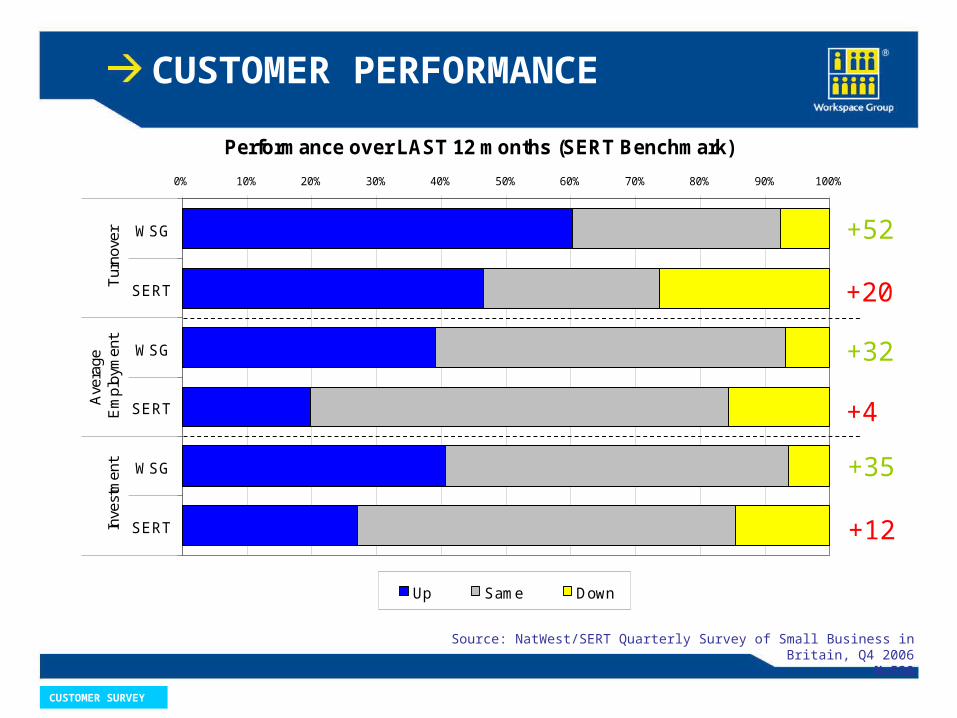
Performance over LAST 12 months (SERT Benchmark)
0% 10% 20% 30% 40% 50% 60% 70% 80% 90% 100%
WSG
SERT
WSG
SERT
WSG
SERT
Tur
nove
rA
vera
geE
mpl
oym
ent
Inve
stm
ent
Up Same Down
CUSTOMER PERFORMANCE
+52
+20
+32
+4
+35
+12
CUSTOMER SURVEY
Source: NatWest/SERT Quarterly Survey of Small Business in Britain, Q4 2006N=538
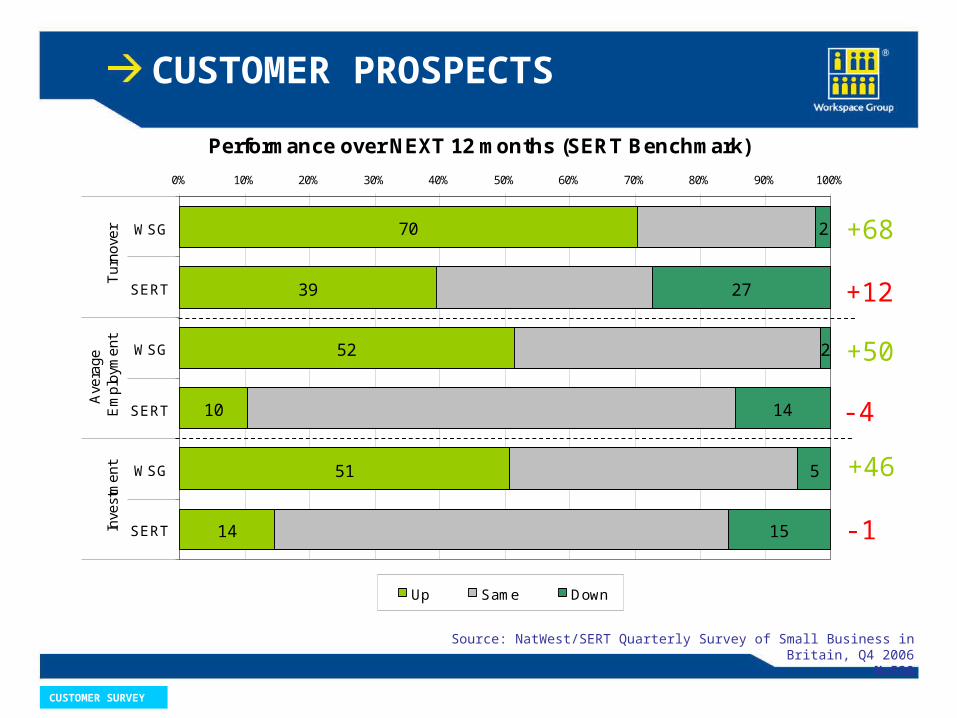
CUSTOMER PROSPECTS
Performance over NEXT 12 months (SERT Benchmark)
70
39
52
10
51
14
2
27
2
14
5
15
0% 10% 20% 30% 40% 50% 60% 70% 80% 90% 100%
WSG
SERT
WSG
SERT
WSG
SERT
Tu
rno
ver
Ave
rag
eE
mp
loym
en
tIn
vest
me
nt
Up Same Down
+68
+12
+50
-4
+46
-1
CUSTOMER SURVEY
Source: NatWest/SERT Quarterly Survey of Small Business in Britain, Q4 2006N=538

BUSINESS OUTLOOK
• Increasing competition (26%) and increasing business costs (20%) are seen as the biggest challenges facing customers
• Access to customers, location in relation to key contacts and ‘kudos’ of London address cited as most popular reasons for being in London
• 21% think they will benefit from the 2012 Olympics, and a further 25% are unsure
• Those that will benefit will do so either directly or indirectly.
• Directly by winning business arising as a result of the Games• Indirectly by the availability of projects normally taken by those involved in the Games
CUSTOMER SURVEY
EXIT RESEARCH

AIMS
EXIT RESEARCH
1. What proportion leave the portfolio & what proportion move within it
2. What types of businesses are leaving the portfolio
3. Why businesses leave the portfolio
4. Levels of satisfaction with Workspace
5. What tenants think of Workspace
AIMS:
60 interviews completed each quarter

SUMMARY OF FINDINGS
EXIT RESEARCH
• Over the last five surveys, on average 20% move to other WSG properties each quarter
• The number of tenants moving to another estate or business premises with a different landlord is about 50%
• No pattern by industry type, but the smallest at most risk
• 50% had been in their current premises for between one and three years
• 88% see their local manager or Workspace representative at least once a week
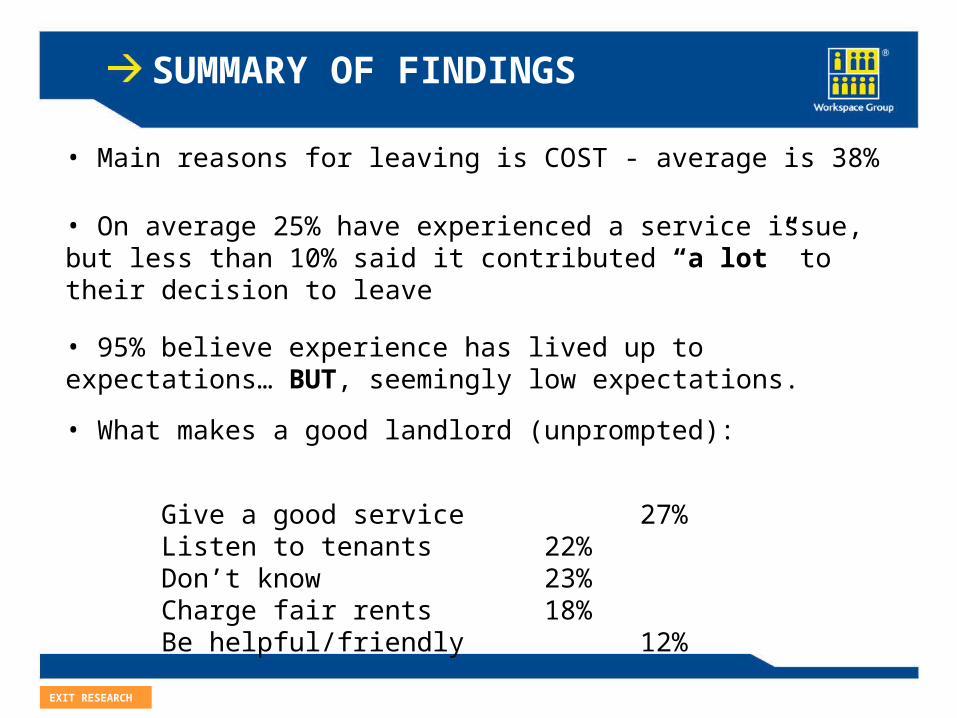
SUMMARY OF FINDINGS
EXIT RESEARCH
• Main reasons for leaving is COST - average is 38%
• On average 25% have experienced a service issue, but less than 10% said it contributed “a lot” to their decision to leave
• 95% believe experience has lived up to expectations… BUT, seemingly low expectations.
• What makes a good landlord (unprompted):
Give a good service 27% Listen to tenants 22%Don’t know 23% Charge fair rents 18% Be helpful/friendly 12%

KEY RELATIONSHIPS
> Those most likely to recommend are those who:
1. Agree that Workspace provides good value for money
2. Are satisfied with the contact at local level
3. Agree that Workspace delivers a competitive package
4. Are satisfied with Workspace Group as a landlord
5. Agree that any service issues have been resolved quickly
SUMMARY

CONSIDERATIONS
• What are the key issues & areas for improvement?
• What are the actions?
• What are the key relationships?
• What do customers expect of Workspace? Do we deliver?
• Is there anything we don’t know but should?
SUMMARY