Embed Size (px)
Citation preview
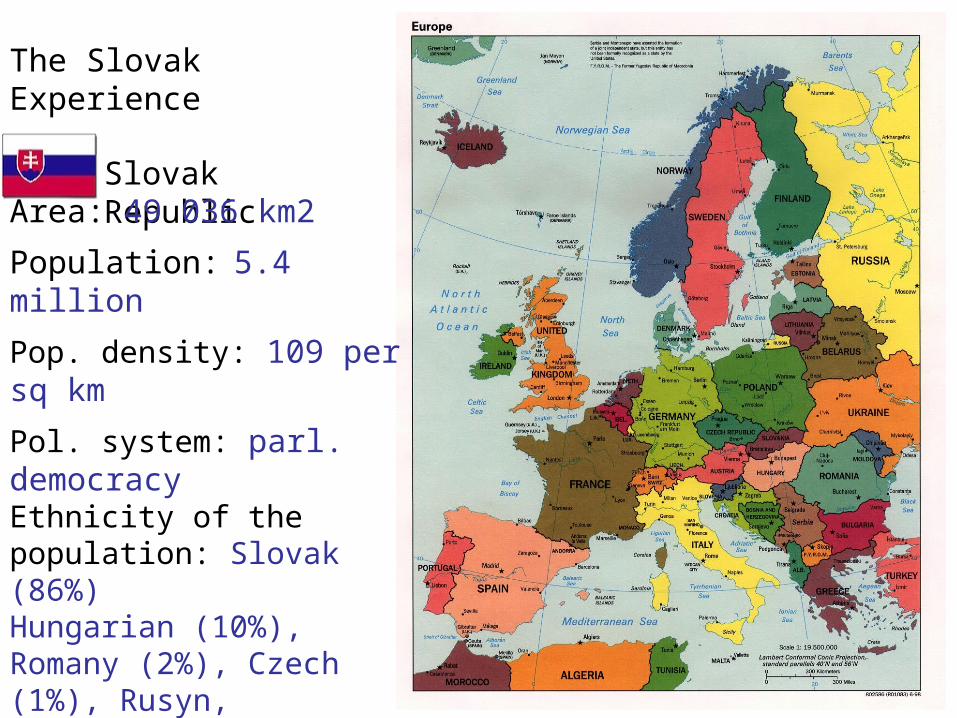
Slovak Republic
Area: 49 036 km2
Population: 5.4 million
Pop. density: 109 per sq km
Pol. system: parl. democracy Ethnicity of the population: Slovak (86%)Hungarian (10%), Romany (2%), Czech (1%), Rusyn, Ukrainian, Russian, German, Polish and others(1%)GNI per capita (2005): US$ 7,600GDP growth (2007): 8.7%
The Slovak Experience
Contents
• General Overview of Communist Economic System
• Transition to Capitalism
• The Case of Slovakia and other Central European Countries
• Communist economic system = central planning + state ownership of production factors
• Communist economic system applied in countries with one third of the world population, covering Russia and Mongolia, Central Europe, Balkan, Baltic Countries, and China, Vietnam and other offshoots.
• It started in relatively backward agrarian countries like Russia in 1917.
General Overview of Communist Economic System
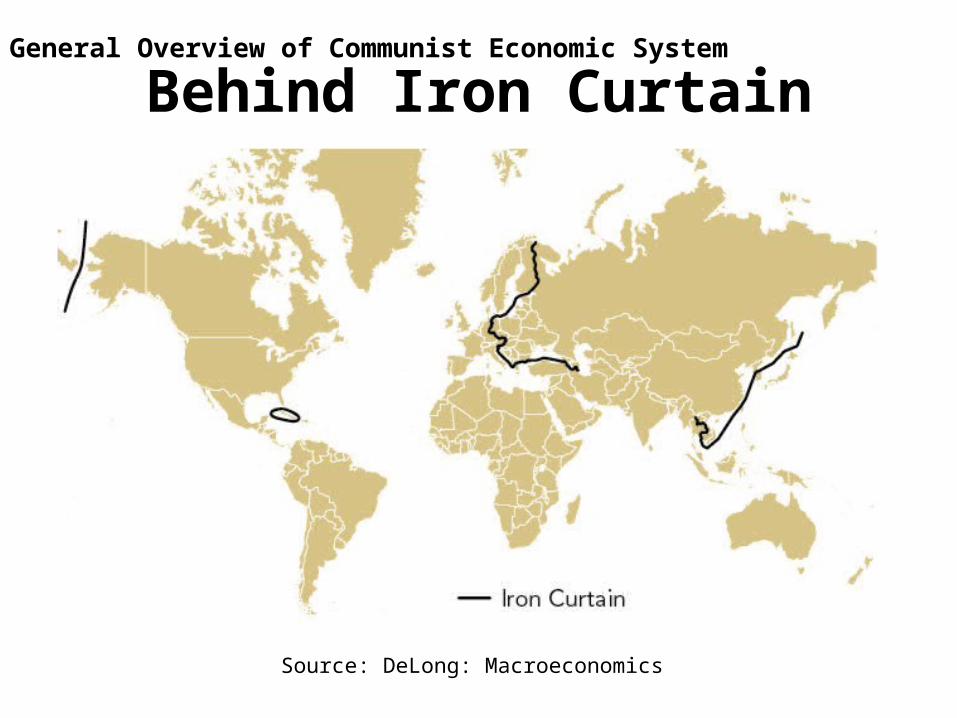
Behind Iron Curtain
Source: DeLong: Macroeconomics
General Overview of Communist Economic System
• At the beginning it was not clear which system (communist or capitalist) more efficient
• Many economists in the West advocated socialism
• It turned out that communist economic system is less efficient than free market system
General Overview of Communist Economic System
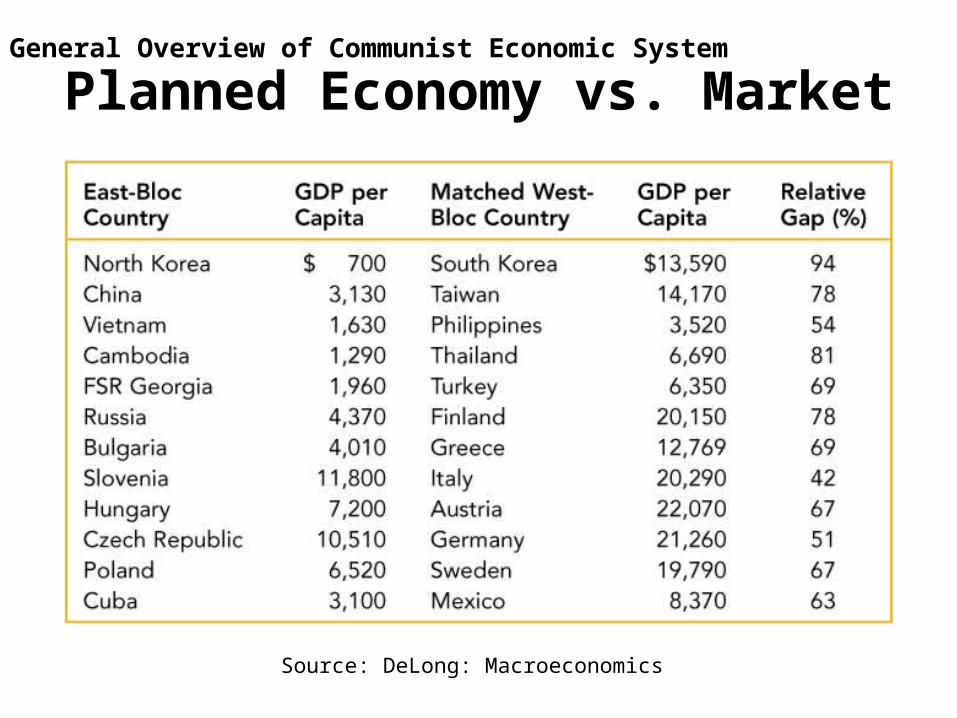
Planned Economy vs. Market
Source: DeLong: Macroeconomics
General Overview of Communist Economic System
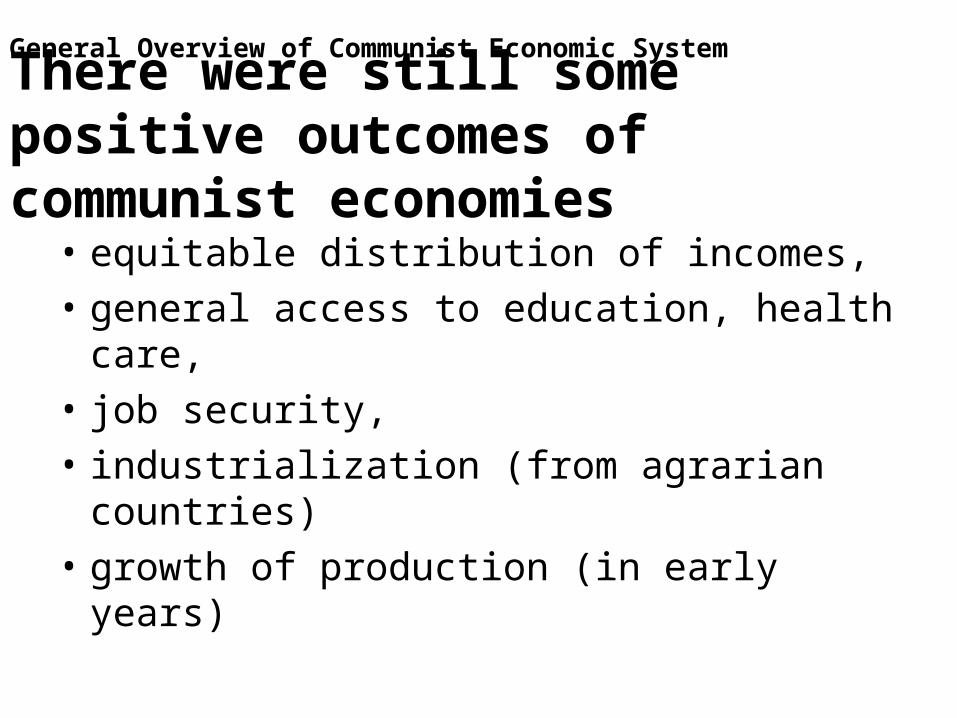
There were still some positive outcomes of communist economies
• equitable distribution of incomes,
• general access to education, health care,
• job security,
• industrialization (from agrarian countries)
• growth of production (in early years)
General Overview of Communist Economic System

But negative outcomes prevailed• shortages or surpluses, • slow economic growth in later periods• technological backwardness because of slow
innovation• environmental damage by heavy industry• stagnating social indicators, health, life expectancy,…• intrusive government due to lack of private incentives• governments NOT maximizing social welfare but
seeking own advantages (principal-agent problem)• lack of freedom – dictatorship
General Overview of Communist Economic System
Why communist economies poorer than market economies?
– Initial conditions (communist countries were poorer in the first place)
– Communist economies generated lower rates of economic growth
General Overview of Communist Economic System
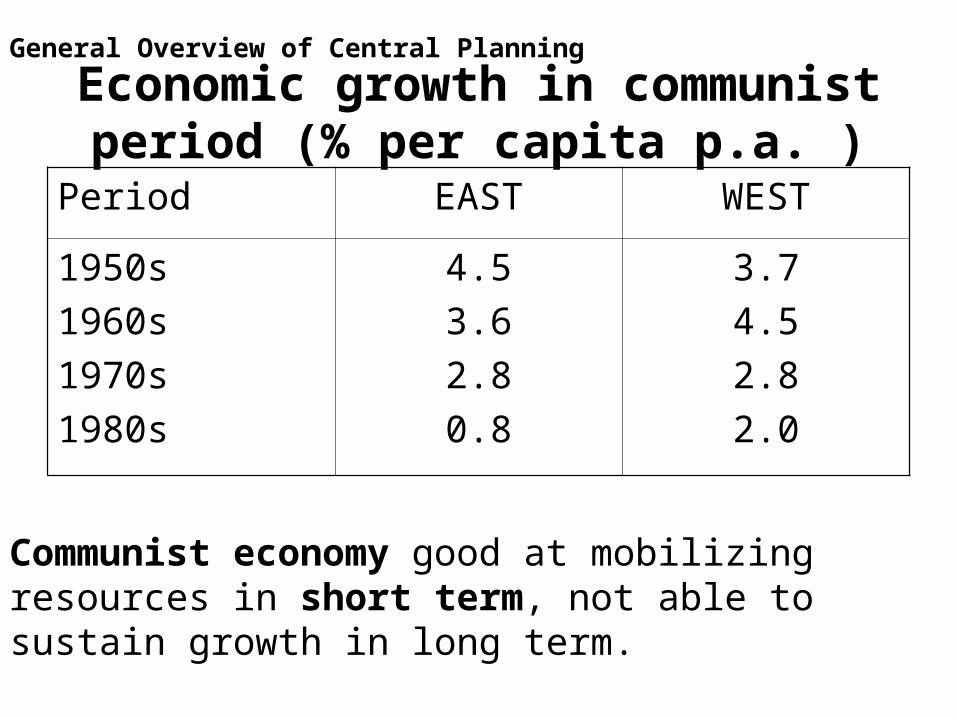
Economic growth in communist period (% per capita p.a. )
Period EAST WEST
1950s
1960s
1970s
1980s
4.5
3.6
2.8
0.8
3.7
4.5
2.8
2.0
Communist economy good at mobilizing resources in short term, not able to sustain growth in long term.
General Overview of Central Planning

What caused poor performance of communist economies?
• Central planning
• Property rights
General Overview of Central Planning
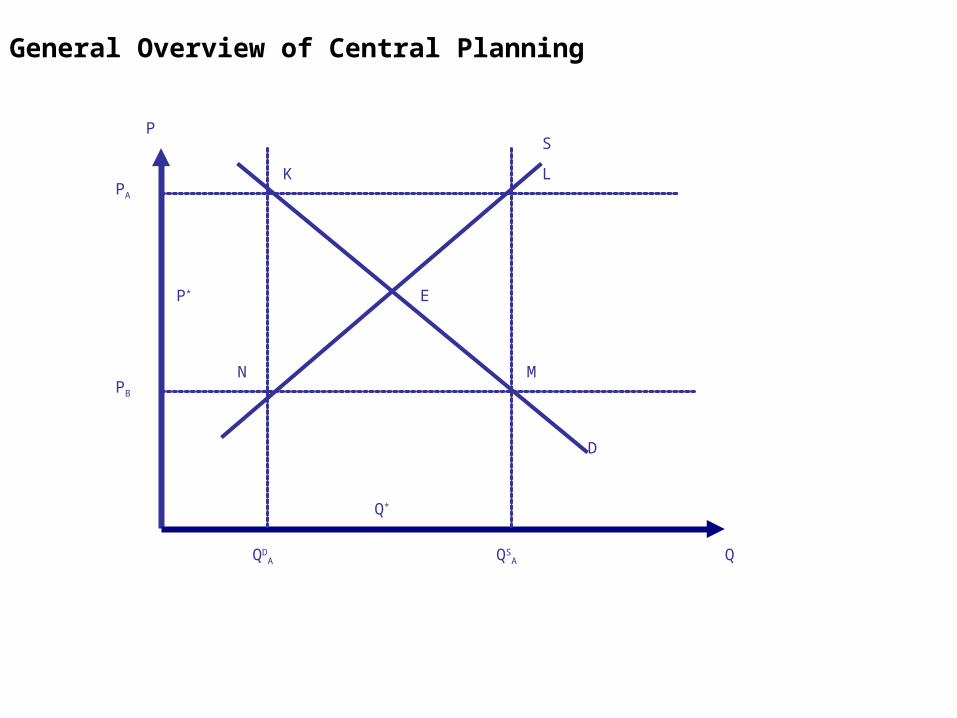
Problems with central planning Imbalances NOT eliminated by price adjustments and prices do not send signals what is scarce or prospective and what abundant and useles.
Quantities set directly by central planners. The whole economy is managed like a single firm (monopoly).
But central planners unable to manage such a huge firm (ECONOMY): poor info and incentives.
PRICE MECHANISM PERFORMS BETTER THAN CENTRAL PLANNING.
General Overview of Central Planning
Problems with central planning Central planning is the story of huge government failure stemming from:
- inability to collect relevant information on preferences of consumers, availability of production methods and technology
- inability to set long-term sustainable goals
Free market economy often faces MARKET FAILURE
Government failure bigger than market failure
General Overview of Central Planning
Q
P
PA
QDA QS
A
M
L
N
K
D
S
PB
E
Q*
P*
General Overview of Central Planning

Problems with property rights
• Rights to use assets and enjoy income from the use of assets
• In communism all assets owned by the state
• Prices and profits irrelevant.
• Managers not motivated to make profit but to fulfill quantitative plans.
• Inability to motivate people to work hard
• Punishment for increasing efficiency and innovation.
General Overview of Central Planning
Collapse of communist experiment and transition• Communist system failed and was followed by TRANSITION
from central planning to market economy
• During TRANSITION all “rules of the game” (constitution, laws, codes of behavior, habits, property rights) changed.
i.e., Market economy based on profit seeking entrepreneurial behavior while entrepreneurship in communism is considered to be speculation and trying to avoid hard work and therefore illegal.
Transition
Speed of Transition
• Two options1. Big Bang or Shock Therapy2. Gradual reforms
• Scope of reforms– Economic reforms: Liberalization, stabilization,
dismantling communist institutions (CMEA) and subsidies, privatization, banking system, safety net
– Institutional reforms: large-scale privatization, market oriented legal system and institutions, financial, labor, retirement regulations (in summary laws, regulations, institutions)
Transition

Speed of transition
• CEEC and FSU big bang in economic reforms and variability in institutional reforms.
Havel: “Cannot cross a chasm in two leaps”
• CHINA gradual reforms only.
Deng Xiaoping: “feeling stones to cross the river”
Transition
Speed of transition
• China vs. CEEC and FSU
– China dictatorship while CEEC and FSU became democracies, in China reforms conducted by communists in CEEC by democrats.
– Chinese approach not used in CEEC as reformers (former dissidents) worried of Russia and return of communists in their own countries used WINDOW OF OPPORTUNITY to make reforms irreversible.
Transition
Outcome of transition depends on • Initial conditions
Some countries remembered pre-communist period and had market skills
Some countries implemented institutions from the scratch (Slovakia)
Some countries started transition with stable economy while others from macroeconomic imbalances
Transition
Outcome of transition depends on • Liberalization and stabilization policies
– In general the stronger the liberalization the faster recovery of production
– Stabilization macroeconomic policies crucial
– Important to establish hard budget constraint
Transition
Outcome of transition depends on • Privatization and regulation
Private firms more efficient than state owned
Methods of privatization
Financial regulation, labor code, regulation of pension system, taxation
Enforcement of contracts
Functioning of legal system
Transition
Outcome of transition depends on • Political system
Avoidance of government failure
Elimination of redundant redistribution and rent seeking
Economic and legal predictability
Sequencing of reforms
EU accession
Transition
Short history
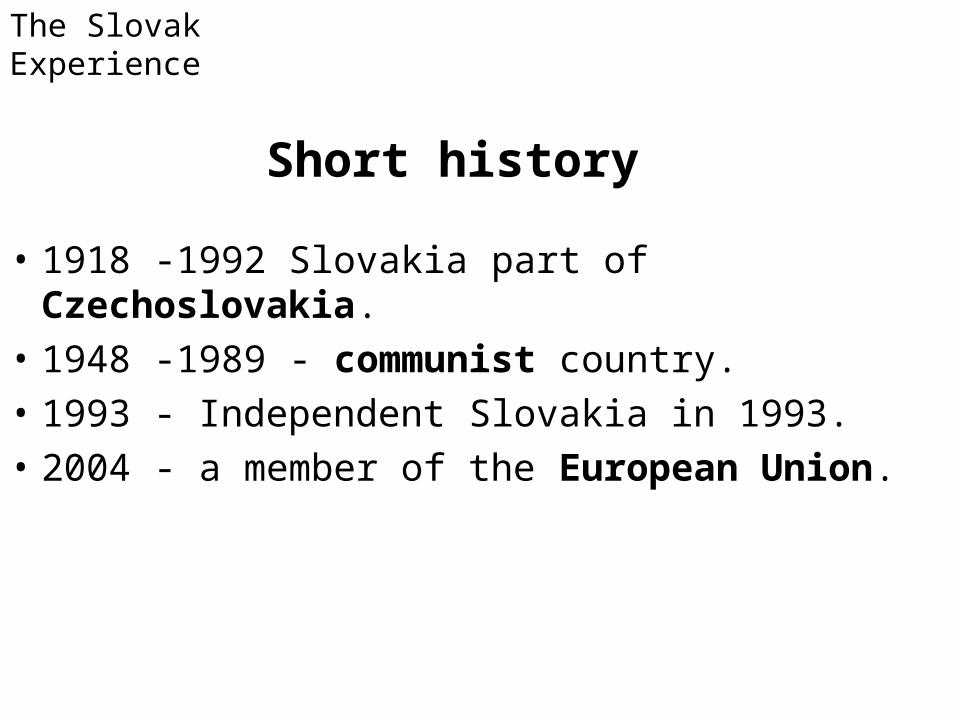
• 1918 -1992 Slovakia part of Czechoslovakia.
• 1948 -1989 - communist country.
• 1993 - Independent Slovakia in 1993.
• 2004 - a member of the European Union.
The Slovak Experience
Short economic history – communist years
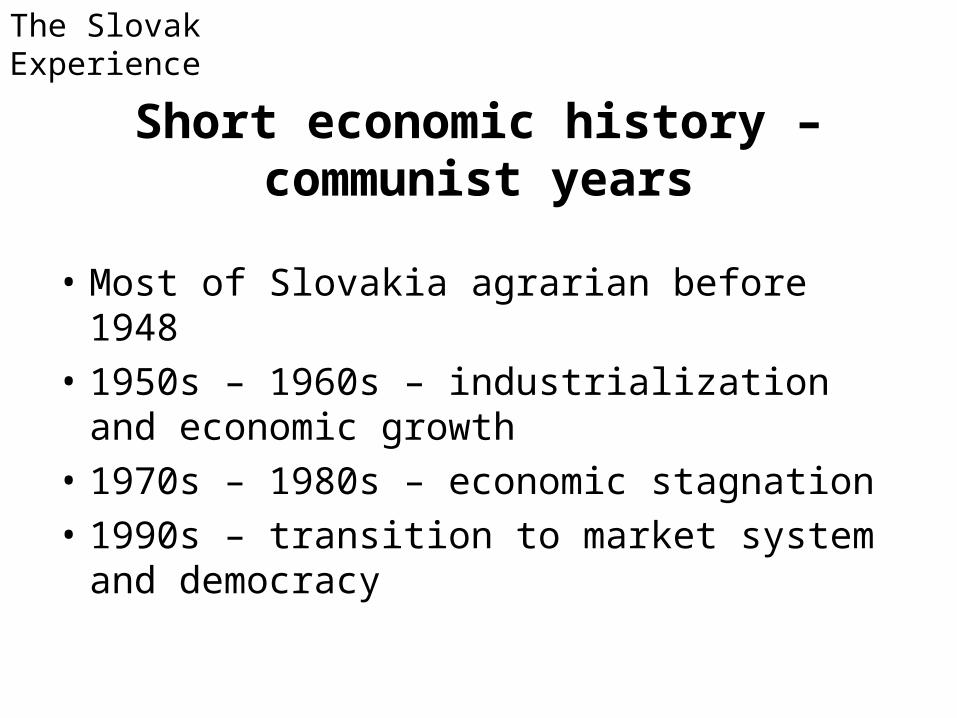
• Most of Slovakia agrarian before 1948
• 1950s – 1960s – industrialization and economic growth
• 1970s – 1980s – economic stagnation
• 1990s – transition to market system and democracy
The Slovak Experience
Short Economic History – Transition Years
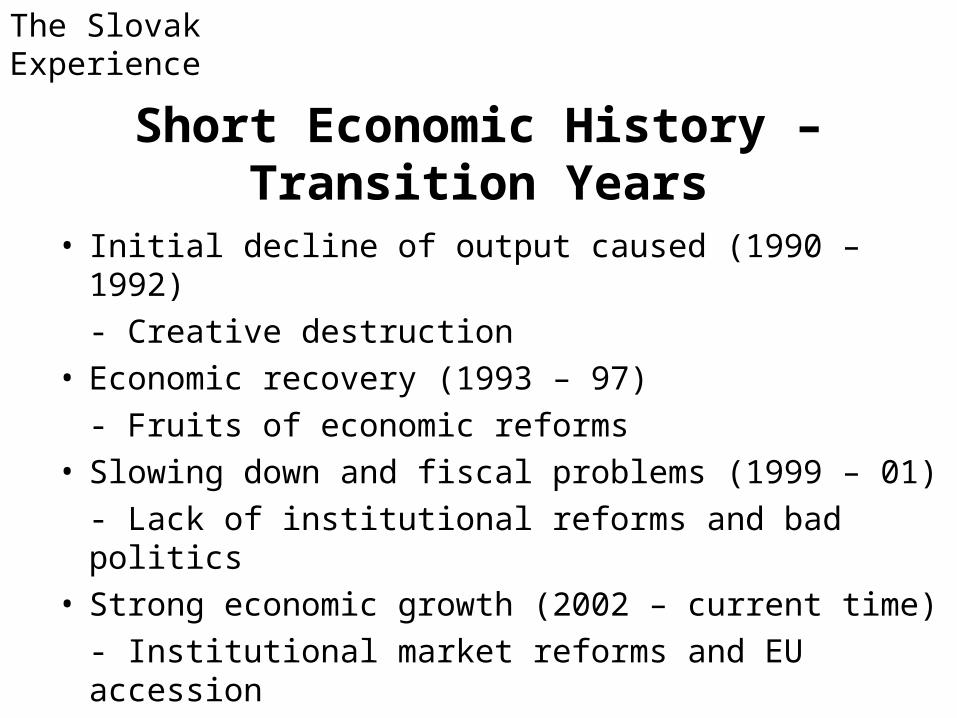
• Initial decline of output caused (1990 – 1992)
- Creative destruction• Economic recovery (1993 – 97)
- Fruits of economic reforms• Slowing down and fiscal problems (1999 – 01)
- Lack of institutional reforms and bad politics• Strong economic growth (2002 – current time)
- Institutional market reforms and EU accession
The Slovak Experience
Adoption of EURO
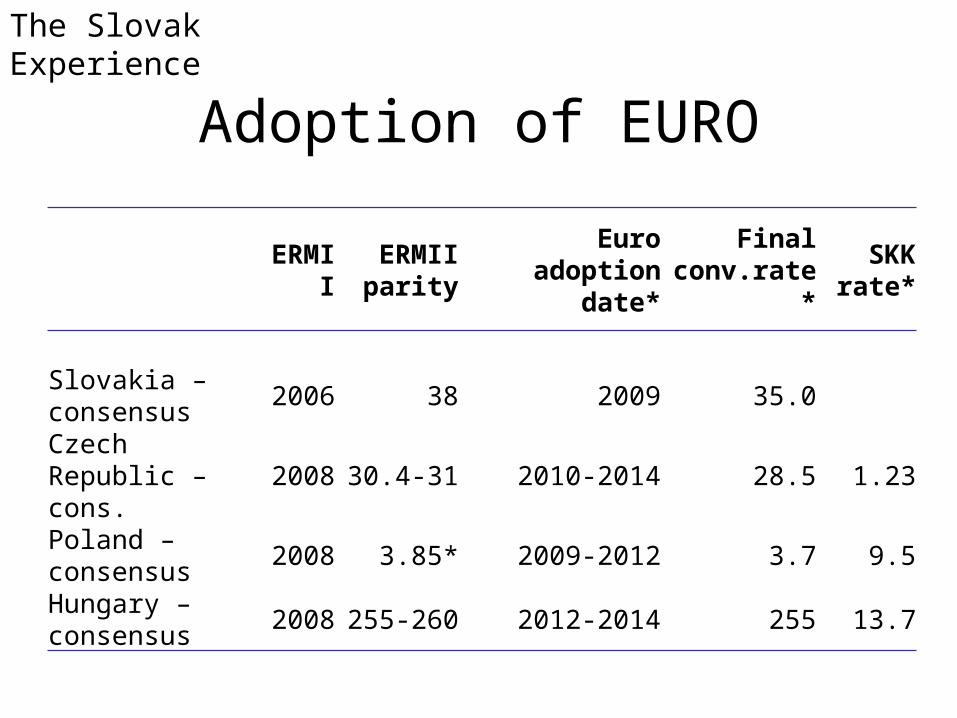
ERMIIERMII parity
Euro adoption date*
Final conv.rate*
SKK rate*
Slovakia – consensus
2006 38 2009 35.0
Czech Republic – cons.
2008 30.4-31 2010-2014 28.5 1.23
Poland – consensus
2008 3.85* 2009-2012 3.7 9.5
Hungary – consensus
2008 255-260 2012-2014 255 13.7
The Slovak Experience
Current economic performance
• Currently, Slovakia is a fast growing economy with GDP growth of about 10 % in 2007
• Unemployment rate remains high but declining (about 10 % in 2009).
• Regional differences: rich Western Slovakia, poor Eastern Slovakia.
The Slovak Experience
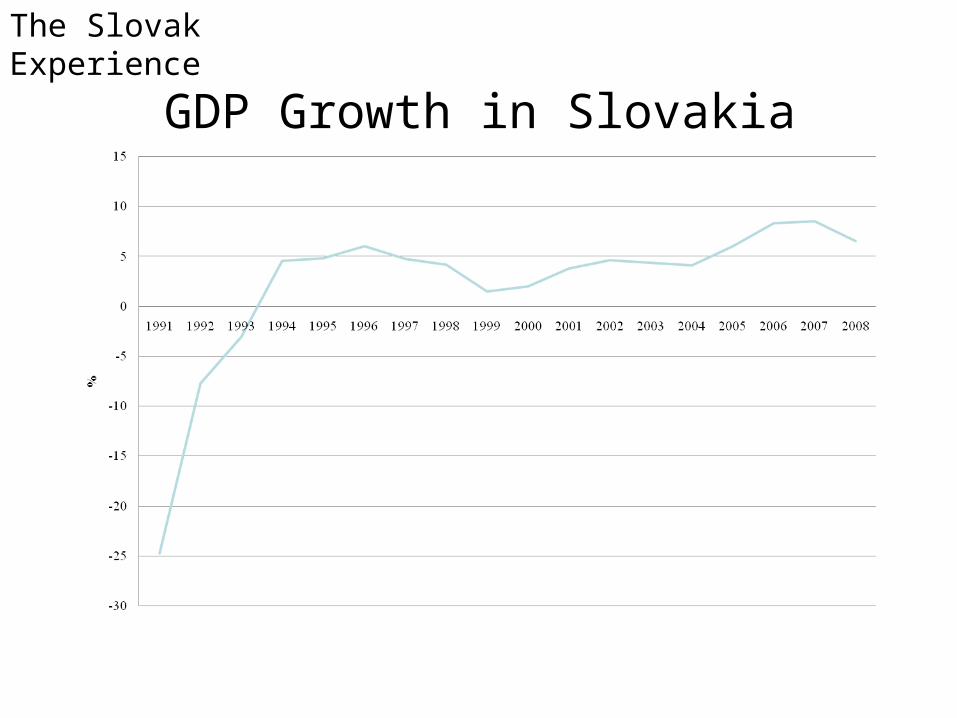
GDP Growth in Slovakia
The Slovak Experience
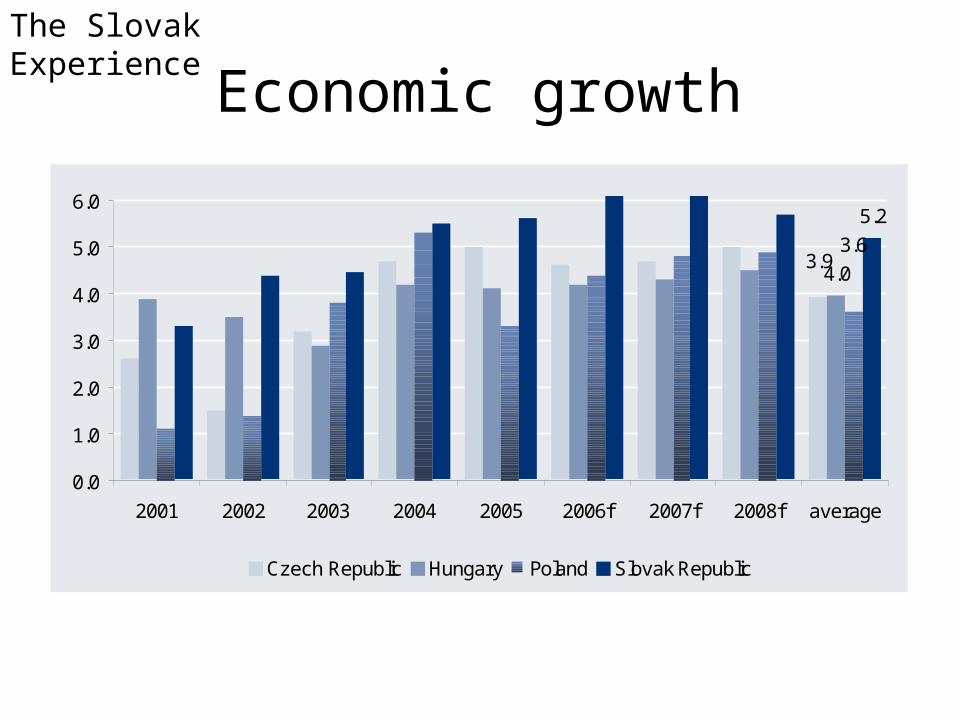
Economic growth
3.94.0
3.6
5.2
0.0
1.0
2.0
3.0
4.0
5.0
6.0
2001 2002 2003 2004 2005 2006f 2007f 2008f average
Czech Republic Hungary Poland Slovak Republic
The Slovak Experience
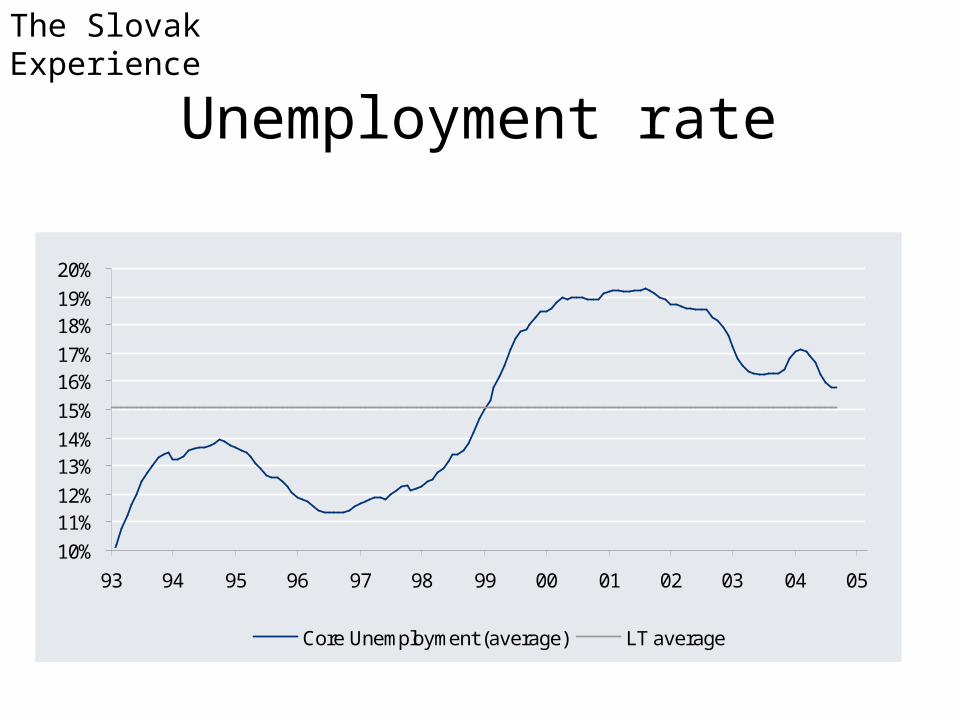
Unemployment rate
10%
11%12%
13%14%
15%
16%17%
18%19%
20%
93 94 95 96 97 98 99 00 01 02 03 04 05
Core Unemployment (average) LT average
The Slovak Experience
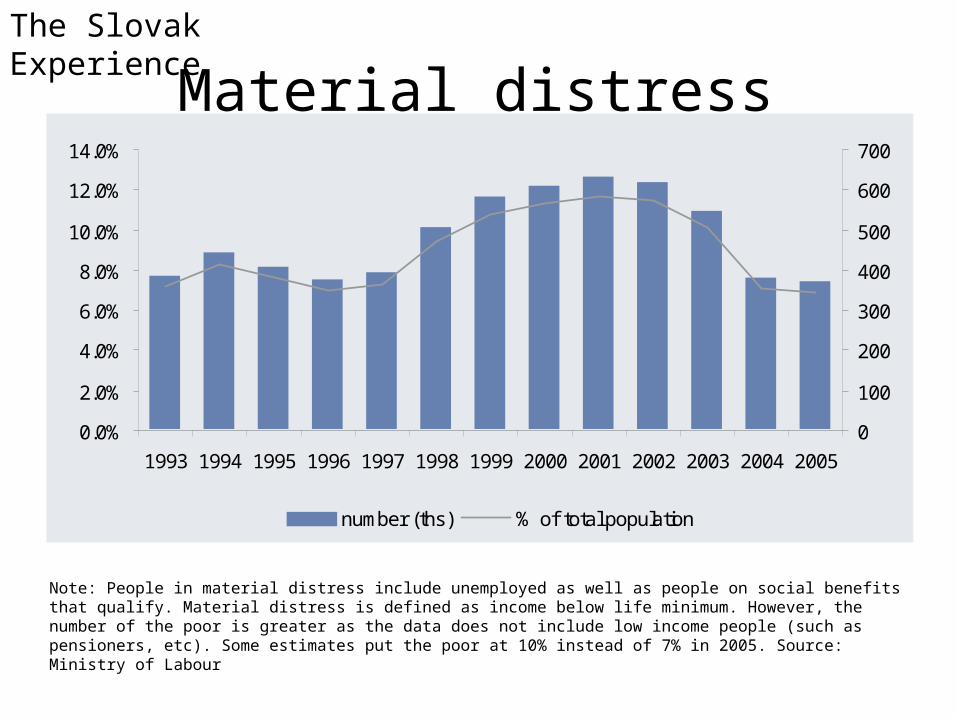
Material distress
0.0%
2.0%
4.0%
6.0%
8.0%
10.0%
12.0%
14.0%
1993 1994 1995 1996 1997 1998 1999 2000 2001 2002 2003 2004 2005
0
100
200
300
400
500
600
700
number (ths) % of total population
Note: People in material distress include unemployed as well as people on social benefits that qualify. Material distress is defined as income below life minimum. However, the number of the poor is greater as the data does not include low income people (such as pensioners, etc). Some estimates put the poor at 10% instead of 7% in 2005. Source: Ministry of Labour
The Slovak Experience
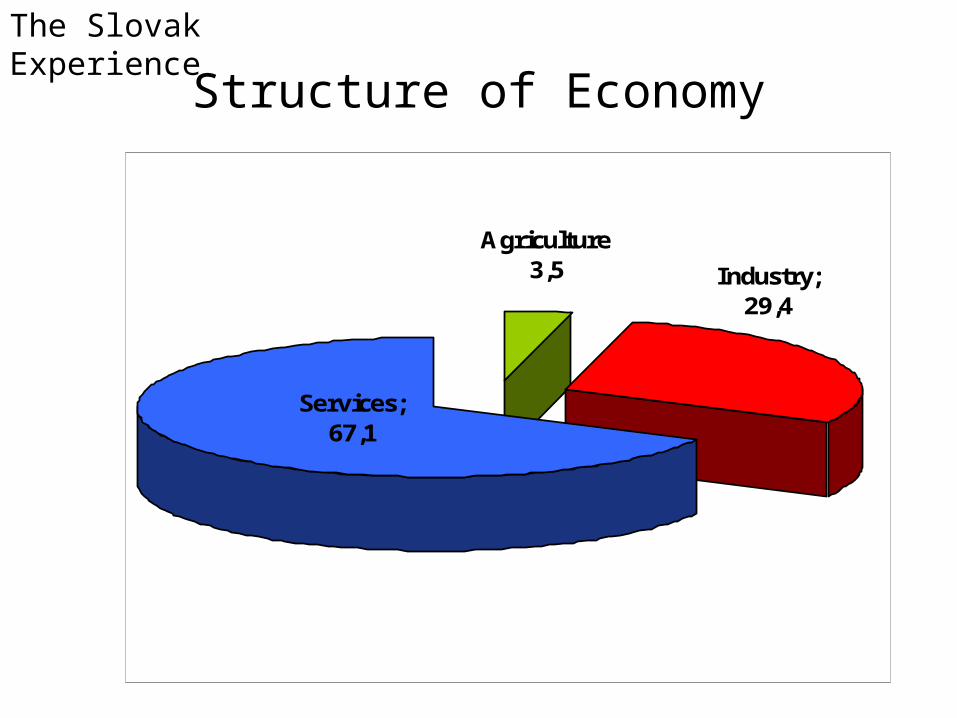
Structure of Economy
Agriculture 3,5 Industry;
29,4
Services; 67,1
The Slovak Experience
• In the world perspective, SLOVAKIA is an upper middle income country with a Gross National Income per capita of US$ 7,600 in 2005.
• In European perspective, Slovakia achieves about 55% of average income of 25 countries of the EU
The Slovak Experience
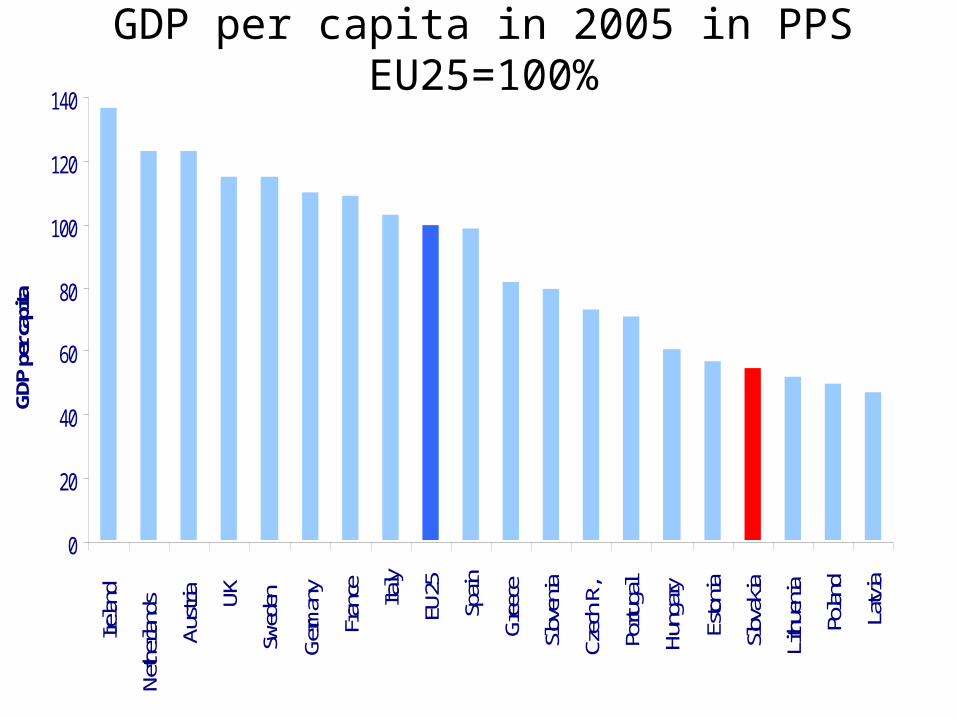
GDP per capita in 2005 in PPS EU25=100%
0
20
40
60
80
100
120
140Ire
land
Neth
erlan
ds
Austr
ia UK
Swed
en
Germ
any
Fran
ce Italy
EU25
Spain
Gree
ce
Slov
enia
Czec
h R,
Portu
gal
Hung
ary
Esto
nia
Slov
akia
Lith
ueni
a
Polan
d
Latv
ia
GDP
per
capi
ta
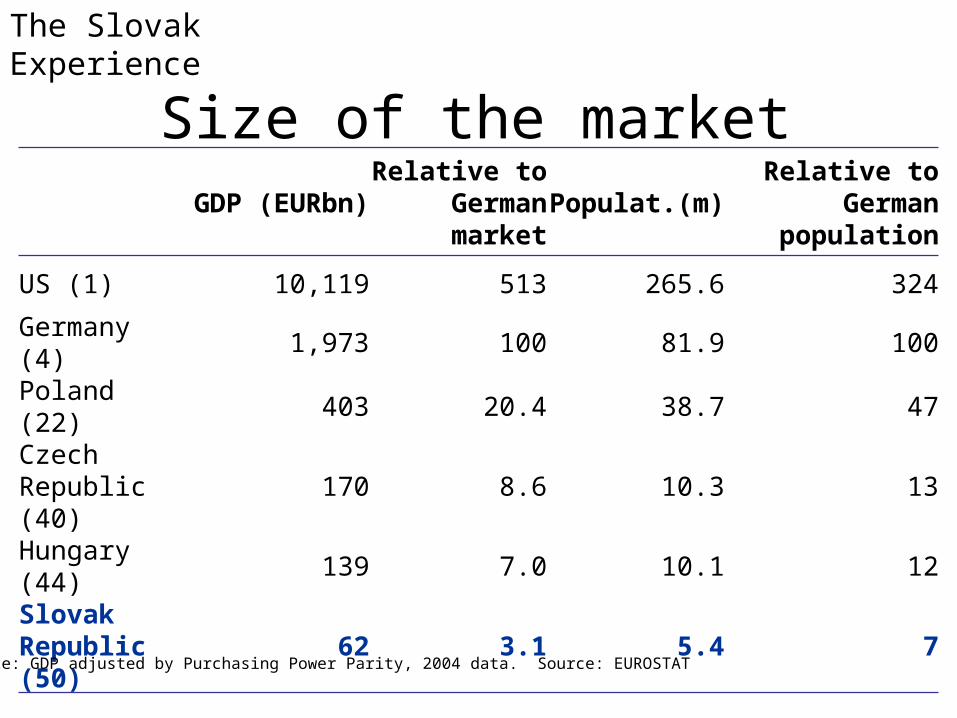
GDP (EURbn)Relative to
German market
Populat.(m)Relative to
German population
US (1) 10,119 513 265.6 324
Germany (4) 1,973 100 81.9 100
Poland (22) 403 20.4 38.7 47
Czech Republic (40)
170 8.6 10.3 13
Hungary (44) 139 7.0 10.1 12
Slovak Republic (50)
62 3.1 5.4 7
Note: GDP adjusted by Purchasing Power Parity, 2004 data. Source: EUROSTAT
Size of the market
The Slovak Experience
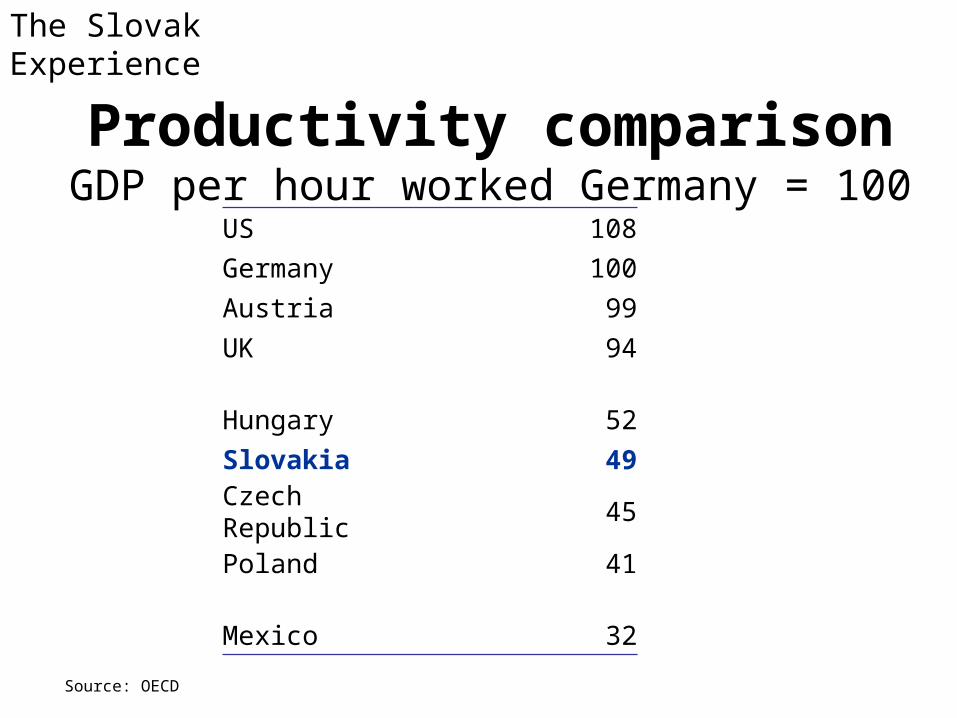
US 108
Germany 100
Austria 99
UK 94
Hungary 52
Slovakia 49
Czech Republic 45
Poland 41
Mexico 32
Productivity comparisonGDP per hour worked Germany = 100
Source: OECD
The Slovak Experience
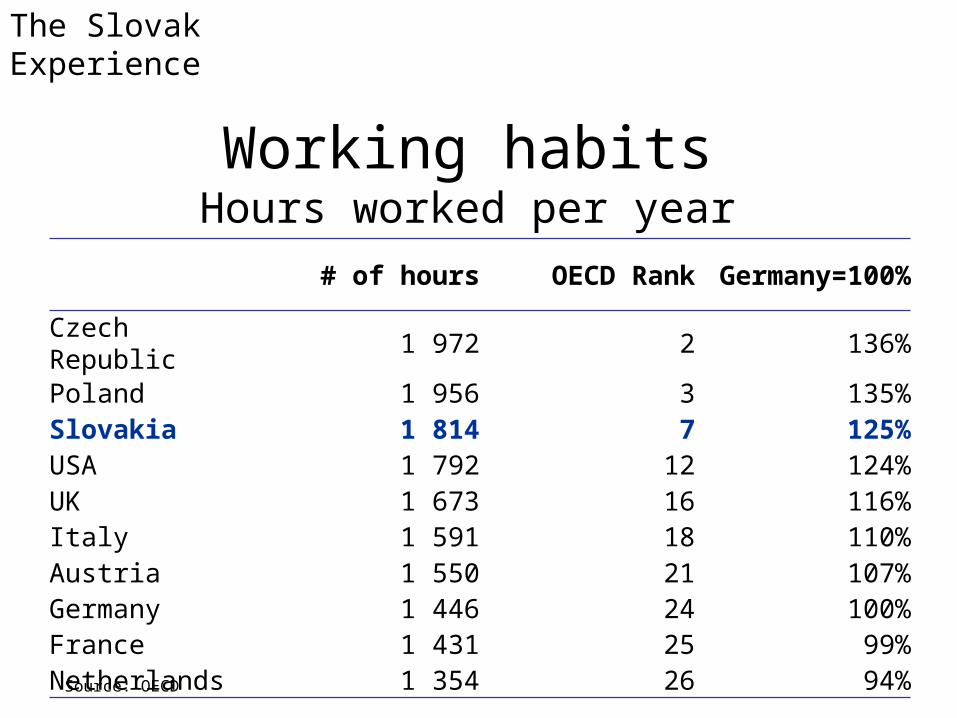
# of hours OECD Rank Germany=100%
Czech Republic 1 972 2 136%Poland 1 956 3 135%Slovakia 1 814 7 125%USA 1 792 12 124%UK 1 673 16 116%Italy 1 591 18 110%Austria 1 550 21 107%Germany 1 446 24 100%France 1 431 25 99%Netherlands 1 354 26 94%
Working habitsHours worked per year
Source: OECD
The Slovak Experience
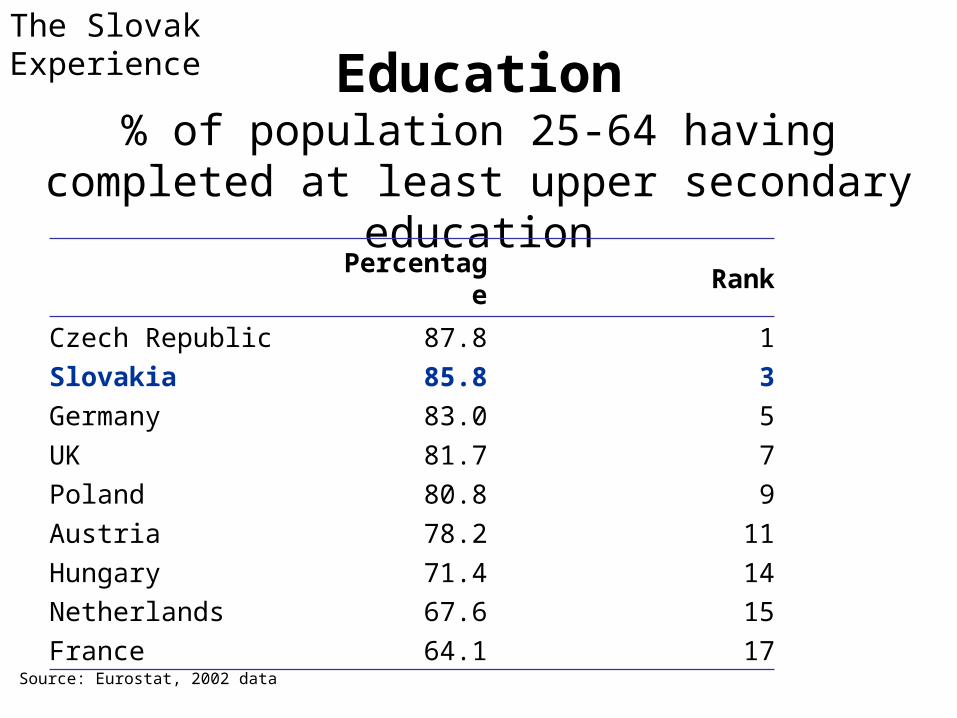
Education% of population 25-64 having completed at least
upper secondary education
Percentage Rank
Czech Republic 87.8 1
Slovakia 85.8 3
Germany 83.0 5
UK 81.7 7
Poland 80.8 9
Austria 78.2 11
Hungary 71.4 14
Netherlands 67.6 15
France 64.1 17Source: Eurostat, 2002 data
The Slovak Experience
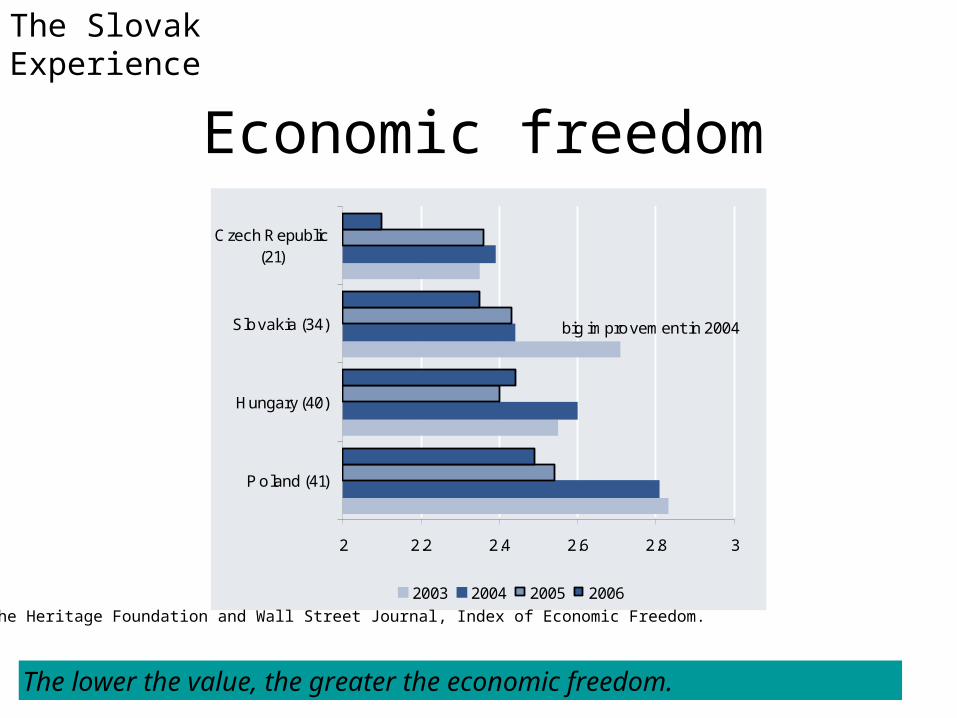
Economic freedom
2 2.2 2.4 2.6 2.8 3
P oland (41)
Hungary (40)
Slovakia (34)
Czech Republic(21)
2003 2004 2005 2006
big improvement in 2004
The lower the value, the greater the economic freedom.
Source: The Heritage Foundation and Wall Street Journal, Index of Economic Freedom.
The Slovak Experience
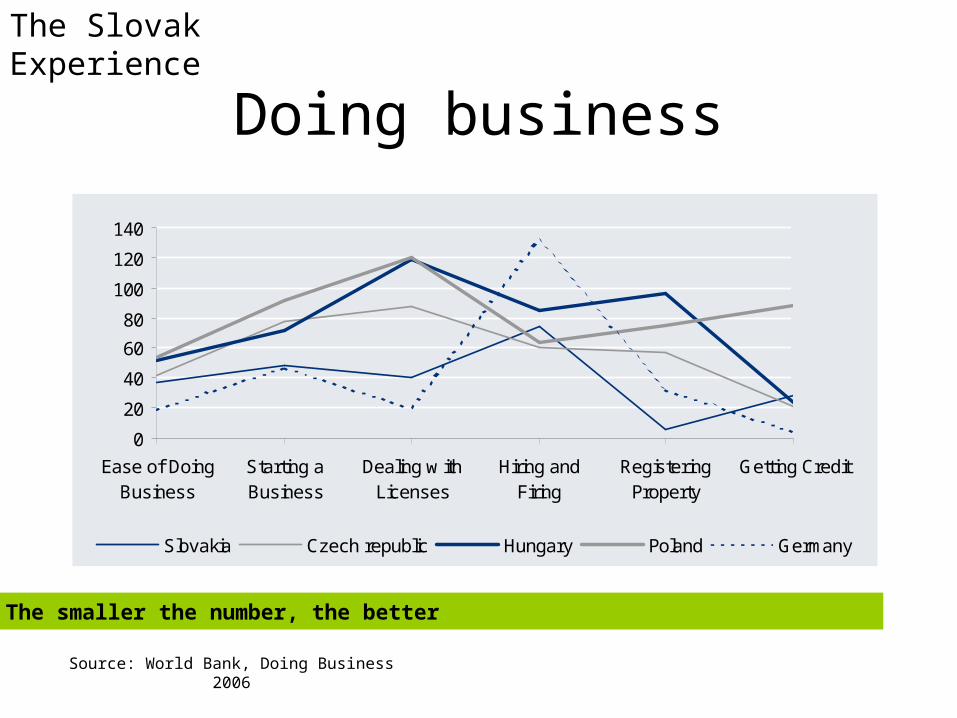
Doing business
0
20
40
60
80
100
120
140
Ease of DoingBusiness
Starting aBusiness
Dealing w ithLicenses
Hiring andFiring
RegisteringProperty
Getting Credit
Slovakia Czech republic Hungary Poland Germany
The smaller the number, the better
Source: World Bank, Doing Business 2006
The Slovak Experience
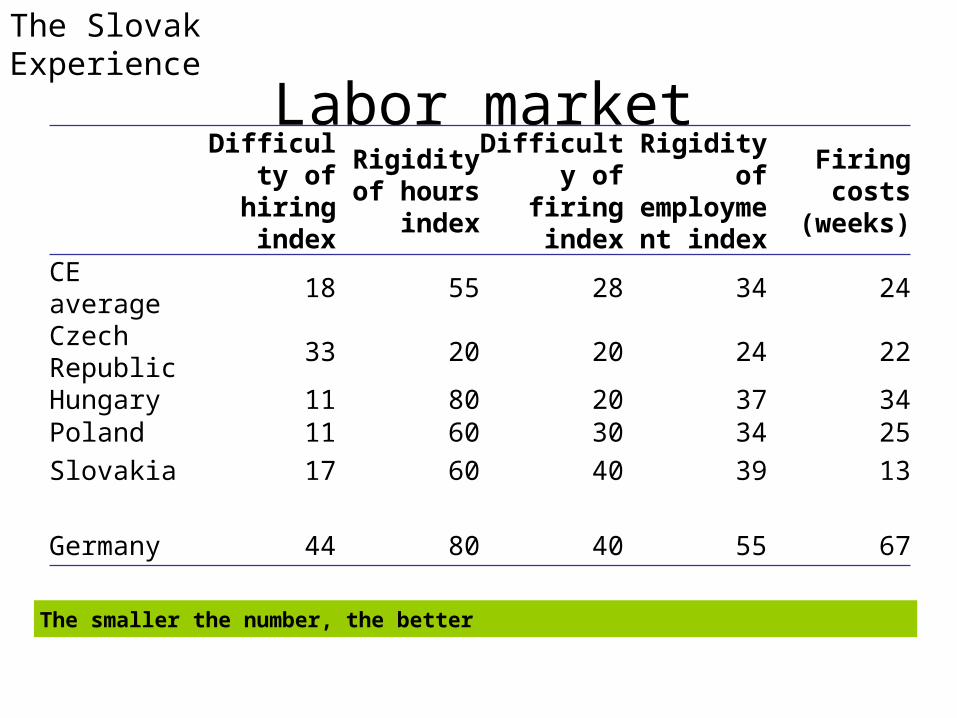
Labor marketDifficulty of hiring
index
Rigidity of hours index
Difficulty of firing
index
Rigidity of employme
nt index
Firing costs
(weeks)
CE average 18 55 28 34 24
Czech Republic
33 20 20 24 22
Hungary 11 80 20 37 34Poland 11 60 30 34 25
Slovakia 17 60 40 39 13
Germany 44 80 40 55 67
The smaller the number, the better
The Slovak Experience
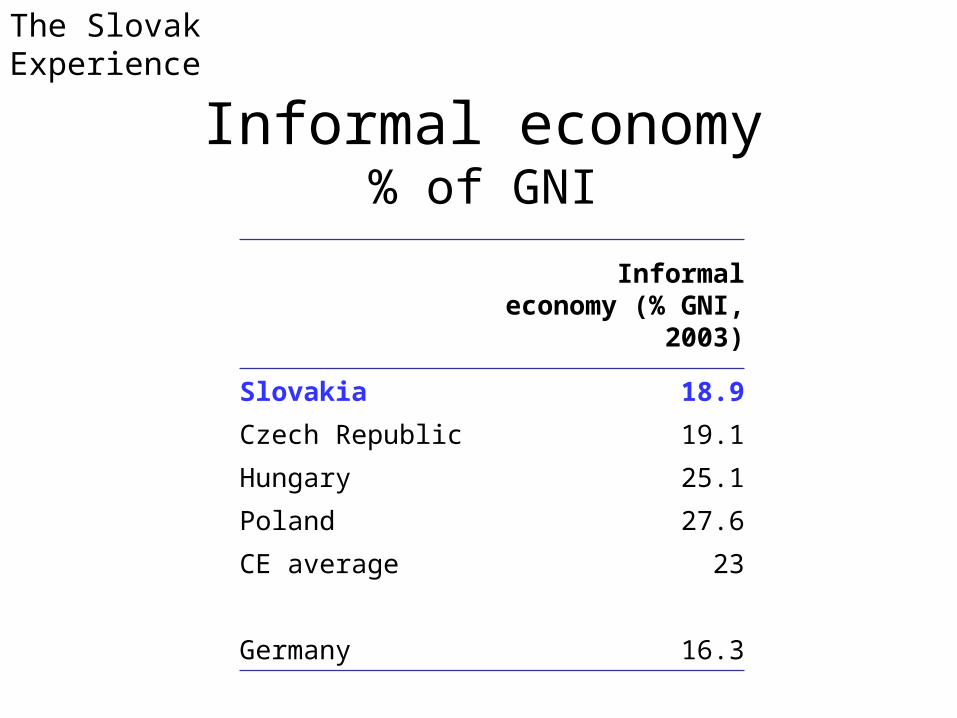
Informal economy% of GNI
Informal economy (% GNI, 2003)
Slovakia 18.9
Czech Republic 19.1
Hungary 25.1
Poland 27.6
CE average 23
Germany 16.3
The Slovak Experience
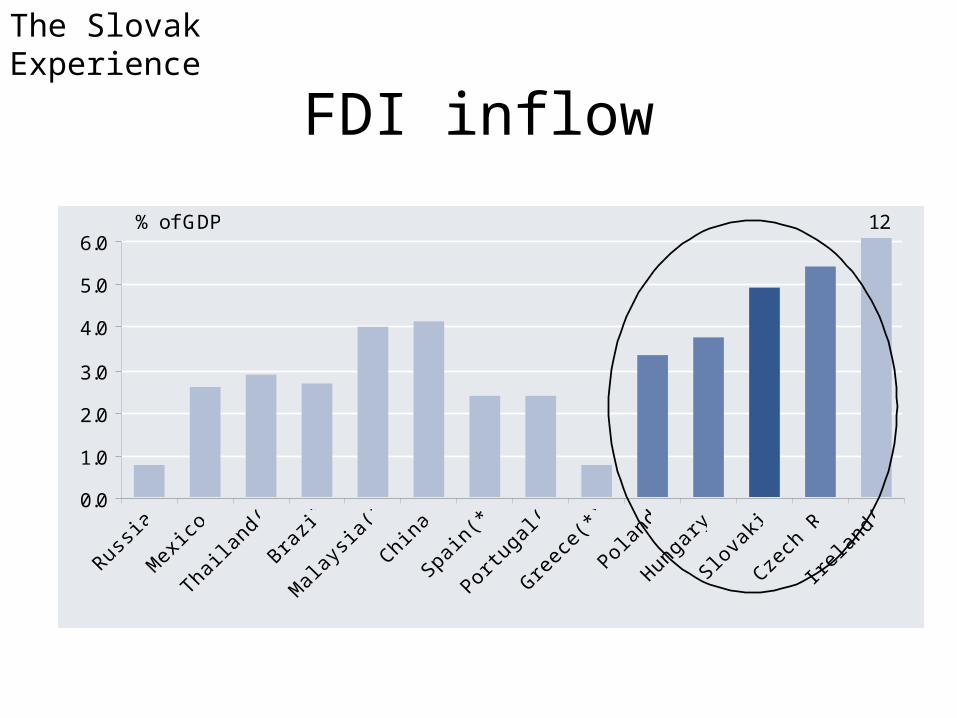
FDI inflow
0.0
1.0
2.0
3.0
4.0
5.0
6.012% of GDP
The Slovak Experience
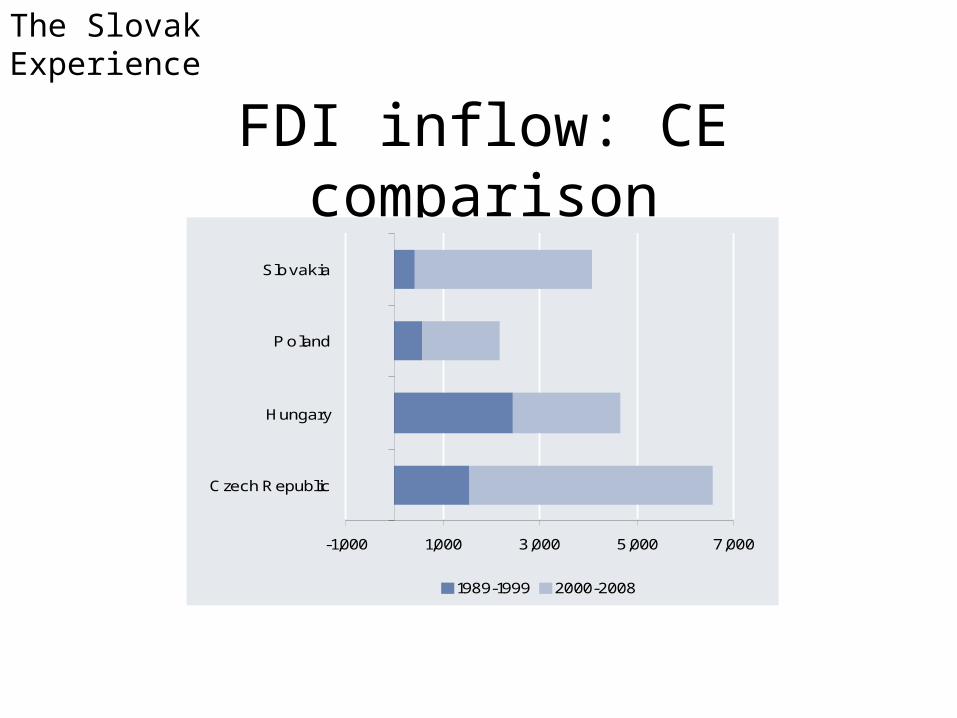
FDI inflow: CE comparison
-1,000 1,000 3,000 5,000 7,000
Czech Republic
Hungary
P oland
Slovakia
1989-1999 2000-2008US$
The Slovak Experience
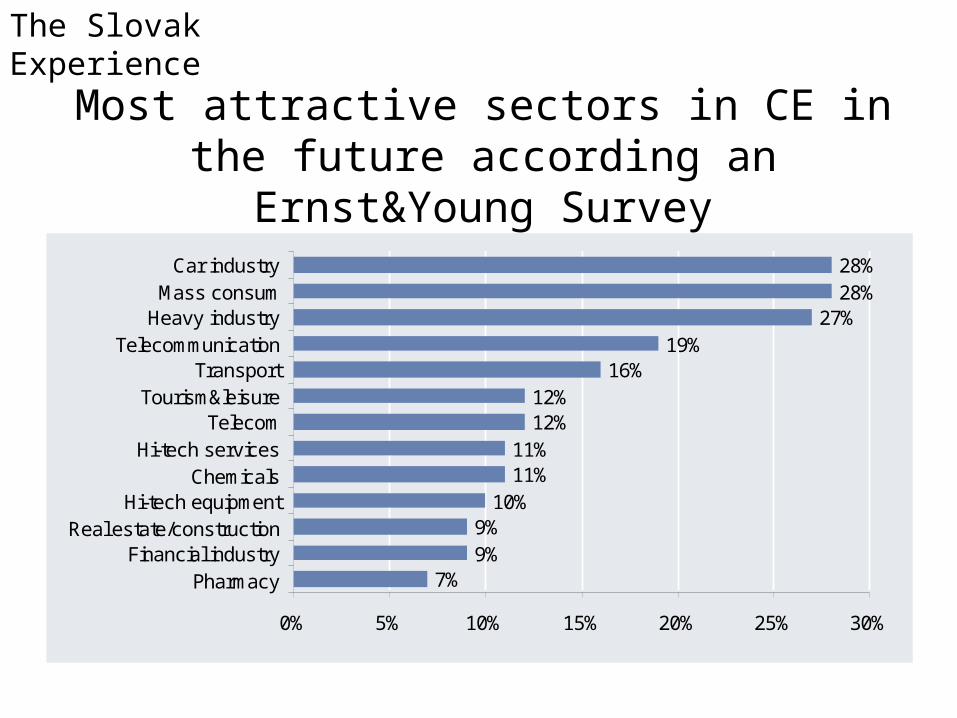
Most attractive sectors in CE in the future according an Ernst&Young Survey
7%9%9%
10%11%11%
12%12%
16%19%
27%28%28%
0% 5% 10% 15% 20% 25% 30%
PharmacyFinancial industry
Real estate/constructionHi-tech equipment
ChemicalsHi-tech services
TelecomTourism&leisure
TransportTelecommunication
Heavy industryMass consum
Car industry
The Slovak Experience
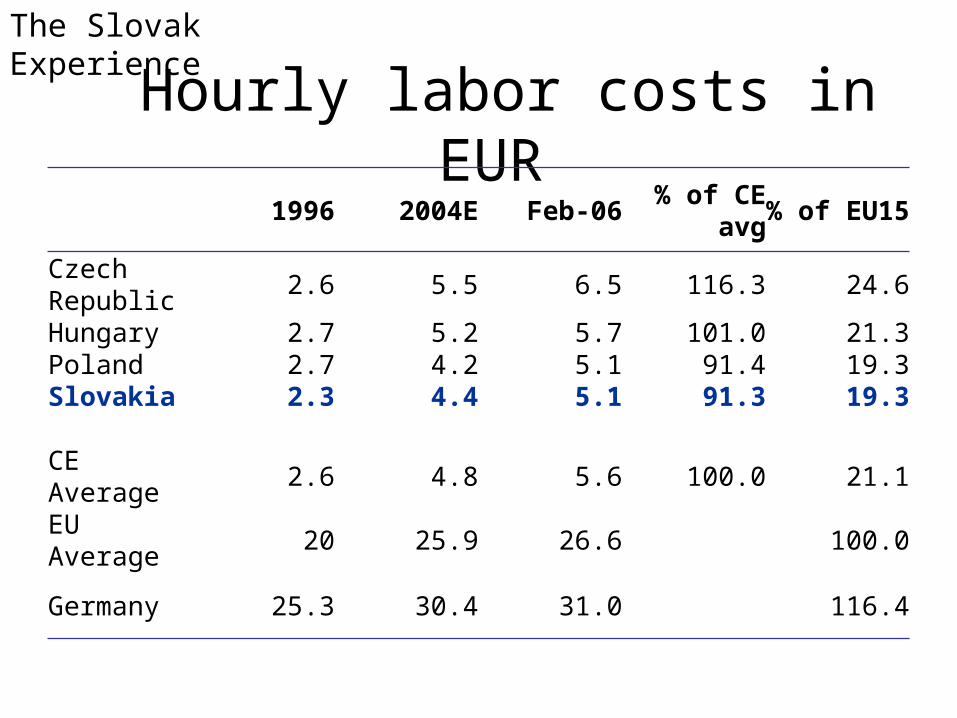
Hourly labor costs in EUR1996 2004E Feb-06
% of CE avg
% of EU15
Czech Republic
2.6 5.5 6.5 116.3 24.6
Hungary 2.7 5.2 5.7 101.0 21.3Poland 2.7 4.2 5.1 91.4 19.3Slovakia 2.3 4.4 5.1 91.3 19.3
CE Average
2.6 4.8 5.6 100.0 21.1
EU Average
20 25.9 26.6 100.0
Germany 25.3 30.4 31.0 116.4
The Slovak Experience
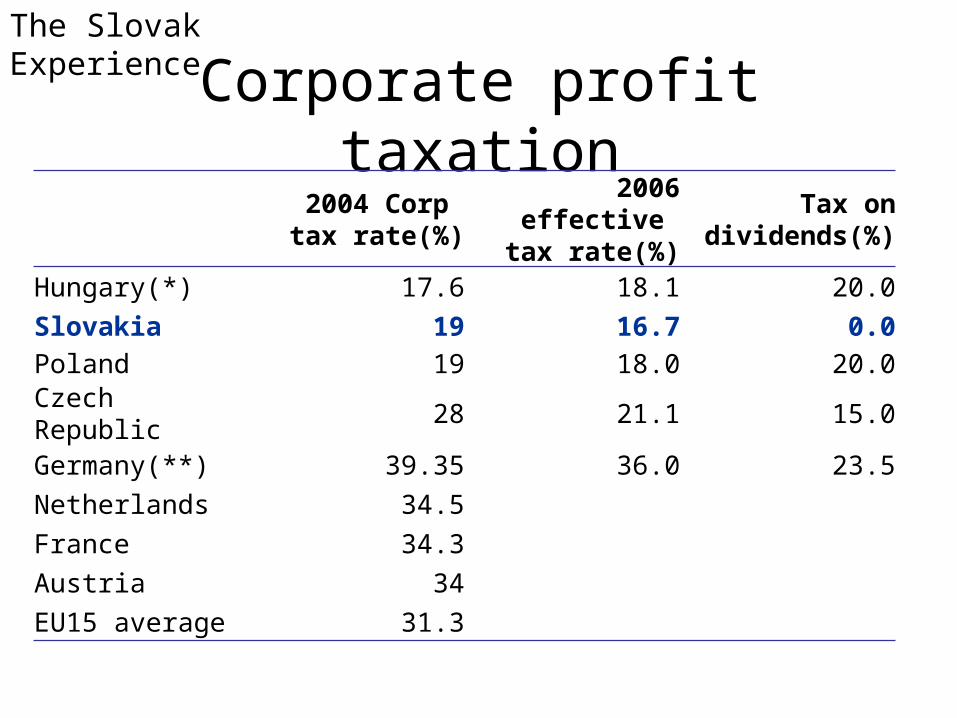
Corporate profit taxation2004 Corp tax rate(%)
2006 effective tax rate(%)
Tax on dividends(%)
Hungary(*) 17.6 18.1 20.0
Slovakia 19 16.7 0.0
Poland 19 18.0 20.0
Czech Republic 28 21.1 15.0
Germany(**) 39.35 36.0 23.5
Netherlands 34.5
France 34.3
Austria 34
EU15 average 31.3
The Slovak Experience
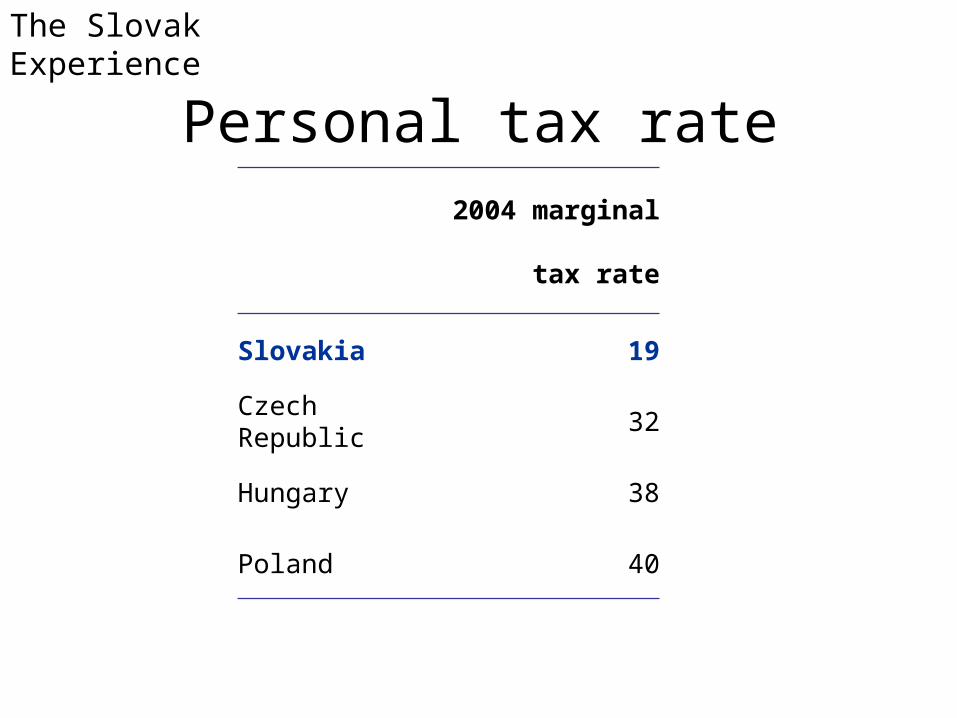
Personal tax rate
2004 marginal tax rate
Slovakia 19
Czech Republic 32
Hungary 38
Poland 40
The Slovak Experience
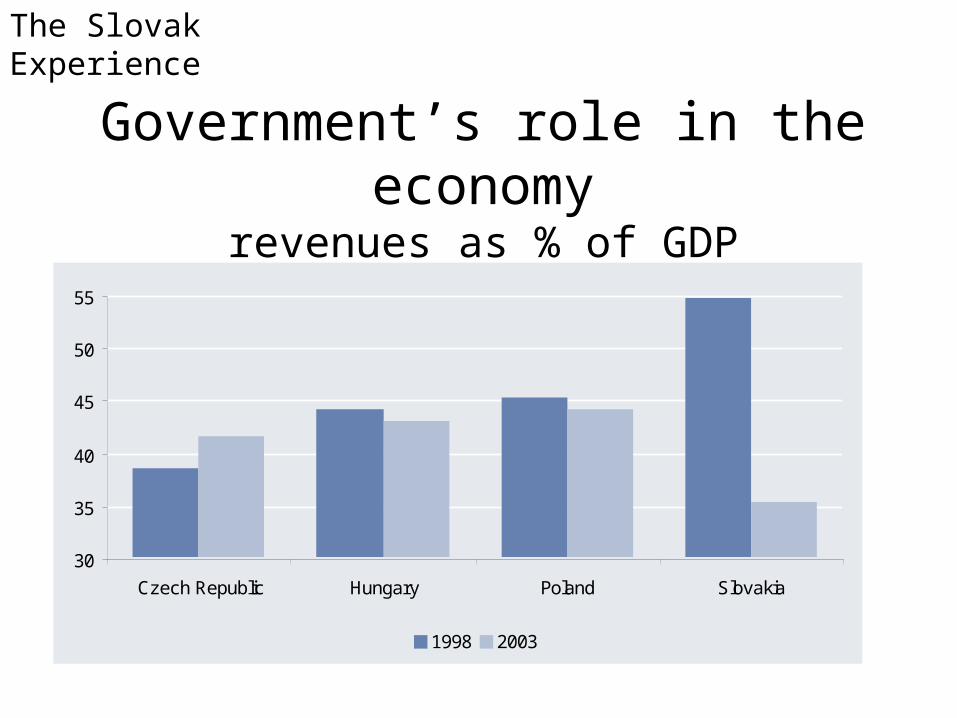
Government’s role in the economyrevenues as % of GDP
30
35
40
45
50
55
Czech Republic Hungary Poland Slovakia
1998 2003
The Slovak Experience
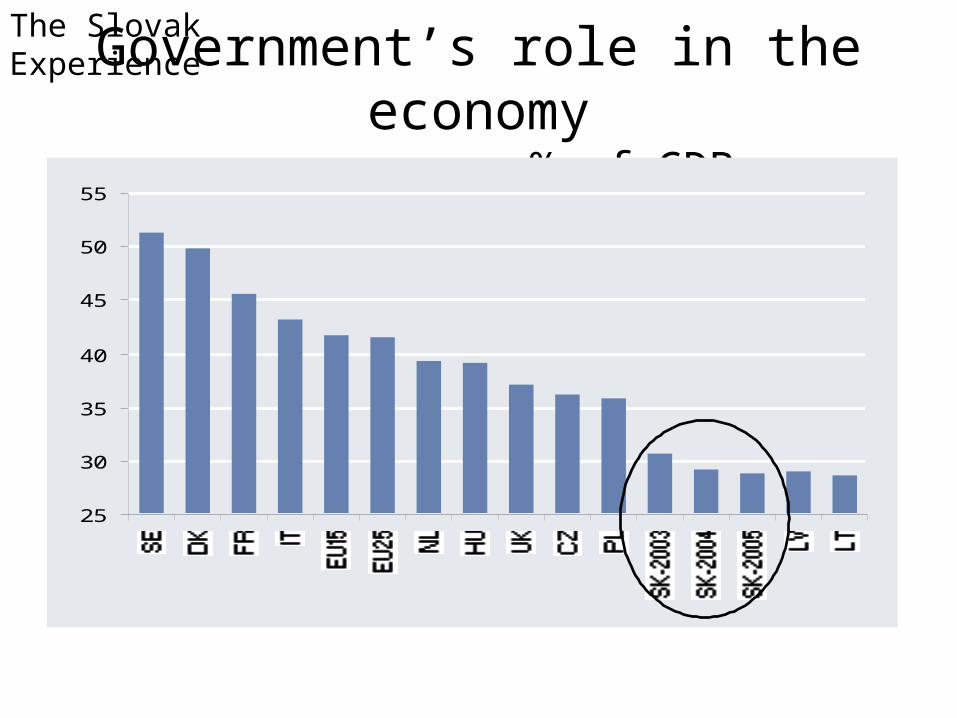
Government’s role in the economyrevenues as % of GDP
25
30
35
40
45
50
55
The Slovak Experience

Conclusions
• Communist experience taught us that:– Government failure bigger problem than market
failure– Governments lack information and incentives to
manage economy appropriately– Property rights play an important role, common
property invites shirking, hinders activity
Conclusions
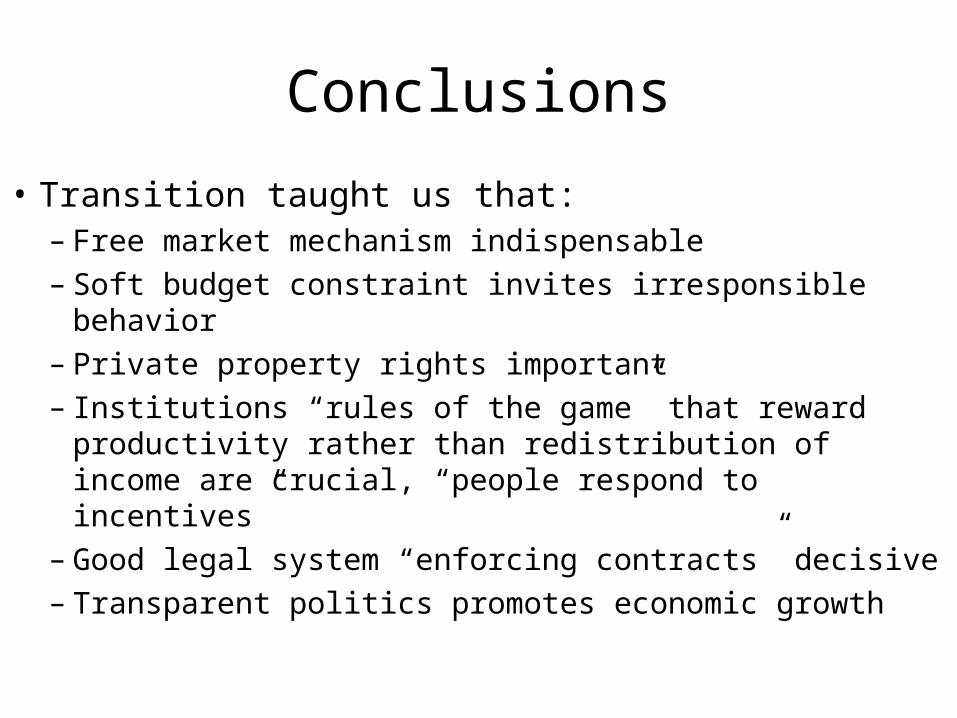
• Transition taught us that:– Free market mechanism indispensable– Soft budget constraint invites irresponsible behavior– Private property rights important– Institutions “rules of the game” that reward
productivity rather than redistribution of income are crucial, “people respond to incentives”
– Good legal system “enforcing contracts” decisive – Transparent politics promotes economic growth

AGRICULTURAL TRANSITION
2nd part of presentation
Introduction
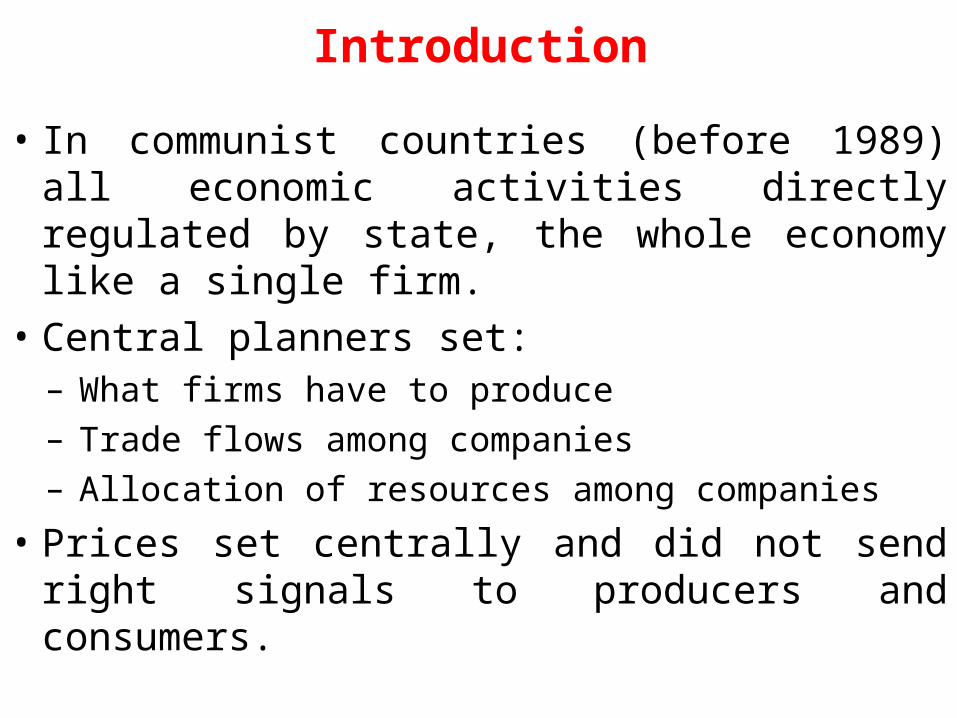
• In communist countries (before 1989) all economic activities directly regulated by state, the whole economy like a single firm.
• Central planners set:– What firms have to produce– Trade flows among companies – Allocation of resources among companies
• Prices set centrally and did not send right signals to producers and consumers.
Introduction cont.
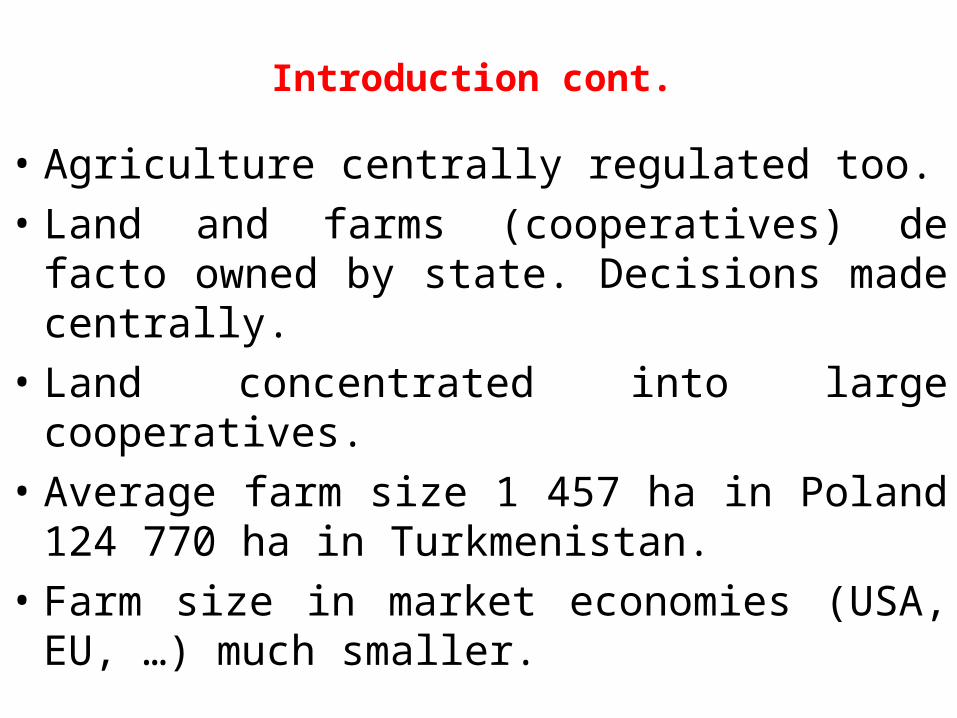
• Agriculture centrally regulated too.• Land and farms (cooperatives) de facto
owned by state. Decisions made centrally.
• Land concentrated into large cooperatives.
• Average farm size 1 457 ha in Poland 124 770 ha in Turkmenistan.
• Farm size in market economies (USA, EU, …) much smaller.
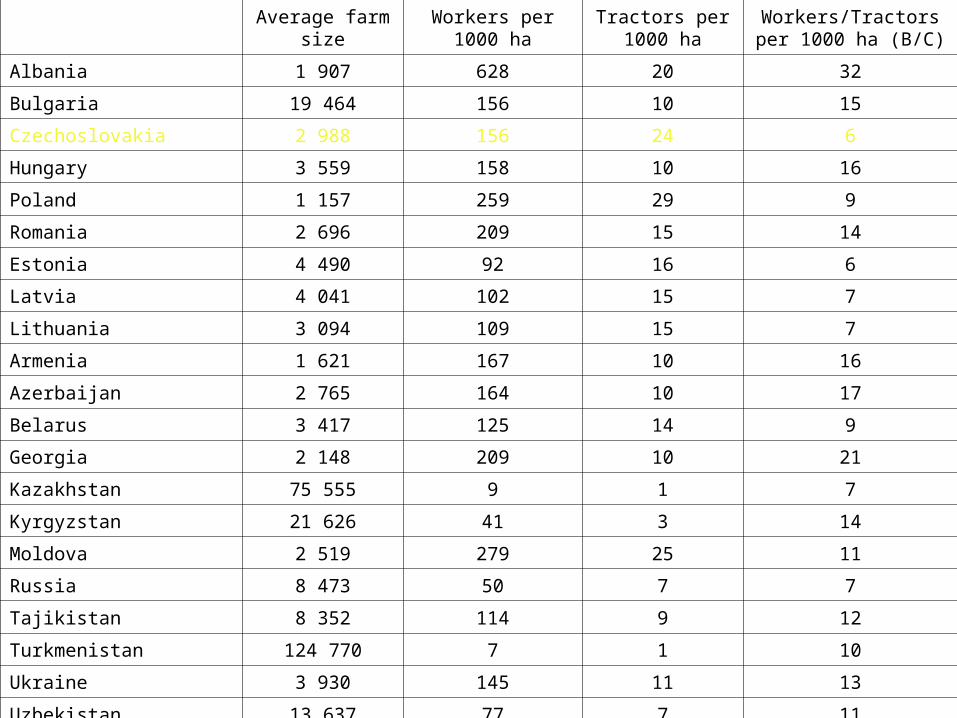
Average farm size Workers per 1000 ha Tractors per 1000 ha
Workers/Tractors per 1000 ha (B/C)
Albania 1 907 628 20 32
Bulgaria 19 464 156 10 15
Czechoslovakia 2 988 156 24 6
Hungary 3 559 158 10 16
Poland 1 157 259 29 9
Romania 2 696 209 15 14
Estonia 4 490 92 16 6
Latvia 4 041 102 15 7
Lithuania 3 094 109 15 7
Armenia 1 621 167 10 16
Azerbaijan 2 765 164 10 17
Belarus 3 417 125 14 9
Georgia 2 148 209 10 21
Kazakhstan 75 555 9 1 7
Kyrgyzstan 21 626 41 3 14
Moldova 2 519 279 25 11
Russia 8 473 50 7 7
Tajikistan 8 352 114 9 12
Turkmenistan 124 770 7 1 10
Ukraine 3 930 145 11 13
Uzbekistan 13 637 77 7 11
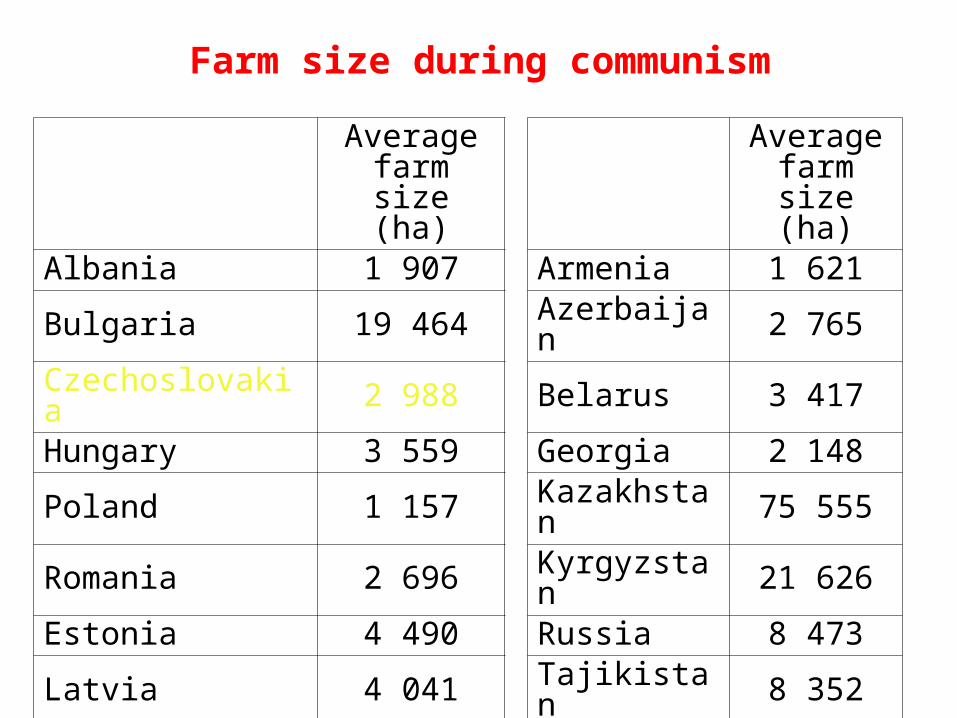
Farm size during communism
Average farm size
(ha)
Average farm size
(ha)
Albania 1 907 Armenia 1 621
Bulgaria 19 464 Azerbaijan 2 765
Czechoslovakia 2 988 Belarus 3 417
Hungary 3 559 Georgia 2 148
Poland 1 157 Kazakhstan 75 555
Romania 2 696 Kyrgyzstan 21 626
Estonia 4 490 Russia 8 473
Latvia 4 041 Tajikistan 8 352
Lithuania 3 094 Turkmenistan 124 770
Ukraine 3 930
Uzbekistan 13 637
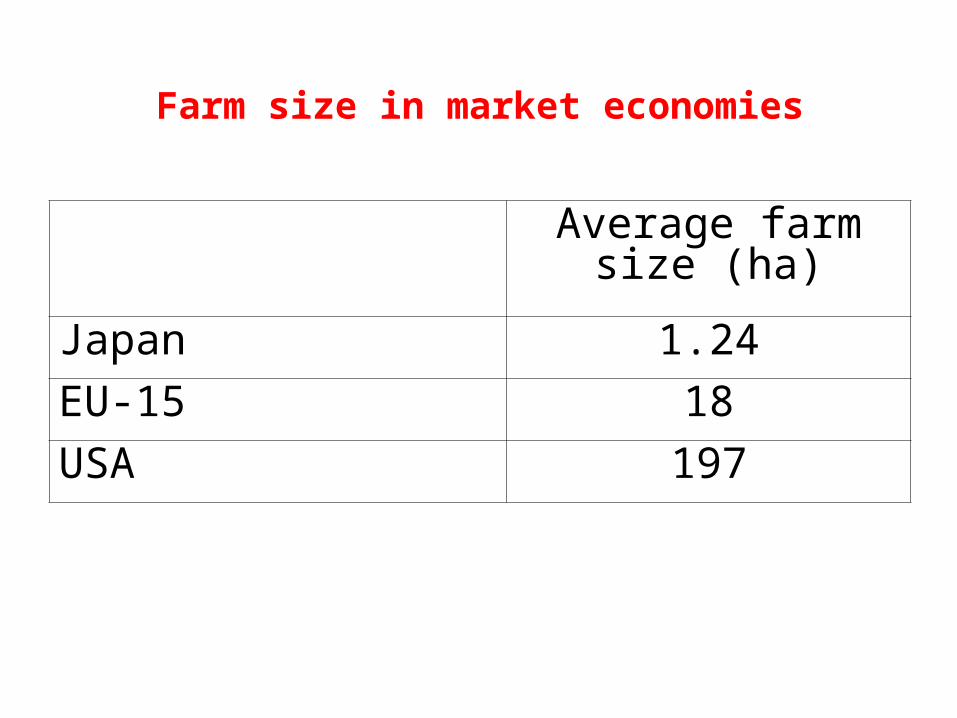
Farm size in market economies
Average farm size (ha)
Japan 1.24
EU-15 18
USA 197
Introduction cont.
• 1989 – The Fall of Berlin Wall – collapse of communist regimes in CEE and FSU
• Transition from centrally planned economy to market economy.
• Transition involves institutional change (change of rules of the game in the form of laws, regulations, property rights, norms, …).
• Institutions constrain behavior of individuals and through this have impact on productivity of the economy.
• Market institutions support private incentives. Communist institutions hinder private incentives.
Introduction: cont.
• Transition of agriculture involves: 1. Privatization2. Farm restructuring3. Price liberalization4. Formation of market institutions
Privatization
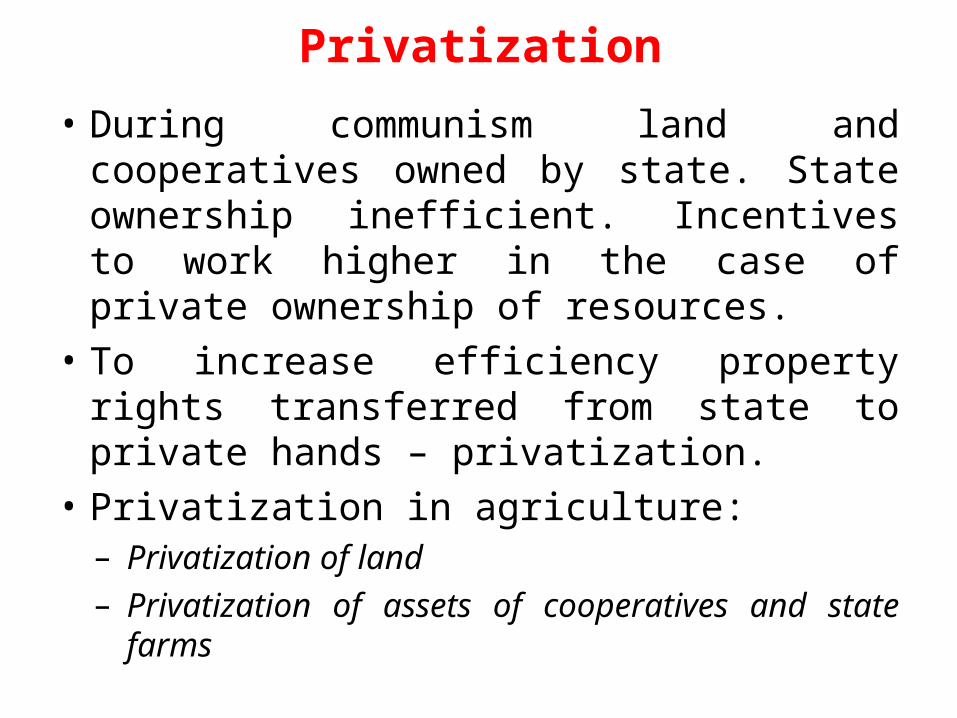
• During communism land and cooperatives owned by state. State ownership inefficient. Incentives to work higher in the case of private ownership of resources.
• To increase efficiency property rights transferred from state to private hands – privatization.
• Privatization in agriculture: – Privatization of land– Privatization of assets of cooperatives and
state farms
Privatization cont.
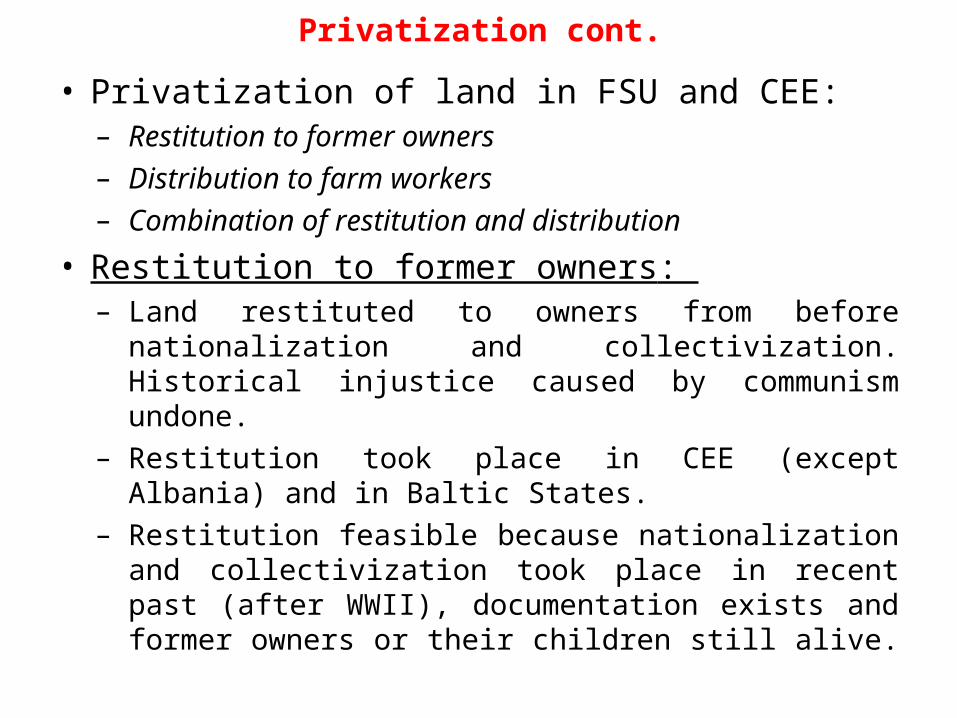
• Privatization of land in FSU and CEE: – Restitution to former owners– Distribution to farm workers– Combination of restitution and distribution
• Restitution to former owners: – Land restituted to owners from before
nationalization and collectivization. Historical injustice caused by communism undone.
– Restitution took place in CEE (except Albania) and in Baltic States.
– Restitution feasible because nationalization and collectivization took place in recent past (after WWII), documentation exists and former owners or their children still alive.
Privatization cont.
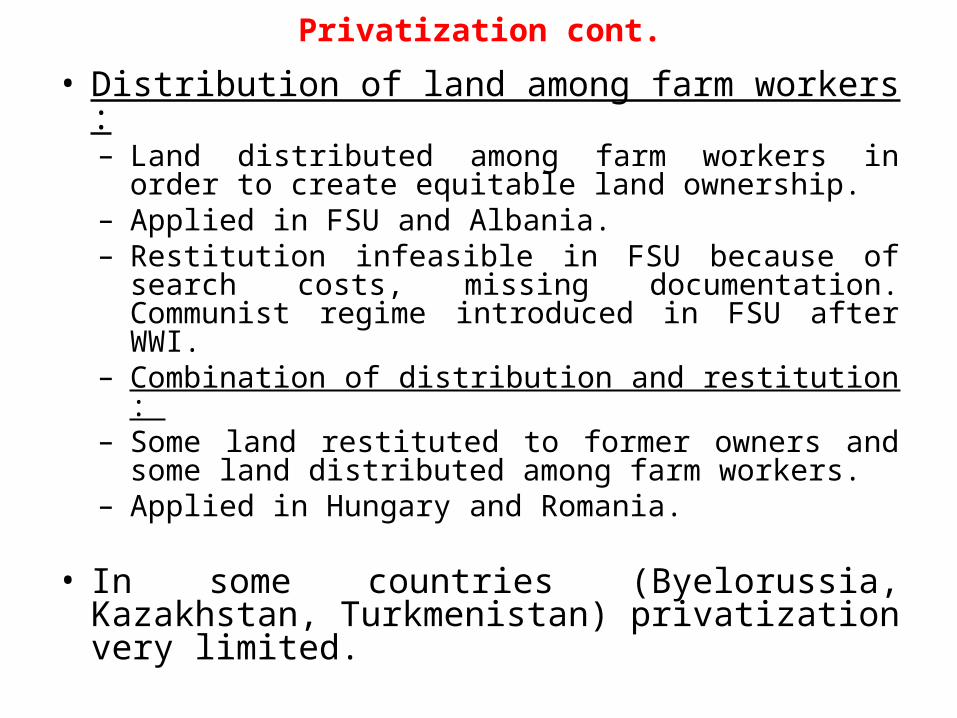
• Distribution of land among farm workers : – Land distributed among farm workers in order
to create equitable land ownership. – Applied in FSU and Albania. – Restitution infeasible in FSU because of
search costs, missing documentation. Communist regime introduced in FSU after WWI.
– Combination of distribution and restitution : – Some land restituted to former owners and
some land distributed among farm workers. – Applied in Hungary and Romania.
• In some countries (Byelorussia, Kazakhstan, Turkmenistan) privatization very limited.
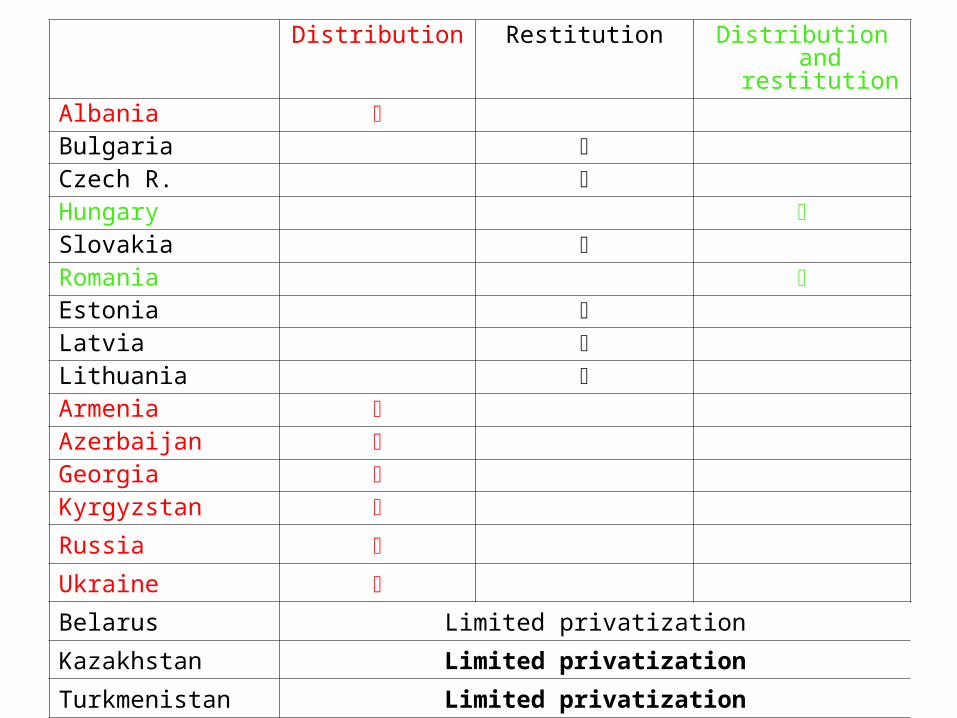
Distribution Restitution Distribution and restitution
Albania
Bulgaria
Czech R.
Hungary
Slovakia
Romania
Estonia
Latvia
Lithuania
Armenia
Azerbaijan
Georgia
Kyrgyzstan
Russia
Ukraine
Belarus Limited privatization
Kazakhstan Limited privatization
Turkmenistan Limited privatization
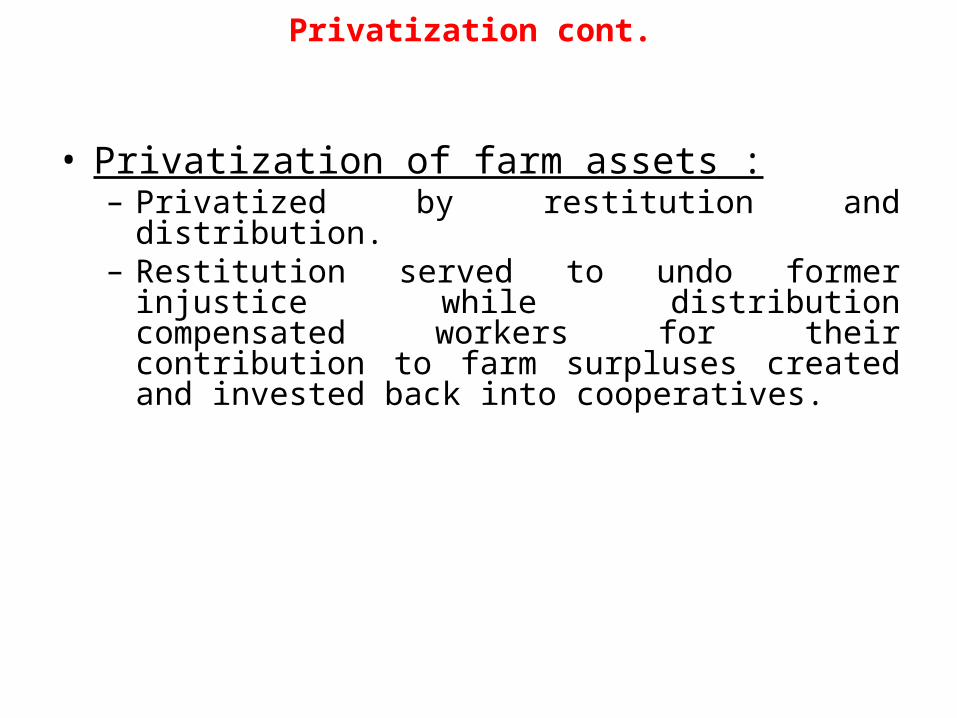
Privatization cont.
• Privatization of farm assets : – Privatized by restitution and distribution. – Restitution served to undo former injustice
while distribution compensated workers for their contribution to farm surpluses created and invested back into cooperatives.
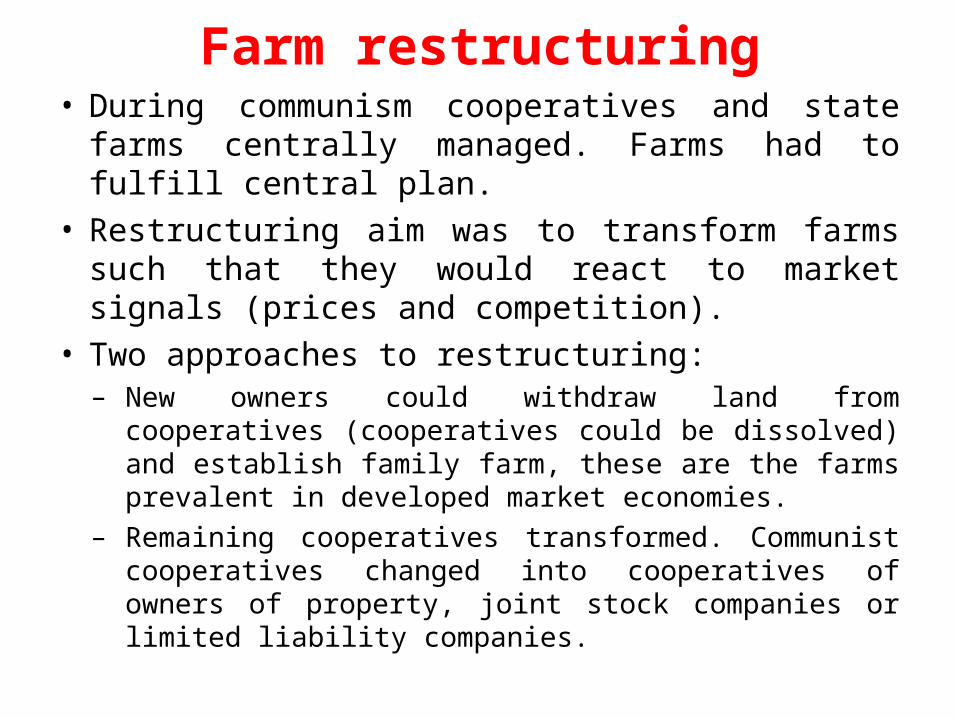
Farm restructuring• During communism cooperatives and state
farms centrally managed. Farms had to fulfill central plan.
• Restructuring aim was to transform farms such that they would react to market signals (prices and competition).
• Two approaches to restructuring: – New owners could withdraw land from
cooperatives (cooperatives could be dissolved) and establish family farm, these are the farms prevalent in developed market economies.
– Remaining cooperatives transformed. Communist cooperatives changed into cooperatives of owners of property, joint stock companies or limited liability companies.
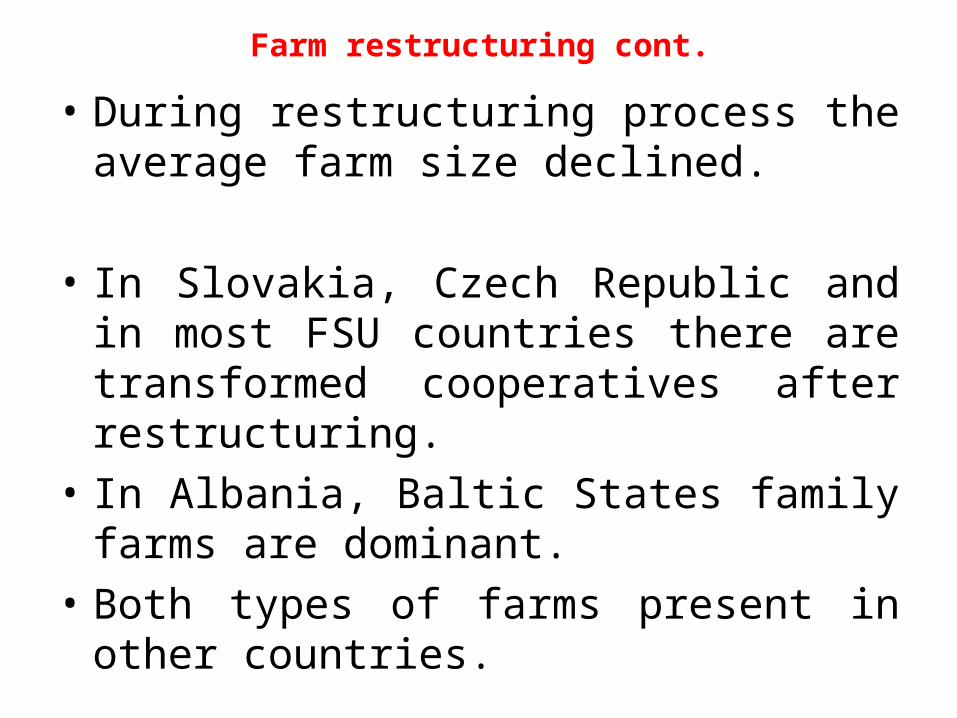
Farm restructuring cont.
• During restructuring process the average farm size declined.
• In Slovakia, Czech Republic and in most FSU countries there are transformed cooperatives after restructuring.
• In Albania, Baltic States family farms are dominant.
• Both types of farms present in other countries.
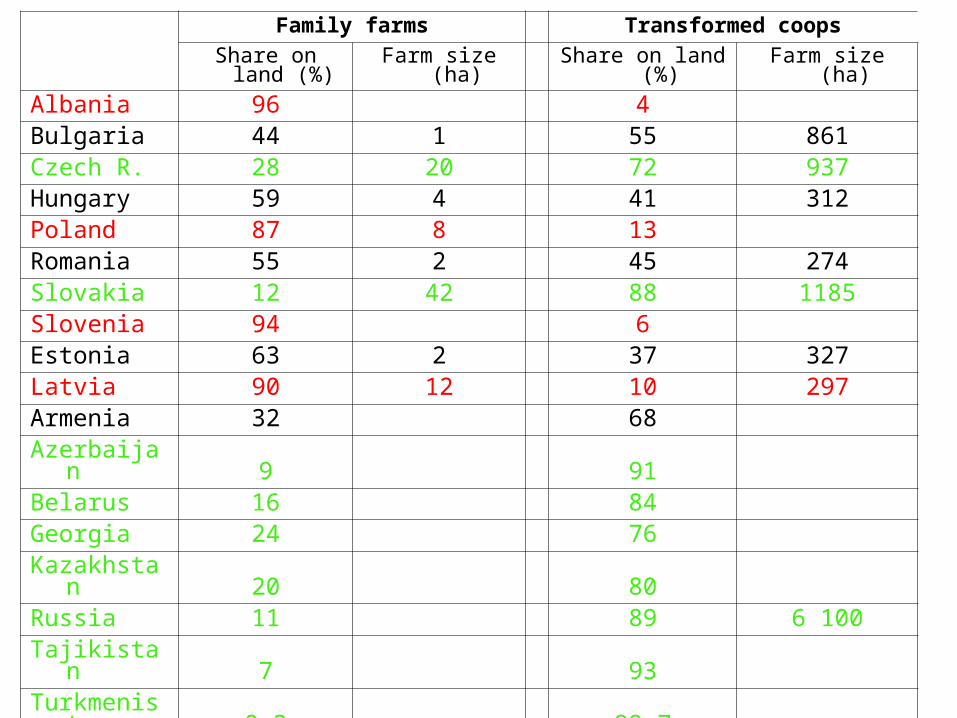
Family farms Transformed coops
Share on land (%) Farm size (ha) Share on land (%) Farm size (ha)
Albania 96 4
Bulgaria 44 1 55 861
Czech R. 28 20 72 937
Hungary 59 4 41 312
Poland 87 8 13
Romania 55 2 45 274
Slovakia 12 42 88 1185
Slovenia 94 6
Estonia 63 2 37 327
Latvia 90 12 10 297
Armenia 32 68
Azerbaijan 9 91
Belarus 16 84
Georgia 24 76
Kazakhstan 20 80
Russia 11 89 6 100
Tajikistan 7 93
Turkmenistan 0.3 99.7
Uzbekistan 4 96
Ukraine 17 83 2 100
Price liberalization• Prices are important in market economy.
Prices provide signals to market participants how scarce commodities are.
• High price may signal high demand. Profit maximizing firms therefore increase production. Firms allocate resources to goods with the highest demand which results in efficient allocation of resources.
• In communism prices regulated by the state. Prices actually used only as an accounting tool to monitor state owned firms. Communist regimes therefore created surpluses of some goods and shortages of other goods.
Price liberalization cont.
• Price liberalization was an integral part of reforms.
• Generally price liberalization lead to increase of price level.
• The highest increase of prices observed for agricultural inputs while prices of agricultural outputs increased less. The reason was shortage of inputs and surplus of outputs prior to liberalization.
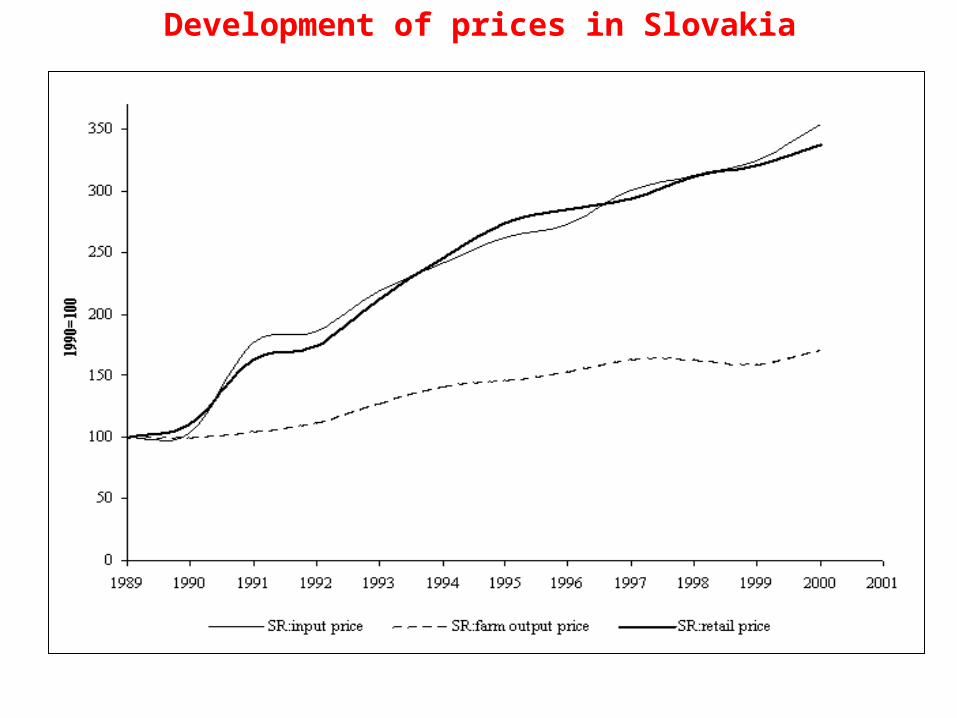
Development of prices in Slovakia
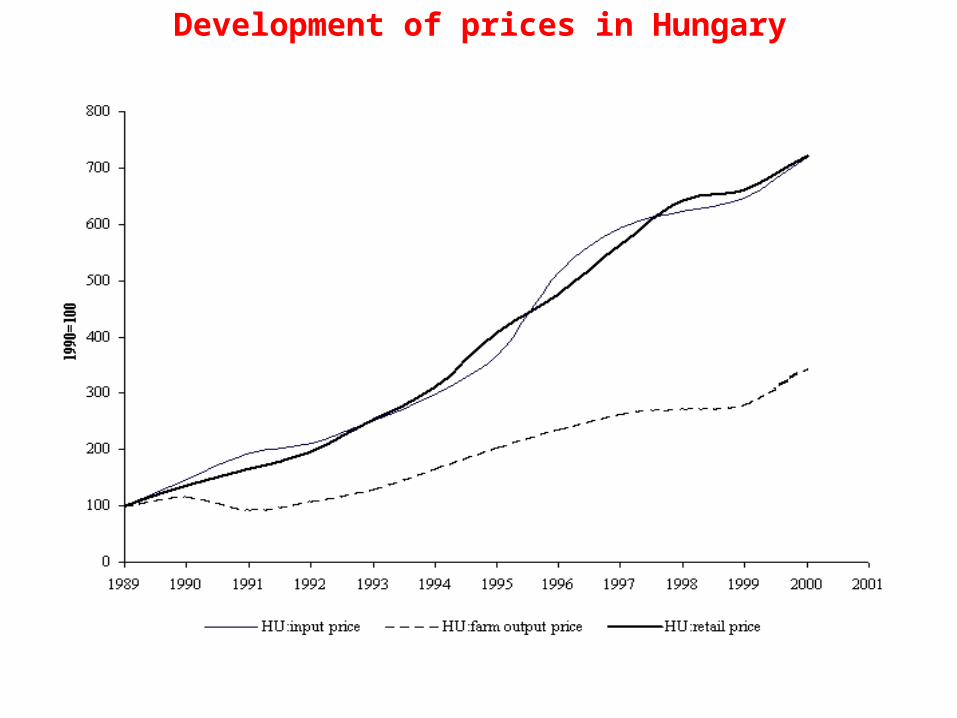
Development of prices in Hungary
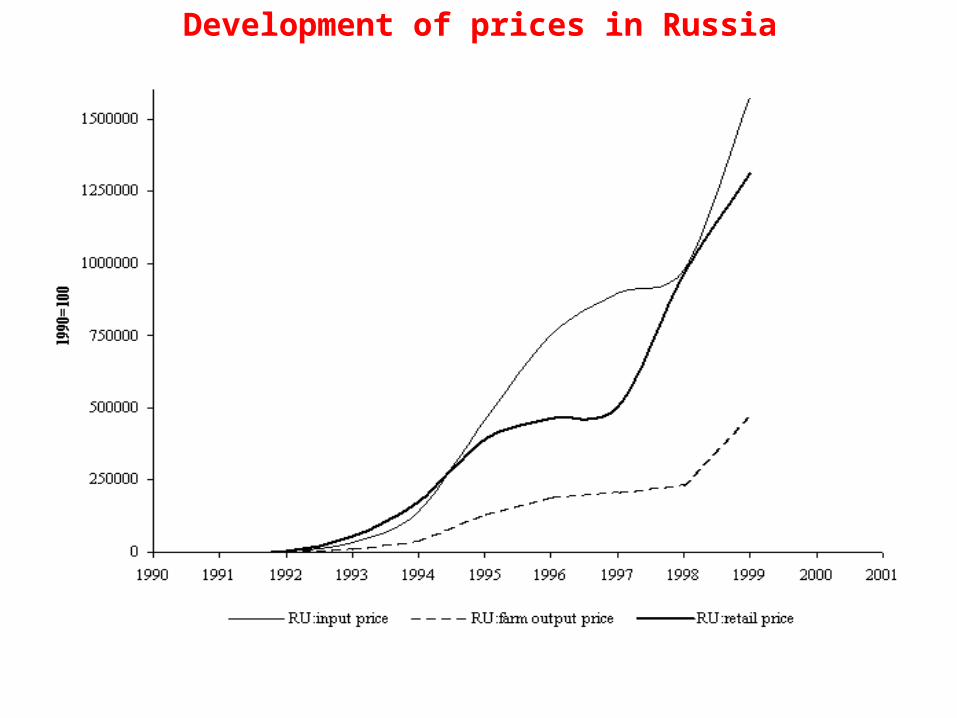
Development of prices in Russia
Formation of market institutions
• Former communist countries had to create institutions supporting market system.
• They include the creation of safe private ownership rights, regulations supporting competition and contract enforcement.
• Many countries, especially FSU, adopted laws preventing sales and renting of land which laead to inefficient allocation of resources.
Formation of market institutions cont.
• Some countries lacked full definition of ownership rights.
• For example, in FSU new owners received shares of cooperatives not entitlement to a particular parcel. Direct relationship between land and individual was not created.
• Better informed managers could constrain rights of less informed owners.
• There was less of the problem in CEE.
Formation of market institutions cont.
• In overall, in CEE and Baltic States ownership rights and law enforcement was stronger than in FSU.
The impact of transformation on agricultural production
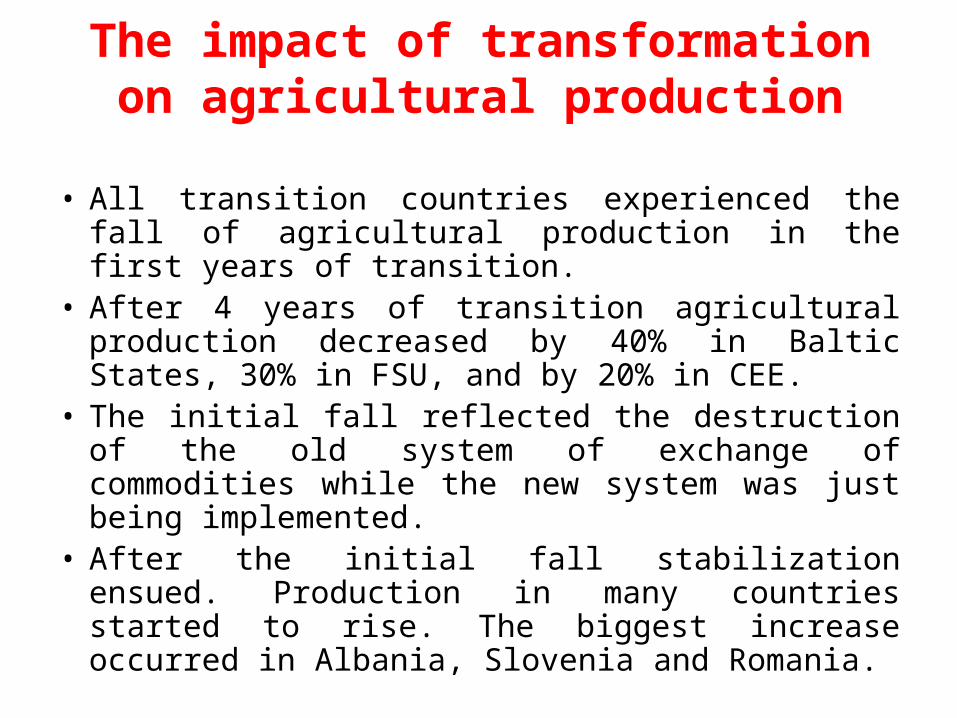
• All transition countries experienced the fall of agricultural production in the first years of transition.
• After 4 years of transition agricultural production decreased by 40% in Baltic States, 30% in FSU, and by 20% in CEE.
• The initial fall reflected the destruction of the old system of exchange of commodities while the new system was just being implemented.
• After the initial fall stabilization ensued. Production in many countries started to rise. The biggest increase occurred in Albania, Slovenia and Romania.
The impact of transformation on agricultural production
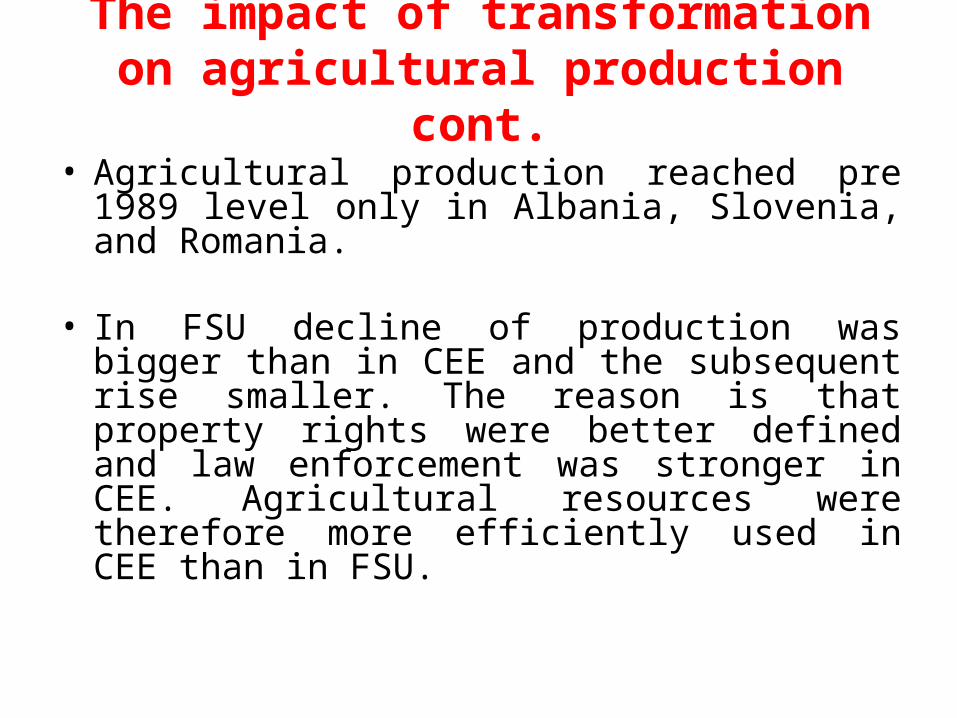
cont.• Agricultural production reached pre 1989
level only in Albania, Slovenia, and Romania.
• In FSU decline of production was bigger than in CEE and the subsequent rise smaller. The reason is that property rights were better defined and law enforcement was stronger in CEE. Agricultural resources were therefore more efficiently used in CEE than in FSU.
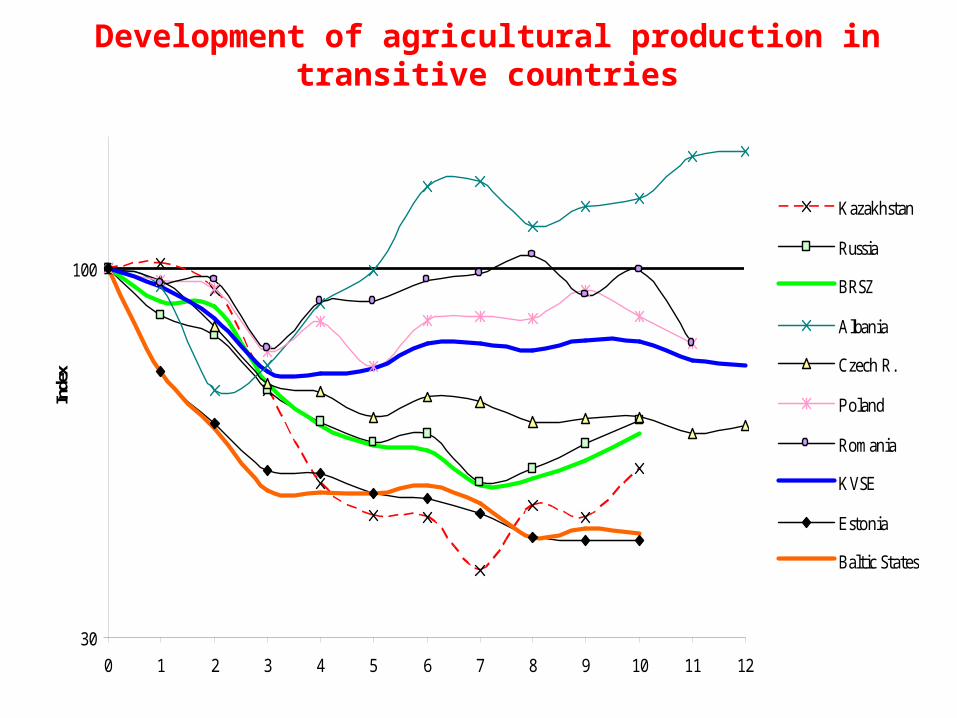
Development of agricultural production in transitive countries
30
100
0 1 2 3 4 5 6 7 8 9 10 11 12
Inde
x
Kazakhstan
Russia
BRSZ
Albania
Czech R.
Poland
Romania
KVSE
Estonia
Baltic States
Počet rokov od začiatku transformačného obdobia
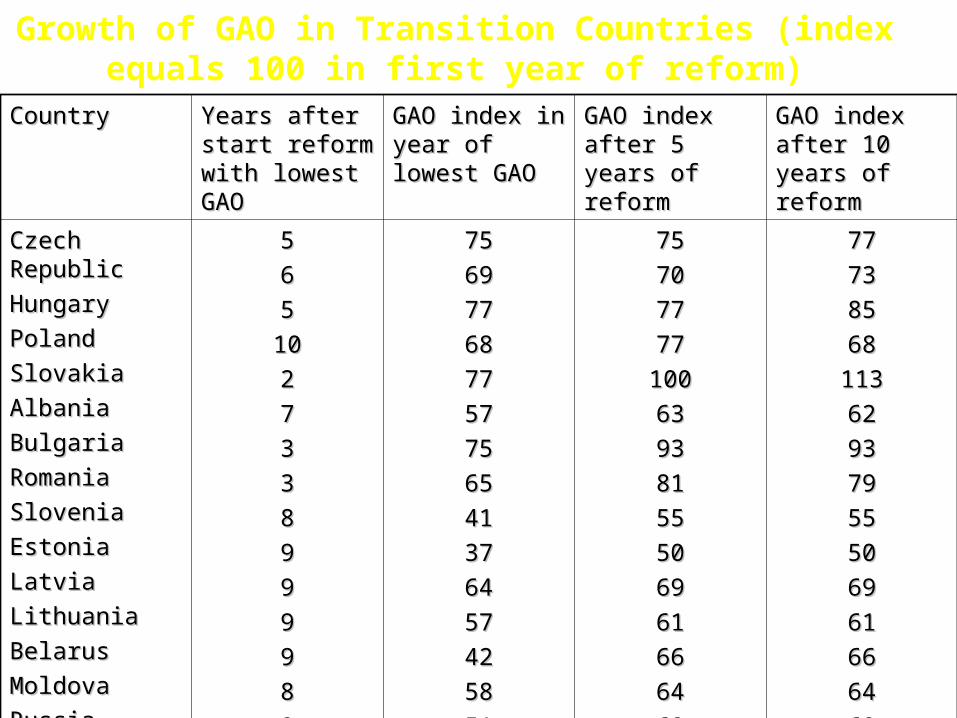
Growth of GAO in Transition Countries (index equals 100 in first year of reform)
CountryCountry Years after Years after start reform start reform with lowest with lowest GAOGAO
GAO index in GAO index in year of lowest year of lowest GAOGAO
GAO index GAO index after 5 years after 5 years of reformof reform
GAO index GAO index after 10 years after 10 years of reformof reform
Czech Czech RepublicRepublic
HungaryHungary
PolandPoland
SlovakiaSlovakia
AlbaniaAlbania
BulgariaBulgaria
RomaniaRomania
SloveniaSlovenia
EstoniaEstonia
LatviaLatvia
LithuaniaLithuania
BelarusBelarus
MoldovaMoldova
RussiaRussia
UkraineUkraine
55
66
55
1010
22
77
33
33
88
99
99
99
99
88
99
7575
6969
7777
6868
7777
5757
7575
6565
4141
3737
6464
5757
4242
5858
5151
7575
7070
7777
7777
100100
6363
9393
8181
5555
5050
6969
6161
6666
6464
6969
7777
7373
8585
6868
113113
6262
9393
7979
5555
5050
6969
6161
6666
6464
6969
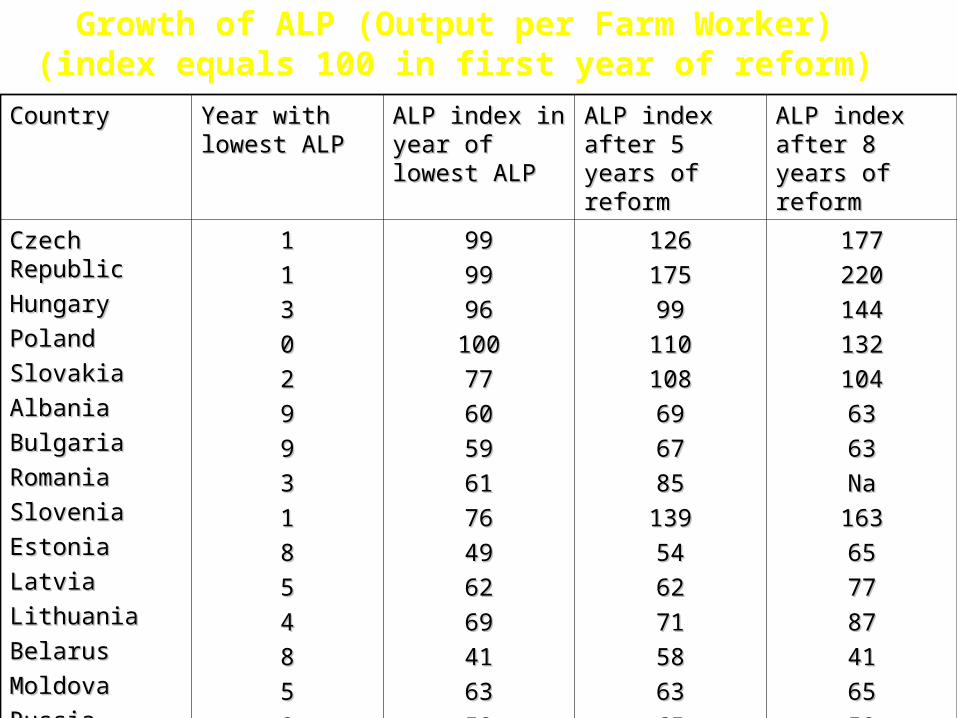
Growth of ALP (Output per Farm Worker) (index equals 100 in first year of reform)
CountryCountry Year with Year with lowest ALPlowest ALP
ALP index in ALP index in year of lowest year of lowest ALPALP
ALP index ALP index after 5 years after 5 years of reformof reform
ALP index ALP index after 8 years after 8 years of reformof reform
Czech Czech RepublicRepublic
HungaryHungary
PolandPoland
SlovakiaSlovakia
AlbaniaAlbania
BulgariaBulgaria
RomaniaRomania
SloveniaSlovenia
EstoniaEstonia
LatviaLatvia
LithuaniaLithuania
BelarusBelarus
MoldovaMoldova
RussiaRussia
UkraineUkraine
11
11
33
00
22
99
99
33
11
88
55
44
88
55
88
9999
9999
9696
100100
7777
6060
5959
6161
7676
4949
6262
6969
4141
6363
5252
126126
175175
9999
110110
108108
6969
6767
8585
139139
5454
6262
7171
5858
6363
6565
177177
220220
144144
132132
104104
6363
6363
NaNa
163163
6565
7777
8787
4141
6565
5252
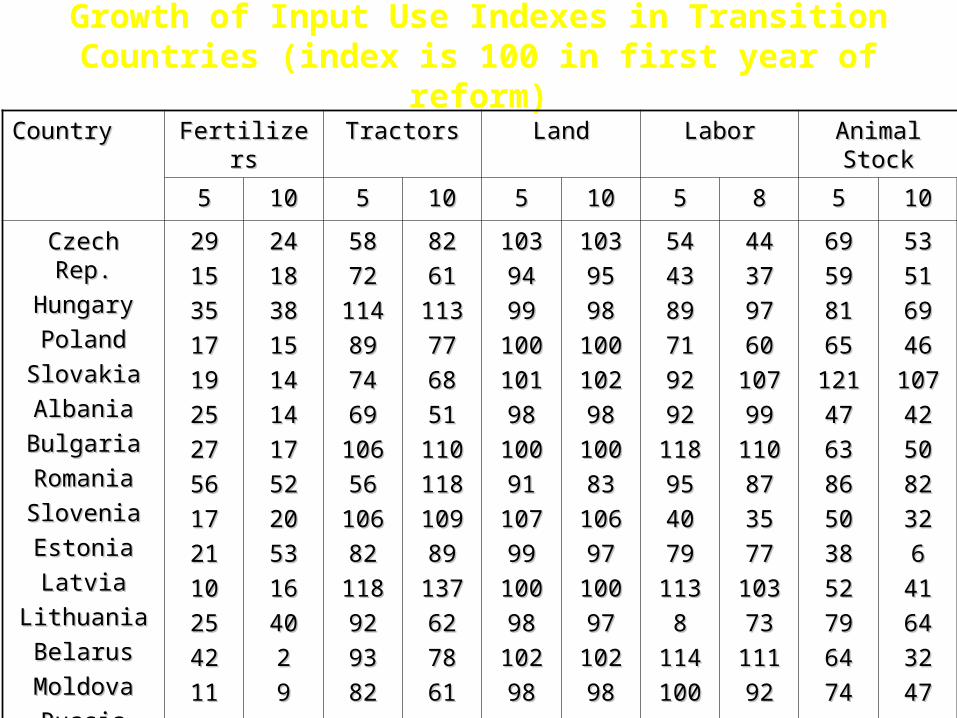
Growth of Input Use Indexes in Transition Countries (index is 100 in first year of reform)
CountryCountry FertilizersFertilizers TractorsTractors LandLand LaborLabor Animal Animal StockStock
55 1010 55 1010 55 1010 55 88 55 1010
Czech Rep.Czech Rep.
HungaryHungary
PolandPoland
SlovakiaSlovakia
AlbaniaAlbania
BulgariaBulgaria
RomaniaRomania
SloveniaSlovenia
EstoniaEstonia
LatviaLatvia
LithuaniaLithuania
BelarusBelarus
MoldovaMoldova
RussiaRussia
UkraineUkraine
2929
1515
3535
1717
1919
2525
2727
5656
1717
2121
1010
2525
4242
1111
2424
2424
1818
3838
1515
1414
1414
1717
5252
2020
5353
1616
4040
22
99
1111
5858
7272
114114
8989
7474
6969
106106
5656
106106
8282
118118
9292
9393
8282
9292
8282
6161
113113
7777
6868
5151
110110
118118
109109
8989
137137
6262
7878
6161
6868
103103
9494
9999
100100
101101
9898
100100
9191
107107
9999
100100
9898
102102
9898
100100
103103
9595
9898
100100
102102
9898
100100
8383
106106
9797
100100
9797
102102
9898
9999
5454
4343
8989
7171
9292
9292
118118
9595
4040
7979
113113
88
114114
100100
106106
4444
3737
9797
6060
107107
9999
110110
8787
3535
7777
103103
7373
111111
9292
102102
6969
5959
8181
6565
121121
4747
6363
8686
5050
3838
5252
7979
6464
7474
7575
5353
5151
6969
4646
107107
4242
5050
8282
3232
66
4141
6464
3232
4747
4141
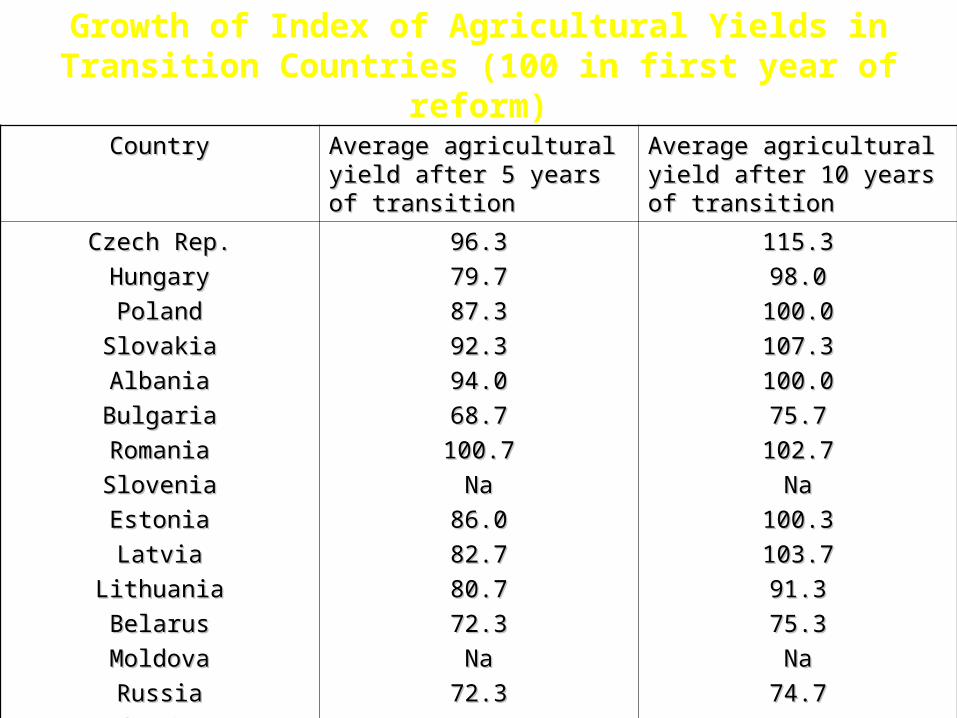
Growth of Index of Agricultural Yields in Transition Countries (100 in first year of reform)
CountryCountry Average agricultural Average agricultural yield after 5 years of yield after 5 years of transitiontransition
Average agricultural Average agricultural yield after 10 years of yield after 10 years of transitiontransition
Czech Rep.Czech Rep.
HungaryHungary
PolandPoland
SlovakiaSlovakia
AlbaniaAlbania
BulgariaBulgaria
RomaniaRomania
SloveniaSlovenia
EstoniaEstonia
LatviaLatvia
LithuaniaLithuania
BelarusBelarus
MoldovaMoldova
RussiaRussia
UkraineUkraine
96.396.3
79.779.7
87.387.3
92.392.3
94.094.0
68.768.7
100.7100.7
NaNa
86.086.0
82.782.7
80.780.7
72.372.3
NaNa
72.372.3
78.378.3
115.3115.3
98.098.0
100.0100.0
107.3107.3
100.0100.0
75.775.7
102.7102.7
NaNa
100.3100.3
103.7103.7
91.391.3
75.375.3
NaNa
74.774.7
71.071.0

Thank you for your attention