Embed Size (px)
Citation preview

SLOSH
New Orleans Basin
2012 Update
Michael Koziara
Science and Operations Officer
National Weather Service
Slidell, LA

The Basics
• What is storm surge?
• What is SLOSH?
– Details
– Assumptions
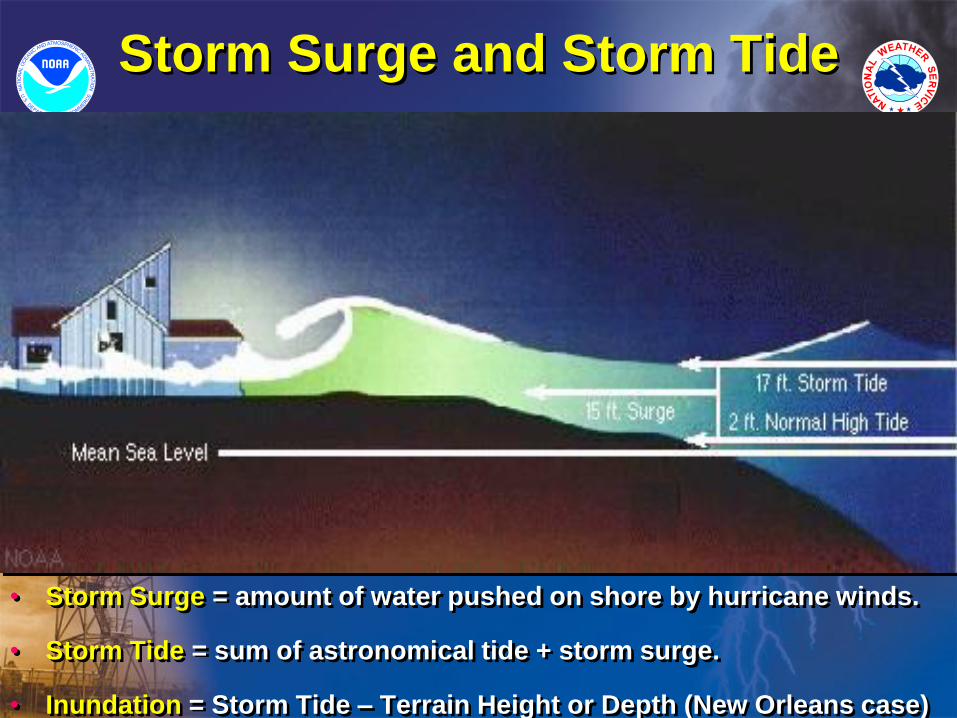
Storm Surge and Storm Tide
• Storm Surge = amount of water pushed on shore by hurricane winds.
• Storm Tide = sum of astronomical tide + storm surge.
• Inundation = Storm Tide – Terrain Height or Depth (New Orleans case)

Landfall
Wind Wind Wind
STORM SURGE
b. Side View of Cross Section “ABC”
Sand Dunes
on Barrier
Island
A B C
0’
50’
100’
150’
200’
Continental Shelf
a. Top View of Sea Surface and Land
Barrier
Island Mainland
A B C
Eye
Current
MSL
Meteorological Oceanographic

What is SLOSH?
Sea, Lake and Overland Surge
from Hurricanes • A computer
model developed by the National Weather Service (NWS) to estimate storm surge heights and winds resulting from historical, hypothetical, or predicted hurricanes.

SLOSH Grid
Types of Information for each
SLOSH Grid Cell • Polar coordinate grid
• Each grid cell has
– Average surge height
– Terrain elevation
– Barriers such a levees,
roads and railroads
– Cuts to allow flow
through deep water
passes.
– Bathymetry
• Accuracy +/- 20% of peak
surge values

New Orleans Hurricane
Protection Levee System
• Updated and
improved
annually by
Corps of
Engineers
(COE).
• Annual
updates
made to
SLOSH using
COE data.

SLOSH Assumptions
• Levees and barriers are assumed to
maintain structural integrity even if over
topped by storm surge. SLOSH is not an
engineering model.
• No storm frequency can be attributed to
any MEOW.
• Run off from rainfall not included in
SLOSH. It is considered to be minor
compared to storm surge.
• Wind Waves are not included in SLOSH.
Use 1/3 surge height to get estimate.

Storm Surge Products
• MOMS
• MEOWS
• Ensembles or P-surge
• When do I use them?

Which Storm Surge Product
Do I Use and When Do I Use It?
• MEOWs
• MOMS
• Ensemble or
Storm Surge
Probability

MOM – Maximum of MEOW • MEOW – Maximum Envelope
of Water from a family of
land falling hurricanes
which share the same
• Direction
• Forward Speed
• Category
• Maximum amount of surge
is saved from each
individual SLOSH model run
and displayed here
• MOMS take this a step
further by combining all
MEOW possibilities
(considering all directions
and forward speeds) within
each Category.

New Orleans Basin 2012
How many individual SLOSH
Model Runs are Used to Make
MEOWS? Answer: 23,760 Category Direction
(moving
toward)
Speed
(mph)
Tide - ft
(2.0 / 0.0 )
RMW
(st mi)
Tracks Runs
0,1,2,3,4,5 W 5,10,15,25 High,Mean 15,25,40 20 2880
0,1,2,3,4,5 WNW 5,10,15,25 High,Mean 15,25,40 19 2736
0,1,2,3,4,5 NW 5,10,15,25 High,Mean 15,25,40 19 2736
0,1,2,3,4,5 NNW 5,10,15,25 High,Mean 15,25,40 19 2736
0,1.2.3.4.5 N 5,10,15,25 High,Mean 15,25.40 20 2880
0,1,2,3.4,5 NNE 5,10,15,25 High,Mean 15,25,40 19 2736
0,1,2,3,4,5 NE 5,10,15,25 High,Mean 15,25,40 17 2448
0,1,2,3.4,5 ENE 5,10,15,25 High,Mean 15,25,40 17 2448
0,1,2,3.4,5 NE 5,10,15,25 High,Mean 15,25,40 15 2160

What is a MEOW? • MEOW – Maximum Envelope of Water from each member of a
family or ensemble of land falling model hurricanes.
• The Slosh Display Program has 216 MEOWS available for viewing.

What is a MEOW? • MEOW – Maximum Envelope of Water from each member of
a family or ensemble of land falling model hurricanes.

Why Do Use MEOWs or
Ensembles?
• Because we must take into account
Forecast Error and Size of Tropical Storm
or Hurricane!
• Types of Forecast Error
– Along track or speed – faster or slower?
– Cross track – right or left?
– Intensity – stronger or weaker?

National Hurricane Center
Track Error Trends

NHC Intensity Error Trends

Single Track Storm Surge Plot

Single Track Storm Surge Plot (moved track west)

Single Track Storm Surge Plot (moved track east)

SLOSH Ensemble developed to
account for uncertainty in track
and intensity forecasts

• More intense storms cause higher surges
• Highest surges usually occur to the right of the storm track
• Fast moving storms = high surges along the open coast
• Slow moving storms = greater flooding inside bays and estuaries

• Larger storms affect longer stretches of coastline
• Direction of storm approach often impacts the extent of flooding
• Shallow slopes in the continental shelf allow greater storm surge with small waves
• Storm surge is less in areas with steeper coastal slopes, but large breaking waves can occur

MOMs
• Maximum of MEOWS = MOM
• Terrebonne and Lafourche Parishes
including LA Highway 1
• MOMS display height in feet NAVD88 for
– Tropical Storm
– Saffir Simpson Categories 1, 2 , 3 , 4 , 5

Tropical Storm
(39 to 73 mph) MOM
• Surge Height – ft NAVD88

Category 1 (74 to 95 mph) MOM • Surge Height – ft NAVD88

Category 2 (96 to 110 mph) MOM • Surge Height – ft NAVD88

Category 3 (111 to 129 mph) MOM
• Surge Height – ft NAVD88

Category 4 (130-156 mph) MOM • Surge Height – ft NAVD88

Category 5 (> 157 mph) MOM • Surge Height – ft NAVD88

Just a Few MEOWS
LA Highway 1 Focus • Category impact
• Increasing category from
– Tropical Storm to 1
– 1 to 2
– 2 to 3
• Directional impact
• Northwest
• Speed impact
– 15 mph
• Inquire Height Option

Northwest 15 mph Cat 0 MEOW
• Minor flooding
along LA
Highway 1
south of
Thibodaux.
• Larose to
Golden
Meadow dry
due to
hurricane
protection
levee.
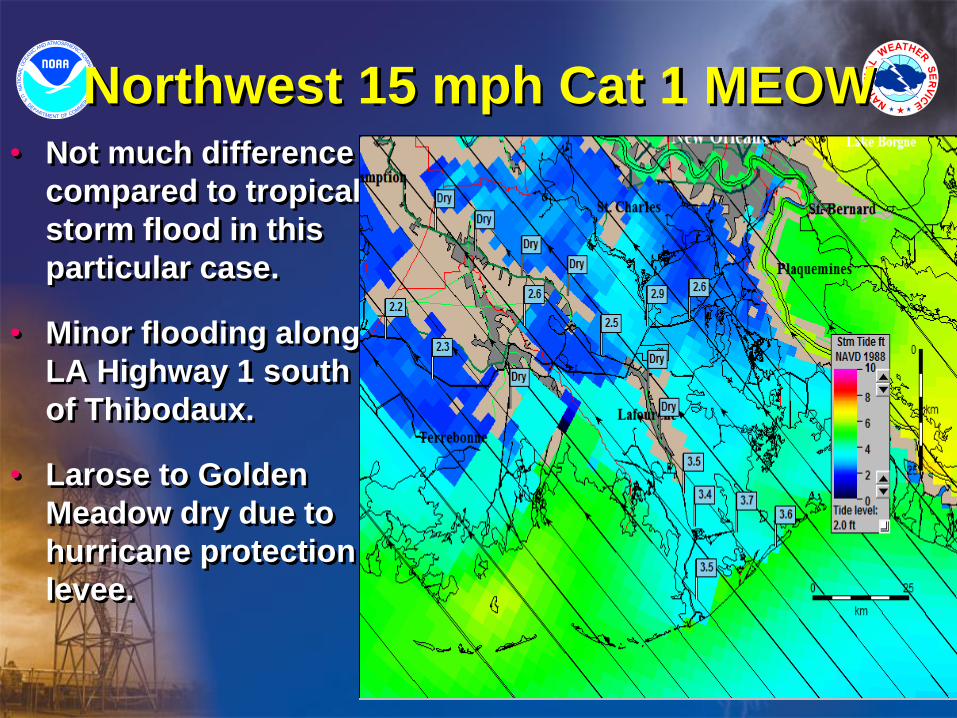
Northwest 15 mph Cat 1 MEOW • Not much difference
compared to tropical
storm flood in this
particular case.
• Minor flooding along
LA Highway 1 south
of Thibodaux.
• Larose to Golden
Meadow dry due to
hurricane protection
levee.

Northwest 15 mph Cat 2 MEOW
• Degree of flooding
has increased from
Cat 1 to Cat 2.
• Severe flooding
below Golden
Meadow and south
of Intracoastal
Waterway.
• Houma and
Thibodaux
threatened.

Northeast 15 mph Cat 3 MEOW
• Increasing category
from 2 to 3 causes
severe storm surge
flooding in most
places.
• Houma is
overwhelmed.
• Deep flood waters
threatening
Thibodaux.
• Inquire all heights
done for

Inquire Heights Option:
LA 1 Highway Approach to Grand Isle
• Available for all 219
MEOWS for a
specified area.
• Only have shown
deeper storm surge
for some Cat 1, 2 and
3 MEOWS here
• There are many Cat 2
possibilities that
could over top this
road trapping people
on Grand Isle.

What Would Hurricane Betsy
Storm Surge Look Like Today?

Summary • MOMs show that minor flooding can occur along LA
Highway 1 even for tropical storms.
• As the strength of the tropical storm or hurricane increases,
the degree of flooding increases.
• There is a great sensitivity of storm surge flooding for
slight changes in direction, forward speed and hurricane
strength.
• The difference between not getting any storm surge
flooding and catastrophic storm surge incident is a very
fine line that can be easily crossed by nature.
• In the real world, all possibilities come into play including
track/intensity forecast error, size of the hurricane and
initial water levels left over from prior hurricanes or tropical
storms.

Bonus Round
Surge Ensembles or
Exeedance Probabilities
• More advanced accounting of forecast
error than MEOWS.
• Takes in many possibilities including
– Track
– Strength
– Size

Probabilistic Storm Surge
Methodology
• Use an ensemble of SLOSH runs to create probabilistic storm surge (P-surge)
– Intended to be used operationally so it is based on NHC’s official advisory.
– P-surge’s ensemble perturbations are determined by statistics of past performance of NHC’s advisories
• P-surge technique accounts for Hurricane forecast errors which impact storm surge:
– Cross track errors (impacts Location)
– Along track errors (impacts Forward Speed)
– Intensity errors (impacts Pressure)
– Size of the storm errors.

Example: Katrina Advisory 23

Varying Katrina’s Tracks
• Include 90%
of possible
cross track
error (roughly 3
times the size
of the cone of
error).
• Spacing based on size of the storm

Varying the Other Parameters
• Size: Small, Medium, Large
• Forward Speed: Fast, Medium, Slow
• Intensity: Strong, Medium, Weak

Exceedance Probability of Surge (P-Surge)
Hurricane Katrina Example
• Ensembles
based on
current NHC
advisory and
forecast error.
• A 90 % chance
of surge heights
that could
occur.
• Or only a 10 %
chance of
greater surge
heights
possible.

Probability of Surge (P-Surge)
Hurricane Katrina Example • Probability of
Surge
Exceeding 10
feet.
• Available in one
foot increments
from 2 to 25 feet.
• Upper bound
increased from
10 to 25 feet in
2009.

Where can you access P-Surge product?
http://www.weather.gov/mdl/psurge
• When is it
available?
– Beginning when the NHC issues a hurricane watch or warning for the continental US
– As close to the advisory release time as possible

Goggle Map Interface
• Available in real
time in NHC home
page.
• Gives zoom, pan
navigation
capability.
• Datum used:
NGVD1929.

Gustav Advisory 30 Category 3 Landfall in 12 hours
Tropical Storm and Hurricane wind field expanded
increasing storm surge

Gustav Advisory 30
Single Track - Deterministic Run
6 – 8 ft
4 – 6 ft
8-10ft

Advisory 30 10 Pct Exceedance – Increase in surge values noted all areas.
Forecasted landfall strength had decreased, but wind field expanded.
7-9ft
9-11ft
9-11ft
11-13ft 9-11ft
11-13ft
13-15ft

Gustav Advisory 30 – KMZ format
Probability Storm Surge GTE 8 Feet
Highest probability east of MS River
50-60%
20-30%
30-40%
30-40%
40-50%
70-80%
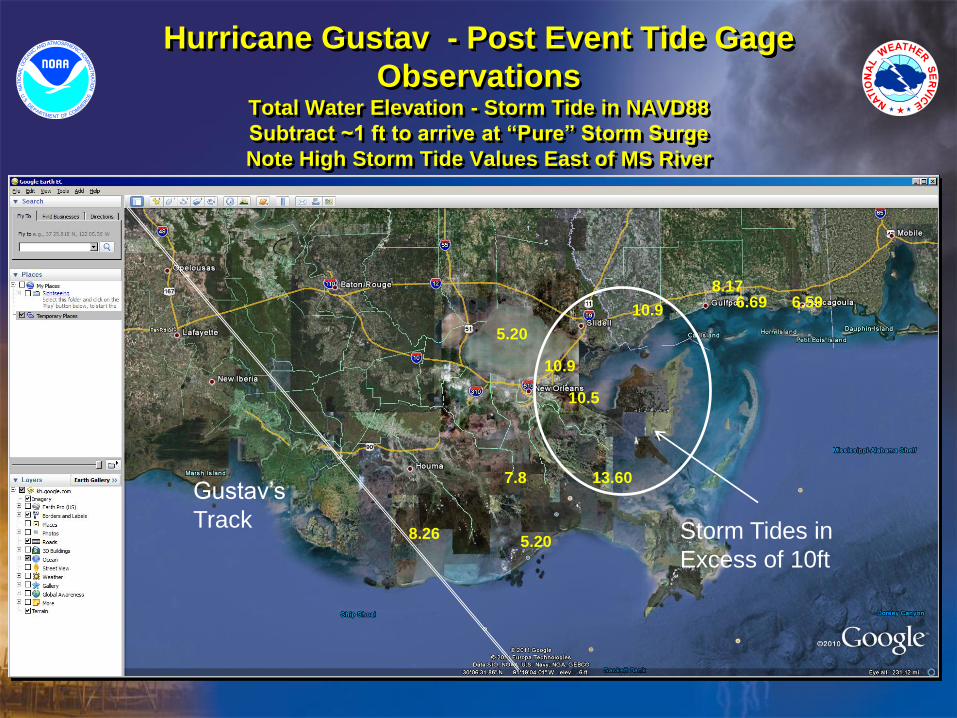
Hurricane Gustav - Post Event Tide Gage
Observations Total Water Elevation - Storm Tide in NAVD88
Subtract ~1 ft to arrive at “Pure” Storm Surge
Note High Storm Tide Values East of MS River
10.5
5.20
13.60
5.20
10.9 6.59
8.17 6.69
10.9
8.26
7.8
Storm Tides in
Excess of 10ft
Gustav’s
Track