Embed Size (px)
Citation preview
prepared forprepared forChino Basin WatermasterChino Basin WatermasterJune 2015June 2015
Chino Basin Optimum Basin Management ProgramChino Basin Optimum Basin Management Program2014 State of the Basin Report2014 State of the Basin Report
SOB_FrontcoverAtlas_v20150602_v2Page 1 6/30/2015 2:12:29 PMSOB_FrontcoverAtlas_v20150602_v2Page 1 6/30/2015 2:12:29 PM
2014 State of the Basin Report
June 2015
Prepared for:
Prepared by:
Front cover left imagery: Map of the Chino Basin hydrologic boundary, Santa Ana River, Chino Basin Desalter wells, and model-projected groundwater-flow direction for 2015 Scenario 5A4. The background photo is the Santa Ana River near the USGS gaging station at MWD Crossing and the Riverside Narrows. Front cover right photo collage - clockwise from upper left: drilling of Prado Basin Habitat Sustainability Program monitoring well PB-9; Ely Basin 3 recharge facility; San Sevaine Basin 5 recharge facility; Chino-I Desalter treatment facility; Prado Basin Habitat Sustainability Program monitoring wells PB-7/1 and PB-7/2; and Turner Basin 1 recharge facility.
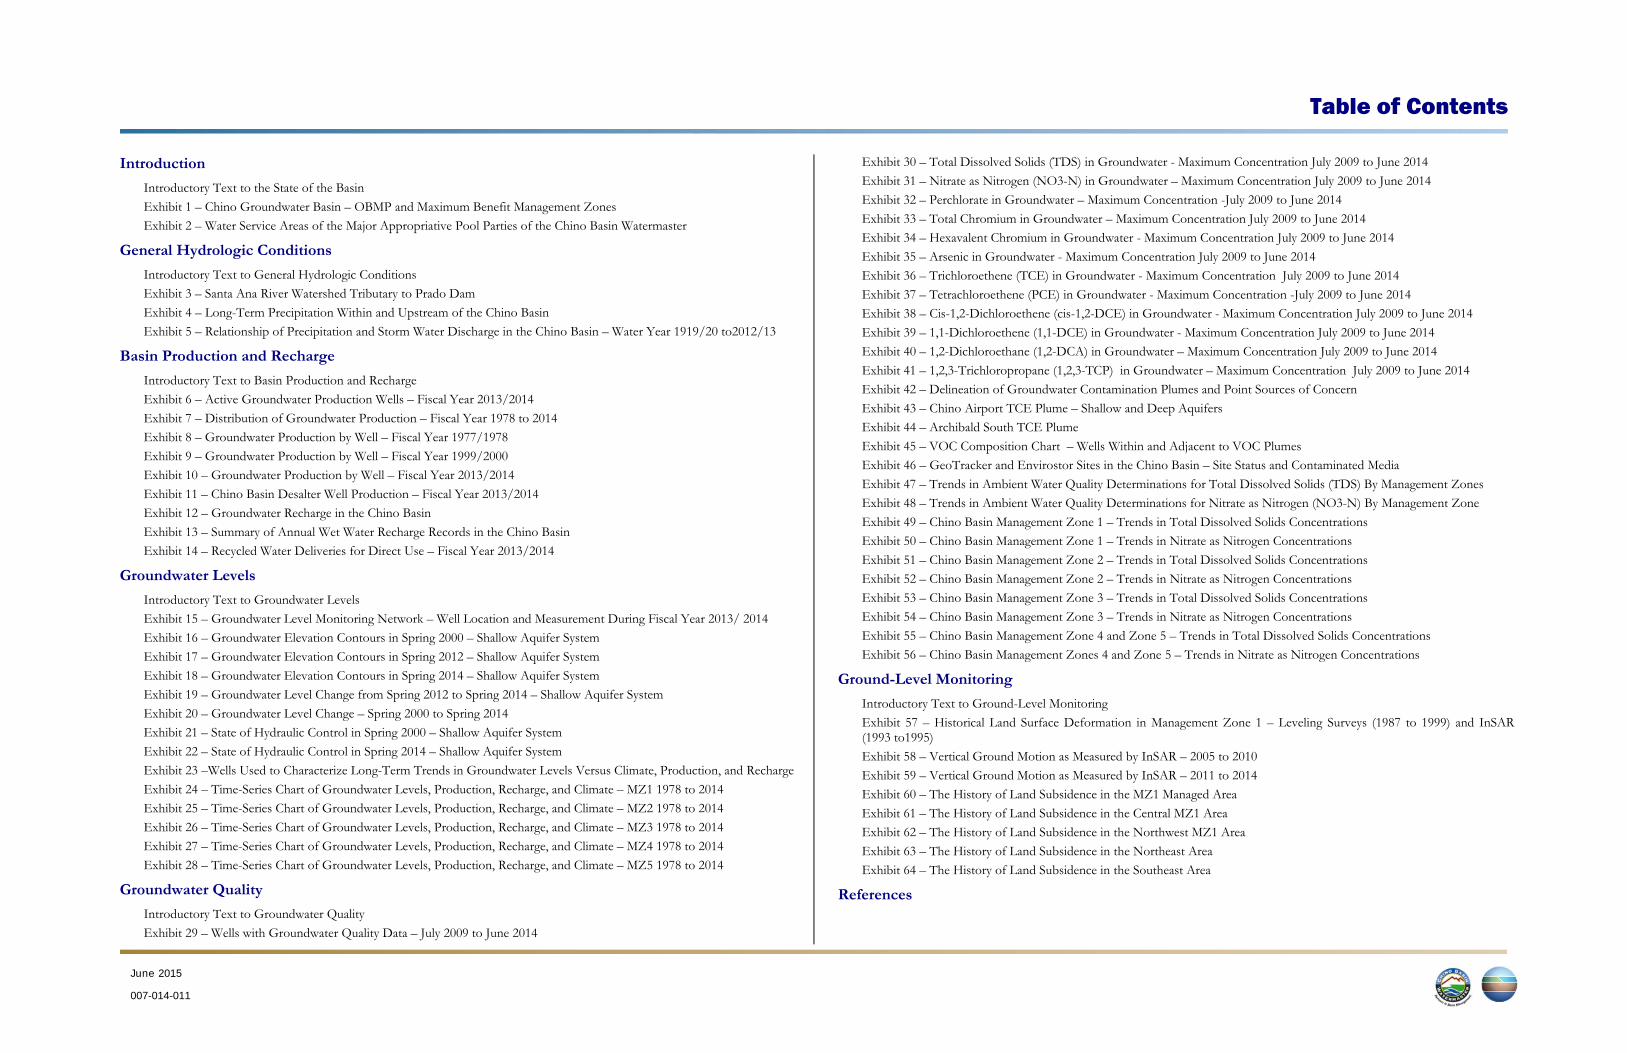
Table of Contents
June 2015
007-014-011
Introduction
Introductory Text to the State of the Basin Exhibit 1 – Chino Groundwater Basin – OBMP and Maximum Benefit Management Zones Exhibit 2 – Water Service Areas of the Major Appropriative Pool Parties of the Chino Basin Watermaster
General Hydrologic Conditions
Introductory Text to General Hydrologic Conditions Exhibit 3 – Santa Ana River Watershed Tributary to Prado Dam Exhibit 4 – Long-Term Precipitation Within and Upstream of the Chino Basin Exhibit 5 – Relationship of Precipitation and Storm Water Discharge in the Chino Basin – Water Year 1919/20 to2012/13
Basin Production and Recharge
Introductory Text to Basin Production and Recharge Exhibit 6 – Active Groundwater Production Wells – Fiscal Year 2013/2014 Exhibit 7 – Distribution of Groundwater Production – Fiscal Year 1978 to 2014 Exhibit 8 – Groundwater Production by Well – Fiscal Year 1977/1978 Exhibit 9 – Groundwater Production by Well – Fiscal Year 1999/2000 Exhibit 10 – Groundwater Production by Well – Fiscal Year 2013/2014 Exhibit 11 – Chino Basin Desalter Well Production – Fiscal Year 2013/2014 Exhibit 12 – Groundwater Recharge in the Chino Basin Exhibit 13 – Summary of Annual Wet Water Recharge Records in the Chino Basin Exhibit 14 – Recycled Water Deliveries for Direct Use – Fiscal Year 2013/2014
Groundwater Levels
Introductory Text to Groundwater Levels Exhibit 15 – Groundwater Level Monitoring Network – Well Location and Measurement During Fiscal Year 2013/ 2014 Exhibit 16 – Groundwater Elevation Contours in Spring 2000 – Shallow Aquifer System Exhibit 17 – Groundwater Elevation Contours in Spring 2012 – Shallow Aquifer System Exhibit 18 – Groundwater Elevation Contours in Spring 2014 – Shallow Aquifer System Exhibit 19 – Groundwater Level Change from Spring 2012 to Spring 2014 – Shallow Aquifer System Exhibit 20 – Groundwater Level Change – Spring 2000 to Spring 2014 Exhibit 21 – State of Hydraulic Control in Spring 2000 – Shallow Aquifer System Exhibit 22 – State of Hydraulic Control in Spring 2014 – Shallow Aquifer System Exhibit 23 –Wells Used to Characterize Long-Term Trends in Groundwater Levels Versus Climate, Production, and Recharge Exhibit 24 – Time-Series Chart of Groundwater Levels, Production, Recharge, and Climate – MZ1 1978 to 2014 Exhibit 25 – Time-Series Chart of Groundwater Levels, Production, Recharge, and Climate – MZ2 1978 to 2014 Exhibit 26 – Time-Series Chart of Groundwater Levels, Production, Recharge, and Climate – MZ3 1978 to 2014 Exhibit 27 – Time-Series Chart of Groundwater Levels, Production, Recharge, and Climate – MZ4 1978 to 2014 Exhibit 28 – Time-Series Chart of Groundwater Levels, Production, Recharge, and Climate – MZ5 1978 to 2014
Groundwater Quality
Introductory Text to Groundwater Quality Exhibit 29 – Wells with Groundwater Quality Data – July 2009 to June 2014
Exhibit 30 – Total Dissolved Solids (TDS) in Groundwater - Maximum Concentration July 2009 to June 2014 Exhibit 31 – Nitrate as Nitrogen (NO3-N) in Groundwater – Maximum Concentration July 2009 to June 2014 Exhibit 32 – Perchlorate in Groundwater – Maximum Concentration -July 2009 to June 2014 Exhibit 33 – Total Chromium in Groundwater – Maximum Concentration July 2009 to June 2014 Exhibit 34 – Hexavalent Chromium in Groundwater - Maximum Concentration July 2009 to June 2014 Exhibit 35 – Arsenic in Groundwater - Maximum Concentration July 2009 to June 2014 Exhibit 36 – Trichloroethene (TCE) in Groundwater - Maximum Concentration July 2009 to June 2014 Exhibit 37 – Tetrachloroethene (PCE) in Groundwater - Maximum Concentration -July 2009 to June 2014 Exhibit 38 – Cis-1,2-Dichloroethene (cis-1,2-DCE) in Groundwater - Maximum Concentration July 2009 to June 2014 Exhibit 39 – 1,1-Dichloroethene (1,1-DCE) in Groundwater - Maximum Concentration July 2009 to June 2014 Exhibit 40 – 1,2-Dichloroethane (1,2-DCA) in Groundwater – Maximum Concentration July 2009 to June 2014 Exhibit 41 – 1,2,3-Trichloropropane (1,2,3-TCP) in Groundwater – Maximum Concentration July 2009 to June 2014 Exhibit 42 – Delineation of Groundwater Contamination Plumes and Point Sources of Concern Exhibit 43 – Chino Airport TCE Plume – Shallow and Deep Aquifers Exhibit 44 – Archibald South TCE Plume Exhibit 45 – VOC Composition Chart – Wells Within and Adjacent to VOC Plumes Exhibit 46 – GeoTracker and Envirostor Sites in the Chino Basin – Site Status and Contaminated Media Exhibit 47 – Trends in Ambient Water Quality Determinations for Total Dissolved Solids (TDS) By Management Zones Exhibit 48 – Trends in Ambient Water Quality Determinations for Nitrate as Nitrogen (NO3-N) By Management Zone Exhibit 49 – Chino Basin Management Zone 1 – Trends in Total Dissolved Solids Concentrations Exhibit 50 – Chino Basin Management Zone 1 – Trends in Nitrate as Nitrogen Concentrations Exhibit 51 – Chino Basin Management Zone 2 – Trends in Total Dissolved Solids Concentrations Exhibit 52 – Chino Basin Management Zone 2 – Trends in Nitrate as Nitrogen Concentrations Exhibit 53 – Chino Basin Management Zone 3 – Trends in Total Dissolved Solids Concentrations Exhibit 54 – Chino Basin Management Zone 3 – Trends in Nitrate as Nitrogen Concentrations Exhibit 55 – Chino Basin Management Zone 4 and Zone 5 – Trends in Total Dissolved Solids Concentrations Exhibit 56 – Chino Basin Management Zones 4 and Zone 5 – Trends in Nitrate as Nitrogen Concentrations
Ground-Level Monitoring
Introductory Text to Ground-Level Monitoring Exhibit 57 – Historical Land Surface Deformation in Management Zone 1 – Leveling Surveys (1987 to 1999) and InSAR (1993 to1995) Exhibit 58 – Vertical Ground Motion as Measured by InSAR – 2005 to 2010 Exhibit 59 – Vertical Ground Motion as Measured by InSAR – 2011 to 2014 Exhibit 60 – The History of Land Subsidence in the MZ1 Managed Area Exhibit 61 – The History of Land Subsidence in the Central MZ1 Area Exhibit 62 – The History of Land Subsidence in the Northwest MZ1 Area Exhibit 63 – The History of Land Subsidence in the Northeast Area Exhibit 64 – The History of Land Subsidence in the Southeast Area
References
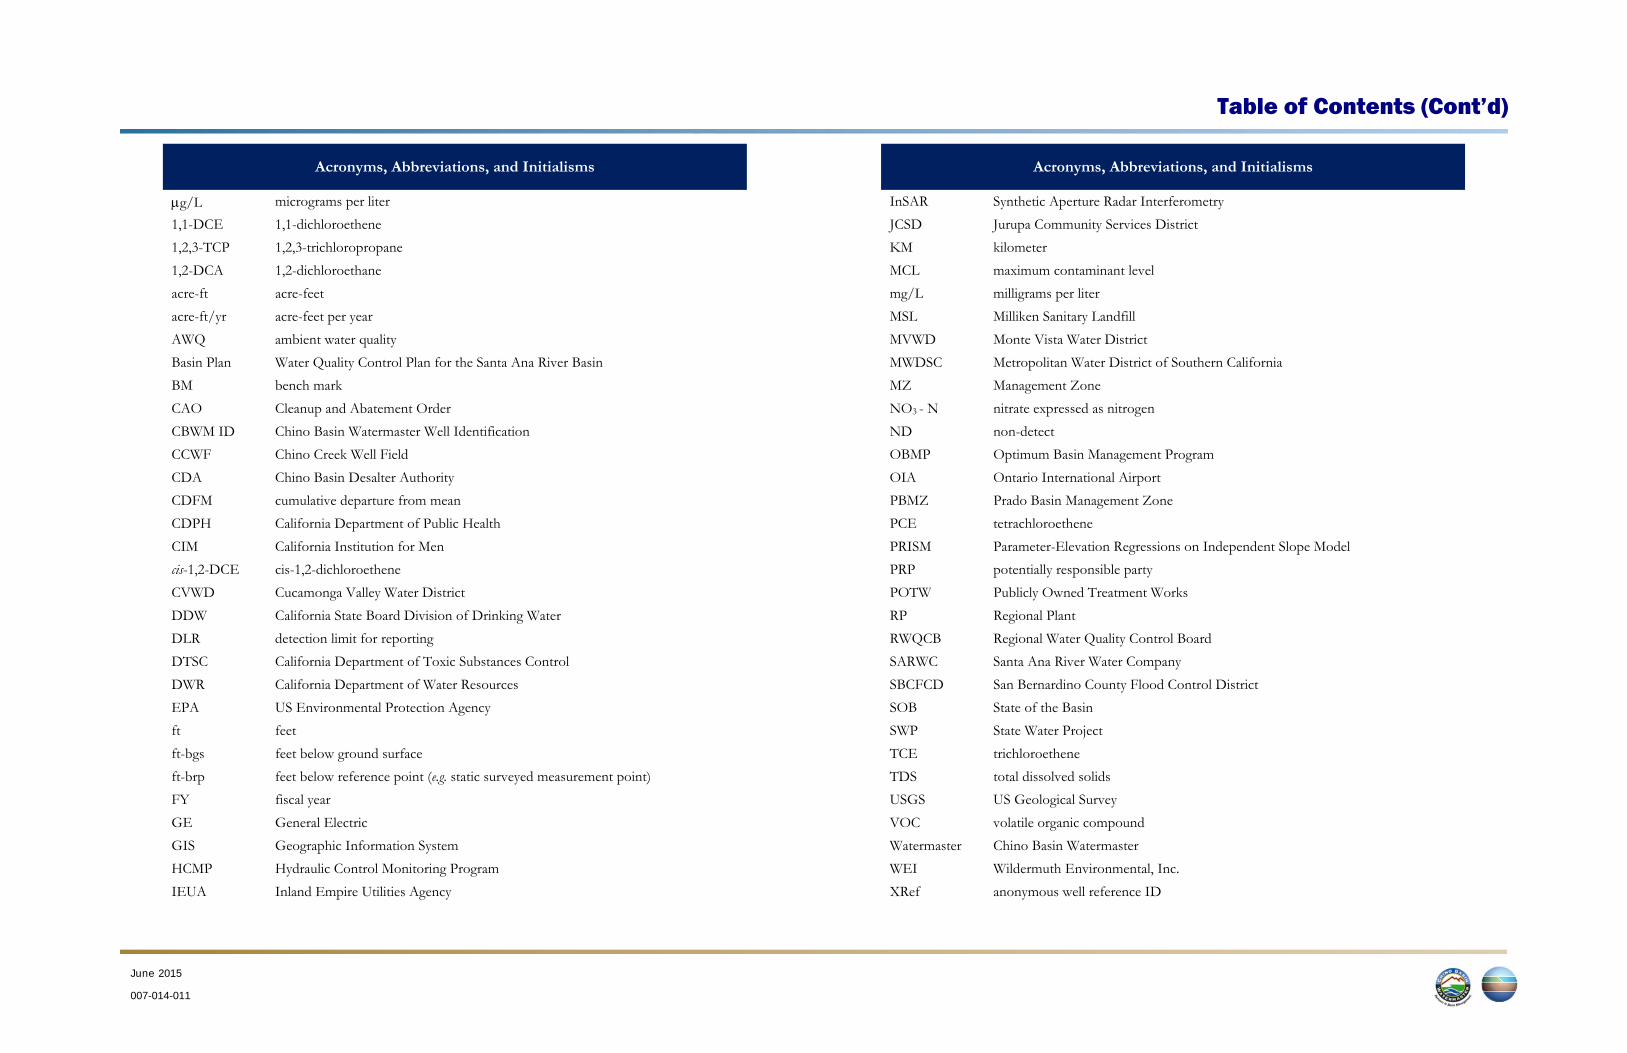
Table of Contents (Cont’d)
June 2015
007-014-011
Acronyms, Abbreviations, and Initialisms
g/L micrograms per liter 1,1-DCE 1,1-dichloroethene 1,2,3-TCP 1,2,3-trichloropropane 1,2-DCA 1,2-dichloroethane acre-ft acre-feet acre-ft/yr acre-feet per year AWQ ambient water quality Basin Plan Water Quality Control Plan for the Santa Ana River Basin BM bench mark CAO Cleanup and Abatement Order CBWM ID Chino Basin Watermaster Well Identification CCWF Chino Creek Well Field CDA Chino Basin Desalter Authority CDFM cumulative departure from mean CDPH California Department of Public Health CIM California Institution for Men cis-1,2-DCE cis-1,2-dichloroethene CVWD Cucamonga Valley Water District DDW California State Board Division of Drinking Water DLR detection limit for reporting DTSC California Department of Toxic Substances Control DWR California Department of Water Resources EPA US Environmental Protection Agency ft feet ft-bgs feet below ground surface ft-brp feet below reference point (e.g. static surveyed measurement point) FY fiscal year GE General Electric GIS Geographic Information System HCMP Hydraulic Control Monitoring Program IEUA Inland Empire Utilities Agency
Acronyms, Abbreviations, and Initialisms
InSAR Synthetic Aperture Radar Interferometry JCSD Jurupa Community Services District KM kilometer MCL maximum contaminant level mg/L milligrams per liter MSL Milliken Sanitary Landfill MVWD Monte Vista Water District MWDSC Metropolitan Water District of Southern California MZ Management Zone NO3 - N nitrate expressed as nitrogen ND non-detect OBMP Optimum Basin Management Program OIA Ontario International Airport PBMZ Prado Basin Management Zone PCE tetrachloroethene PRISM Parameter-Elevation Regressions on Independent Slope Model PRP potentially responsible party POTW Publicly Owned Treatment Works RP Regional Plant RWQCB Regional Water Quality Control Board SARWC Santa Ana River Water Company SBCFCD San Bernardino County Flood Control District SOB State of the Basin SWP State Water Project TCE trichloroethene TDS total dissolved solids USGS US Geological Survey VOC volatile organic compound Watermaster Chino Basin Watermaster WEI Wildermuth Environmental, Inc. XRef anonymous well reference ID