Embed Size (px)
Citation preview
slide 1
Some slide material taken from: SAS Education
Lecture 4:
Decision Trees: Overview
DSCI 4520/5240: Data MiningFall 2013 – Dr. Nick Evangelopoulos
Lecture 6 - 2
DSCI 4520/5240DATA MINING
On the News: The Rise of the Numerati.
BusinessWeek, Sep 8, 2008:
With the explosion of data from the Internet, cell phones, and credit cards, the people who can make sense of it all are changing our world.An excerpt from the introduction of the book The Numerati by Stephen Baker:
Imagine you're in a café, perhaps the noisy one I'm sitting in at this moment. A young woman at a table to your right is typing on her laptop. You turn your head and look at her screen. She surfs the Internet. You watch. Hours pass. She reads an online newspaper. You notice that she reads three articles about China. She scouts movies for Friday night and watches the trailer for Kung Fu Panda. She clicks on an ad that promises to connect her to old high school classmates. You sit there taking notes. With each passing minute, you're learning more about her. Now imagine that you could watch 150 million people surfing at the same time. That's what is happening today at the business place.
Lecture 6 - 3
DSCI 4520/5240DATA MINING
On the News: The Rise of the Numerati.
By building mathematical models of its own employees, IBM aims to improve productivity and automate management.In 2005, IBM embarked on research to harvest massive data on employees, and to build mathematical models of 50,000 of the company’s consultants. The goal was to optimize them, using operations research, so that they can be deployed with ever more efficiency. Data on IBM employees include:
-Time spent in meetings-Social network participation-Time spent surfing the Web-Response time to e-mails-Amount of sales-Marital status-Ratio of personal to work e-mails
-Allergies-Number of interns managed-Client visits-Computer languages-Number of words per e-mail-Amount spent entertaining clients-Number of weekends worked
slide 4
DSCI 4520/5240DATA MINING
Agenda
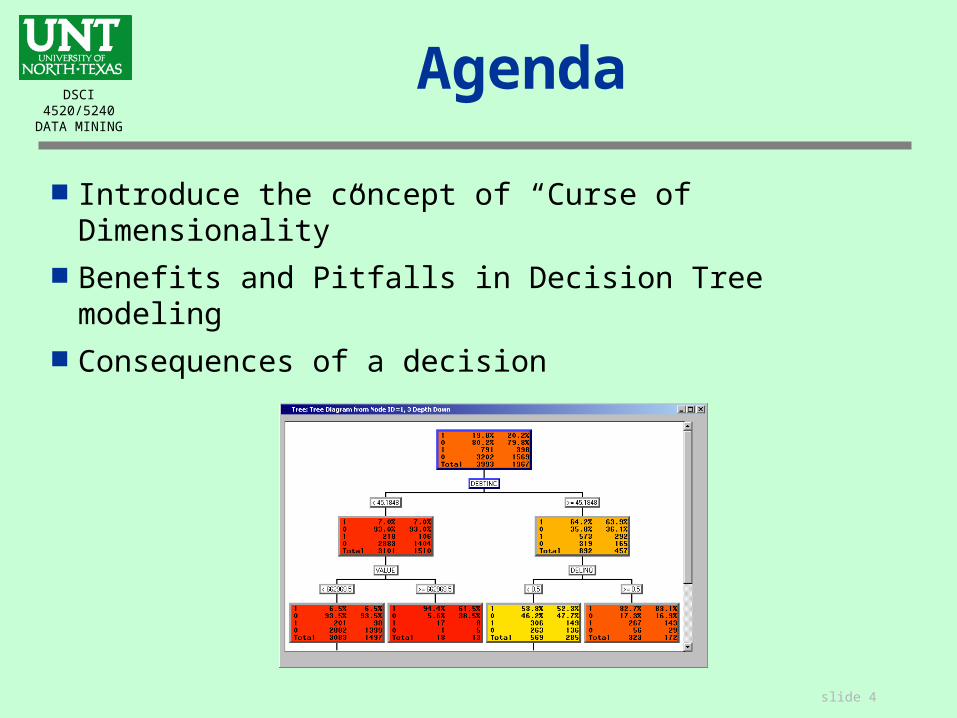
Introduce the concept of “Curse of Dimensionality” Benefits and Pitfalls in Decision Tree modeling Consequences of a decision
Lecture 6 - 5
DSCI 4520/5240DATA MINING
The Curse of Dimensionality
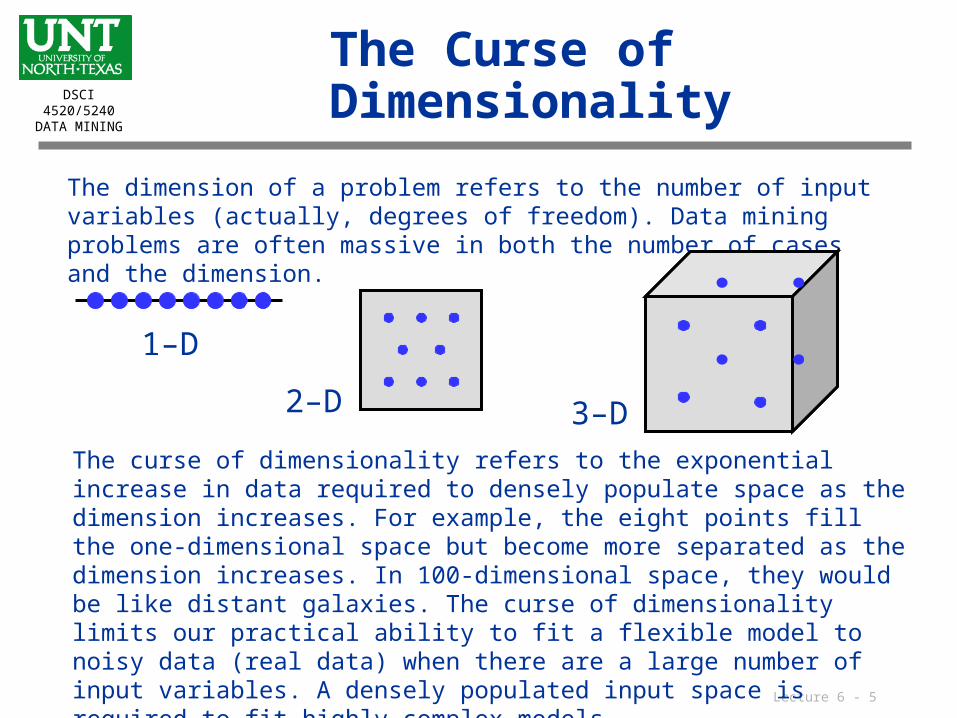
The dimension of a problem refers to the number of input variables (actually, degrees of freedom). Data mining problems are often massive in both the number of cases and the dimension.
The curse of dimensionality refers to the exponential increase in data required to densely populate space as the dimension increases. For example, the eight points fill the one-dimensional space but become more separated as the dimension increases. In 100-dimensional space, they would be like distant galaxies. The curse of dimensionality limits our practical ability to fit a flexible model to noisy data (real data) when there are a large number of input variables. A densely populated input space is required to fit highly complex models.
1–D
2–D 3–D
Lecture 6 - 6
DSCI 4520/5240DATA MINING
Addressing the Curse of Dimensionality: Reduce the Dimensions
Inp
ut 3
Input1
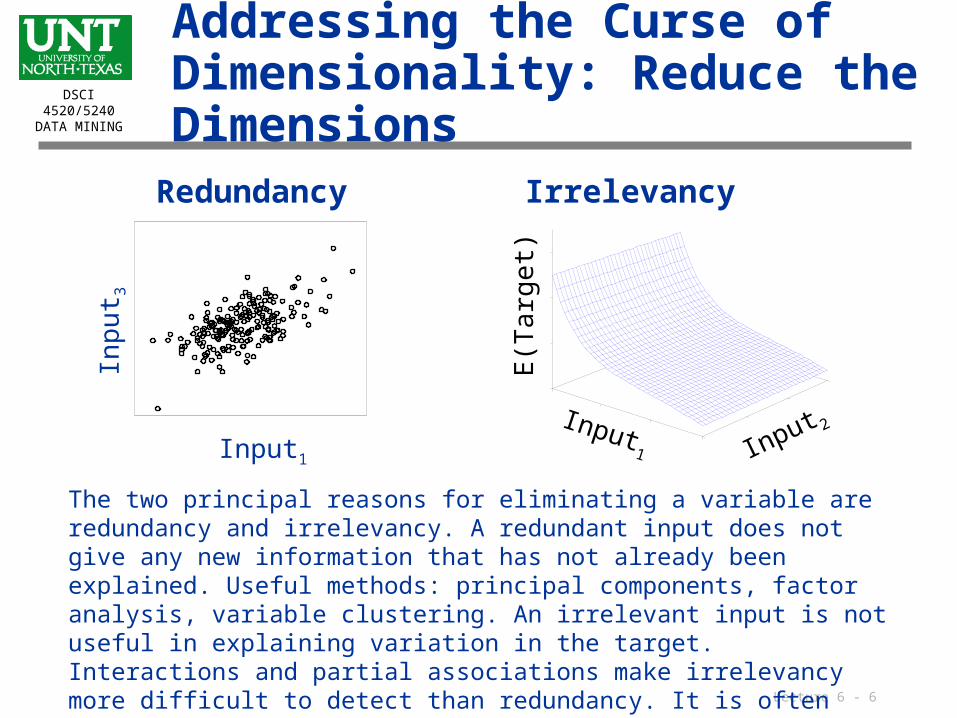
Redundancy
Input 2Input1
E(T
arg
et)
Irrelevancy
The two principal reasons for eliminating a variable are redundancy and irrelevancy. A redundant input does not give any new information that has not already been explained. Useful methods: principal components, factor analysis, variable clustering. An irrelevant input is not useful in explaining variation in the target. Interactions and partial associations make irrelevancy more difficult to detect than redundancy. It is often useful to first eliminate redundant dimensions and then tackle irrelevancy.
Lecture 6 - 7
DSCI 4520/5240DATA MINING
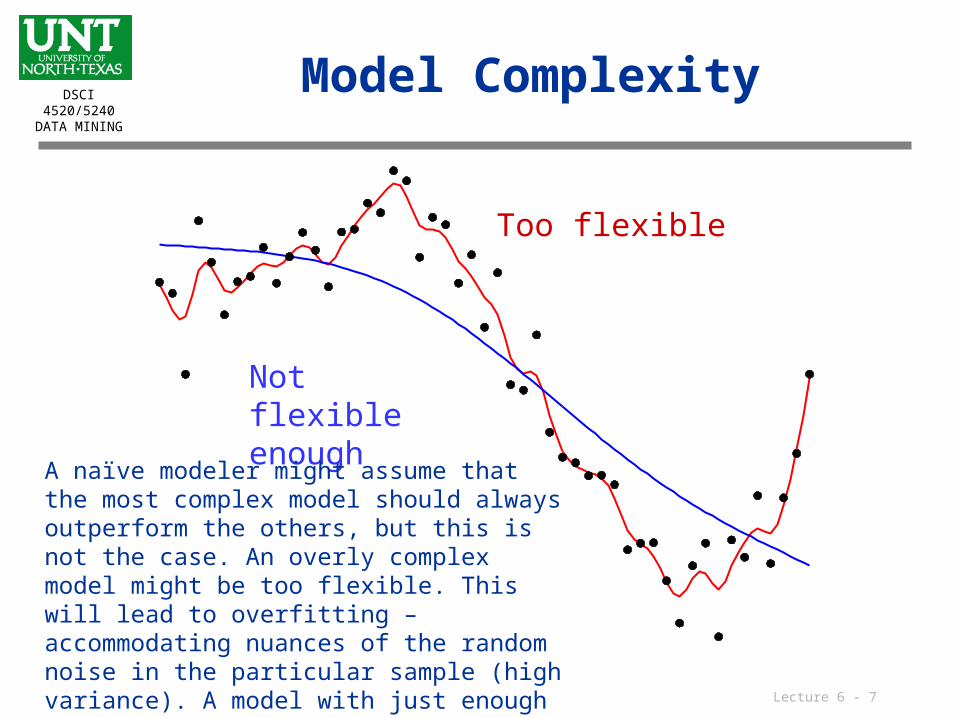
Model Complexity
Too flexible
Not flexible enough
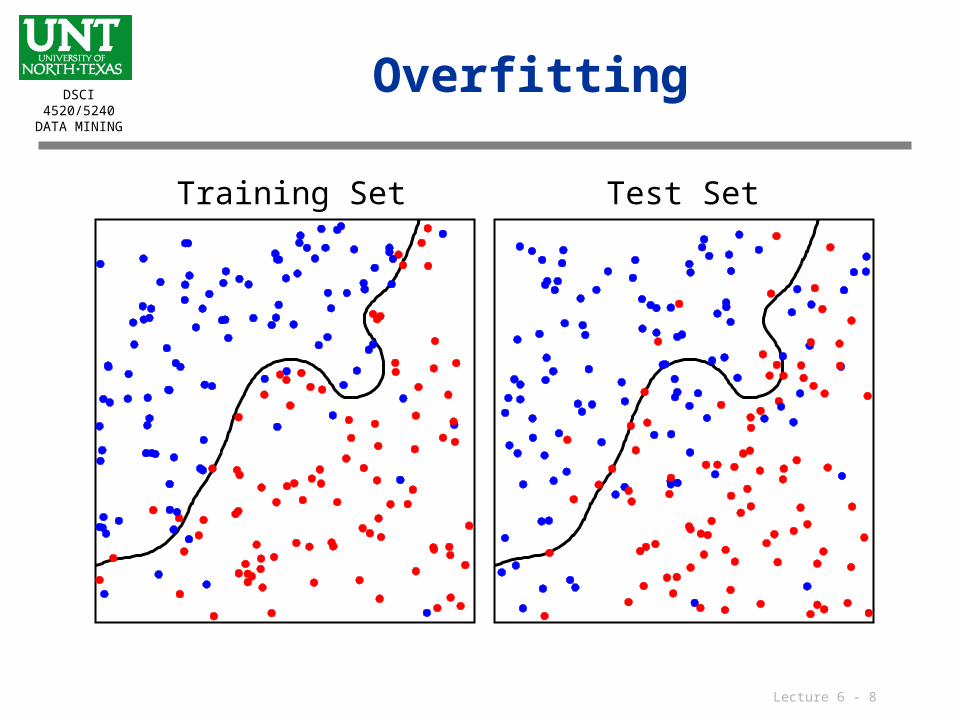
A naïve modeler might assume that the most complex model should always outperform the others, but this is not the case. An overly complex model might be too flexible. This will lead to overfitting – accommodating nuances of the random noise in the particular sample (high variance). A model with just enough flexibility will give the best generalization.
Lecture 6 - 8
DSCI 4520/5240DATA MINING
Overfitting
Training Set Test Set
Lecture 6 - 9
DSCI 4520/5240DATA MINING
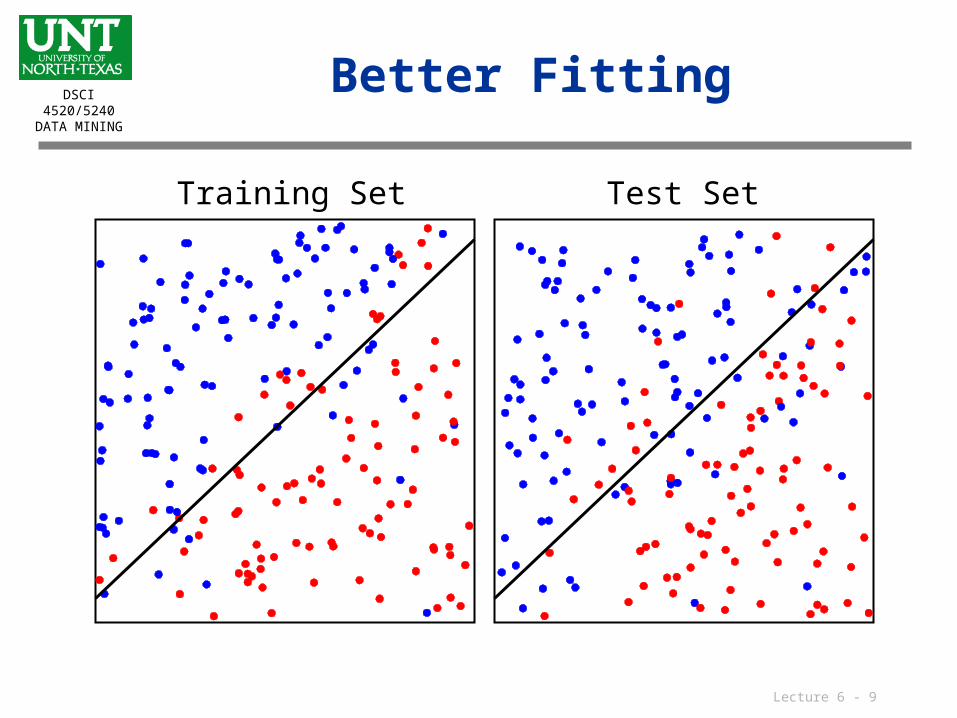
Better Fitting
Training Set Test Set
slide 10
DSCI 4520/5240DATA MINING
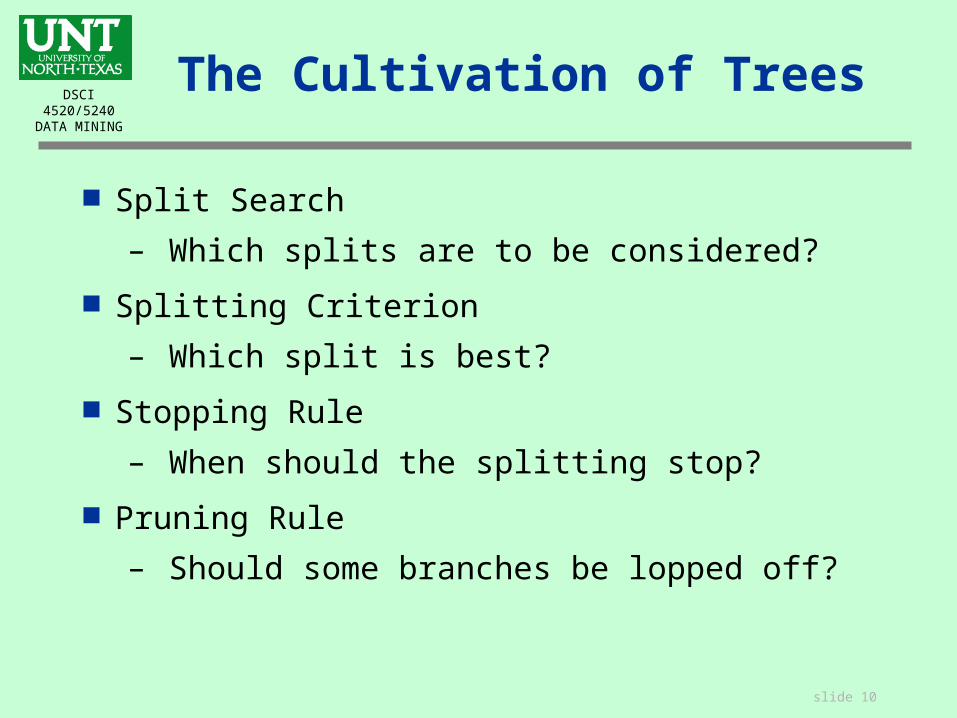
The Cultivation of Trees
Split Search
– Which splits are to be considered?
Splitting Criterion
– Which split is best?
Stopping Rule
– When should the splitting stop?
Pruning Rule
– Should some branches be lopped off?
Lecture 6 - 11
DSCI 4520/5240DATA MINING
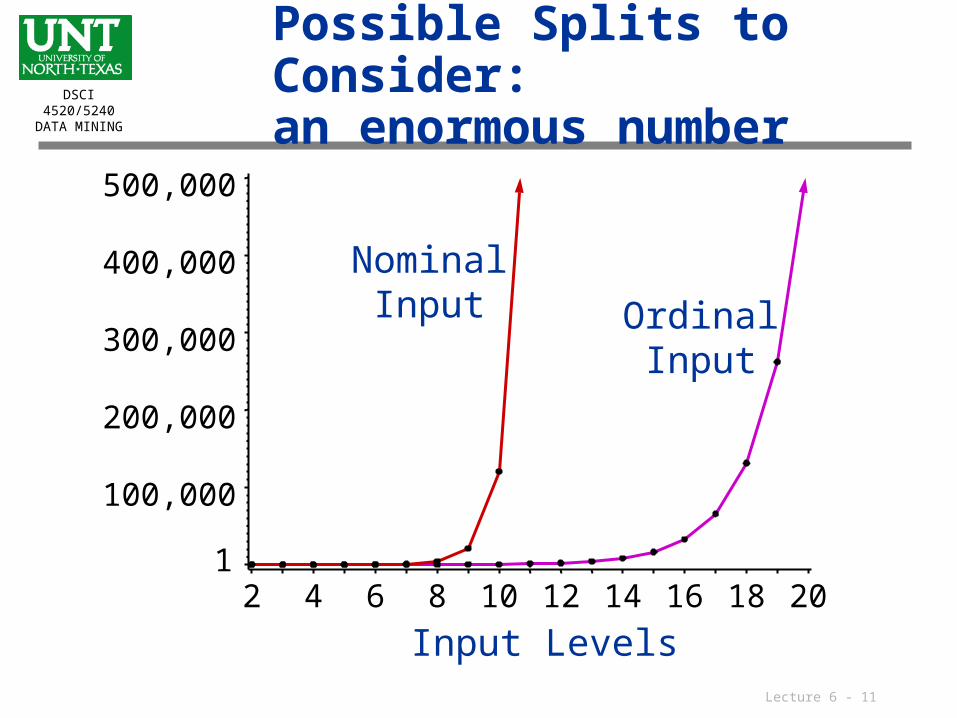
Possible Splits to Consider:an enormous number
1
100,000
200,000
300,000
400,000
500,000
2 4 6 8 10 12 14 16 18 20
NominalInput Ordinal
Input
Input Levels
slide 12
DSCI 4520/5240DATA MINING
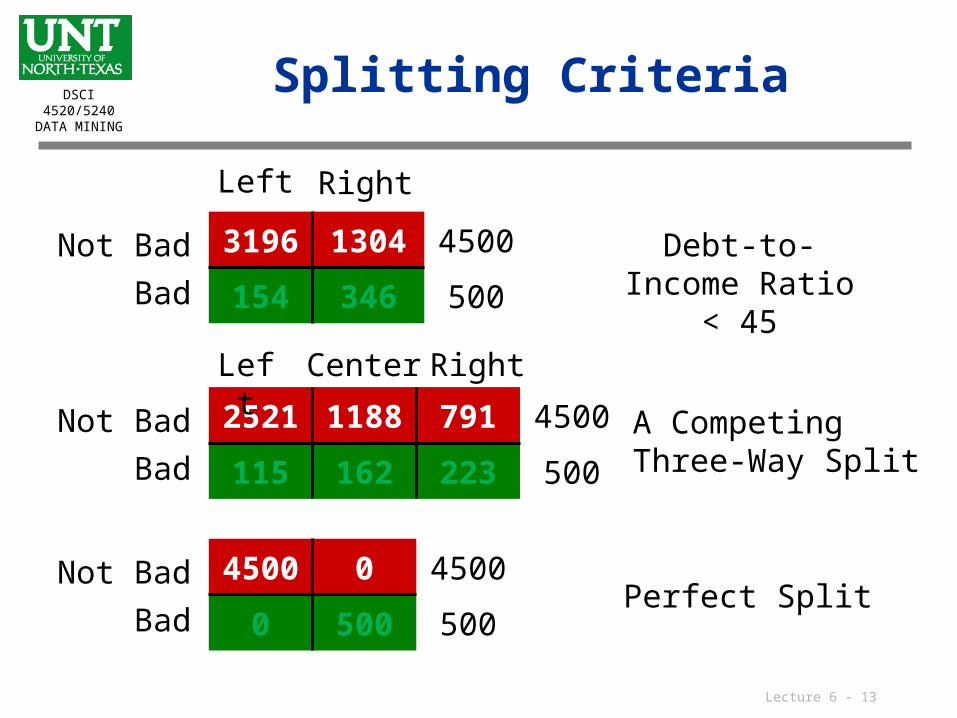
How is the best split determined? In some situations, the worth of a split is obvious. If the expected target is the same in the child nodes as in the parent node, no improvement was made, and the split is worthless!
In contrast, if a split results in pure child nodes, the split is undisputedly best. For classification trees, the three most widely used splitting criteria are based on the Pearson chi-squared test, the Gini index, and entropy. All three measure the difference in class distributions across the child nodes. The three methods usually give similar results.
Splitting Criteria
Lecture 6 - 13
DSCI 4520/5240DATA MINING
Splitting Criteria
Left Right
Perfect Split
Debt-to-Income Ratio < 45
A CompetingThree-Way Split
4500 0
0 500
3196 1304
154 346
Not Bad
Bad
2521 1188
115 162
791
223
Left Center Right
4500
500
4500
500
4500
500
Not Bad
Bad
Not Bad
Bad
Lecture 6 - 14
DSCI 4520/5240DATA MINING
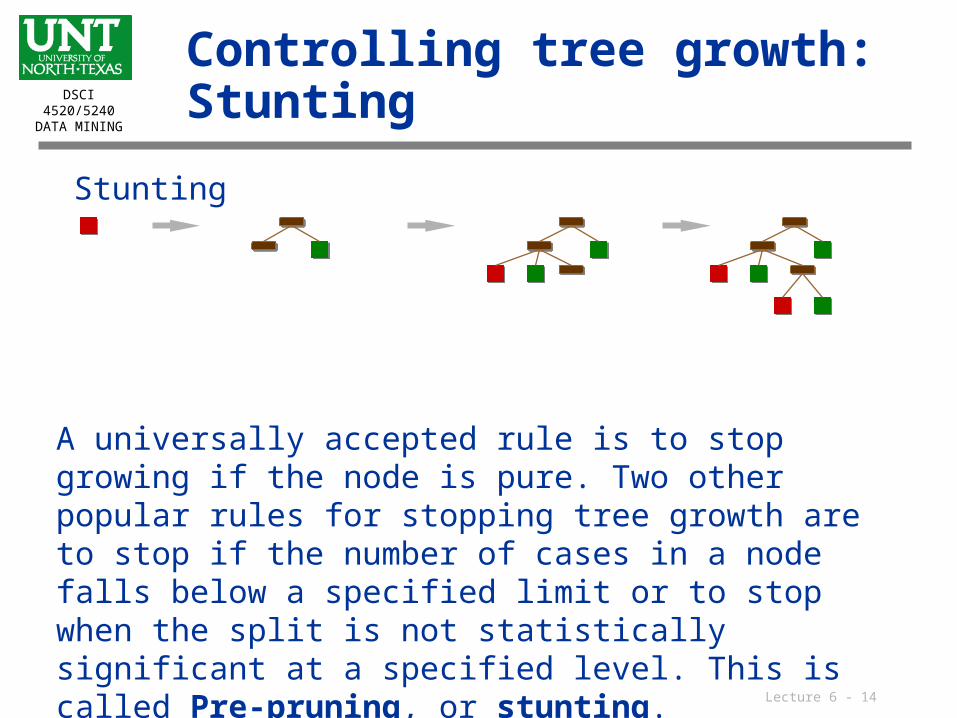
Controlling tree growth: Stunting
Stunting
A universally accepted rule is to stop growing if the node is pure. Two other popular rules for stopping tree growth are to stop if the number of cases in a node falls below a specified limit or to stop when the split is not statistically significant at a specified level. This is called Pre-pruning, or stunting.
Lecture 6 - 15
DSCI 4520/5240DATA MINING
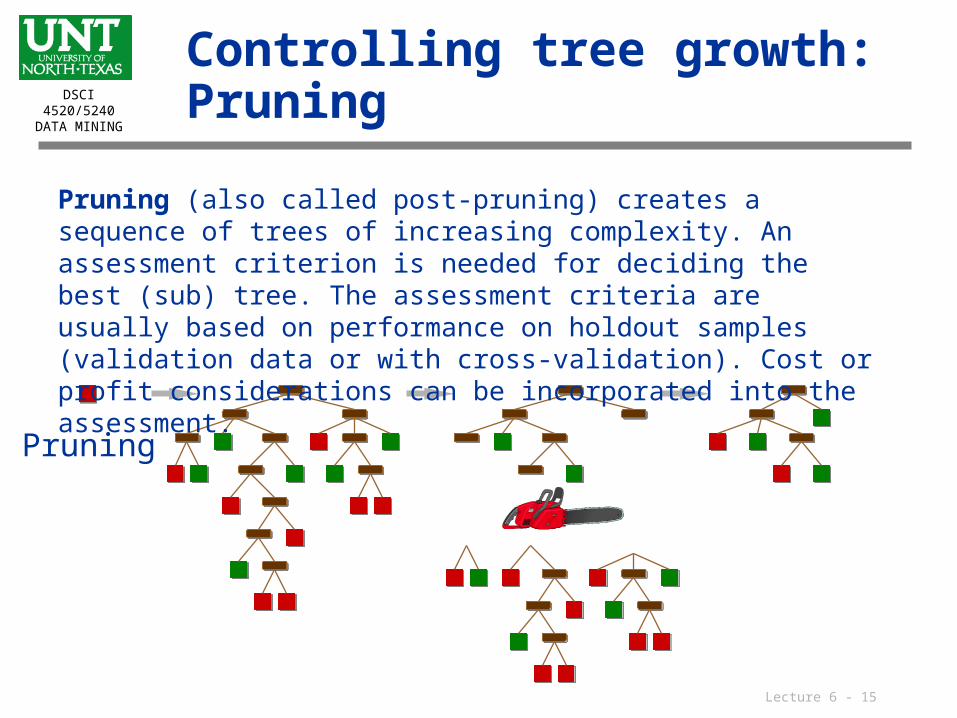
Controlling tree growth: Pruning
Pruning
Pruning (also called post-pruning) creates a sequence of trees of increasing complexity. An assessment criterion is needed for deciding the best (sub) tree. The assessment criteria are usually based on performance on holdout samples (validation data or with cross-validation). Cost or profit considerations can be incorporated into the assessment.
Lecture 6 - 16
DSCI 4520/5240DATA MINING
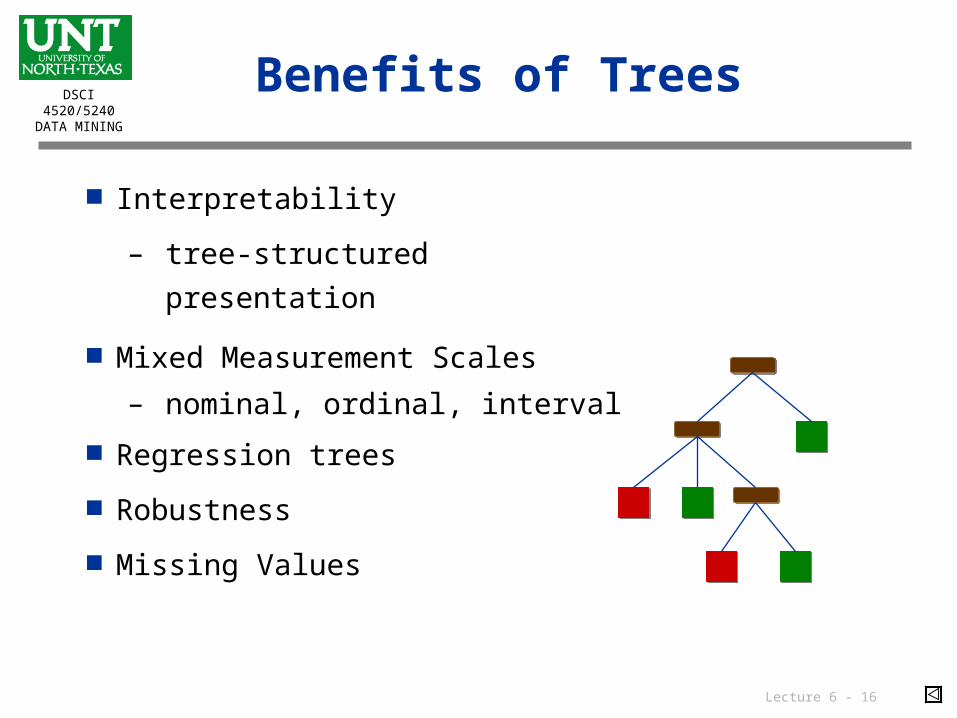
Benefits of Trees
Interpretability
– tree-structured presentation
Mixed Measurement Scales
– nominal, ordinal, interval
Regression trees
Robustness
Missing Values
Lecture 6 - 17
DSCI 4520/5240DATA MINING
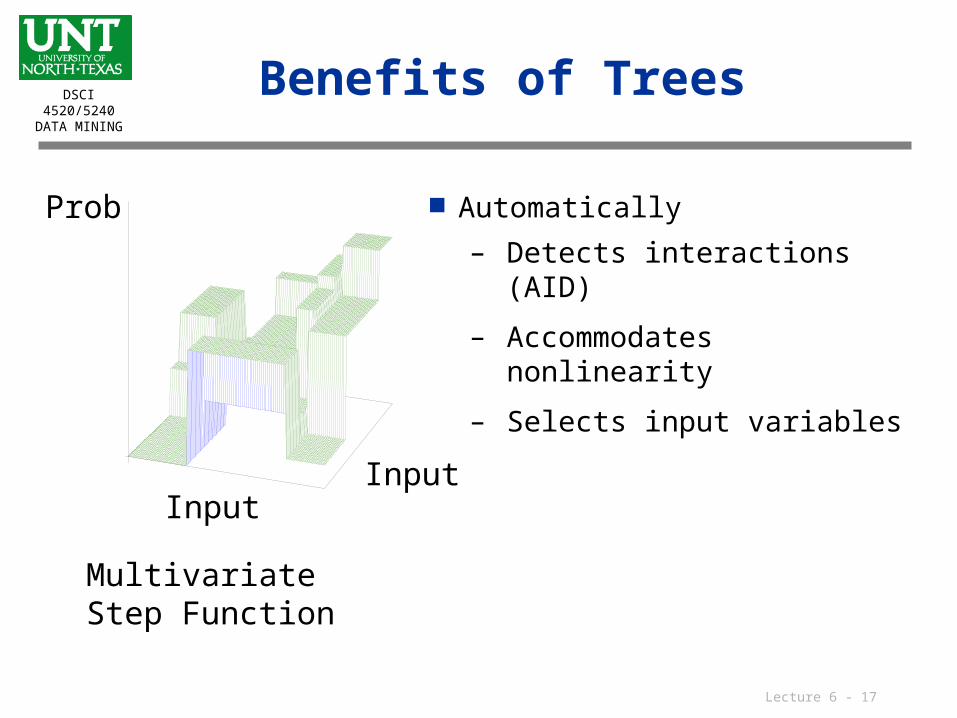
Benefits of Trees
Automatically
– Detects interactions (AID)
– Accommodates nonlinearity
– Selects input variables
InputInput
Prob
MultivariateStep Function
Lecture 6 - 18
DSCI 4520/5240DATA MINING
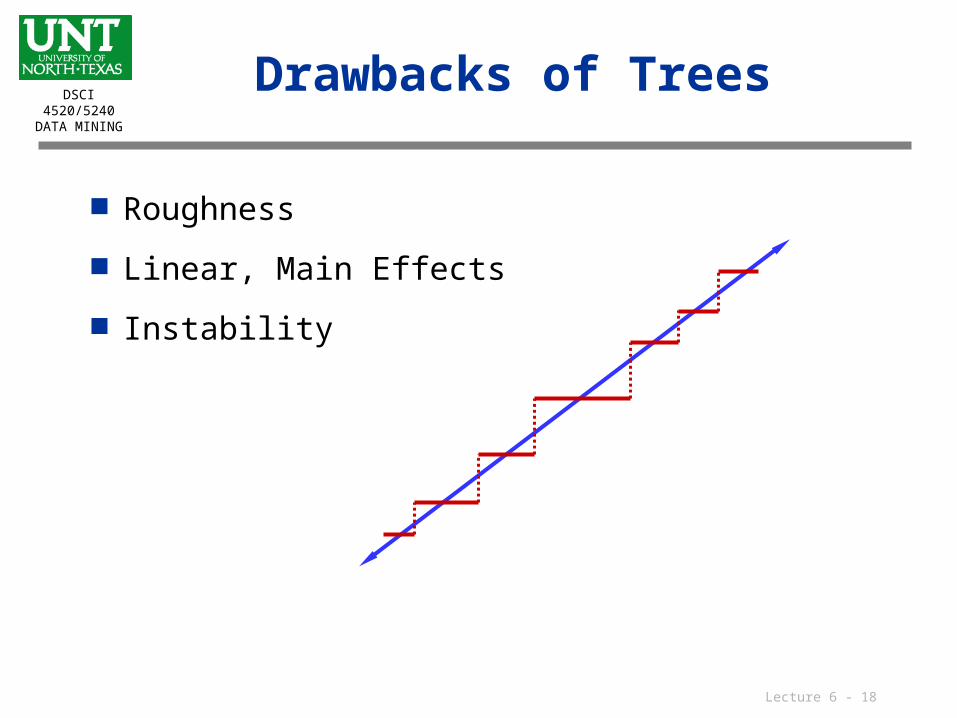
Drawbacks of Trees
Roughness
Linear, Main Effects
Instability
Lecture 6 - 19
DSCI 4520/5240DATA MINING
Building and Interpreting Decision Trees
Explore the types of decision tree models available in Enterprise Miner.
Build a decision tree model. Examine the model results and interpret these
results. Choose a decision threshold theoretically and
empirically.
slide 20
DSCI 4520/5240DATA MINING
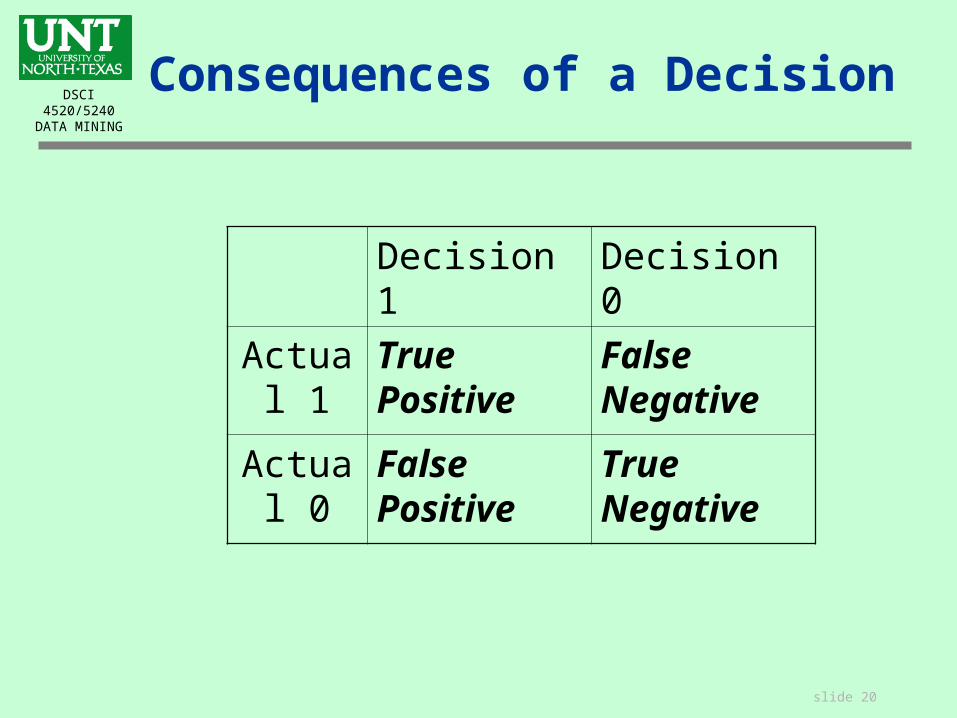
Consequences of a Decision
Decision 1 Decision 0
Actual 1
True Positive False Negative
Actual 0
False Positive
True Negative

slide 21
DSCI 4520/5240DATA MINING
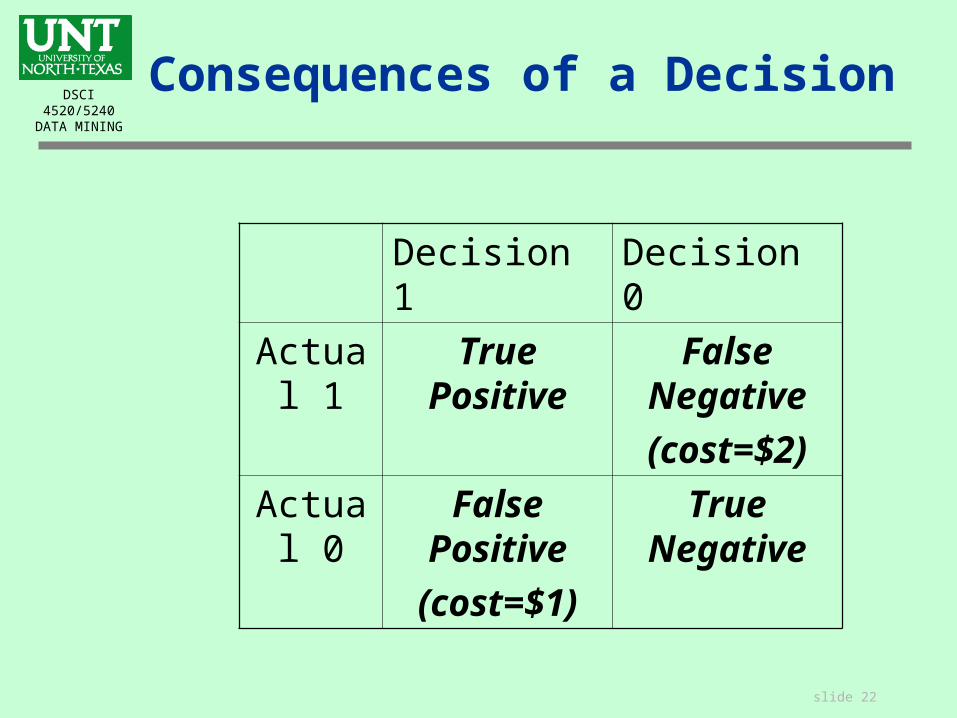
Example
Recall the home equity line of credit scoring example. Presume that every two dollars loaned eventually returns three dollars if the loan is paid off in full.
slide 22
DSCI 4520/5240DATA MINING
Consequences of a Decision
Decision 1 Decision 0
Actual 1
True Positive False Negative
(cost=$2)
Actual 0
False Positive
(cost=$1)
True Negative
slide 23
DSCI 4520/5240DATA MINING
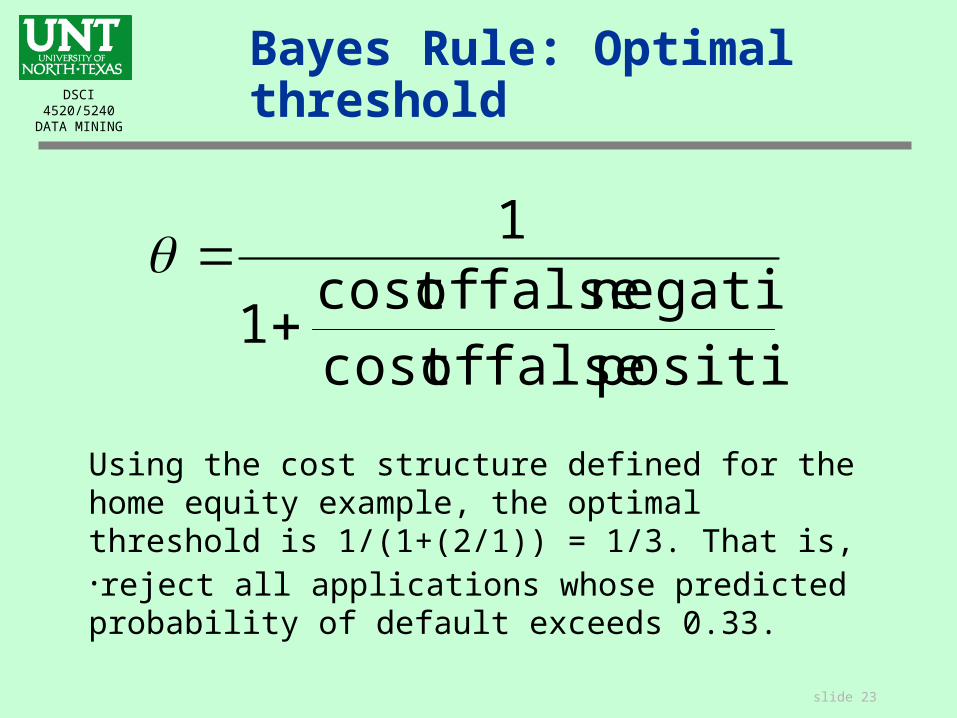
Bayes Rule: Optimal threshold
positive false ofcost
negative false ofcost 1
1
Using the cost structure defined for the home equity example, the optimal threshold is 1/(1+(2/1)) = 1/3. That is,•reject all applications whose predicted probability of default exceeds 0.33.
slide 24
DSCI 4520/5240DATA MINING
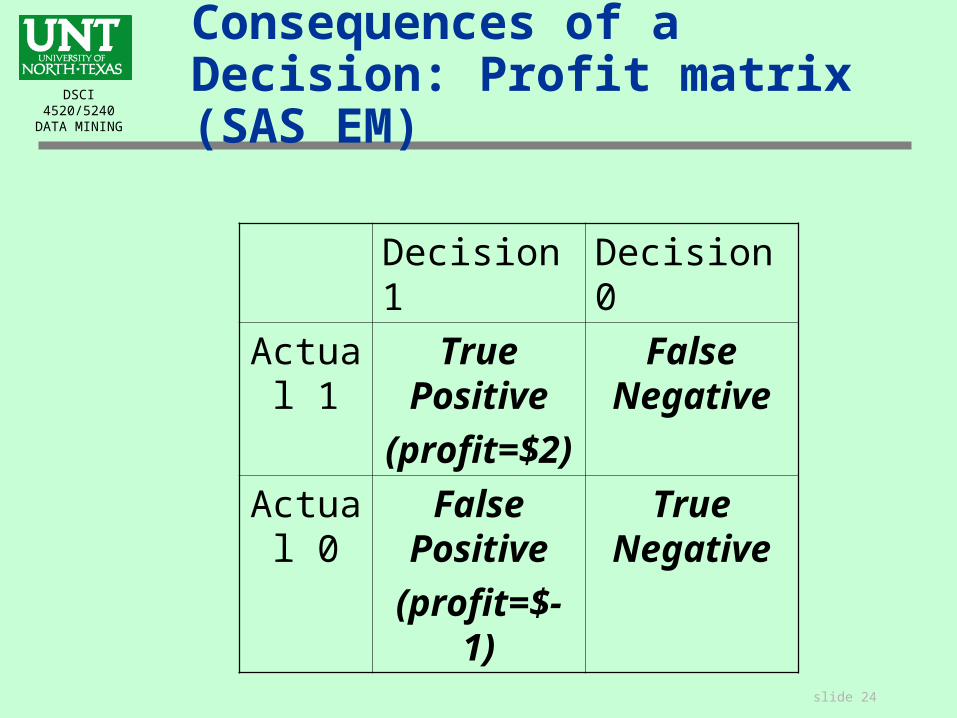
Consequences of a Decision: Profit matrix (SAS EM)
Decision 1 Decision 0
Actual 1
True Positive
(profit=$2)
False Negative
Actual 0
False Positive
(profit=$-1)
True Negative
Lecture 6 - 25
DSCI 4520/5240DATA MINING
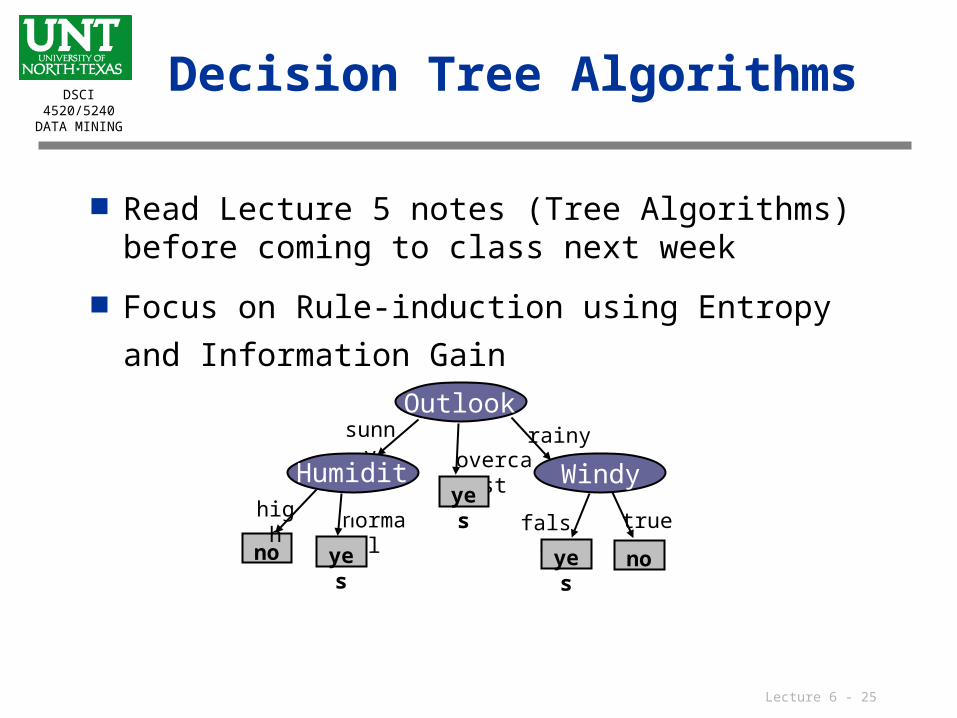
Decision Tree Algorithms
Read Lecture 5 notes (Tree Algorithms) before coming to class next week
Focus on Rule-induction using Entropy and
Information Gain
Outlook
no
normalhigh
sunny
Humidity
yes
Windy
rainyovercast
falseyes
true
yes no