Embed Size (px)
Citation preview
Slickspot Soil Genesis in the Carrizo Plain, CaliforniaD. A. Reid,* R. C. Graham, R. J. Southard, and C. Amrhein
ABSTRACTBarren, shallow depressions known as slickspots are common fea-
tures on sodic soil landscapes. Our objective was to determine theconditions and processes responsible for slickspot soil genesis in aclosed basin grassland in the Central Coast Range province of Cali-fornia. The slickspots are irregularly shaped, 0.5 to 15 m long, anddevoid of all vegetation throughout the year. The adjacent soils undergrass have strong columnar structure below a thin (<5 cm) A horizon.In the 0.5-m-wide transition zone between grass-covered soils andslickspots, the grass is sparse and stunted, the soil is eroded to the Bthorizon, the columnar structure is degraded, and salt efflorescencesrise from > 150 cm deep in the vegetated soil to within about 10 cmof the slickspot soil surface. Infiltration is severely impeded in thecrusted slickspot soils, but not in the structured vegetated soils. Thus,leaching predominates over evapotranspiration in the vegetated soils(fine, montmorillonitic, thermic Typic Haploxeralfs), but is insignif-icant in the adjacent slickspot soils (fine, montmorillonitic, thermicTypic Natrargids). Water and dissolved salts leached through the veg-etated soils move along a water potential gradient into the drier slick-spot subsoils, then upward, following a gradient established byevaporation at the slickspot surface, resulting in salinization of theslickspot soils. Carbon-dated relict grass roots from the slickspot soilsindicate that the slickspots have expanded at the expense of grasslandwithin the last few tens to hundreds of years. Water and wind erosionat slickspot margins is increasing the size of these barren areas, whichare too dry, compacted, and saline for vegetation to become reestab-lished.
SLICKSPOTS are a commonly occurring feature onsodic soil landscapes of the arid and semiarid Great
Plains and western USA (Soil Survey Staff, 1951;Lewis and White, 1964). Slickspots, also referred toas panspots, vary somewhat in form but are typicallycharacterized as barren depressions, 15 to 30 cm be-low the surrounding vegetated soil surfaces, on nearlylevel ground. They may be roughly circular to irreg-ularly shaped and range in size from =0.1 to 15 m indiameter. Slickspot soils are very slowly permeable towater and are ponded for long periods following rains(Sandoval et al., 1959; Johnson et al., 1985).
Various models of slickspot genesis and associatedsoil processes have been proposed. Lewis and Drew(1973) related slickspot formation in southeastern Ne-braska to ephemeral perched water tables that developin response to localized loess-over-till stratigraphicconditions. Soluble products of weathering, includingNa and Ca are added to slickspot soils by capillaryrise from the water table, resulting in unfavorable con-ditions for plant growth. This model fits the classictheory of sodic soil formation described by Gedroiz(1927) and Kelley (1934). ___
D.A. Reid, Woodward-Clyde Consultants, 2020 East First Street,Suite 400, Santa Ana, CA 92705; R.C. Graham and C. Amrhein,Dep. of Soil and Environmental Sciences, Univ. of California,Riverside, CA 92521-0424; and R J. Southard, Dep. of Land, Airand Water Resources, Univ. of California, Davis, CA 95616.Contribution of the Dept. of Soil and Environmental Sciences,Univ. of California, Riverside. Received 4 Mar. 1992. *Corre-sponding author.
Published in Soil Sci. Soc. Am. J. 57:162-168 (1993).
Other researchers have studied systems in whichwater tables did not play a role in slickspot formation.Lewis et al. (1959), using applied 35S as a tracer,found that water infiltration through slickspot surfacesin southwestern Idaho was minimal. Instead, waterinfiltrated readily in the adjacent vegetated soils andthen moved laterally into slickspot subsoils. This pat-tern of water movement helped to explain the higherconcentration of salts, exchangeable Na, and amor-phous silica in the slickspot soils than in the adjacentvegetated soils (Lewis and White, 1964). Munn andBoehm (1983) suggested that a similar pattern of un-saturated flow concentrated Na and silica at high pointsin till-shale contacts in northern Montana, resultingin sodic, clayey subsoil horizons. Drastically reducedpermeability in these soils inhibits leaching, keepingthe subsoils drier and more saline than surroundingsoils. Thus, lateral moisture movement into the slick-spot subsoils, as described by Lewis et al. (1959), ispromoted in response to soil water potential gradients.Slickspots formed when wind erosion exposed theclayey, sodic subsoil horizons at the surface.
Johnson et al. (1985) and Hopkins et al. (1991)studied Na-affected landscapes in South Dakota andNorth Dakota, respectively, and stressed the role ofwater erosion in slickspot genesis. Hopkins et al. (1991),in particular, emphasized the process of mechanical-dispersive erosion produced by seepage flow at slick-spot scarplets.
The various models of slickspot genesis reflect thevariety of conditions and processes that may interactto produce slickspots. In this study, we investigated aslickspot-grassland landscape in the Carrizo Plain,California, to determine the conditions and processesresponsible for slickspot soil formation. The CarrizoPlain is particularly important because it is the site ofan extensive (>32 375 ha) Nature Conservancy eco-logical preserve. This preserve is noted for its largelyundisturbed flora and fauna that are representative ofpre-agricultural conditions in the nearby San JoaquinValley (Holing, 1988).
MATERIALS AND METHODSDescription of the Study Area
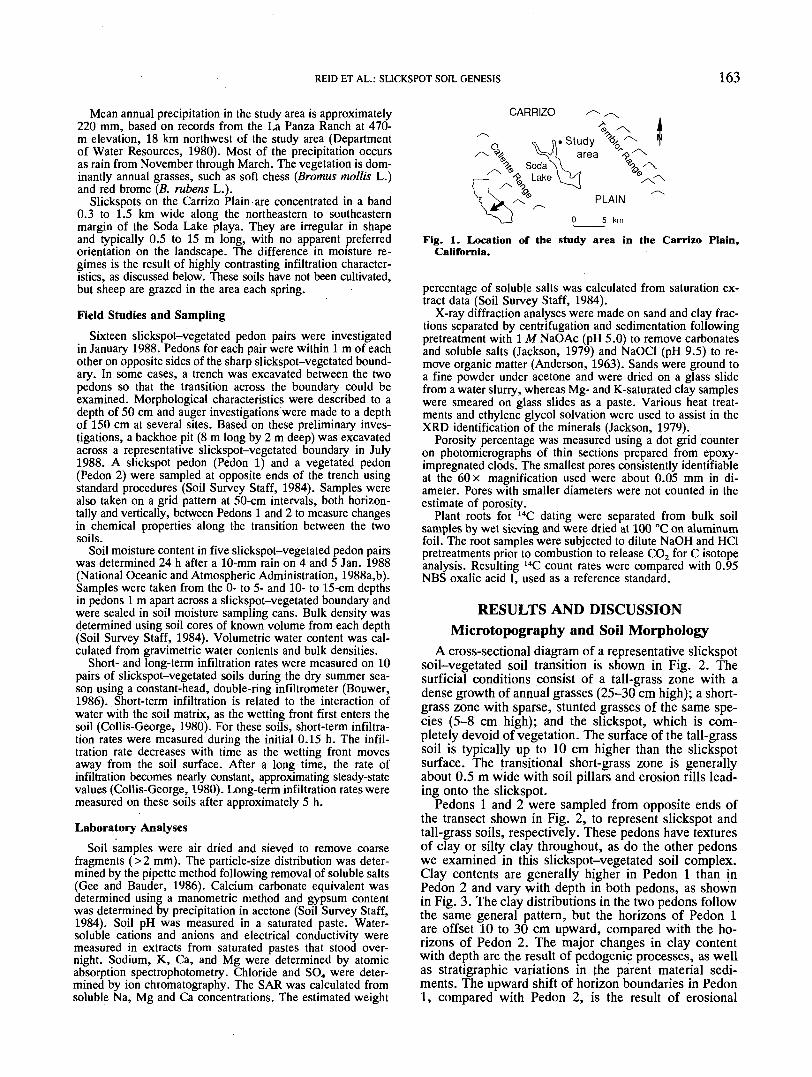
The Carrizo Plain is located in the valley between the Cal-iente and Temblor Ranges of the Central Coast Range provincein eastern San Luis Obispo County, California (Fig. 1). Thevalley is approximately 72 km long and 12 km wide, withSoda Lake located in the lowest part at an elevation of 581 m.The Carrizo Plain became a closed basin about 2 million yrago when tectonic uplift blocked the original northwestwarddrainage from the valley (Dibblee, 1962). The basin is filledwith alluvium derived from Miocene marine sandstones, silt-stones, and shales of the Caliente and Temblor ranges. TheSan Andreas fault runs along the base of the Temblor Rangeand has experienced 475 m of right lateral displacement in thelast 13 250 yr (Sieh and Jahns, 1984).Abbreviations: EC, electrical conductivity; NBS, National Bu-reau of Standards; SAR, sodium adsorption ratio; XRD, x-raydiffraction; YBP, years before present; 0V, volumetric water con-tent.
162
REID ET AL.: SLICKSPOT SOIL GENESIS 163
Mean annual precipitation in the study area is approximately220 mm, based on records from the La Panza Ranch at 470-m elevation, 18 km northwest of the study area (Departmentof Water Resources, 1980). Most of the precipitation occursas rain from November through March. The vegetation is dom-inantly annual grasses, such as soft chess (Bromus mollis L.)and red brome (B. rubens L.).
Slickspots on the Carrizo Plain are concentrated in a band0.3 to 1.5 km wide along the northeastern to southeasternmargin of the Soda Lake playa. They are irregular in shapeand typically 0.5 to 15 m long, with no apparent preferredorientation on the landscape. The difference in moisture re-gimes is the result of highly contrasting infiltration character-istics, as discussed below. These soils have not been cultivated,but sheep are grazed in the area each spring.
Field Studies and SamplingSixteen slickspot-vegetated pedon pairs were investigated
in January 1988. Pedons for each pair were within 1 m of eachother on opposite sides of the sharp slickspot-vegetated bound-ary. In some cases, a trench was excavated between the twopedons so that the transition across the boundary could beexamined. Morphological characteristics were described to adepth of 50 cm and auger investigations were made to a depthof 150 cm at several sites. Based on these preliminary inves-tigations, a backhoe pit (8 m long by 2 m deep) was excavatedacross a representative slickspot-vegetated boundary in July1988. A slickspot pedon (Pedon 1) and a vegetated pedon(Pedon 2) were sampled at opposite ends of the trench usingstandard procedures (Soil Survey Staff, 1984). Samples werealso taken on a grid pattern at 50-cm intervals, both horizon-tally and vertically, between Pedons 1 and 2 to measure changesin chemical properties along the transition between the twosoils.
Soil moisture content in five slickspot-vegetated pedon pairswas determined 24 h after a 10-mm rain on 4 and 5 Jan. 1988(National Oceanic and Atmospheric Administration, 1988a,b).Samples were taken from the 0- to 5- and 10- to 15-cm depthsin pedons 1 m apart across a slickspot-vegetated boundary andwere sealed in soil moisture sampling cans. Bulk density wasdetermined using soil cores of known volume from each depth(Soil Survey Staff, 1984). Volumetric water content was cal-culated from gravimetric water contents and bulk densities.
Short- and long-term infiltration rates were measured on 10pairs of slickspot-vegetated soils during the dry summer sea-son using a constant-head, double-ring infiltrometer (Bouwer,1986)..Short-term infiltration is related to the interaction ofwater with the soil matrix, as the wetting front first enters thesoil (Collis-George, 1980). For these soils, short-term infiltra-tion rates were measured during the initial 0.15 h. The infil-tration rate decreases with time as the wetting front movesaway from the soil surface. After a long time, the rate ofinfiltration becomes nearly constant, approximating steady-statevalues (Collis-George, 1980). Long-term infiltration rates weremeasured on these soils after approximately 5 h.
Laboratory AnalysesSoil samples were air dried and sieved to remove coarse
fragments (>2 mm). The particle-size distribution was deter-mined by the pipette method following removal of soluble salts(Gee and Bauder, 1986). Calcium carbonate equivalent wasdetermined using a manometric method and gypsum contentwas determined by precipitation in acetone (Soil Survey Staff,1984). Soil pH was measured in a saturated paste. Water-soluble cations and anions and electrical conductivity weremeasured in extracts from saturated pastes that stood over-night. Sodium, K, Ca, and Mg were determined by atomicabsorption spectrophotometry. Chloride and SO4 were deter-mined by ion chromatography. The SAR was calculated fromsoluble Na, Mg and Ca concentrations. The estimated weight
CARRIZO
VStudy \area
\ Soda\\
PLAIN
5 km
Fig. 1. Location of the study area in the Carrizo Plain,California.
percentage of soluble salts was calculated from saturation ex-tract data (Soil Survey Staff, 1984).
X-ray diffraction analyses were made on sand and clay frac-tions separated by centrifugation and sedimentation followingpretreatment with 1 M NaOAc (pH 5.0) to remove carbonatesand soluble salts (Jackson, 1979) and NaOCl (pH 9.5) to re-move organic matter (Anderson, 1963). Sands were ground toa fine powder under acetone and were dried on a glass slidefrom a water slurry, whereas Mg- and K-saturated clay sampleswere smeared on glass slides as a paste. Various heat treat-ments and ethylene glycol solvation were used to assist in theXRD identification of the minerals (Jackson, 1979).
Porosity percentage was measured using a dot grid counteron photomicrographs of thin sections prepared from epoxy-impregnated clods. The smallest pores consistently identifiableat the 60 x magnification used were about 0.05 mm in di-ameter. Pores with smaller diameters were not counted in theestimate of porosity.
Plant roots for 14C dating were separated from bulk soilsamples by wet sieving and were dried at 100 °C on aluminumfoil. The root samples were subjected to dilute NaOH and HC1pretreatments prior to combustion to release CO2 for C isotopeanalysis. Resulting 14C count rates were compared with 0.95NBS oxalic acid I, used as a reference standard.
RESULTS AND DISCUSSIONMicrotopography and Soil Morphology
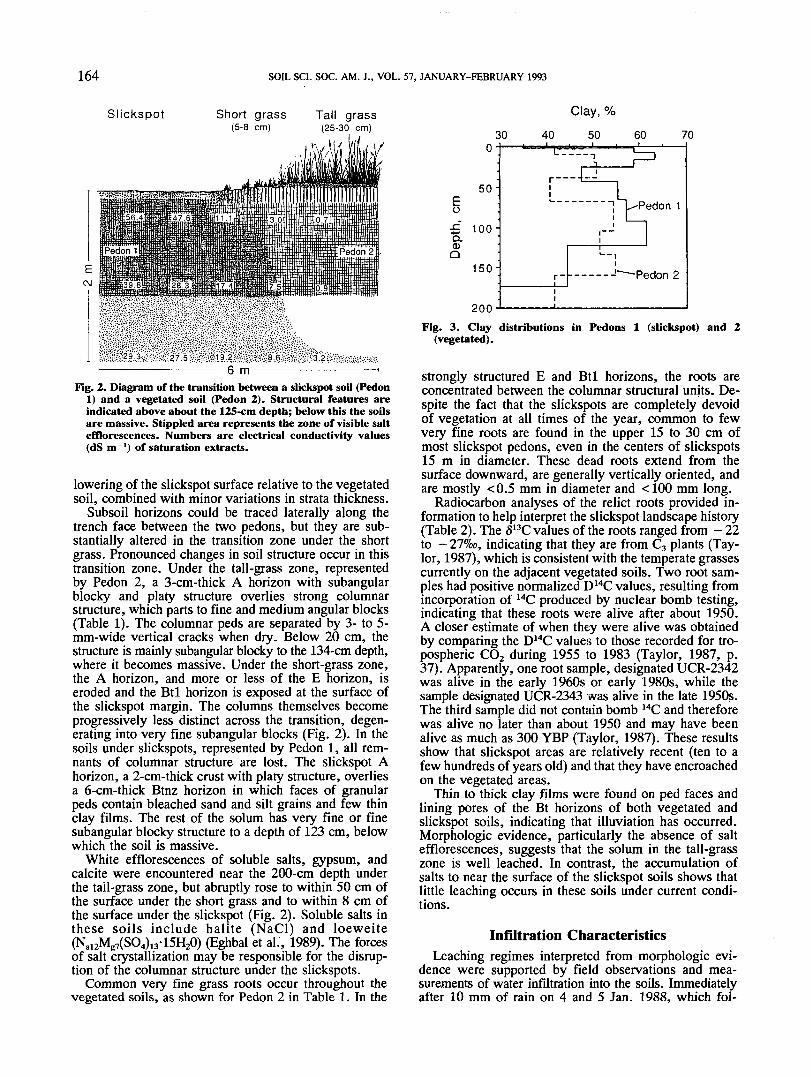
A cross-sectional diagram of a representative slickspotsoil-vegetated soil transition is shown in Fig. 2. Thesurficial conditions consist of a tall-grass zone with adense growth of annual grasses (25-30 cm high); a short-grass zone with sparse, stunted grasses of the same spe-cies (5-8 cm high); and the slickspot, which is com-pletely devoid of vegetation. The surface of the tall-grasssoil is typically up to 10 cm higher than the slickspotsurface. The transitional short-grass zone is generallyabout 0.5 m wide with soil pillars and erosion rills lead-ing onto the slickspot.
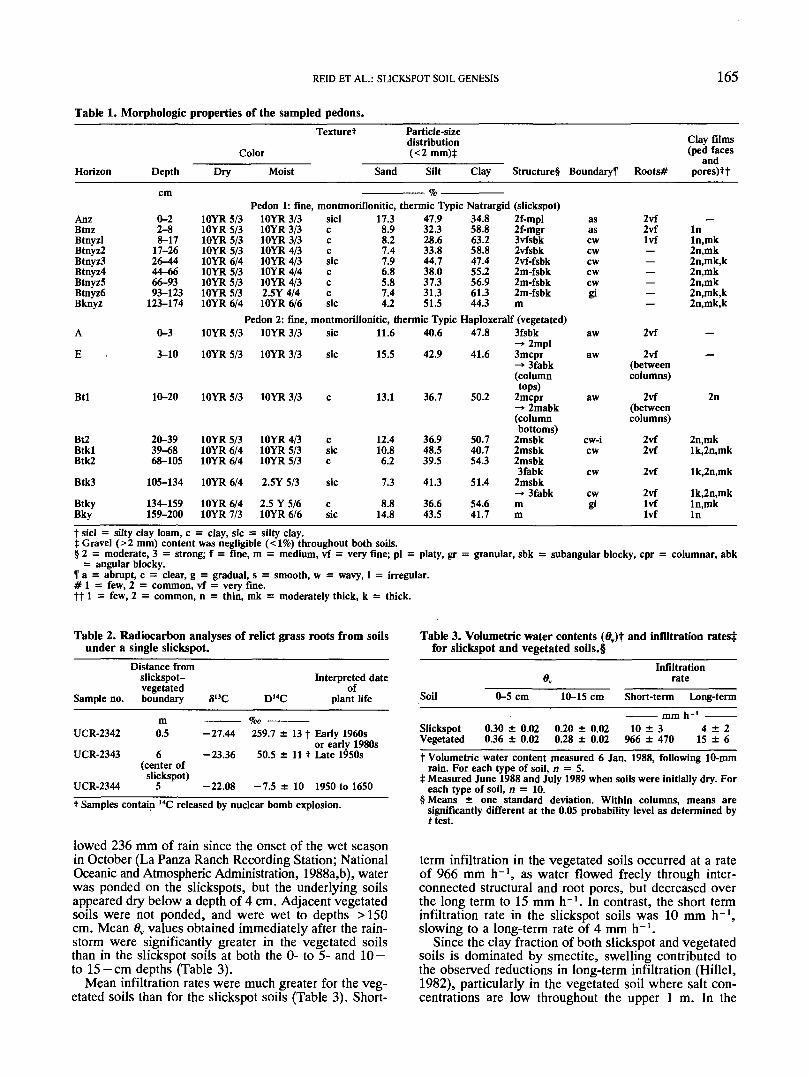
Pedons 1 and 2 were sampled from opposite ends ofthe transect shown in Fig. 2, to represent slickspot andtall-grass soils, respectively. These pedons have texturesof clay or silty clay throughout, as do the other pedonswe examined in this slickspot-vegetated soil complex.Clay contents are generally higher in Pedon 1 than inPedon 2 and vary with depth in both pedons, as shownin Fig. 3. The clay distributions in the two pedons followthe same general pattern, but the horizons of Pedon 1are offset 10 to 30 cm upward, compared with the ho-rizons of Pedon 2. The major changes in clay contentwith depth are the result of pedogenic processes, as wellas stratigraphic variations in the parent material sedi-ments. The upward shift of horizon boundaries in Pedon1, compared with Pedon 2, is the result of erosional
164 SOIL SCI. SOC. AM. J., VOL. 57, JANUARY-FEBRUARY 1993
Slickspot Short grass(5-8 cm)
Tall grass(25-30 cm)
30
Clay, %40 50 60 70
6 mFig. 2. Diagram of the transition between a slickspot soil (Pedon
1) and a vegetated soil (Pedon 2). Structural features areindicated above about the 125-cm depth; below this the soilsare massive. Stippled area represents the zone of visible saltefflorescences. Numbers are electrical conductivity values(dS m ') of saturation extracts.
lowering of the slickspot surface relative to the vegetatedsoil, combined with minor variations in strata thickness.
Subsoil horizons could be traced laterally along thetrench face between the two pedons, but they are sub-stantially altered in the transition zone under the shortgrass. Pronounced changes in soil structure occur in thistransition zone. Under the tall-grass zone, representedby Pedon 2, a 3-cm-thick A horizon with subangularblocky and platy structure overlies strong columnarstructure, which parts to fine and medium angular blocks(Table 1). The columnar peds are separated by 3- to 5-mm-wide vertical cracks when dry. Below 20 cm, thestructure is mainly subangular blocky to the 134-cm depth,where it becomes massive. Under the short-grass zone,the A horizon, and more or less of the E horizon, iseroded and the Btl horizon is exposed at the surface ofthe slickspot margin. The columns themselves becomeprogressively less distinct across the transition, degen-erating into very fine subangular blocks (Fig. 2). In thesoils under slickspots, represented by Pedon 1, all rem-nants of columnar structure are lost. The slickspot Ahorizon, a 2-cm-thick crust with platy structure, overliesa 6-cm-thick Btnz horizon in which faces of granularpeds contain bleached sand and silt grains and few thinclay films. The rest of the solum has very fine or finesubangular blocky structure to a depth of 123 cm, belowwhich the soil is massive.
White efflorescences of soluble salts, gypsum, andcalcite were encountered near the 200-cm depth underthe tall-grass zone, but abruptly rose to within 50 cm ofthe surface under the short grass and to within 8 cm ofthe surface under the slickspot (Fig. 2). Soluble salts inthese soils include halite (NaCl) and loeweite(Nal2Mg7(SO4)i3-15H20) (Eghbal et al., 1989). The forcesof salt crystallization may be responsible for the disrup-tion of the columnar structure under the slickspots.
Common very fine grass roots occur throughout thevegetated soils, as shown for Pedon 2 in Table 1. In the
Eo
"5.o>Q
u -
50-
100
150
or\n -
L-_-_-_-_n » —— ,T |I
r _ _ -|_-.__ ——I
~j ^-Pedon 1ii
i~~i'•"ii
r- ------J~~-Pedon 2ii
Fig. 3. Clay distributions in Pedons 1 (slickspot) and 2(vegetated).
strongly structured E and Btl horizons, the roots areconcentrated between the columnar structural units. De-spite the fact that the slickspots are completely devoidof vegetation at all times of the year, common to fewvery fine roots are found in the upper 15 to 30 cm ofmost slickspot pedons, even in the centers of slickspots15 m in diameter. These dead roots extend from thesurface downward, are generally vertically oriented, andare mostly <0.5 mm in diameter and <100 mm long.
Radiocarbon analyses of the relict roots provided in-formation to help interpret the slickspot landscape history(Table 2). The 513C values of the roots ranged from - 22to — 27%o, indicating that they are from C3 plants (Tay-lor, 1987), which is consistent with the temperate grassescurrently on the adjacent vegetated soils. Two root sam-ples had positive normalized D14C values, resulting fromincorporation of 14C produced by nuclear bomb testing,indicating that these roots were alive after about 1950.A closer estimate of when they were alive was obtainedby comparing the D14C values to those recorded for tro-pospheric CO2 during 1955 to 1983 (Taylor, 1987, p.37). Apparently, one root sample, designated UCR-2342was alive in the early 1960s or early 1980s, while thesample designated UCR-2343 was alive in the late 1950s.The third sample did not contain bomb 14C and thereforewas alive no later than about 1950 and may have beenalive as much as 300 YBP (Taylor, 1987). These resultsshow that slickspot areas are relatively recent (ten to afew hundreds of years old) and that they have encroachedon the vegetated areas.
Thin to thick clay films were found on ped faces andlining pores of the Bt horizons of both vegetated andslickspot soils, indicating that illuviation has occurred.Morphologic evidence, particularly the absence of saltefflorescences, suggests that the solum in the tall-grasszone is well leached. In contrast, the accumulation ofsalts to near the surface of the slickspot soils shows thatlittle leaching occurs in these soils under current condi-tions.
Infiltration CharacteristicsLeaching regimes interpreted from morphologic evi-
dence were supported by field observations and mea-surements of water infiltration into the soils. Immediatelyafter 10 mm of rain on 4 and 5 Jan. 1988, which fol-
REID ET AL.: SLICKSPOT SOIL GENESIS 165
Table 1. Morphologic properties of the sampled pedons.
ColorHorizon
AnzBtnzBtnyzlBtnyz2BtnyzSBtnyz4BtnyzSBtnyz6Bknyz
A
E
Btl
Bt2BtklBtk2
Btk3
BtkyBky
Depth
cm
0-22-88-17
17-2626-4444-6666-9393-123
123-174
0-3
3-10
10-20
20-3939-6868-105
105-134
134-159159-200
Dry
10YR 5/310YR 5/310YR 5/310YR 5/310YR 6/410YR 5/310YR 5/310YR 5/310YR 6/4
10YR 5/3
10YR 5/3
10YR 5/3
10YR 5/310YR 6/410YR 6/4
10YR 6/4
10YR 6/410YR 7/3
Moist
Pedon 1: fine10YR 3/310YR 3/310YR 3/310YR 4/310YR 4/310YR 4/410YR 4/32.5Y 4/410YR 6/6
Pedon 2: fine,10YR 3/3
10YR 3/3
10YR 3/3
10YR 4/310YR 5/310YR 5/3
2.5Y 5/3
2.5 Y 5/610YR 6/6
Texturef
Sand
, montmorillonitic,siclcccsiccccsic
17.38.98.27.47.96.85.87.44.2
Particle-sizedistribution(<2 mm)t
Silt
———thermic Typic
47.932.328.633.844.738.037.331.351.5
Clay
Natrargid34.858.863.258.847.455.256.961.344.3
Structure§
(slickspot)2f-mpl2f-mgr3vfsbk2vfsbk2vf-fsbk2m-fsbk2m-fsbk2m-fsbkm
Boundary^
asascwcwcwcwcwgi
Roots#
2vf2vfIvf——————
Clay films(ped faces
andpores)tt
—InIn.mk2n,mk2n,mk,k2n,mk2n,mk2n,mk,k2n,mk,k
montmorillonitic, thermic Typic Haploxeralf (vegetated)sic
sic
c
csicc
sic
csic
11.6
15.5
13.1
12.410.86.2
7.3
8.814.8
40.6
42.9
36.7
36.948.539.5
41.3
36.643.5
47.8
41.6
50.2
50.740.754.3
51.4
54.641.7
3fsbk-» 2mpl3mcpr-» Sfabk(columntops)
2mcpr-* 2mabk(columnbottoms)
2msbk2msbk2msbk3fabk
2msbk-> Sfabkmm
aw
aw
aw
cw-icw
cw
cwgi
2vf
2vf(betweencolumns)
2vf(betweencolumns)
2vf2vf
2vf
2vfIvfIvf
—
—
2n
2n,rnklk,2n,mk
lk,2n,mk
lk,2n,mkln,mkIn
f sicl = silty clay loam, c = clay, sic = silty clay.i Gravel (>2 mm) content was negligible (<1%) throughout both soils.§ 2 = moderate, 3 = strong; f = fine, m = medium, vf = very fine; pi = platy, gr = granular, sbk = subangular blocky, cpr = columnar, abk
= angular blocky.H a = abrupt, c = clear, g = gradual, s = smooth, w = wavy, i = irregular.# 1 = few, 2 = common, vf = very fine.tt 1 = few, 2 = common, n = thin, ink = moderately thick, k = thick.
Table 2. Radiocarbon analyses of relict grass roots from soilsunder a single slickspot.
Table 3. Volumetric water contents (0v)t and infiltration ratestfor slickspot and vegetated soils.§
Sample no
UCR-2342
UCR-2343
UCR-2344t Samples
Distance fromslickspot-vegetatedboundary
m0.5
6(center ofslickspot)
5
S'3C
-27.44
-23.36
-22.08
D14C
259.7 ±
50.5 ±
-7.5 ±contain 14C released by nuclear bomb
13 t
lit
10
Interpreted dateof
plant life
Early 1960sor early 1980sLate 1950s
1950 to 1650explosion.
lowed 236 mm of rain since the onset of the wet seasonin October (La Panza Ranch Recording Station; NationalOceanic and Atmospheric Administration, 1988a,b), waterwas ponded on the slickspots, but the underlying soilsappeared dry below a depth of 4 cm. Adjacent vegetatedsoils were not ponded, and were wet to depths >150cm. Mean 0V values obtained immediately after the rain-storm were significantly greater in the vegetated soilsthan in the slickspot soils at both the 0- to 5- and 10 —to 15 - cm depths (Table 3).
Mean infiltration rates were much greater for the veg-etated soils than for the slickspot soils (Table 3). Short-
Infiltrationrate
Soil 0-5 cm 10-15 cm Short-term Long-term„„ U-l
SlickspotVegetated
0.30 ± 0.020.36 ± 0.02
0.20 ± 0.020.28 ± 0.02
10 ± 3 4 ± 2966 ± 470 15 ± 6
t Volumetric water content measured 6 Jan. 1988, following 10-mmrain. For each type of soil, n = 5,
$ Measured June 1988 and July 1989 when soils were initially dry. Foreach type of soil, n = 10.
§ Means ± one standard deviation. Within columns, means aresignificantly different at the 0.05 probability level as determined byt test.
term infiltration in the vegetated soils occurred at a rateof 966 mm h"1, as water flowed freely through inter-connected structural and root pores, but decreased overthe long term to 15 mm h"1. In contrast, the short terminfiltration rate in the slickspot soils was 10 mm h"1,slowing to a long-term rate of 4 mm h"1.
Since the clay fraction of both slickspot and vegetatedsoils is dominated by smectite, swelling contributed tothe observed reductions in long-term infiltration (Hillel,1982), particularly in the vegetated soil where salt con-centrations are low throughout the upper 1 m. In the
166 SOIL SCI. SOC. AM. J., VOL. 57, JANUARY-FEBRUARY 1993
Table 4. Chemical properties of the sampled pedons.
Horizon DepthWater-soluble cations and anions
PH ECt Na Ca Mg Cl SO4
AnzBtnzBtnyzlBtnyz2Btnyz3Btnyz4BtnyzSBtnyz6Bknyz
0-22-88-17
17-2626-4444-6666-9393-123
123-174
7.27.07.17.17.27.47.67.67.7
dSm-1
47.587.188.585.074.656.141.331.627.3
• mmol L~'Pedon 1 (slickspot)1502662032011771811097973
2.52.52.00.90.80.50.40.30.3
10441213125211971091993561407358
7.413.426.615.318.615.617.516.416.7
Pedon 2 (vegetated)
3.27.511.420.319.314.49.110.47.2
99014361304982849646380273217
1766156217207178121118108
AEBtlBt2BtklBtk2Btk3BtkyBky
0-33-10
10-2020-3939-6868-105
105-134134-159159-200
6.86.46.97.37.77.97.97.67.8
1.41.00.81.11.10.91.93.63.8
245458644
1.10.50.30.30.10.10.10.20.1
4.05.85.66.66.77.5
12.515.016.2
3.51.20.81.41.20.63.5
15.515.5
2.40.80.61.10.70.30.82.23.6
2.12.73.23.65.45.02.12.43.1
1.30.70.41.31.11.77.5
22.428.0
t EC = electrical conductivity, $ SAR = sodium adsorption ratio.
slickspot soils, infiltration is also inhibited by a 2-cm-thick surface crust with platy structure. The upper 2 mmof the crust is particularly compact and is finer grainedthat the underlying soil fabric (as observed in thin sec-tions). Total porosity (0.23 cm3/cm3) in the slickspotcrust is about the same as the surface of the vegetatedsoil (0.21 cm3/cm3). However, the pores in the slickspotcrust are largely vesicular, and thus not interconnected,whereas those in the vegetated soil are root channels thatprovide continuous paths for water flow.
Soil Chemical ConditionsSoil pH values in this slickspot-grassland complex range
from 6.4 to 7.9 (Table 4), indicating the predominance ofneutral Cl and SO4 salts, rather than Na2CO3, which wouldraise the pH to >8.5 (U.S. Salinity Laboratory, 1954;Whittig and Janitzky, 1963). The horizons that containCaCO3 have pH values of 7.3 to 7.8, as expected wherecalcite is in equilibrium with typical soil CO2 levels.
Electrical conductivity values are vastly different inthe slickspot and vegetated soils (Table 4). In Pedon 1(slickspot), EC decreases regularly from a high of 87 dSm"1 in the 2- to 8-cm depth to a low of 27 dS m"1 inthe 123- to 174-cm depth. In contrast, EC in the moreleached Pedon 2 (vegetated ) is <2 dS m"1 in the upper134 cm and about 4 dS m-1 in the 134- to 200-cm depth.The higher EC values reflect increased concentrations ofwater-soluble cations and anions. In both soils, Na+ isthe dominant cation and Cl~ is the dominant anion ob-tained in saturation extracts; however, the concentrationof these ions are roughly two orders of magnitude higherin the slickspot soils than in the vegetated soils (Table4). Sodium adsorption ratios in the slickspot soils arealso much higher than in the vegetated soils, these sa-line-sodic conditions of relatively high SAR and EC,and pH <8.5, are typical of slickspot soils describedelsewhere in the western USA (E.G., Lewis and White,1964; Munn and Boehm, 1983; Johnson et al., 1985;Hopkins et al., 1991).
The change in saturation extract EC values along thetransition between Pedons 1 and 2 is shown in Fig. 2,which also depicts the distribution of efflorescences,mainly soluble salts and gypsum. The EC values underthe slickspot are high (28-56 dS m-1) and exhibit thesame trend of decreasing with depth as Pedon 1. As theslickspot-vegetated transition is approached, EC valuesdecrease and the depth to efflorescences increases. Un-der the tall grass, the depth to the efflorescence-free zoneincreases abruptly to 2 m. The EC values are < 1 dS m"1
within that zone, increasing to 3 dS m"1 where the ef-florescences are evident at the 2-m depth. The low ECvalues under the tall grass are additional evidence thatthese soils are well leached, whereas the high EC valuesunder the slickspot are the result of accumulated saltwhere leaching is minimal. Furthermore, the increasingEC with depth under the short- and tall-grass zones in-dicates that leaching predominates over the upward fluxdue to evapotranspiration, resulting in an overall down-ward flux of salts in the soil profile. The opposite is trueunder the slickspot, where EC increases upward in theprofile, indicating a net upward flux of salts in responseto an evaporation gradient that dominates over leaching.
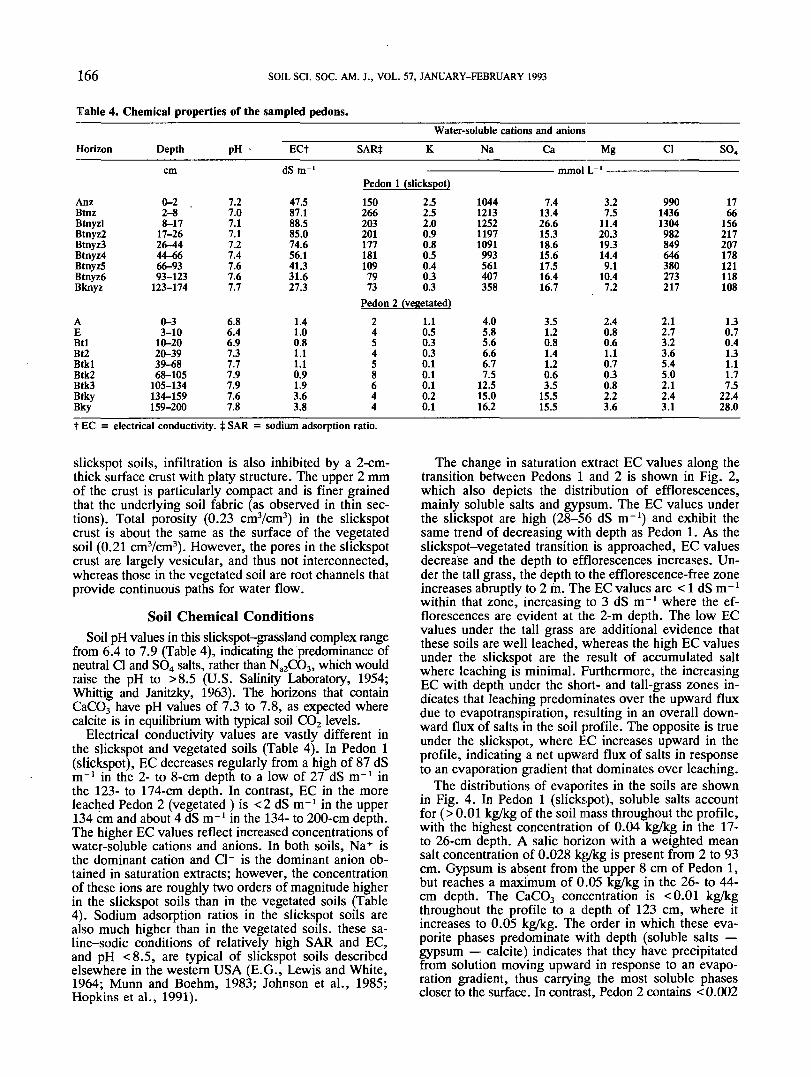
The distributions of evaporites in the soils are shownin Fig. 4. In Pedon 1 (slickspot), soluble salts accountfor (>0.01 kg/kg of the soil mass throughout the profile,with the highest concentration of 0.04 kg/kg in the 17-to 26-cm depth. A salic horizon with a weighted meansalt concentration of 0.028 kg/kg is present from 2 to 93cm. Gypsum is absent from the upper 8 cm of Pedon 1,but reaches a maximum of 0.05 kg/kg in the 26- to 44-cm depth. The CaCO3 concentration is <0.01 kg/kgthroughout the profile to a depth of 123 cm, where itincreases to 0.05 kg/kg. The order in which these eva-porite phases predominate with depth (soluble salts —gypsum — calcite) indicates that they have precipitatedfrom solution moving upward in response to an evapo-ration gradient, thus carrying the most soluble phasescloser to the surface. In contrast, Pedon 2 contains <0.002
REID ET AL.: SLICKSPOT SOIL GENESIS 167
Weight % ———————2 4 6
Slickspot Short grass Tall grass8 10
50-
£ 100-Q.0)D
150-
200
Fig. 4. Distribution of soluble salts, gypsum, and calcite (CaCO3equivalent) in Pedons 1 (slickspot) and 2 (vegetated).
kg/kg soluble salts throughout and gypsum (0.04-0.07kg/kg) is encountered only below 134 cm, while calciteis present in all horizons below 40 cm (increasing withdepth to 0.08 kg/kg below 159 cm). Thus, in the vege-tated soil, the order of evaporite occurrence (Calcite —gypsum — soluble salts) is the reverse of that in theslickspot soil. The least soluble phases have precipitatedfirst (highest in the profile) in response to a downwardleaching environment.
Slickspot Formation and Soil GenesisCommon relict grass roots in the slickspot soils, which
currently are devoid of vegetation throughout the year,are compelling evidence that these areas were once veg-etated. The current physical and chemical conditions ofthe slickspot Natrargids are so inhospitable to plant growththat the hypothesis of them becoming vegetated andevolving into Haploxeralfs is untenable. Apparently, acontinuous grassland-Haploxeralf landscape once ex-isted in the study area, but it has since been interruptedby the development of slickspot-Natrargid bodies.
Accepting the evidence that the slickspot soils haveevolved from the vegetated soils, we have developed aninterpretation of their formation. Slickspots can begin toform when the surface of the vegetated soil is laid bareto erosion. These are several possible mechanisms bywhich bare soil can be exposed at the surface, includingthe concentrated activity of sheep, which are grazed inthe area, and mounding by gophers, which are commoninhabitants of the vegetated soils.
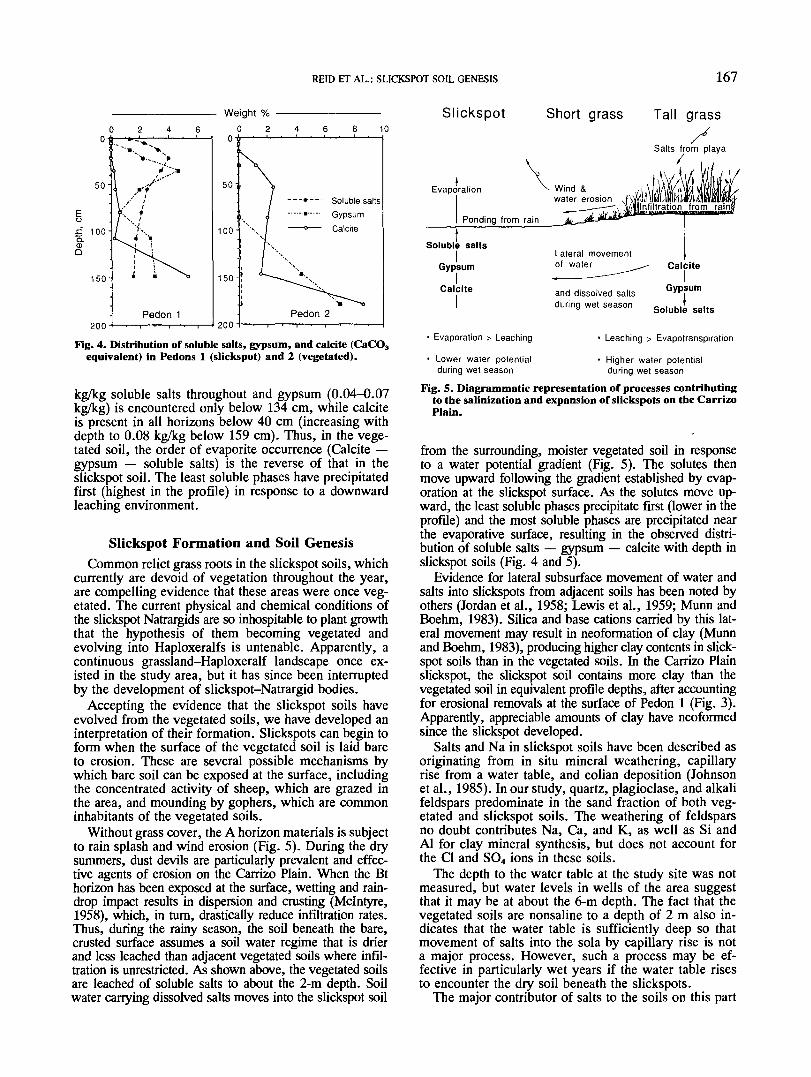
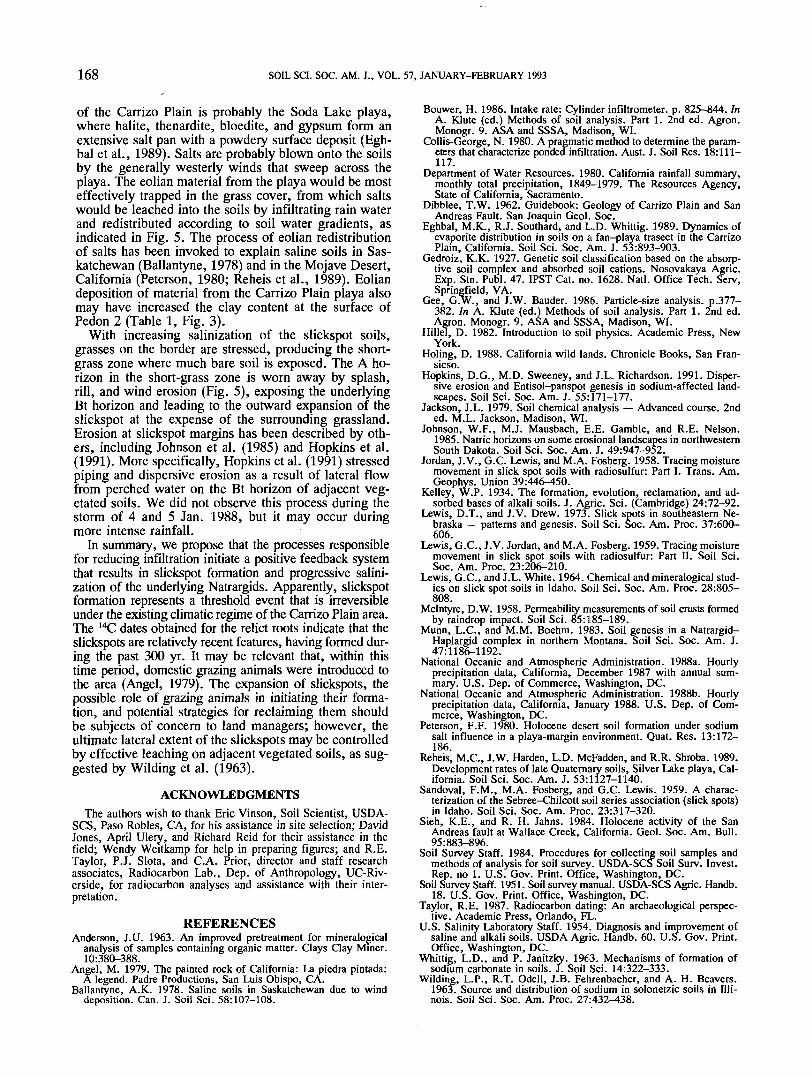
Without grass cover, the A horizon materials is subjectto rain splash and wind erosion (Fig. 5). During the drysummers, dust devils are particularly prevalent and effec-tive agents of erosion on the Carrizo Plain. When the Bthorizon has been exposed at the surface, wetting and rain-drop impact results in dispersion and crusting (Mclntyre,1958), which, in turn, drastically reduce infiltration rates.Thus, during the rainy season, the soil beneath the bare,crusted surface assumes a soil water regime that is drierand less leached than adjacent vegetated soils where infil-tration is unrestricted. As shown above, the vegetated soilsare leached of soluble salts to about the 2-m depth. Soilwater carrying dissolved salts moves into the slickspot soil
Salts from playa/ / .
Evaporation
Ponding from rain
Soluble salts
Gypsum
Calcite
-. Wind &water erosion JVv
___jt4__jii->iik^
Lateral movementof water
and dissolved saltsduring wet season
infiltration from rainj
^- Calcite
Gypsum
Soluble salts
Evaporation > Leaching
Lower water potentialduring wet season
Leaching > Evapotranspiration
Higher water potentialduring wet season
Fig. 5. Diagrammatic representation of processes contributingto the salinization and expansion of slickspots on the CarrizoPlain.
from the surrounding, moister vegetated soil in responseto a water potential gradient (Fig. 5). The solutes thenmove upward following the gradient established by evap-oration at the slickspot surface. As the solutes move up-ward, the least soluble phases precipitate first (lower in theprofile) and the most soluble phases are precipitated nearthe evaporative surface, resulting in the observed distri-bution of soluble salts — gypsum — calcite with depth inslickspot soils (Fig. 4 and 5).
Evidence for lateral subsurface movement of water andsalts into slickspots from adjacent soils has been noted byothers (Jordan et al., 1958; Lewis et al., 1959; Munn andBoehm, 1983). Silica and base cations carried by this lat-eral movement may result in neoformation of clay (Munnand Boehm, 1983), producing higher clay contents in slick-spot soils than in the vegetated soils. In the Carrizo Plainslickspot, the slickspot soil contains more clay than thevegetated soil in equivalent profile depths, after accountingfor erosional removals at the surface of Pedon 1 (Fig. 3).Apparently, appreciable amounts of clay have neoformedsince the slickspot developed.
Salts and Na in slickspot soils have been described asoriginating from in situ mineral weathering, capillaryrise from a water table, and eolian deposition (Johnsonet al., 1985). In our study, quartz, plagioclase, and alkalifeldspars predominate in the sand fraction of both veg-etated and slickspot soils. The weathering of feldsparsno doubt contributes Na, Ca, and K, as well as Si andAl for clay mineral synthesis, but does not account forthe Cl and SO4 ions in these soils.
The depth to the water table at the study site was notmeasured, but water levels in wells of the area suggestthat it may be at about the 6-m depth. The fact that thevegetated soils are nonsaline to a depth of 2 m also in-dicates that the water table is sufficiently deep so thatmovement of salts into the sola by capillary rise is nota major process. However, such a process may be ef-fective in particularly wet years if the water table risesto encounter the dry soil beneath the slickspots.
The major contributor of salts to the soils on this part
168 SOIL SCI. SOC. AM. J., VOL. 57, JANUARY-FEBRUARY 1993
of the Carrizo Plain is probably the Soda Lake playa,where halite, thenardite, bloedite, and gypsum form anextensive salt pan with a powdery surface deposit (Egh-bal et al., 1989). Salts are probably blown onto the soilsby the generally westerly winds that sweep across theplaya. The eolian material from the playa would be mosteffectively trapped in the grass cover, from which saltswould be leached into the soils by infiltrating rain waterand redistributed according to soil water gradients, asindicated in Fig. 5. The process of eolian redistributionof salts has been invoked to explain saline soils in Sas-katchewan (Ballantyne, 1978) and in the Mojave Desert,California (Peterson, 1980; Reheis et al., 1989). Eoliandeposition of material from the Carrizo Plain playa alsomay have increased the clay content at the surface ofPedon 2 (Table 1, Fig. 3).
With increasing salinization of the slickspot soils,grasses on the border are stressed, producing the short-grass zone where much bare soil is exposed. The A ho-rizon in the short-grass zone is worn away by splash,rill, and wind erosion (Fig. 5), exposing the underlyingBt horizon and leading to the outward expansion of theslickspot at the expense of the surrounding grassland.Erosion at slickspot margins has been described by oth-ers, including Johnson et al. (1985) and Hopkins et al.(1991). More specifically, Hopkins et al. (1991) stressedpiping and dispersive erosion as a result of lateral flowfrom perched water on the Bt horizon of adjacent veg-etated soils. We did not observe this process during thestorm of 4 and 5 Jan. 1988, but it may occur duringmore intense rainfall.
In summary, we propose that the processes responsiblefor reducing infiltration initiate a positive feedback systemthat results in slickspot formation and progressive salini-zation of the underlying Natrargids. Apparently, slickspotformation represents a threshold event that is irreversibleunder the existing climatic regime of the Carrizo Plain area.The 14C dates obtained for the relict roots indicate that theslickspots are relatively recent features, having formed dur-ing the past 300 yr. It may be relevant that, within thistime period, domestic grazing animals were introduced tothe area (Angel, 1979). The expansion of slickspots, thepossible role of grazing animals in initiating their forma-tion, and potential strategies for reclaiming them shouldbe subjects of concern to land managers; however, theultimate lateral extent of the slickspots may be controlledby effective leaching on adjacent vegetated soils, as sug-gested by Wilding et al. (1963).
ACKNOWLEDGMENTSThe authors wish to thank Eric Vinson, Soil Scientist, USDA-
SCS, Paso Robles, CA, for his assistance in site selection; DavidJones, April Ulery, and Richard Reid for their assistance in thefield; Wendy Weitkamp for help in preparing figures; and R.E.Taylor, PJ. Slota, and C.A. Prior, director and staff researchassociates, Radiocarbon Lab., Dep. of Anthropology, UC-Riv-erside, for radiocarbon analyses and assistance with their inter-pretation.