Embed Size (px)
Citation preview
SLAM DUNK. How to score full points on performance in SLAs.Adam Grummitt – [email protected]
2
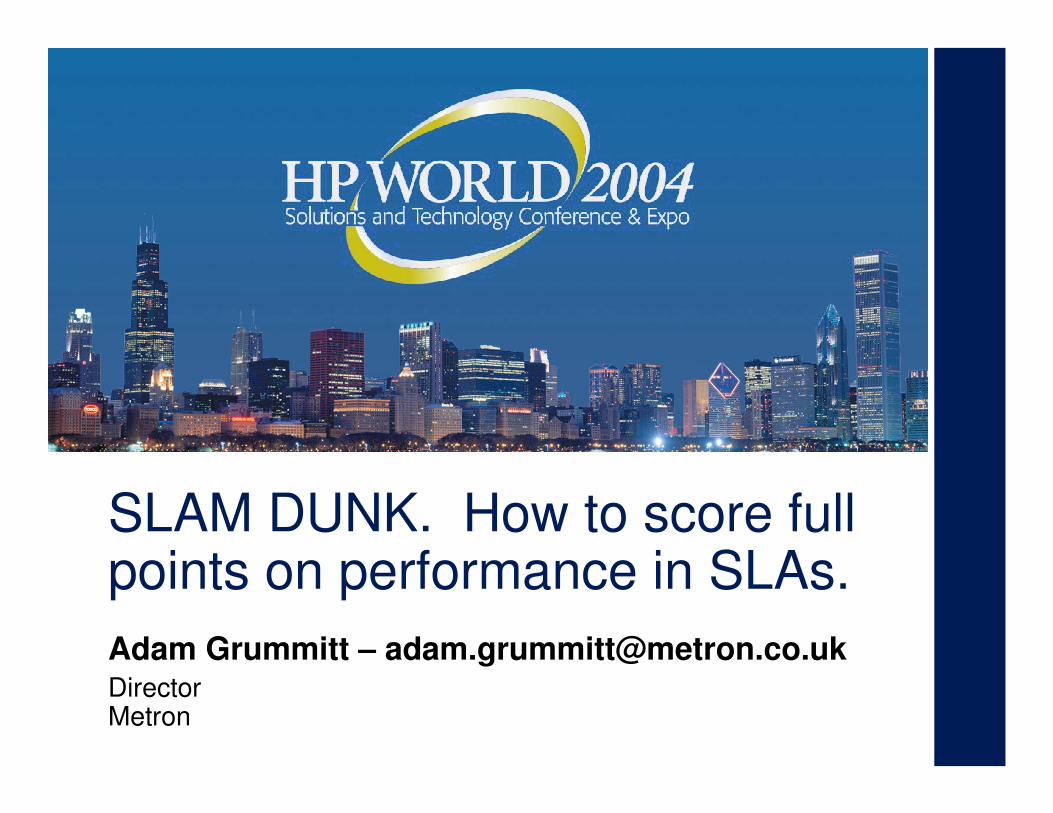
Abstract: SLAs and Performance Assurance
• SLAs define IT service requirements formally
• Constrain/contract both receivers & providers
• Define/repository for Performance Targets
• Measurable key performance indicators (KPI)
• Business and application views inc. response time
• Models used to reflect and police SLAs
• Establish a performance management regime
• Threshold violations alarms and alerts
• Achieve Performance Assurance
3
Introduction• SLA & SLAM – ITIL & ITSM
• Six Sigma, BSC, CoBit, QM, MOF
• Practical approach to performance in SLAs
• A skeleton SLA
• Typical outcome analysis
• Use of capacity management techniques
• Typical implementations and benefits
• Samples including ecommerce
4
ITIL• The ITI Library - books & definitions
− Service Support & Service delivery− Business, Infrastructure, Development, Service
• Good practice for managing IT
• Basis of BS15000, 7799 and ISO 17799 standards
• Developed by UK’s OGC in the 90’s
• Metron key contributor to initial Demonstrator
• itSMF− The IT Service Management Forum for ITIL users− Promotes exchange of info & experience− GB, NL, B, AUS, ZA, CDN, F, CH/A/D, USA
5
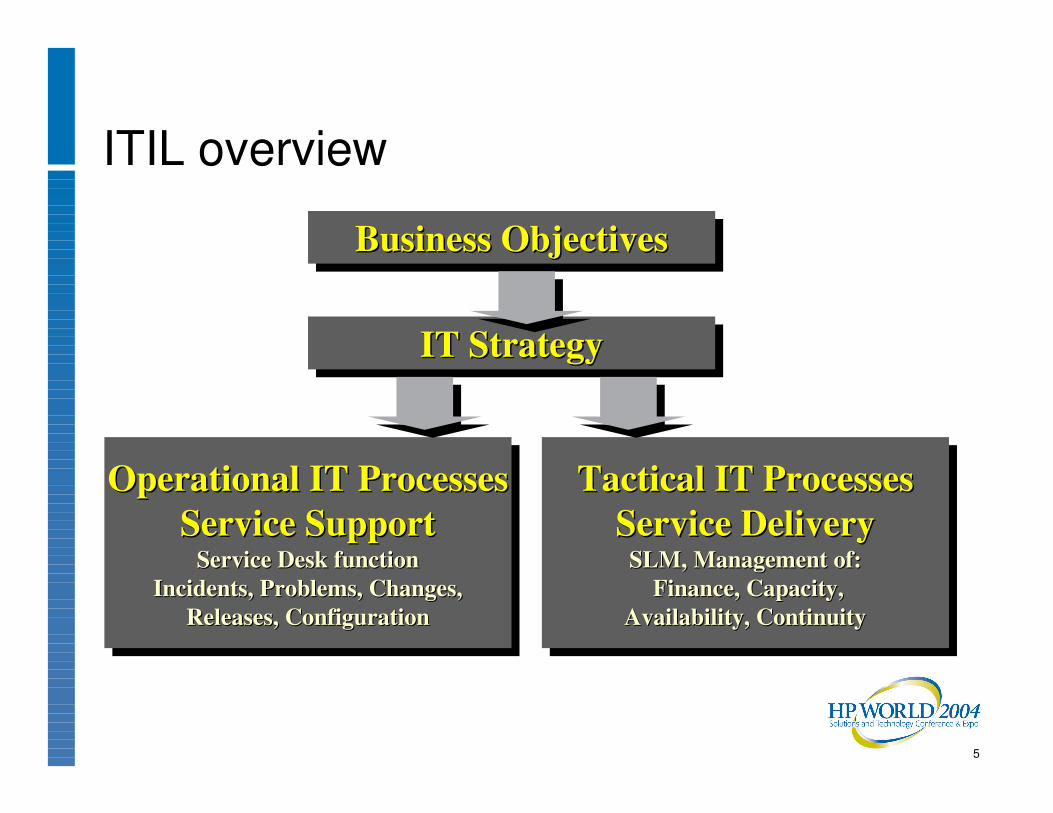
ITIL overview
Business ObjectivesBusiness ObjectivesBusiness Objectives
IT StrategyIT StrategyIT Strategy
Tactical IT ProcessesService Delivery
SLM, Management of:Finance, Capacity,
Availability, Continuity
Tactical IT ProcessesTactical IT ProcessesService DeliveryService Delivery
SLM, Management of:SLM, Management of:Finance, Capacity,Finance, Capacity,
Availability, ContinuityAvailability, Continuity
Operational IT ProcessesService Support
Service Desk functionIncidents, Problems, Changes,
Releases, Configuration
Operational IT ProcessesOperational IT ProcessesService SupportService Support
Service Desk functionService Desk functionIncidents, Problems, Changes,Incidents, Problems, Changes,
Releases, ConfigurationReleases, Configuration
6
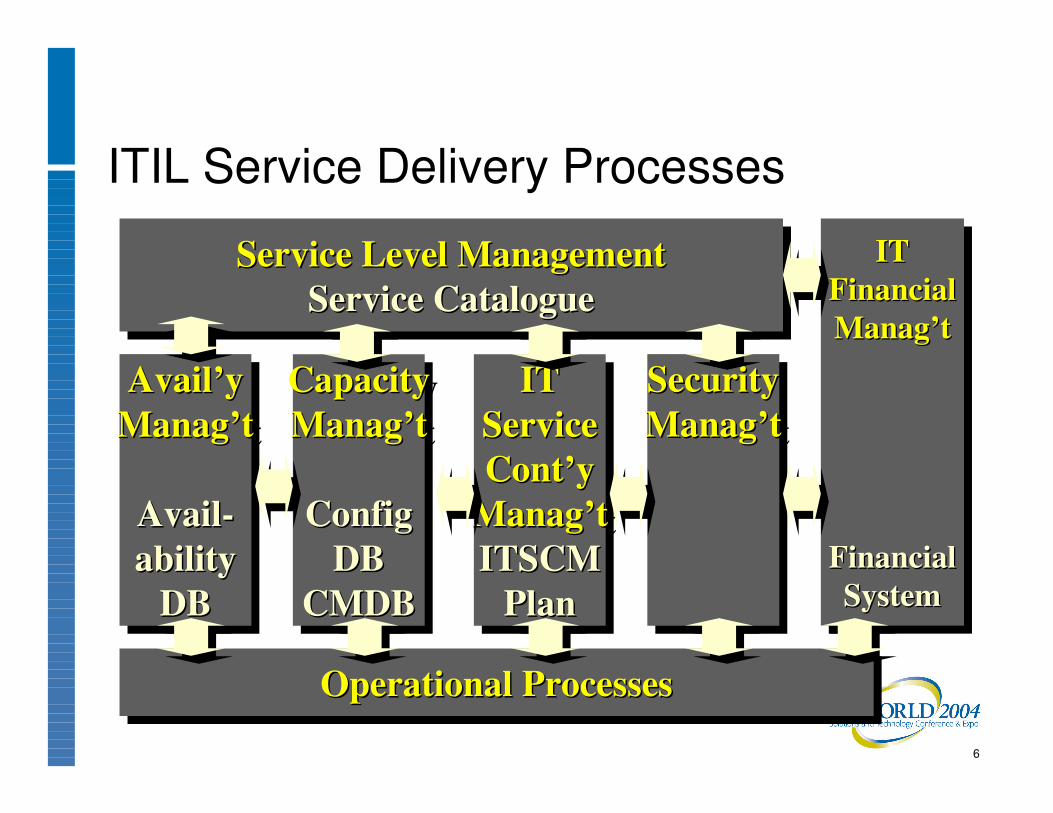
ITIL Service Delivery Processes
Service Level ManagementService Catalogue
Service Level ManagementService Level ManagementService CatalogueService Catalogue
Operational ProcessesOperational ProcessesOperational Processes
Avail’yManag’t
Avail-ability
DB
Avail’yAvail’yManag’tManag’t
AvailAvail--abilityability
DBDB
CapacityManag’t
ConfigDB
CMDB
CapacityCapacityManag’tManag’t
ConfigConfigDBDB
CMDBCMDB
ITServiceCont’y
Manag’tITSCM
Plan
ITITServiceServiceCont’yCont’y
Manag’tManag’tITSCMITSCM
PlanPlan
SecurityManag’tSecuritySecurityManag’tManag’t
ITFinancialManag’t
FinancialSystem
ITITFinancialFinancialManag’tManag’t
FinancialFinancialSystemSystem
7
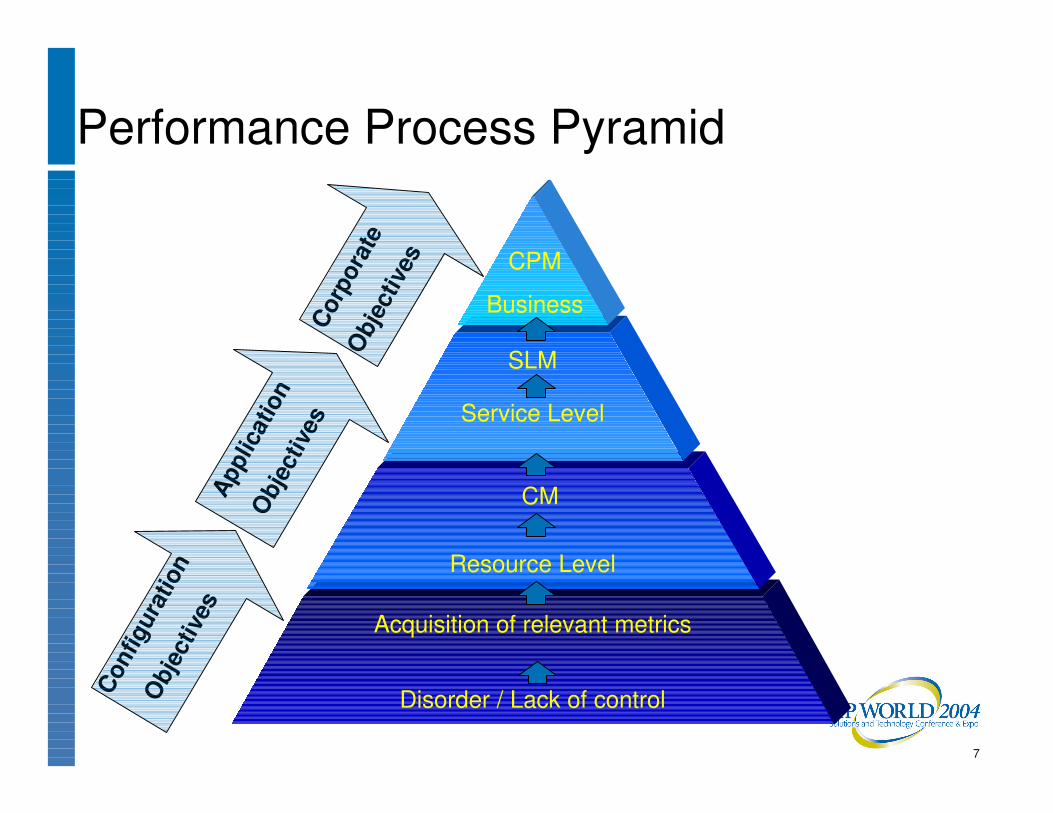
Disorder / Lack of control
Acquisition of relevant metrics
Conf
igur
atio
nO
bjec
tives
Resource Level
CMAppl
icat
ion
Obj
ectiv
es Service Level
SLM
CPM
BusinessCo
rpor
ate
Obj
ectiv
es
Performance Process Pyramid
8
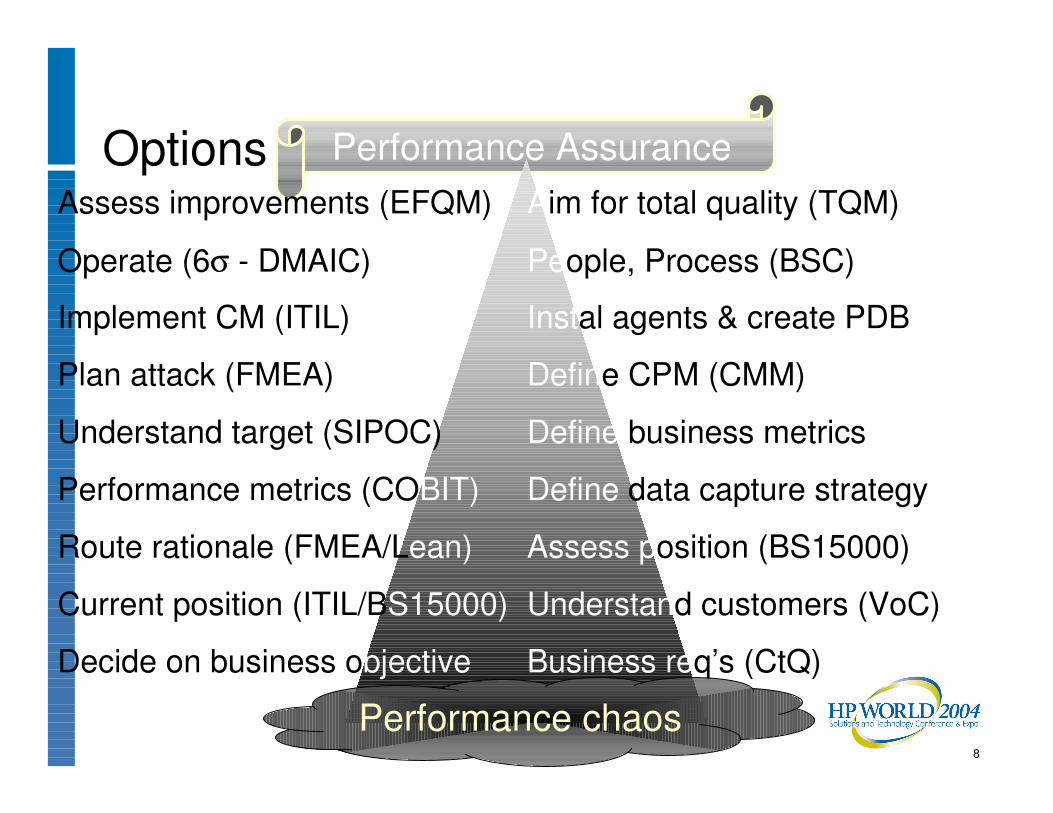
Performance AssuranceOptionsAssess improvements (EFQM) Aim for total quality (TQM)
Operate (6σ - DMAIC) People, Process (BSC)
Implement CM (ITIL) Instal agents & create PDB
Plan attack (FMEA) Define CPM (CMM)
Understand target (SIPOC) Define business metrics
Performance metrics (COBIT) Define data capture strategy
Route rationale (FMEA/Lean) Assess position (BS15000)
Current position (ITIL/BS15000) Understand customers (VoC)
Decide on business objective Business req’s (CtQ)
Performance chaos
9
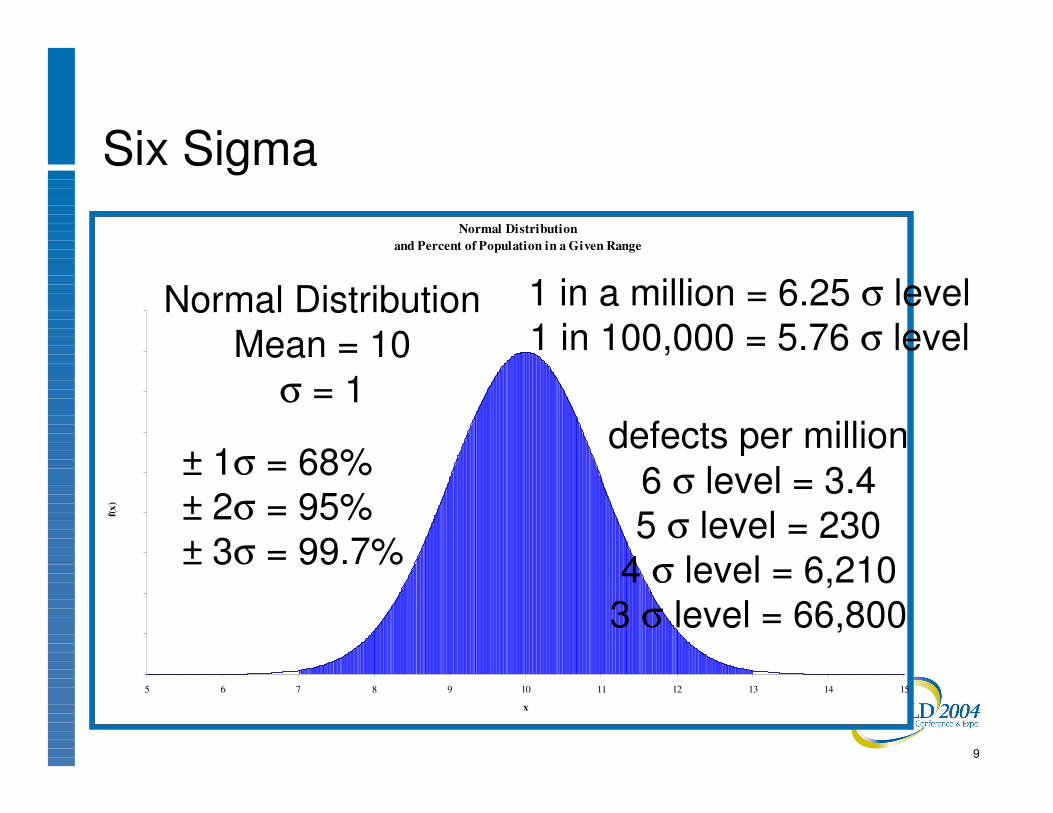
Six SigmaNormal Distribution
and Percent of Population in a Given Range
0
0.05
0.1
0.15
0.2
0.25
0.3
0.35
0.4
0.45
5 6 7 8 9 10 11 12 13 14 15
x
f(x)
± 1σ = 68%± 2σ = 95%± 3σ = 99.7%
1 in a million = 6.25 σ level1 in 100,000 = 5.76 σ level
defects per million6 σ level = 3.45 σ level = 230
4 σ level = 6,2103 σ level = 66,800
Normal DistributionMean = 10
σ = 1
10
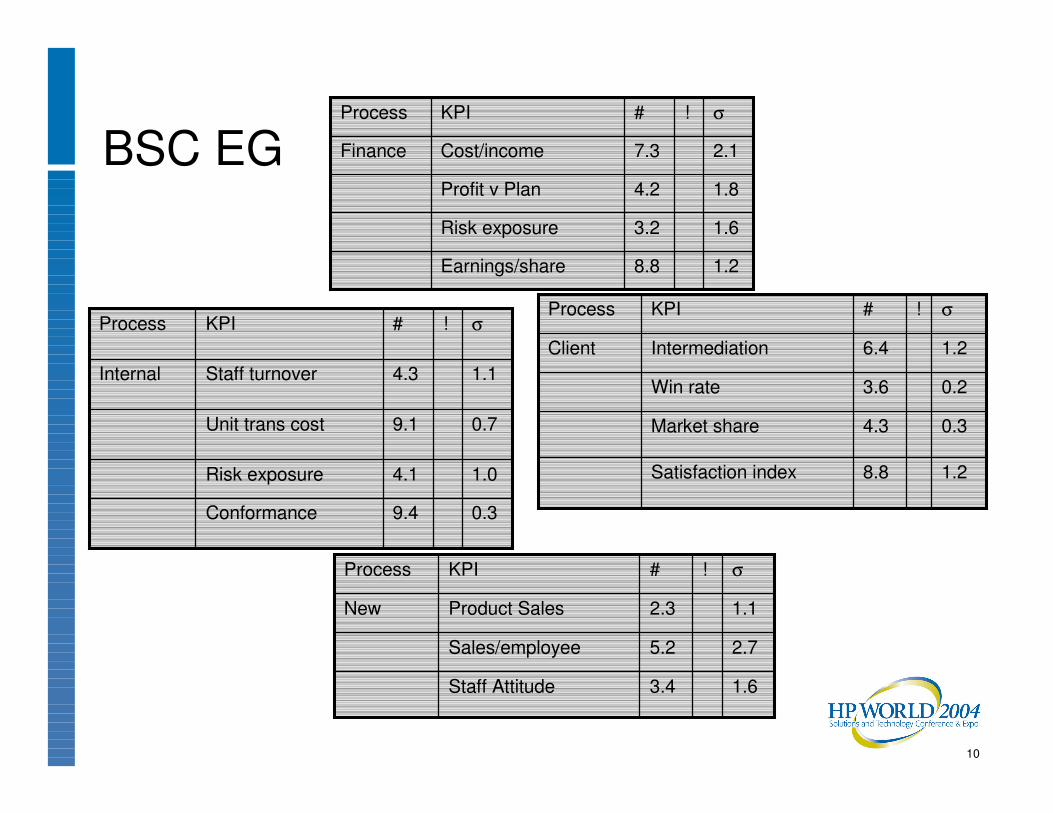
BSC EG
0.39.4Conformance
1.04.1Risk exposure
0.79.1Unit trans cost
1.14.3Staff turnover Internal
σ!#KPIProcess
1.28.8Earnings/share
1.63.2Risk exposure
1.84.2Profit v Plan
2.17.3Cost/incomeFinance
σ!#KPIProcess
1.28.8Satisfaction index
0.34.3Market share
0.23.6Win rate
1.26.4IntermediationClient
σ!#KPIProcess
1.63.4Staff Attitude
2.75.2Sales/employee
1.12.3Product SalesNew
σ!#KPIProcess
11
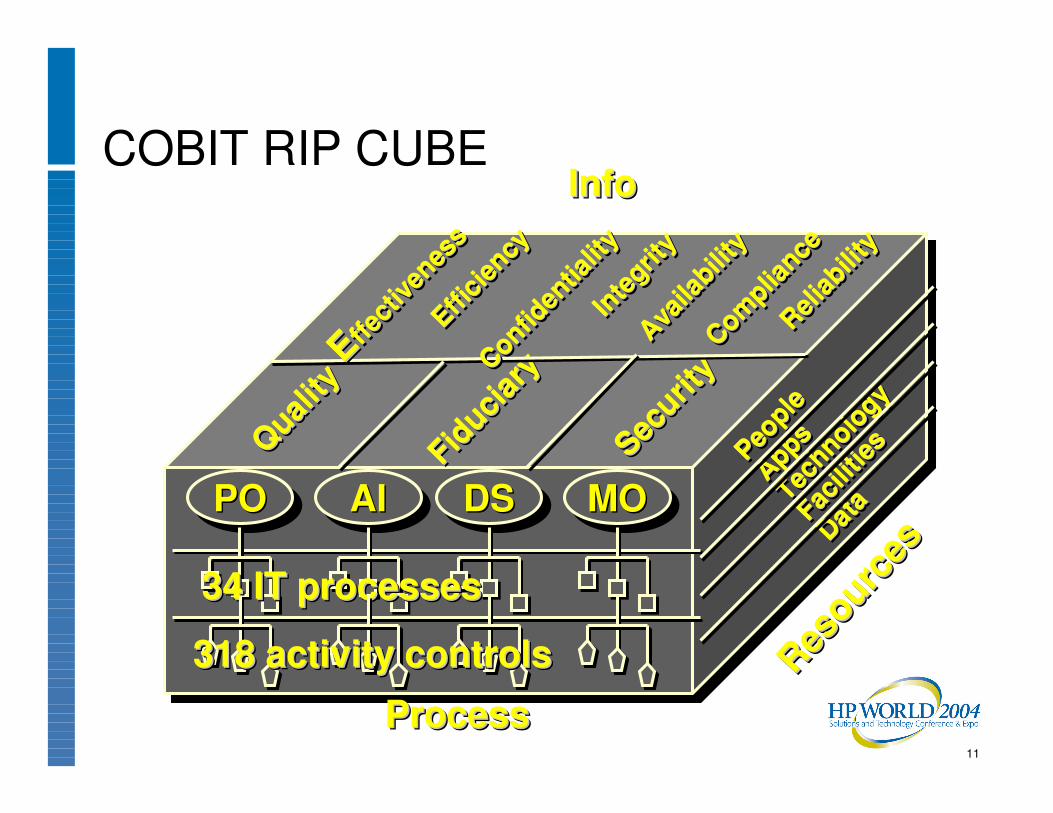
COBIT RIP CUBE
POPOPO AIAIAI DSDSDS MOMOMO
34 IT processes34 IT processes34 IT processes
318 activity controls318 activity controls318 activity controls
Quality
Quality
Quality
Fiducia
ry
Fiducia
ry
Fiducia
ry
Securit
y
Securit
y
Securit
yEffect
ivenes
s
EEffect
ivenes
s
ffect
ivenes
sEffi
ciency
Efficie
ncy
Efficie
ncyConfid
entia
lity
Confiden
tialit
y
Confiden
tialit
yIn
tegrit
y
Inte
grity
Inte
grity
Availa
bility
Availa
bility
Availa
bility
Complia
nce
Complia
nce
Complia
nceReli
abilit
y
Reliab
ility
Reliab
ility
InfoInfoInfo
ProcessProcessProcess
Resou
rces
Resou
rces
Resou
rces
People
AppsTec
hnology
Facilit
ies
Data
People
People
AppsApps
Technolo
gy
Technolo
gy
Facilit
ies
Facilit
ies
Data
Data
12
CMM, TQM, EFQM• CMM levels and QM
1. Basic introduction, ad hoc solution
2. Repeatable or reactive process
3. Defined or proactive process
4. Quantitatively managed process
5. Optimised effective implementation
13
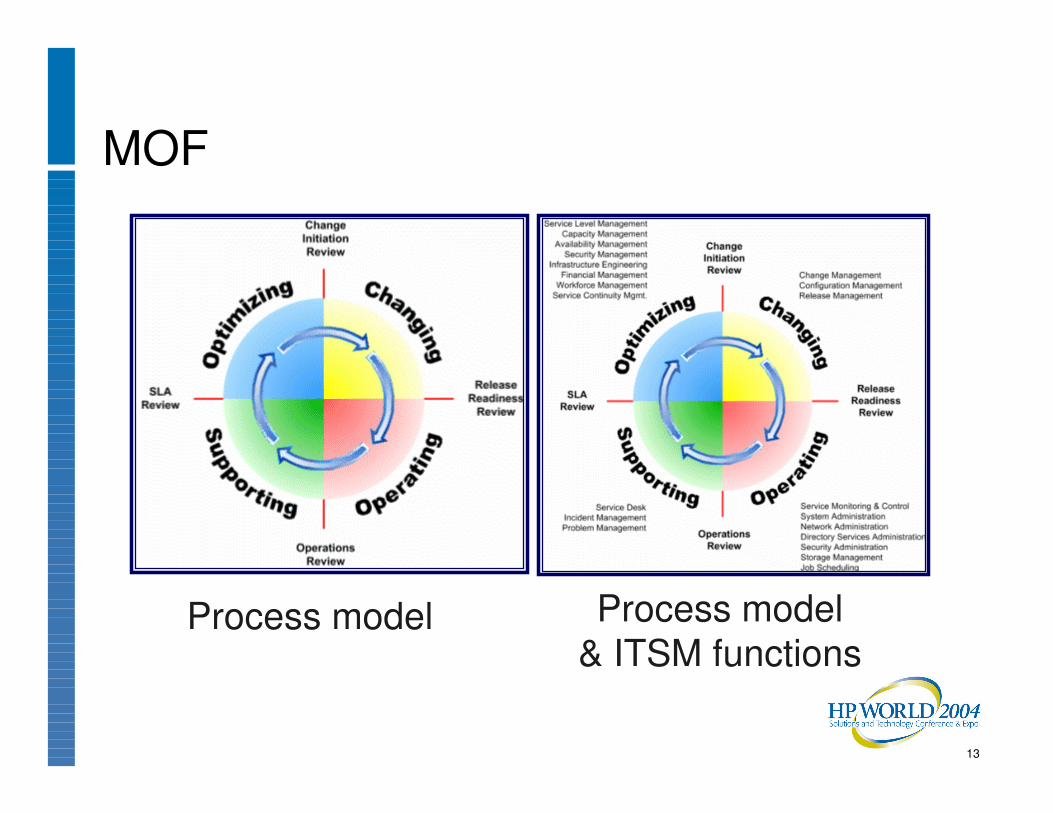
MOF
Process model Process model& ITSM functions
14
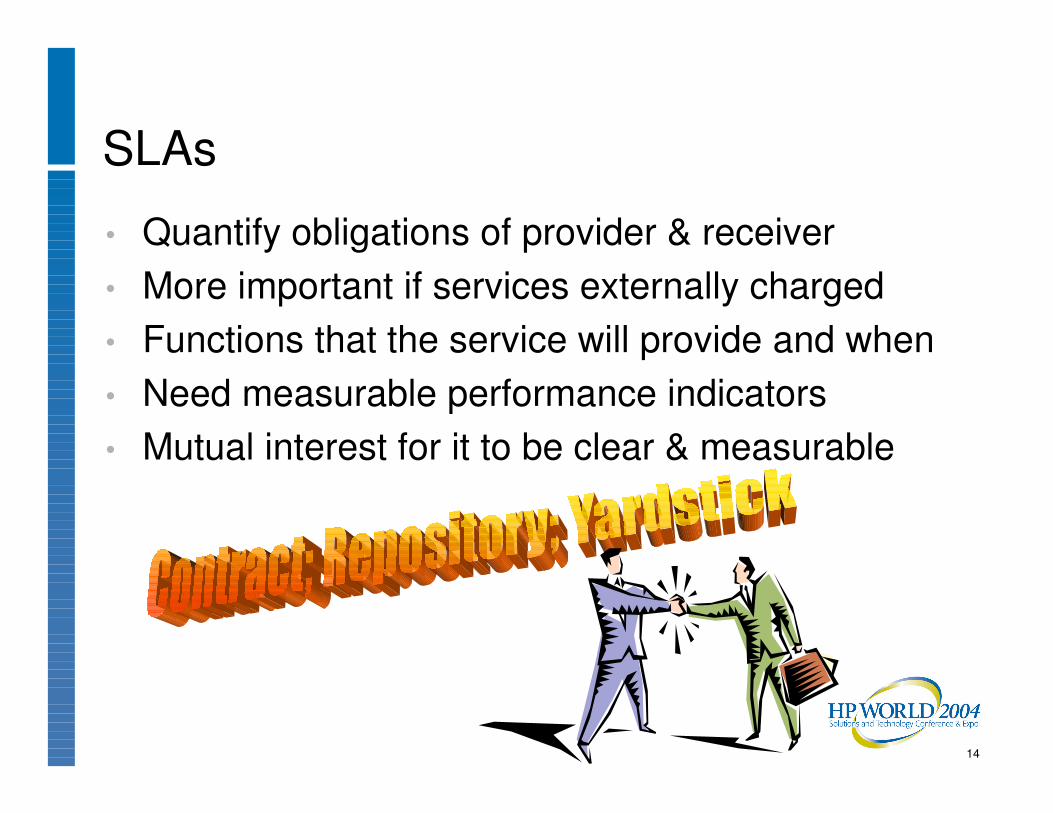
SLAs
• Quantify obligations of provider & receiver• More important if services externally charged• Functions that the service will provide and when• Need measurable performance indicators• Mutual interest for it to be clear & measurable
15
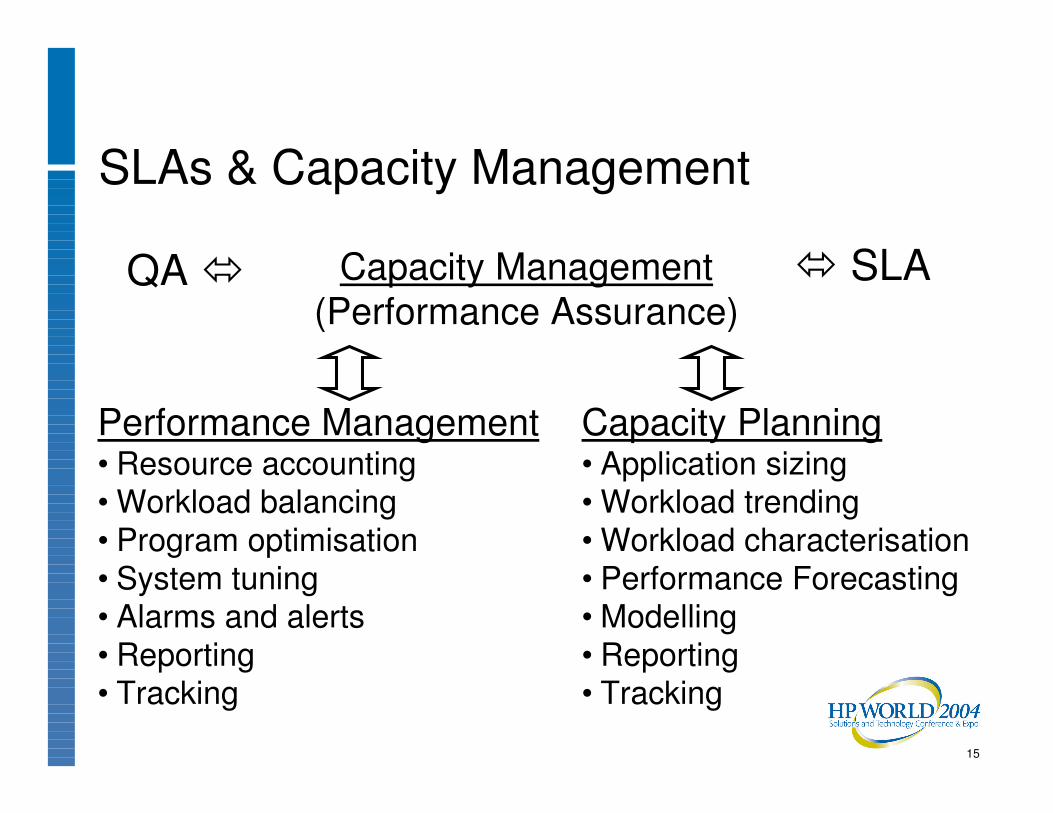
SLAs & Capacity Management
Capacity Management(Performance Assurance)
Performance Management• Resource accounting• Workload balancing• Program optimisation• System tuning• Alarms and alerts• Reporting• Tracking
Capacity Planning• Application sizing• Workload trending• Workload characterisation• Performance Forecasting• Modelling• Reporting• Tracking
� SLAQA �
16
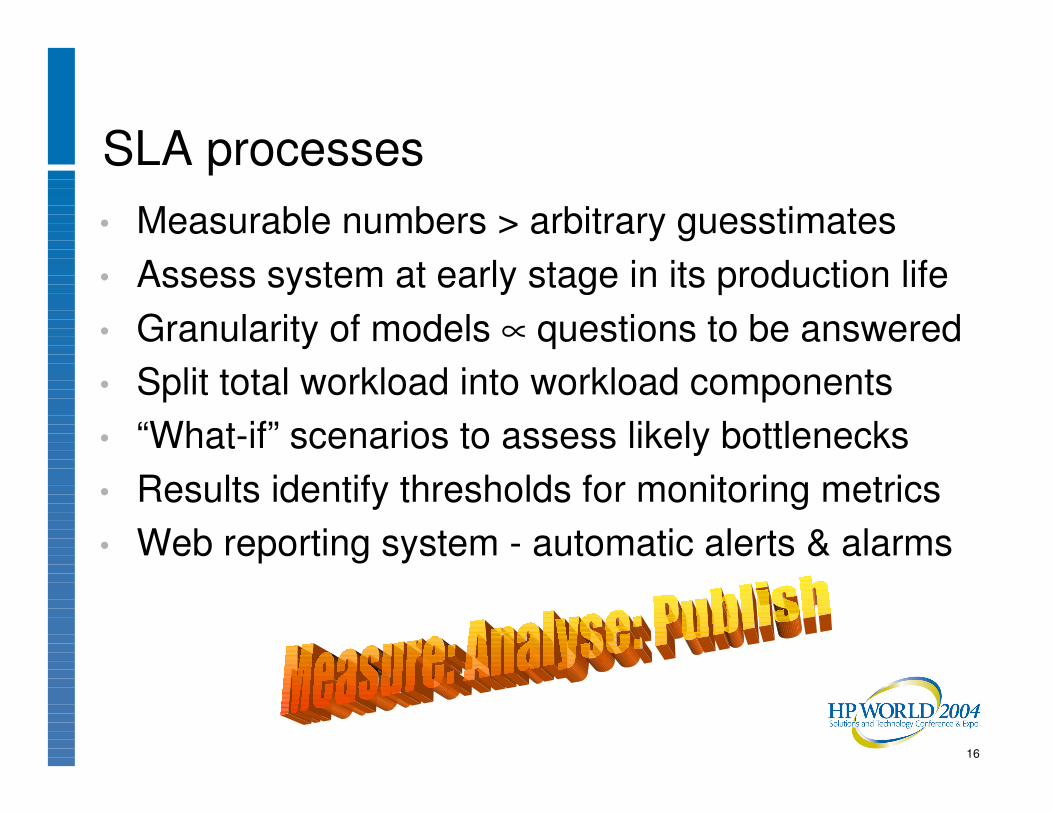
SLA processes• Measurable numbers > arbitrary guesstimates• Assess system at early stage in its production life• Granularity of models ∝ questions to be answered• Split total workload into workload components• “What-if” scenarios to assess likely bottlenecks• Results identify thresholds for monitoring metrics • Web reporting system - automatic alerts & alarms
17
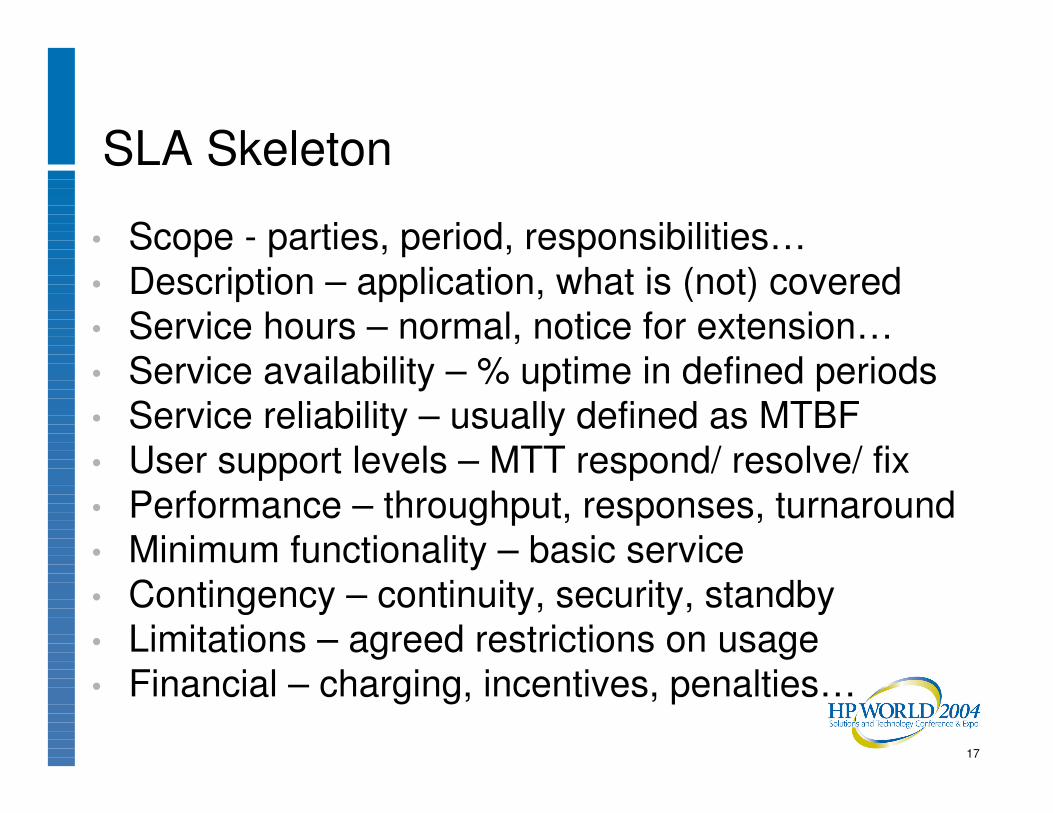
SLA Skeleton
• Scope - parties, period, responsibilities…• Description – application, what is (not) covered• Service hours – normal, notice for extension…• Service availability – % uptime in defined periods• Service reliability – usually defined as MTBF• User support levels – MTT respond/ resolve/ fix• Performance – throughput, responses, turnaround• Minimum functionality – basic service• Contingency – continuity, security, standby• Limitations – agreed restrictions on usage• Financial – charging, incentives, penalties…
18
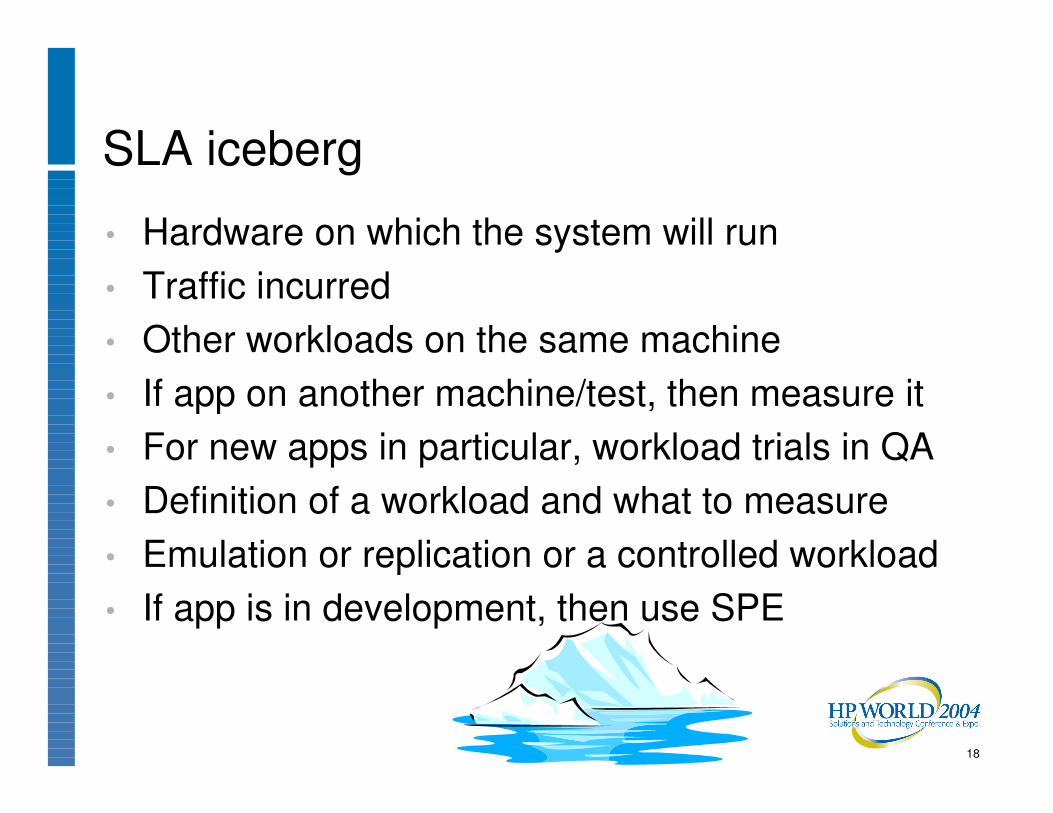
SLA iceberg
• Hardware on which the system will run• Traffic incurred• Other workloads on the same machine• If app on another machine/test, then measure it• For new apps in particular, workload trials in QA• Definition of a workload and what to measure• Emulation or replication or a controlled workload• If app is in development, then use SPE
19
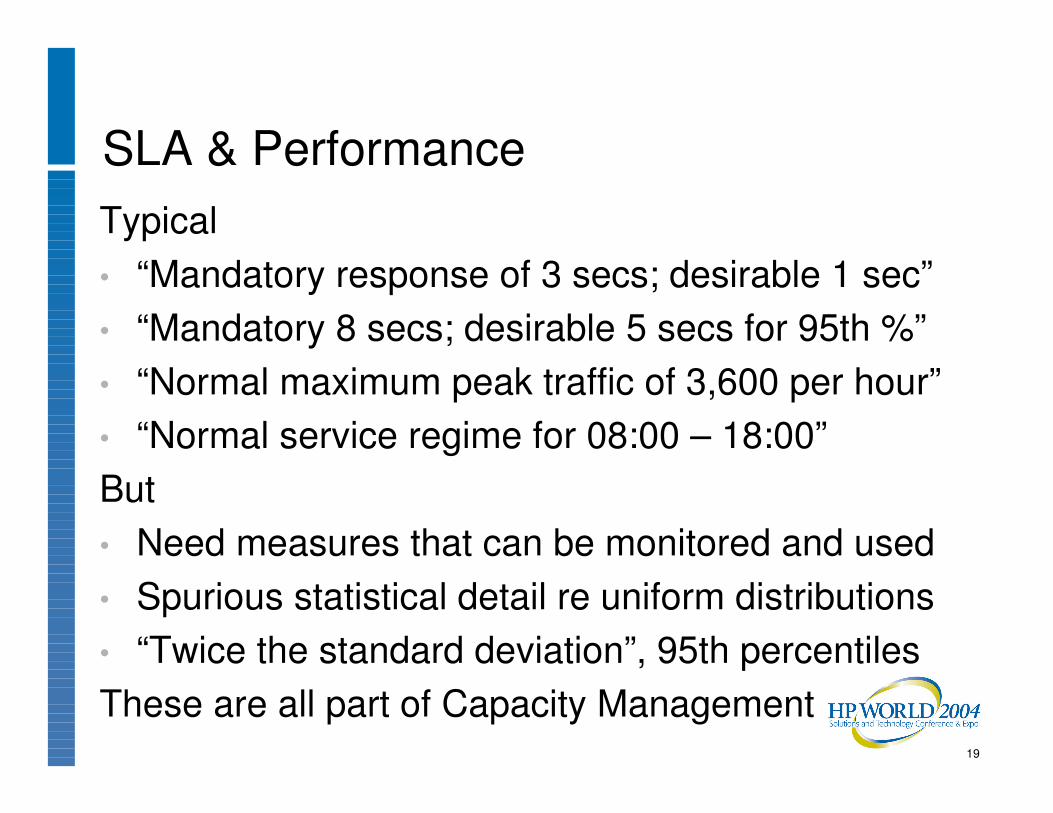
SLA & PerformanceTypical• “Mandatory response of 3 secs; desirable 1 sec” • “Mandatory 8 secs; desirable 5 secs for 95th %”• “Normal maximum peak traffic of 3,600 per hour”• “Normal service regime for 08:00 – 18:00”But• Need measures that can be monitored and used• Spurious statistical detail re uniform distributions• “Twice the standard deviation”, 95th percentiles These are all part of Capacity Management
20
Performance Metrics variability• Metrics are variable in presence and reliability• What is available is not always necessary• What is necessary is not always available• Both system level and user/process level• Metrics may be sparse re mapping or responses• Some applications are well instrumented…• Network statistics mostly in ports, packets…• Rules and practices enable gaps to be filled
21
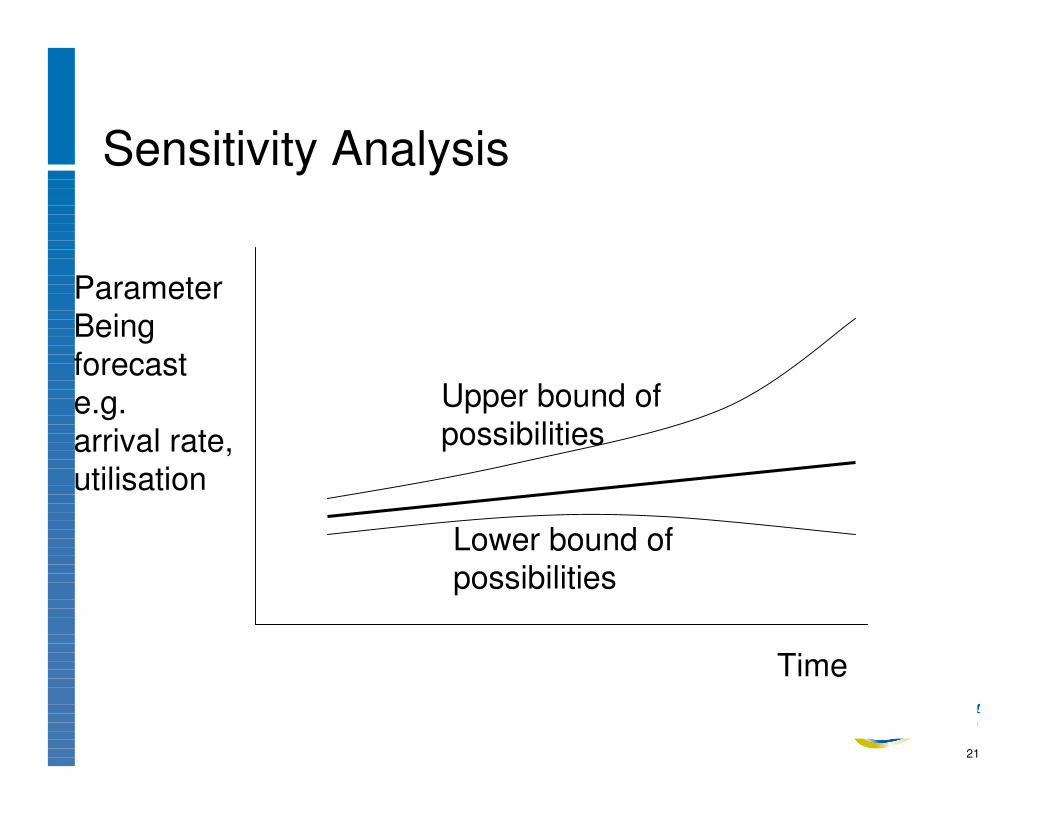
Sensitivity Analysis
ParameterBeing forecaste.g.arrival rate,utilisation
Upper bound of possibilities
Lower bound of possibilities
Time
22
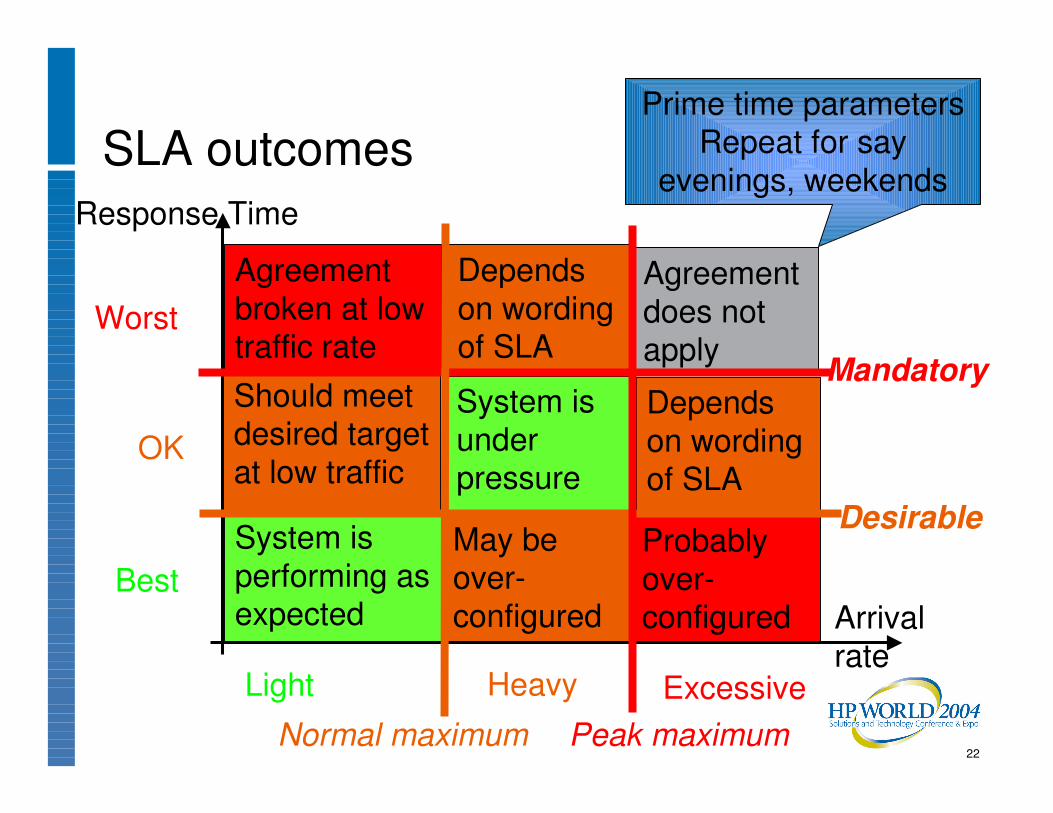
SLA outcomes
Agreement does not apply
Agreement broken at low traffic rate
Probably over-configured
System is under pressure
System is performing as expected
Response Time
Arrivalrate
Should meet desired target at low traffic
May be over-configured
Depends on wording of SLA
Depends on wording of SLA
Worst
OK
Best
Mandatory
Desirable
Normal maximum Peak maximum
Light ExcessiveHeavy
Prime time parametersRepeat for say
evenings, weekends
23
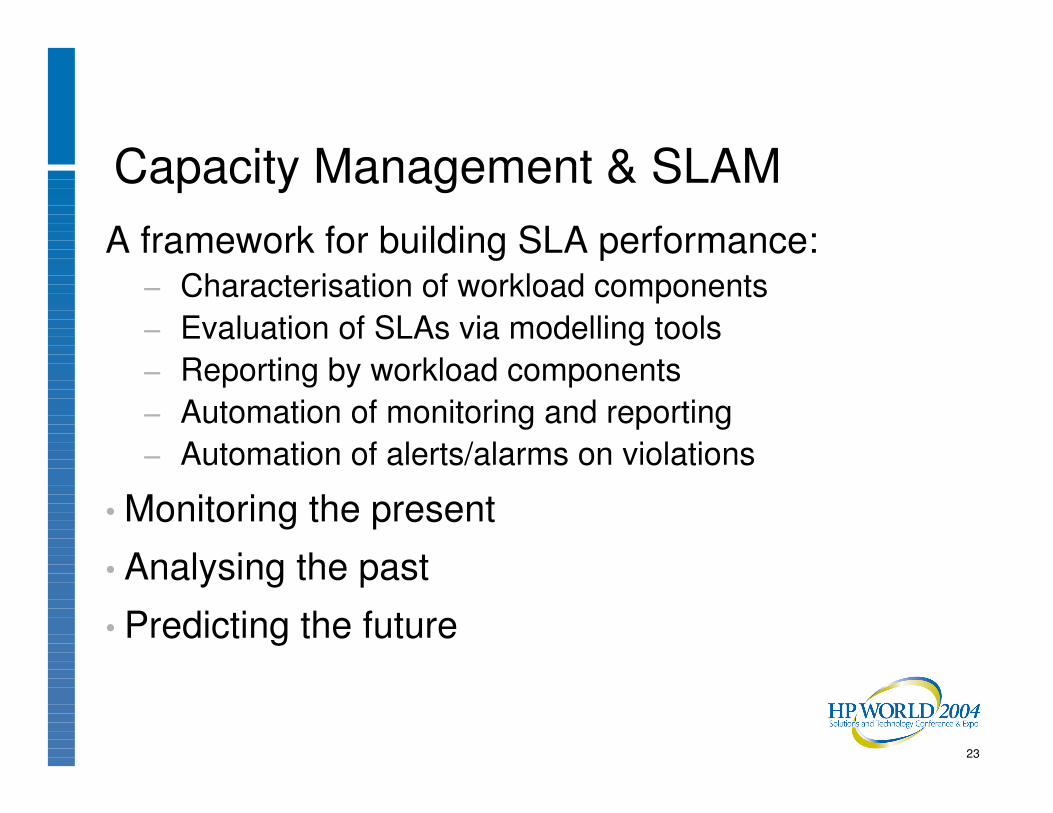
Capacity Management & SLAMA framework for building SLA performance:
− Characterisation of workload components− Evaluation of SLAs via modelling tools− Reporting by workload components− Automation of monitoring and reporting− Automation of alerts/alarms on violations
• Monitoring the present
• Analysing the past
• Predicting the future
24
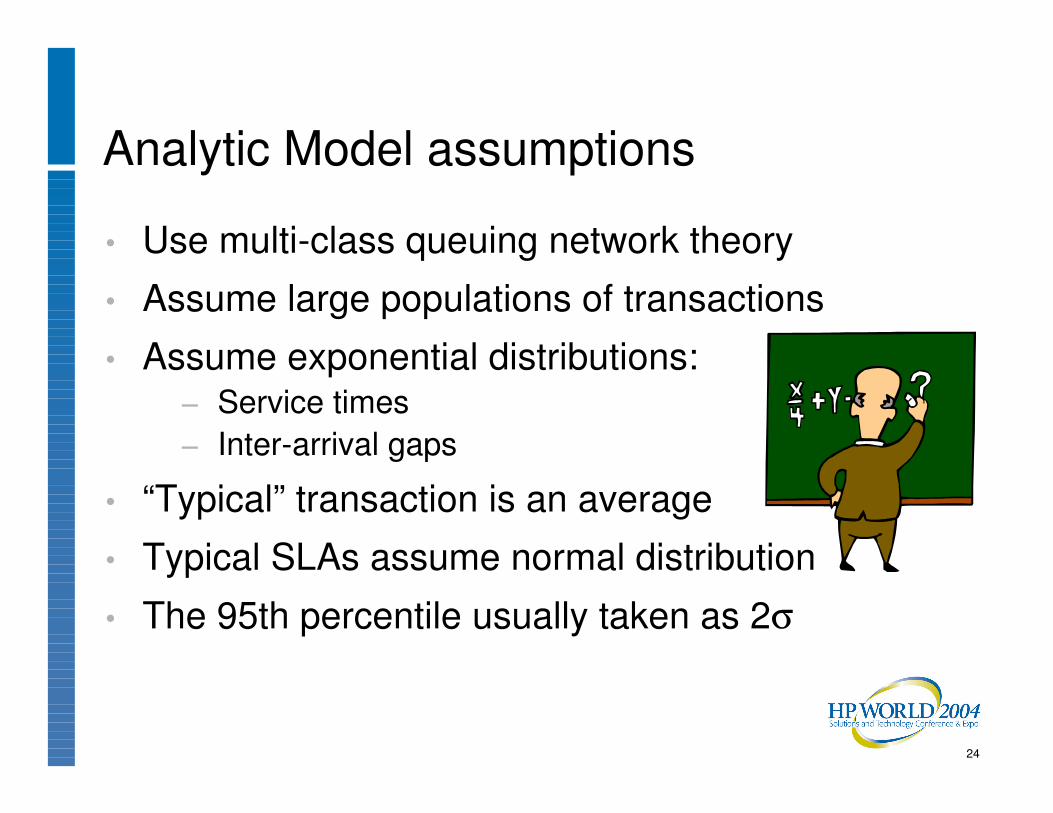
Analytic Model assumptions
• Use multi-class queuing network theory
• Assume large populations of transactions
• Assume exponential distributions:− Service times− Inter-arrival gaps
• “Typical” transaction is an average
• Typical SLAs assume normal distribution
• The 95th percentile usually taken as 2σ
25
Performance Assurance tools• SLA definition of an app depends on the site• Typically, n users all running a particular package• A large number of transactions via an even larger
number of processes• Need to capture, collect and store all KPI details• Aggregate all the resource demands for a group of
processes or users = workload component• Synthesised - usually not a “real” transaction• Used to define a baseline situation and assess
relative degradation with increasing traffic etc.
26
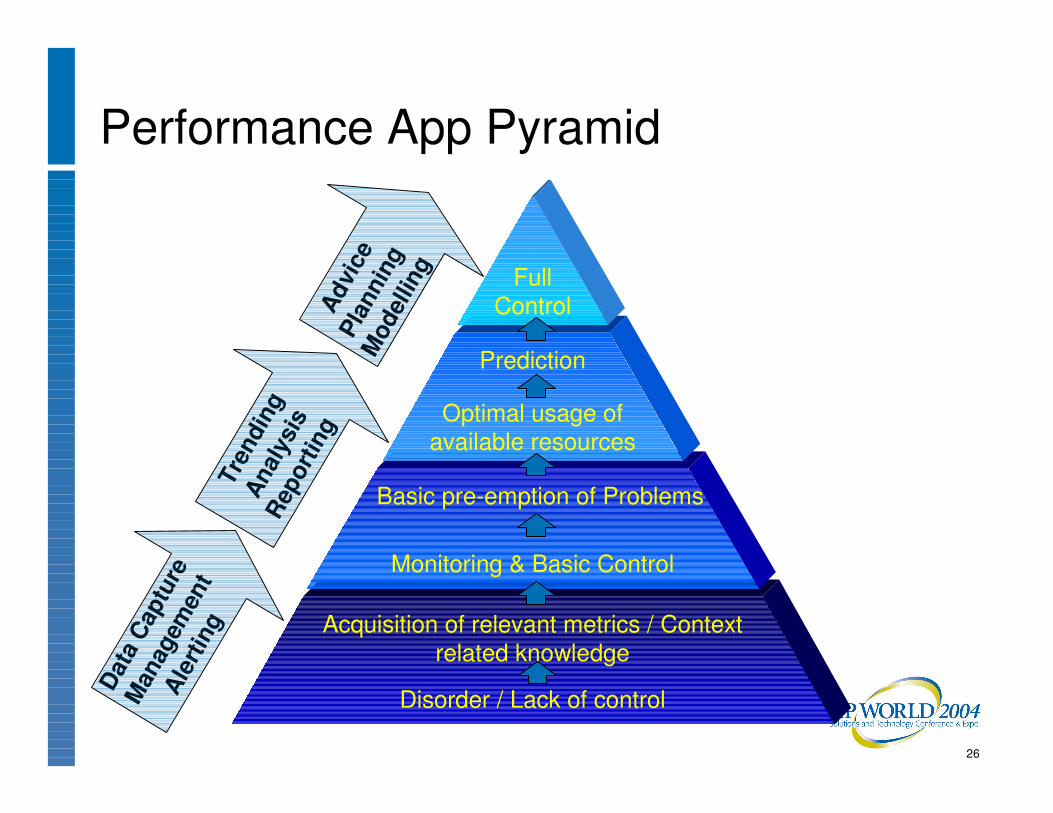
Disorder / Lack of control
Acquisition of relevant metrics / Context related knowledge
Data
Cap
ture
Man
agem
ent
Aler
ting
Monitoring & Basic Control
Basic pre-emption of Problems
Tren
ding
An
alys
is
Repo
rting
Optimal usage of available resources
Prediction
Full ControlAd
vice
Pl
anni
ng
Mod
ellin
g
Performance App Pyramid
27
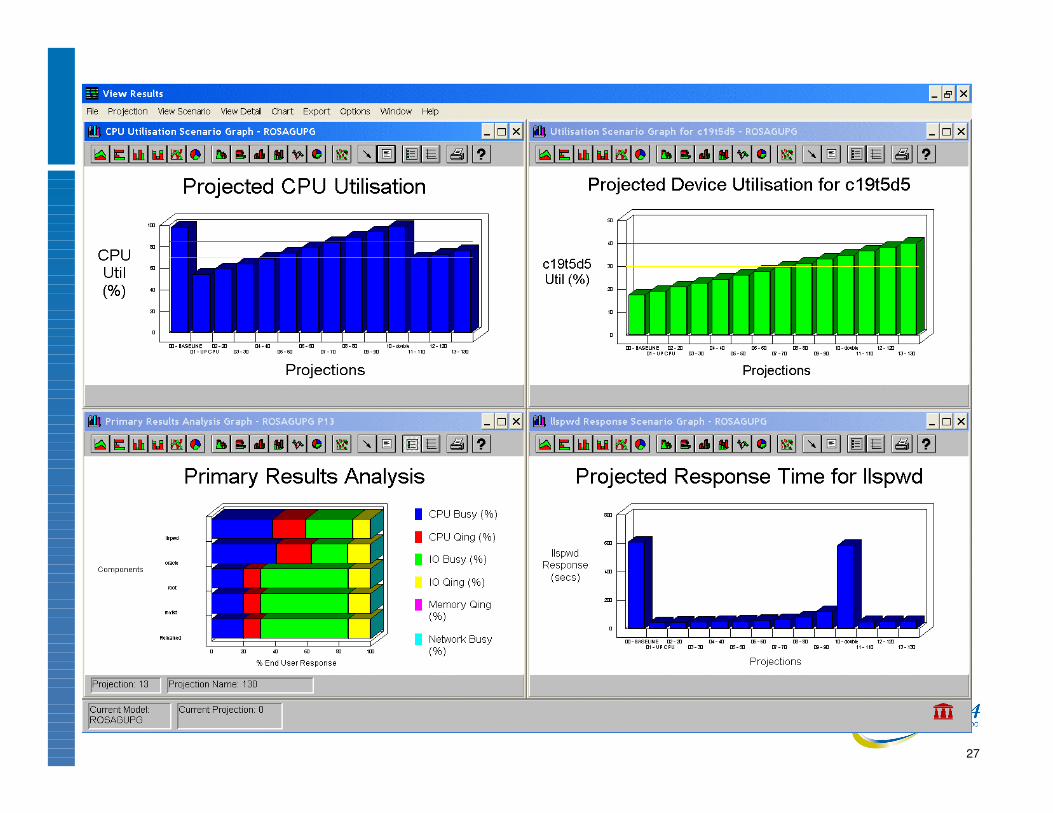
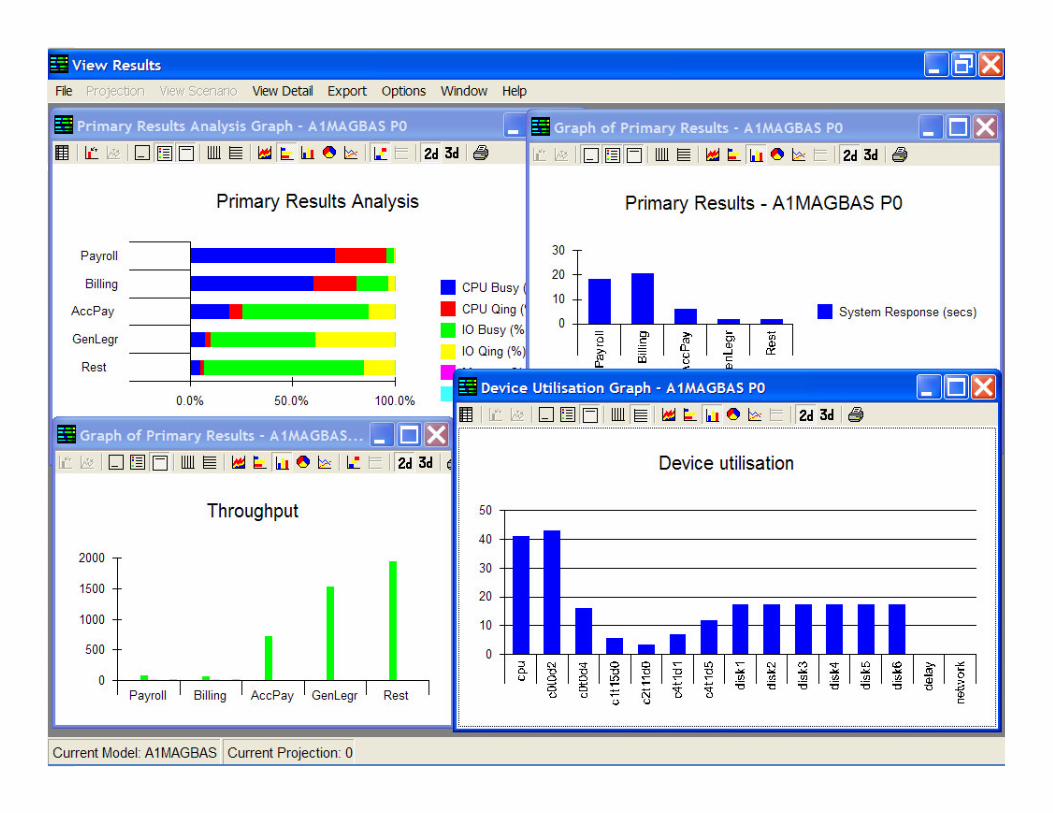
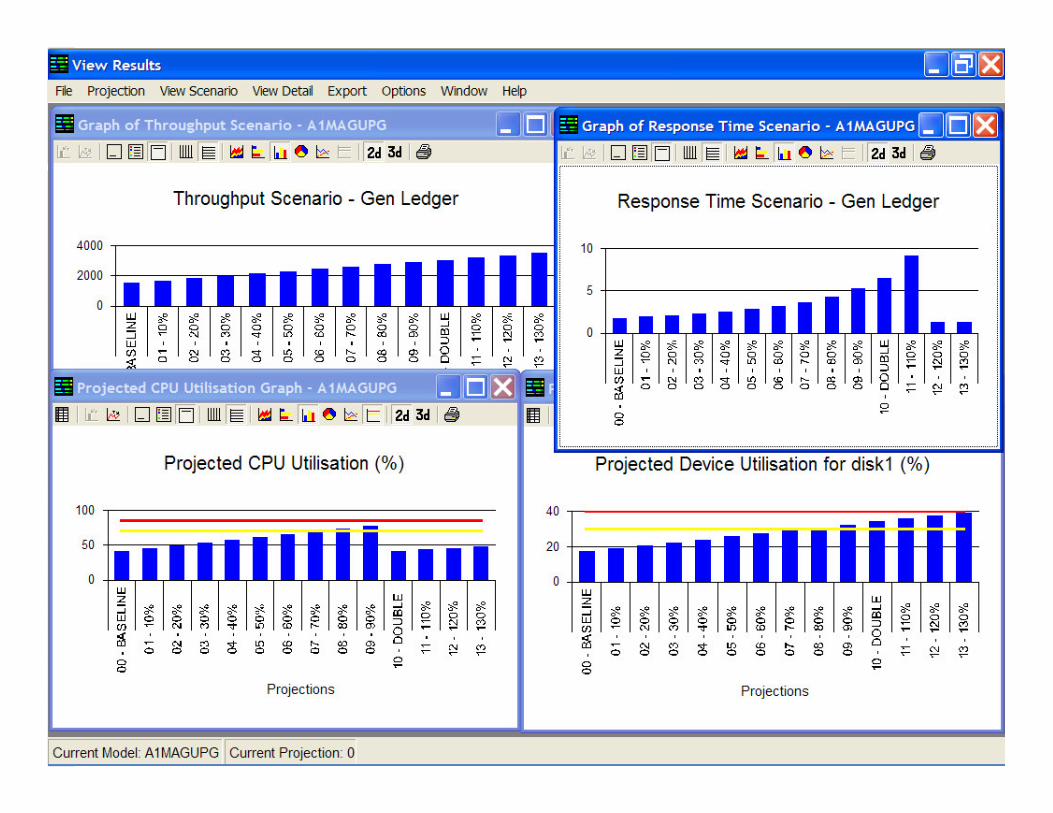
SLAM & models
28
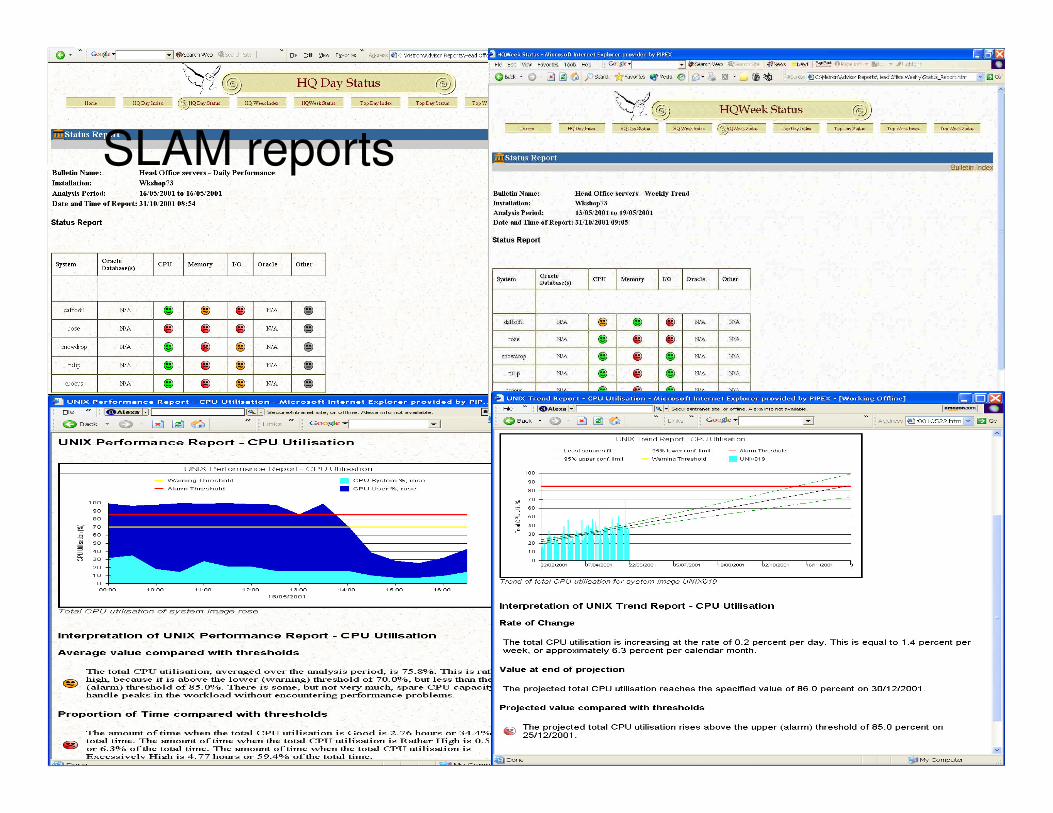
SLAM reports
29
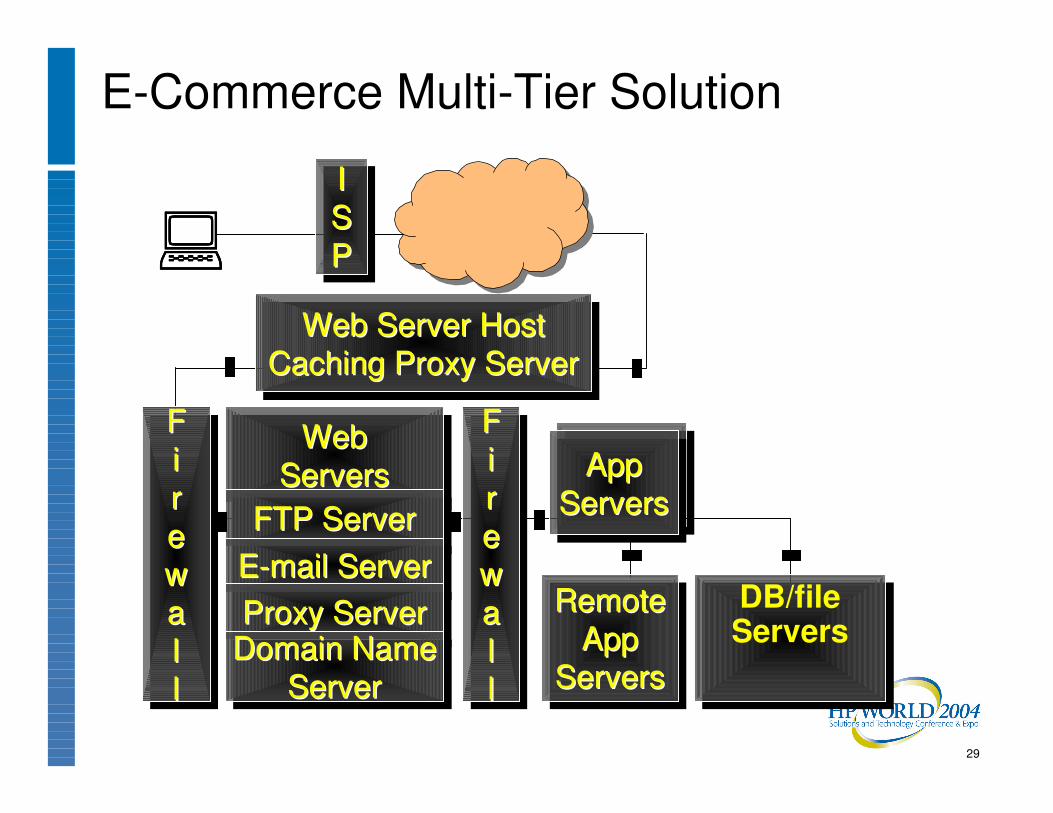
E-Commerce Multi-Tier Solution
����
AppServers
AppAppServersServers
RemoteApp
Servers
RemoteRemoteAppApp
ServersServers
WebServersWebWeb
ServersServers
FTP ServerFTP ServerFTP Server
E-mail ServerEE--mail Servermail Server
Proxy ServerProxy ServerProxy ServerDomain Name
ServerDomain NameDomain Name
ServerServer
Web Server HostCaching Proxy Server
Web Server HostWeb Server HostCaching Proxy ServerCaching Proxy Server
Firewall
FFiirreewwaallll
Firewall
FFiirreewwaallll
ISP
IISSPP
DB/file ServersDB/file Servers
30
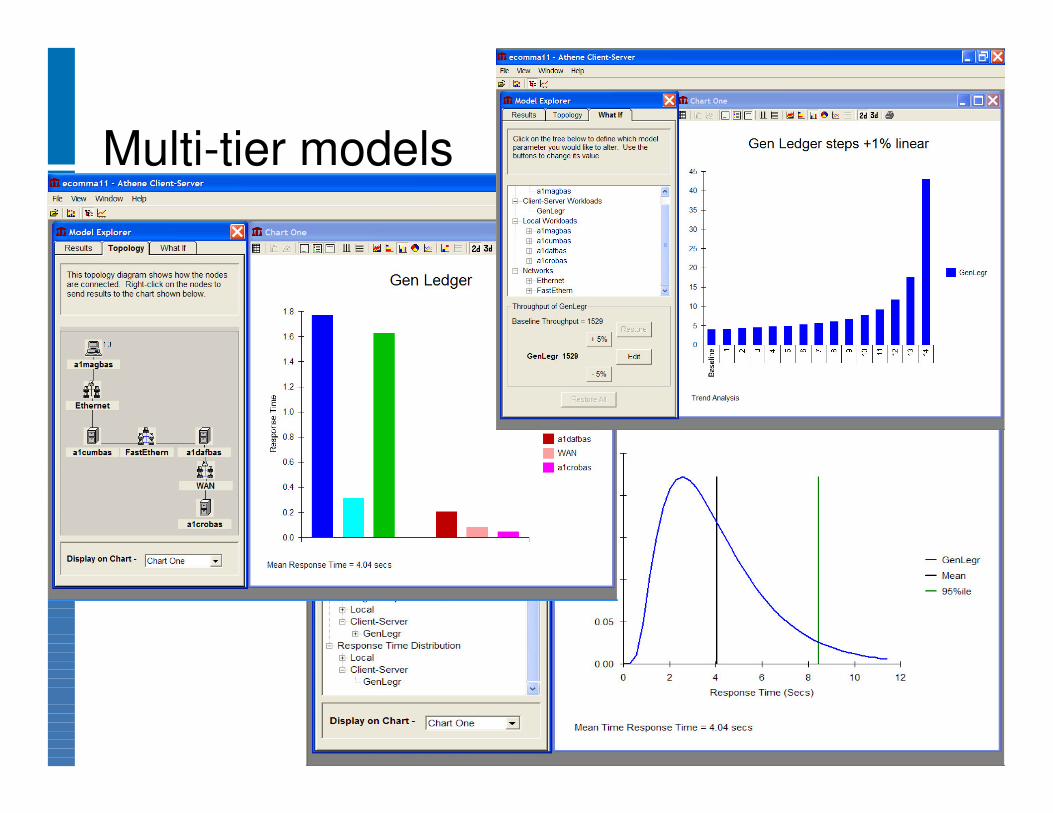
Multi-tier models
31
Baseline snapshot
32
SLAM & models
SLAM DUNK. How to score full points on performance in SLAs.Adam Grummitt – [email protected]
34
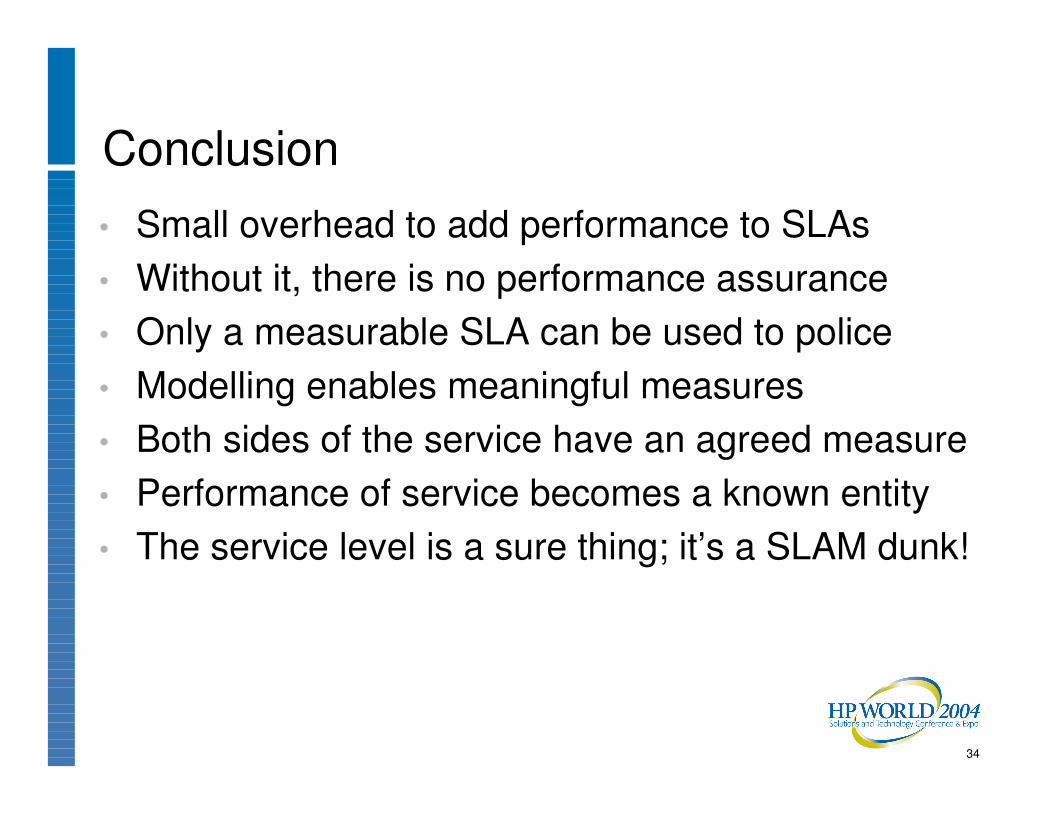
Conclusion• Small overhead to add performance to SLAs• Without it, there is no performance assurance• Only a measurable SLA can be used to police• Modelling enables meaningful measures• Both sides of the service have an agreed measure• Performance of service becomes a known entity• The service level is a sure thing; it’s a SLAM dunk!
Co-produced by:


![PL-SLAM: Real-Time Monocular Visual SLAM with Points and …...textured environments, and also, improves the performance of the original ORB-SLAM [18] in highly textured sequences](https://img.pdfslide.us/doc/110x75/602915a482ec846e031bc9de/pl-slam-real-time-monocular-visual-slam-with-points-and-textured-environments.jpg)