Embed Size (px)
Citation preview
1
SKRIPSI
THE EFFECT OF ROUND ROBIN WRITING STRATEGY ON
STUDENTS’ ACHIEVEMENT IN WRITING DESCRIPTIVE TEXT AT
THE TENTH GRADE OF MAS PAB 2 HELVETIA MEDAN
IN 2016/2017 ACADEMIC YEAR
Submitted to the Faculty of Tarbiyah and Teachers Training, State Islamic
University of North Sumatera Medan as a Partial Fulfillment of the Requirements
for Sarjana Pendidikan
BY:
RIZKI TIA MAUDINA
NIM. 34.13.3.061
Advisor I Advisor II
Dr. Abdillah, M.Pd Maryati Salmiah, S.Pd, M.Hum
NIP. 19680805 199703 1 002 NIP. 19820501 200901 2 012
DEPARTMENT OF ENGLISH EDUCATION
FACULTY OF TARBIYAH SCIENCE AND TEACHERS TRAINING
STATE ISLAMIC UNIVERSITY OF
NORTH SUMATERA
MEDAN
2
2017
ABSTRACT
RIZKI TIA MAUDINA. THE EFFECT OF ROUND ROBIN
WRITING STRATEGY ON STUDENTS’ ACHIEVEMENT IN WRITING
DESCRIPTIVE TEXT AT THE TENTH GRADE OF MAS PAB 2
HELVETIA MEDAN IN 2016/2017 ACADEMIC YEAR.
Skripsi, Medan: Department of English Education, Faculty of Tarbiyah
Science and Teachers Training, State Islamic University of North Sumatera,
Medan 2017.
Keywords: Round Robin Writing Strategy, Students’ Achievement in Writing
Descriptive Text
This research was intended to find out the empirical evidence of the
students’ achievement in writing descriptive text by using Round Robin writing
strategy at the tenth grade of MAS PAB 2 Helvetia Medan. This research was
experimental research. The population of this research was all students of class X
of MAS PAB 2 Helvetia Medan. The samples of this research were taken from 30
students of experimental group (class X-1) and 30 students of control group (class
X-2). The instrument for collecting data was a test. After analyzing the data, the
writer got; (1) The students’ achievement in writing descriptive text by Round
Robin writing strategy got the mean 76.00 and standard deviation was 8.06; (2)
The students’ achievement in writing descriptive text by using conventional
strategy got the mean 62.47 and standard deviation was 7.30. The value of tobserved
was 6.564 and that of ttable was 2.009. So the value of tobserved was higher than that
of ttable. It means that there was significant effect of using Round Robin writing
strategy on students’ achievement in writing descriptive text.
3
ACKNOWLEDGMENT
حيم ن ٱلره حم ٱلره بسم ٱلله
In the name of Allah, the Beneficent, the Merciful. Praise and Gratitude be
to Allah for giving the strength and guidance to the writer, so that this skripsi can
be finished accordingly. Peace and blessing be upon the Prophet Muhammad
Shallallaahu ‘alaihi wa salaam, his family, his relatives, and all his followers.
The writing of this skripsi entitled “The Effect of Round Robin Writing
Strategy on Students’ Achievement in Writing Descriptive Text at the Tenth
Grade of MAS PAB 2 Helvetia Medan in 2016/2017 Academic Year”. This
skripsi is written to fulfill one of the requirements to obtain the Sarjana
Pendidikan degree at the Department of English Education, Faculty of Tarbiyah
and Teachers Training, State Islamic University of North Sumatera.
The writing this skripsi is actually a miracle for me since it was firstly
regarded as a task would be very hard to do. However, it has now been denied
since this skripsi has finally been written. Then, I would like to thank Allah
Subhaanahu Wa Ta’ala for His Blessing given to me so that the writing of this
skripsi has been finished without any meaningful problem. Additionally, the
writer is grateful to the following for their supports and helps.
1. Dr. Amirruddin Siahaan, M.Pd as the Dean of Faculty of Tarbiyah and
Teacher Training State Islamic University of North Sumatera.
2. Dr. Sholihatul Hamidah Daulay, S.Ag, M.Hum the Head of English
Educational Department
3. Dr. Abdillah, M.Pd as my first advisor who has given suggestion, correction,
beneficial opinion and encouragement in process of writing this skripsi.

4
4. Maryati Salmiah S.Pd, M.Hum as my second advisor who has also given
suggestion, correction, beneficial opinion and encouragement in process of
writing this skripsi.
5. All lecturers in the English Department for teaching precious knowledge,
sharing philosophy of life, and giving wonderful study experience.
6. The principal of MAS PAB 2 Helvetia Medan Drs. H. M. Fauzi, MA,,
English teacher Deci, S.Pd and all students of X-1 and X2 class who helped
the writer during the research.
7. My beloved parents Abdul Salam and Iriani. L, S.Pd who always give me
support, advice, motivation, help, goodness, care, and all things that I need to
finish my study.
8. My beloved brother M. Sandi Abdillah ST, Said Ahmad Fauzi and Fahrul
Fahmi SP who have supported me in completing my study at Faculty of
Tarbiyah and Teachers Training, State Islamic University of North Sumatera.
9. All of my family in PBI-5, thank you so much for your support and
motivation.
10. My best friends Rizka Khairini, Shela Rizkina and Agus Surya Sibarani
who always support each other, sharing the information, accompanied me,
entertaining me, and be “crazy” with me until we can finish our final task
together.
11. My best friend since Senior High School, the one and only Novita Sari
Pohan, A.Md who always pray and support me until I can finish my study.
12. All members of BTS who always accompany me with your beautiful voice
towards your gorgeous songs during the process of writing this skripsi.
5
At last, this skripsi is far from being perfect, but it is expected that this skripsi
will be useful not only for the writer, but also the readers. For these reasons,
constructive thoughts, full suggestions, and critics are welcome to make this
skripsi better.
Finally, may Allah Subhaanahu Wa Ta’ala receives all their work and
kindnesses. Aamiin.
Medan, April 2017
The Writer
Rizki Tia Maudina
NIM. 34.13.3.061

6
TABLE OF CONTENTS
ABSTRACT ........................................................................................ i
ACKNOWLEDGMENT ................................................................... ii
TABLE OF CONTENTS ................................................................... v
LIST OF TABLES ............................................................................. viii
LIST OF FIGURE ............................................................................. ix
LIST OF APPENDICES ................................................................... x
CHAPTER I: INTRODUCTION ..................................................... 1
A. Background of Study ............................................................... 1
B. Identification of the Problems ................................................. 2
C. Formulation of the Problem .................................................... 3
D. Objectives of the Study ........................................................... 3
E. Significances of the Study ....................................................... 3
CHAPTER II: THEORETICAL FRAMEWORK ........................ 5
A. Theoretical Framework ........................................................... 5
1. Achievement ........................................................................ 5
2. Writing ................................................................................ 5
3. Writing Achievement .......................................................... 8
4. Writing as Cooperative Activity ......................................... 9
5. Genre of Writing ................................................................. 9
5.1 Descriptive Text ........................................................... 10
7
5.2 Parts of Descriptive Text .............................................. 10
5.3 Example of Descriptive Text ........................................ 11
6. Strategy ................................................................................ 12
7. Round Robin Writing Strategy ............................................ 13
7.1 The Avantages of Round Robin Writing Strategy ....... 14
7.2 The Procedures of Round Robin Writing Strategy ....... 14
8. Assessment in Writing ........................................................ 17
B. Conceptual Framework ........................................................... 18
C. Hypothesis ............................................................................... 19
CHAPTER III: RESEARCH METHODOLOGY .......................... 20
A. Location of Research ............................................................... 20
B. Population and Sample ............................................................ 20
C. The Instrument for Collecting Data ........................................ 21
D. Techniques of Collecting Data ................................................ 21
1. Pre Test ................................................................................ 21
2. Treatment ............................................................................ 22
3. Post Test .............................................................................. 22
E. Scoring the Test ....................................................................... 22
F. The Technique for Analysing Data .......................................... 25
CHAPTER IV: DATA ANALYSIS AND RESEARCH
FINDING ........................................................................................... 26
8
A. Description of Data ................................................................. 26
B. Data Analysis .......................................................................... 29
1. Normality Testing ............................................................... 29
1.1 Normality Testing of Experimental Group ................... 29
1.2 Normality Testing of Control Group ............................ 37
2. Homogeneity Testing .......................................................... 45
2.1 Homogeneity Testing of Pre Test ................................. 45
2.2 Homogeneity Testing of Post Test ............................... 46
3. Hypothesis Testing .............................................................. 47
C. Discussion ............................................................................... 51
CHAPTER V: CONCLUSION AND SUGGESTIONS ................. 53
A. Conclusion .............................................................................. 53
B. Suggestions ............................................................................. 53
REFERENCES ................................................................................... 55
APPENDICES .................................................................................... 57

9
LIST OF TABLES
Table I. The Example of Descriptive Text .......................................... 11
Table II. Samples ................................................................................ 20
Table III. Scoring Scale of Students’ Writing Test .............................. 22
Table IV. The Score of Pre Test and Post Test of Experimental
Group .................................................................................. 26
Table V. The Score of Pre Test and Post Test of Control
Group .................................................................................. 28
Table VI. Frequency Distribution of Pre Test in Experimental
Group .................................................................................. 29
Table VII. Normality Testing of Pre Test in Experimental Group ..... 31
Table VIII. Frequency Distribution of Post Test in Experimental
Group .................................................................................. 33
Table IX. Normality Testing of Post Test in Experimental Group ..... 35
Table X. Frequency Distribution of Pre Test in Control Group ......... 37
Table XI. Normality Testing of Pre Test in Control Group ................ 39
Table XII. Frequency Distribution of Post Test in Control Group ..... 42
Table XIII. Normality Testing of Post Test in Control Group ............ 43
Table XIV. Mean of Post Test – Pre Test in Experimental Group ..... 47
Table XV. Mean of Post Test – Pre Test in Control Group ................ 48

10
LIST OF FIGURE
Figure I. Procedure of Round Robin Writing Strategy ....................... 16
11
LIST OF APPENDICES
Appendix A. Pre Test
Appendix B. Picture for Pre Test
Appendix C. Post Test
Appendix D. Picture for Post Test
Appendix E. Lesson Plan for Experimental Group
Appendix F. Lesson Plan for Control Group
Appendix G. Students’ Name of Experimental Group
Appendix H. Students’ Name of Control Group
Appendix I. The Critical Value Liliefors Test
Appendix J. Table of F Distribution
Appendix K. Percentage Points of T Distribution
Appendix L. Documentation

12
CHAPTER I
INTRODUCTION
A. Background of Study
The language skill is the performance of the speakers of a language in
using their language as a tool of the communication in their daily routines. It is the
ability to use their language according to the set of the conventional rules they
share among themselves. It refers to the correct use of the rules of their language.
People having a good language skill are those who can apply the rules of their
language in transferring information in their communication effectively.1 There
are four language skills: speaking, writing, listening and reading.
Writing is one of the language skills, which is the written productive
language skill. It is the skill of a writer to communicate information to a reader or
group of readers.2 As one of the language skill, writing can not be ignored from its
role to improve students’ knowledge. Writing skill needs to be mastered by the
learners, because learning how to write in English is important. In last few years,
the schools have been emphasizing the importance of knowing how to write. In
many countries, education systems emphasize writing for taking tests. For many
students, the only reason to practice writing is to pass examinations or to get a
good grade in the class. This is not likely to make students interested in writing.
Writing is a progressive activity. This means that when students write
something down, they have already been thinking about what they are going to
1 Sanggam Siahaan, (2008), The English Paragraph, Yogyakarta: Graha Ilmu, p. 1. 2 Ibid, p. 2.
13
say and how they are going to say it.3 But in fact, one of major difficulties in
writing is to find something to write about. In English classes, students frequently
complain that finding something to write about is more difficult than writing.
They do not have any idea of what to write. The students also can not choose the
right words, and they do not know how to start their writing.
One factor causes the problem is the strategy applied by the English
teachers. They do not have sufficient and suitable teaching techniques, and also
lack of appropriate materials in their classes. Besides, many teachers still use the
traditional teacher-centered method in writing classes, which makes classes boring
and ineffective.
To solve the problem, English teachers would do well to provide students
with as many acceptable suggestions as they can. Teachers also must find an
effective strategy in teaching writing skill, especially in teaching descriptive
witing – and Round Robin Writing is the answer.
Based on the above problems the researcher intends to conduct research on
“The Effect of Round Robin Writing Strategy on Students’ Achievement in
Writing Descriptive Text at The Tenth Grade of MAS PAB 2 Helvetia
Medan”.
B. Identification of Problems
In relation to the background, the problem of this research will be
identified as the following:
3 Alice Oshima and Ann Hogue, (1997), Introduction to Academic Writing 2nd ed, New
York: Addison Wesley Longman, p. 2.

14
1. The students have difficulties in writing, especially in writing descriptive
text.
2. The teachers do not have sufficient and suitable taching strategies in
writing classes.
C. Formulation of Problem
In the relation to the background of the study, the research addresses the
problem as the following:
“Is there any significant effect of Round Robin Writing strategy on students’
achievement in writing descriptive text?
D. Objectives of Study
Applying Round Robin Writing strategy as one of the writing strategy in
teaching is expected to help the students in writing competence and to encourage
their motivation, so they are interested in learning, and challenged to learn. Based
on the question in the formulation of problem above, the objective of this study is
to investigate the significant effect of Round Robin Writing strategy on students’
achievement in writing descriptive text.
E. Significances of Study
The result of the study is expected to be useful theoretically and
practically.
15
Theoretically, the result of the study is expected to be useful for the
readers, to enrich their horizon in theory of English learning. The result of the
study is also expected to be useful for the researcher for their future study.
Practically, the result of the study is expected to be useful for:
1. English teachers, as an alternative teaching resource to give them more
information about another strategy which can be applied in teaching
writing in order to improve their competence in teaching English,
especially descriptive writing.
2. Students, to enable them to improve their descriptive writing achievement.
3. Researcher, be useful as a reference in the learning process in the future.
4. Other researchers, also be useful as a reference in the learning process in
their future.
16
CHAPTER II
THEORETICAL FRAMEWORK
A. Theoretical Framework
In conducting a research, theories are needed to explain some concert in
the research concern. The concept which is used must be clarified in order to have
the same perspective of implementation in the field and avoid misunderstanding.
In this chapter, the theoretical framework is presented in order to give clear
concepts and much better understanding so that the readers will get the point
clearly.
1. Achievement
Achievement is a thing done successfully especially with afford and skill.
An achievement is related directly to classroom lessons, units, or even a total
curriculum.4 Based on Taxonomy Bloom, there are three aspects of learning
achievement such as affective, cognitive, and psychomotoric. From these three
aspects, the students’ achievement is concerned with what someone has actually
learnt from the learning process. To get maximal achievement is not easy. It
depends in how students gave their effort to get the knowledge from their
environment.
2. Writing
The terms of writing have several meanings. Many experts have proposed
the definitions of writing. According to Brown, writing is, in fact, a transaction
4 H. Douglas Brown, (2004), Language Assessment: Principles and Classroom Practices,
New York: Addison Wesley Longman, p. 47.
17
with words whereby you free yourself from what you presently think, fell and
preceive.5 Writing is the expression of language in the form of letters, symbols, or
words, and the primary purpose of writing is communication.6 Sanggam states
that writing is the written productive language skill, and it is the skill of a writer to
communicate information to a reader or group of readers.7
Writing can be defined as an activity of delivering messages
(communication) with the use of written language as a means or media, or in other
words writing is communication activities such as delivering a message in writing
to the other people.8
Harmer stated that writing as one of the four skills has always formed part
of the syllabus in the teaching of English. However, it can be used for a variety of
purposes ranging from being merely a backup for grammar teaching to a major
syllabus stand in its own right where mastering the ability to write effectively is
seen as a key objective for learners.9
Oshima and Hogue stated that writing is never one-step action – it is a
process that has several steps.10 This statement is supported by Gibbons who
stated that writing is a recursive process – that writers continually revise and edit
at all stages of the writing process, from first draft to final product.11 The writing
process is extended to provide a step-by-step model for writing so that the
finished piece is the best it can be.
5 H. Douglas Brown, (2000), Teaching by Principles: An Interactive Approach to
Language Pedagogy (Second Edition), New York: Addison Wesley Longman, p. 337. 6 Utami Dewi, (2011), How to Write, Medan: La-Tansa Press, p. 2. 7 Sanggam Siahaan, Op. Cit, p. 2. 8 Suparno and Mohamad Yunus, (2002), Keterampilan Dasar Menulis, Jakarta:
Universitas Terbuka, p. 3. 9 Jeremy Harmer, (2004), How to Teach Writing, England: Longman, p. 31. 10 Alice Oshima and Ann Hogue, Op. Cit, p. 2. 11 Pauline Gibbons, (2005), Writing in a Second Language Across the Curriculum, New
York: Pearson Education, p. 276.
18
Macdonald stated in Fera Mursidah and Entis journal that writing as the
mainpart of education. Writing is a vital part of education, because writing is
basic of thinking and education. Writing forces to think, explore ideas, find out an
argument and evaluate product.12
From the statements above, it can be assumed that writing has a main role
in education. It presents how the brain works by using the students’ mind to think.
Education needs thought to deliver information such as ideas, opinion and spread
their creativity. Both of the functions are able to be evaluated by writing a letter,
essay, poem as the product.
When writing, students work through the stages of the writing process.
The creation of writing occurs in basically five stages: prewriting, drafting,
revising, editing, and publishing.13
1) Prewriting
Prewriting is anything students do before they write a draft of their
document. It includes thinking, taking notes, talking to others,
brainstorming, outlining, and gathering information.
2) Drafting
Drafting occurs when students put their ideas into sentences and
paragraphs. Here students concentrate upon explaining and supporting
their ideas fully. Here students also begin to connect their ideas. In this
stage, students do not pay attention to such things as spelling at this stage.
12 Fera Mursidah, (2011), Improving Students Writing Ability to Write Narrative Text
through Write Pair Share, Education Journal: Vol 2, p. 23. 13 Utami Dewi, Op. Cit, p. 8.

19
3) Revising
Revision is the key to effective documents. Here students think more
deeply about their readers’ needs and expectations. The document
becomes reader-centered.
4) Editing
In this stage, students should check for such things as grammar,
mechanics, and spelling. They also should check the facts – if their writing
includes details, be sure they have included the information correctly.
5) Publishing
The final step of the writing process is publishing. Students need to
produce a final copy of their work, in the correct format. This often means
adding a bibliography, ensuring that citations are correct, and adding
details such as the students reference number.
It is important for students to learn the writing process, because the writing
process is a tool used to enable students to efficiently express their feelings,
thoughts, and knowledge. The more students learn how to use this process
efficiently, the more they can express themselves efficiently.
3. Writing Achievement
An achievement is related directly to classroom lessons, units, or even a
total curriculum,14 especially in writing skill. Writing achievement can also serve
the diagnostic role of indicating what a student needs to continue to work on
14 H. Douglas Brown, Op. Cit.
20
writing in the future, but the primary role of writing achievement is to determine
whether the writing skill objectives have been met—and appropriate knowldege
and skills acquired—by the end of a period of instruction.
4. Writing as Cooperative Activity
Many researchers recommend the inclusion of cooperative learning
because by using cooperative learning in process writing, students not only gain
the academic benefits but also social benefits. Teachers and students can apply
cooperative learning approach in teaching and learning writing.
Cooperative learning in writing brings a positive affect to students,
because writing in groups can be greatly motivating for students.15 By applying
this approach, students are asked to work in groups in order to create a written text
collaboratively.
Collaborative writing involves developing instructional arrangements
whereby students are encouraged to brainstorm ideas in groups, work together to
plan, draft, revise, and edit their compositions. It shows a strong impact on
improving the quality of students’ writing.
5. Genre of Writing
Genre is a kind of text or writing work itself. It views that the language
(writing form) must be related to social function. Social function of the text then
implies a certain social environment and place where and when the text is used.16
15 Jeremy Harmer, (2001), The Practice of English Language Teaching (Third Edition),
UK: Longman, p. 260. 16 Dirgeyasa, (2014), College Academic Writing: A Genre-Based Perspective, Medan:
Unimed Press, p. xvii.

21
There are various genres of text: Narrative, Descriptive, Procedure,
Recount, Explanation, Analytical Exposition, Hortatory Exposition, Report,
Anecdote, Spoof, Review, and News.
From the variety of genres above, the writer choose the genre of
descriptive to be applied in writing.
5.1 Descriptive Text
Description or descriptive etymologically is derived from the word
‘describe’. Describe means to draw, to illustrate or to picture object, place, person
in order to have visual appearance of the object described. However, descriptive
text can also describe idea or point of view in order to have visual appearance of
it.17
In composition, a description is also considered as text. It is a text in which
a writer tries to picture out an object to the readers. The object can be anything. It
can be a concrete object such as a person, or an animal, or a plant, or a car, and
etc.18
In other words, descriptive text is a piece of writing which visualize and
performs the appearance of thing by describing the details of subject.
5.2 Parts of Descriptive Text
In descriptive text writing, there are several things that should be
understood as a following:
1) Social Function
17 Ibid, p. 3. 18 Sanggam Siahaan, Op. Cit, p. 119.
22
The social function of descriptive text is to describe a particular person,
place, thing, or animal.
2) Generic Structure
The generic structure of descriptive text is:
- Identification, which identifies phenomenon that will be describe.
- Description, which describe about parts, qualities, or characteristic of
something or someone in detail.19
3) Grammatical Features
There are several grammatical features of descriptive text as a following:
- In descriptive text, the present tense is predominantly used. The past
tense is used to describe something in the past.
- The used of action verbs are needed in describing especially for
describing behaviors.
- When describing feelings, mental verb are used. Adjective, adverb,
and adverbial phrase are used most often.20
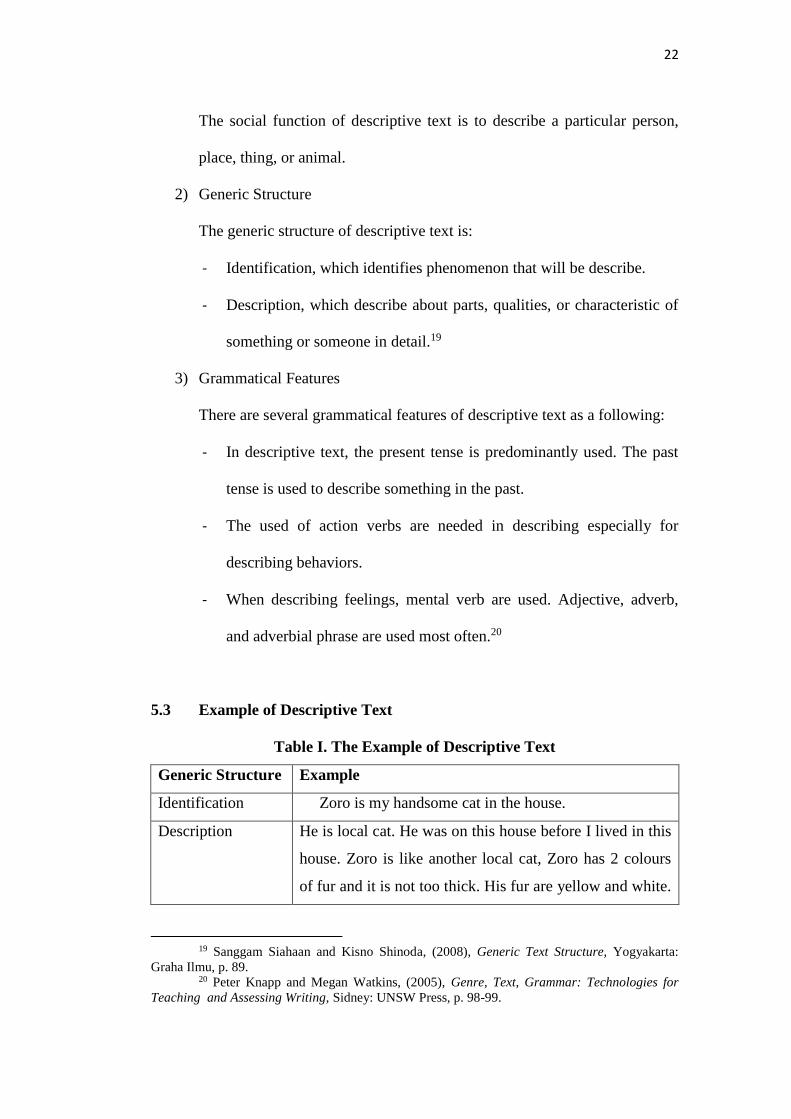
5.3 Example of Descriptive Text
Table I. The Example of Descriptive Text
Generic Structure Example
Identification Zoro is my handsome cat in the house.
Description He is local cat. He was on this house before I lived in this
house. Zoro is like another local cat, Zoro has 2 colours
of fur and it is not too thick. His fur are yellow and white.
19 Sanggam Siahaan and Kisno Shinoda, (2008), Generic Text Structure, Yogyakarta:
Graha Ilmu, p. 89. 20 Peter Knapp and Megan Watkins, (2005), Genre, Text, Grammar: Technologies for
Teaching and Assessing Writing, Sidney: UNSW Press, p. 98-99.

23
Look from the size of his body, Zoro is 2 years old.
Zoro’s body is long enough. The lenght of his body is
about 27cm. Because of this, He looks more handsome I
think. Moreover, he is very active during playing with my
brother. He plays with my brother almost everyday. But,
he likes to sleep in my bed. I always feel that is not good
for me or my brother.
Everyday, I always feed zoro during breakfast, lunch,
and dinner. I buy food for cat and not forget to give him a
milk. When I feed him, I feel so happy and I think zoro
feels same because he always mew loudly. I really like
zoro. He is my handsome pet. He also has become best
friend for my brother and me.
6. Strategy
According to Kozna, learning strategy can be defined as the activity that is
chosen to provide facilities or assistance to students towards achieving specific
learning objectives.21 J. R. David states that learning strategy is a plan, method, or
series of activities designed to achieve a particular education goal.22
Strategy is a way to do something be successful. Strategy in teaching
should be easy and enjoyable, so that the goals in learning can be achieved.
Allah said in the Holy Qur’an in surah An-Nahl in the 125th verse. It says:
21 Hamzah B. Uno, (2007), Model Pembelajaran: Menciptakan Proses Belajar Mengajar
yang Kreatif dan Efektif, Jakarta: Bumi Aksara, p. 1. 22 Nunuk Suryani and Leo Agung, (2012), Strategi Belajar Mengajar, Yogyakarta:
Penerbit Ombak, p. 2.

24
Meaning: “Invite to the way of your Lord with wisdom and good
instruction, and argue with them in a way that is best. Indeed, your Lord is most
knowing of who has strayed from His way, and He is most knowing of who is
[rightly] guided.”23 (Q.S. An-Nahl: 125)
From the verse above, Allah asked the human to give the lesson by
wisdom, wisdom means the way by the right strategy. It can help the teacher to
make teaching learning process run well.
There are varieties of strategy that can be used to support cooperative
learning in the classroom. Such strategies include Jigsaw in reading skill, Think-
Pair-Share to develop speaking skill and Round Robin writing for writing skill.
7. Round Robin Writing Strategy
Round Robin writing is used to create a text written by more than one
participant.24 Round Robin is one of the most effective strategies for cooperative
learning. It is a valuable strategy at the start of any unit since it allows the teacher
to discover the general level of knowldege of the class and can also be used for
revision purposes, as well as being used for specific purposes.25 Round Robin is
like discussion, which can be used for brainstorming, reviewing, practicing, and
serving as a team builder.
Round Robin is primarily a brainstorming strategy in which students
generate ideas but do not elaborate, explain, evaluate, or question the ideas. Group
23 http://makalahpendidikanislamlengkap.blogspot.co.id/2016/12/ayat-ayat-al-quran-
tentang-metode.html 24 http://fanlore.org/wiki/Round_Robin 25 Eric Frangenheim, (2005), Reflections on Classroom Thinking Strategies: Practical
Strategies to Encourage Thinking in Your Classroom (Sixth Edition), London: Paul Chapman
Publishing, p. 82.
25
members take turns responding to a question with a word, phrase or short
statement.26
7.1 The Advantages of Round Robin Writing Strategy
There are some advantages of Round Robin writing strategy:
1) It encourages opportunities for both social and academic language
development of students.
2) Each student gets to display their individual thinking and receive
assistance as needed from their peers.27
3) It encourages contributions from all participants.
4) To practice writing descriptives and build relationships between
participants.
7.2 The Procedures of Round Robin Writing Strategy
The stages of Round Robin writing are as follows:
Stage one: Getting started
1) The participants are divided into group of no more than five people and no
less than two.
2) Each group has a pen. The groups should have only a piece of paper for
the entire group.
3) Each group is provided with a topic.
4) One person in the group starts writing. That person writes sentences or
phrases then passes the paper to the next person who writes a sentence
26 Elizabert E. Barkley, K. Patricia Cross, Claire Howell Major, (2012), Collaborative
Learning Techniques (Terjemahan), Bandung: Nusa Media, p. 162. 27 https://fall13azusa.wikispaces.com/file/view/What+is+Round+Robin.pdf

26
with the pen, and then passes it on. The group continues to take turn
writing sentences until time is called.
5) After time is called, each group takes editing their text and collect paper to
the teacher.
Stage two: Refining the descriptive (do not rush into stage two. Have the
groups do a few Round Robin sessions over a couple of weeks before introducing
stage two).
1) Teacher talks to participants what makes a good descriptive (the generic
structure: identification which identifies phenomenon that will be describe
and description which describes about parts, qualities, or characteristic of
something or someone in detail.
2) Teacher encourages the participants to be conscious of the elements of a
good descriptive as they write their next sentences. They might want to
discusss their identification of phenomenon and describe about parts,
qualities, or characteristic of something or someone in detail.
3) Students are to follow the same process as stage one (the procedure are
explained below):
a) The first student should begin the text writing about the identification
of phenomenon.
b) The text is then passed to the second student who reads what has been
written and then continues the text by writing about the description
about parts, qualities, or characteristic of something or someone in
detail.

27
c) The text is now passed to the third students who read what has been
written thus far and then continnues the text by writing about the
description to complete the information.
d) Students continue passing the text around and writing a successive
sequence.
e) The group can read the text and edit their text.
Paper
Student
Figure I.
Procedure of Round Robin Writing Strategy28
Before beginning the writing activity, teacher may share an example of
descriptive text. If teacher finds that the groups are becoming discouraged or
“thinking” too hard about what they are writing, teacher should encourages them
to just let go of any of the pre-plans they have made before writing, and just get
the ideas down. After finishing the writing activity, students revise and edit their
text collaboratively.
During the Round Robin writing activity, students in each group might
work on a single descriptive text. If that is the case, be sure the other students in
28 Eric Frangenheim, Op. Cit, p. 82.
28
the group have an assignment to work on as the text is making its way among the
group members. The procedures are as follows:
1) All students in group write an identification of something or someone.
2) When the timer goes off, all students pass their papers to the right. In that
way, each student has experience of writing an characteristics. At the end
of the period, each student can take back the text she or he started and edit
that text for publication or sharing.
3) Close the lesson by reviewing what students learned about writing a
descriptive text, what elements make a good descriptive text, which part of
the text seemed easiest and most difficult to write, and so on.
8. Assessment in Writing
Assessment is an ongoing process that encompasses a much wider
domain.29 From the ongoing assessment teachers carry out to find out what their
students are able to do. If only teacher knows students’ current abilities can
subsquent teaching be truly responsive and only then teacher can plan to take
students further.
There are two different approaches for assessing writing ability that can be
adopted, first is writing can be devided into discrete levels e.g grammar,
vocabulary, spelling and punctuation, and these can be tested separately by the use
of objective tests. The second is more direct extent of various types could be
constructed. These would have greater construct, content, but would require a
more subjective assessment.
29 H. Douglas Brown, (2004), Op. Cit,, p. 4.
29
The assessment on writing achievement, in order to determine how good
the writing process of the student is, and to measure the extent of students’
writing. The teacher as an evaluator should has a right concept of writing
assessment to assess the writing work appropriately. In this study, the researcher
used test and rubric as instrument. There are three indicators to consider in writing
test: Organization, Language use and Mechanics.
Organization is ability to create a descriptive text based on its generic
structure (identification and description). Language use is the ability to write the
text by using the language features of descriptive (the grammar, action verbs,
mental verbs, adjectives, and adverbs). Mechanics is the ability to use correctly
the preposition, articles, punctuation, capitalization and spelling.
B. Conceptual Framework
Writing as one of the four language skills that should be acquired by the
students, has always formed part of the syllabus in the teaching of English.30 It is
considered that writing in groups, whether as part of a short game like
communicative activity, can be greatly motivating students, including as it does,
not only writing, but also research, discussion, peer evaluation, and group pride in
a group accomplishment.
As writing is a part of the English teaching syllabus, it is important to find
an effective strategy in order to let students get better achievement in writing. And
Round Robin writing is one of the best strategies which can be applied in the
classroom. It is kind of collaborative learning strategies which is especially
30 Jeremy Harmer, (2004), Op. Cit, p.31.
30
effective for generating many ideas because it requires all students to participate.
“Round Robin also ensures equal participation among group members. The ideas
that students generate can be compiled in a list that serves as the basis for a next-
step assignment.”
This strategy provides opportunities to students to work in groups for
generating ideas, organize the materials, to support group cooperation and
interaction among students. Being active larners is essential for students when
they work in group more than work individually. Because of that Round Robin
writing strategy is hope will help the students’ achievement in writing
ddescriptive text.
Round Robin writing is a strategy in which students to write a descriptive
text cooperatively. As one of Round Robin writing’s advantages is to practice
writing descriptives and build relationships between participants, it is the best
strategy in which students acquire the knowledge as well as create interpersonal
and team skills.
C. Hypothesis
The research hypothesis is formulated as follows:
Ha = “There is a significant effect of Round Robin writing strategy on the
students’ achievement in writing descriptive text.”
H0 = “There is no significant effect of Round Robin writing strategy on the
students’ achievement in writing descriptive text.”

31
CHAPTER III
RESEARCH METHODOLOGY
A. Location of Research
This research was conducted at the tenth grade of MAS PAB 2 Helvetia
Medan in the academic year 2016/2017. It is located on Jalan Veteran Pasar 4
Helvetia Medan. The reason to choose this school is based on the researcher’s
experience during doing teaching at that school, researcher found the students
have difficulties in writing, especially in writing descriptive text.
B. Population and Sample
The population of this research was the tenth grade students of MAS PAB
2 Helvetia Medan. Because in that school, many students got difficulties in
writing text especially descriptive text. There were two classes of the tenth grade
students. It was class X-1 and X-2. Each class consists of 30 students, so the total
numbers of students were 60 students. The sample was class X-1 and X-2. Class
X-1 was decided as experimental group and class X-2 as control group. There
were 60 students as the sample, 30 students for each experimental group and
control group. The sample of this research also can be seen as follow:
Table II. Samples
Group Strategies Samples
Class Students
Experimental Round Robin X-1 30 students
Control Conventional X-2 30 students
Total 60 students

32
C. The Instrument for Collecting Data
For collecting the data, a writing test was used as the instrument. The test
was administered to the students in both experimental and control group. They
were pre-test and post-test. The design of the test was in essay form. The students
were instructed to write a descriptive text based on the topic given by the
researcher. The tests were given to both groups; experimental and control group.
The students’ achievement in learning descriptive text was analyzed by the
collecting data in the test.
D. Techniques of Collecting Data
Techniques of collecting data are the techniques or methods that can be
used by researchers for collecting data. Techniques for appointing an abstract
word and not embodied in objects, but their use can only be seen through:
questionnaires, interviews, observations, test, documentation, and others.
Researchers can use one or a combination of these techniques depends on the
problems encountered or studied.31 In this researh, it used pre-test, treatment, and
post-test.
1. Pre-Test
The pre-test was administered before treatment. The same pre-test was
given to both experimental and control group in order to investigate the students’
writing ability. Both experimental and control group were asked to write a
descriptive text based on the topic given.
31 https://rachmatul4212.wordpress.com/2013/01/28/teknik-pengumpulan-data-dalam-
penelitian-kuantitatif-dan-kualitatif/
33
2. Treatment
The treatment was conducted after pre-test. In the experimental group, the
students were taught by applying Round Robin Writing Strategy while control
group, the students were taught by using conventional method. Both experimental
and control group were taught with the same material.
3. Post-Test
Post-test was given after the treatment has been completed. It was aimed
to get the mean scores of experimental group and control group. It was applied to
know the effect of teaching presentation in both groups.
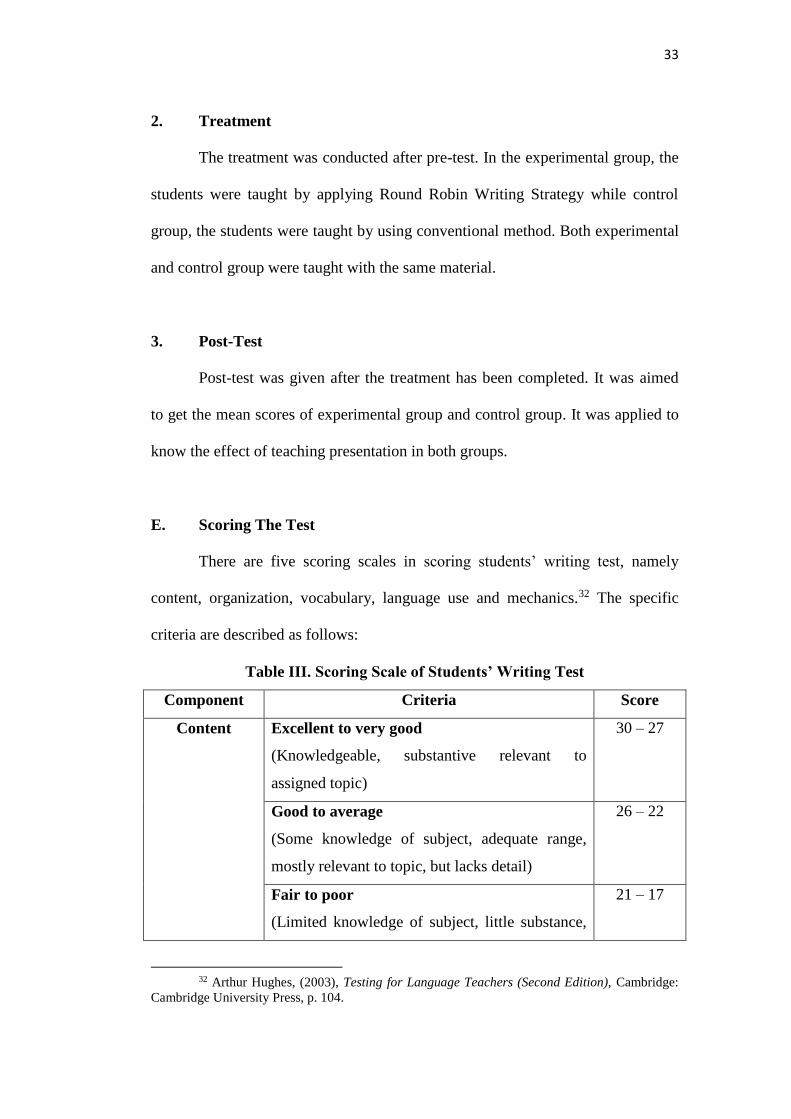
E. Scoring The Test
There are five scoring scales in scoring students’ writing test, namely
content, organization, vocabulary, language use and mechanics.32 The specific
criteria are described as follows:
Table III. Scoring Scale of Students’ Writing Test
Component Criteria Score
Content Excellent to very good
(Knowledgeable, substantive relevant to
assigned topic)
30 – 27
Good to average
(Some knowledge of subject, adequate range,
mostly relevant to topic, but lacks detail)
26 – 22
Fair to poor
(Limited knowledge of subject, little substance,
21 – 17
32 Arthur Hughes, (2003), Testing for Language Teachers (Second Edition), Cambridge:
Cambridge University Press, p. 104.

34
inadequate development of topic)
Very poor
(Does not show knowledge of subject, non-
substantive, not pertinent, or not enough to
evaluate)
16 – 13
Organization Excellent to very good
(Fluent expression, ideas clearly stated/
supported, succinct, well-organized, logical
sequencing, cohesive)
20 – 18
Good to average
(Somewhat choppy, loosely organized but main
ideas stand out, limited support, logical but
incomplete sequencing)
17 – 14
Fair to poor
(Non-fluent, ideas confused or disconnected,
lacks logical sequencing and development)
13 – 10
Very poor
(Does not communicate, no organization, or not
enough to evaluate)
9 – 7
Vocabulary Excellent to very good
(Sophisticated range, effective word/ idiom
choice and usage, word from mastery,
appropriate register)
20 – 18
Good to average
(Adequate range, occasional errors of word/
idiom form, choice, usage but meaning not
obscured)
17 – 14
Fair to poor
(Limited range, frequent errors of word/ idiom
form, choice, usage, meaning confused or
obscured)
13 – 10
Very poor 9 – 7

35
(Essentially translation, little knowledge of
English vocabulary, idioms, word form, or not
enough to evaluate)
Language Use Excellent to very good
(Effective complex constructions, few errors of
agreement, tense, number, word order/ function,
articles, pronouns, prepositions)
25 – 22
Good to average
(Effective but simple constructions, minor
problems in complex constructions, several
errors of agreement, tense, number, word order/
function, articles, pronouns, prepositions but
meaning seldom obscured)
21 – 18
Fair to poor
(Major problems in simple/ complex
constructions, frequent errors of negation,
aggrement, tense, number, word order/ function,
articles, pronouns, prepositions and/ or
fragments, run-ons, deletions, meaning confused
or obscured)
17 – 11
Very poor
(Virtually no mastery of sentence construction
rules, dominated by errors, does not
communicate, or not enough to evaluate)
10 – 5
Mechanics Excellent to very good
(Demonstrates mastery of conventions, few
errors of spelling, punctuation, capitalization,
paragraphing)
5
Good to average
(Occasional errors or spelling, punctuation,
capitalization, paragraphing but meaning not
obscured)
4

36
Fair to poor
(Frequent errors of spelling, punctuation,
capitalization, paragraphing, poor handwriting,
meaning confused or obscured)
3
Very poor
(No mastery of conventions, dominated by errors
of spelling, punctuation, capitalization,
paragraphing, handwriting illegible, or not
enough to evaluate)
2
Total Score 100
F. The Technique for Analysing Data
In order to find the different effect between Experimental and Control
Group, the t-test formula was applied. The formula was stated as the following:
T-test = 𝑥
1 − 𝑥
2
√𝑆
12
𝑛1
+𝑆
22
𝑛2
Where:
T-test = The effect
x1 = Mean of Post-test – Pre-test in experimental group
x2 = Mean of Post-test – Pre-test in control group
S12 = Variant of Pre-test – Post-test in experimental group
S22 = Variant of Pre-test – Post-test in control group
n1 = Sample in experimental group
n2 = Sample in control group
37
CHAPTER IV
DATA ANALYSIS AND RESEARCH FINDINGS
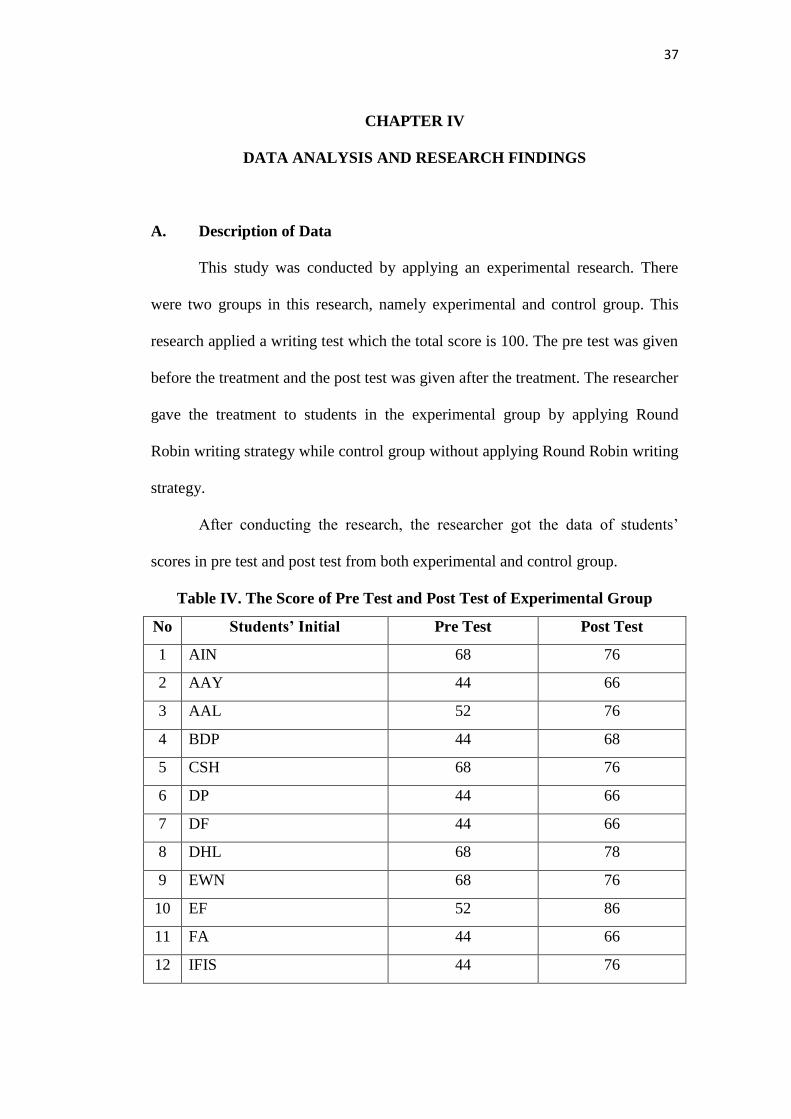
A. Description of Data
This study was conducted by applying an experimental research. There
were two groups in this research, namely experimental and control group. This
research applied a writing test which the total score is 100. The pre test was given
before the treatment and the post test was given after the treatment. The researcher
gave the treatment to students in the experimental group by applying Round
Robin writing strategy while control group without applying Round Robin writing
strategy.
After conducting the research, the researcher got the data of students’
scores in pre test and post test from both experimental and control group.
Table IV. The Score of Pre Test and Post Test of Experimental Group
No Students’ Initial Pre Test Post Test
1 AIN 68 76
2 AAY 44 66
3 AAL 52 76
4 BDP 44 68
5 CSH 68 76
6 DP 44 66
7 DF 44 66
8 DHL 68 78
9 EWN 68 76
10 EF 52 86
11 FA 44 66
12 IFIS 44 76

38
No Students’ Initial Pre Test Post Test
13 KAL 40 68
14 LAN 68 88
15 M 52 78
16 MA 44 66
17 MIN 52 80
18 MRR 44 66
19 MSR 40 66
20 NA 68 76
21 NF 68 86
22 NJP 52 78
23 NAN 56 88
24 PAKS 52 86
25 QA 68 86
26 RP 40 66
27 RL 56 76
28 SS 56 76
29 SRAL 52 86
30 S 52 88
Total ∑ = 1600 ∑ = 2280
Mean 53.33 76.00
Based on the table above, the student’s achievement in writing
descriptive text in experimental group showed the lowest score of pre-test was 40,
and the highest score of pre-test was 68 and the mean of pre-test was 53.33. On
the other hand the lowest score of post-test was 66, and the highest score of post-
test was 88 and the mean of post-test was 76.00.
39
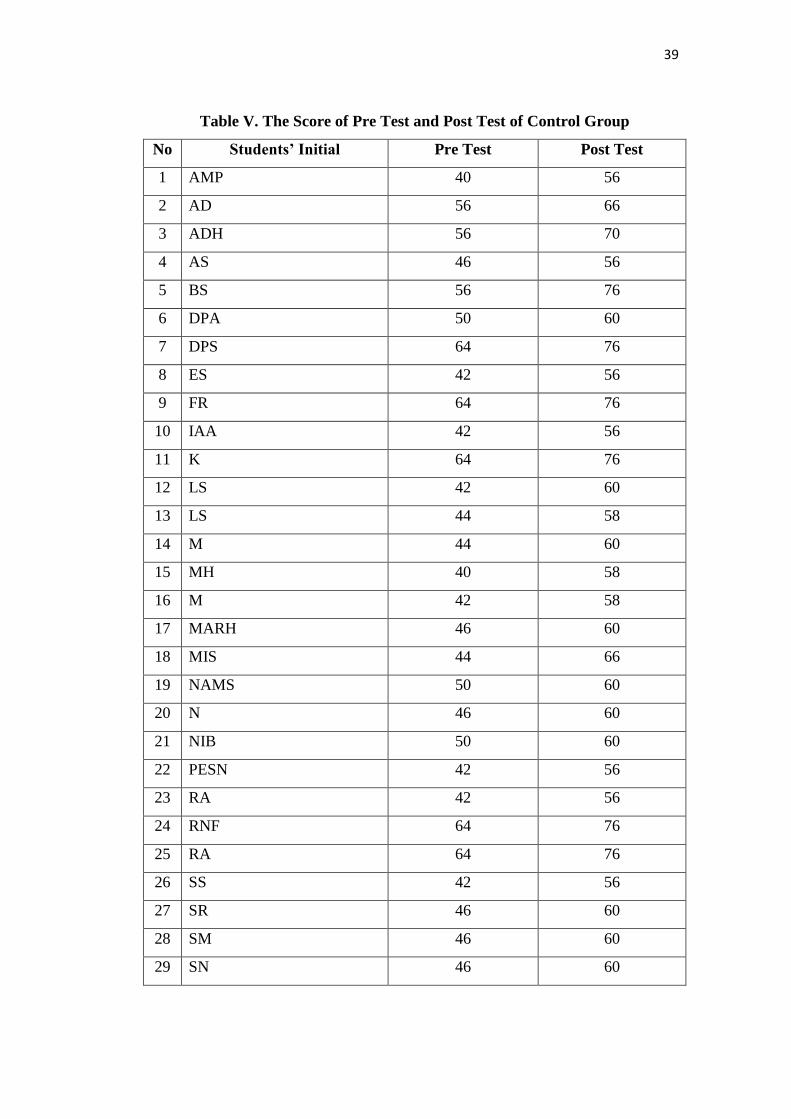
Table V. The Score of Pre Test and Post Test of Control Group
No Students’ Initial Pre Test Post Test
1 AMP 40 56
2 AD 56 66
3 ADH 56 70
4 AS 46 56
5 BS 56 76
6 DPA 50 60
7 DPS 64 76
8 ES 42 56
9 FR 64 76
10 IAA 42 56
11 K 64 76
12 LS 42 60
13 LS 44 58
14 M 44 60
15 MH 40 58
16 M 42 58
17 MARH 46 60
18 MIS 44 66
19 NAMS 50 60
20 N 46 60
21 NIB 50 60
22 PESN 42 56
23 RA 42 56
24 RNF 64 76
25 RA 64 76
26 SS 42 56
27 SR 46 60
28 SM 46 60
29 SN 46 60
40
No Students’ Initial Pre Test Post Test
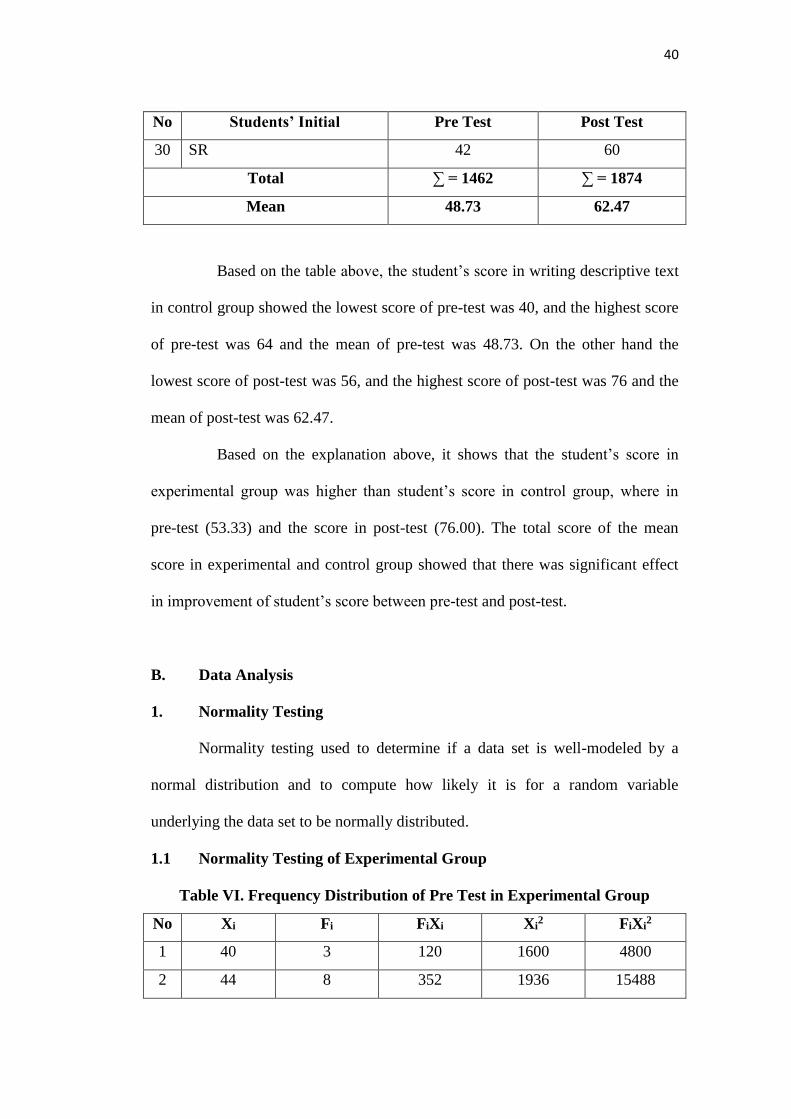
30 SR 42 60
Total ∑ = 1462 ∑ = 1874
Mean 48.73 62.47
Based on the table above, the student’s score in writing descriptive text
in control group showed the lowest score of pre-test was 40, and the highest score
of pre-test was 64 and the mean of pre-test was 48.73. On the other hand the
lowest score of post-test was 56, and the highest score of post-test was 76 and the
mean of post-test was 62.47.
Based on the explanation above, it shows that the student’s score in
experimental group was higher than student’s score in control group, where in
pre-test (53.33) and the score in post-test (76.00). The total score of the mean
score in experimental and control group showed that there was significant effect
in improvement of student’s score between pre-test and post-test.
B. Data Analysis
1. Normality Testing
Normality testing used to determine if a data set is well-modeled by a
normal distribution and to compute how likely it is for a random variable
underlying the data set to be normally distributed.
1.1 Normality Testing of Experimental Group
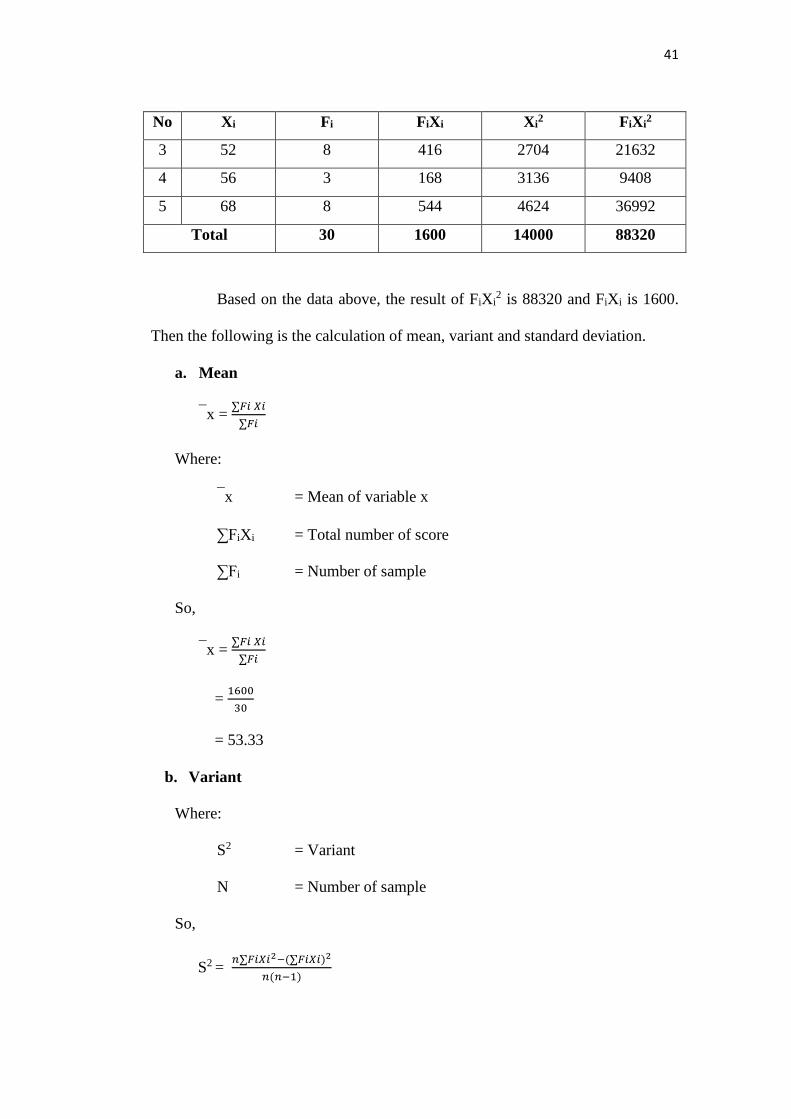
Table VI. Frequency Distribution of Pre Test in Experimental Group
No Xi Fi FiXi Xi2 FiXi
2
1 40 3 120 1600 4800
2 44 8 352 1936 15488
41
No Xi Fi FiXi Xi2 FiXi
2
3 52 8 416 2704 21632
4 56 3 168 3136 9408
5 68 8 544 4624 36992
Total 30 1600 14000 88320
Based on the data above, the result of FiXi2 is 88320 and FiXi is 1600.
Then the following is the calculation of mean, variant and standard deviation.
a. Mean
x = ∑𝐹𝑖 𝑋𝑖
∑𝐹𝑖
Where:
x = Mean of variable x
∑FiXi = Total number of score
∑Fi = Number of sample
So,
x = ∑𝐹𝑖 𝑋𝑖
∑𝐹𝑖
= 1600
30
= 53.33
b. Variant
Where:
S2 = Variant
N = Number of sample
So,
S2 = 𝑛∑𝐹𝑖𝑋𝑖2−(∑𝐹𝑖𝑋𝑖)2
𝑛(𝑛−1)

42
= 30 x 88320 – (1600)2
30(30−1)
= 2649600 – 2560000
30(29)
= 89600
870
= 102.98
c. Standard Deviation
S = √𝑆2
= √102.98
= 10.14
After getting the calculation of mean, variant and deviation
standard, then the next step is to found out the normality of the test. It means that
the test was given to the students is observed by Liliefors test. The calculation of
normality writing descriptive text can be seen in the following table:
Table VII. Normality Testing of Pre Test in Experimental Group
No Score Zi F(Zi) S(Zi) F(Zi) - S(Zi)
1 40 -1.31 0.094 0.10 -0,006
2 40 -1.31 0.094 0.10 -0,006
3 40 -1.31 0.094 0.10 -0,006
4 44 -0.92 0.179 0.36 -0,181
5 44 -0.92 0.179 0.36 -0,181
6 44 -0.92 0.179 0.36 -0,181
7 44 -0.92 0.179 0.36 -0,181
8 44 -0.92 0.179 0.36 -0,181
9 44 -0.92 0.179 0.36 -0,181
10 44 -0.92 0.179 0.36 -0,181
11 44 -0.92 0.179 0.36 -0,181
43
No Score Zi F(Zi) S(Zi) F(Zi) - S(Zi)
12 52 -0.13 0.448 0.63 -0.182
13 52 -0.13 0.448 0.63 -0.182
14 52 -0.13 0.448 0.63 -0.182
15 52 -0.13 0.448 0.63 -0.182
16 52 -0.13 0.448 0.63 -0.182
17 52 -0.13 0.448 0.63 -0.182
18 52 -0.13 0.448 0.63 -0.182
19 52 -0.13 0.448 0.63 -0.182
20 56 0.26 0.604 0.73 -0.126
21 56 0.26 0.604 0.73 -0.126
22 56 0.26 0.604 0.73 -0.126
23 68 1.45 0.926 1.00 -0.074
24 68 1.45 0.926 1.00 -0.074
25 68 1.45 0.926 1.00 -0.074
26 68 1.45 0.926 1.00 -0.074
27 68 1.45 0.926 1.00 -0.074
28 68 1.45 0.926 1.00 -0.074
29 68 1.45 0.926 1.00 -0.074
30 68 1.45 0.926 1.00 -0.074
Total 1600 Lo = -0.006
Mean 53.33 Lt = 0.029
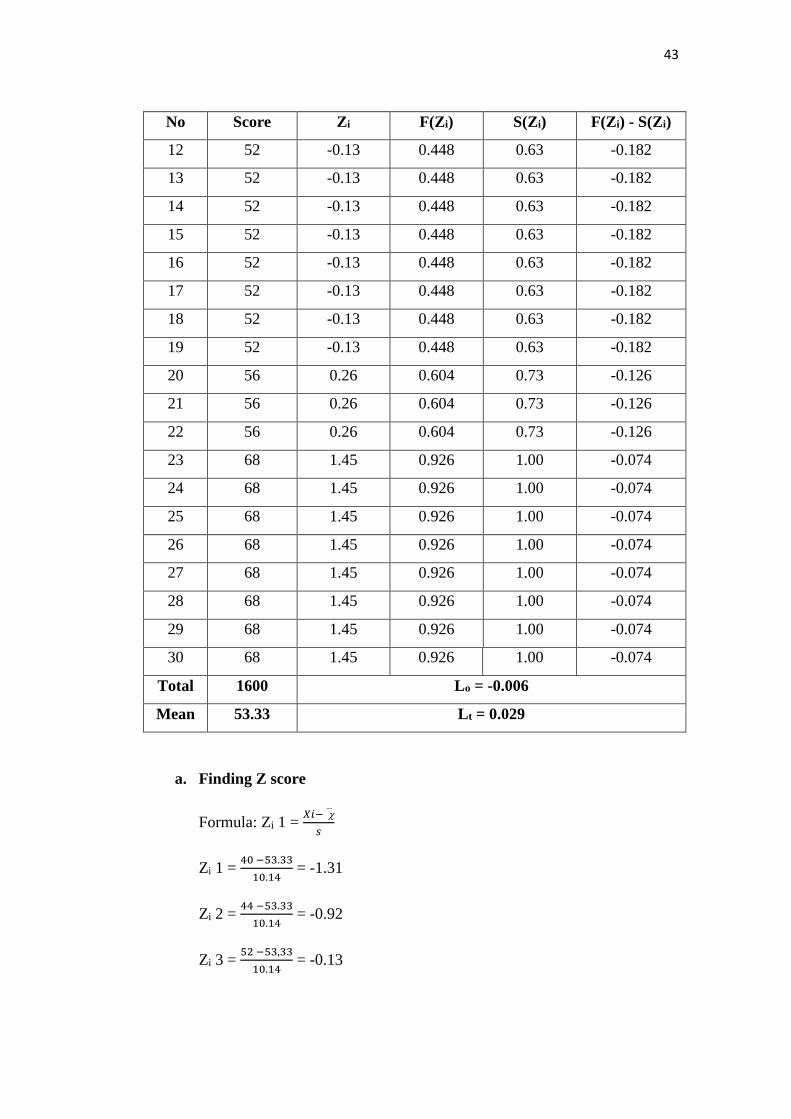
a. Finding Z score
Formula: Zi 1 = 𝑋𝑖−
𝑠
Zi 1 = 40 −53.33
10.14 = -1.31
Zi 2 = 44 −53.33
10.14 = -0.92
Zi 3 = 52 −53,33
10.14 = -0.13
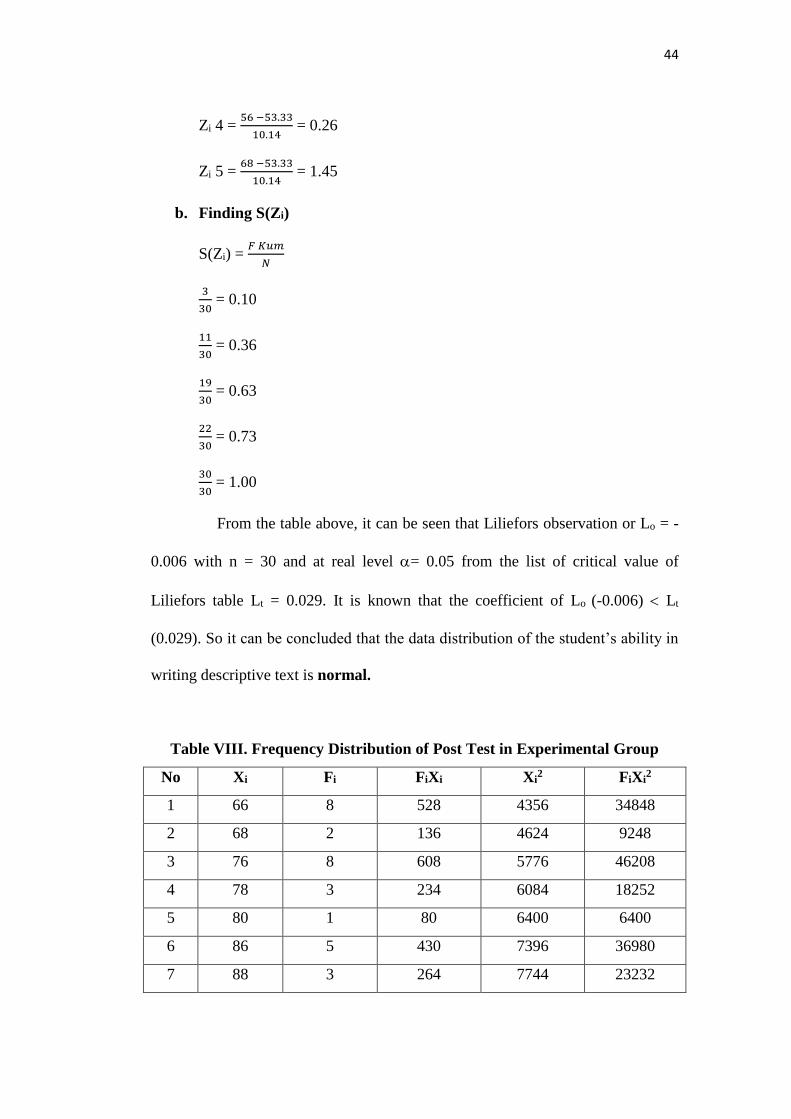
44
Zi 4 = 56 −53.33
10.14 = 0.26
Zi 5 = 68 −53.33
10.14 = 1.45
b. Finding S(Zi)
S(Zi) = 𝐹 𝐾𝑢𝑚
𝑁
3
30 = 0.10
11
30 = 0.36
19
30 = 0.63
22
30 = 0.73
30
30 = 1.00
From the table above, it can be seen that Liliefors observation or Lo = -
0.006 with n = 30 and at real level = 0.05 from the list of critical value of
Liliefors table Lt = 0.029. It is known that the coefficient of Lo (-0.006) Lt
(0.029). So it can be concluded that the data distribution of the student’s ability in
writing descriptive text is normal.
Table VIII. Frequency Distribution of Post Test in Experimental Group
No Xi Fi FiXi Xi2 FiXi
2
1 66 8 528 4356 34848
2 68 2 136 4624 9248
3 76 8 608 5776 46208
4 78 3 234 6084 18252
5 80 1 80 6400 6400
6 86 5 430 7396 36980
7 88 3 264 7744 23232
45
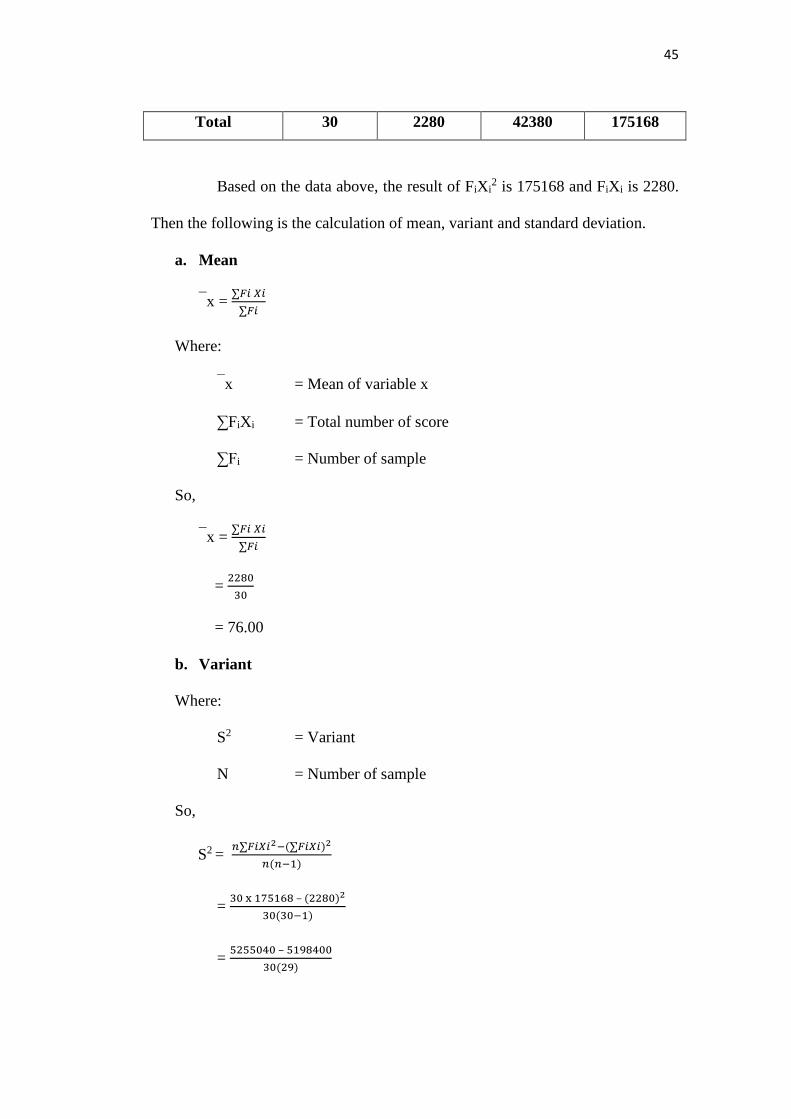
Total 30 2280 42380 175168
Based on the data above, the result of FiXi2 is 175168 and FiXi is 2280.
Then the following is the calculation of mean, variant and standard deviation.
a. Mean
x = ∑𝐹𝑖 𝑋𝑖
∑𝐹𝑖
Where:
x = Mean of variable x
∑FiXi = Total number of score
∑Fi = Number of sample
So,
x = ∑𝐹𝑖 𝑋𝑖
∑𝐹𝑖
= 2280
30
= 76.00
b. Variant
Where:
S2 = Variant
N = Number of sample
So,
S2 = 𝑛∑𝐹𝑖𝑋𝑖2−(∑𝐹𝑖𝑋𝑖)2
𝑛(𝑛−1)
= 30 x 175168 – (2280)2
30(30−1)
= 5255040 – 5198400
30(29)

46
= 56640
870
= 65.10
c. Standard Deviation
S = √𝑆2
= √65.10
= 8.06
After getting the calculation of mean, variant and deviation
standard, then the next step is to found out the normality of the test. It means that
the test was given to the students is observed by Liliefors test. The calculation of
normality writing descriptive text can be seen in the following table:
Table IX. Normality Testing of Post Test in Experimental Group
No Score Zi F(Zi) S(Zi) F(Zi) - S(Zi)
1 66 -1.24 0.107 0.26 -0.153
2 66 -1.24 0.107 0.26 -0.153
3 66 -1.24 0.107 0.26 -0.153
4 66 -1.24 0.107 0.26 -0.153
5 66 -1.24 0.107 0.26 -0.153
6 66 -1.24 0.107 0.26 -0.153
7 66 -1.24 0.107 0.26 -0.153
8 66 -1.24 0.107 0.26 -0.153
9 68 -0.99 0.160 0.33 -0.170
10 68 -0.99 0.160 0.33 -0.170
11 76 0.00 0.500 0.60 -0.100
12 76 0.00 0.500 0.60 -0.100
13 76 0.00 0.500 0.60 -0.100
14 76 0.00 0.500 0.60 -0.100

47
No Score Zi F(Zi) S(Zi) F(Zi) - S(Zi)
15 76 0.00 0.500 0.60 -0.100
16 76 0.00 0.500 0.60 -0.100
17 76 0.00 0.500 0.60 -0.100
18 76 0.00 0.500 0.60 -0.100
19 78 0.25 0.598 0.70 -0.102
20 78 0.25 0.598 0.70 -0.102
21 78 0.25 0.598 0.70 -0.102
22 80 0.50 0.690 0.73 -0.040
23 86 1.24 0.893 0.90 -0.007
24 86 1.24 0.893 0.90 -0.007
25 86 1.24 0.893 0.90 -0.007
26 86 1.24 0.893 0,90 -0.007
27 86 1.24 0.893 0.90 -0.007
28 88 1.49 0.932 1.00 -0.068
29 88 1.49 0.932 1.00 -0.068
30 88 1.49 0.932 1.00 -0.068
Total 2280 Lo = -0.007
Mean 76.00 Lt = 0.029
a. Finding Z score
Formula: Zi 1 = 𝑋𝑖−
𝑠
Zi 1 = 66 −76.00
8.06 = -1.24
Zi 2 = 68 −76.00
8.06 = -0.99
Zi 3 = 76 −76.00
8.06 = 0.00
Zi 4 = 78 −76.00
8.06 = 0.25
Zi 5 = 80 −76.00
8.06 = 0.50

48
Zi 6 = 86 −76.00
8.06 = 1.24
Zi 7 = 88 −76.00
8.06 = 1.49
b. Finding S(Zi)
S(Zi) = 𝐹 𝐾𝑢𝑚
𝑁
8
30 = 0.26
10
30 = 0.33
18
30 = 0.60
21
30 = 0.70
22
30 = 0.73
27
30 = 0.90
30
30 = 1.00
From the table above, it can be seen that Liliefors observation or Lo = -
0.007 with n = 30 and at real level = 0.05 from the list of critical value of
Liliefors table Lt = 0.029. It is known that the coefficient of Lo (-0.007) Lt
(0.029). So it can be concluded that the data distribution of the student’s ability in
writing descriptive text is normal.
1.2 Normality Testing of Control Group
Table X. Frequency Distribution of Pre Test in Control Group
No Xi Fi FiXi Xi2 FiXi
2
1 40 2 80 1600 3200

49
No Xi Fi FiXi Xi2 FiXi
2
2 42 8 336 1764 14112
3 44 3 132 1936 5808
4 46 6 276 2116 12696
5 50 3 150 2500 7500
6 56 3 168 3136 9408
7 64 5 320 4096 20480
Total 30 1462 17148 73204
Based on the data above, the result of FiXi2 is 73204 and FiXi is 1462.
Then the following is the calculation of mean, variant and standard deviation.
a. Mean
x = ∑𝐹𝑖 𝑋𝑖
∑𝐹𝑖
Where:
x = Mean of variable x
∑FiXi = Total number of score
∑Fi = Number of sample
So,
x = ∑𝐹𝑖 𝑋𝑖
∑𝐹𝑖
= 1462
30
= 48.73
b. Variant
Where:
S2 = Variant
N = Number of sample
50
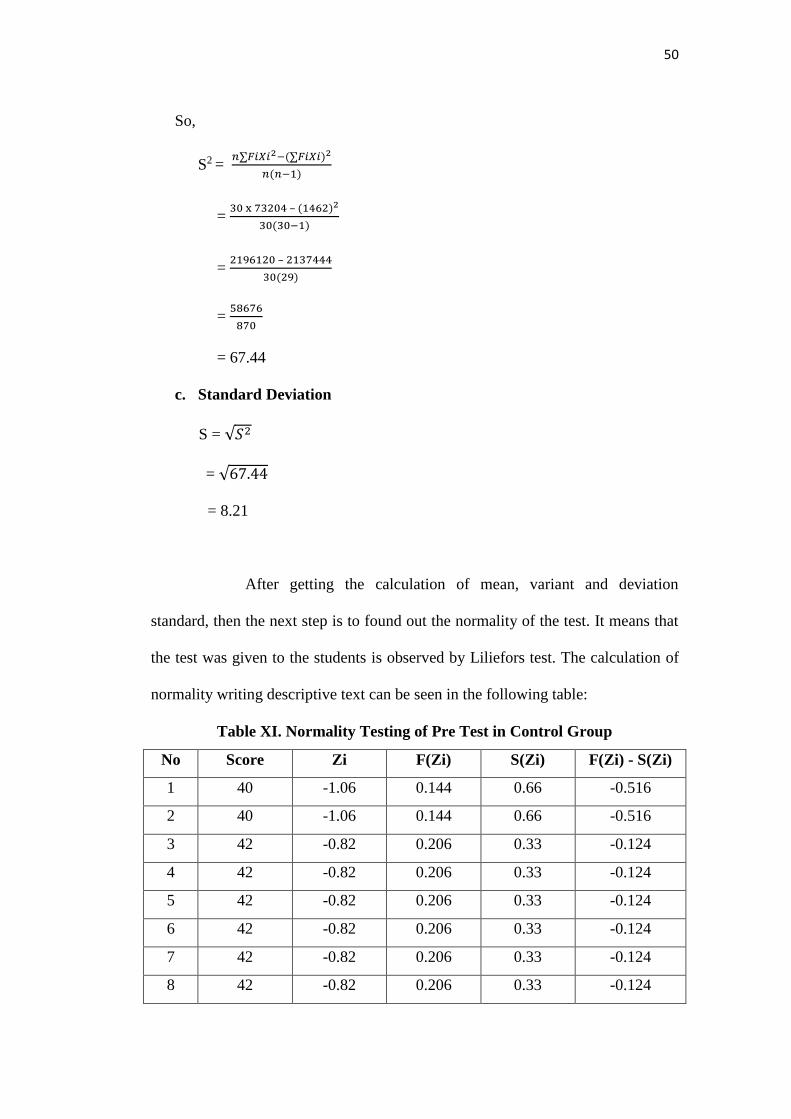
So,
S2 = 𝑛∑𝐹𝑖𝑋𝑖2−(∑𝐹𝑖𝑋𝑖)2
𝑛(𝑛−1)
= 30 x 73204 – (1462)2
30(30−1)
= 2196120 – 2137444
30(29)
= 58676
870
= 67.44
c. Standard Deviation
S = √𝑆2
= √67.44
= 8.21
After getting the calculation of mean, variant and deviation
standard, then the next step is to found out the normality of the test. It means that
the test was given to the students is observed by Liliefors test. The calculation of
normality writing descriptive text can be seen in the following table:
Table XI. Normality Testing of Pre Test in Control Group
No Score Zi F(Zi) S(Zi) F(Zi) - S(Zi)
1 40 -1.06 0.144 0.66 -0.516
2 40 -1.06 0.144 0.66 -0.516
3 42 -0.82 0.206 0.33 -0.124
4 42 -0.82 0.206 0.33 -0.124
5 42 -0.82 0.206 0.33 -0.124
6 42 -0.82 0.206 0.33 -0.124
7 42 -0.82 0.206 0.33 -0.124
8 42 -0.82 0.206 0.33 -0.124

51
No Score Zi F(Zi) S(Zi) F(Zi) - S(Zi)
9 42 -0.82 0.206 0.33 -0.124
10 42 -0.82 0.206 0.33 -0.124
11 44 -0.58 0.282 0.43 -0.148
12 44 -0.58 0.282 0.43 -0.148
13 44 -0.58 0.282 0.43 -0.148
14 46 -0.33 0.370 0.63 -0.260
15 46 -0.33 0.370 0.63 -0.260
16 46 -0.33 0.370 0.63 -0.260
17 46 -0.33 0.370 0.63 -0.260
18 46 -0.33 0.370 0.63 -0.260
19 46 -0.33 0.370 0.63 -0.260
20 50 0.15 0.561 0.73 -0.169
21 50 0.15 0.561 0.73 -0.169
22 50 0.15 0.561 0.73 -0.169
23 56 0.89 0.812 0.83 -0.018
24 56 0.89 0.812 0.83 -0.018
25 56 0.89 0.812 0.83 -0.018
26 64 1.86 0.969 1.00 -0.031
27 64 1.86 0.969 1.00 -0.031
28 64 1.86 0.969 1.00 -0.031
29 64 1.86 0.969 1.00 -0.031
30 64 1.86 0.969 1.00 -0.031
Total 1462 Lo = -0.018
Mean 48.73 Lt = 0.029
a. Finding Z score
Formula: Zi 1 = 𝑋𝑖−
𝑠
Zi 1 = 40 −48.73
8.21 = -1.06

52
Zi 2 = 42 −48.73
8.21 = -0.82
Zi 3 = 44 −48.73
8.21 = -0.58
Zi 4 = 46 −48.73
8.21 = -0.33
Zi 5 = 50 −48.73
8.21 = 0.15
Zi 6 = 56 −48.73
8.21 = 0.89
Zi 7 = 64 −48.73
8.21 = 1.86
b. Finding S(Zi)
S(Zi) = 𝐹 𝐾𝑢𝑚
𝑁
2
30 = 0.66
10
30 = 0.33
13
30 = 0.43
19
30 = 0.63
22
30 = 0.73
25
30 = 0.83
30
30 = 1.00
From the table above, it can be seen that Liliefors observation or Lo = -
0.018 with n = 30 and at real level = 0.05 from the list of critical value of
Liliefors table Lt = 0.029. It is known that the coefficient of Lo (-0.018) Lt
(0.029). So it can be concluded that the data distribution of the student’s ability in
writing descriptive text is normal.
53
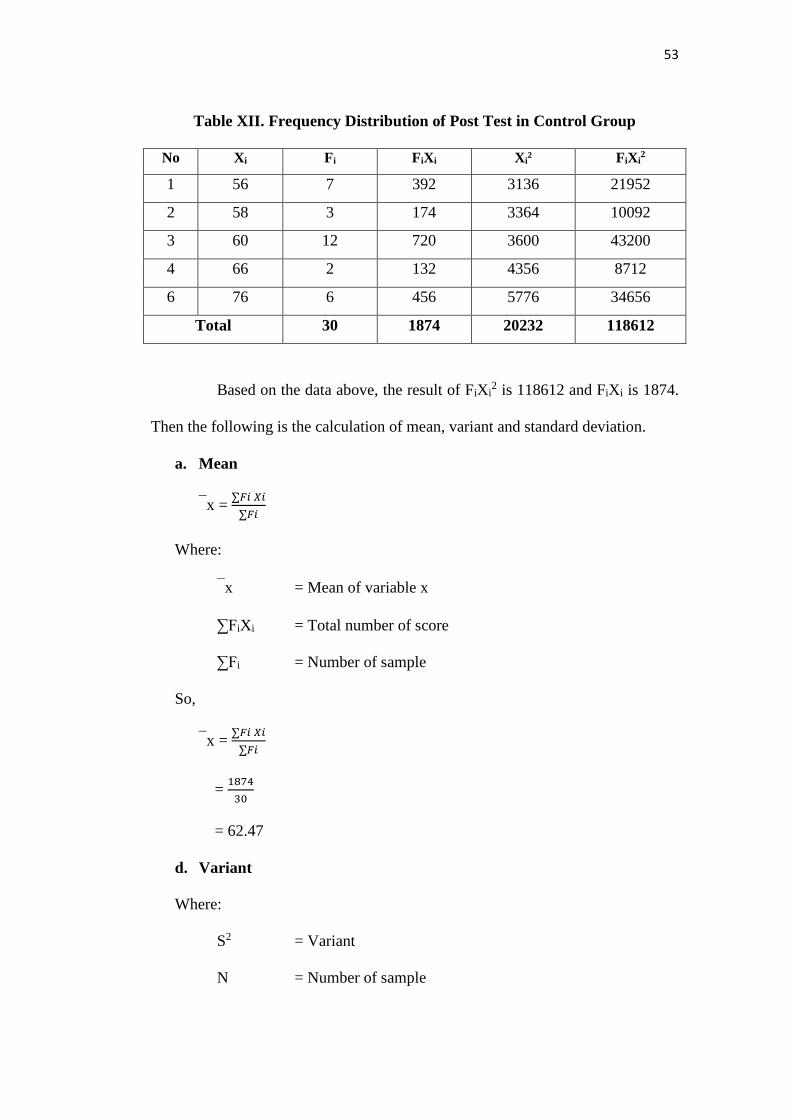
Table XII. Frequency Distribution of Post Test in Control Group
No Xi Fi FiXi Xi2 FiXi
2
1 56 7 392 3136 21952
2 58 3 174 3364 10092
3 60 12 720 3600 43200
4 66 2 132 4356 8712
6 76 6 456 5776 34656
Total 30 1874 20232 118612
Based on the data above, the result of FiXi2 is 118612 and FiXi is 1874.
Then the following is the calculation of mean, variant and standard deviation.
a. Mean
x = ∑𝐹𝑖 𝑋𝑖
∑𝐹𝑖
Where:
x = Mean of variable x
∑FiXi = Total number of score
∑Fi = Number of sample
So,
x = ∑𝐹𝑖 𝑋𝑖
∑𝐹𝑖
= 1874
30
= 62.47
d. Variant
Where:
S2 = Variant
N = Number of sample

54
So,
S2 = 𝑛∑𝐹𝑖𝑋𝑖2−(∑𝐹𝑖𝑋𝑖)2
𝑛(𝑛−1)
= 30 x 118612 – (1874)2
30(30−1)
= 3558360 – 3511876
30(29)
= 46484
870
= 53.42
e. Standard Deviation
S = √𝑆2
= √53.42
= 7.30
After getting the calculation of mean, variant and deviation
standard, then the next step is to found out the normality of the test. It means that
the test was given to the students is observed by Liliefors test. The calculation of
normality writing descriptive text can be seen in the following table:
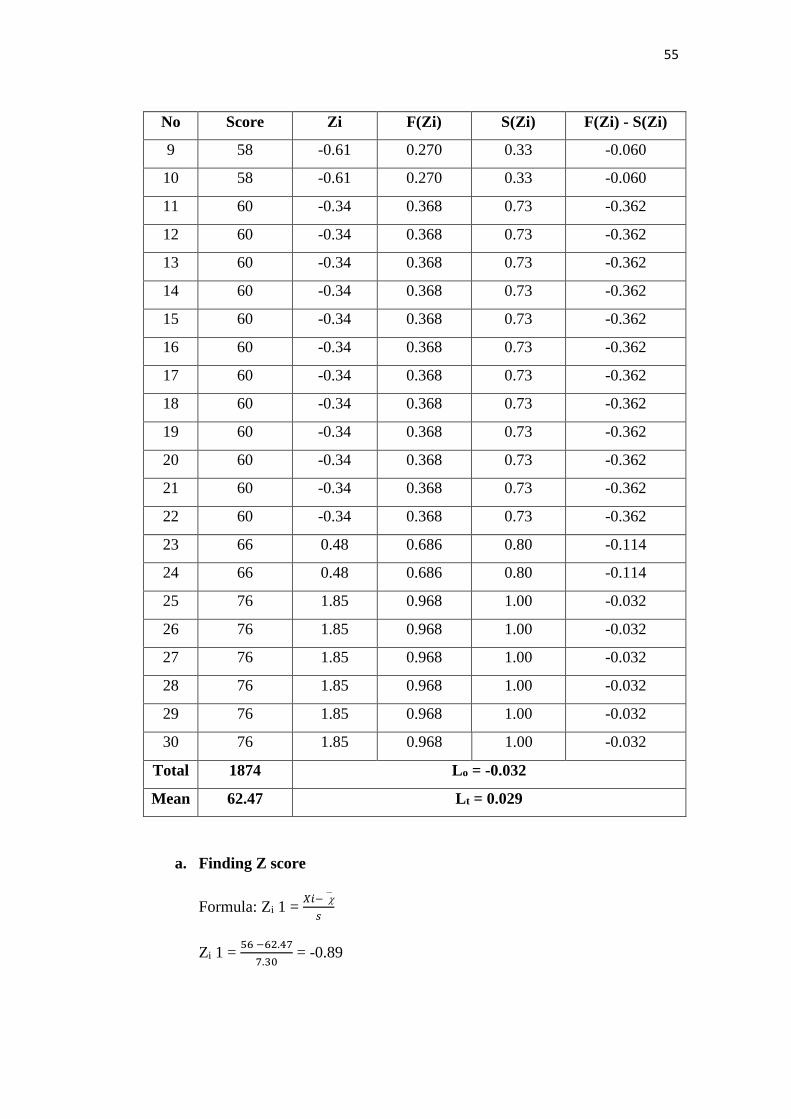
Table XIII. Normality Testing of Post Test in Control Group
No Score Zi F(Zi) S(Zi) F(Zi) - S(Zi)
1 56 -0.89 0.188 0.23 -0.042
2 56 -0.89 0.188 0.23 -0.042
3 56 -0.89 0.188 0.23 -0.042
4 56 -0.89 0.188 0.23 -0.042
5 56 -0.89 0.188 0.23 -0.042
6 56 -0.89 0.188 0.23 -0.042
7 56 -0.89 0.188 0.23 -0.042
8 58 -0.61 0.270 0.33 -0.060
55
No Score Zi F(Zi) S(Zi) F(Zi) - S(Zi)
9 58 -0.61 0.270 0.33 -0.060
10 58 -0.61 0.270 0.33 -0.060
11 60 -0.34 0.368 0.73 -0.362
12 60 -0.34 0.368 0.73 -0.362
13 60 -0.34 0.368 0.73 -0.362
14 60 -0.34 0.368 0.73 -0.362
15 60 -0.34 0.368 0.73 -0.362
16 60 -0.34 0.368 0.73 -0.362
17 60 -0.34 0.368 0.73 -0.362
18 60 -0.34 0.368 0.73 -0.362
19 60 -0.34 0.368 0.73 -0.362
20 60 -0.34 0.368 0.73 -0.362
21 60 -0.34 0.368 0.73 -0.362
22 60 -0.34 0.368 0.73 -0.362
23 66 0.48 0.686 0.80 -0.114
24 66 0.48 0.686 0.80 -0.114
25 76 1.85 0.968 1.00 -0.032
26 76 1.85 0.968 1.00 -0.032
27 76 1.85 0.968 1.00 -0.032
28 76 1.85 0.968 1.00 -0.032
29 76 1.85 0.968 1.00 -0.032
30 76 1.85 0.968 1.00 -0.032
Total 1874 Lo = -0.032
Mean 62.47 Lt = 0.029
a. Finding Z score
Formula: Zi 1 = 𝑋𝑖−
𝑠
Zi 1 = 56 −62.47
7.30 = -0.89

56
Zi 2 = 58 −62.47
7.30 = -0.61
Zi 3 = 60 −62.47
7.30 = -0.34
Zi 4 = 66 −62.47
7.30 = 0.48
Zi 5 = 76 −62.47
7.30 = 1.85
b. Finding S(Zi)
S(Zi) = 𝐹 𝐾𝑢𝑚
𝑁
7
30 = 0.23
10
30 = 0.33
22
30 = 0.73
24
30 = 0.80
30
30 = 1.00
From the table above, it can be seen that Liliefors observation or Lo = -
0.032 with n = 30 and at real level = 0.05 from the list of critical value of
Liliefors table Lt = 0.029. It is known that the coefficient of Lo (-0.032) Lt
(0.029). So it can be concluded that the data distribution of the student’s ability in
writing descriptive text is normal.
2. Homogeneity Testing
2.1 Homogeneity Testing of Pre Test
2
2
2
1
S
SFobs

57
Where : S12 = the biggest variant
S22 = the smallest variant
Based on the variants of both samples of pre-test found that:
2
exS = 102.98 N = 30
2
coS = 67.44 N = 30
So:
Fobs = 2
2
co
ex
S
S
Fobs = 52.144.67
98.102
Then the coefficient of Fobs = 1.52 is compared with Ftable, where Ftable is
determined at real level 𝛼 = 0.05 and the same numerator dk = N - 1 = 30 - 1 = 29
that was exist dk numerator 29, the denominator dk = n - 1 (30 - 1 = 29). Then
Ftable can be calculated F0.05(29,29) = 1.85
So Fobs < Ftable atau (1.52 < 1.85) so it can be concluded that the variant is
homogenous.
2.2 Homogeneity Testing of Post Test
2
2
2
1
S
SFobs
Where : S12 = the biggest variant
S22 = the smallest variant
Based on the variants of both samples of post-test found that:
2
exS = 65.10 N = 30
58
2
coS = 53.42 N = 30
So:
Fobs = 2
2
co
ex
S
S
Fobs = 21.142.53
10.65
Then the coefficient of Fobs = 1.21 is compared with Ftable, where Ftable is
determined at real level 𝛼 = 0.05 and the same numerator dk = N - 1 = 30 - 1 = 29
that was exist dk numerator 29, the denominator dk = n - 1 (30 - 1 = 29). Then
Ftable can be calculated F0.05(29,29) = 1.85
So Fobs < Ftable atau (1.21 < 1.85) so it can be concluded that the variant is
homogenous.
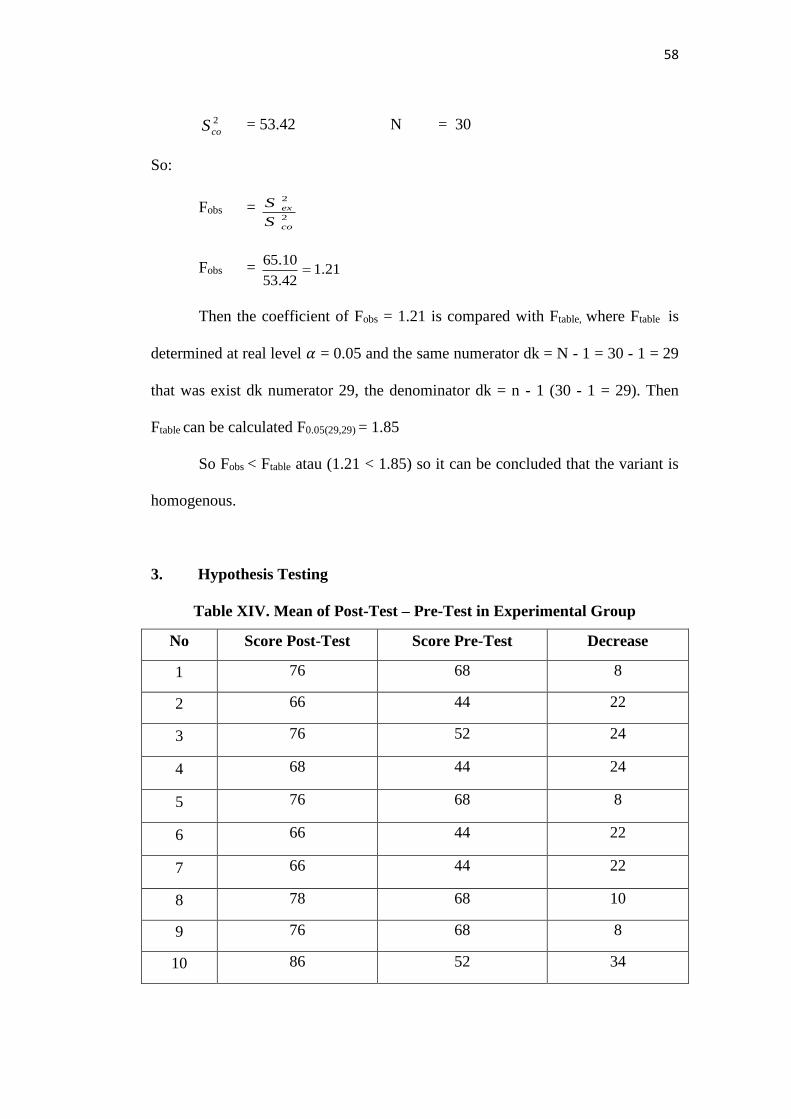
3. Hypothesis Testing
Table XIV. Mean of Post-Test – Pre-Test in Experimental Group
No Score Post-Test Score Pre-Test Decrease
1 76 68 8
2 66 44 22
3 76 52 24
4 68 44 24
5 76 68 8
6 66 44 22
7 66 44 22
8 78 68 10
9 76 68 8
10 86 52 34

59
11 66 44 22
12 76 44 32
No Score Post-Test Score Pre-Test Decrease
13 68 40 28
14 88 68 20
15 78 52 26
16 66 44 22
17 80 52 28
18 66 44 22
19 66 40 26
20 76 68 8
21 86 68 18
22 78 52 26
23 88 56 32
24 86 52 34
25 86 68 18
26 66 40 26
27 76 56 20
28 76 56 20
29 86 52 34
30 88 52 36
680
Mean 22.66
Table XV. Mean of Post-Test – Pre-Test in Control Group
No Score Post-Test Score Pre-Test Decrease
1 56 40 16

60
2 66 56 10
3 70 56 14
No Score Post-Test Score Pre-Test Decrease
4 56 46 10
5 76 56 20
6 60 50 10
7 76 64 12
8 56 42 14
9 76 64 12
10 56 42 14
11 76 64 12
12 60 42 18
13 58 44 14
14 60 44 16
15 58 40 18
16 58 42 16
17 60 46 14
18 66 44 22
19 60 50 10
20 60 46 14
21 60 50 10
22 56 42 14
23 56 42 14
24 76 64 12
25 76 64 12
26 56 42 14
27 60 46 14
61
28 60 46 14
29 60 46 14
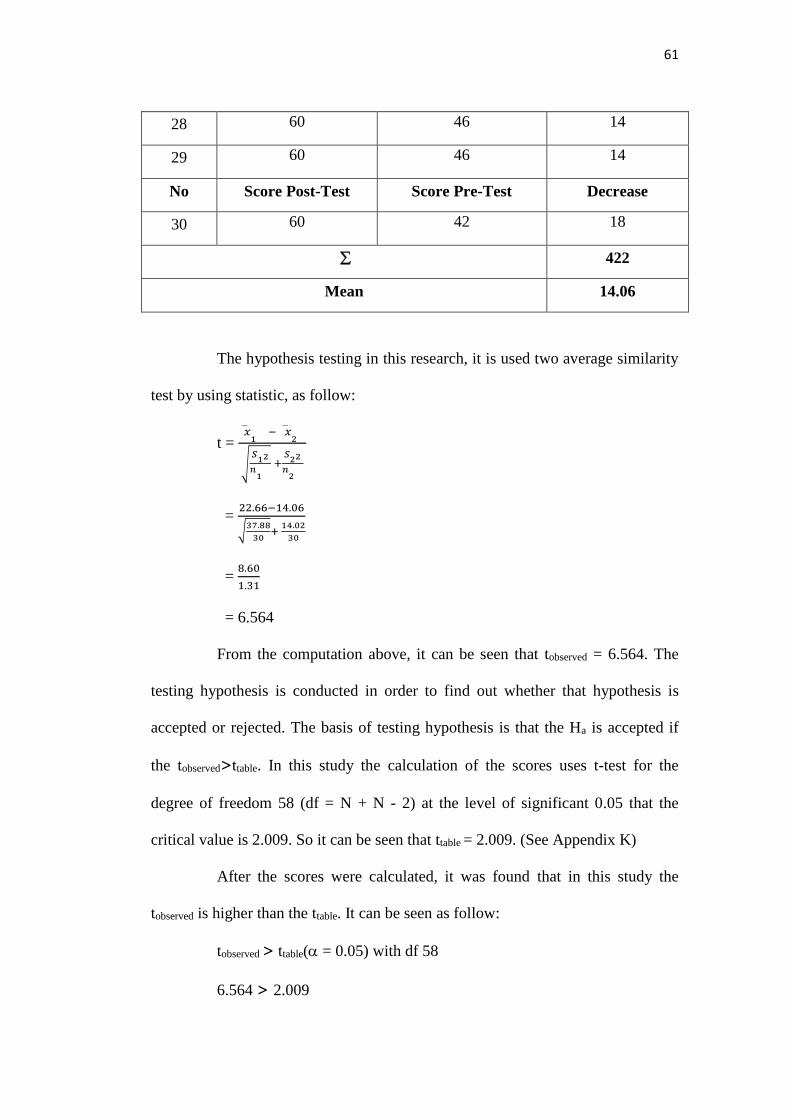
No Score Post-Test Score Pre-Test Decrease
30 60 42 18
422
Mean 14.06
The hypothesis testing in this research, it is used two average similarity
test by using statistic, as follow:
t = 𝑥
1 − 𝑥
2
√𝑆
12
𝑛1
+𝑆
22
𝑛2
= 22.66−14.06
√37.88
30+
14.02
30
= 8.60
1.31
= 6.564
From the computation above, it can be seen that tobserved = 6.564. The
testing hypothesis is conducted in order to find out whether that hypothesis is
accepted or rejected. The basis of testing hypothesis is that the Ha is accepted if
the tobserved>ttable. In this study the calculation of the scores uses t-test for the
degree of freedom 58 (df = N + N - 2) at the level of significant 0.05 that the
critical value is 2.009. So it can be seen that ttable = 2.009. (See Appendix K)
After the scores were calculated, it was found that in this study the
tobserved is higher than the ttable. It can be seen as follow:
tobserved > ttable( = 0.05) with df 58
6.564 > 2.009
62
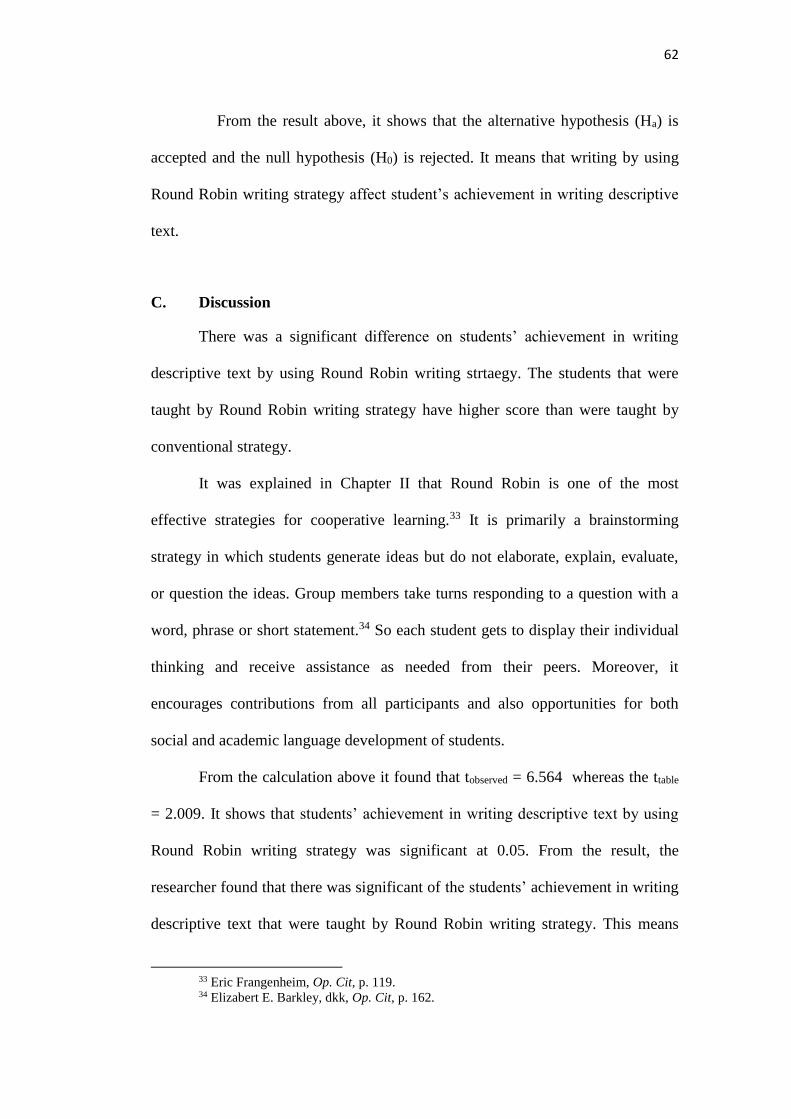
From the result above, it shows that the alternative hypothesis (Ha) is
accepted and the null hypothesis (H0) is rejected. It means that writing by using
Round Robin writing strategy affect student’s achievement in writing descriptive
text.
C. Discussion
There was a significant difference on students’ achievement in writing
descriptive text by using Round Robin writing strtaegy. The students that were
taught by Round Robin writing strategy have higher score than were taught by
conventional strategy.
It was explained in Chapter II that Round Robin is one of the most
effective strategies for cooperative learning.33 It is primarily a brainstorming
strategy in which students generate ideas but do not elaborate, explain, evaluate,
or question the ideas. Group members take turns responding to a question with a
word, phrase or short statement.34 So each student gets to display their individual
thinking and receive assistance as needed from their peers. Moreover, it
encourages contributions from all participants and also opportunities for both
social and academic language development of students.
From the calculation above it found that tobserved = 6.564 whereas the ttable
= 2.009. It shows that students’ achievement in writing descriptive text by using
Round Robin writing strategy was significant at 0.05. From the result, the
researcher found that there was significant of the students’ achievement in writing
descriptive text that were taught by Round Robin writing strategy. This means
33 Eric Frangenheim, Op. Cit, p. 119. 34 Elizabert E. Barkley, dkk, Op. Cit, p. 162.

63
that the students’ achievement in writing descriptive text that were taught by
Round Robin writing strategy was better than taught by conventional strategy.
64
CHAPTER V
CONCLUSION AND SUGGESTION
A. Conclusion
From the data obtained it is seen that the result of the students’
achievement in writing descriptive text by using Round Robin writing strategy is
higher than that by using conventional strategy at the tenth grade of MAS PAB 2
Helvetia Medan. Round Robin writing strategy is significant to be used in
improving the students’achievement in writing descriptive text. The result of
tobserved is 6.564 and ttable is 2.009 (tobserved > ttable, 6.564 > 2.009). It means that H0
is rejected and Ha is accepted. There is a significant effect of Round Robin writing
strategy on the students’ achievement in writing descriptive text.
B. Suggestion
Based on the conclusion above, the researcher gives some suggestions as
follows:
1. English teachers are suggested to use Round Robin writing strategy in
their teaching learning process in order to improve the students’ writing
achievement.
2. The researchers who are interested in doing a research related to this study
should try to apply Round Robin writing strategy on different level of
learners through different genre to prove the effectiveness of Round Robin
writing strategy on students’ writing achievement.

65
Finally, the resarcher considers that this study still need validity from the
next researcher that has the similar topic with this study.
66
REFERENCES
Barkley, Elizabert E., Cross, K. Patricia, Major, Claire Howell. 2012.
Collaborative Learning Techniques (Terjemahan). Bandung: Nusa Media.
Brown, H. Douglas. 2000. Teaching by Principles: An Interactive Approach to
Language Pedagogy (Second Edition). New York: Addison Wesley
Longman.
Brown, H. Douglas. 2004. Language Assessment: Principles and Classroom
Practices. New York: Addison Wesley Longman.
Dewi, Utami. 2011. How to Write. Medan: La-Tansa Press.
Dirgeyasa. 2014. College Academic Writing: A Genre-Based Perspective. Medan:
Unimed Press.
Frangenheim, Eric. 2005. Reflections on Classroom Thinking Strategies:
Practical Strategies to Encourage Thinking in Your Classroom (Sixth
Edition). London: Paul Chapman.
Gibbons, Pauline. 2005. Writing in a Second Language Across the Curriculum.
New York: Pearson Education.
Harmer, Jeremy. 2001. The Practice of English Language Teaching (Third
Edition). UK: Longman.
Harmer, Jeremy. 2004. How to Teach Writing. England: Pearson Education
Limited.
Hughes, Arthur. 2003. Testing for Language Teachers (Second Edition).
Cambridge: Cambridge University Press.

67
https://fall13azusa.wikispaces.com/file/view/What+is+Round+Robin.pdf
(Accessed on December 25th, 2016)
http://fanlore.org/wiki/Round_Robin (Accessed on December 25th, 2016)
http://makalahpendidikanislamlengkap.blogspot.co.id/2016/12/ayat-ayat-al-quran-
tentang-metode.html (Accessed on December 20th, 2016)
https://rachmatul4212.wordpress.com/2013/01/28/teknik-pengumpulan-data-
dalam-penelitian-kuantitatif-dan-kualitatif/ (Accessed on January 10th,
2017)
Knapp, Peter and Watkins, Megan. 2005. Genre, Text, Grammar: Technologies
for Teaching and Assessing Writing. Sidney: UNSW Press.
Mursidah, Fera. 2011. Improving Students Writing Ability to Write Narrative Text
through Write Pair Share. Education Journal: Vol 2.
Oshima, Alice and Hogue, Ann. 1997. Introduction to Academic Writing 2nd ed.
New York: Addison Wesley Longman.
Siahaan, Sanggam. 2008. The English Paragraph. Yogyakarta: Graha Ilmu.
Siahaan, Sanggam and Shinoda, Kisno. 2008. Generic Text Structure.
Yogyakarta: Graha Ilmu.
Suryani, Nunuk and Agung, Leo. 2012. Strategi Belajar Mengajar. Yogyakarta:
Ombak.
Uno, Hamzah B. 2007. Model Pembelajaran: Menciptakan Proses Belajar
Mengajar yang Kreatif dan Efektif. Jakarta: Bumi Aksara.
68
APPENDIX A
PRE TEST
Name: Class:
Write down a descriptive text based on the picture!

69
APPENDIX B
PICTURE FOR PRE TEST
70
APPENDIX C
POST TEST
Name: Class:
Write down a descriptive text based on the picture!
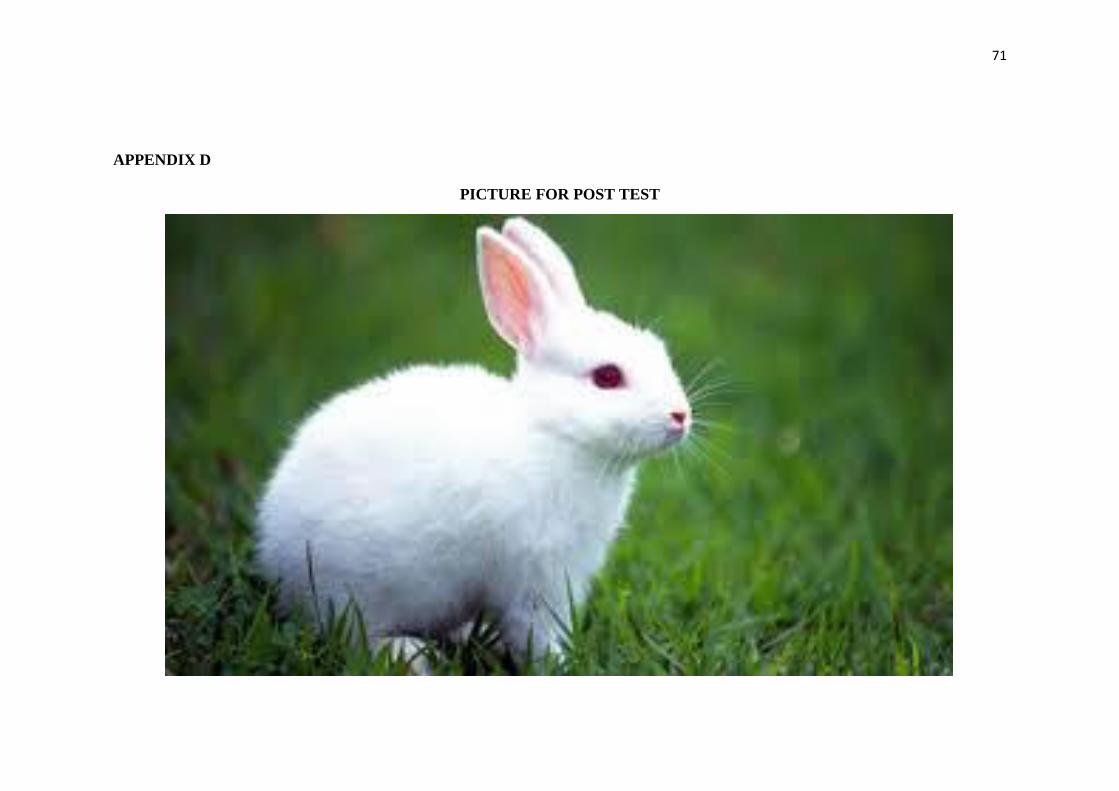
71
APPENDIX D
PICTURE FOR POST TEST

APPENDIX E
LESSON PLAN I
(Experimental Group)
School : MAS PAB Helvetia Medan
Class : X-1
Subject : English
Skill : Writing
Genre : Descriptive Text
Time : 2 x 45 minutes
A. Standard Competence
To understand the meaning of short functional text and simple essay in
forms of descriptive in daily life contextual and in order to access
knowledge.
B. Basic Competence
To respond meaning of essay in written language form accurately, fluency,
and can be accepted in daily life contextual and in order to access
knowledge in descriptive.
C. Indicator
Students are able to produce descriptive text by using Round Robin
Writing Strategy.
D. Teaching Material
DESCRIPTIVE TEXT
Social Function:
The social function of writing descriptive text is to describe a particular
person, place, thing, or animal.
Generic Structure:
1. Identification, which identifies phenomenon that will be describe.
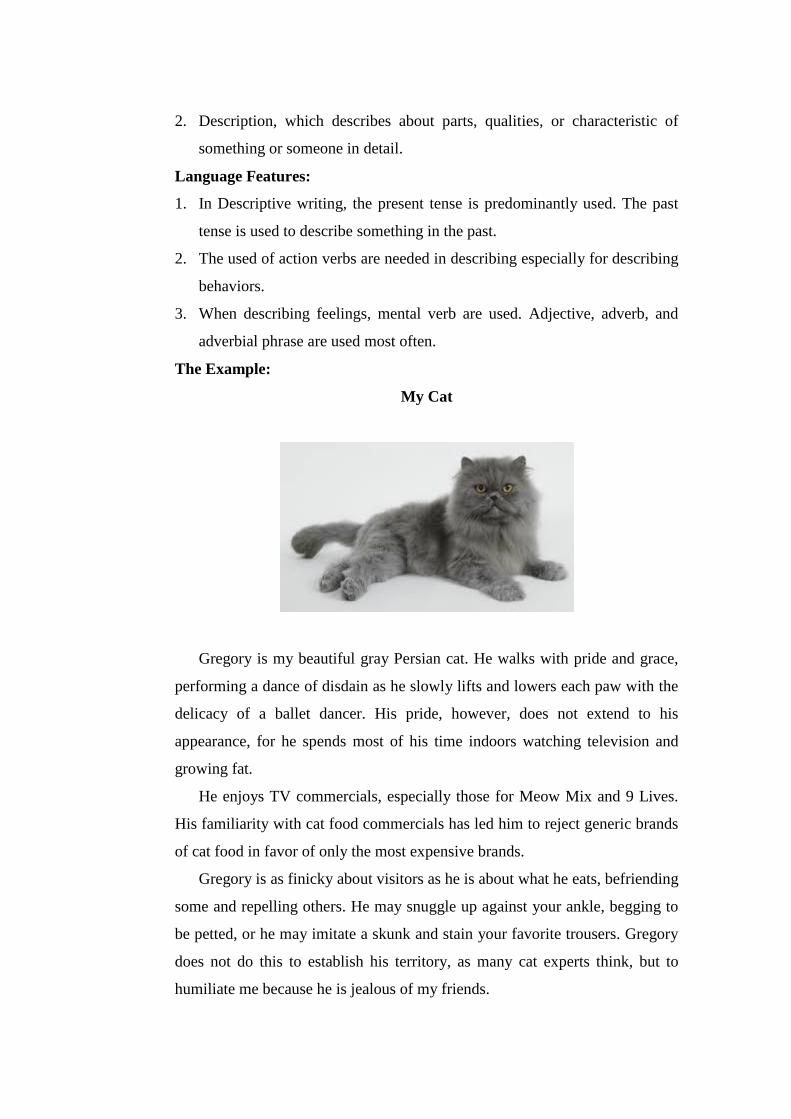
2. Description, which describes about parts, qualities, or characteristic of
something or someone in detail.
Language Features:
1. In Descriptive writing, the present tense is predominantly used. The past
tense is used to describe something in the past.
2. The used of action verbs are needed in describing especially for describing
behaviors.
3. When describing feelings, mental verb are used. Adjective, adverb, and
adverbial phrase are used most often.
The Example:
My Cat
Gregory is my beautiful gray Persian cat. He walks with pride and grace,
performing a dance of disdain as he slowly lifts and lowers each paw with the
delicacy of a ballet dancer. His pride, however, does not extend to his
appearance, for he spends most of his time indoors watching television and
growing fat.
He enjoys TV commercials, especially those for Meow Mix and 9 Lives.
His familiarity with cat food commercials has led him to reject generic brands
of cat food in favor of only the most expensive brands.
Gregory is as finicky about visitors as he is about what he eats, befriending
some and repelling others. He may snuggle up against your ankle, begging to
be petted, or he may imitate a skunk and stain your favorite trousers. Gregory
does not do this to establish his territory, as many cat experts think, but to
humiliate me because he is jealous of my friends.

After my guests have fled, I look at the old fleabag snoozing and smiling
to himself in front of the television set, and I have to forgive him for his
obnoxious, but endearing, habits.
E. Media
1. Copy of picture and the test
2. English dictionary
F. Learning Strategy
Round Robin Writing Strategy
G. Teaching and Learning Process
No. Activities Time
1. Opening
a. Teacher greets the students
b. Teacher explains what the class is going to do
in the meeting
10’
2. Main Activities
a. Teacher explains about the generic structure
and language feature of descriptive text
b. Teacher asks the student to sit in group of no
more than five people and no more less than
two
c. Teacher gives each group a pen and each group
has only one piece of paper
d. Teacher gives a topic discussion from the
picture
e. Teacher asks one person from each group to
start writing about the identification of
phenomenon
f. Teacher asks the students to pass the paper to
the second student who reads what has been
70’

written and then continue the text by writing
about the description which describe about
parts, qualities, or characteristic of something
or someone in detail
g. The paper is pass now to the third students who
read what has been written thus far and then
also continue the text by writing about the
description to complete the information
h. Teacher asks students continued passing the
text around and writes a successive sequence
i. Teacher directs each group for editing on their
own writing before collect it to the teacher
j. Teacher calls the time and collect the student’s
paper
3. Closing
a. Teacher concludes the material of the lesson
b. Teacher closes the class and reminds the
students to study at home
10’
H. Assessment
Write your own descriptive text based on the picture!
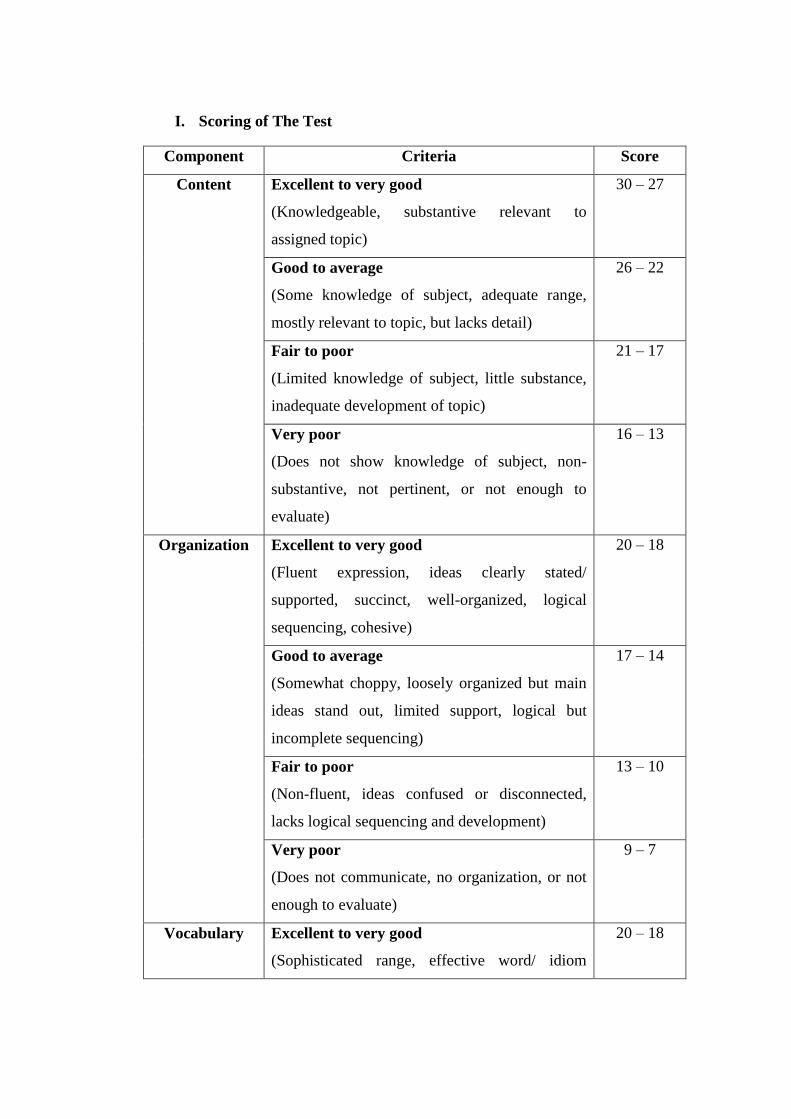
I. Scoring of The Test
Component Criteria Score
Content Excellent to very good
(Knowledgeable, substantive relevant to
assigned topic)
30 – 27
Good to average
(Some knowledge of subject, adequate range,
mostly relevant to topic, but lacks detail)
26 – 22
Fair to poor
(Limited knowledge of subject, little substance,
inadequate development of topic)
21 – 17
Very poor
(Does not show knowledge of subject, non-
substantive, not pertinent, or not enough to
evaluate)
16 – 13
Organization Excellent to very good
(Fluent expression, ideas clearly stated/
supported, succinct, well-organized, logical
sequencing, cohesive)
20 – 18
Good to average
(Somewhat choppy, loosely organized but main
ideas stand out, limited support, logical but
incomplete sequencing)
17 – 14
Fair to poor
(Non-fluent, ideas confused or disconnected,
lacks logical sequencing and development)
13 – 10
Very poor
(Does not communicate, no organization, or not
enough to evaluate)
9 – 7
Vocabulary Excellent to very good
(Sophisticated range, effective word/ idiom
20 – 18

choice and usage, word from mastery,
appropriate register)
Good to average
(Adequate range, occasional errors of word/
idiom form, choice, usage but meaning not
obscured)
17 – 14
Fair to poor
(Limited range, frequent errors of word/ idiom
form, choice, usage, meaning confused or
obscured)
13 – 10
Very poor
(Essentially translation, little knowledge of
English vocabulary, idioms, word form, or not
enough to evaluate)
9 – 7
Language Use Excellent to very good
(Effective complex constructions, few errors of
agreement, tense, number, word order/ function,
articles, pronouns, prepositions)
25 – 22
Good to average
(Effective but simple constructions, minor
problems in complex constructions, several
errors of agreement, tense, number, word order/
function, articles, pronouns, prepositions but
meaning seldom obscured)
21 – 18
Fair to poor
(Major problems in simple/ complex
constructions, frequent errors of negation,
aggrement, tense, number, word order/ function,
articles, pronouns, prepositions and/ or
fragments, run-ons, deletions, meaning confused
or obscured)
17 – 11
Very poor 10 – 5
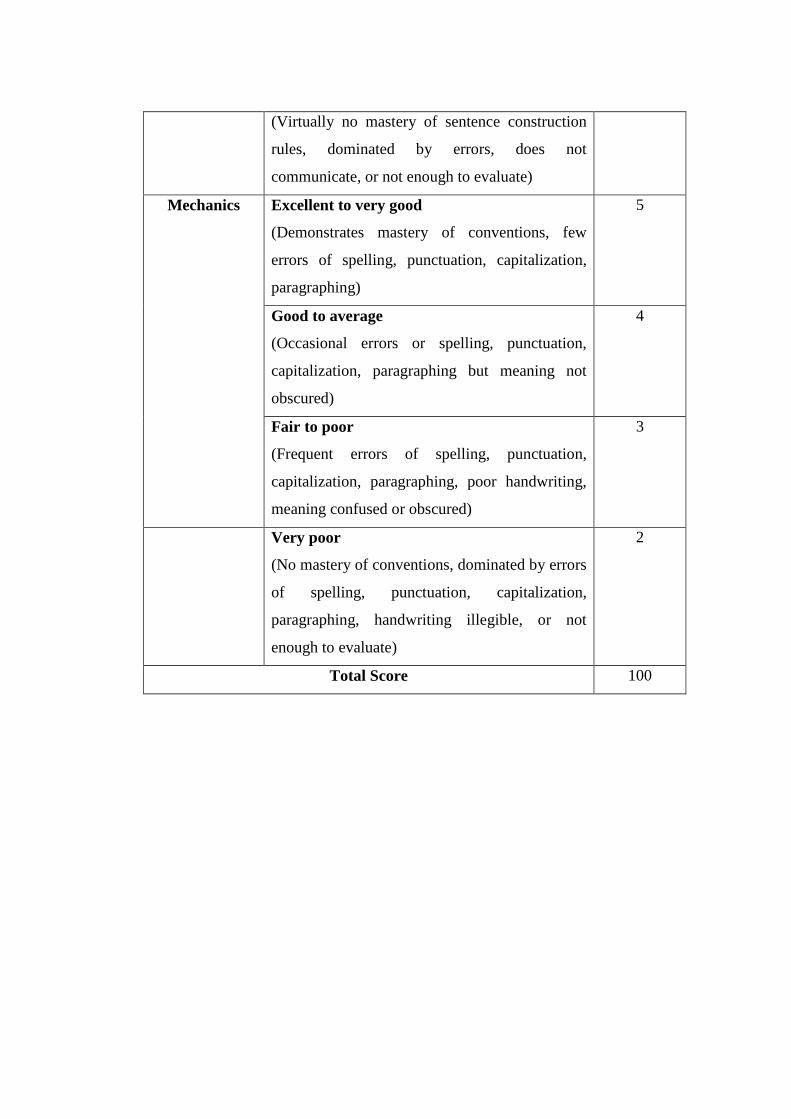
(Virtually no mastery of sentence construction
rules, dominated by errors, does not
communicate, or not enough to evaluate)
Mechanics Excellent to very good
(Demonstrates mastery of conventions, few
errors of spelling, punctuation, capitalization,
paragraphing)
5
Good to average
(Occasional errors or spelling, punctuation,
capitalization, paragraphing but meaning not
obscured)
4
Fair to poor
(Frequent errors of spelling, punctuation,
capitalization, paragraphing, poor handwriting,
meaning confused or obscured)
3
Very poor
(No mastery of conventions, dominated by errors
of spelling, punctuation, capitalization,
paragraphing, handwriting illegible, or not
enough to evaluate)
2
Total Score 100

LESSON PLAN II
(Experimental Group)
School : MAS PAB Helvetia Medan
Class : X-1
Subject : English
Skill : Writing
Genre : Descriptive Text
Time : 2 x 45 minutes
A. Standard Competence
To understand the meaning of short functional text and simple essay in
forms of descriptive in daily life contextual and in order to access
knowledge.
B. Basic Competence
To respond meaning of essay in written language form accurately, fluency,
and can be accepted in daily life contextual and in order to access
knowledge in descriptive.
C. Indicator
Students are able to produce descriptive text by using Round Robin
Writing Strategy.
D. Teaching Material
DESCRIPTIVE TEXT
Social Function:
The social function of writing descriptive text is to describe a particular
person, place, thing, or animal.
Generic Structure:
1. Identification, which identifies phenomenon that will be describe.

2. Description, which describes about parts, qualities, or characteristic of
something or someone in detail.
Language Features:
1. In Descriptive writing, the present tense is predominantly used. The past
tense is used to describe something in the past.
2. The used of action verbs are needed in describing especially for describing
behaviors.
3. When describing feelings, mental verb are used. Adjective, adverb, and
adverbial phrase are used most often.
The Example:
My Hamster
My hamster’s name is Gigi, and I love her so much, she’s only been in the
family for a short while, but it feels like she’s been here forever! There are so
many words that I can use to describe her with that if somebody were to ask me to
only use three words to describe Gigi it would be really hard to do , but if I had to
I would say she is very loving, adorable, and sweet. I would say those specific
three words because she just is all of those words combined into one very cute
hamster.
I like her small body and soft fur. I also like her face. It’s true she is very
cute!
E. Media
1. Copy of picture and the test
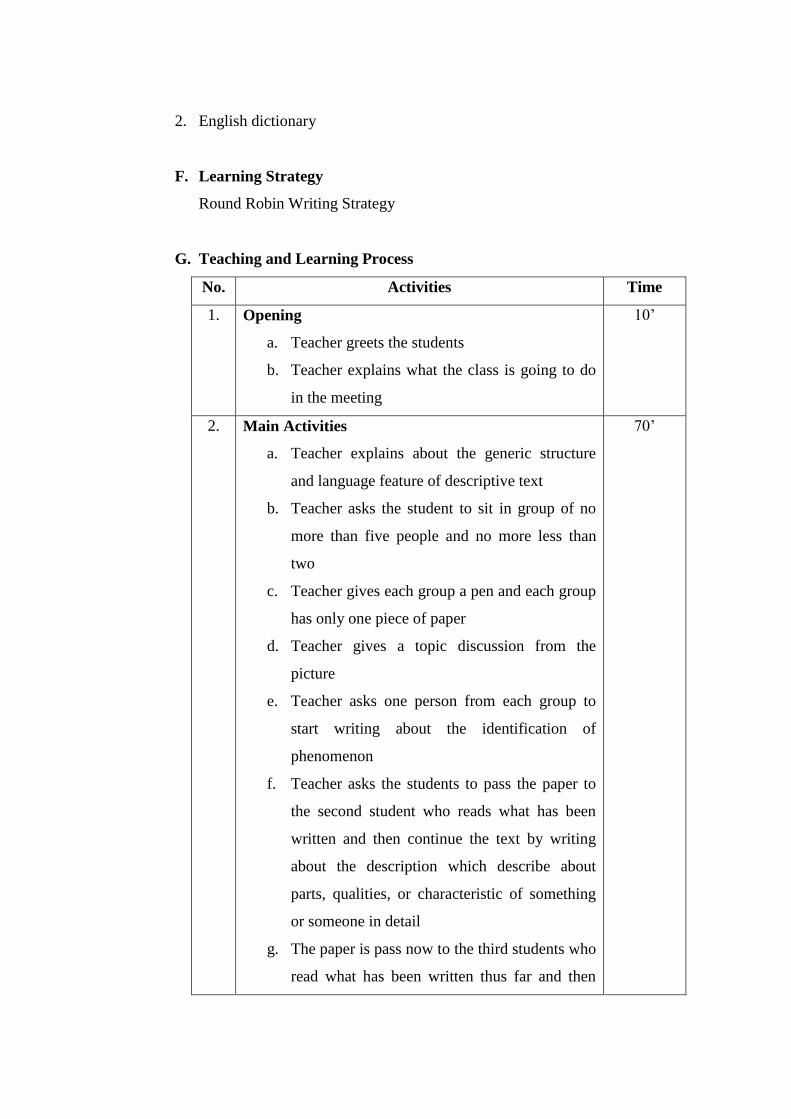
2. English dictionary
F. Learning Strategy
Round Robin Writing Strategy
G. Teaching and Learning Process
No. Activities Time
1. Opening
a. Teacher greets the students
b. Teacher explains what the class is going to do
in the meeting
10’
2. Main Activities
a. Teacher explains about the generic structure
and language feature of descriptive text
b. Teacher asks the student to sit in group of no
more than five people and no more less than
two
c. Teacher gives each group a pen and each group
has only one piece of paper
d. Teacher gives a topic discussion from the
picture
e. Teacher asks one person from each group to
start writing about the identification of
phenomenon
f. Teacher asks the students to pass the paper to
the second student who reads what has been
written and then continue the text by writing
about the description which describe about
parts, qualities, or characteristic of something
or someone in detail
g. The paper is pass now to the third students who
read what has been written thus far and then
70’

also continue the text by writing about the
description to complete the information
h. Teacher asks students continued passing the
text around and writes a successive sequence
i. Teacher directs each group for editing on their
own writing before collect it to the teacher
j. Teacher calls the time and collect the student’s
paper
3. Closing
a. Teacher concludes the material of the lesson
b. Teacher closes the class and reminds the
students to study at home
10’
H. Assessment
Write your own descriptive text based on the picture!
I. Scoring of The Test
Component Criteria Score
Content Excellent to very good
(Knowledgeable, substantive relevant to
assigned topic)
30 – 27
Good to average
(Some knowledge of subject, adequate range,
mostly relevant to topic, but lacks detail)
26 – 22
Fair to poor 21 – 17
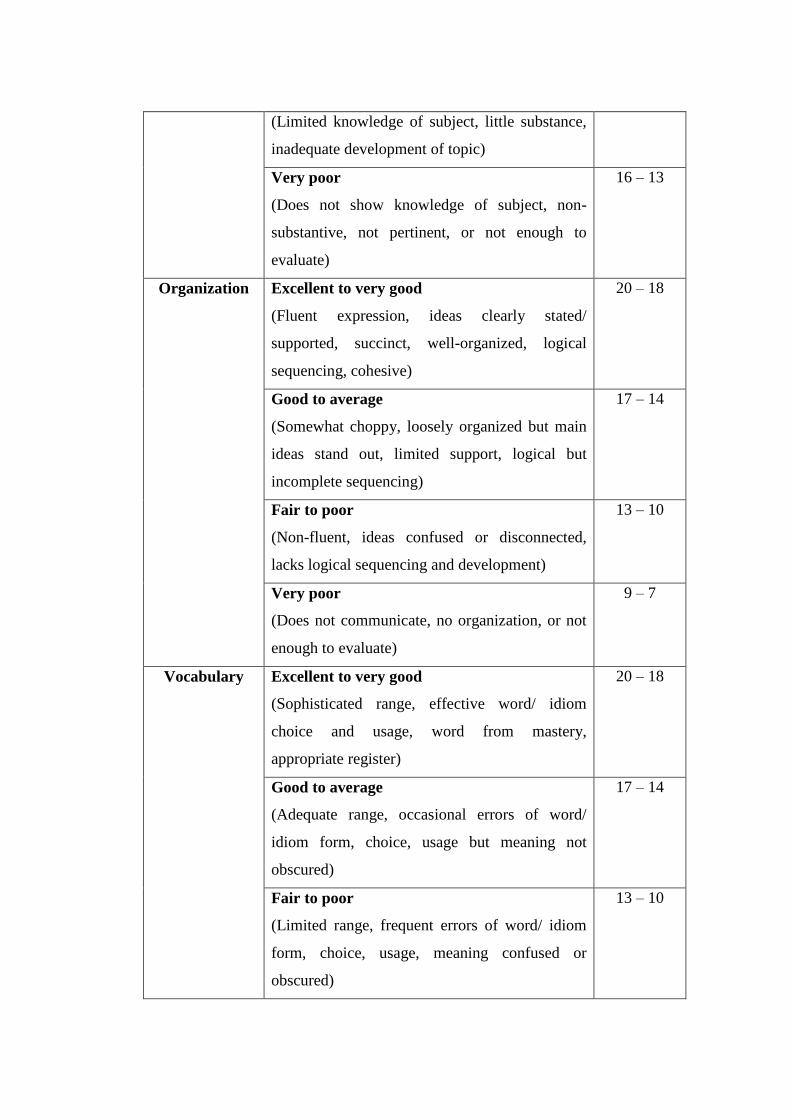
(Limited knowledge of subject, little substance,
inadequate development of topic)
Very poor
(Does not show knowledge of subject, non-
substantive, not pertinent, or not enough to
evaluate)
16 – 13
Organization Excellent to very good
(Fluent expression, ideas clearly stated/
supported, succinct, well-organized, logical
sequencing, cohesive)
20 – 18
Good to average
(Somewhat choppy, loosely organized but main
ideas stand out, limited support, logical but
incomplete sequencing)
17 – 14
Fair to poor
(Non-fluent, ideas confused or disconnected,
lacks logical sequencing and development)
13 – 10
Very poor
(Does not communicate, no organization, or not
enough to evaluate)
9 – 7
Vocabulary Excellent to very good
(Sophisticated range, effective word/ idiom
choice and usage, word from mastery,
appropriate register)
20 – 18
Good to average
(Adequate range, occasional errors of word/
idiom form, choice, usage but meaning not
obscured)
17 – 14
Fair to poor
(Limited range, frequent errors of word/ idiom
form, choice, usage, meaning confused or
obscured)
13 – 10
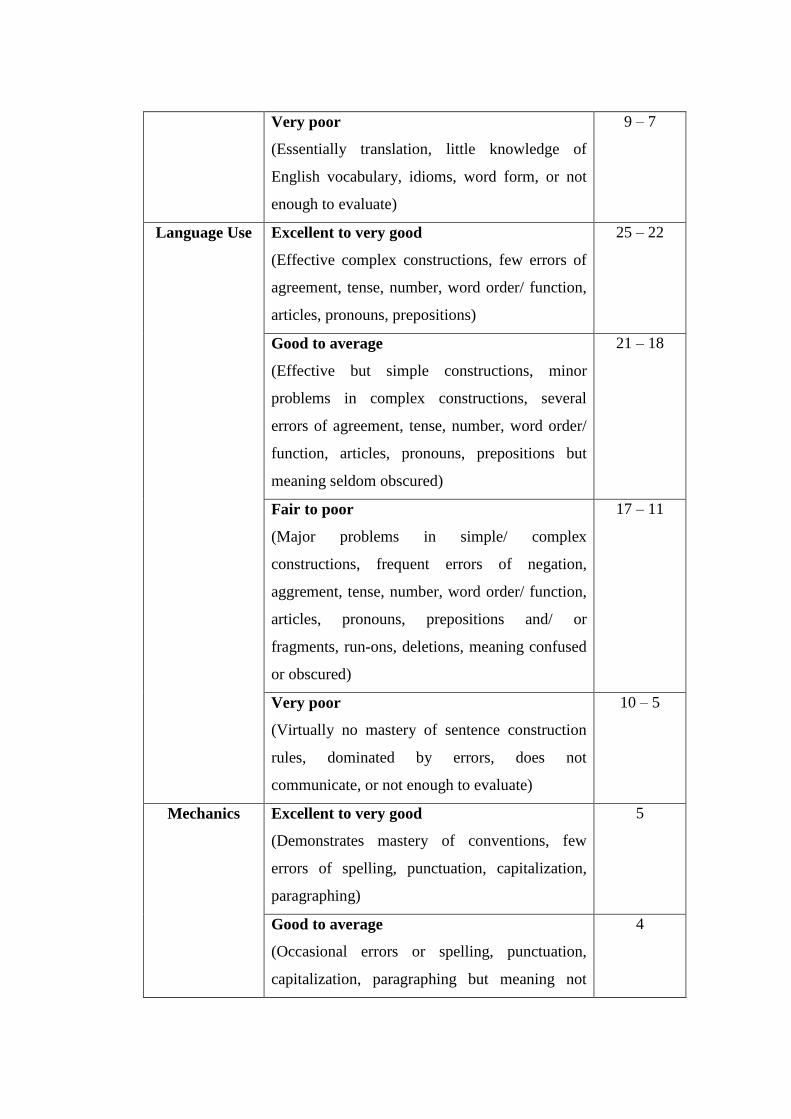
Very poor
(Essentially translation, little knowledge of
English vocabulary, idioms, word form, or not
enough to evaluate)
9 – 7
Language Use Excellent to very good
(Effective complex constructions, few errors of
agreement, tense, number, word order/ function,
articles, pronouns, prepositions)
25 – 22
Good to average
(Effective but simple constructions, minor
problems in complex constructions, several
errors of agreement, tense, number, word order/
function, articles, pronouns, prepositions but
meaning seldom obscured)
21 – 18
Fair to poor
(Major problems in simple/ complex
constructions, frequent errors of negation,
aggrement, tense, number, word order/ function,
articles, pronouns, prepositions and/ or
fragments, run-ons, deletions, meaning confused
or obscured)
17 – 11
Very poor
(Virtually no mastery of sentence construction
rules, dominated by errors, does not
communicate, or not enough to evaluate)
10 – 5
Mechanics Excellent to very good
(Demonstrates mastery of conventions, few
errors of spelling, punctuation, capitalization,
paragraphing)
5
Good to average
(Occasional errors or spelling, punctuation,
capitalization, paragraphing but meaning not
4
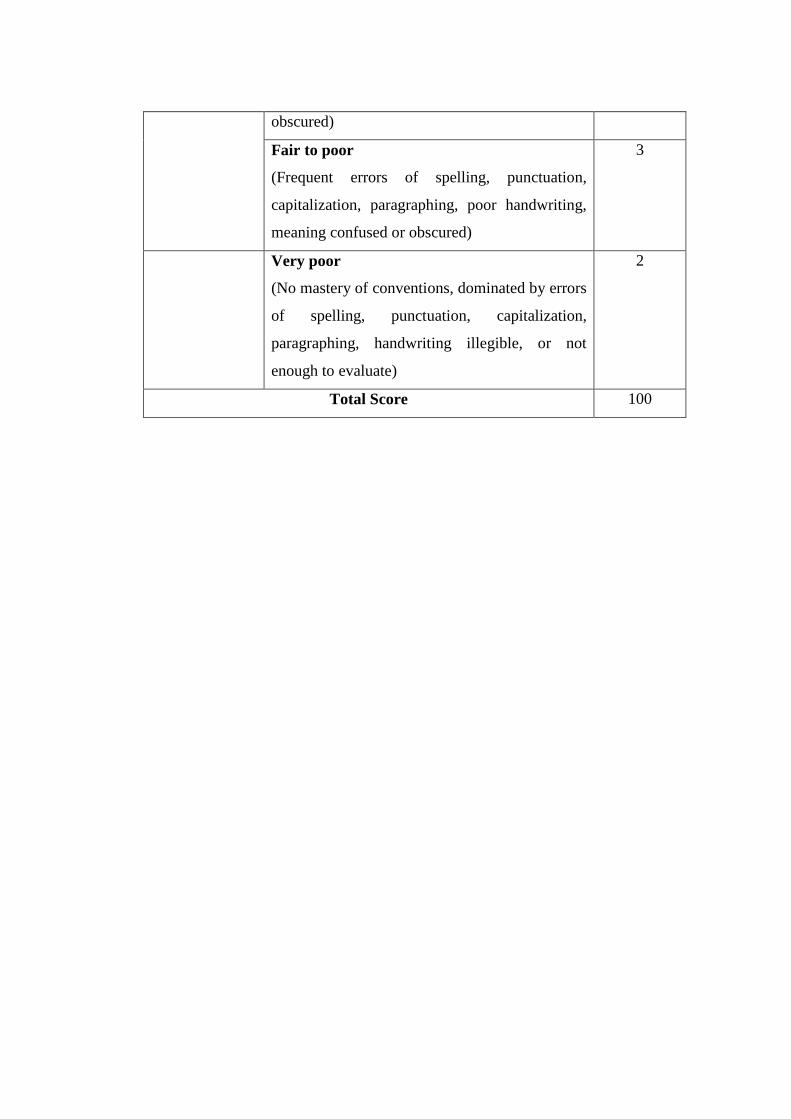
obscured)
Fair to poor
(Frequent errors of spelling, punctuation,
capitalization, paragraphing, poor handwriting,
meaning confused or obscured)
3
Very poor
(No mastery of conventions, dominated by errors
of spelling, punctuation, capitalization,
paragraphing, handwriting illegible, or not
enough to evaluate)
2
Total Score 100
APPENDIX F
LESSON PLAN I
(Control Group)
School : MAS PAB Helvetia Medan
Class : X-2
Subject : English
Skill : Writing
Genre : Descriptive Text
Time : 2 x 45 minutes
A. Standard Competence
To understand the meaning of short functional text and simple essay in
forms of descriptive in daily life contextual and in order to access
knowledge.
B. Basic Competence
To respond meaning of essay in written language form accurately, fluency,
and can be accepted in daily life contextual and in order to access
knowledge in descriptive.
C. Indicator
Students are able to produce descriptive text.
D. Teaching Material
DESCRIPTIVE TEXT
Social Function:
The social function of writing descriptive text is to describe a particular
person, place, thing, or animal.
Generic Structure:
1. Identification, which identifies phenomenon that will be describe.

2. Description, which describes about parts, qualities, or characteristic of
something or someone in detail.
Language Features:
1. In Descriptive writing, the present tense is predominantly used. The past
tense is used to describe something in the past.
2. The used of action verbs are needed in describing especially for describing
behaviors.
3. When describing feelings, mental verb are used. Adjective, adverb, and
adverbial phrase are used most often.
The Example:
My Cat
Gregory is my beautiful gray Persian cat. He walks with pride and grace,
performing a dance of disdain as he slowly lifts and lowers each paw with the
delicacy of a ballet dancer. His pride, however, does not extend to his
appearance, for he spends most of his time indoors watching television and
growing fat.
He enjoys TV commercials, especially those for Meow Mix and 9 Lives.
His familiarity with cat food commercials has led him to reject generic brands
of cat food in favor of only the most expensive brands.
Gregory is as finicky about visitors as he is about what he eats, befriending
some and repelling others. He may snuggle up against your ankle, begging to
be petted, or he may imitate a skunk and stain your favorite trousers. Gregory
does not do this to establish his territory, as many cat experts think, but to
humiliate me because he is jealous of my friends.

After my guests have fled, I look at the old fleabag snoozing and smiling
to himself in front of the television set, and I have to forgive him for his
obnoxious, but endearing, habits.
E. Media
1. Copy of picture and the test
2. English dictionary
F. Teaching and Learning Process
No. Activities Time
1. Opening
a. Teacher greets the students
b. Teacher explains what the class is going to do
in the meeting
10’
2. Main Activities
a. Teacher explains about the generic structure
and language feature of descriptive text
b. Teacher shows the picture to the students
c. Teacher asks the students to think about the
picture
d. Teacher asks the students to write descriptive
text based on the picture
e. Teacher asks the students to collect their
answer sheet
70’
3. Closing
a. Teacher concludes the material of the lesson
b. Teacher closes the class and reminds the
students to study at home
10’
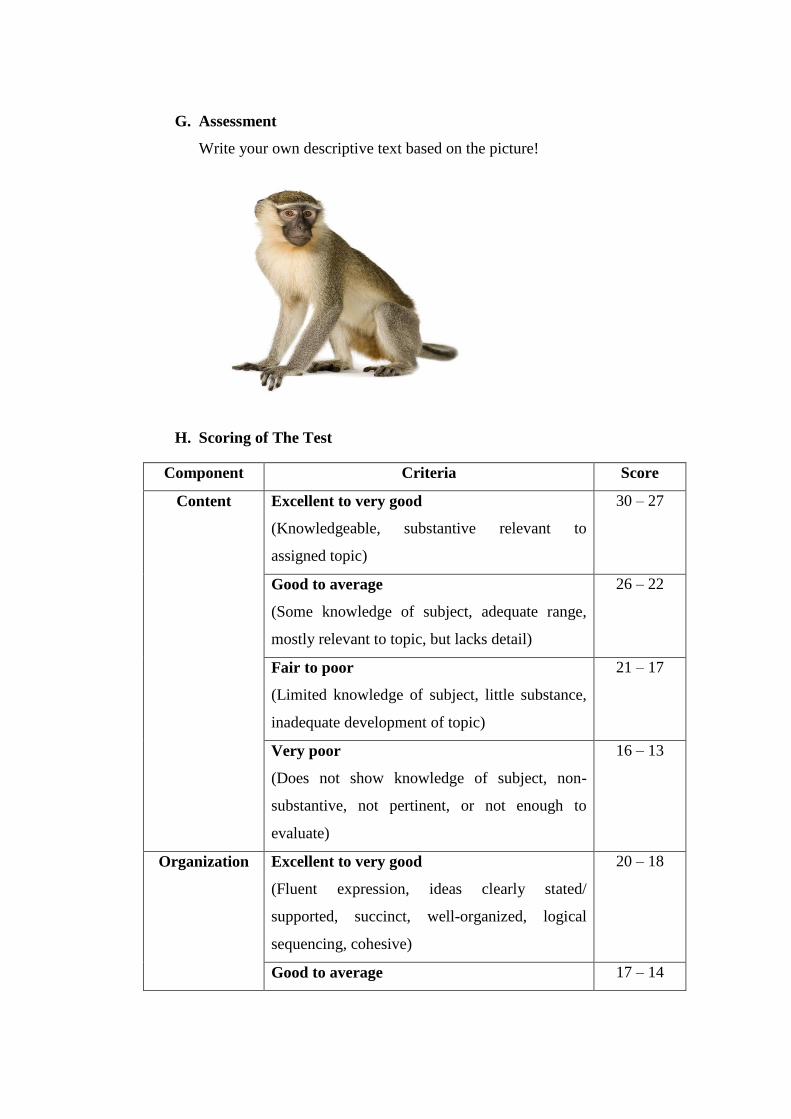
G. Assessment
Write your own descriptive text based on the picture!
H. Scoring of The Test
Component Criteria Score
Content Excellent to very good
(Knowledgeable, substantive relevant to
assigned topic)
30 – 27
Good to average
(Some knowledge of subject, adequate range,
mostly relevant to topic, but lacks detail)
26 – 22
Fair to poor
(Limited knowledge of subject, little substance,
inadequate development of topic)
21 – 17
Very poor
(Does not show knowledge of subject, non-
substantive, not pertinent, or not enough to
evaluate)
16 – 13
Organization Excellent to very good
(Fluent expression, ideas clearly stated/
supported, succinct, well-organized, logical
sequencing, cohesive)
20 – 18
Good to average 17 – 14

(Somewhat choppy, loosely organized but main
ideas stand out, limited support, logical but
incomplete sequencing)
Fair to poor
(Non-fluent, ideas confused or disconnected,
lacks logical sequencing and development)
13 – 10
Very poor
(Does not communicate, no organization, or not
enough to evaluate)
9 – 7
Vocabulary Excellent to very good
(Sophisticated range, effective word/ idiom
choice and usage, word from mastery,
appropriate register)
20 – 18
Good to average
(Adequate range, occasional errors of word/
idiom form, choice, usage but meaning not
obscured)
17 – 14
Fair to poor
(Limited range, frequent errors of word/ idiom
form, choice, usage, meaning confused or
obscured)
13 – 10
Very poor
(Essentially translation, little knowledge of
English vocabulary, idioms, word form, or not
enough to evaluate)
9 – 7
Language Use Excellent to very good
(Effective complex constructions, few errors of
agreement, tense, number, word order/ function,
articles, pronouns, prepositions)
25 – 22
Good to average
(Effective but simple constructions, minor
problems in complex constructions, several
21 – 18
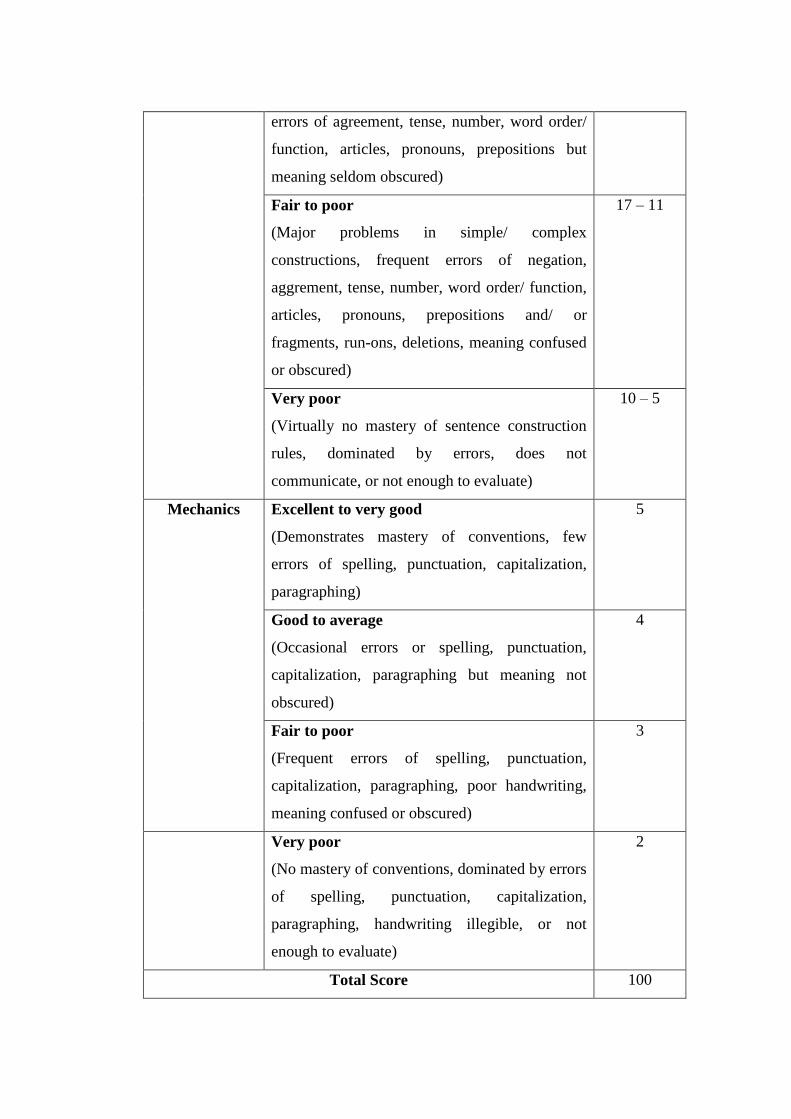
errors of agreement, tense, number, word order/
function, articles, pronouns, prepositions but
meaning seldom obscured)
Fair to poor
(Major problems in simple/ complex
constructions, frequent errors of negation,
aggrement, tense, number, word order/ function,
articles, pronouns, prepositions and/ or
fragments, run-ons, deletions, meaning confused
or obscured)
17 – 11
Very poor
(Virtually no mastery of sentence construction
rules, dominated by errors, does not
communicate, or not enough to evaluate)
10 – 5
Mechanics Excellent to very good
(Demonstrates mastery of conventions, few
errors of spelling, punctuation, capitalization,
paragraphing)
5
Good to average
(Occasional errors or spelling, punctuation,
capitalization, paragraphing but meaning not
obscured)
4
Fair to poor
(Frequent errors of spelling, punctuation,
capitalization, paragraphing, poor handwriting,
meaning confused or obscured)
3
Very poor
(No mastery of conventions, dominated by errors
of spelling, punctuation, capitalization,
paragraphing, handwriting illegible, or not
enough to evaluate)
2
Total Score 100
LESSON PLAN II
(Control Group)
School : MAS PAB Helvetia Medan
Class : X-2
Subject : English
Skill : Writing
Genre : Descriptive Text
Time : 2 x 45 minutes
A. Standard Competence
To understand the meaning of short functional text and simple essay in
forms of descriptive in daily life contextual and in order to access
knowledge.
B. Basic Competence
To respond meaning of essay in written language form accurately, fluency,
and can be accepted in daily life contextual and in order to access
knowledge in descriptive.
C. Indicator
Students are able to produce descriptive text.
D. Teaching Material
DESCRIPTIVE TEXT
Social Function:
The social function of writing descriptive text is to describe a particular
person, place, thing, or animal.
Generic Structure:
1. Identification, which identifies phenomenon that will be describe.

2. Description, which describes about parts, qualities, or characteristic of
something or someone in detail.
Language Features:
1. In Descriptive writing, the present tense is predominantly used. The past
tense is used to describe something in the past.
2. The used of action verbs are needed in describing especially for describing
behaviors.
3. When describing feelings, mental verb are used. Adjective, adverb, and
adverbial phrase are used most often.
The Example:
My Hamster
My hamster’s name is Gigi, and I love her so much, she’s only been in the
family for a short while, but it feels like she’s been here forever! There are so
many words that I can use to describe her with that if somebody were to ask me to
only use three words to describe Gigi it would be really hard to do , but if I had to
I would say she is very loving, adorable, and sweet. I would say those specific
three words because she just is all of those words combined into one very cute
hamster.
I like her small body and soft fur. I also like her face. It’s true she is very
cute!
E. Media
1. Copy of picture and the test
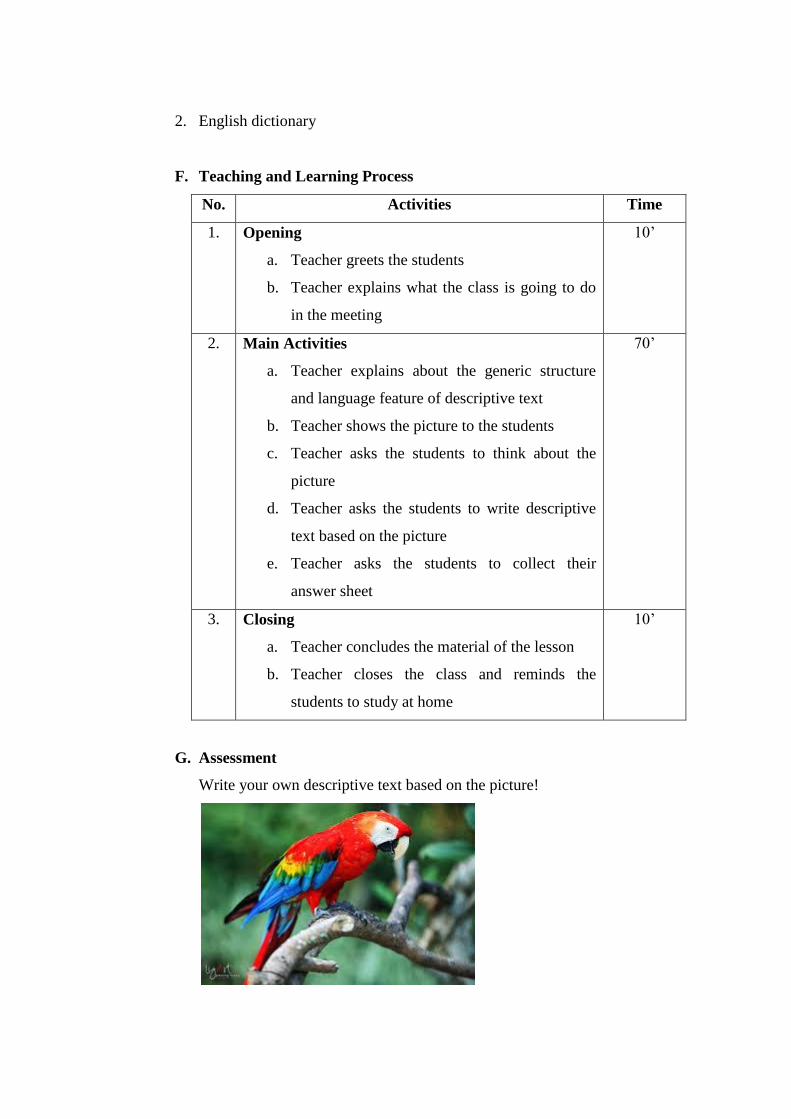
2. English dictionary
F. Teaching and Learning Process
No. Activities Time
1. Opening
a. Teacher greets the students
b. Teacher explains what the class is going to do
in the meeting
10’
2. Main Activities
a. Teacher explains about the generic structure
and language feature of descriptive text
b. Teacher shows the picture to the students
c. Teacher asks the students to think about the
picture
d. Teacher asks the students to write descriptive
text based on the picture
e. Teacher asks the students to collect their
answer sheet
70’
3. Closing
a. Teacher concludes the material of the lesson
b. Teacher closes the class and reminds the
students to study at home
10’
G. Assessment
Write your own descriptive text based on the picture!

H. Scoring of The Test
Component Criteria Score
Content Excellent to very good
(Knowledgeable, substantive relevant to
assigned topic)
30 – 27
Good to average
(Some knowledge of subject, adequate range,
mostly relevant to topic, but lacks detail)
26 – 22
Fair to poor
(Limited knowledge of subject, little substance,
inadequate development of topic)
21 – 17
Very poor
(Does not show knowledge of subject, non-
substantive, not pertinent, or not enough to
evaluate)
16 – 13
Organization Excellent to very good
(Fluent expression, ideas clearly stated/
supported, succinct, well-organized, logical
sequencing, cohesive)
20 – 18
Good to average
(Somewhat choppy, loosely organized but main
ideas stand out, limited support, logical but
incomplete sequencing)
17 – 14
Fair to poor
(Non-fluent, ideas confused or disconnected,
lacks logical sequencing and development)
13 – 10
Very poor
(Does not communicate, no organization, or not
enough to evaluate)
9 – 7
Vocabulary Excellent to very good
(Sophisticated range, effective word/ idiom
20 – 18
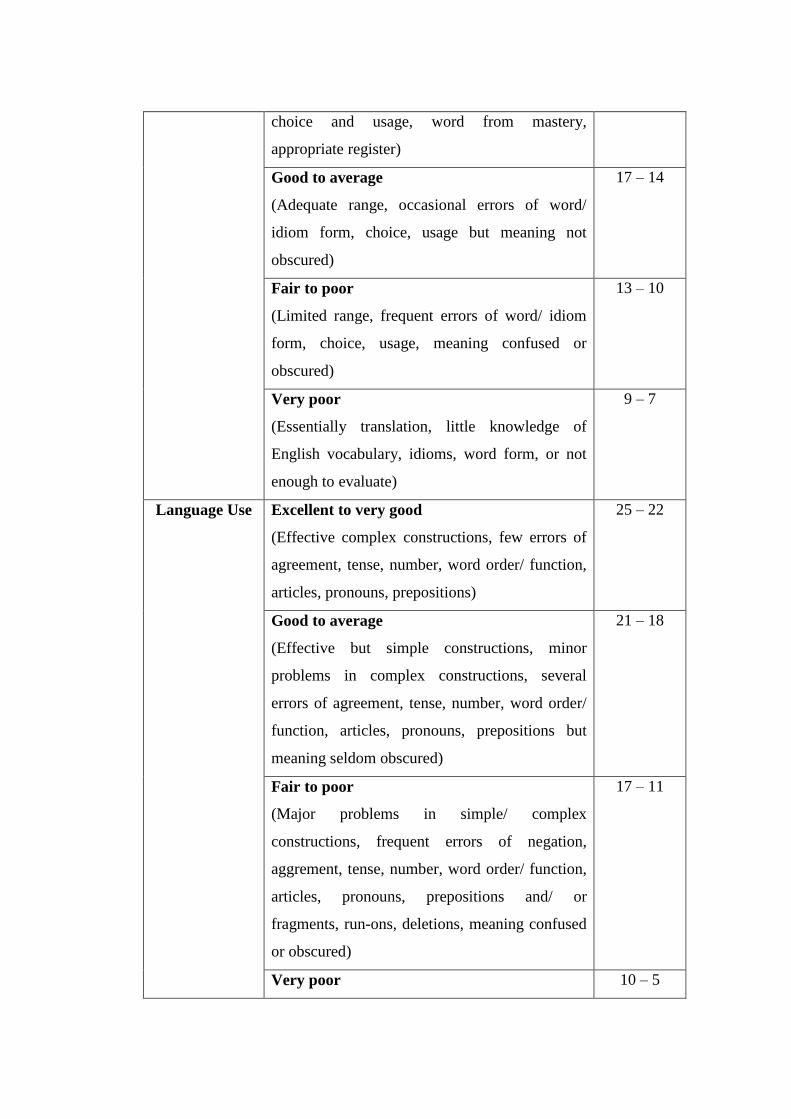
choice and usage, word from mastery,
appropriate register)
Good to average
(Adequate range, occasional errors of word/
idiom form, choice, usage but meaning not
obscured)
17 – 14
Fair to poor
(Limited range, frequent errors of word/ idiom
form, choice, usage, meaning confused or
obscured)
13 – 10
Very poor
(Essentially translation, little knowledge of
English vocabulary, idioms, word form, or not
enough to evaluate)
9 – 7
Language Use Excellent to very good
(Effective complex constructions, few errors of
agreement, tense, number, word order/ function,
articles, pronouns, prepositions)
25 – 22
Good to average
(Effective but simple constructions, minor
problems in complex constructions, several
errors of agreement, tense, number, word order/
function, articles, pronouns, prepositions but
meaning seldom obscured)
21 – 18
Fair to poor
(Major problems in simple/ complex
constructions, frequent errors of negation,
aggrement, tense, number, word order/ function,
articles, pronouns, prepositions and/ or
fragments, run-ons, deletions, meaning confused
or obscured)
17 – 11
Very poor 10 – 5

(Virtually no mastery of sentence construction
rules, dominated by errors, does not
communicate, or not enough to evaluate)
Mechanics Excellent to very good
(Demonstrates mastery of conventions, few
errors of spelling, punctuation, capitalization,
paragraphing)
5
Good to average
(Occasional errors or spelling, punctuation,
capitalization, paragraphing but meaning not
obscured)
4
Fair to poor
(Frequent errors of spelling, punctuation,
capitalization, paragraphing, poor handwriting,
meaning confused or obscured)
3
Very poor
(No mastery of conventions, dominated by errors
of spelling, punctuation, capitalization,
paragraphing, handwriting illegible, or not
enough to evaluate)
2
Total Score 100
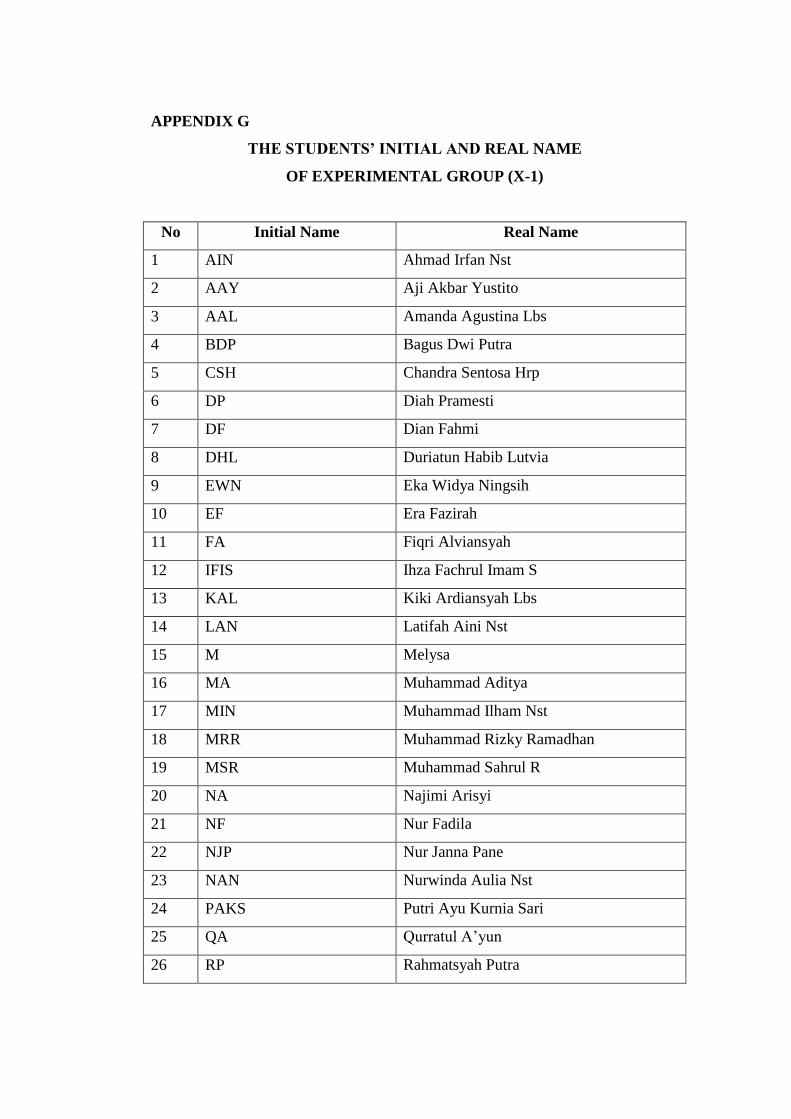
APPENDIX G
THE STUDENTS’ INITIAL AND REAL NAME
OF EXPERIMENTAL GROUP (X-1)
No Initial Name Real Name
1 AIN Ahmad Irfan Nst
2 AAY Aji Akbar Yustito
3 AAL Amanda Agustina Lbs
4 BDP Bagus Dwi Putra
5 CSH Chandra Sentosa Hrp
6 DP Diah Pramesti
7 DF Dian Fahmi
8 DHL Duriatun Habib Lutvia
9 EWN Eka Widya Ningsih
10 EF Era Fazirah
11 FA Fiqri Alviansyah
12 IFIS Ihza Fachrul Imam S
13 KAL Kiki Ardiansyah Lbs
14 LAN Latifah Aini Nst
15 M Melysa
16 MA Muhammad Aditya
17 MIN Muhammad Ilham Nst
18 MRR Muhammad Rizky Ramadhan
19 MSR Muhammad Sahrul R
20 NA Najimi Arisyi
21 NF Nur Fadila
22 NJP Nur Janna Pane
23 NAN Nurwinda Aulia Nst
24 PAKS Putri Ayu Kurnia Sari
25 QA Qurratul A’yun
26 RP Rahmatsyah Putra

27 RL Rudi Luqman
28 SS Safira Sultanah
29 SRAL Siti Rahmah Afroh Lbs
30 S Susanti
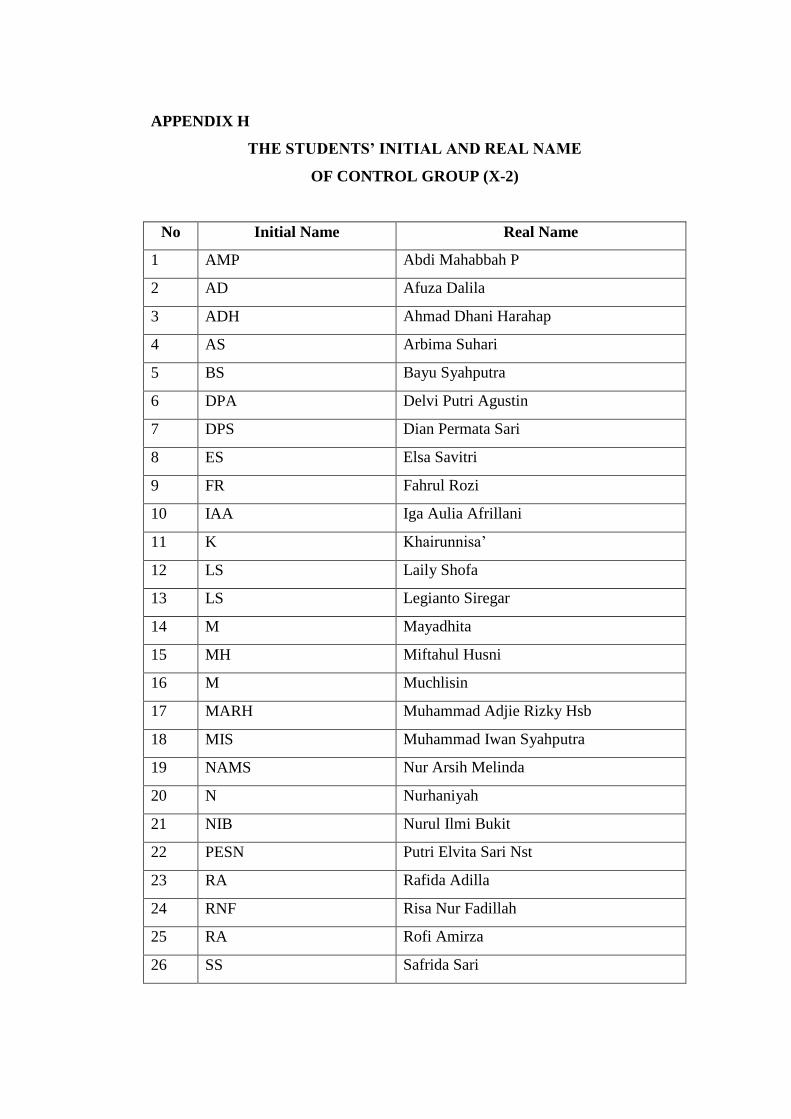
APPENDIX H
THE STUDENTS’ INITIAL AND REAL NAME
OF CONTROL GROUP (X-2)
No Initial Name Real Name
1 AMP Abdi Mahabbah P
2 AD Afuza Dalila
3 ADH Ahmad Dhani Harahap
4 AS Arbima Suhari
5 BS Bayu Syahputra
6 DPA Delvi Putri Agustin
7 DPS Dian Permata Sari
8 ES Elsa Savitri
9 FR Fahrul Rozi
10 IAA Iga Aulia Afrillani
11 K Khairunnisa’
12 LS Laily Shofa
13 LS Legianto Siregar
14 M Mayadhita
15 MH Miftahul Husni
16 M Muchlisin
17 MARH Muhammad Adjie Rizky Hsb
18 MIS Muhammad Iwan Syahputra
19 NAMS Nur Arsih Melinda
20 N Nurhaniyah
21 NIB Nurul Ilmi Bukit
22 PESN Putri Elvita Sari Nst
23 RA Rafida Adilla
24 RNF Risa Nur Fadillah
25 RA Rofi Amirza
26 SS Safrida Sari

27 SR Septian Syahrozy
28 SM Siti Marhamah
29 SN Siti Nurhalizah
30 SR Suci Ramadhani
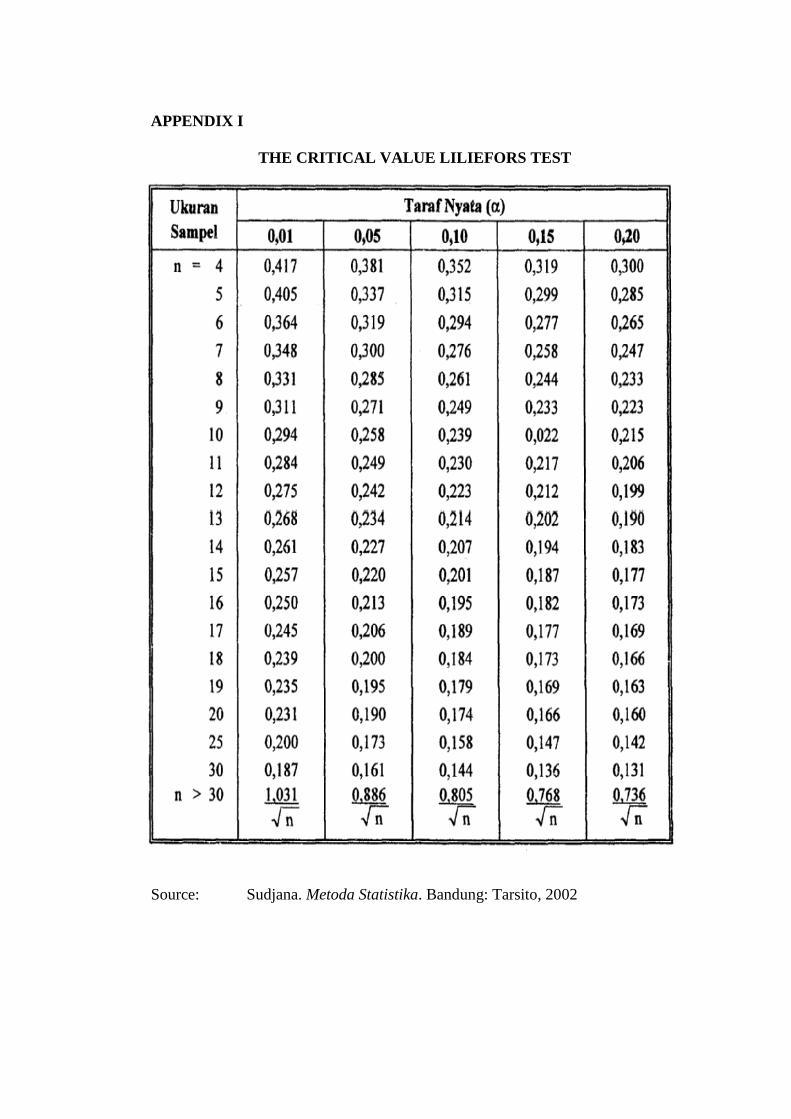
APPENDIX I
THE CRITICAL VALUE LILIEFORS TEST
Source: Sudjana. Metoda Statistika. Bandung: Tarsito, 2002

APPENDIX J
TABLE OF F DISTRIBUTION
(Bilangan Dalam Badan Daftar Menyatakaan:
Fp : Baris Atas untuk p = 0,05 dan Baris Bawah untuk p = 0,01)
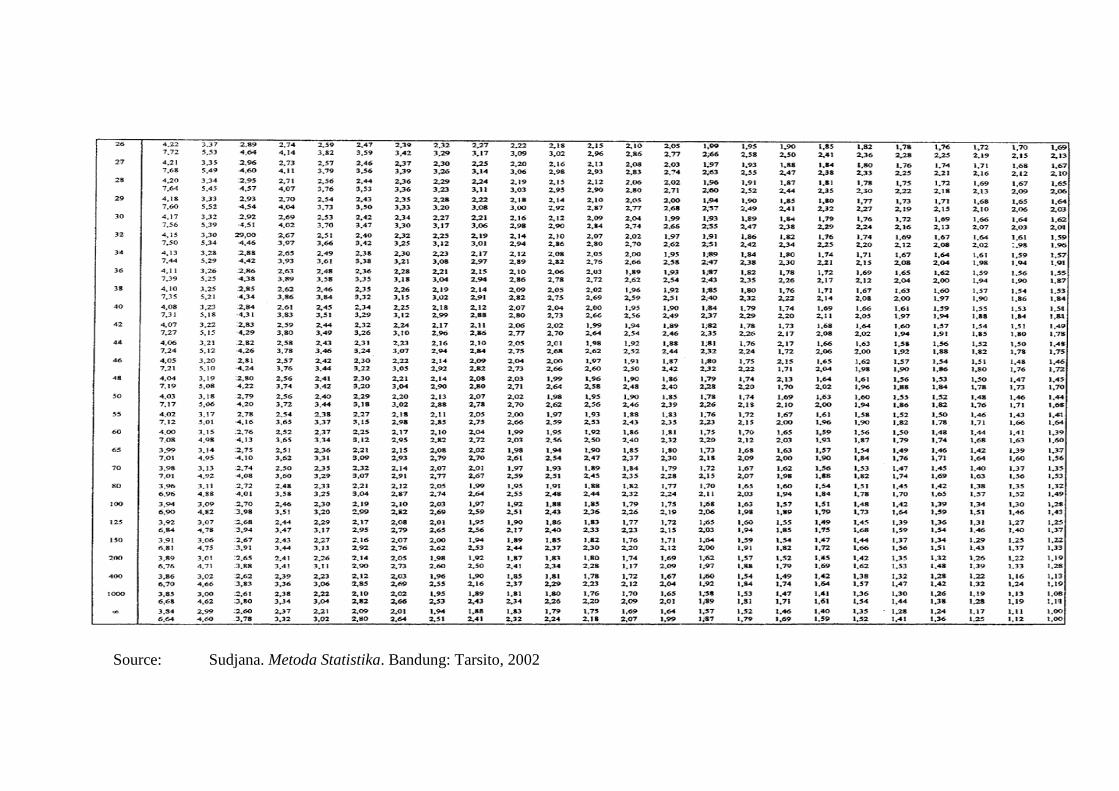
Source: Sudjana. Metoda Statistika. Bandung: Tarsito, 2002
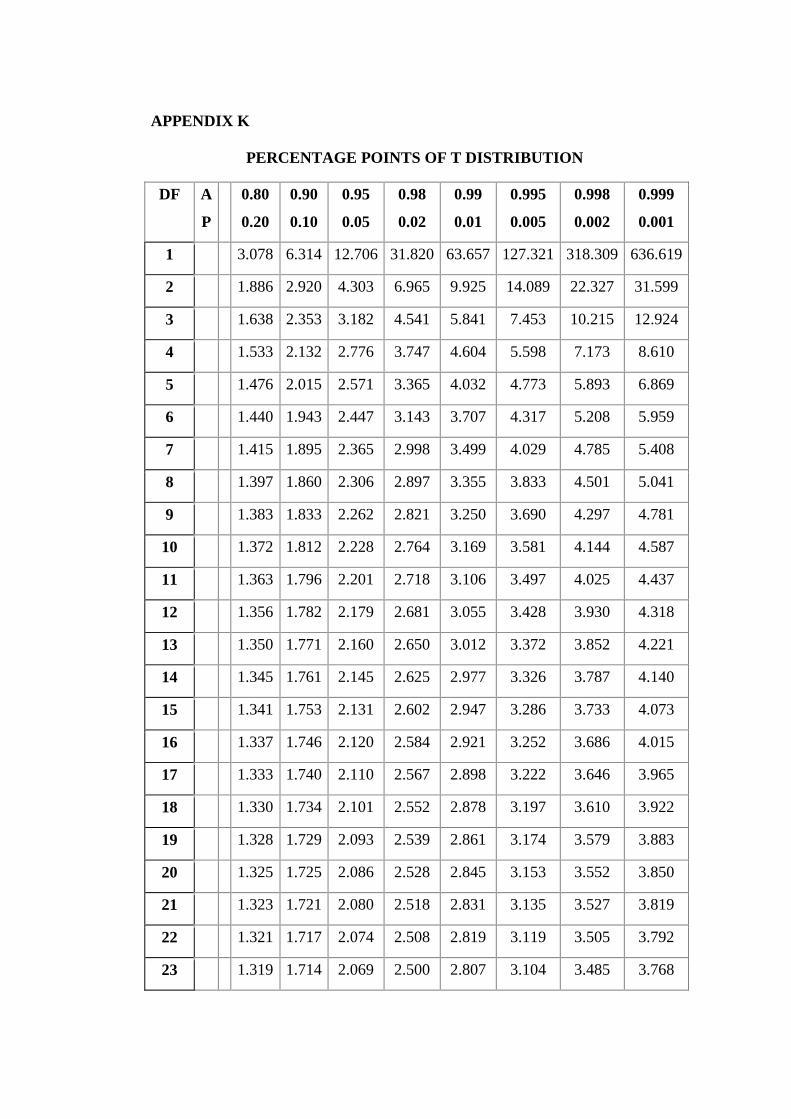
APPENDIX K
PERCENTAGE POINTS OF T DISTRIBUTION
DF A
P
0.80
0.20
0.90
0.10
0.95
0.05
0.98
0.02
0.99
0.01
0.995
0.005
0.998
0.002
0.999
0.001
1 3.078 6.314 12.706 31.820 63.657 127.321 318.309 636.619
2 1.886 2.920 4.303 6.965 9.925 14.089 22.327 31.599
3 1.638 2.353 3.182 4.541 5.841 7.453 10.215 12.924
4 1.533 2.132 2.776 3.747 4.604 5.598 7.173 8.610
5 1.476 2.015 2.571 3.365 4.032 4.773 5.893 6.869
6 1.440 1.943 2.447 3.143 3.707 4.317 5.208 5.959
7 1.415 1.895 2.365 2.998 3.499 4.029 4.785 5.408
8 1.397 1.860 2.306 2.897 3.355 3.833 4.501 5.041
9 1.383 1.833 2.262 2.821 3.250 3.690 4.297 4.781
10 1.372 1.812 2.228 2.764 3.169 3.581 4.144 4.587
11 1.363 1.796 2.201 2.718 3.106 3.497 4.025 4.437
12 1.356 1.782 2.179 2.681 3.055 3.428 3.930 4.318
13 1.350 1.771 2.160 2.650 3.012 3.372 3.852 4.221
14 1.345 1.761 2.145 2.625 2.977 3.326 3.787 4.140
15 1.341 1.753 2.131 2.602 2.947 3.286 3.733 4.073
16 1.337 1.746 2.120 2.584 2.921 3.252 3.686 4.015
17 1.333 1.740 2.110 2.567 2.898 3.222 3.646 3.965
18 1.330 1.734 2.101 2.552 2.878 3.197 3.610 3.922
19 1.328 1.729 2.093 2.539 2.861 3.174 3.579 3.883
20 1.325 1.725 2.086 2.528 2.845 3.153 3.552 3.850
21 1.323 1.721 2.080 2.518 2.831 3.135 3.527 3.819
22 1.321 1.717 2.074 2.508 2.819 3.119 3.505 3.792
23 1.319 1.714 2.069 2.500 2.807 3.104 3.485 3.768
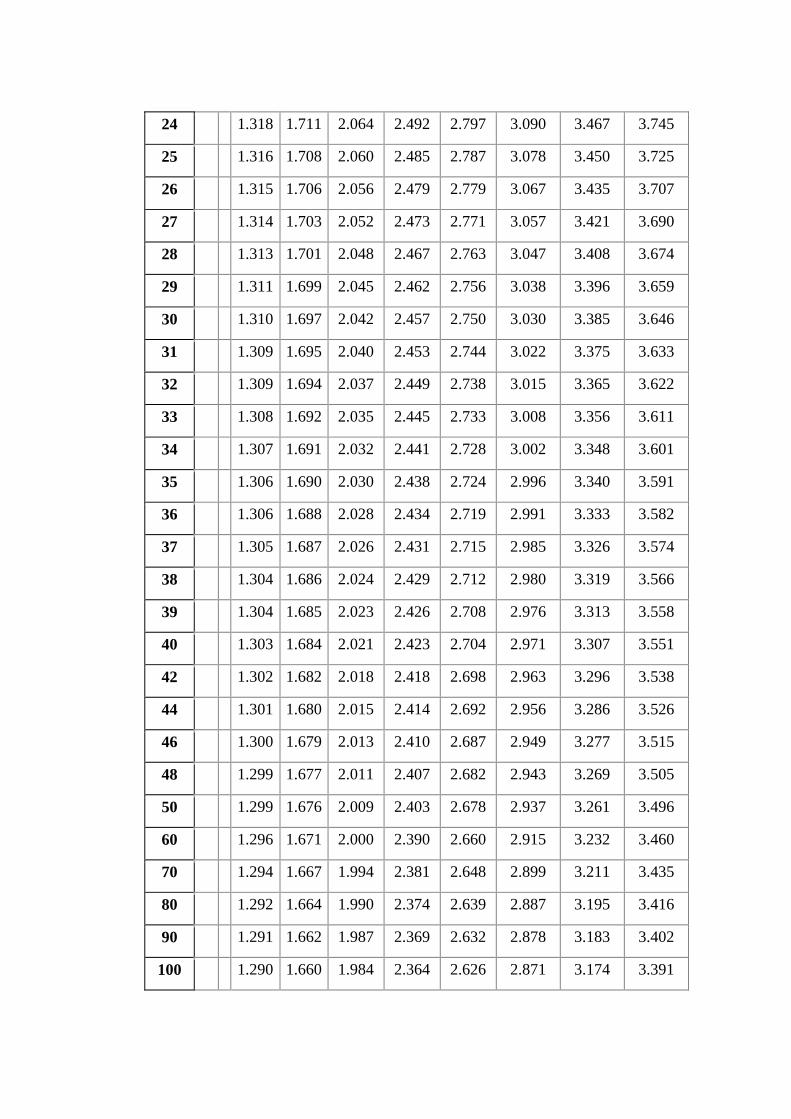
24 1.318 1.711 2.064 2.492 2.797 3.090 3.467 3.745
25 1.316 1.708 2.060 2.485 2.787 3.078 3.450 3.725
26 1.315 1.706 2.056 2.479 2.779 3.067 3.435 3.707
27 1.314 1.703 2.052 2.473 2.771 3.057 3.421 3.690
28 1.313 1.701 2.048 2.467 2.763 3.047 3.408 3.674
29 1.311 1.699 2.045 2.462 2.756 3.038 3.396 3.659
30 1.310 1.697 2.042 2.457 2.750 3.030 3.385 3.646
31 1.309 1.695 2.040 2.453 2.744 3.022 3.375 3.633
32 1.309 1.694 2.037 2.449 2.738 3.015 3.365 3.622
33 1.308 1.692 2.035 2.445 2.733 3.008 3.356 3.611
34 1.307 1.691 2.032 2.441 2.728 3.002 3.348 3.601
35 1.306 1.690 2.030 2.438 2.724 2.996 3.340 3.591
36 1.306 1.688 2.028 2.434 2.719 2.991 3.333 3.582
37 1.305 1.687 2.026 2.431 2.715 2.985 3.326 3.574
38 1.304 1.686 2.024 2.429 2.712 2.980 3.319 3.566
39 1.304 1.685 2.023 2.426 2.708 2.976 3.313 3.558
40 1.303 1.684 2.021 2.423 2.704 2.971 3.307 3.551
42 1.302 1.682 2.018 2.418 2.698 2.963 3.296 3.538
44 1.301 1.680 2.015 2.414 2.692 2.956 3.286 3.526
46 1.300 1.679 2.013 2.410 2.687 2.949 3.277 3.515
48 1.299 1.677 2.011 2.407 2.682 2.943 3.269 3.505
50 1.299 1.676 2.009 2.403 2.678 2.937 3.261 3.496
60 1.296 1.671 2.000 2.390 2.660 2.915 3.232 3.460
70 1.294 1.667 1.994 2.381 2.648 2.899 3.211 3.435
80 1.292 1.664 1.990 2.374 2.639 2.887 3.195 3.416
90 1.291 1.662 1.987 2.369 2.632 2.878 3.183 3.402
100 1.290 1.660 1.984 2.364 2.626 2.871 3.174 3.391

120 1.289 1.658 1.980 2.358 2.617 2.860 3.160 3.373
150 1.287 1.655 1.976 2.351 2.609 2.849 3.145 3.357
200 1.286 1.652 1.972 2.345 2.601 2.839 3.131 3.340
300 1.284 1.650 1.968 2.339 2.592 2.828 3.118 3.323
500 1.283 1.648 1.965 2.334 2.586 2.820 3.107 3.310
1.282 1.645 1.960 2.326 2.576 2.807 3.090 3.291

APPENDIX L
DOCUMENTATION
Pict 1. The students of experimental group are doing pre test
Pict 2. The researcher gives pre test paper to the students of control group

Pict 3. The students of experimental group are making descriptive text by using
Round Robin writing strategy in a group
Pict 4. The researcher asks every group to show their paper

Pict 5. One of the students in a group is writing her ideas
Pict 6. The researcher is giving explanation about descriptive text to the students
of control group

Pict 7. The students of experimental group are doing post test
Pict 8. The students of control group are doing post test