Embed Size (px)
Citation preview

Skills jobseekers need in the modern labour market
Paul BivandAssociate Director of Analysis &
Statistics Inclusion

What is the shape of the labour market as recession
ebbs?Analysed recruitment patterns in
Scotland using Labour Force SurveySince 2011, 707,000 people starting
new jobs in Scotland314,000 a year – on average
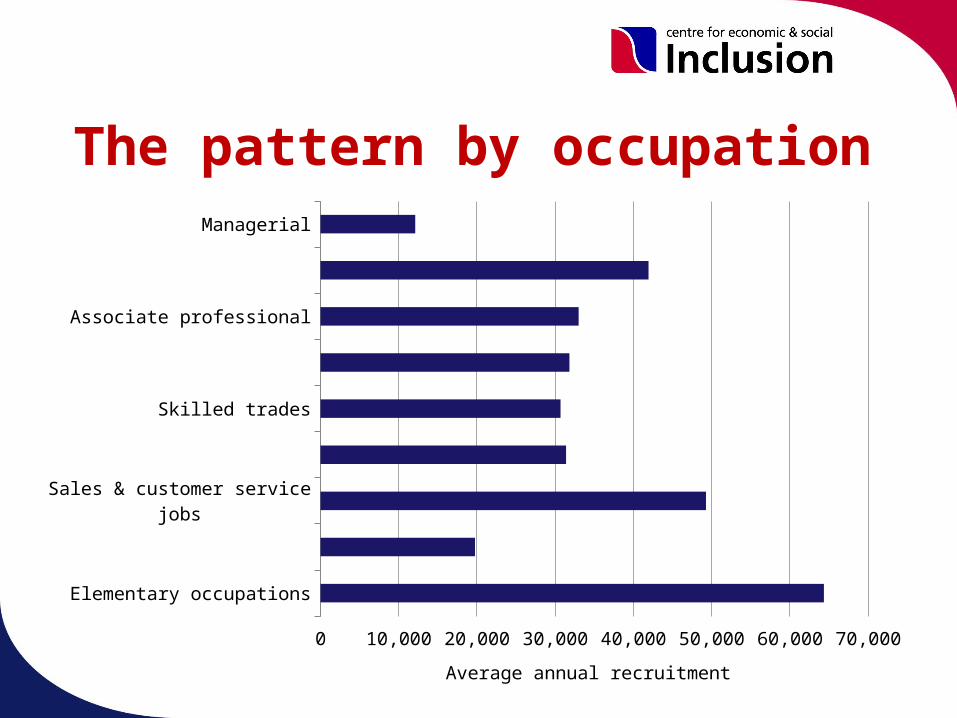
The pattern by occupationManagerial
Professional
Associate professional
Administrative & Secretarial
Skilled trades
Personal services
Sales & customer service jobs
Process & machine operators
Elementary occupations
0 10,000 20,000 30,000 40,000 50,000 60,000 70,000
Average annual recruitment
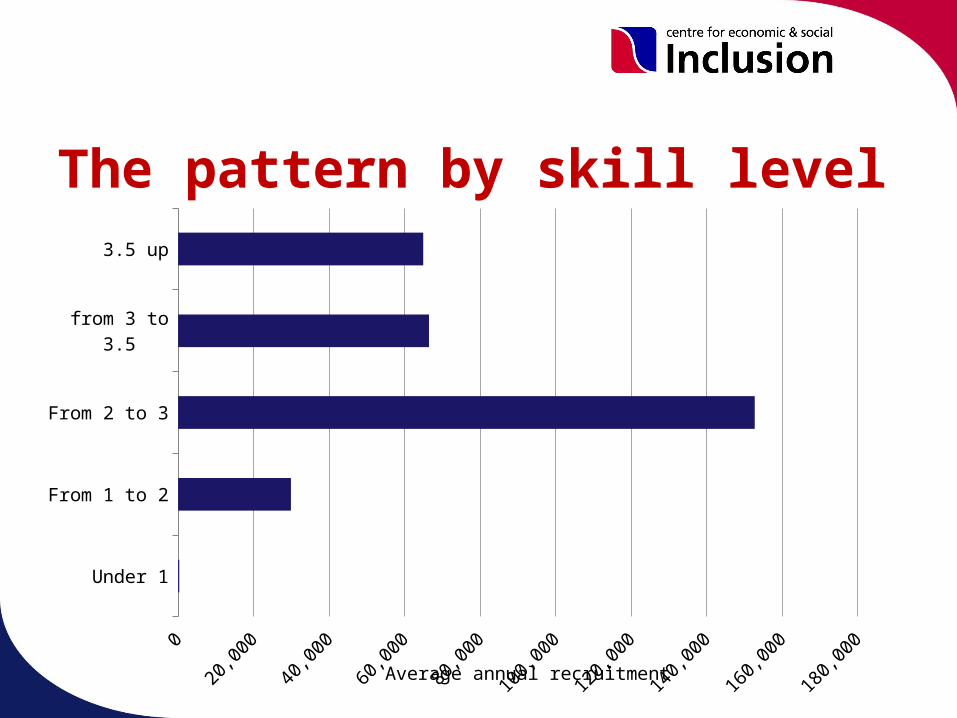
The pattern by skill level3.5 up
from 3 to 3.5
From 2 to 3
From 1 to 2
Under 1
0
20,0
00
40,0
00
60,0
00
80,0
00
100,
000
120,
000
140,
000
160,
000
180,
000
Average annual recruitment

Patterns of recruitmentThe largest occupation groups for
recruitment are (high turnover):
– Elementary jobs– Sales and customer service
But, employers are recruiting at above entry level
64,000 recruits for elementary jobs a year
Only 30,000 people below Level 2 starting work (a year)

Employment rates by qualification
None
SVQ1
SVQ2
Other
Qua
lifica
tions
SVQ3
Trad
e App
rent
icesh
ips
SVQ4+
0%
10%
20%
30%
40%
50%
60%
70%
80%
90%
41%
64% 66% 69% 71%76%
82%

Qualifications of employed and workless
In employment
0% 10% 20% 30% 40% 50% 60% 70% 80% 90% 100%
None SVQ1 SVQ2Other Qualifications SVQ3 Trade ApprenticeshipsSVQ4+
Workless
0% 10% 20% 30% 40% 50% 60% 70% 80% 90% 100%

Vacancy trendsONS vacancy survey doesn’t give
Scotland figuresJobcentre vacancy figures ended
November 2012Universal Jobmatch figures started
straight after

Jobcentre vacancies to November 2012
Sep
2008
Dec 2
008
Mar
200
9
Jun
2009
Sep
2009
Dec 2
009
Mar
201
0
Jun
2010
Sep
2010
Dec 2
010
Mar
201
1
Jun
2011
Sep
2011
Dec 2
011
Mar
201
2
Jun
2012
Sep
2012
0
2,000
4,000
6,000
8,000
10,000
12,000
Weekly notified vacancies: totalWeekly new vacancies Seasonally adjusted

Universal Jobmatch vacancies
Dec 2
012
Jan
2013
Feb
2013
Mar
201
3
Apr 2
013
May
201
3
Jun
2013
Jul 2
013
Aug 2
013
Sep
2013
0
5,000
10,000
15,000
20,000
25,000
30,000
35,000

JCP new vacancies – ratio to new JSA claims (to Nov
2012)
0.0
0.5
1.0
1.5
2.0
2.5
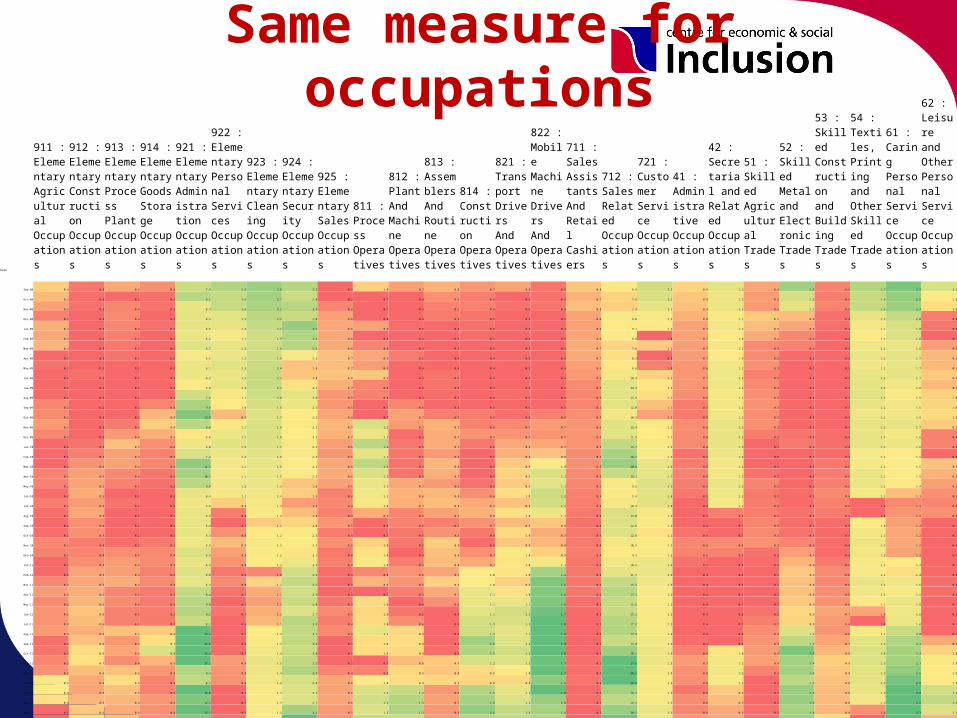
Same measure for occupations
Date
911 : Elementary Agricultural Occupations
912 : Elementary Construction Occupations
913 : Elementary Process Plant Occupations
914 : Elementary Goods Storage Occupations
921 : Elementary Administration Occupations
922 : Elementary Personal Services Occupations
923 : Elementary Cleaning Occupations
924 : Elementary Security Occupations
925 : Elementary Sales Occupations
811 : Process Operatives
812 : Plant And Machine Operatives
813 : Assemblers And Routine Operatives
814 : Construction Operatives
821 : Transport Drivers And Operatives
822 : Mobile Machine Drivers And Operatives
711 : Sales Assistants And Retail Cashiers
712 : Sales Related Occupations
721 : Customer Service Occupations
41 : Administrative Occupations
42 : Secretarial and Related Occupations
51 : Skilled Agricultural Trades
52 : Skilled Metal and Electronic Trades
53 : Skilled Construction and Building Trades
54 : Textiles, Printing and Other Skilled Trades
61 : Caring Personal Service Occupations
62 : Leisure and Other Personal Service Occupations
Sep-08 0.4 0.3 0.4 0.4 7.9 1.9 2.8 3.3 0.1 1.0 0.7 0.8 0.7 0.8 0.5 0.8 8.9 2.2 0.9 1.3 0.4 1.5 0.5 1.7 2.7 1.1
Oct-08 0.3 0.3 0.3 0.3 9.1 1.6 2.7 3.0 0.2 0.7 0.4 0.6 0.6 0.6 0.5 0.7 7.6 2.1 0.9 1.2 0.3 1.2 0.5 1.6 2.5 1.0
Nov-08 0.3 0.3 0.4 0.3 6.4 1.6 2.5 3.3 0.4 0.7 0.4 0.5 0.6 0.6 0.5 0.8 7.3 1.7 0.8 1.3 0.3 1.1 0.5 1.6 2.4 1.0
Dec-08 0.2 0.3 0.4 0.3 6.4 1.3 2.3 3.0 0.6 0.8 0.4 0.5 0.5 0.5 0.5 0.6 9.8 1.3 0.8 1.1 0.5 0.8 0.4 1.2 2.0 0.8
Jan-09 0.3 0.3 0.3 0.3 6.5 1.3 2.1 3.7 0.6 0.9 0.5 0.4 0.5 0.5 0.4 0.6 9.1 1.2 0.7 1.2 0.5 0.7 0.4 1.1 1.8 0.8
Feb-09 0.3 0.2 0.3 0.2 6.2 1.1 1.9 3.4 0.6 0.8 0.4 0.3 0.5 0.4 0.3 0.6 8.9 1.0 0.7 1.0 0.4 0.6 0.4 1.1 1.8 0.7
Mar-09 0.3 0.3 0.3 0.2 6.7 1.3 1.9 3.3 0.6 0.8 0.4 0.3 0.5 0.5 0.3 0.7 7.6 1.1 0.7 1.1 0.3 0.6 0.4 1.2 1.6 0.9
Apr-09 0.2 0.3 0.3 0.3 5.6 1.2 1.9 2.3 0.7 0.9 0.5 0.4 0.4 0.5 0.4 0.7 8.2 0.9 0.7 1.0 0.3 0.5 0.3 1.2 1.7 0.9
May-09 0.2 0.3 0.3 0.3 6.1 1.3 2.0 1.8 0.7 0.9 0.4 0.4 0.4 0.5 0.4 0.6 8.6 1.0 0.6 1.2 0.3 0.5 0.3 1.2 1.7 0.9
Jun-09 0.2 0.3 0.3 0.3 6.2 1.2 2.1 1.8 0.8 0.9 0.4 0.5 0.4 0.6 0.4 0.6 10.3 1.1 0.7 1.2 0.2 0.4 0.3 1.3 1.7 0.9
Jul-09 0.2 0.3 0.2 0.2 5.0 1.3 2.1 2.1 0.7 0.8 0.2 0.5 0.4 0.6 0.3 0.5 12.3 1.1 0.6 1.2 0.3 0.4 0.3 1.3 1.6 0.9
Aug-09 0.2 0.3 0.2 0.2 7.8 1.1 2.0 2.6 0.5 0.8 0.3 0.4 0.4 0.6 0.4 0.5 12.4 1.1 0.6 1.1 0.3 0.4 0.3 1.3 1.5 1.0
Sep-09 0.2 0.2 0.2 0.4 9.8 1.0 1.8 2.5 0.5 0.7 0.6 0.4 0.5 0.6 0.5 0.5 12.0 1.1 0.5 1.2 0.3 0.3 0.3 1.2 1.6 1.0
Oct-09 0.2 0.3 0.2 0.5 12.0 0.9 1.7 2.2 0.6 0.7 0.7 0.5 0.6 0.6 0.6 0.5 10.3 1.1 0.5 1.2 0.3 0.4 0.3 1.2 1.6 1.0
Nov-09 0.3 0.3 0.3 0.6 9.0 1.1 1.8 2.2 0.7 1.2 0.7 0.7 0.6 0.7 0.7 0.6 12.4 1.2 0.6 1.3 0.3 0.5 0.4 1.2 1.7 0.9
Dec-09 0.2 0.3 0.4 0.5 5.0 1.2 1.8 2.2 0.7 1.1 0.5 0.7 0.7 0.7 0.7 0.5 11.9 1.1 0.6 1.3 0.2 0.5 0.4 1.2 1.6 0.8
Jan-10 0.2 0.3 0.5 0.4 6.0 1.3 1.7 2.3 0.6 1.4 0.5 0.7 0.6 0.8 0.7 0.5 15.7 1.3 0.6 1.3 0.1 0.6 0.4 1.3 1.6 0.8
Feb-10 0.1 0.4 0.4 0.3 7.2 1.2 1.6 2.3 0.5 1.1 0.5 0.6 0.5 0.8 0.8 0.5 18.7 1.3 0.5 1.2 0.0 0.5 0.4 1.1 1.5 0.8
Mar-10 0.2 0.4 0.4 0.4 11.3 1.1 1.6 2.2 0.6 1.4 0.5 0.8 0.5 0.9 1.0 0.5 20.0 1.6 0.5 1.2 0.1 0.5 0.5 1.1 1.5 0.9
Apr-10 0.2 0.5 0.4 0.3 10.1 1.1 1.5 2.3 0.6 1.2 0.5 0.7 0.5 0.9 1.2 0.5 15.1 1.7 0.6 1.2 0.2 0.5 0.5 1.2 1.5 0.9
May-10 0.2 0.5 0.3 0.3 9.0 1.2 1.5 1.8 0.6 1.1 0.7 0.6 0.5 0.9 1.1 0.5 9.9 1.9 0.5 1.3 0.3 0.5 0.5 1.2 1.4 0.9
Jun-10 0.2 0.5 0.3 0.2 6.4 1.1 1.4 1.9 0.4 1.1 0.8 0.8 0.6 1.0 1.2 0.4 9.4 1.8 0.5 1.2 0.2 0.5 0.6 1.1 1.3 0.8
Jul-10 0.2 0.5 0.3 0.2 5.9 0.9 1.3 1.5 0.4 1.0 0.7 0.8 0.7 0.9 1.2 0.4 10.3 1.8 0.4 1.1 0.2 0.5 0.5 1.0 1.1 0.8
Aug-10 0.2 0.5 0.2 0.2 6.2 0.8 1.2 1.8 0.4 0.9 0.6 0.7 0.8 1.0 1.1 0.4 13.0 1.3 0.5 0.8 0.2 0.5 0.5 1.0 1.2 0.8
Sep-10 0.2 0.4 0.2 0.2 6.4 0.7 1.1 2.0 0.5 0.8 0.6 0.5 0.7 0.9 0.9 0.4 12.6 1.2 0.4 0.7 0.3 0.5 0.4 1.0 1.2 0.7
Oct-10 0.2 0.4 0.2 0.2 6.4 0.8 1.2 2.3 0.4 0.7 0.5 0.6 0.6 1.0 0.7 0.4 12.6 1.1 0.5 0.7 0.3 0.5 0.4 1.1 1.2 0.7
Nov-10 0.2 0.4 0.3 0.3 5.9 0.9 1.3 2.2 0.5 1.0 0.5 0.9 0.5 0.9 0.8 0.4 10.2 1.2 0.6 0.8 0.3 0.6 0.4 1.2 1.2 0.7
Dec-10 0.2 0.4 0.4 0.4 6.9 0.8 1.2 2.1 0.4 1.0 0.4 0.8 0.7 1.0 0.9 0.4 9.3 1.2 0.6 0.8 0.2 0.7 0.4 1.2 1.2 0.7
Jan-11 0.1 0.4 0.4 0.4 6.4 0.8 1.2 2.5 0.4 1.0 0.5 0.8 0.7 1.0 1.1 0.4 10.5 1.6 0.5 0.8 0.2 0.8 0.5 1.1 1.4 0.7
Feb-11 0.2 0.5 0.4 0.3 6.8 0.8 1.0 2.9 0.3 0.8 0.6 0.7 1.0 1.0 1.4 0.4 11.7 1.6 0.4 0.6 0.1 0.9 0.6 1.1 1.4 0.8
Mar-11 0.2 0.5 0.4 0.4 6.3 0.8 1.1 3.1 0.3 0.9 0.6 0.9 1.0 0.9 1.6 0.4 15.5 1.5 0.4 0.6 0.1 0.8 0.6 1.2 1.6 0.8
Apr-11 0.3 0.5 0.3 0.3 8.4 0.7 1.1 2.9 0.2 0.7 0.5 0.7 1.1 1.0 1.6 0.4 17.1 1.2 0.4 0.7 0.1 0.8 0.6 1.2 1.5 0.8
May-11 0.2 0.5 0.4 0.3 9.0 0.7 1.1 3.0 0.3 1.0 0.4 0.6 1.1 1.1 1.6 0.3 15.5 1.2 0.4 0.7 0.1 0.9 0.6 1.1 1.6 0.7
Jun-11 0.3 0.6 0.3 0.3 9.2 0.7 1.1 2.7 0.5 1.0 0.5 0.4 1.1 1.2 1.7 0.3 15.2 1.3 0.4 0.8 0.2 0.9 0.7 1.0 1.6 0.7
Jul-11 0.3 0.6 0.3 0.3 8.1 0.6 1.1 3.3 0.4 1.0 0.6 0.4 1.3 1.2 1.8 0.3 17.2 1.3 0.4 0.7 0.2 0.9 0.6 1.0 1.6 0.7
Aug-11 0.3 0.5 0.5 0.6 16.2 0.7 1.2 3.1 0.4 1.1 0.9 0.4 1.3 1.1 1.9 0.2 17.5 1.4 0.4 0.8 0.3 1.2 0.6 1.1 2.0 0.7
Sep-11 0.2 0.6 0.4 0.7 24.0 0.6 1.3 3.2 0.1 1.0 0.9 0.4 1.6 1.2 1.9 0.2 15.0 1.4 0.5 0.8 0.3 1.3 0.7 1.3 2.2 0.9
Oct-11 0.2 0.6 0.4 0.8 25.4 0.7 1.4 3.0 0.1 1.0 0.9 0.5 1.5 1.2 2.0 0.3 20.1 1.5 0.6 1.0 0.4 1.6 0.8 1.4 2.3 1.0
Nov-11 0.2 0.7 0.4 0.5 17.2 0.8 1.5 3.2 0.1 0.7 0.8 0.9 1.2 1.2 1.7 0.3 27.6 1.5 0.7 1.2 0.4 1.4 0.9 1.3 2.3 1.0
Dec-11 0.2 0.6 0.5 0.4 9.4 0.8 1.4 3.4 0.4 0.8 0.9 0.8 0.9 1.0 1.7 0.4 30.2 1.4 0.6 1.2 0.2 1.4 0.8 1.3 2.5 1.0
Jan-12 0.5 0.5 0.5 0.3 8.7 0.8 1.4 2.8 0.6 1.0 0.9 0.9 0.9 0.9 1.5 0.4 26.6 1.3 0.6 1.1 0.1 1.3 0.8 1.3 2.8 1.0
Feb-12 0.4 0.5 0.5 0.3 14.0 0.7 1.3 2.7 0.6 1.2 1.2 0.6 1.5 1.1 1.8 0.3 19.1 1.3 0.5 0.9 0.1 1.5 0.8 1.2 3.0 1.2
Mar-12 0.4 0.5 0.4 0.4 12.2 0.7 1.3 2.7 0.6 1.3 1.3 0.7 1.5 1.2 1.5 0.3 16.3 1.3 0.6 0.9 0.1 1.5 0.8 1.2 3.2 1.2
Apr-12 0.1 0.6 0.4 0.4 13.7 0.7 1.3 3.5 0.5 1.2 1.3 0.6 1.6 1.3 1.4 0.3 20.5 1.5 0.6 0.9 0.2 1.4 0.8 1.0 3.3 1.1
May-12 0.1 0.6 0.5 0.4 12.0 0.7 1.2 4.6 0.5 1.3 1.2 0.7 1.5 1.3 1.4 0.3 24.5 1.5 0.7 0.9 0.2 1.5 0.9 0.9 3.3 0.9
Jun-12 0.1 0.7 0.5 0.4 16.1 0.8 1.3 5.3 0.5 1.3 1.2 0.7 1.6 1.5 1.6 0.3 25.4 1.8 0.8 1.0 0.2 1.6 1.0 0.9 3.3 0.8
Jul-12 0.2 0.7 0.4 0.4 27.6 0.8 1.2 4.3 0.4 1.2 1.1 0.6 1.9 1.7 2.1 0.2 15.0 1.8 0.9 1.0 0.3 1.8 1.2 1.0 3.4 0.8
Aug-12 0.3 0.7 0.3 0.5 25.9 0.6 1.1 3.0 0.2 0.6 0.9 0.4 1.8 2.2 2.5 0.2 17.8 1.8 0.9 1.2 0.3 1.6 1.1 1.0 3.4 0.8
Sep-12 0.2 0.7 0.3 0.6 26.4 0.5 1.1 2.5 0.0 0.8 0.7 0.3 1.9 2.6 2.5 0.2 22.6 2.1 0.9 1.2 0.4 1.6 1.2 1.0 3.5 0.8
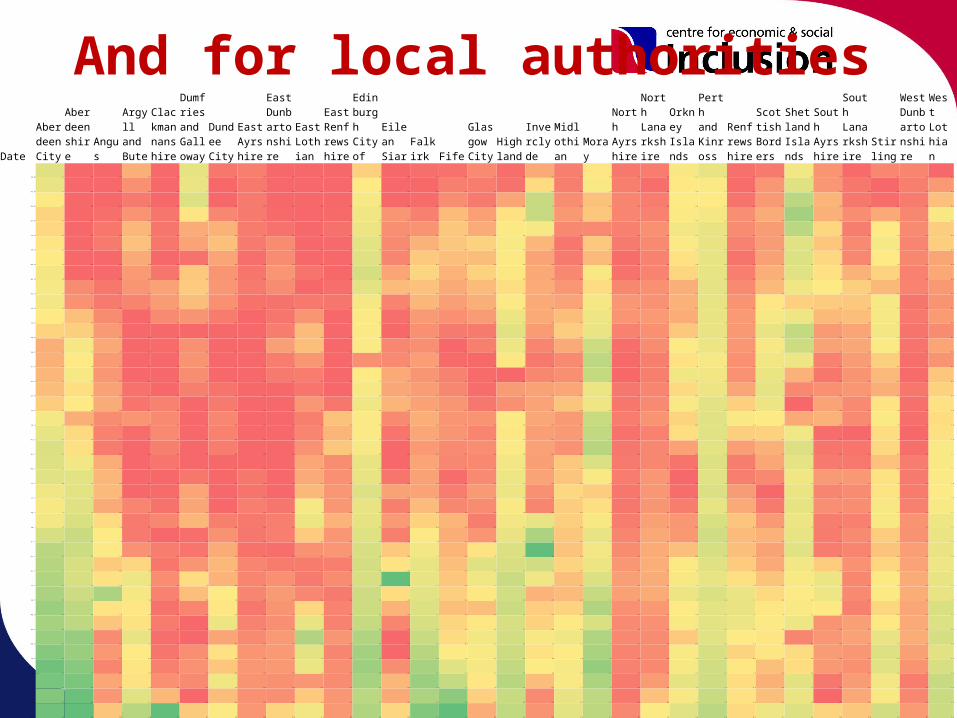
And for local authorities
Date
Aberdeen City
Aberdeenshire
Angus
Argyll and Bute
Clackmannanshire
Dumfries and Galloway
Dundee City
East Ayrshire
East Dunbartonshire
East Lothian
East Renfrewshire
Edinburgh City of
Eilean Siar
Falkirk Fife
Glasgow City
Highland
Inverclyde
Midlothian
Moray
North Ayrshire
North Lanarkshire
Orkney Islands
Perth and Kinross
Renfrewshire
Scottish Borders
Shetland Islands
South Ayrshire
South Lanarkshire
Stirling
West Dunbartonshire
West Lothian
Sep-09 2.1 0.7 0.6 0.9 0.4 1.1 0.8 0.5 0.4 0.5 0.3 1.1 0.5 0.5 0.6 0.7 0.8 0.6 0.6 1.0 0.4 0.6 1.1 1.3 0.5 0.5 1.1 0.8 0.6 0.7 0.4 0.6
Oct-09 1.9 0.6 0.5 0.8 0.4 1.1 0.7 0.4 0.5 0.5 0.3 1.1 0.5 0.5 0.6 0.7 0.8 0.9 0.6 1.0 0.4 0.5 1.0 1.1 0.5 0.7 1.4 0.8 0.6 0.6 0.4 0.8
Nov-09 1.7 0.6 0.5 0.7 0.4 1.1 0.7 0.4 0.4 0.6 0.3 1.2 0.5 0.5 0.7 0.7 0.9 1.4 0.6 0.9 0.4 0.6 1.0 1.1 0.5 0.7 1.8 0.9 0.6 0.6 0.3 0.9
Dec-09 1.5 0.7 0.6 0.8 0.5 1.0 0.8 0.5 0.5 0.7 0.4 1.2 0.7 0.6 0.8 0.8 1.0 1.4 0.7 0.9 0.4 0.6 1.0 1.2 0.6 0.8 2.0 0.9 0.7 0.8 0.4 1.1
Jan-10 1.6 0.7 0.6 0.9 0.5 0.9 0.9 0.5 0.5 0.6 0.4 1.3 0.7 0.7 0.9 0.8 1.0 1.1 0.6 0.8 0.4 0.6 1.1 1.3 0.6 0.7 1.7 1.0 0.6 1.0 0.4 0.9
Feb-10 1.6 0.7 0.6 0.9 0.5 0.9 0.9 0.5 0.6 0.6 0.4 1.3 0.6 0.8 0.9 0.9 1.0 0.7 0.5 0.9 0.4 0.6 1.1 1.3 0.6 0.7 1.3 0.9 0.7 1.1 0.4 0.9
Mar-10 1.6 0.7 0.6 0.8 0.4 0.8 0.9 0.4 0.6 0.6 0.3 1.4 0.6 0.9 0.9 0.9 1.0 0.6 0.5 0.9 0.3 0.6 1.0 1.3 0.5 0.7 1.4 1.0 0.7 1.0 0.4 0.8
Apr-10 1.8 0.8 0.6 0.8 0.5 0.9 0.8 0.4 0.7 0.7 0.3 1.5 0.7 0.9 0.8 0.9 1.0 0.6 0.6 1.0 0.3 0.6 0.9 1.3 0.6 0.8 1.3 1.0 0.8 0.9 0.4 0.8
May-10 1.8 0.8 0.6 0.8 0.7 0.9 0.8 0.4 0.6 0.7 0.4 1.3 0.8 0.8 0.8 0.9 1.0 0.6 0.7 1.0 0.5 0.6 0.7 1.3 0.6 0.8 1.2 1.0 0.9 0.9 0.4 0.8
Jun-10 1.8 0.9 0.6 0.7 0.6 0.9 0.8 0.4 0.5 0.7 0.4 1.2 0.6 0.8 0.7 0.8 1.0 0.6 0.7 1.1 0.5 0.6 0.7 1.3 0.7 1.0 1.0 0.9 0.9 1.1 0.3 0.7
Jul-10 1.7 0.9 0.7 0.7 0.6 0.8 0.8 0.4 0.5 0.8 0.3 1.1 0.5 0.7 0.7 0.8 1.1 0.6 0.8 1.1 0.5 0.7 0.7 1.3 0.7 1.1 1.2 0.9 0.8 1.1 0.3 0.8
Aug-10 1.5 1.0 0.7 0.6 0.4 0.8 0.7 0.3 0.6 0.9 0.3 1.1 0.5 0.6 0.6 0.7 1.2 0.5 0.9 1.1 0.4 0.6 0.9 1.3 0.7 1.2 1.6 0.8 0.8 1.2 0.3 0.7
Sep-10 1.4 1.1 0.8 0.5 0.4 0.8 0.6 0.3 0.7 0.9 0.2 1.1 0.6 0.6 0.6 0.7 1.1 0.4 0.7 1.3 0.3 0.6 1.0 1.2 0.7 1.1 1.5 0.8 0.8 1.0 0.3 0.8
Oct-10 1.4 1.0 0.7 0.6 0.4 0.8 0.6 0.3 0.6 0.8 0.2 1.0 0.6 0.7 0.6 0.7 1.0 0.3 0.6 1.3 0.3 0.6 1.0 1.2 0.6 1.1 1.2 0.7 0.7 0.9 0.3 0.7
Nov-10 1.4 1.1 0.7 0.6 0.4 0.8 0.7 0.3 0.6 0.7 0.2 1.1 0.7 0.7 0.6 0.7 0.8 0.4 0.6 1.3 0.3 0.6 1.2 1.2 0.6 1.2 0.9 0.7 0.7 0.9 0.3 0.9
Dec-10 1.4 1.0 0.8 0.7 0.4 0.8 0.8 0.3 0.5 0.7 0.4 1.2 0.7 0.7 0.7 0.7 0.9 0.6 0.7 1.1 0.4 0.6 0.9 1.2 0.7 1.2 0.8 0.8 0.7 0.8 0.3 0.9
Jan-11 1.5 1.0 0.8 0.7 0.5 0.7 0.8 0.3 0.5 0.8 0.4 1.2 0.8 0.7 0.7 0.7 0.9 0.6 0.8 1.1 0.4 0.6 1.1 1.3 0.9 1.2 0.8 0.8 0.7 1.0 0.3 1.0
Feb-11 1.8 0.9 0.7 0.8 0.6 0.7 0.8 0.3 0.4 0.8 0.8 1.1 0.6 0.8 0.7 0.8 1.0 0.6 0.7 1.3 0.4 0.6 0.9 1.4 1.0 1.0 0.9 0.9 0.7 1.0 0.3 1.0
Mar-11 2.0 1.0 0.7 0.7 0.6 0.6 0.8 0.3 0.4 0.8 0.7 1.1 0.6 0.7 0.7 0.7 1.0 0.6 0.7 1.3 0.3 0.6 1.0 1.4 0.9 0.9 1.1 0.7 0.5 1.0 0.2 1.0
Apr-11 2.1 1.0 0.6 0.6 0.5 0.7 0.8 0.3 0.4 0.8 0.8 1.2 0.5 0.7 0.7 0.8 1.0 0.6 0.6 1.4 0.4 0.6 0.7 1.3 0.7 0.8 1.4 0.7 0.6 0.9 0.3 1.1
May-11 2.1 1.1 0.8 0.5 0.5 0.7 0.7 0.3 0.4 0.8 0.5 1.3 0.5 0.7 0.7 0.7 1.1 0.6 0.9 1.2 0.4 0.6 0.5 1.4 0.6 0.7 1.3 0.7 0.6 0.9 0.4 1.1
Jun-11 2.0 1.2 0.8 0.5 0.4 0.8 0.7 0.4 0.4 0.9 0.6 1.3 0.6 0.7 0.6 0.7 1.1 0.6 0.9 1.0 0.4 0.7 0.4 1.4 0.6 0.6 1.2 0.8 0.7 1.0 0.3 1.0
Jul-11 1.9 1.2 0.8 0.6 0.4 0.9 0.7 0.4 0.5 0.9 0.6 1.4 0.7 0.7 0.6 0.8 1.2 0.5 0.9 0.9 0.4 0.7 0.4 1.4 0.7 0.5 1.2 0.7 0.7 1.0 0.3 1.0
Aug-11 1.8 1.2 0.8 0.7 0.5 0.9 0.7 0.5 0.5 1.0 0.6 1.3 0.6 0.8 0.7 0.7 1.0 0.4 0.9 1.0 0.4 0.7 0.5 1.3 0.7 0.5 1.3 0.8 0.7 1.1 0.4 1.1
Sep-11 1.8 1.2 1.0 0.7 0.6 0.9 0.8 0.4 0.6 1.1 0.7 1.3 0.7 0.9 0.8 0.7 1.1 1.2 0.9 1.0 0.4 0.7 0.6 1.5 0.9 0.7 1.2 0.7 0.6 1.1 0.5 1.2
Oct-11 2.2 1.3 1.0 0.7 0.4 0.8 0.8 0.4 0.6 0.9 0.6 1.4 0.6 1.0 0.8 0.8 1.2 1.6 0.9 1.1 0.5 0.7 0.6 1.6 0.8 0.8 1.3 0.7 0.7 0.9 0.5 1.2
Nov-11 2.6 1.3 1.0 0.8 0.5 0.8 0.9 0.4 0.5 0.8 0.6 1.4 0.9 1.1 0.8 1.0 1.3 2.2 0.8 1.1 0.5 0.7 0.8 1.5 0.8 0.7 1.3 0.7 0.6 0.9 0.6 1.2
Dec-11 2.7 1.3 0.9 1.0 0.5 0.9 0.9 0.5 0.6 0.7 0.5 1.5 0.9 1.1 0.9 1.3 1.3 1.3 0.9 1.1 0.5 0.8 1.0 1.4 0.9 0.7 1.1 0.9 0.7 0.9 0.6 1.2
Jan-12 2.7 1.2 1.0 1.1 0.6 1.0 0.9 0.5 0.6 0.7 0.5 1.5 1.1 1.1 0.9 1.1 1.4 1.1 0.8 1.2 0.6 0.7 1.1 1.3 1.0 0.9 1.1 1.1 0.7 1.0 0.6 1.2
Feb-12 2.8 1.3 1.1 1.0 0.5 0.9 1.0 0.5 0.7 0.8 0.4 1.5 0.9 1.2 0.9 1.0 1.4 0.7 0.8 1.3 0.6 0.7 1.2 1.4 1.1 0.9 1.0 1.1 0.7 1.1 0.6 1.2
Mar-12 3.0 1.4 1.0 1.0 0.5 0.8 1.0 0.4 0.7 1.0 0.5 1.5 0.8 1.2 0.9 0.9 1.4 0.8 0.9 1.4 0.5 0.7 1.0 1.3 1.1 1.0 1.1 1.0 0.6 0.9 0.6 1.3
Apr-12 2.9 1.4 0.9 1.0 0.5 0.7 1.1 0.5 0.6 1.1 0.5 1.6 0.6 1.2 0.9 1.0 1.3 0.9 1.0 1.2 0.5 0.6 1.1 1.3 1.1 1.0 1.2 0.8 0.7 1.0 0.6 1.3
May-12 3.1 1.7 0.7 1.1 0.4 0.7 0.9 0.5 0.7 1.3 0.6 1.8 0.5 1.3 0.9 1.1 1.4 1.1 1.1 1.4 0.5 0.6 0.9 1.4 1.0 1.0 0.8 0.8 0.7 1.3 0.6 1.4
Jun-12 3.3 1.6 0.7 1.0 0.5 0.8 1.0 0.6 0.7 1.1 0.5 1.9 0.5 1.4 1.0 1.1 1.4 1.0 1.0 1.4 0.4 0.6 1.1 1.5 0.9 1.0 1.0 0.8 0.7 1.4 0.6 1.3
Jul-12 3.6 1.7 0.7 1.0 0.5 0.8 0.9 0.6 0.7 1.1 0.5 2.0 0.6 1.5 1.1 1.1 1.5 1.0 1.1 1.6 0.4 0.6 1.1 1.5 1.0 0.8 1.0 0.8 0.7 1.4 0.5 1.4
Aug-12 3.5 1.8 0.8 1.0 0.6 0.8 1.0 0.6 0.6 0.8 0.5 1.9 0.8 1.6 1.2 1.0 1.6 0.7 1.1 1.4 0.4 0.7 1.3 1.6 0.9 0.8 1.3 0.7 0.7 1.2 0.4 1.5
Sep-12 3.3 1.9 0.7 1.1 0.8 0.8 0.9 0.6 0.6 0.9 0.6 1.7 0.7 1.5 1.4 0.9 1.4 0.5 1.2 1.3 0.4 0.8 1.1 1.6 1.0 0.8 1.2 0.7 0.8 1.1 0.4 1.5
Oct-12 3.6 2.3 0.9 1.2 1.8 0.9 1.0 0.6 0.9 1.1 0.6 1.8 0.9 1.7 1.6 0.8 1.5 0.5 1.2 1.4 0.5 1.0 1.4 1.8 0.9 1.1 1.4 0.9 0.9 1.6 0.5 1.5

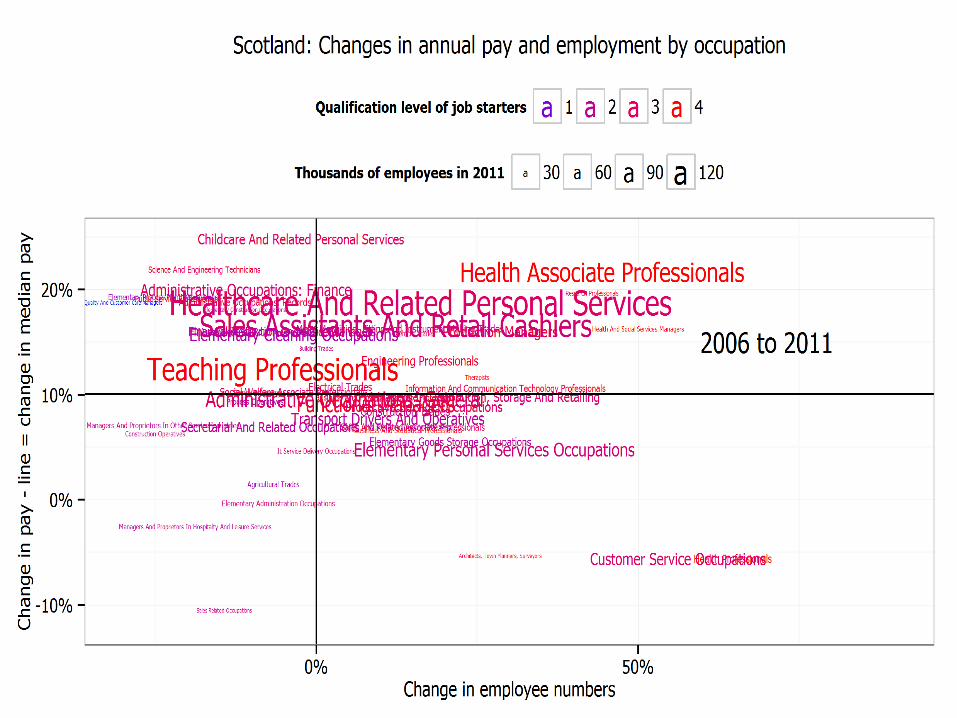
Longer term changesWe’ve looked at changes in both the
numbers employed and in the pay levels
Reflecting employer responses to their labour market
5 years up to classification change in 2011
Occupations coloured by skill level of recruits
Next stepsNot simply a story of employment
growth only for highly skilledBut occupation match to skill level
confused by:– Students working in elementary and
sales– Part-time jobs at similar levels– Part-timers often working below their
own skill levelEast and North doing better than
West