Embed Size (px)
Citation preview
Sketch-to-Scale Solutions™
Investor PresentationSeptember 2017
1
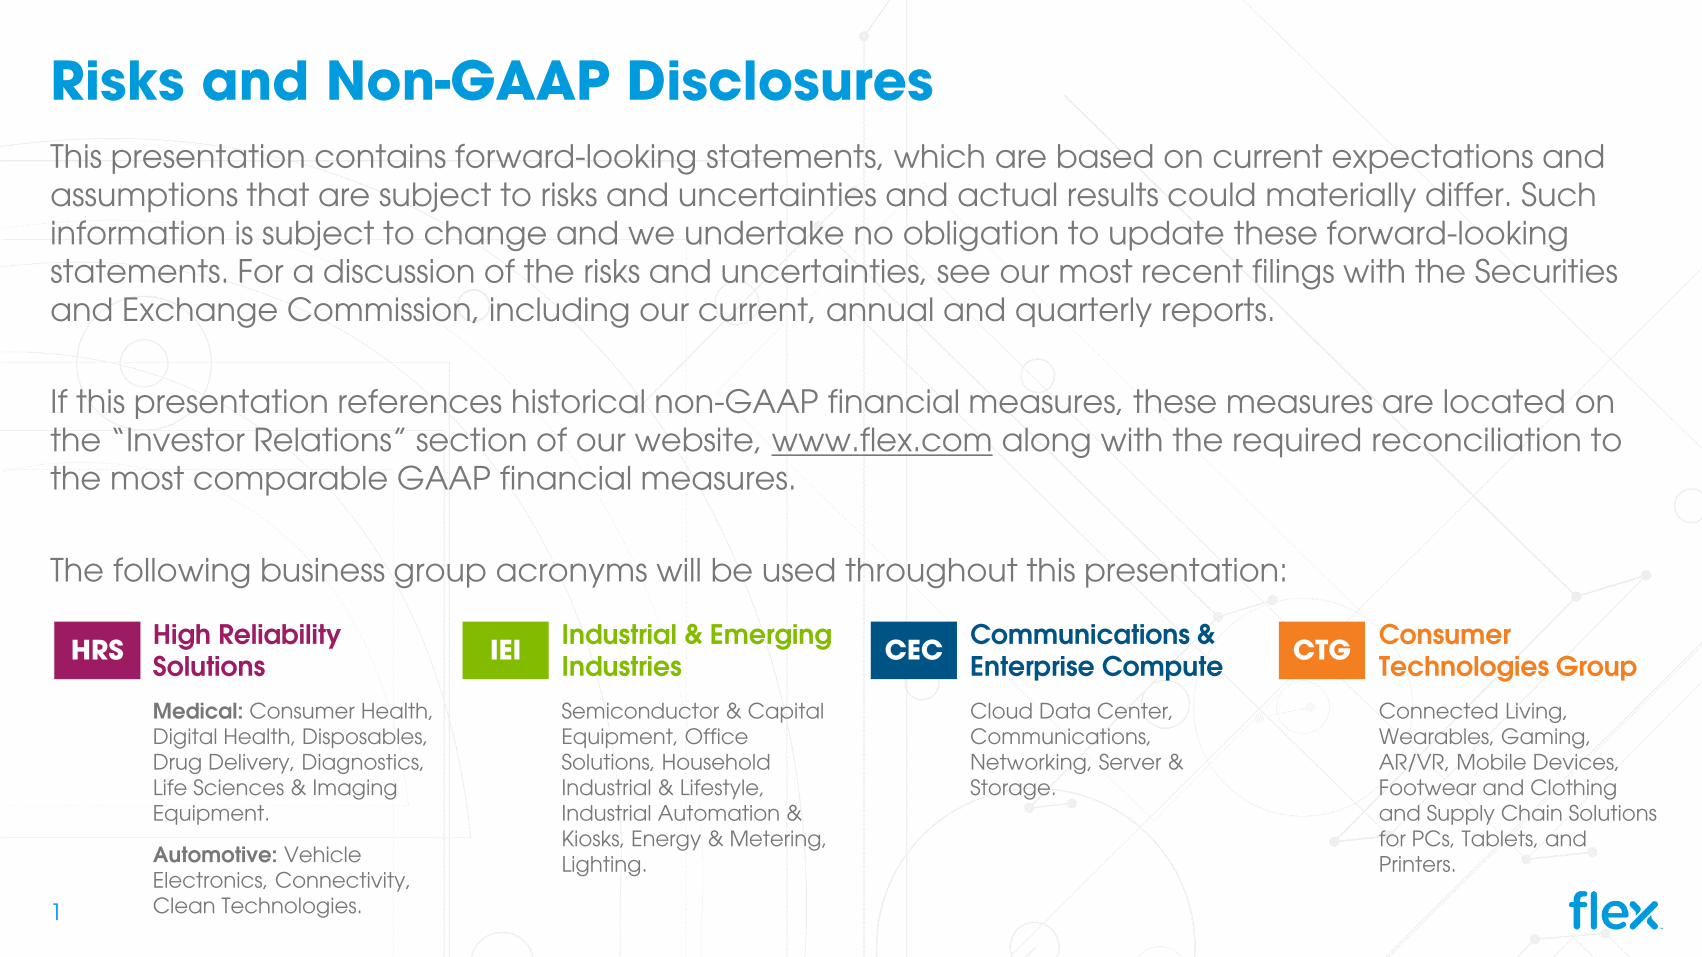
Risks and Non-GAAP DisclosuresThis presentation contains forward-looking statements, which are based on current expectations and assumptions that are subject to risks and uncertainties and actual results could materially differ. Such information is subject to change and we undertake no obligation to update these forward-looking statements. For a discussion of the risks and uncertainties, see our most recent filings with the Securities and Exchange Commission, including our current, annual and quarterly reports.
If this presentation references historical non-GAAP financial measures, these measures are located on the “Investor Relations” section of our website, www.flex.com along with the required reconciliation to the most comparable GAAP financial measures.
The following business group acronyms will be used throughout this presentation:
Communications & Enterprise Compute
Cloud Data Center, Communications, Networking, Server & Storage.
Consumer Technologies Group
Connected Living, Wearables, Gaming, AR/VR, Mobile Devices, Footwear and Clothing and Supply Chain Solutions for PCs, Tablets, and Printers.
Industrial & Emerging Industries
Semiconductor & Capital Equipment, Office Solutions, Household Industrial & Lifestyle, Industrial Automation & Kiosks, Energy & Metering, Lighting.
High Reliability Solutions
Medical: Consumer Health, Digital Health, Disposables, Drug Delivery, Diagnostics, Life Sciences & Imaging Equipment.
Automotive: Vehicle Electronics, Connectivity, Clean Technologies.
HRS IEI CEC CTG
2
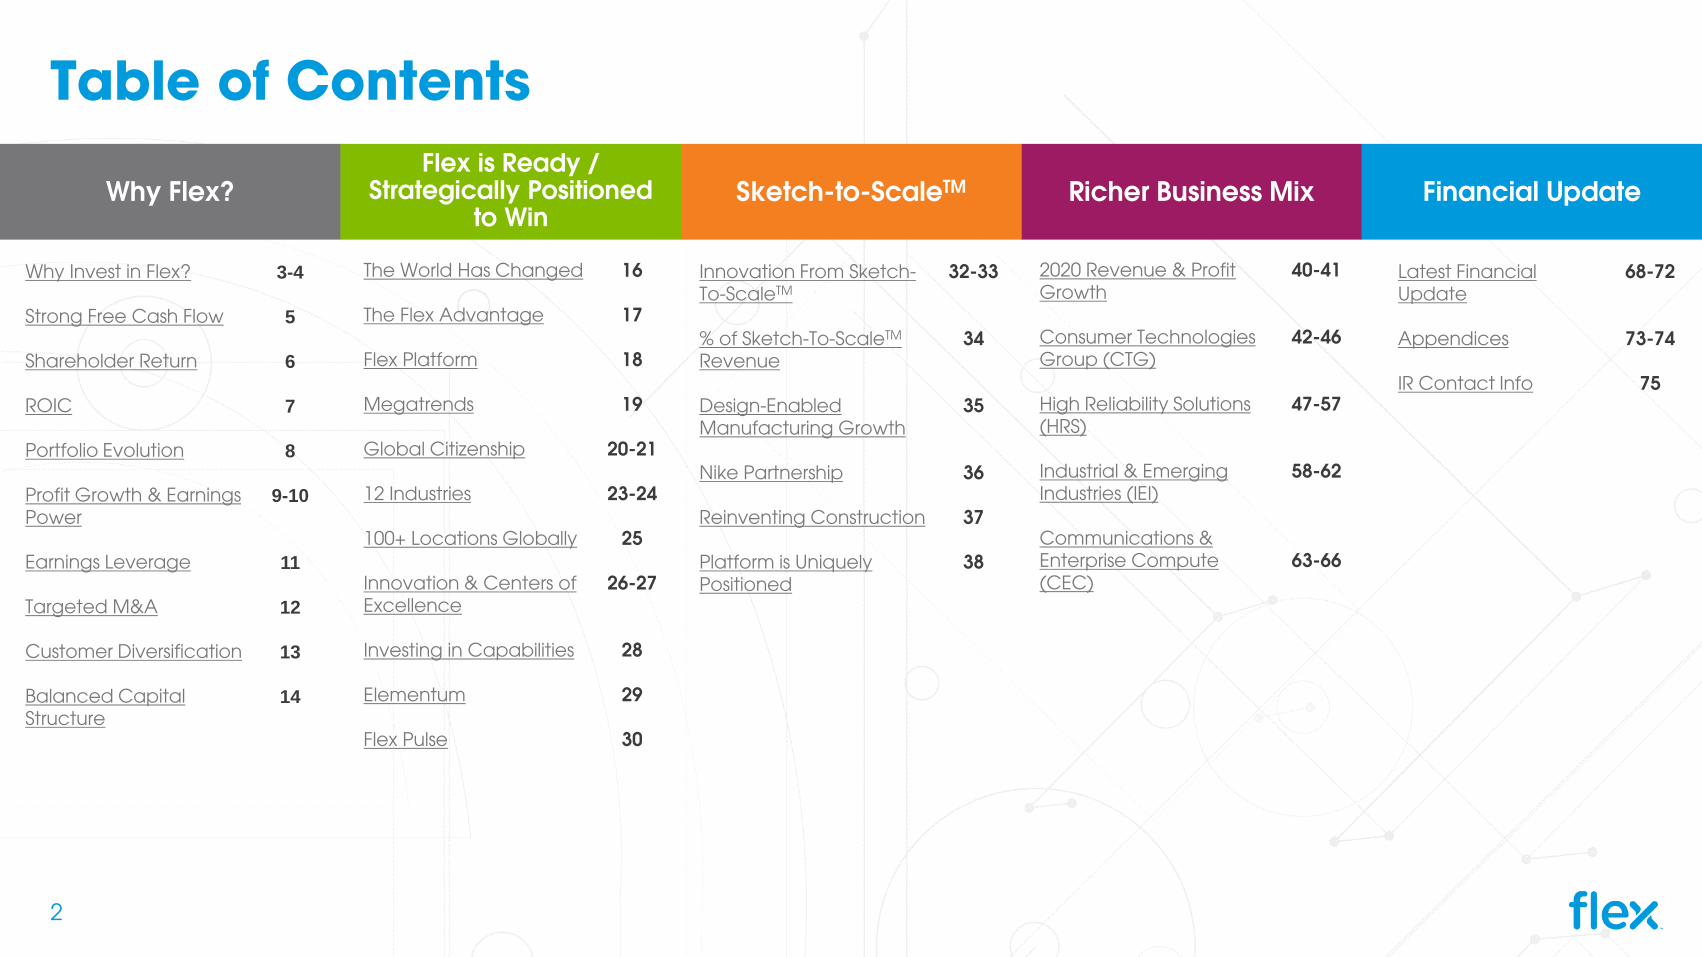
Table of Contents
Richer Business MixSketch-to-ScaleTMWhy Flex?Flex is Ready /
Strategically Positionedto Win
Financial Update
Why Invest in Flex?
Strong Free Cash Flow
Shareholder Return
ROIC
Portfolio Evolution
Profit Growth & Earnings Power
Earnings Leverage
Targeted M&A
Customer Diversification
Balanced Capital Structure
3-4
5
6
7
8
9-10
11
12
13
14
The World Has Changed
The Flex Advantage
Flex Platform
Megatrends
Global Citizenship
12 Industries
100+ Locations Globally
Innovation & Centers of Excellence
Investing in Capabilities
Elementum
Flex Pulse
16
17
18
19
20-21
23-24
25
26-27
28
29
30
Innovation From Sketch-To-ScaleTM
% of Sketch-To-ScaleTM
Revenue
Design-Enabled Manufacturing Growth
Nike Partnership
Reinventing Construction
Platform is Uniquely Positioned
32-33
34
35
36
37
38
2020 Revenue & Profit Growth
Consumer Technologies Group (CTG)
High Reliability Solutions (HRS)
Industrial & Emerging Industries (IEI)
Communications & Enterprise Compute (CEC)
40-41
42-46
47-57
58-62
63-66
Latest Financial Update
Appendices
IR Contact Info
68-72
73-74
75
3
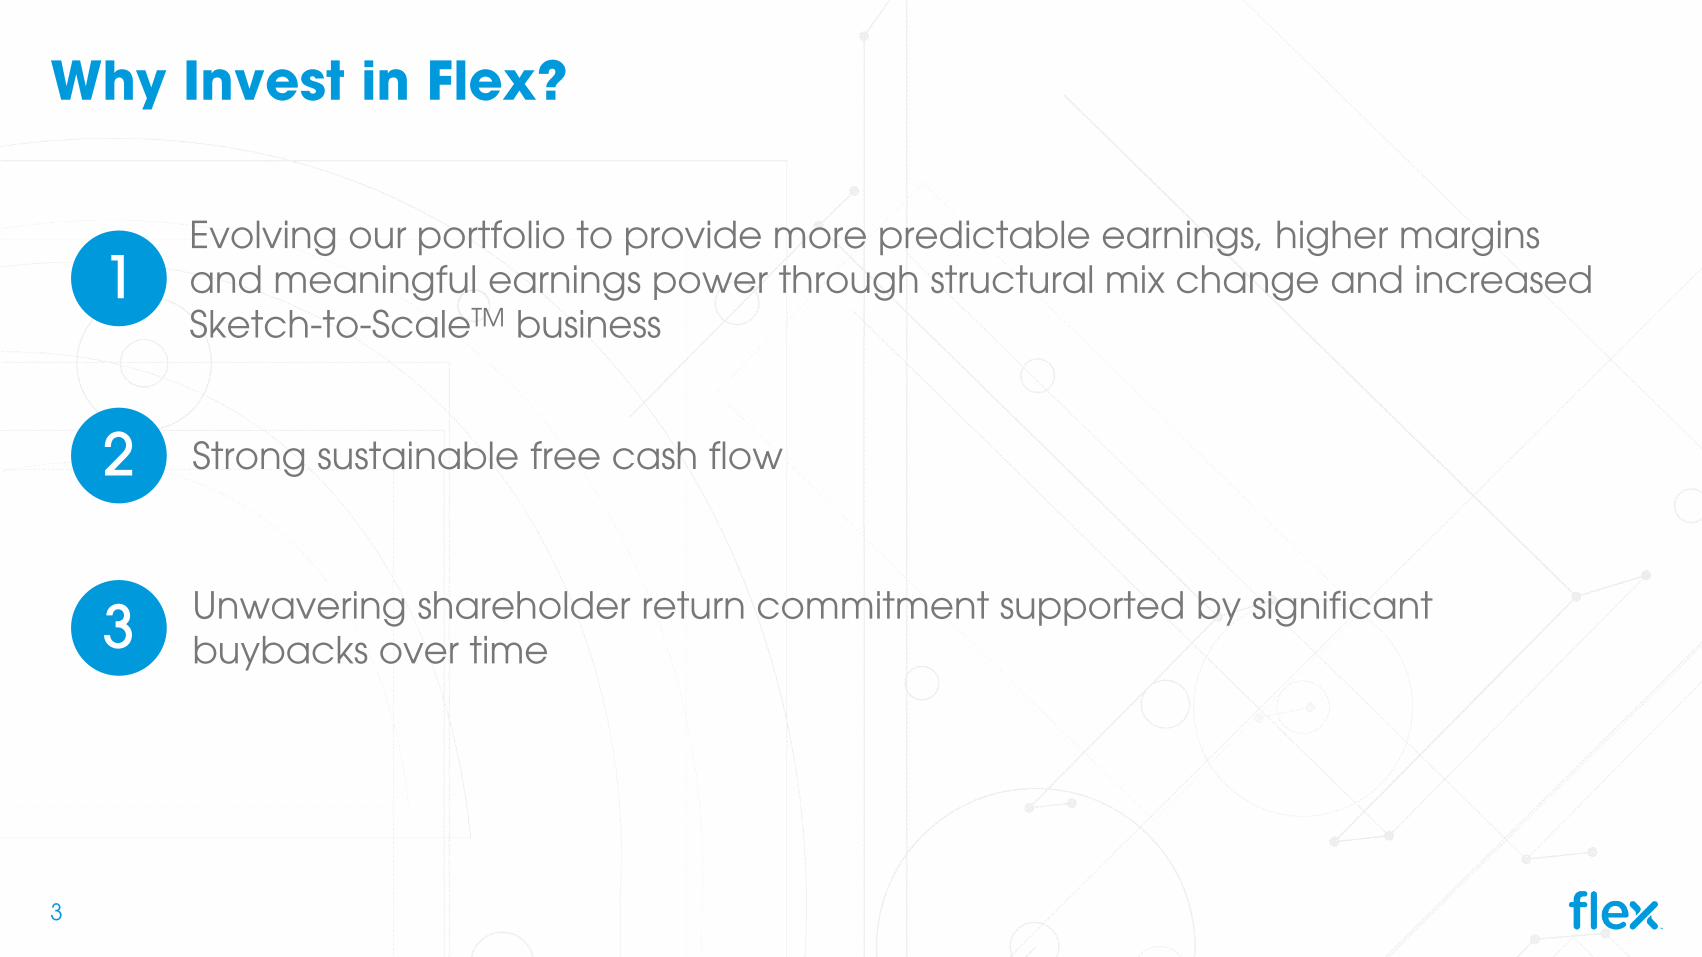
Why Invest in Flex?
Evolving our portfolio to provide more predictable earnings, higher margins and meaningful earnings power through structural mix change and increased Sketch-to-ScaleTM business
Strong sustainable free cash flow
Unwavering shareholder return commitment supported by significant buybacks over time
1
2
3
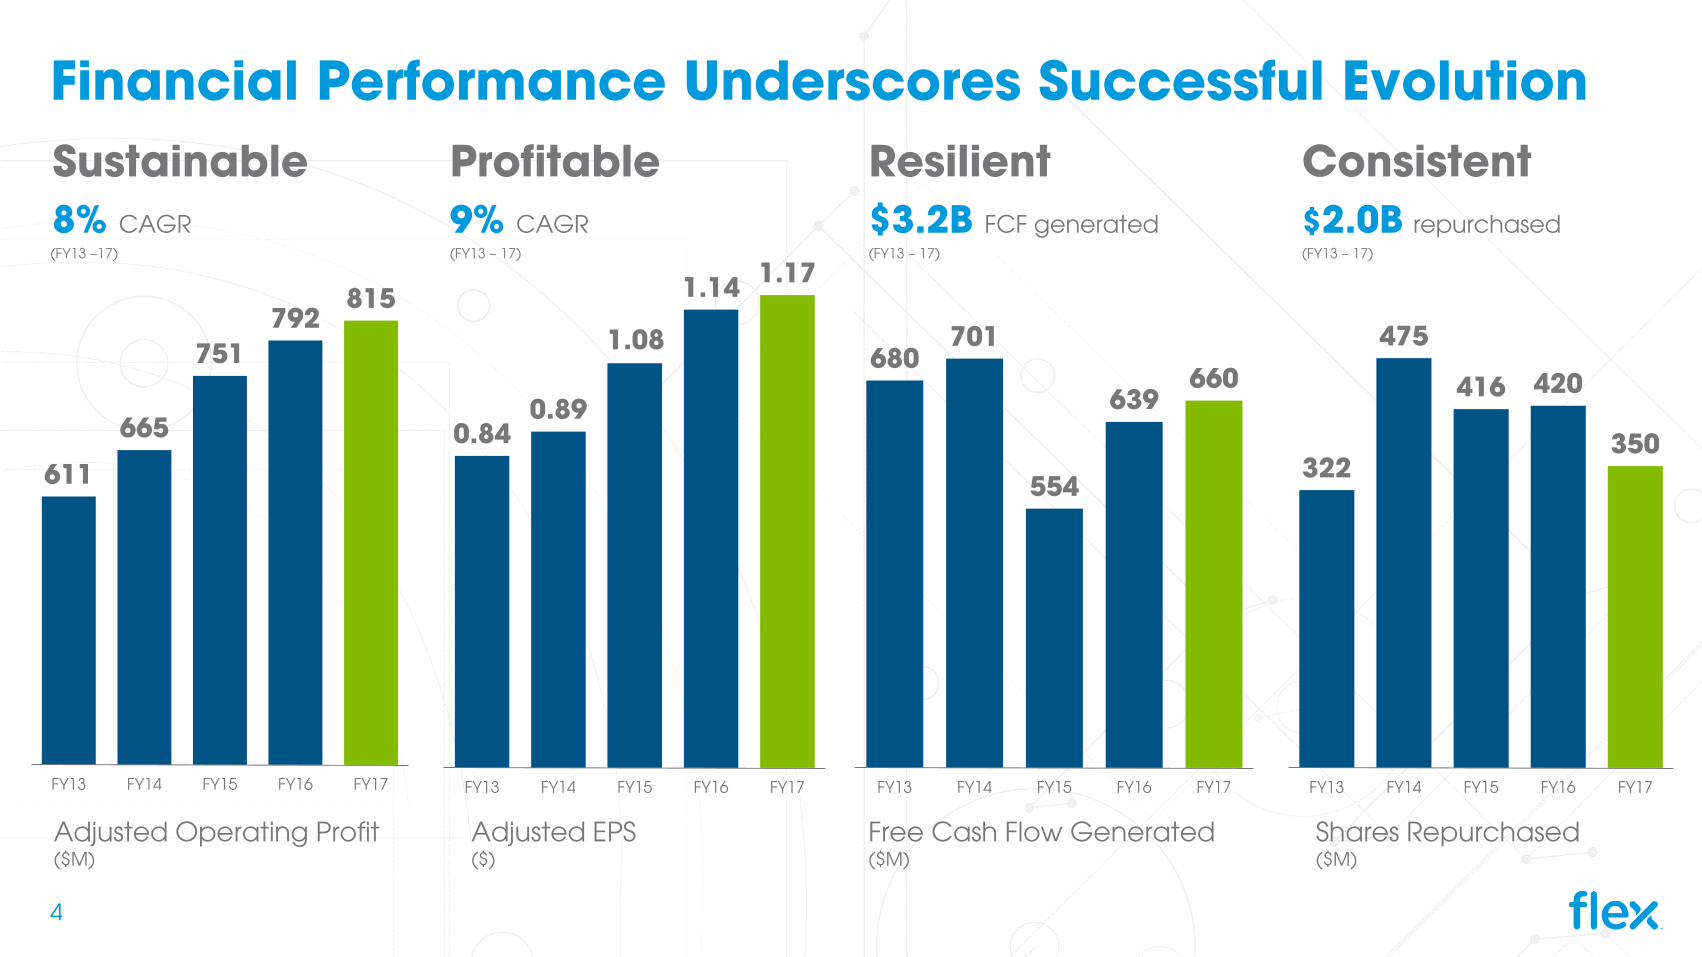
Financial Performance Underscores Successful Evolution
611
665
751792
815
FY13 FY14 FY15 FY16 FY17
Sustainable
0.84 0.89
1.14 1.17
FY13 FY14 FY15 FY16 FY17
1.08
Profitable
Adjusted EPS($)
Resilient
Free Cash Flow Generated($M)
Consistent
Shares Repurchased($M)
680701
554
639660
FY13 FY14 FY15 FY16 FY17
322
475
416 420
350
FY13 FY14 FY15 FY16 FY17
8% CAGR 9% CAGR $3.2B FCF generated $2.0B repurchased
Adjusted Operating Profit($M)
(FY13 – 17) (FY13 – 17)(FY13 – 17)(FY13 –17)
4
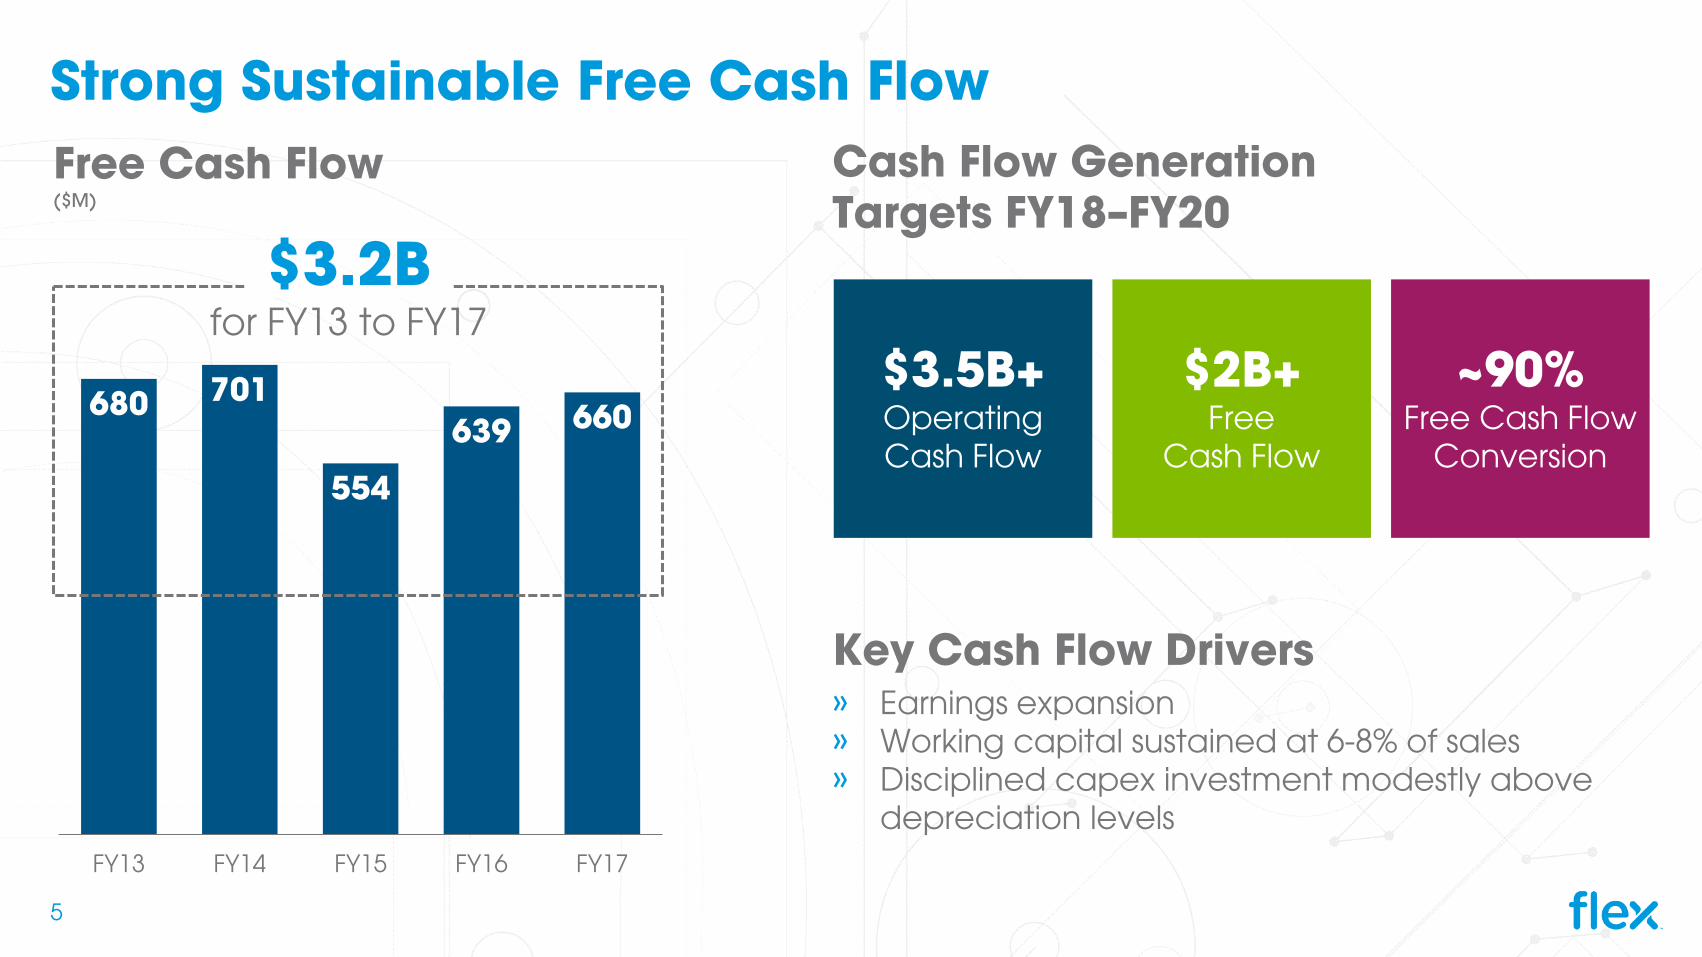
Strong Sustainable Free Cash Flow
680 701
554
639 660
FY13 FY14 FY15 FY16 FY17
Free Cash Flow($M)
$3.2Bfor FY13 to FY17
Key Cash Flow Drivers» Earnings expansion» Working capital sustained at 6-8% of sales» Disciplined capex investment modestly above
depreciation levels
~90%Free Cash Flow
Conversion
$3.5B+Operating Cash Flow
$2B+Free
Cash Flow
Cash Flow Generation Targets FY18–FY20
5
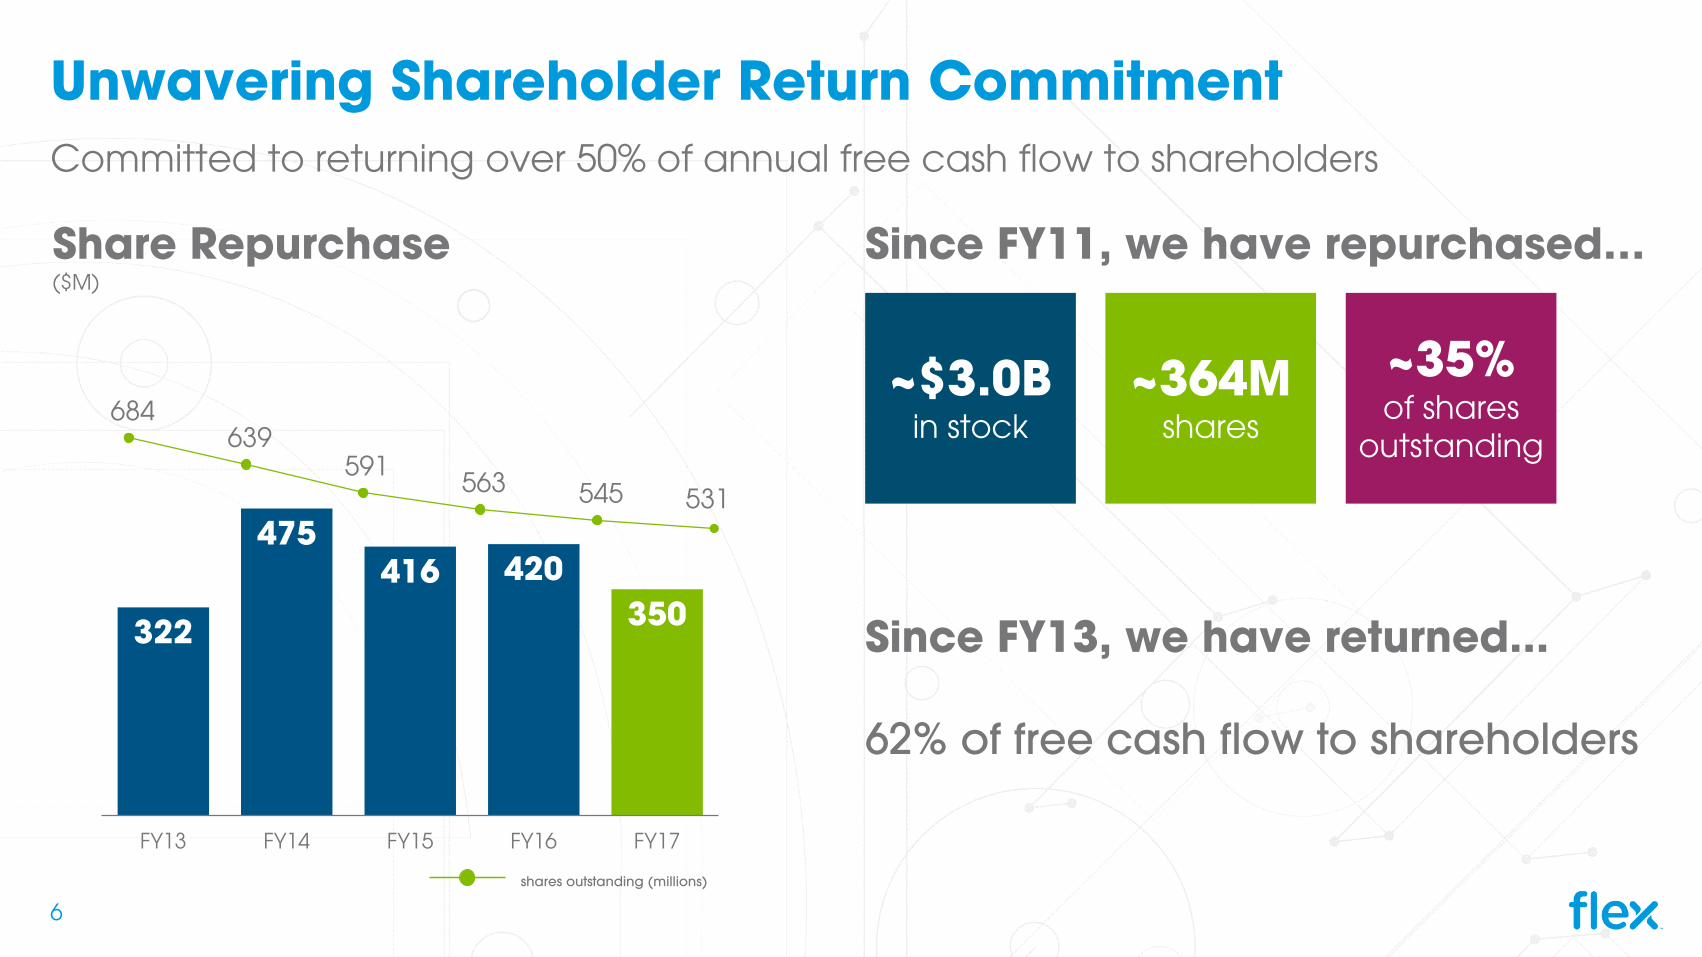
684 639
591 563 545 531
322
475 416 420
350
FY13 FY14 FY15 FY16 FY17
shares outstanding (millions)
Unwavering Shareholder Return Commitment
Share Repurchase($M)
Committed to returning over 50% of annual free cash flow to shareholders
Since FY11, we have repurchased…
~35%of shares
outstanding
~$3.0Bin stock
~364Mshares
6
Since FY13, we have returned...
62% of free cash flow to shareholders
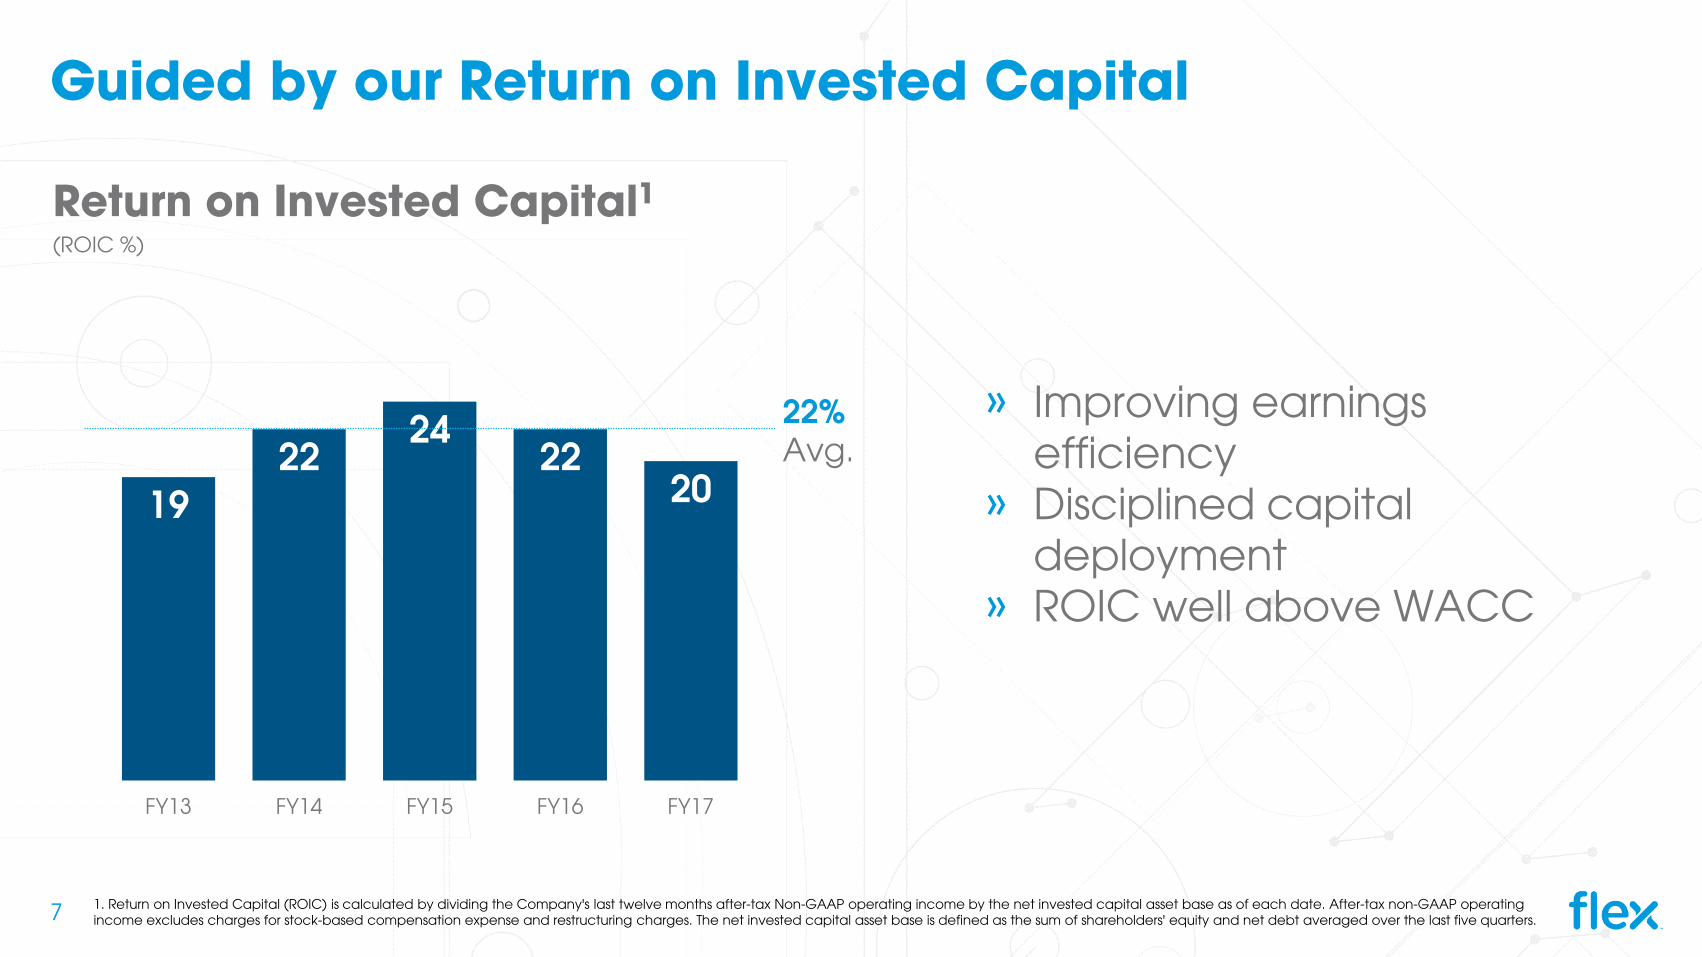
Guided by our Return on Invested Capital
Return on Invested Capital1(ROIC %)
» Improving earnings efficiency
» Disciplined capital deployment
» ROIC well above WACC
1. Return on Invested Capital (ROIC) is calculated by dividing the Company's last twelve months after-tax Non-GAAP operating income by the net invested capital asset base as of each date. After-tax non-GAAP operating income excludes charges for stock-based compensation expense and restructuring charges. The net invested capital asset base is defined as the sum of shareholders' equity and net debt averaged over the last five quarters.
1922
2422
20
FY13 FY14 FY15 FY16 FY17
22%Avg.
7

Portfolio Evolution to Higher Margin Business
$4.5BHRS + IEI
revenue
$9.1BHRS + IEI
revenue
Driving predicable earnings and margin expansion
FY10HRS6%
IEI13%
CTG42%
CEC39%
19% FY17
HRS17%
IEI21%
CTG27%
CEC35%
38% FY20EHRS
~22%
IEI~23%
CTG~28%
CEC~27%
~45%
~$13.0BHRS + IEI
revenue
~2years
~4 years
~6 years
Est Avg Product Life Cycle
8
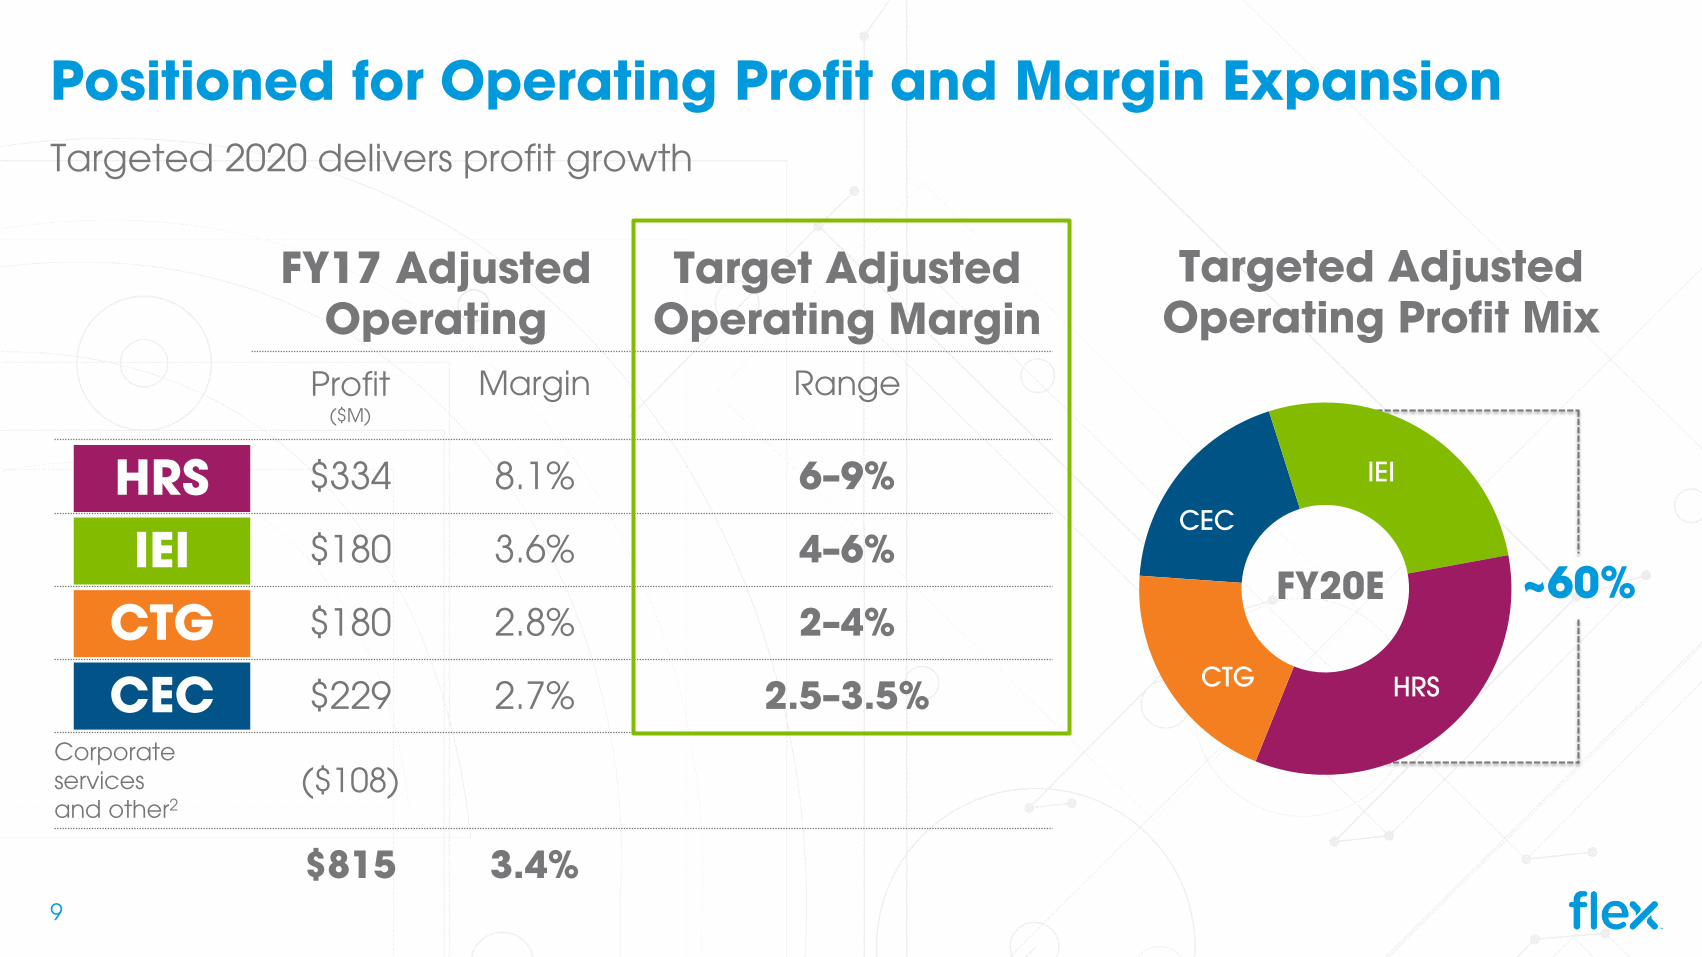
FY17 Adjusted Operating
Target Adjusted Operating Margin
Profit($M)
Margin Range
$334 8.1% 6–9%
$180 3.6% 4–6%
$180 2.8% 2–4%
$229 2.7% 2.5–3.5%Corporateservices and other2
($108)
$815 3.4%
Positioned for Operating Profit and Margin Expansion
HRSIEI
CTGCEC
Targeted Adjusted Operating Profit Mix
Targeted 2020 delivers profit growth
FY20E
HRS
IEI
CTG
CEC
~60%
9
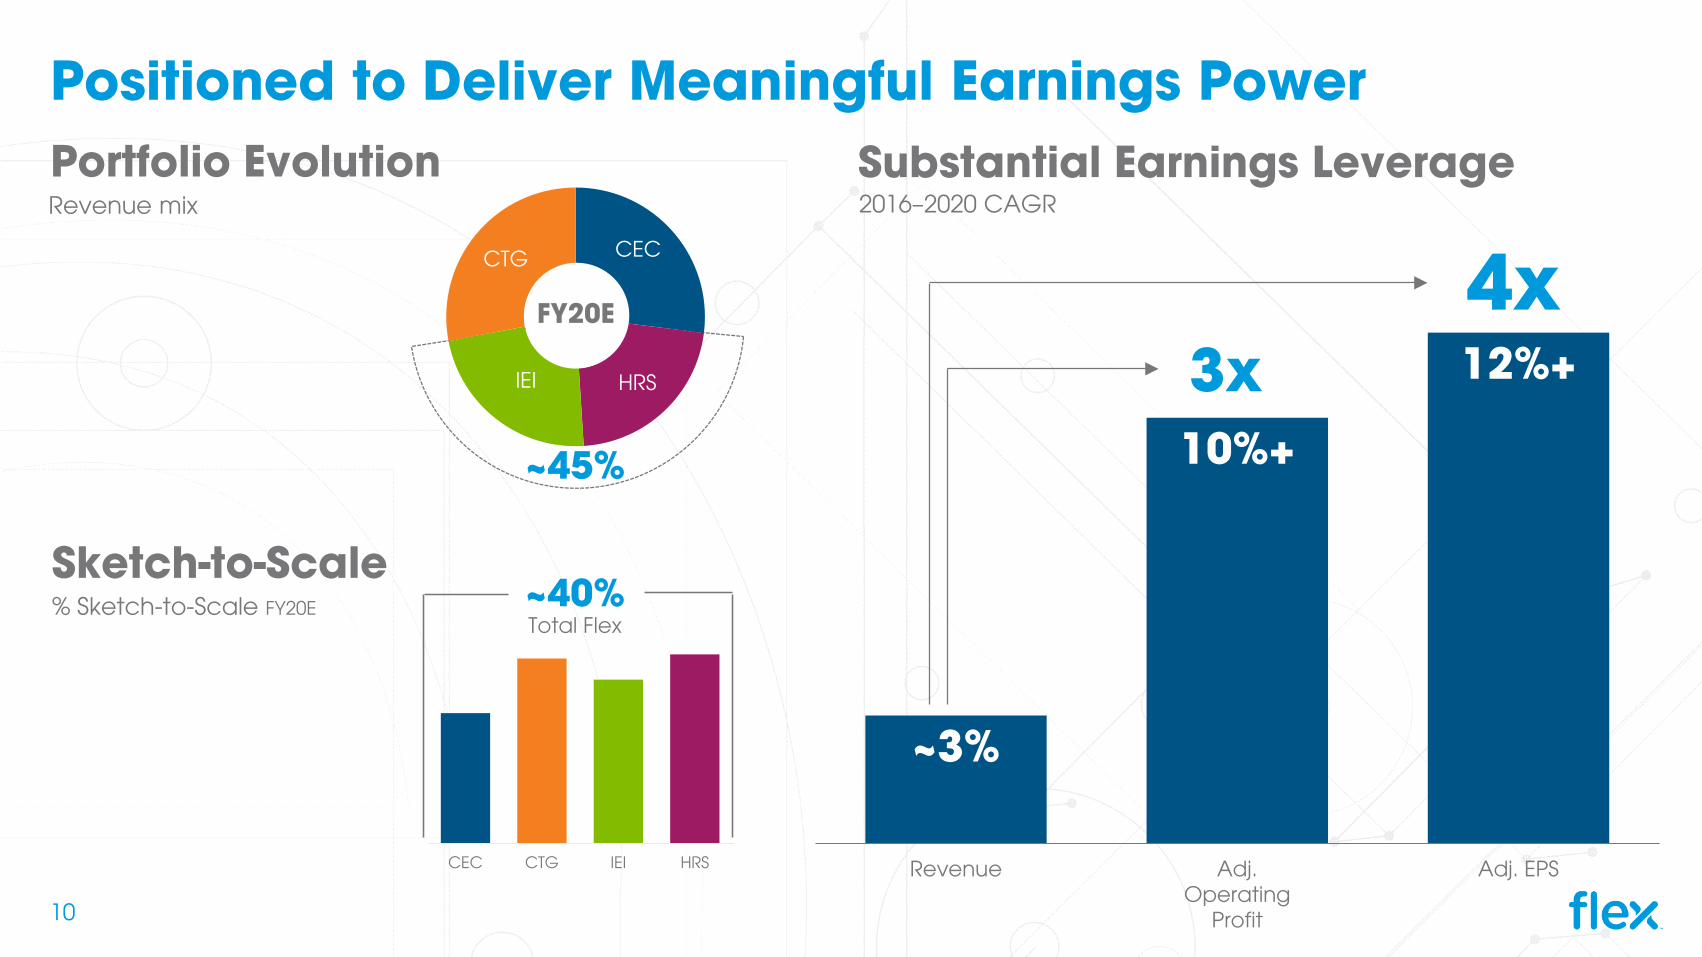
Positioned to Deliver Meaningful Earnings Power
% Sketch-to-Scale FY20E
Portfolio Evolution
Sketch-to-Scale
~3%
10%+
12%+
Revenue Adj.Operating
Profit
Adj. EPS
2016–2020 CAGRSubstantial Earnings Leverage
3x4x
Revenue mix
CEC
HRSIEI
CTG
FY20E
~45%
CEC CTG IEI HRS
~40%Total Flex
10
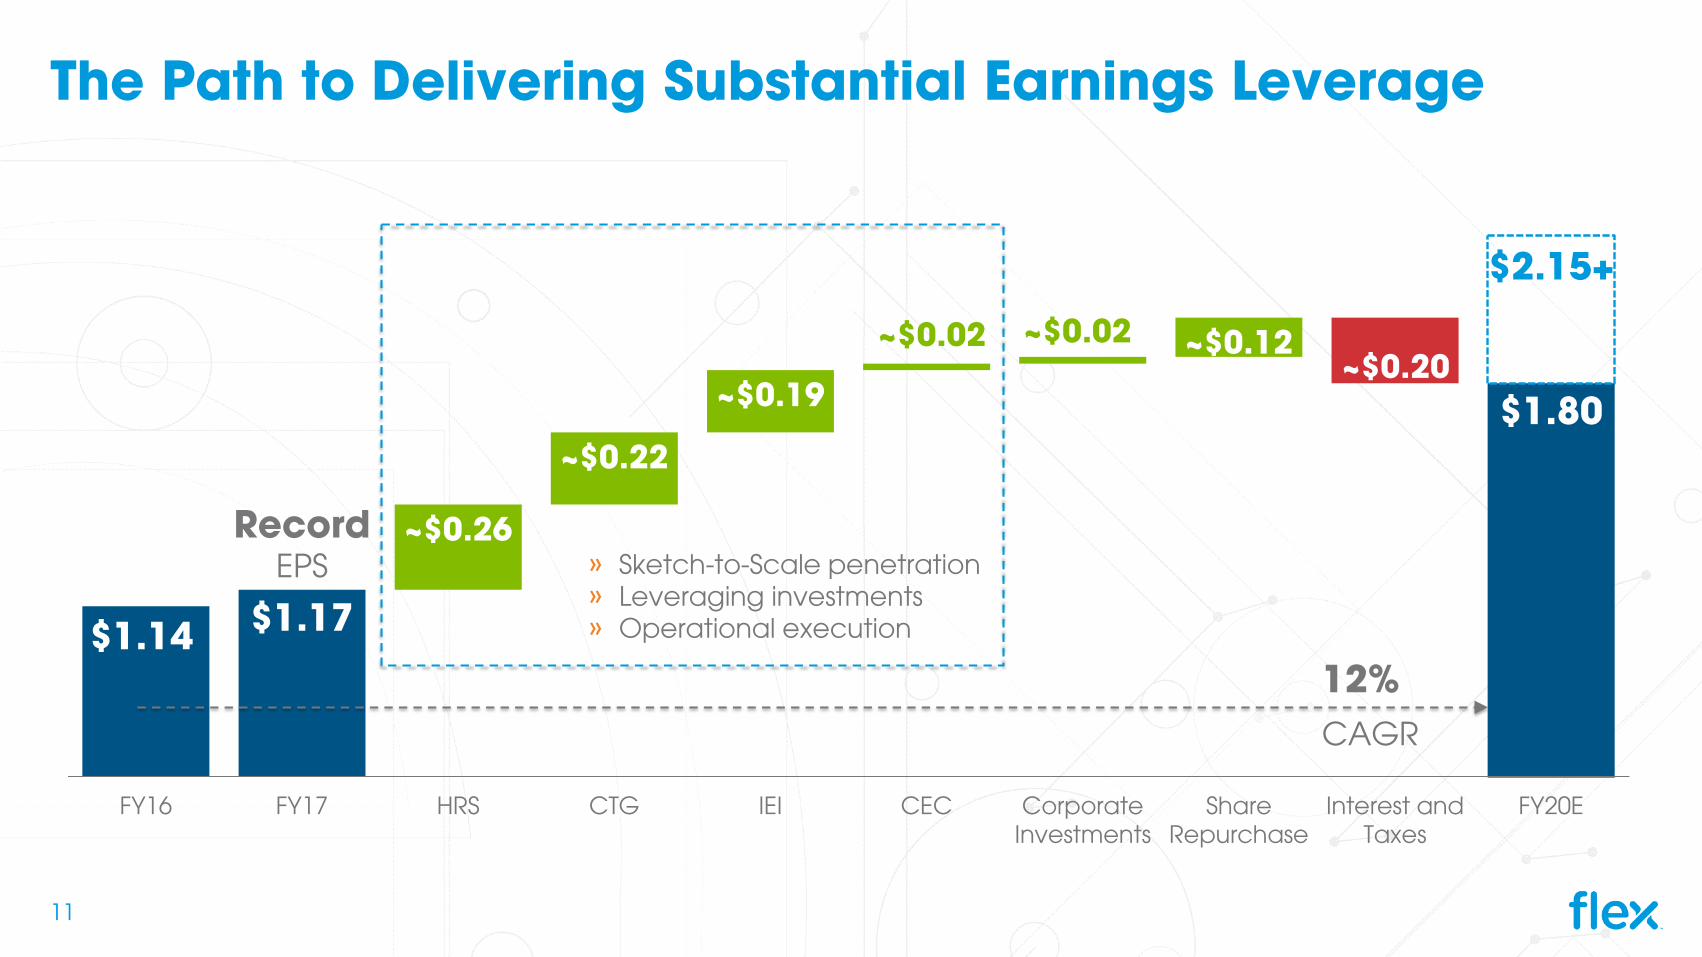
$1.17
~$0.26
~$0.22
~$0.19
~$0.02 ~$0.02 ~$0.12 ~$0.20
$1.80
FY16 FY17 HRS CTG IEI CEC CorporateInvestments
ShareRepurchase
Interest andTaxes
FY20E
$1.14
The Path to Delivering Substantial Earnings Leverage
» Sketch-to-Scale penetration» Leveraging investments» Operational execution
12%CAGR
$2.15+
Record EPS
11
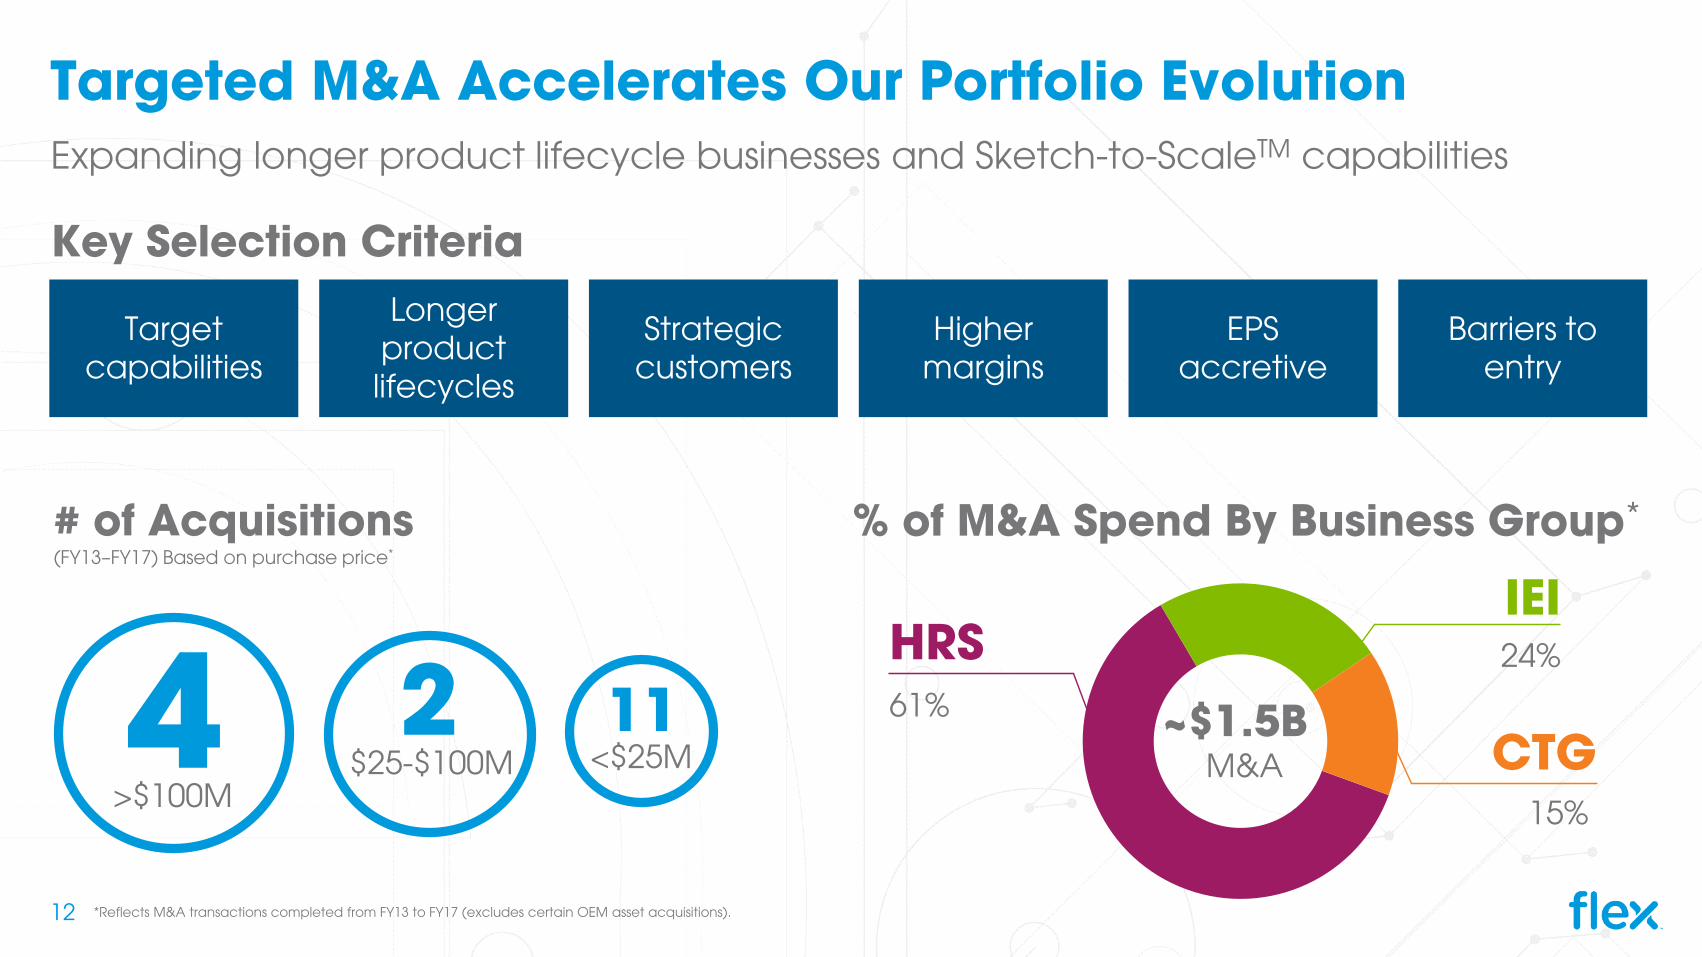
1 Reflects M&A transactions completed from FY13 to FY17 (excludes certain OEM asset acquisitions)
Targeted M&A Accelerates Our Portfolio Evolution
11<$25M
Target capabilities
Strategic customers
Longer product lifecycles
EPS accretive
Barriers to entry
Higher margins
Key Selection Criteria
# of Acquisitions (FY13–FY17) Based on purchase price*
4>$100M
% of M&A Spend By Business Group*
61%
HRS 24%
IEI
15%
CTG~$1.5B
M&A
Expanding longer product lifecycle businesses and Sketch-to-ScaleTM capabilities
2$25-$100M
12 *Reflects M&A transactions completed from FY13 to FY17 (excludes certain OEM asset acquisitions).

Improving Customer Diversification
10%+ Customers
FY07 FY12 FY17
Top 10 Customers as % of Total Revenue
64%
55%
43%
No 10%+ customer
Q1 FY18 was 6th straight quarter with no 10% customer
13

500 503 500
600
CY17 CY18 CY19 CY20 CY21 CY22 CY23 CY24 CY25
56113
700
Balanced Capital Structure
Investment Grade RatedMoody’s | S&P | Fitch
Significant Debt Maturities*($M) Balances as of June 30, 2017
~3.6%Low Avg.
Cost of Debt
$3.3BSolid Liquidity
($1.75B revolver + $1.6B cash)
2.4xStrong Debt/ Adj. EBITDA4
(LTM)
Term Loan
Notes
$2.3BCredit Facility Renewal
Maturity date in 2022($1.75B revolver + $503M loan)
*Does not reflect the contractual quarterly amortization payments due prior to maturity.
14
The World Has Changed… Flex is Ready
15
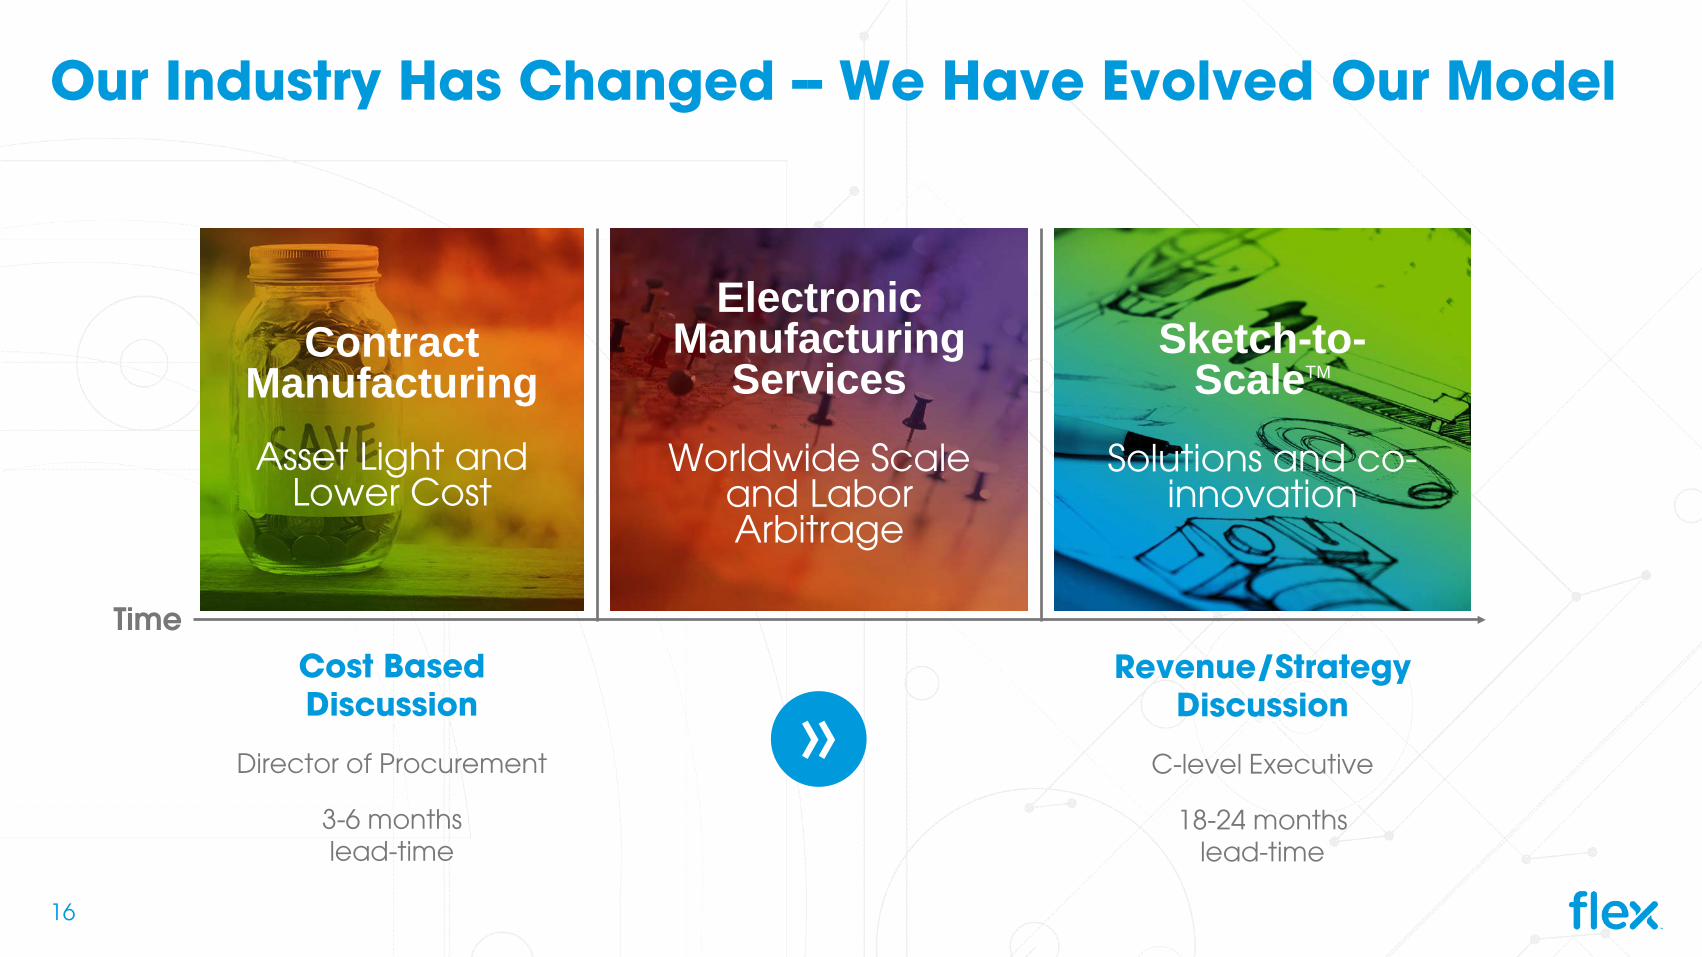
Electronic Manufacturing
Services
Worldwide Scale and Labor Arbitrage
Time
Contract ManufacturingAsset Light and
Lower Cost
Our Industry Has Changed -- We Have Evolved Our Model
Cost Based Discussion
Director of Procurement
3-6 months lead-time
»
Sketch-to-ScaleTM
Solutions and co-innovation
Revenue/Strategy Discussion
C-level Executive
18-24 months lead-time
16
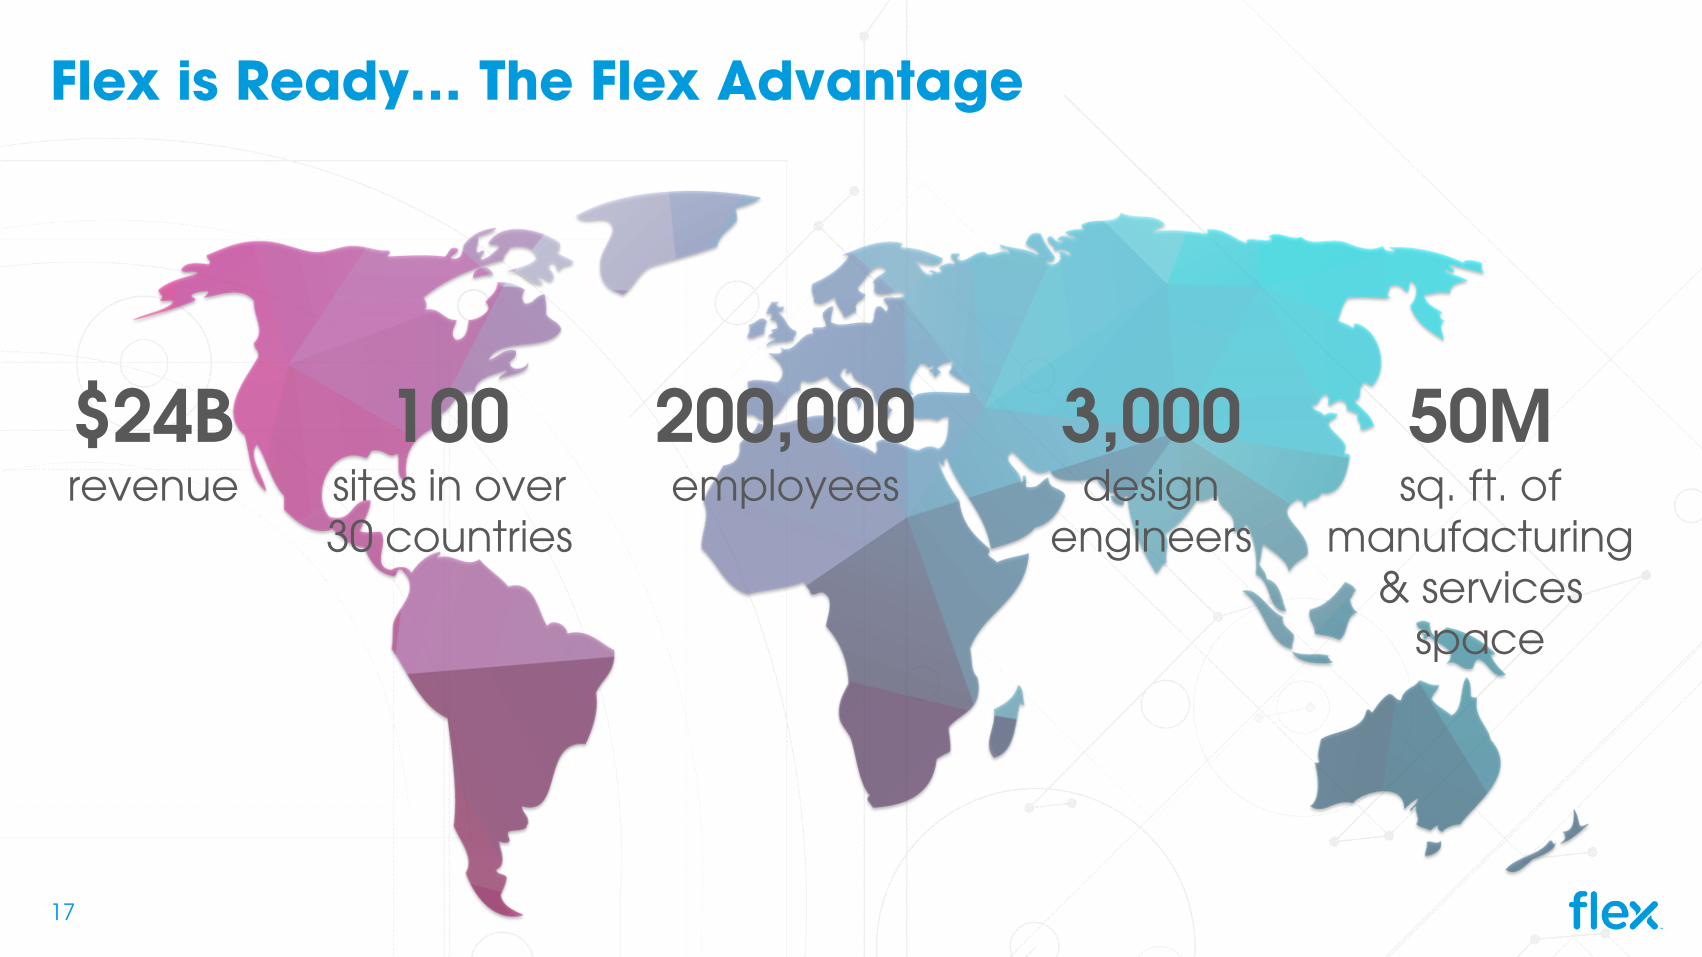
Flex is Ready… The Flex Advantage
$24Brevenue
50Msq. ft. of
manufacturing & services
space
200,000employees
100sites in over 30 countries
3,000design
engineers
17

Capabilities Built for the Future
The Flex Platform
Our company innovates across three dimensions
18

Yielding a Massive Expansion of TAM
Artificial Intelligence (AI) **
Digital Health
Smart Cities *
Autonomous/ Connected Cars
Cloud Data Center
Augmented Reality/ Virtual Reality (AR/VR) **
5G/Telco Cloud
Intelligent AssetTracking
Industrial Automation
Connected Living
2015-2020 data points ($B), CAGR
Source: Gartner, IDC,IFR, Markets & Markets, GMI Insights, Goldman Sachs, Autodesk, Flex Internal Estimates (1) Represents 2016 estimated figured(2) Overlaps with other categories including connected living an autonomous vehicles
246392
10%
4
3554%
8
4756%
32 61
14%
10
2520%
65
17622%
50
11919%
3
3884%
1
1282%
3676
16%
19Source: Gartner, IDC,IFR, Markets & Markets, GMI Insights, Goldman Sachs, Autodesk, Flex Internal Estimates *Overlaps with other categories including connected living an autonomous vehicles.**Represents 2016 estimated figure.
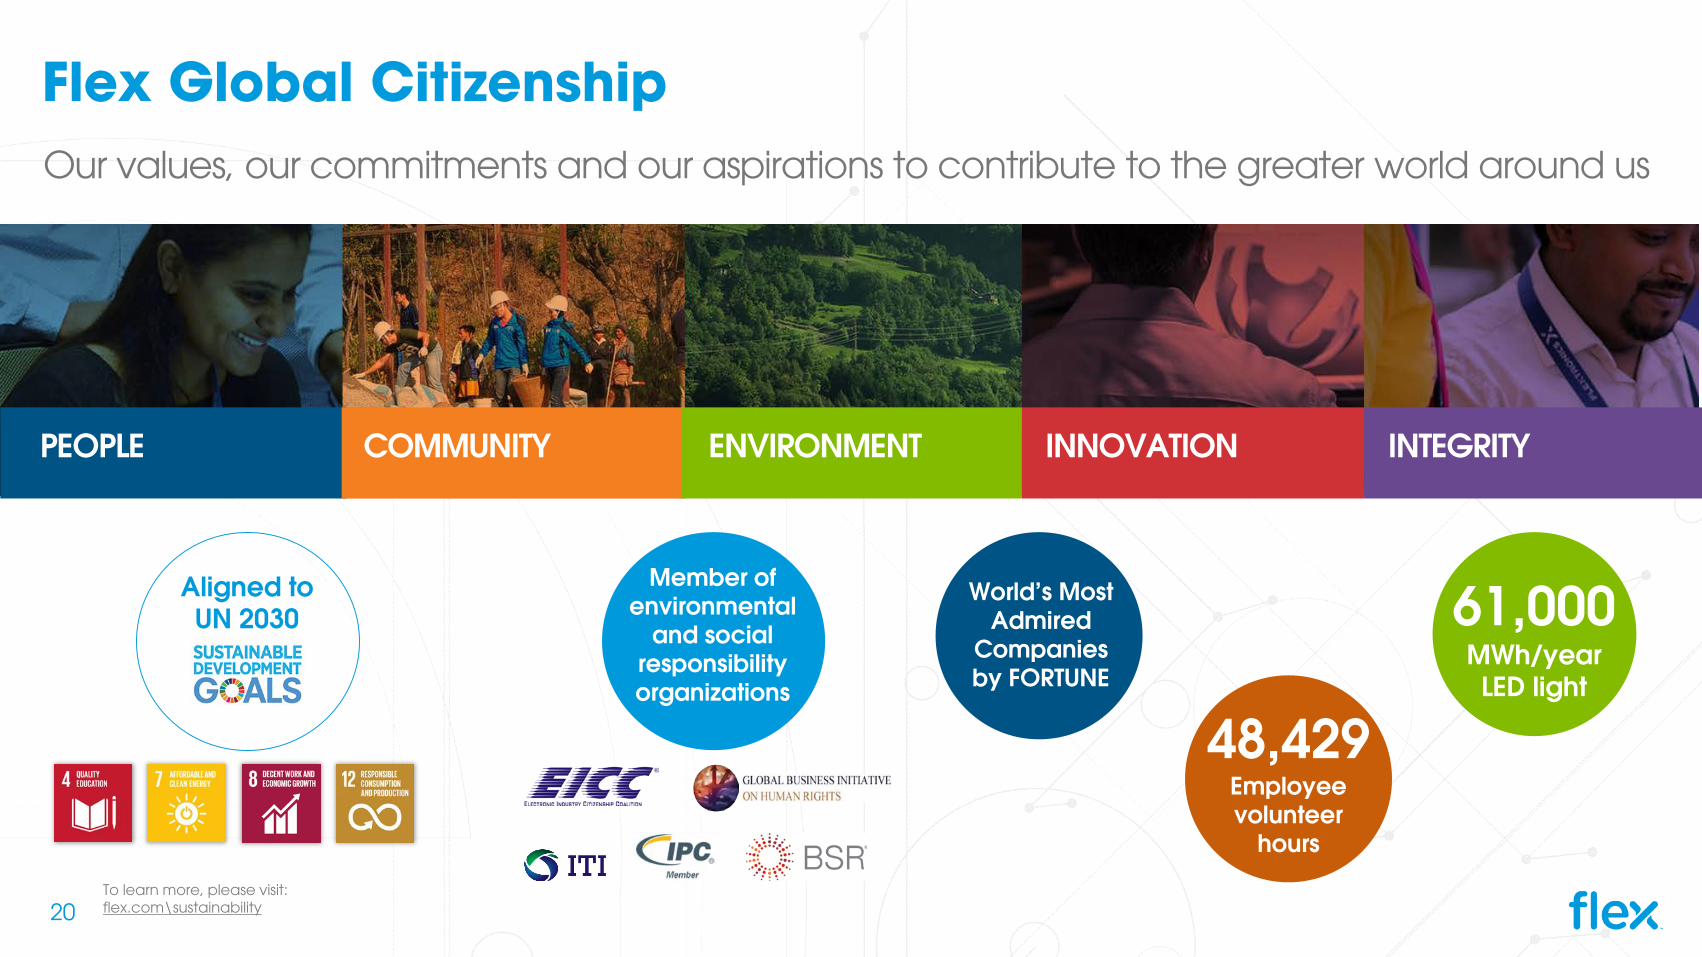
Flex Global Citizenship
Aligned to UN 2030
Our values, our commitments and our aspirations to contribute to the greater world around us
COMMUNITYPEOPLE INNOVATION INTEGRITYENVIRONMENT
Member of environmental
and social responsibility organizations
48,429Employee volunteer
hours
World’s MostAdmired
Companiesby FORTUNE
61,000MWh/yearLED light
To learn more, please visit: flex.com\sustainability20

Flex 20 by 2020
For more information review our Biannual Progress Report (as of Dec, 2016):https://www.flex.com/about/commitment/global-citizenship/flex-20-by-2020-progress-report
Volunteer Hours CSER Supplier Training
Supplier Screening on Social and Environ. Criteria
Worker Empowerment Training Program
Flex Foundation –Community Grants
CoBCE Training Completion
In-person CoBCE Training
Incident Rate
Employee Development
Flex Pledge Audits
Human Rights Policy Training Completion
EICC Compliance on Rest Day Requirements
Use of Renewable Energy
Water Recycling
CO2 Emissions
Cost of Electricity to the Grid vs Fossil Fuels
Number of Powered Homes Equivalent
Waste Diversion Rate
Water Consumption
Percent of Sites with Community Activities
Flex has established 20 goals targeted for 2020 that align with the U.N. Sustainable Development Goals
CoBCE: Code of Business Conduct and Ethics
21
Strategically Positioned to Win
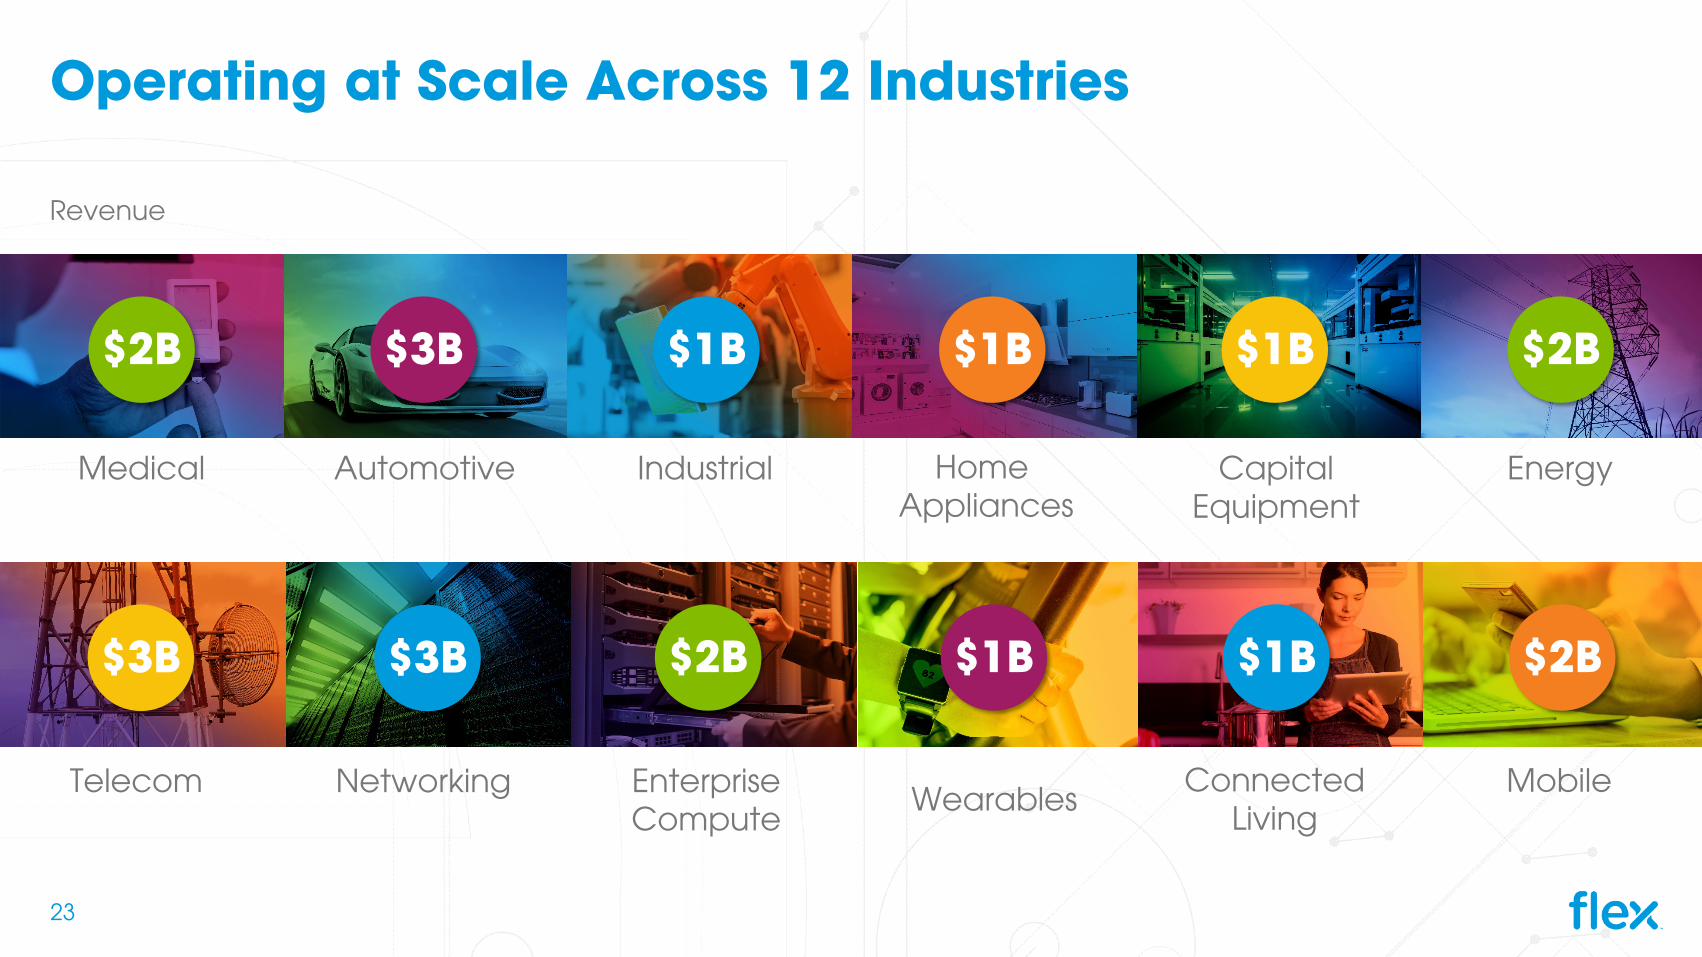
Operating at Scale Across 12 Industries
Medical
$2B
Automotive
$3B
Industrial
$1B
Home Appliances
$1B
CapitalEquipment
$1B
Energy
$2B
Telecom
$3B
EnterpriseCompute
$2B
Wearables
$1B
ConnectedLiving
$1B
Mobile
$2B
Networking
$3B
Revenue
23

Giving Us Unparalleled Insight
Medical
$2Billion
Automotive
$2Billion
Industrial
$1Billion
Home Appliances
$1Billion
CapitalEquipment
$1Billion
Energy
$2Billion
Telecom
$3Billion
EnterpriseCompute
$2Billion
Wearables
$1Billion
ConnectedLiving
$1Billion
Mobile
$2Billion
Networking
$3Billion
144 130 51 52 101 76
30 27 21 62 934
# of customers*
24
*Current as of May 2017 Investor & Analyst Day
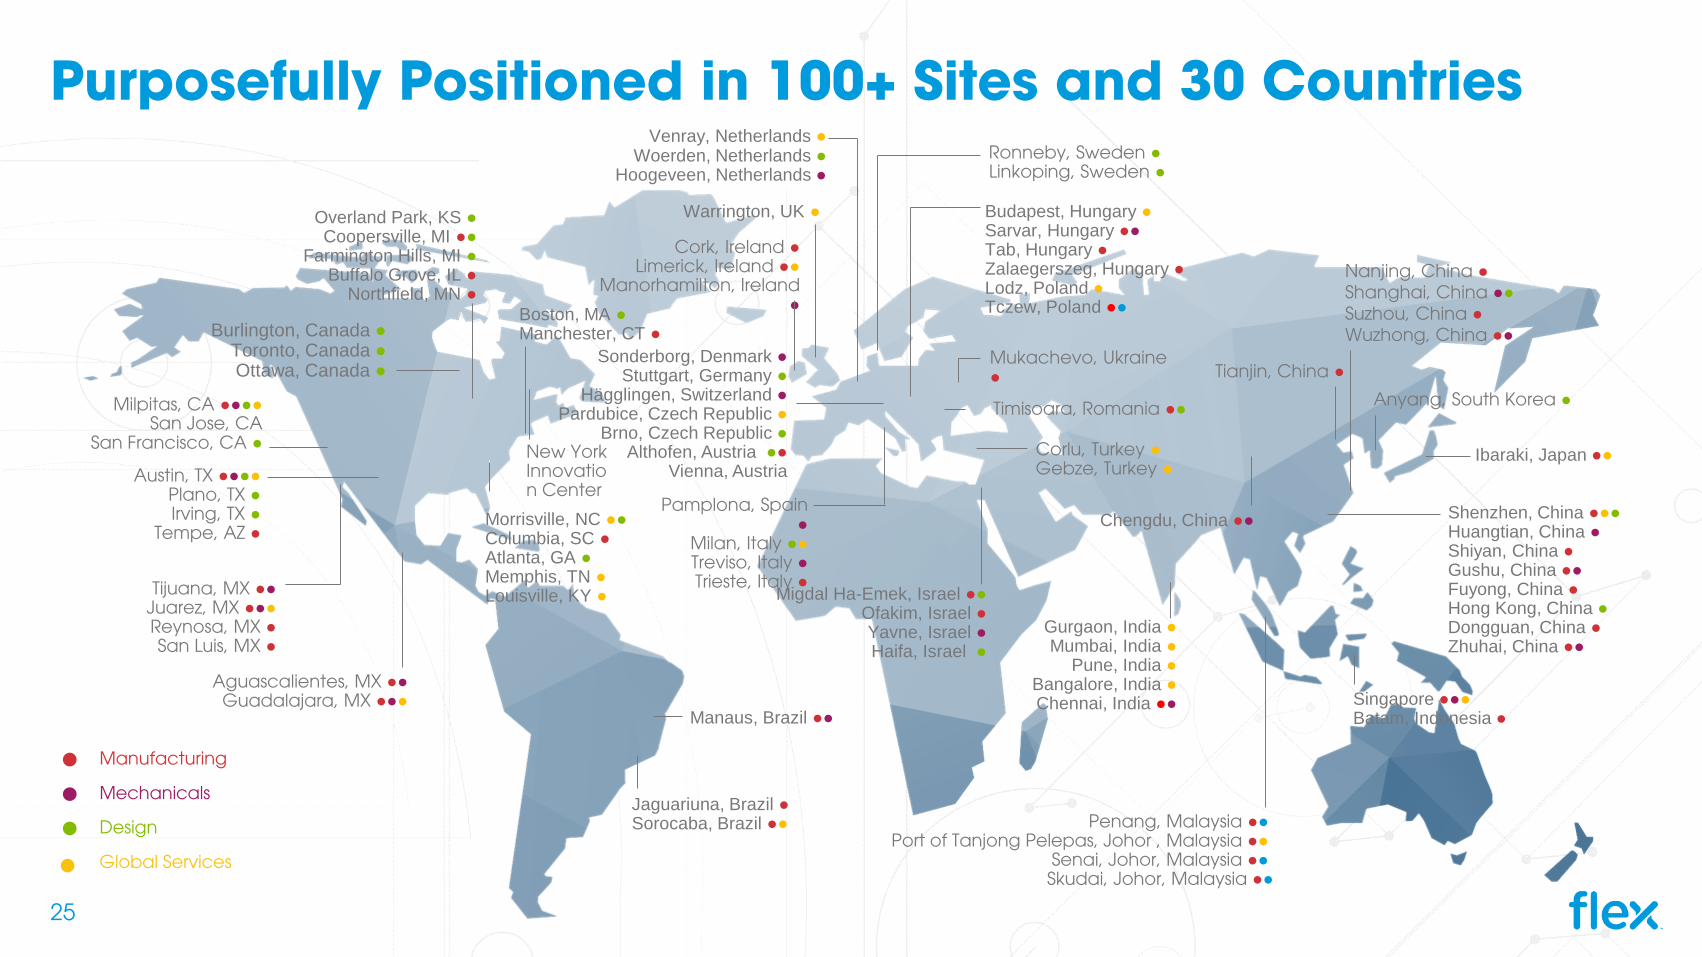
Purposefully Positioned in 100+ Sites and 30 Countries
Jaguariuna, Brazil ●Sorocaba, Brazil ●●
Manaus, Brazil ●●
Milpitas, CA ●●●●San Jose, CA
San Francisco, CA ●
Austin, TX ●●●●Plano, TX ●Irving, TX ●
Tempe, AZ ●
Tijuana, MX ●●Juarez, MX ●●●Reynosa, MX ●San Luis, MX ●
Overland Park, KS ●Coopersville, MI ●●
Farmington Hills, MI ●Buffalo Grove, IL ●
Northfield, MN ●
Morrisville, NC ●●Columbia, SC ●Atlanta, GA ●Memphis, TN ●Louisville, KY ●
Boston, MA ●Manchester, CT ●
Cork, Ireland ●Limerick, Ireland ●●
Manorhamilton, Ireland ●
Venray, Netherlands ●Woerden, Netherlands ●
Hoogeveen, Netherlands ●
Budapest, Hungary ●Sarvar, Hungary ●●Tab, Hungary ●Zalaegerszeg, Hungary ●Lodz, Poland ●Tczew, Poland ●●
Migdal Ha-Emek, Israel ●●Ofakim, Israel ●Yavne, Israel ●Haifa, Israel ●
Chengdu, China ●●
Gurgaon, India ●Mumbai, India ●
Pune, India ●Bangalore, India ●Chennai, India ●●
Penang, Malaysia ●●Port of Tanjong Pelepas, Johor , Malaysia ●●
Senai, Johor, Malaysia ●●Skudai, Johor, Malaysia ●●
Ibaraki, Japan ●●
Nanjing, China ●Shanghai, China ●●Suzhou, China ●Wuzhong, China ●●
Shenzhen, China ●●●Huangtian, China ●Shiyan, China ●Gushu, China ●●Fuyong, China ●Hong Kong, China ●Dongguan, China ●Zhuhai, China ●●
Singapore ●●●Batam, Indonesia ●
Tianjin, China ●
Pamplona, Spain ●
Milan, Italy ●●Treviso, Italy ●Trieste, Italy ●
Mukachevo, Ukraine ●
Timisoara, Romania ●●
Aguascalientes, MX ●●Guadalajara, MX ●●●
Global Services
Design
Manufacturing
Mechanicals
Burlington, Canada ●Toronto, Canada ●Ottawa, Canada ●
New York Innovation Center
Ronneby, Sweden ●Linkoping, Sweden ●
Corlu, Turkey ●Gebze, Turkey ●
Warrington, UK ●
Sonderborg, Denmark ●Stuttgart, Germany ●
Hägglingen, Switzerland ●Pardubice, Czech Republic ●
Brno, Czech Republic ●Althofen, Austria ●●
Vienna, Austria
Anyang, South Korea ●
25
26
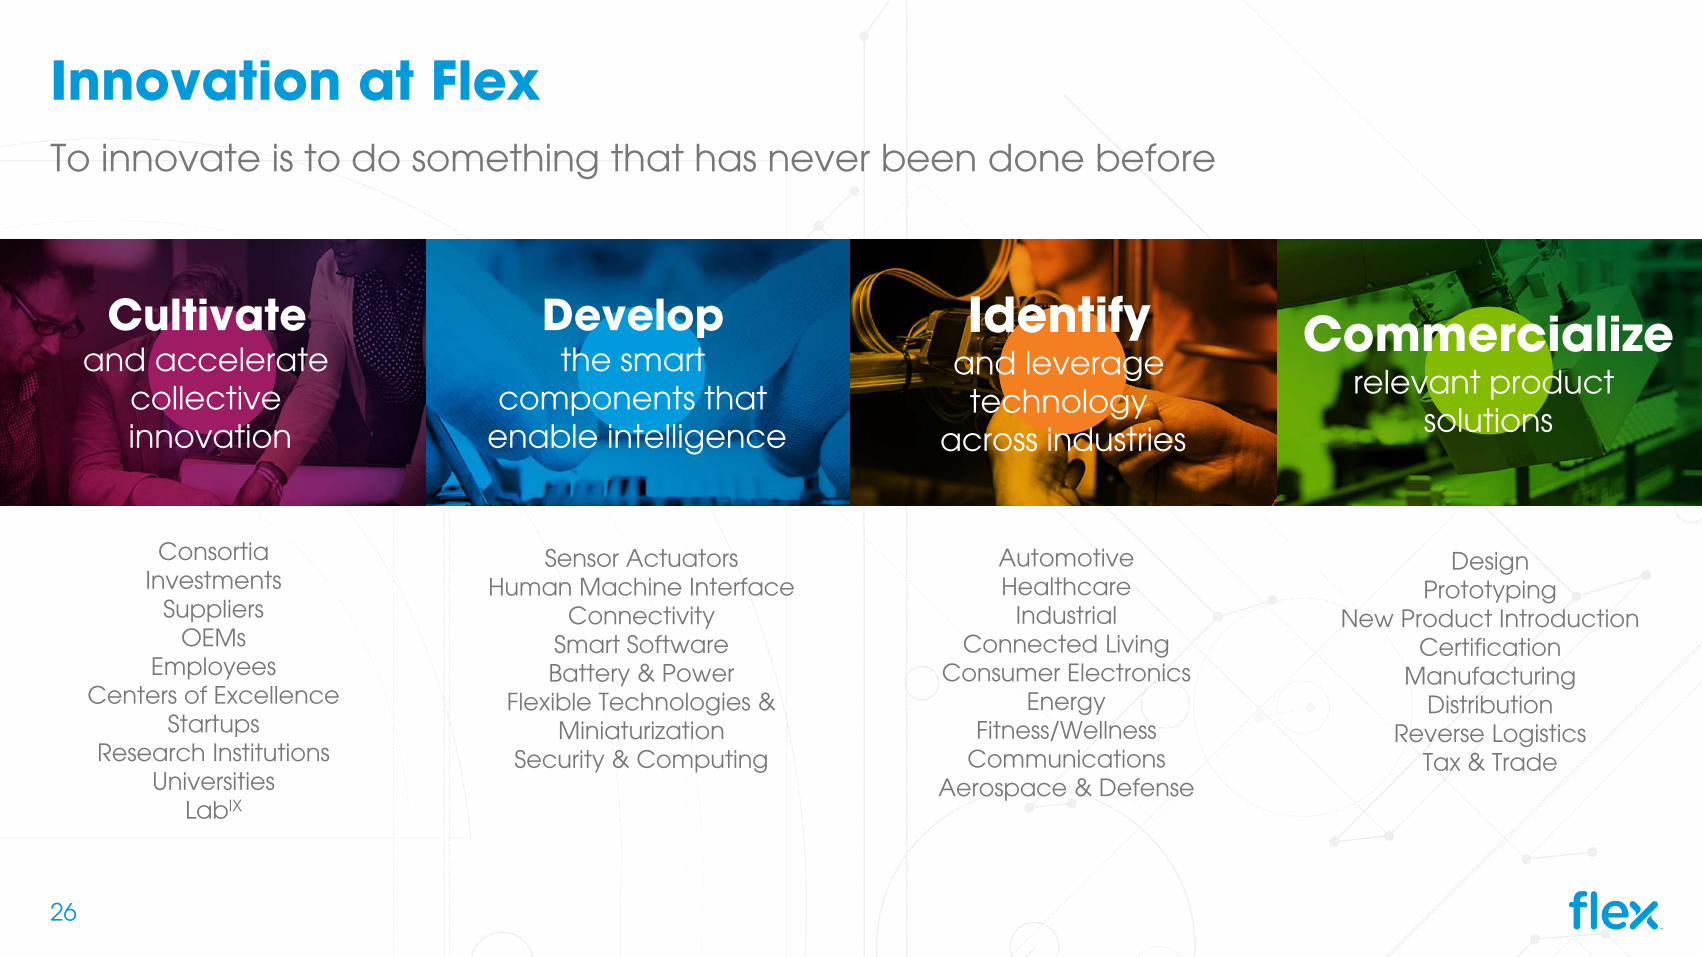
Innovation at FlexTo innovate is to do something that has never been done before
AutomotiveHealthcare
IndustrialConnected Living
Consumer ElectronicsEnergy
Fitness/WellnessCommunications
Aerospace & Defense
ConsortiaInvestments
SuppliersOEMs
EmployeesCenters of Excellence
StartupsResearch Institutions
UniversitiesLabIX
Sensor ActuatorsHuman Machine Interface
ConnectivitySmart SoftwareBattery & Power
Flexible Technologies & Miniaturization
Security & Computing
DesignPrototyping
New Product IntroductionCertification
ManufacturingDistribution
Reverse LogisticsTax & Trade
Cultivateand accelerate
collective innovation
Developthe smart
components that enable intelligence
Identifyand leverage technology
across industries
Commercializerelevant product
solutions
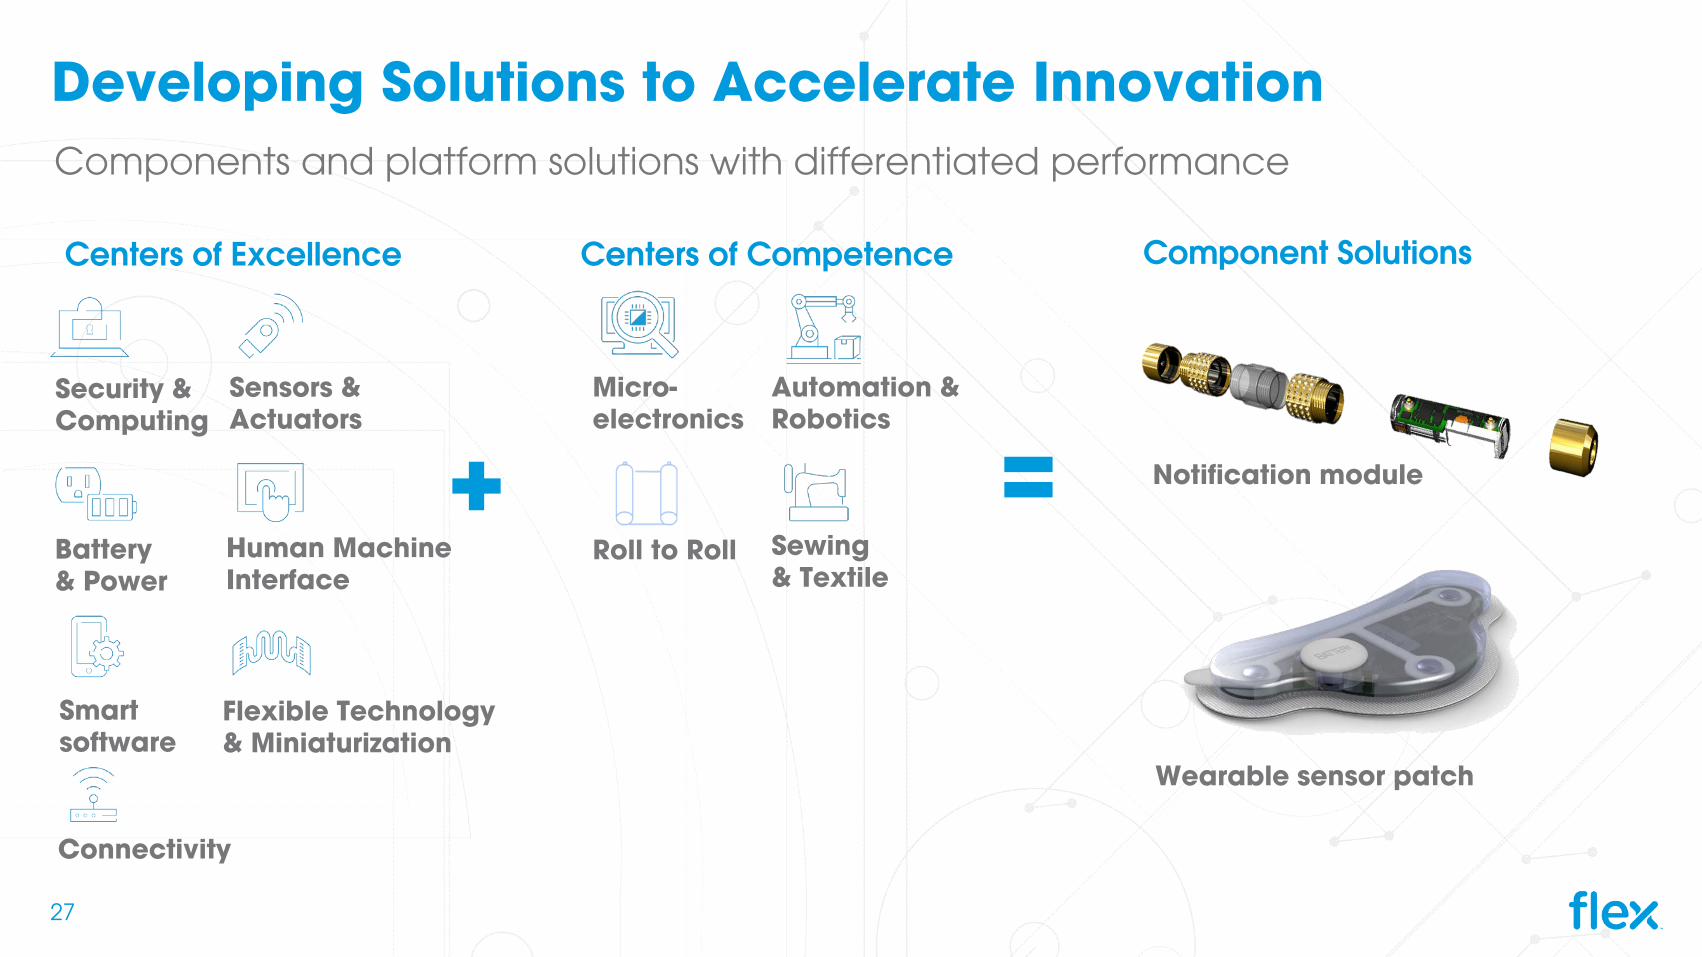
Developing Solutions to Accelerate InnovationComponents and platform solutions with differentiated performance
Sewing & Textile
Automation & Robotics
Centers of Competence
Roll to Roll
Micro-electronics
=+
Centers of Excellence
Connectivity
Flexible Technology & Miniaturization
Smart software
Sensors & Actuators
Security & Computing
Human Machine Interface
Battery & Power
Wearable sensor patch
Notification module
Component Solutions
27
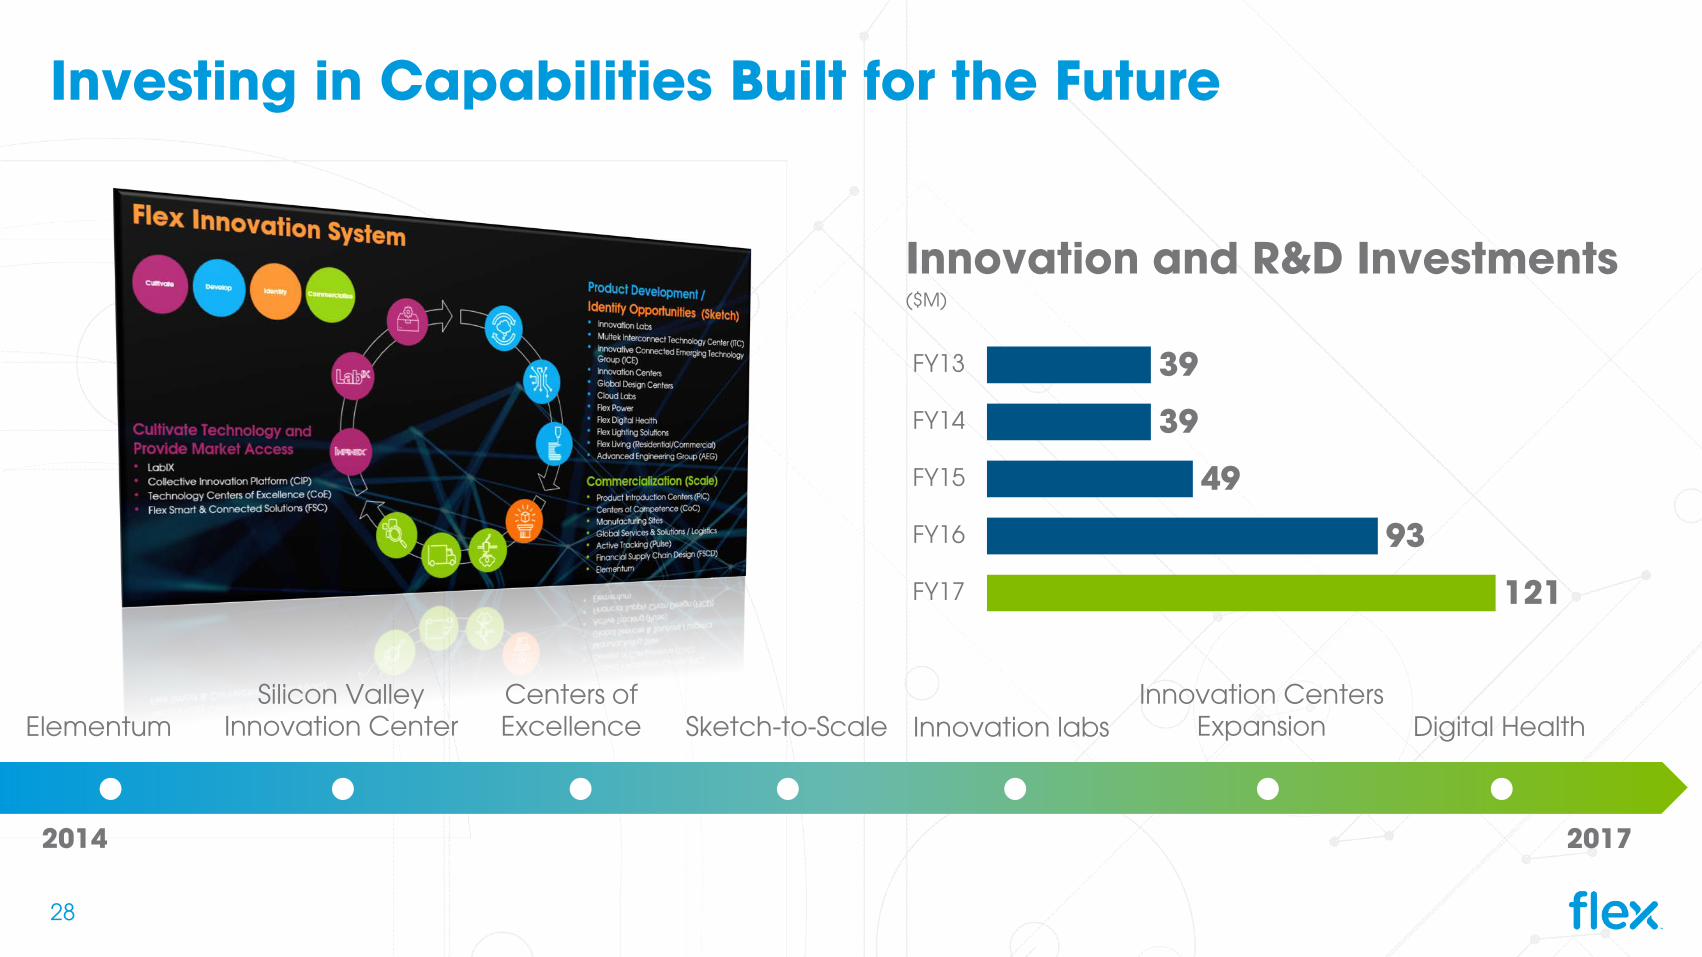
Innovation and R&D Investments($M)
121
93
49
39
39
FY17
FY16
FY15
FY14
FY13
2014
ElementumSilicon Valley
Innovation CenterCenters of Excellence
Innovation Centers Expansion Digital Health
2017• • • • •
Sketch-to-Scale
•Innovation labs
•
Investing in Capabilities Built for the Future
28
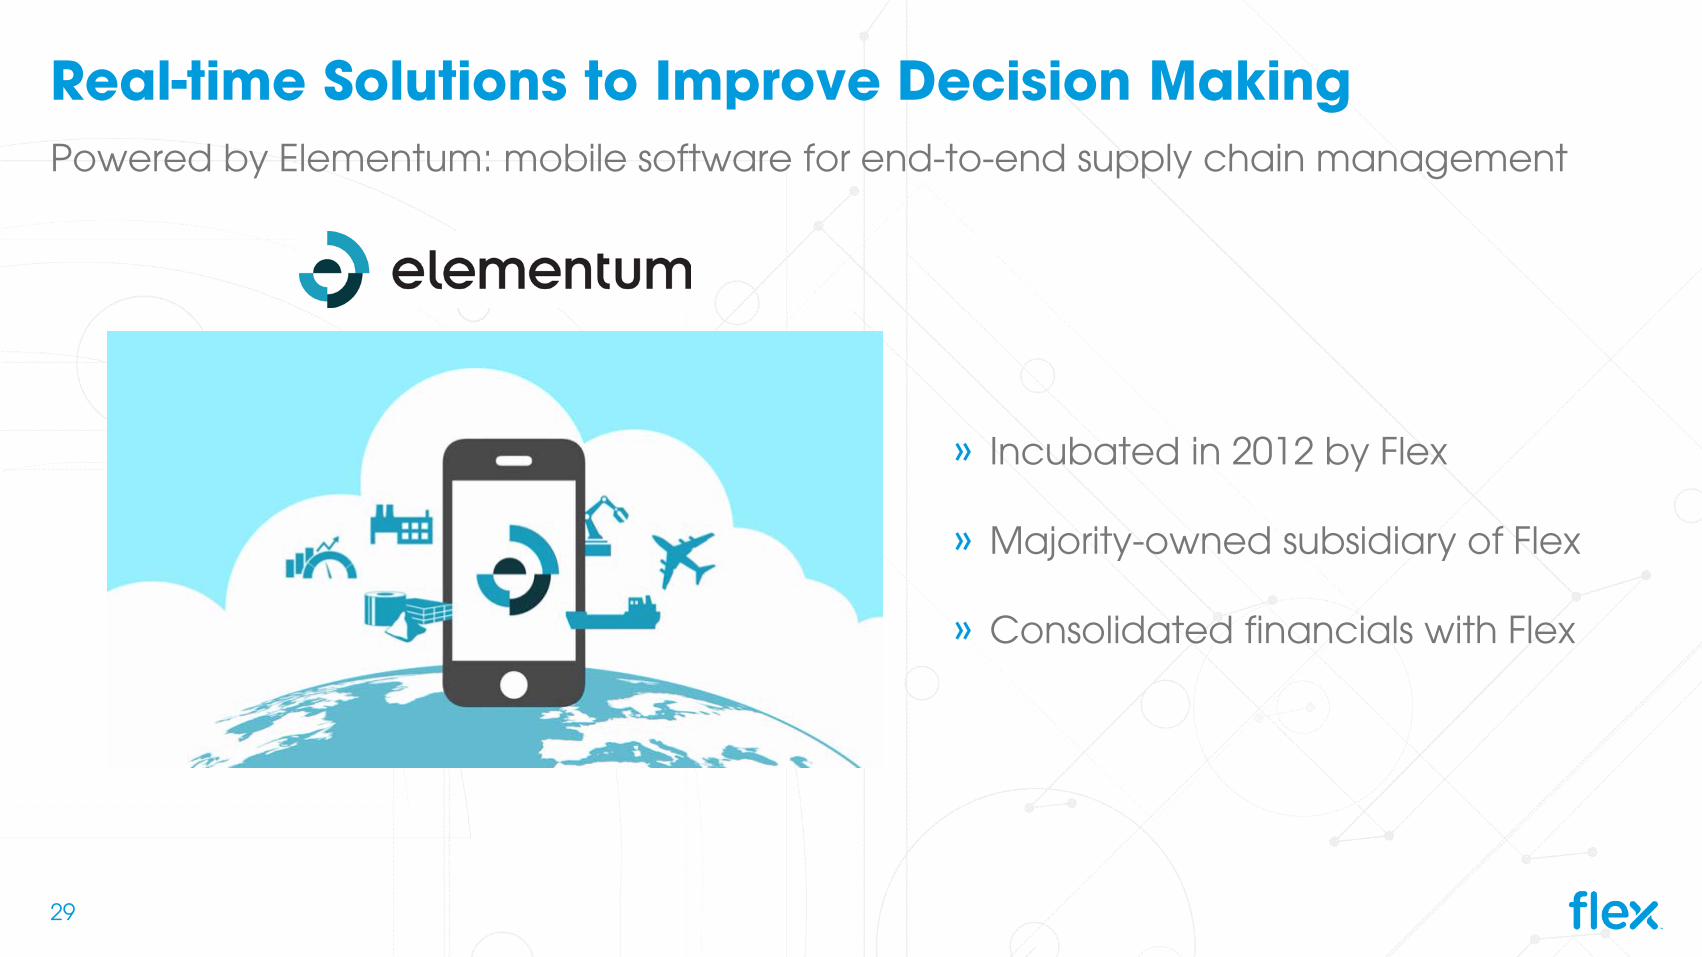
Real-time Solutions to Improve Decision Making
» Incubated in 2012 by Flex
» Majority-owned subsidiary of Flex
» Consolidated financials with Flex
Powered by Elementum: mobile software for end-to-end supply chain management
29
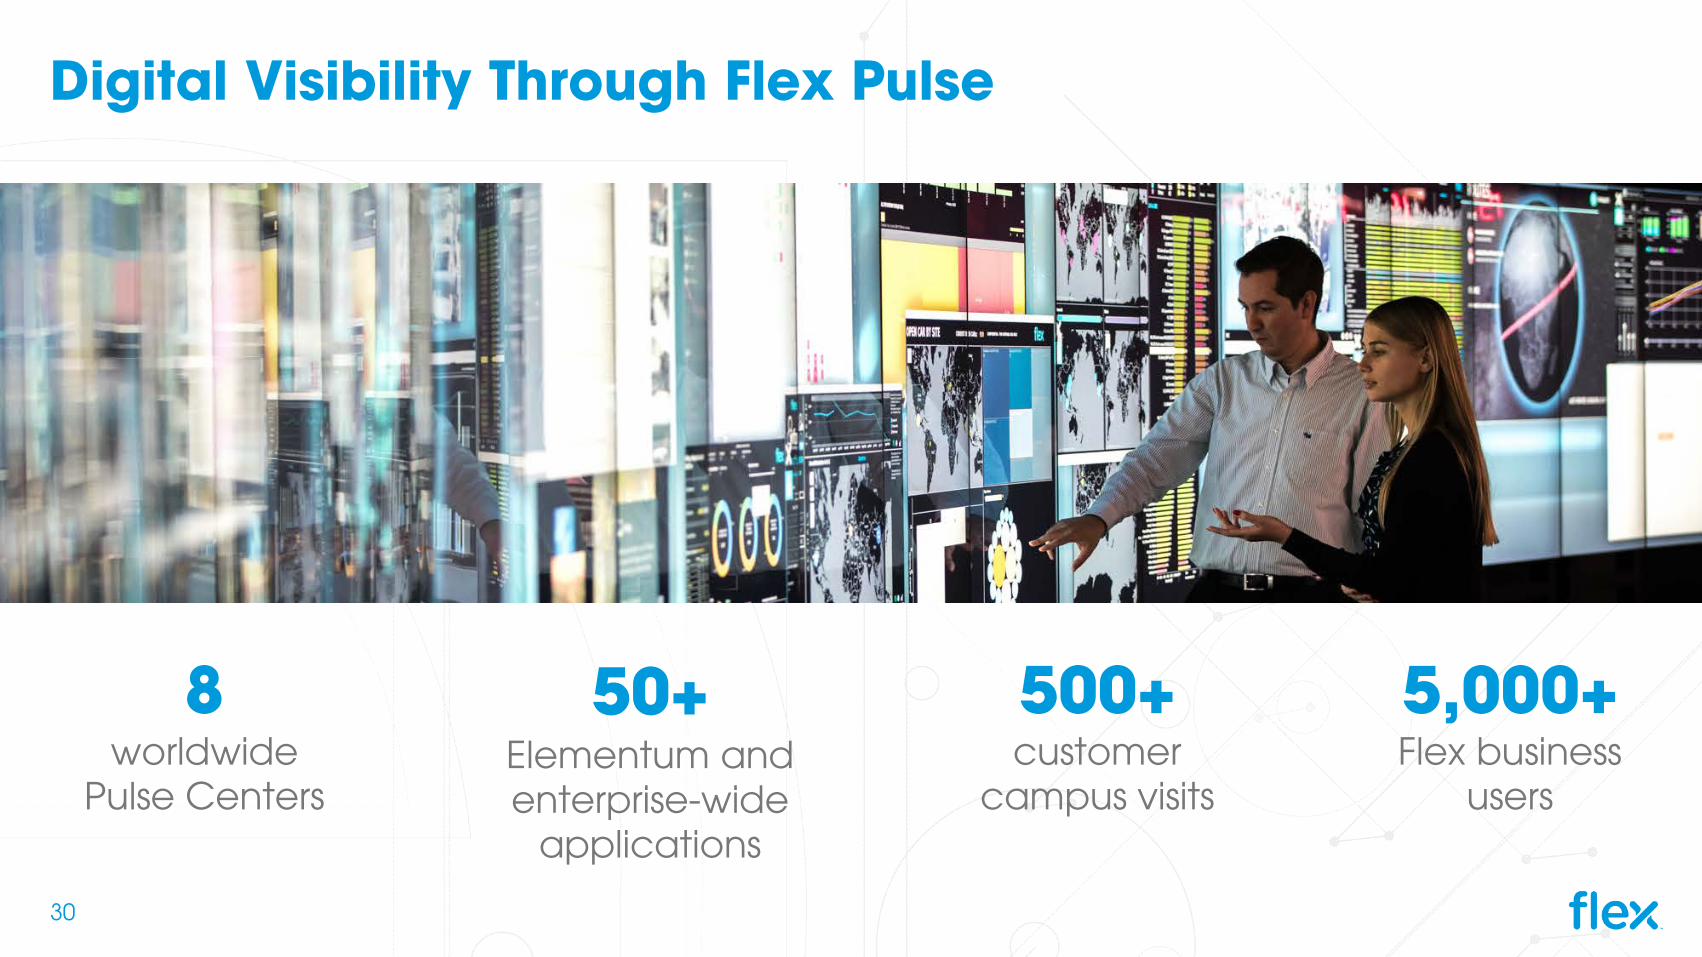
Digital Visibility Through Flex Pulse
50+Elementum and enterprise-wide
applications
8worldwide
Pulse Centers
500+customer
campus visits
5,000+Flex business
users
30
Sketch-to-ScaleTM
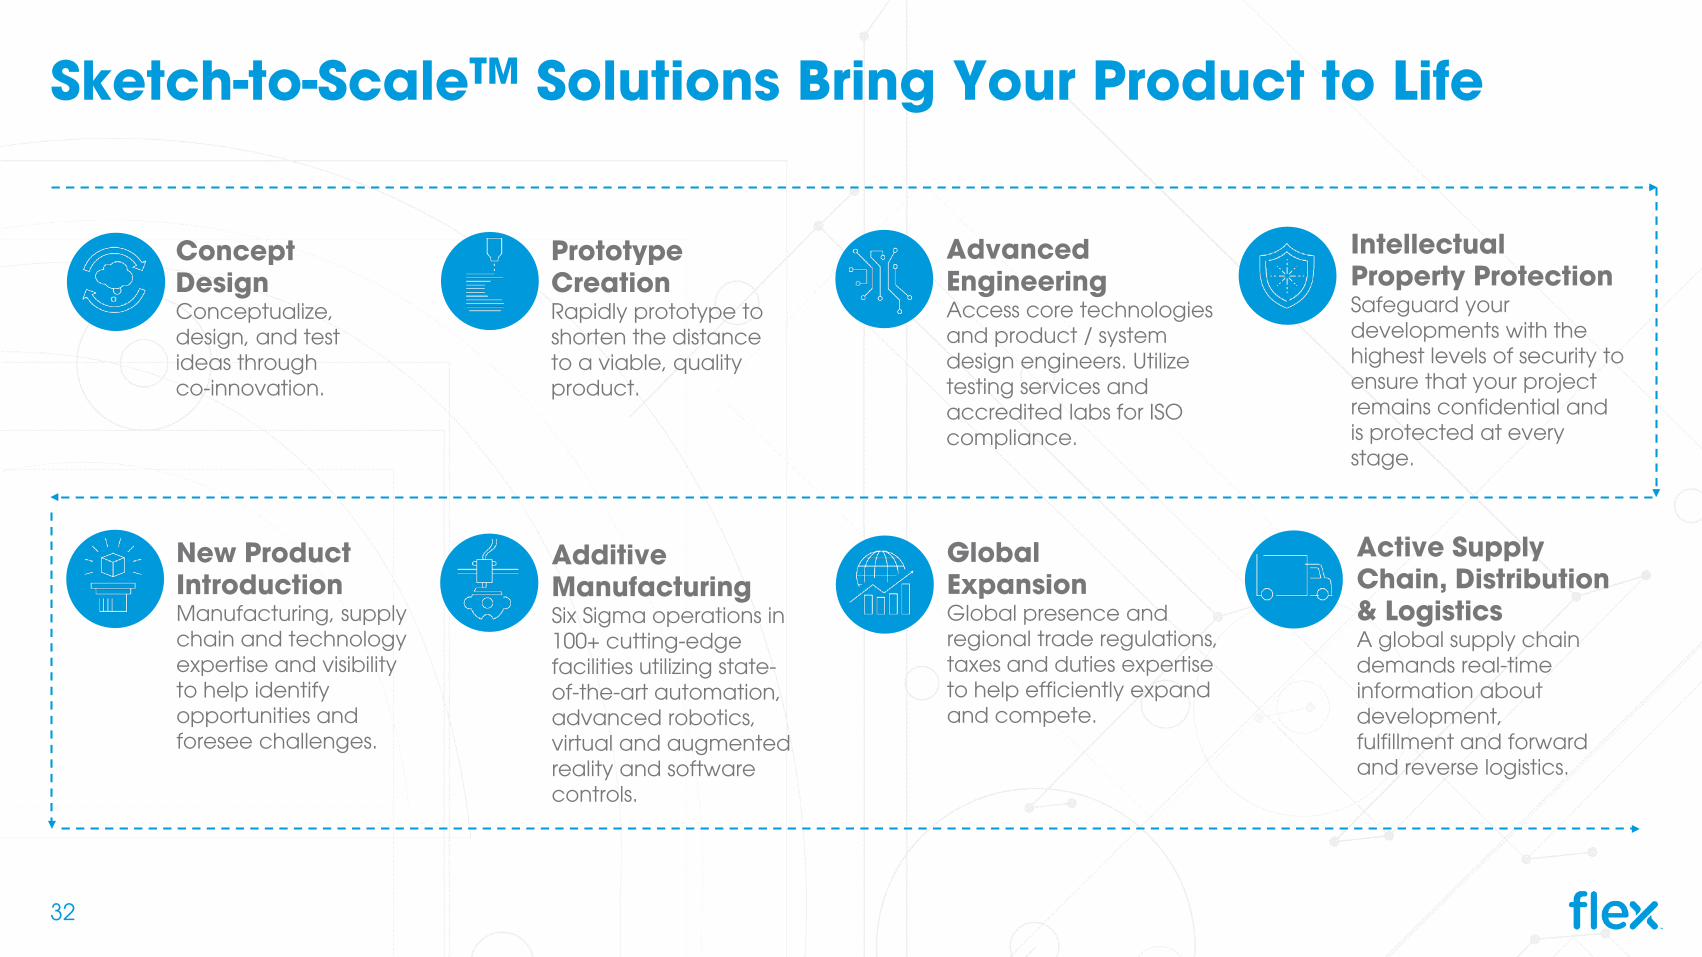
Sketch-to-ScaleTM Solutions Bring Your Product to Life
Intellectual Property ProtectionSafeguard your developments with the highest levels of security to ensure that your project remains confidential and is protected at every stage.
Concept DesignConceptualize, design, and test ideas through co-innovation.
Additive ManufacturingSix Sigma operations in 100+ cutting-edge facilities utilizing state-of-the-art automation, advanced robotics, virtual and augmented reality and software controls.
Advanced EngineeringAccess core technologiesand product / system design engineers. Utilize testing services and accredited labs for ISO compliance.
Global ExpansionGlobal presence and regional trade regulations, taxes and duties expertise to help efficiently expand and compete.
Active Supply Chain, Distribution & LogisticsA global supply chain demands real-time information about development, fulfillment and forward and reverse logistics.
New Product IntroductionManufacturing, supply chain and technology expertise and visibility to help identify opportunities and foresee challenges.
Prototype CreationRapidly prototype to shorten the distance to a viable, quality product.
32
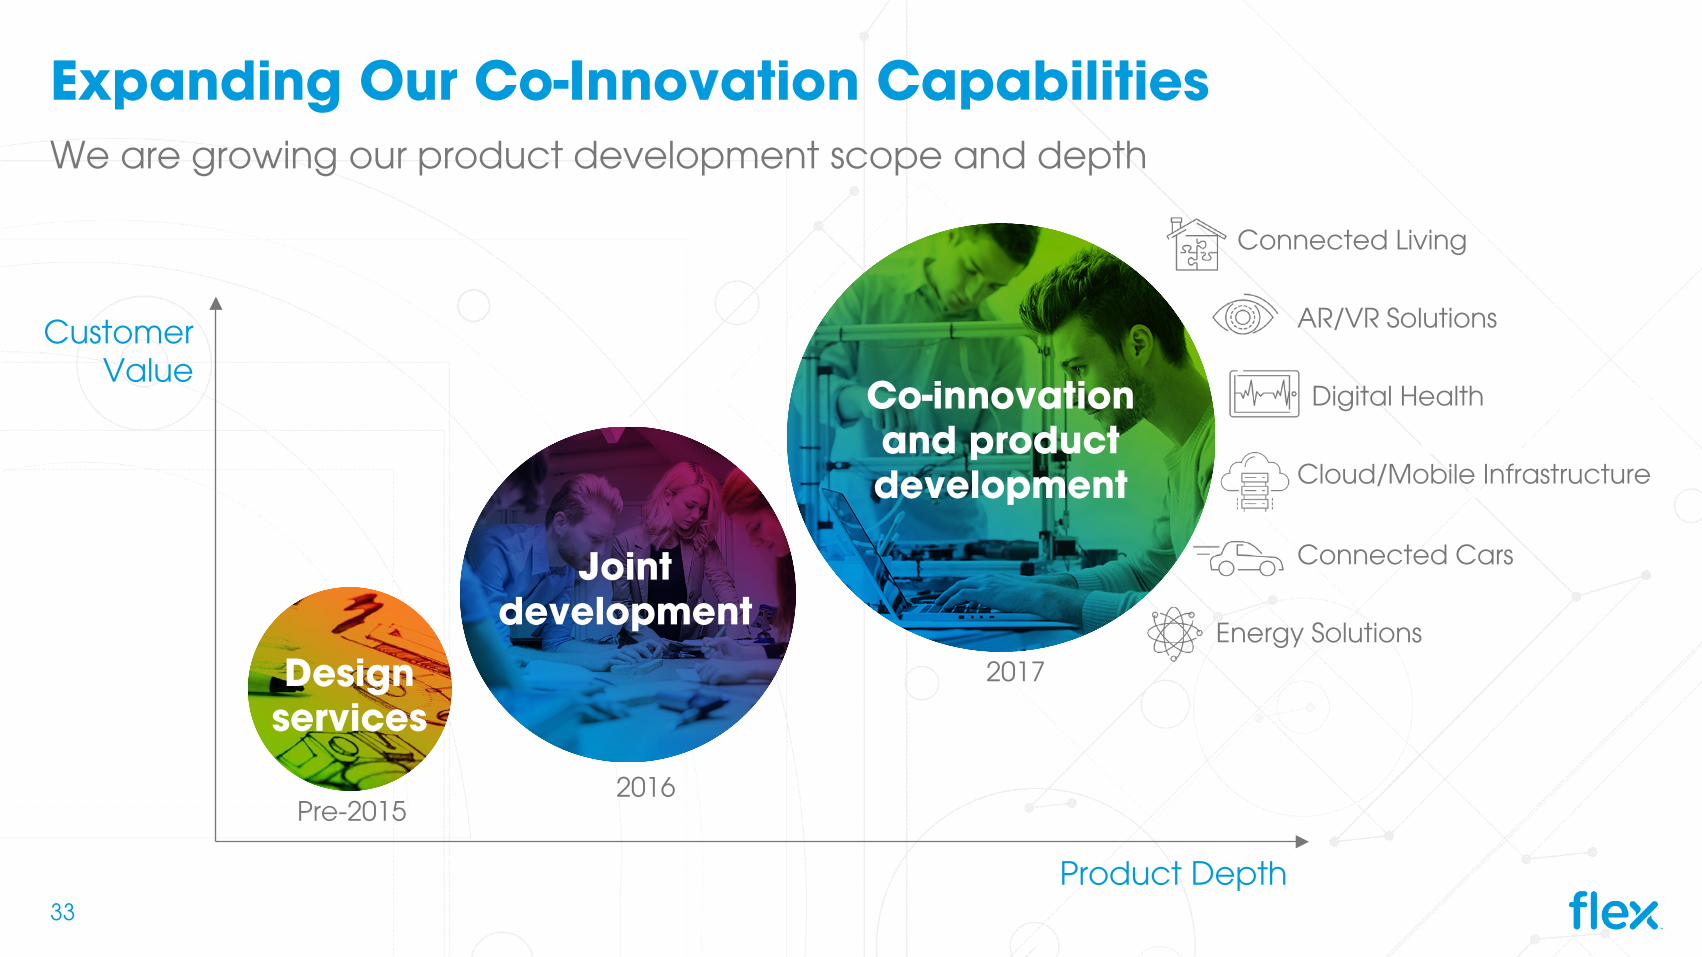
Expanding Our Co-Innovation CapabilitiesWe are growing our product development scope and depth
Design services
Joint development
Co-innovation and product development
Pre-20152016
2017
Connected Living
AR/VR Solutions
Digital Health
Cloud/Mobile Infrastructure
Connected Cars
Energy Solutions
CustomerValue
Product Depth33
Co-innovation and product development
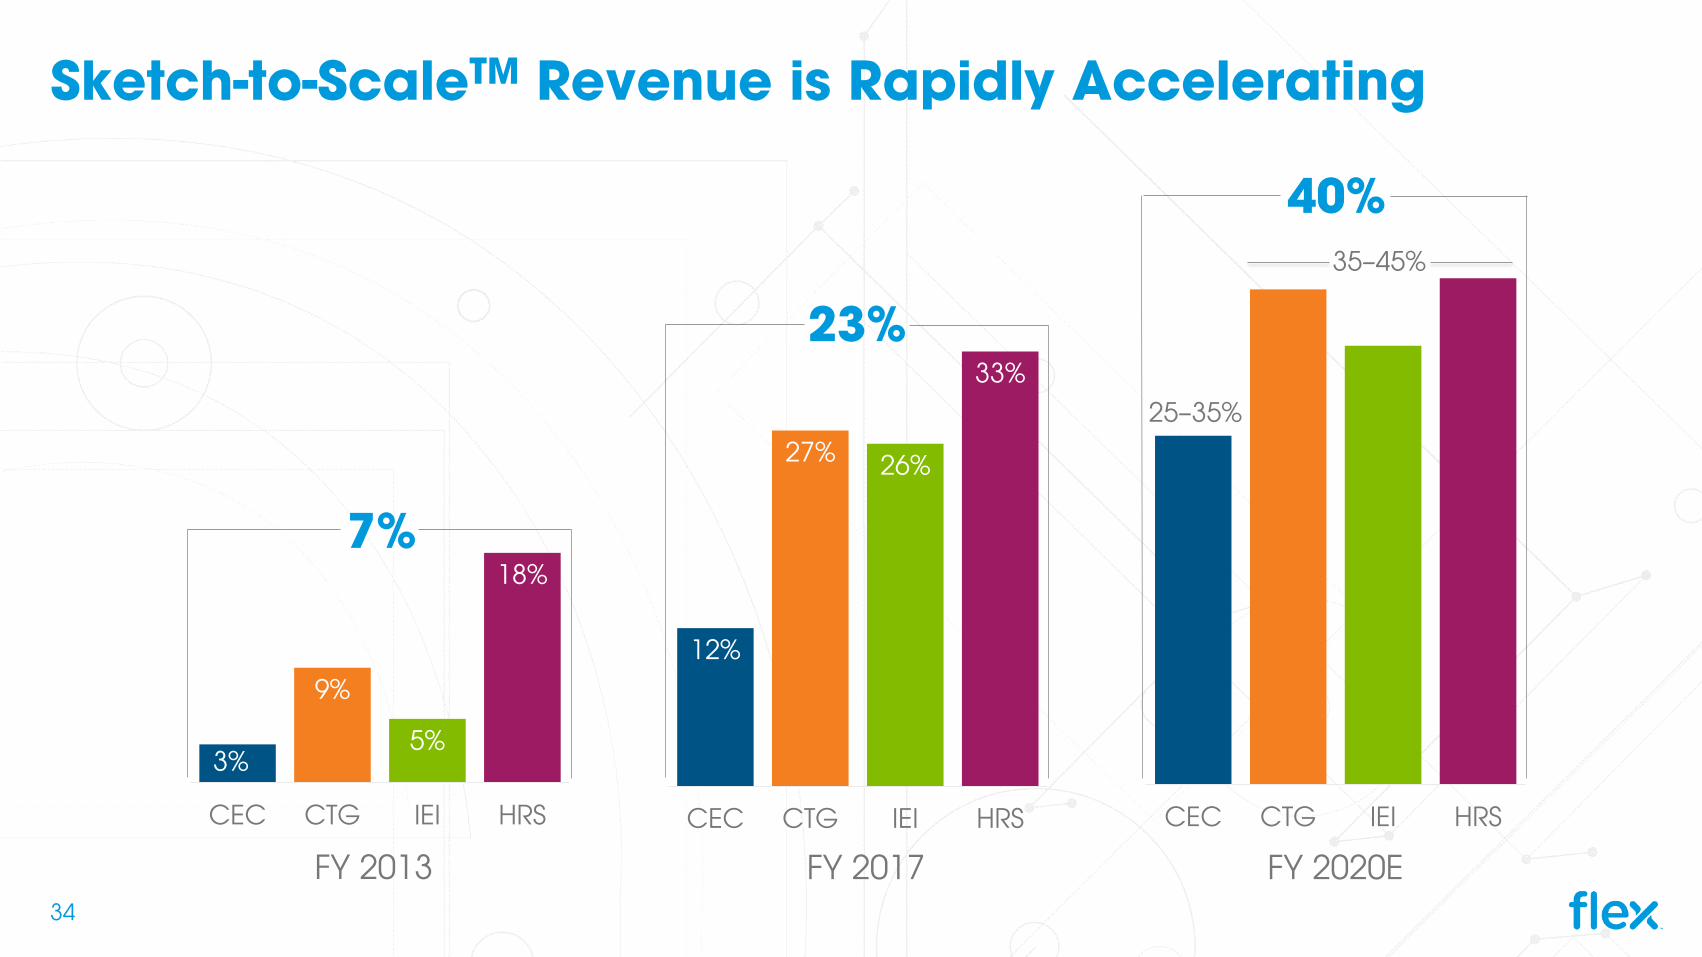
3%
9%
5%
18%
CEC CTG IEI HRS
7%
12%
27% 26%
33%
CEC CTG IEI HRS
Sketch-to-ScaleTM Revenue is Rapidly Accelerating
FY 2013
CEC CTG IEI HRS
FY 2020E
40%
FY 2017
23%
25–35%
35–45%
34
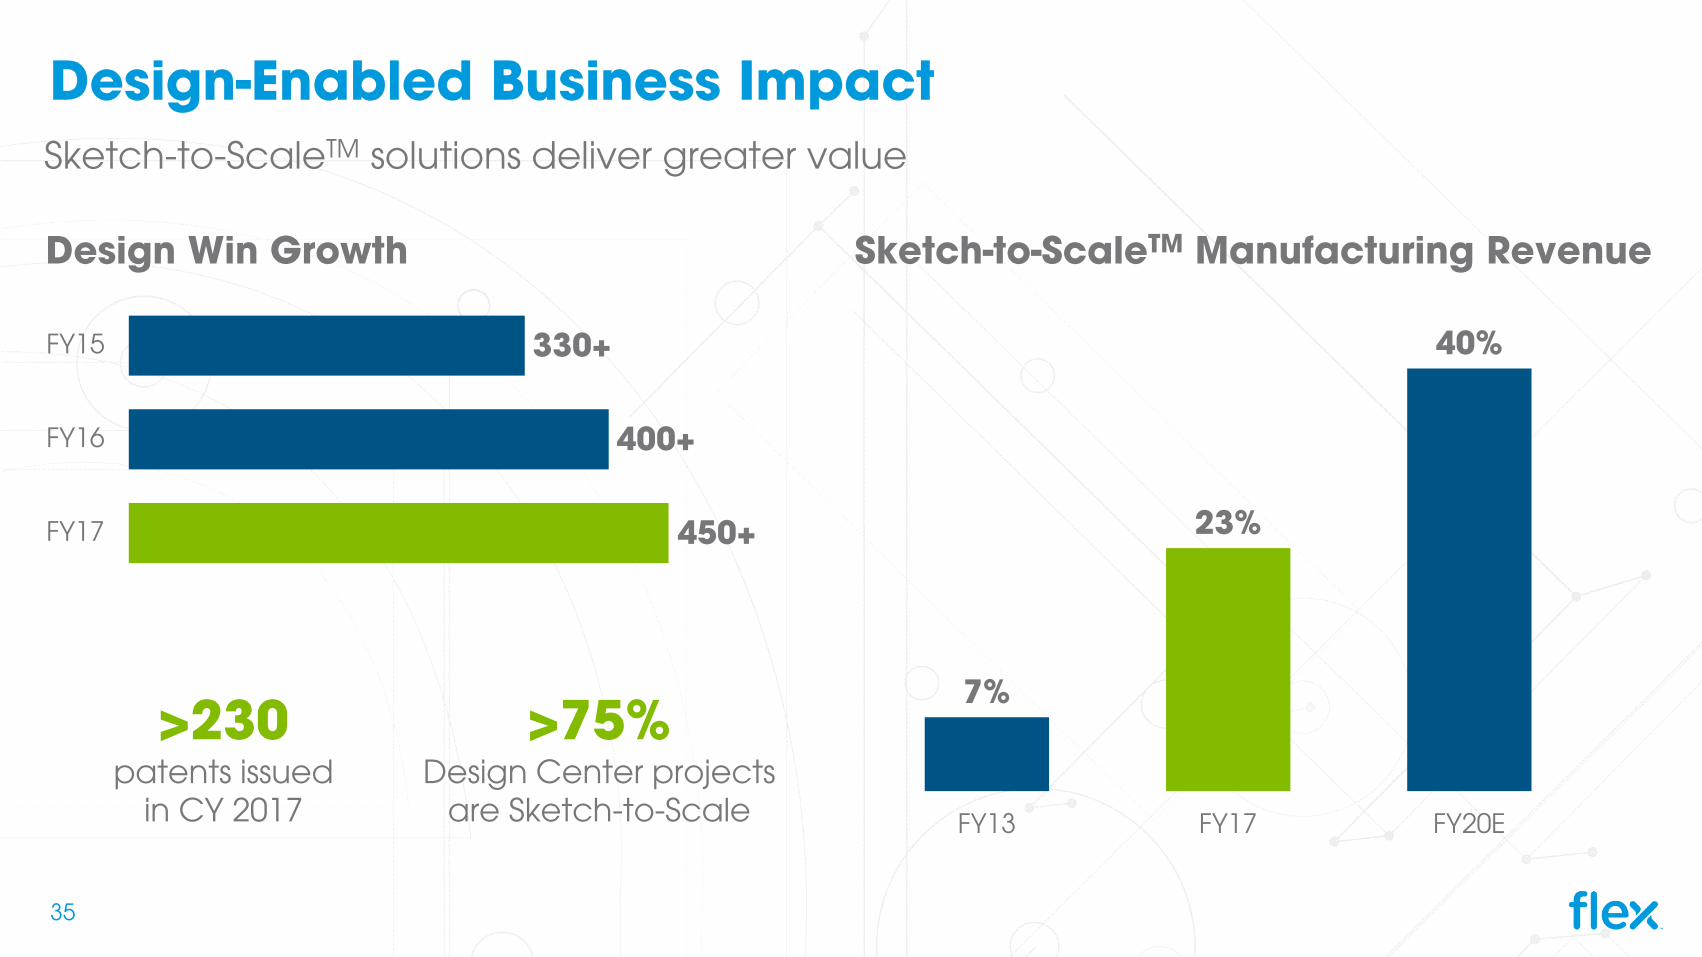
Design-Enabled Business Impact
Sketch-to-ScaleTM Manufacturing Revenue
>75% Design Center projects
are Sketch-to-Scale
Design Win Growth
>230 patents issued
in CY 2017
450+
400+
330+
FY17
FY16
FY15
7%
23%
40%
FY13 FY17 FY20E
Sketch-to-ScaleTM solutions deliver greater value
35
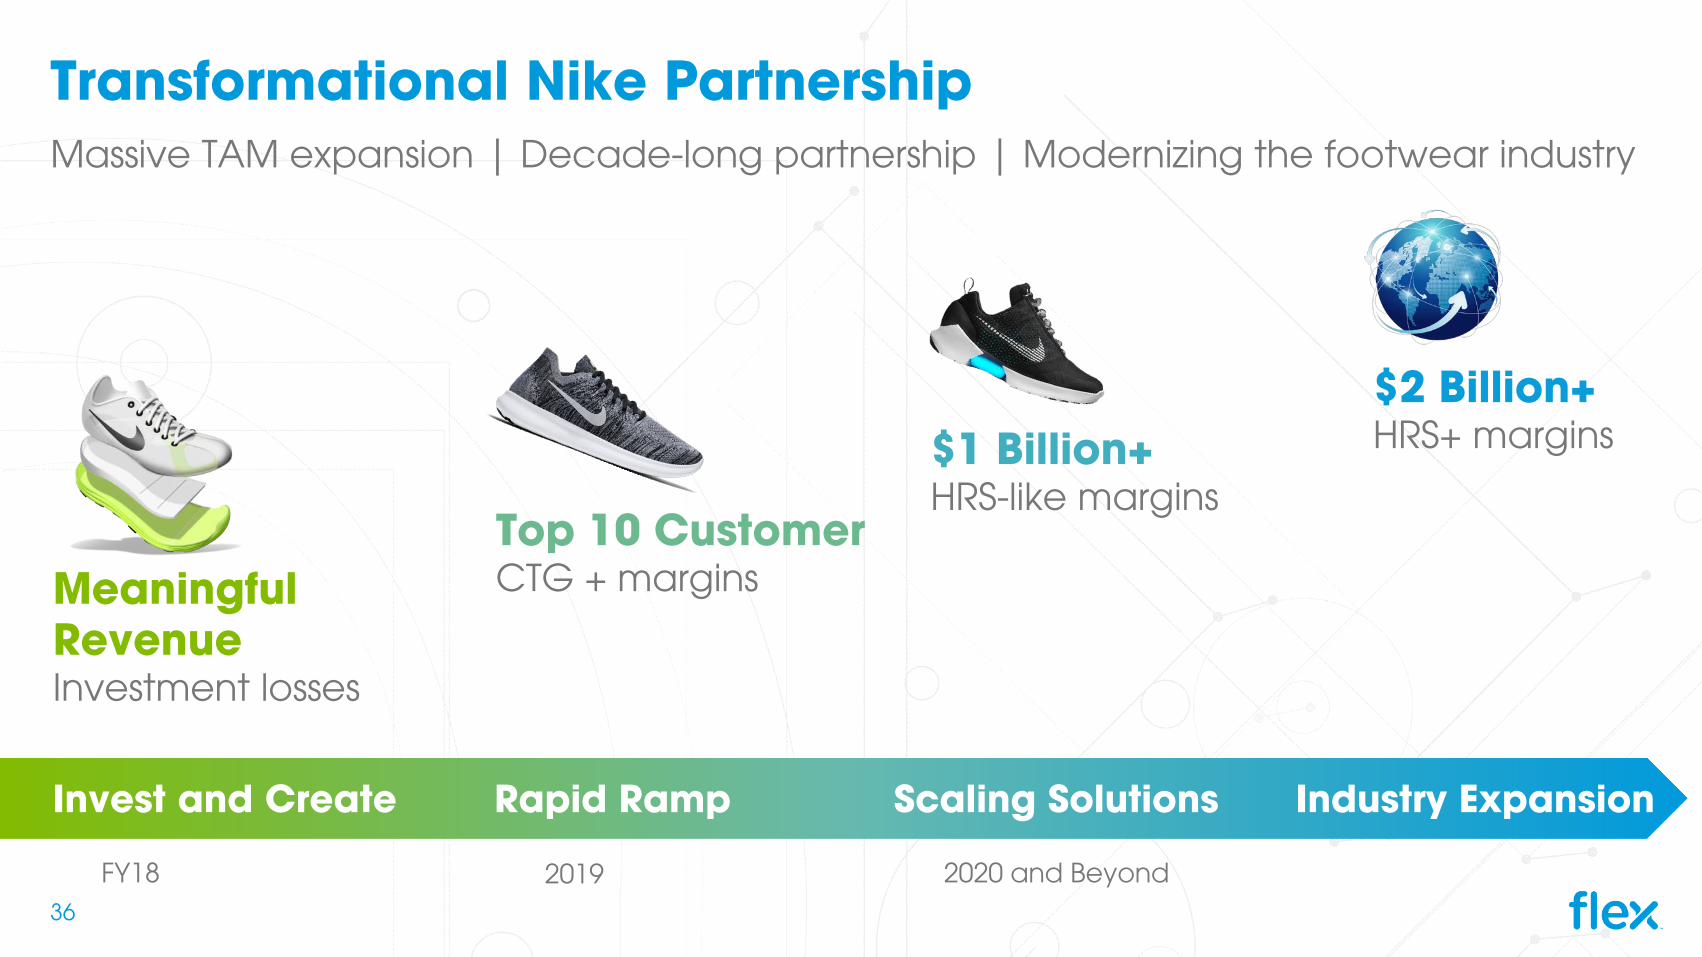
Transformational Nike Partnership
Meaningful RevenueInvestment losses
Top 10 CustomerCTG + margins
$2 Billion+ HRS+ margins
Massive TAM expansion | Decade-long partnership | Modernizing the footwear industry
Invest and Create Rapid Ramp Industry Expansion
FY18 2019 2020 and Beyond
Scaling Solutions
$1 Billion+ HRS-like margins
36
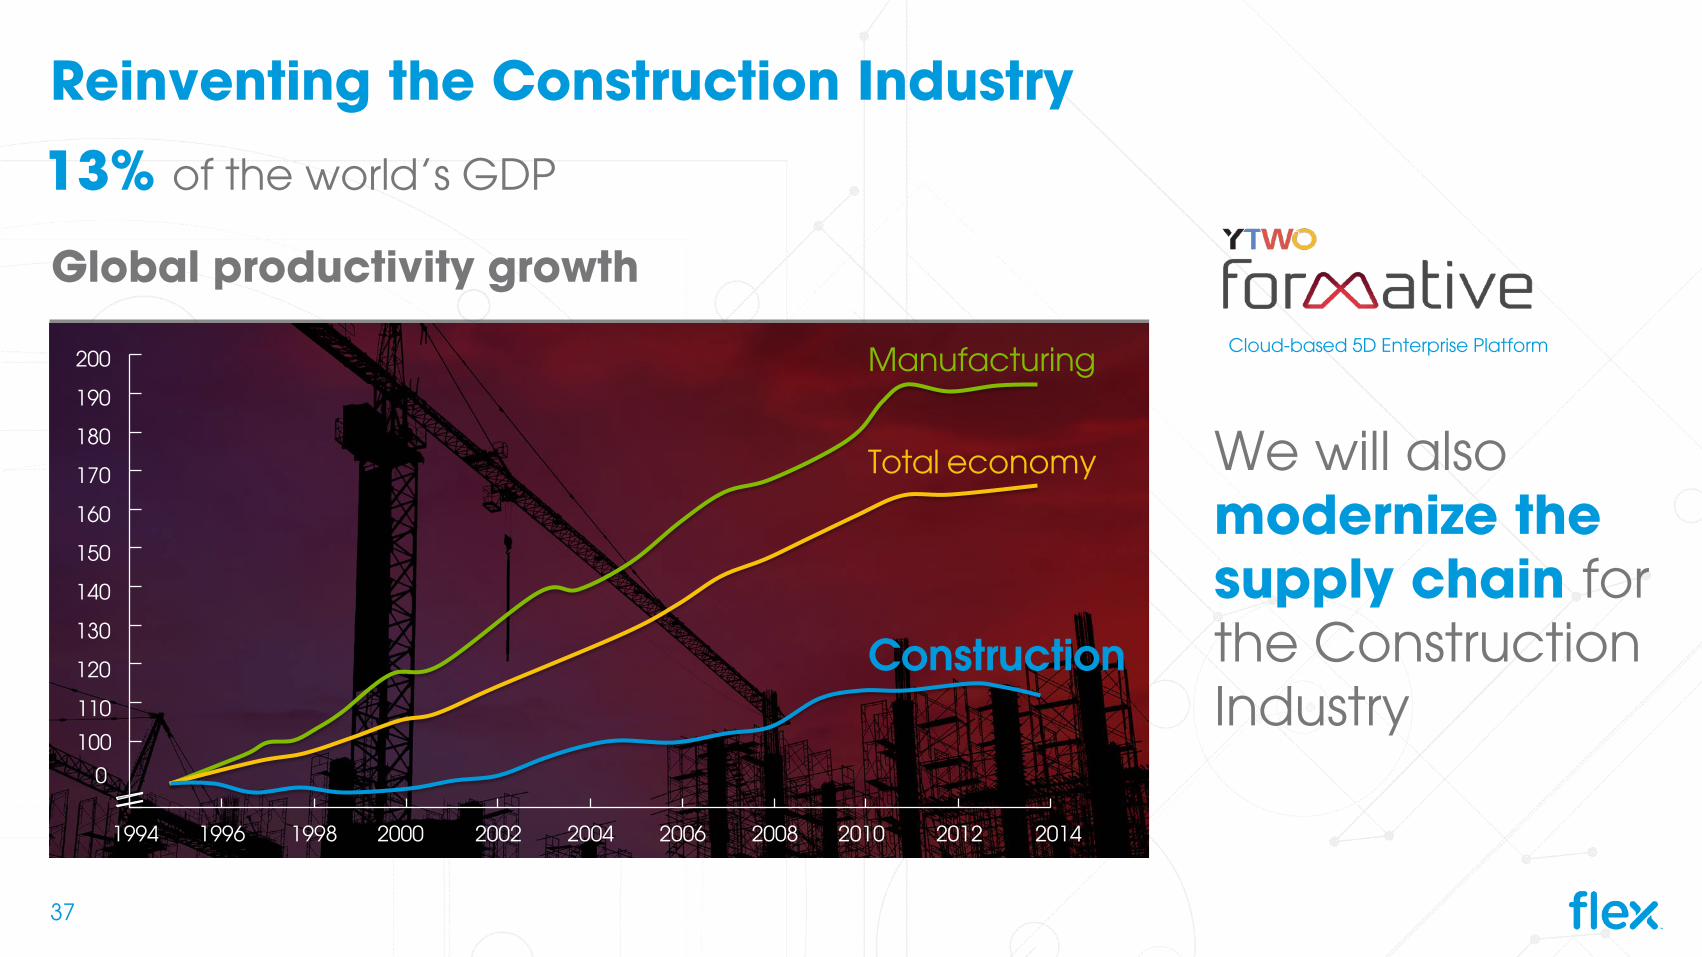
Reinventing the Construction Industry
(McKinsey, 2016) Real gross value added per hour worked by persons engaged, Indexed 1995 = 100
Global productivity growth
1994 1996 1998 2000 2002 2004 2006 2008 2010 2012 2014
Construction
Total economy
Manufacturing200
190
180
170
160
150
140
130
120
110
100
0
We will also modernize the supply chain for the Construction Industry
13% of the world’s GDP
37
Cloud-based 5D Enterprise Platform
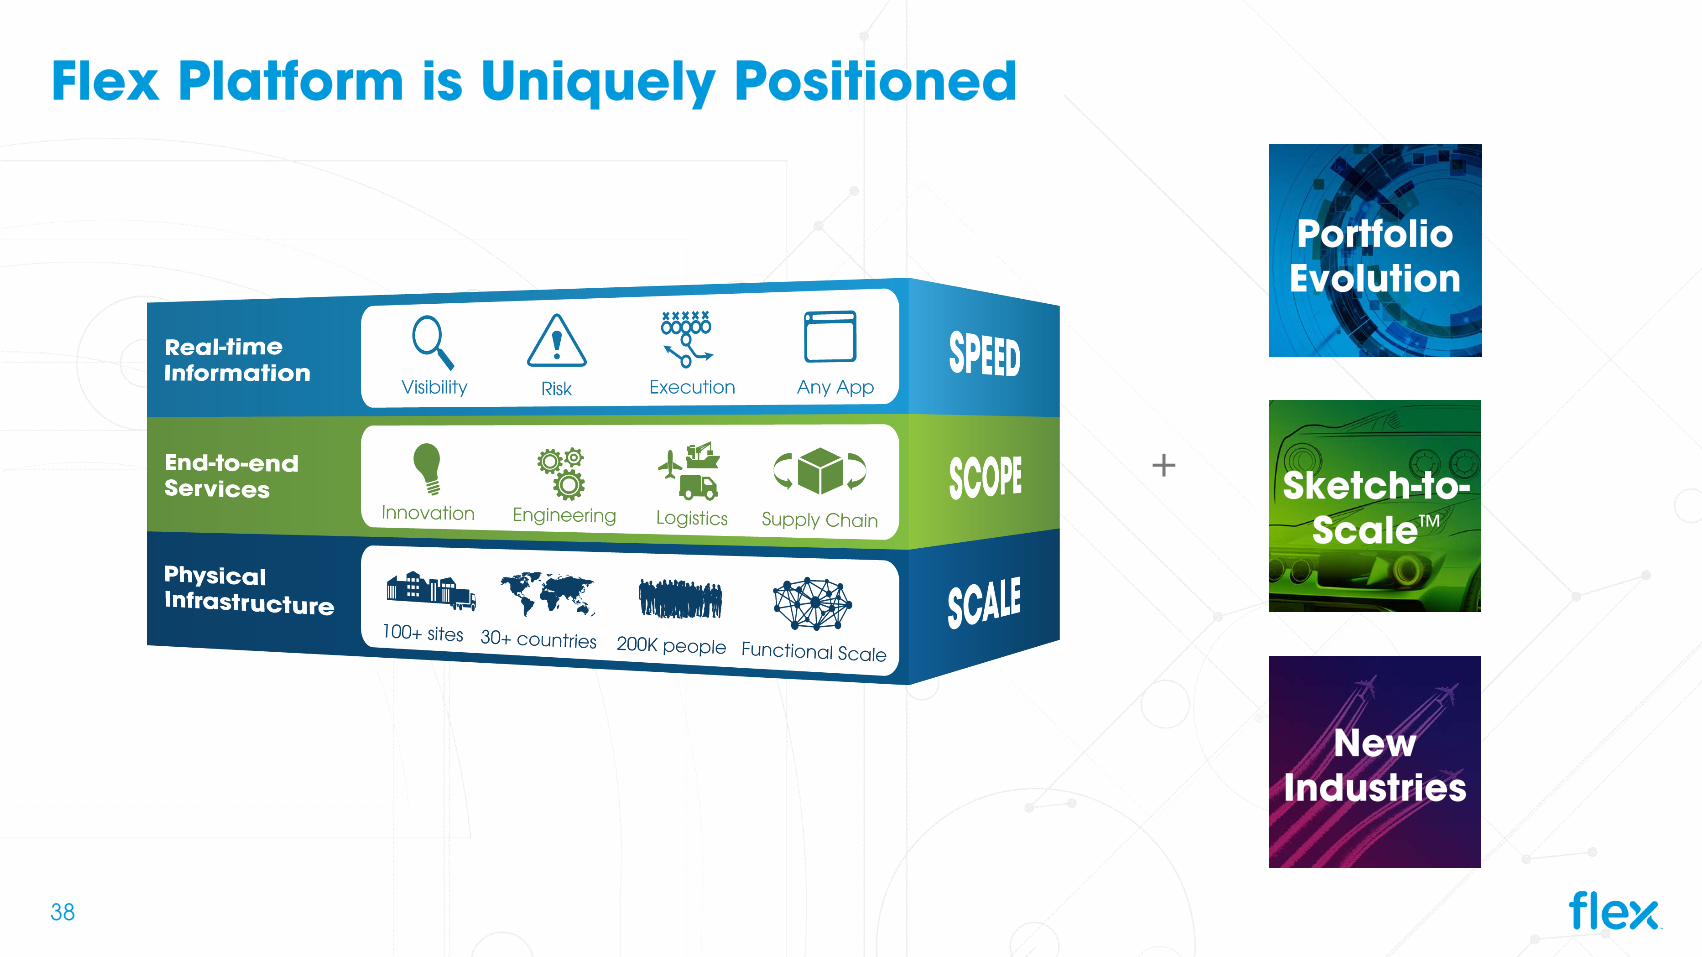
Flex Platform is Uniquely Positioned
+
New Industries
Portfolio Evolution
Sketch-to-ScaleTM
38
Richer Business Mix
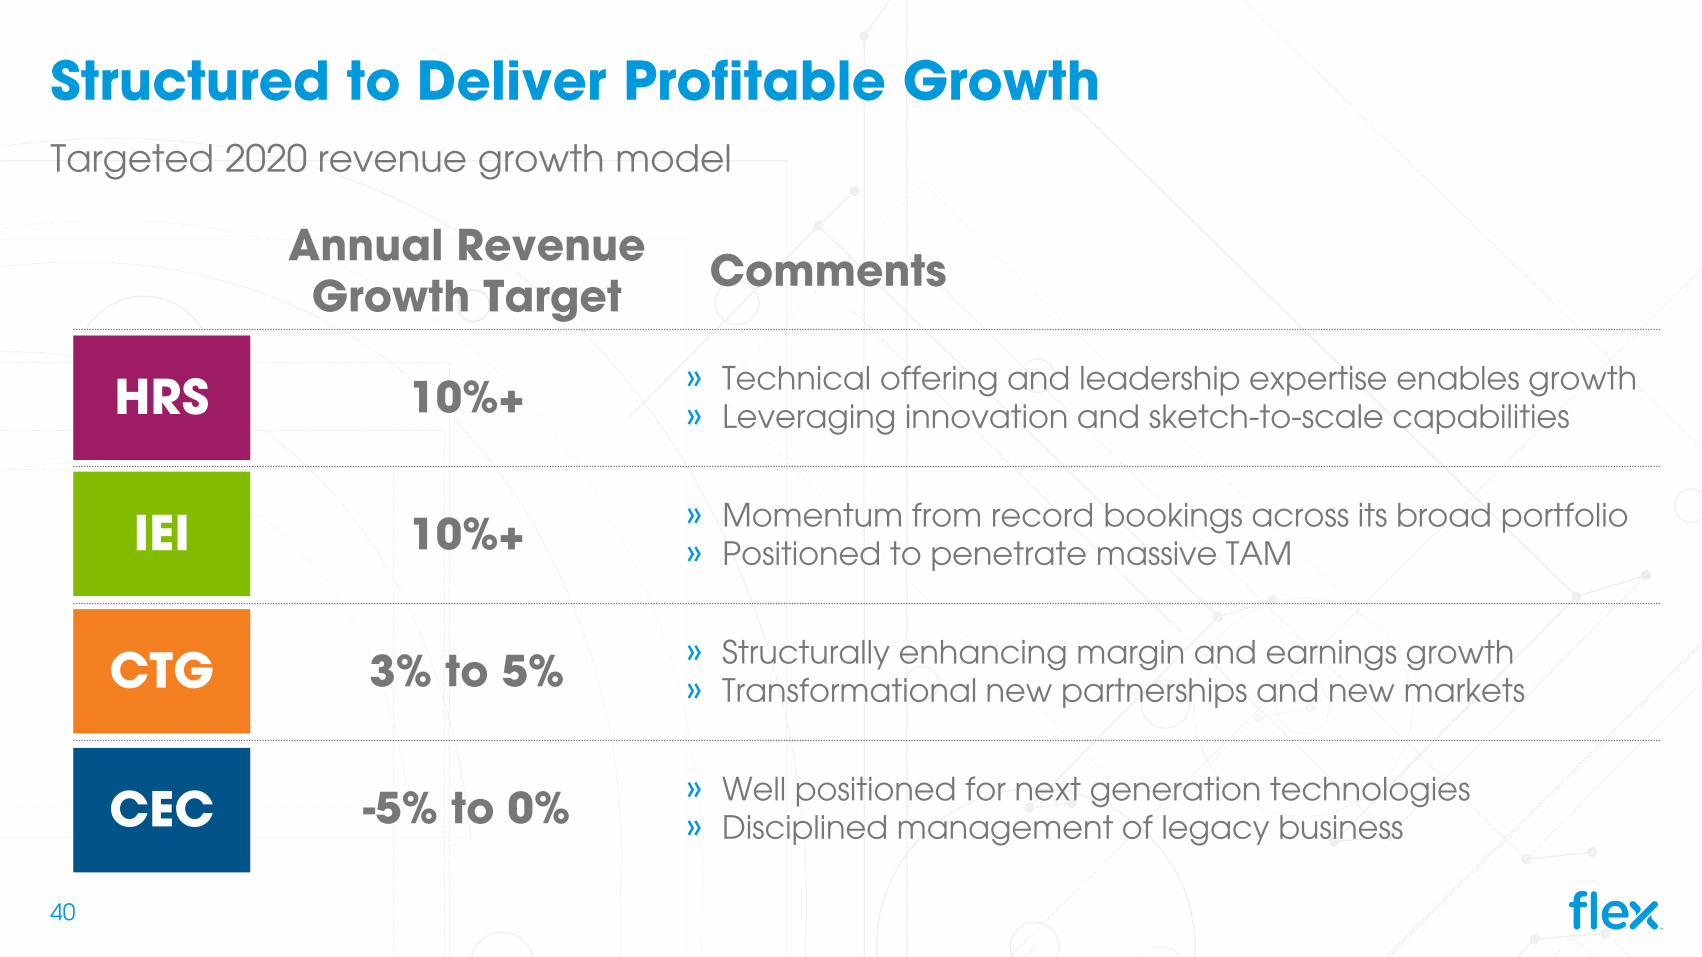
Structured to Deliver Profitable Growth
Annual RevenueGrowth Target Comments
10%+ » Technical offering and leadership expertise enables growth» Leveraging innovation and sketch-to-scale capabilities
10%+ » Momentum from record bookings across its broad portfolio» Positioned to penetrate massive TAM
3% to 5% » Structurally enhancing margin and earnings growth» Transformational new partnerships and new markets
-5% to 0% » Well positioned for next generation technologies» Disciplined management of legacy business
HRS
IEI
CTG
CEC
Targeted 2020 revenue growth model
40

FY17 Adjusted Operating
Target Adjusted Operating Margin
Profit($M)
Margin Range
$334 8.1% 6–9%
$180 3.6% 4–6%
$180 2.8% 2–4%
$229 2.7% 2.5–3.5%Corporateservices and other2
($108)
$815 3.4%
Positioned for Operating Profit and Margin Expansion
HRSIEI
CTGCEC
Targeted Adjusted Operating Profit Mix
Targeted 2020 delivers profit growth
FY20E
HRS
IEI
CTG
CEC
~60%
41
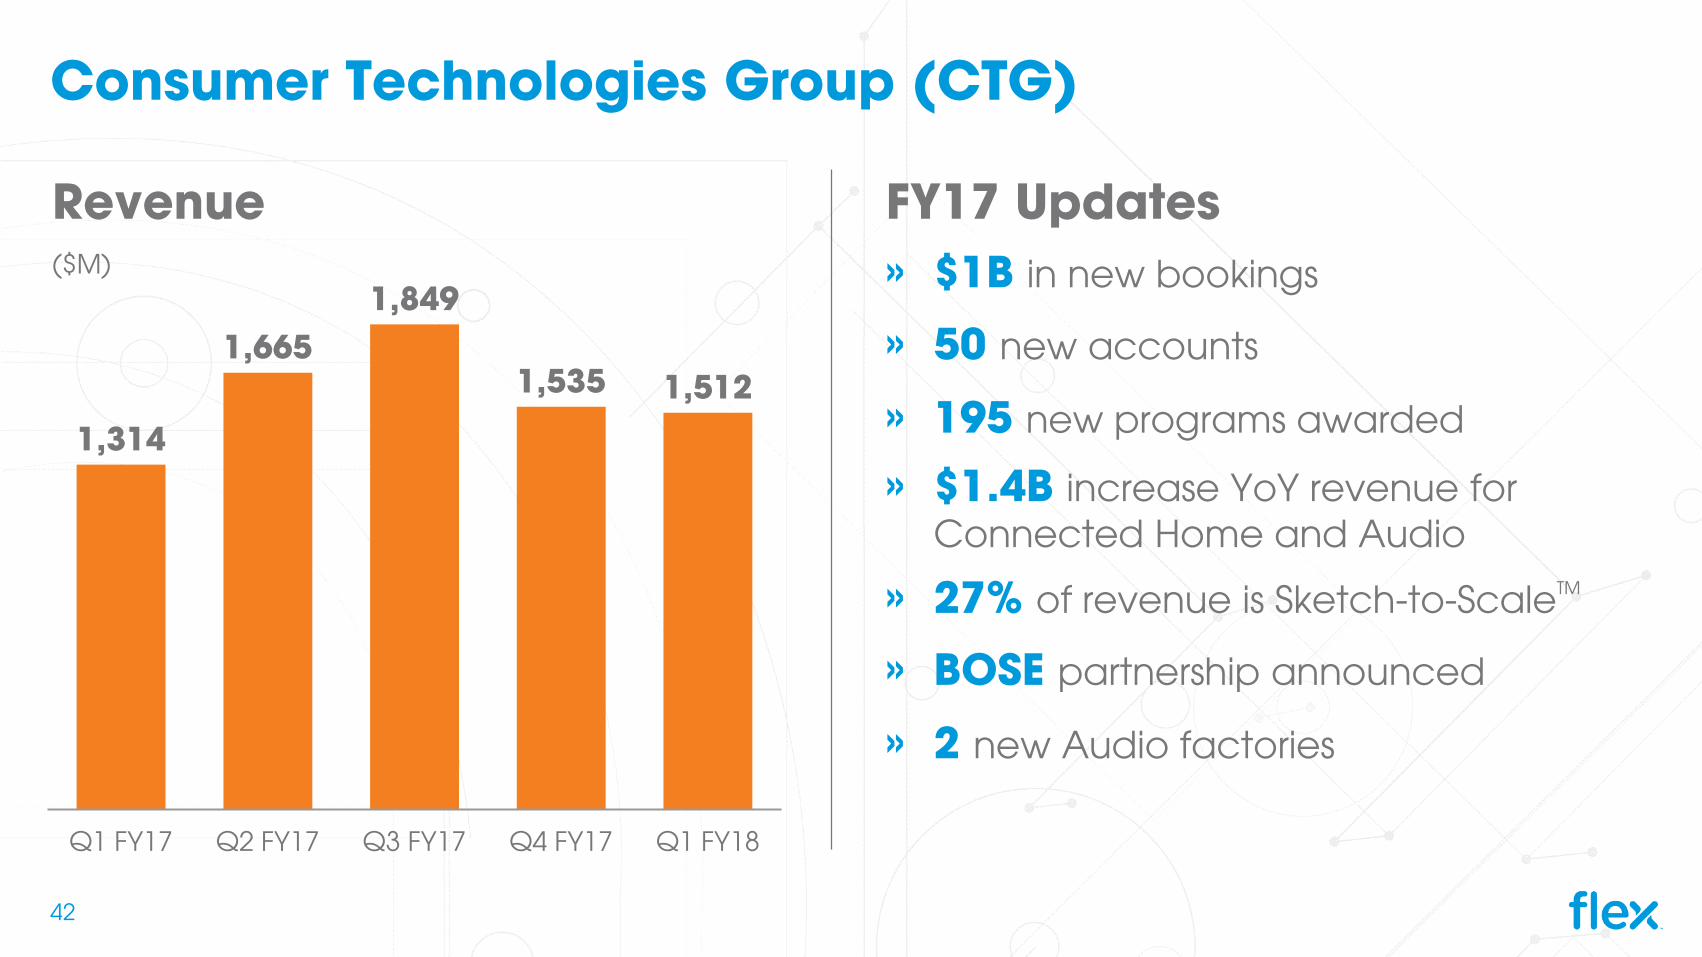
Consumer Technologies Group (CTG)
Revenue ($M)
1,314
1,665 1,849
1,535 1,512
Q1 FY17 Q2 FY17 Q3 FY17 Q4 FY17 Q1 FY18
FY17 Updates» $1B in new bookings
» 50 new accounts
» 195 new programs awarded
» $1.4B increase YoY revenue for Connected Home and Audio
» 27% of revenue is Sketch-to-ScaleTM
» BOSE partnership announced
» 2 new Audio factories
42
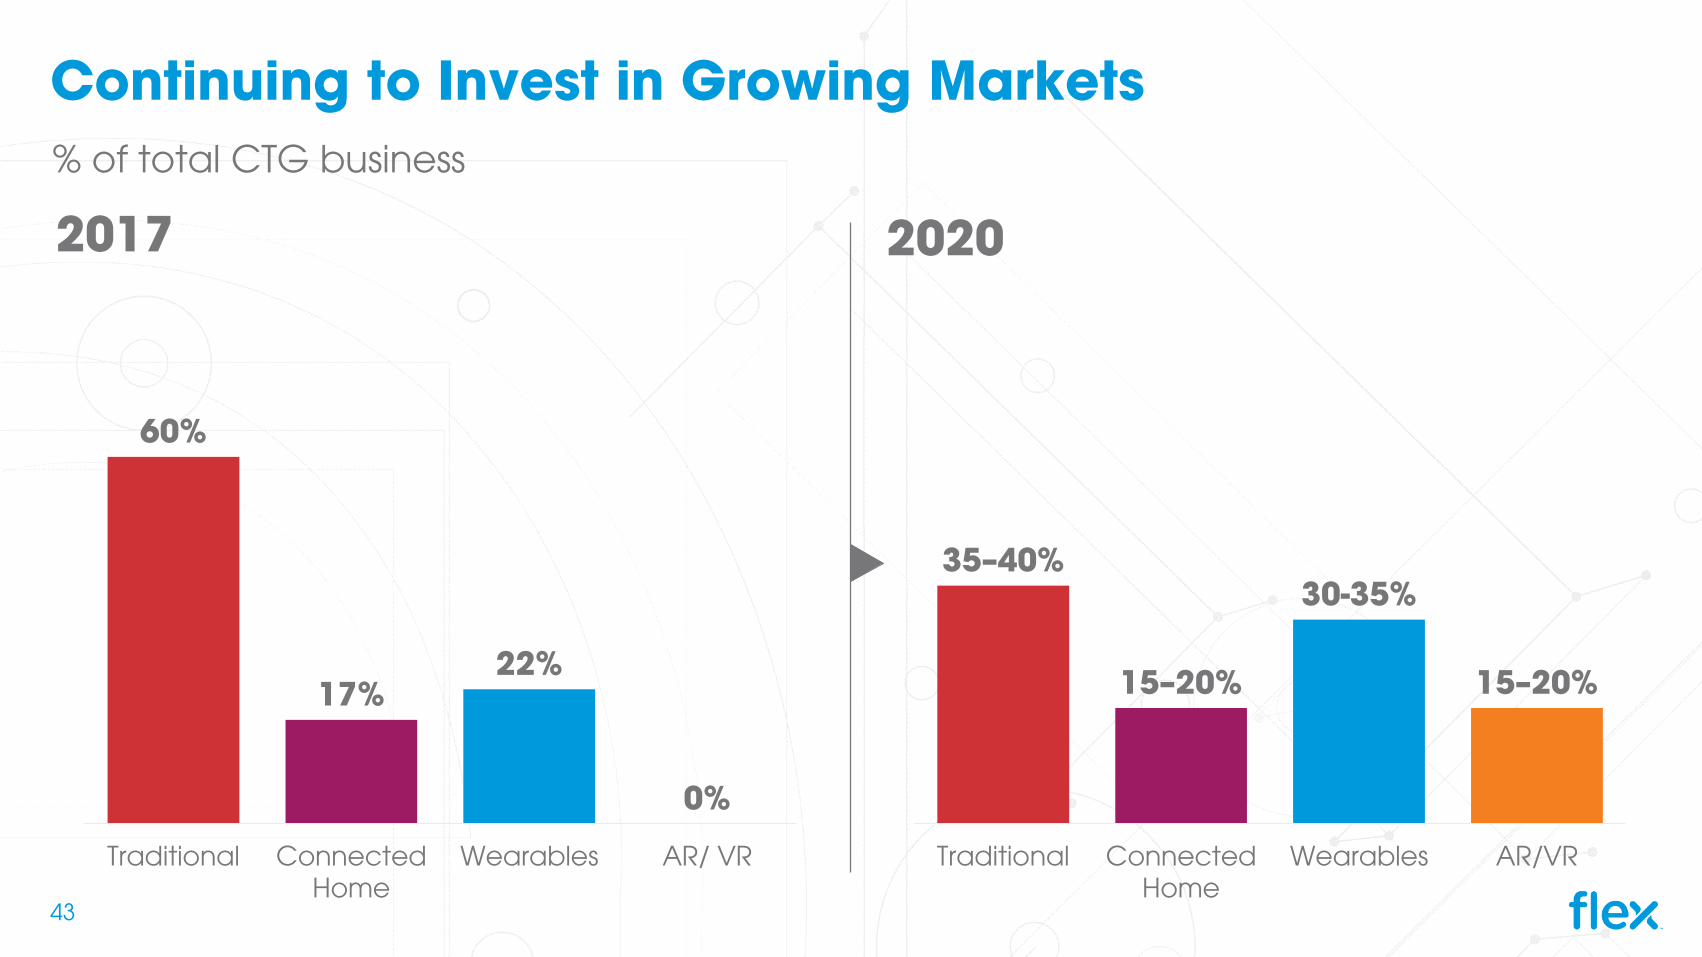
Continuing to Invest in Growing Markets
60%
17%22%
0%
Traditional ConnectedHome
Wearables AR/ VR
2017 2020
35–40%
15–20%
30-35%
15–20%
Traditional ConnectedHome
Wearables AR/VR
% of total CTG business
43
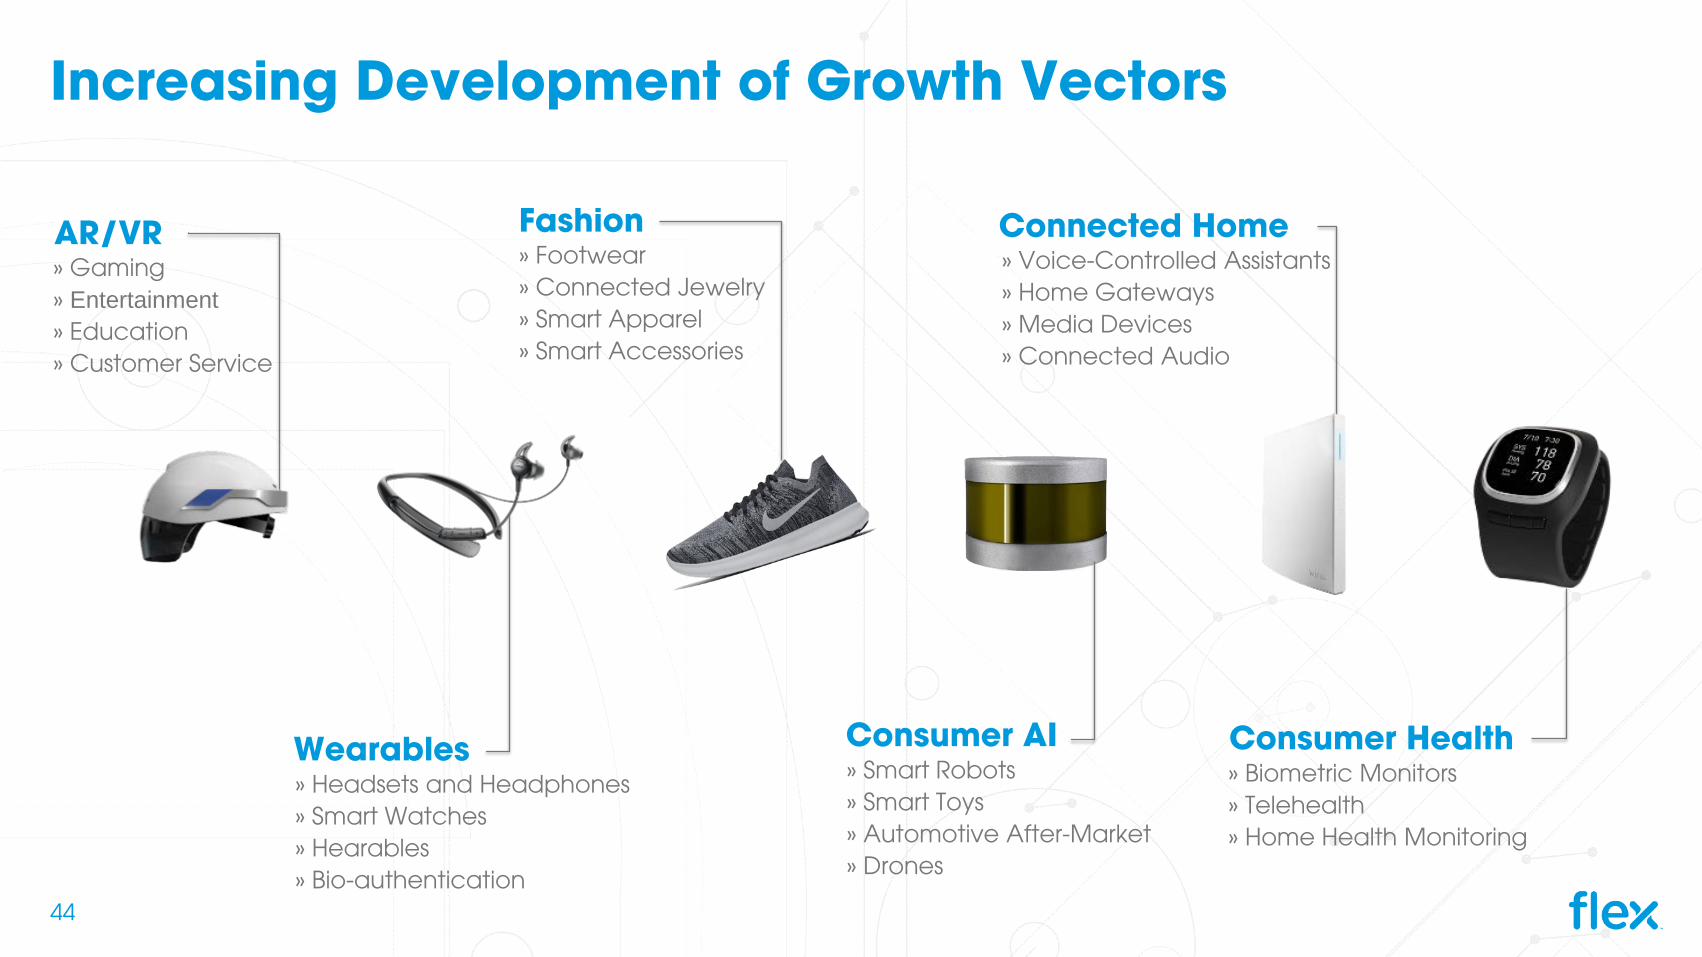
Increasing Development of Growth Vectors
AR/VR» Gaming» Entertainment» Education» Customer Service
Fashion» Footwear» Connected Jewelry» Smart Apparel» Smart Accessories
Connected Home» Voice-Controlled Assistants» Home Gateways» Media Devices» Connected Audio
Wearables» Headsets and Headphones» Smart Watches» Hearables» Bio-authentication
Consumer Health» Biometric Monitors» Telehealth» Home Health Monitoring
Consumer AI» Smart Robots» Smart Toys» Automotive After-Market» Drones
44

Higher Margins and Operating Profit
Operating Profit
Customers Added
Revenue Growth
6%+ 404%
<3% 4-14%
4%* 69%STRATEGIC
CORE
ICE
FY17 Achieved
*Not including Nike investment45
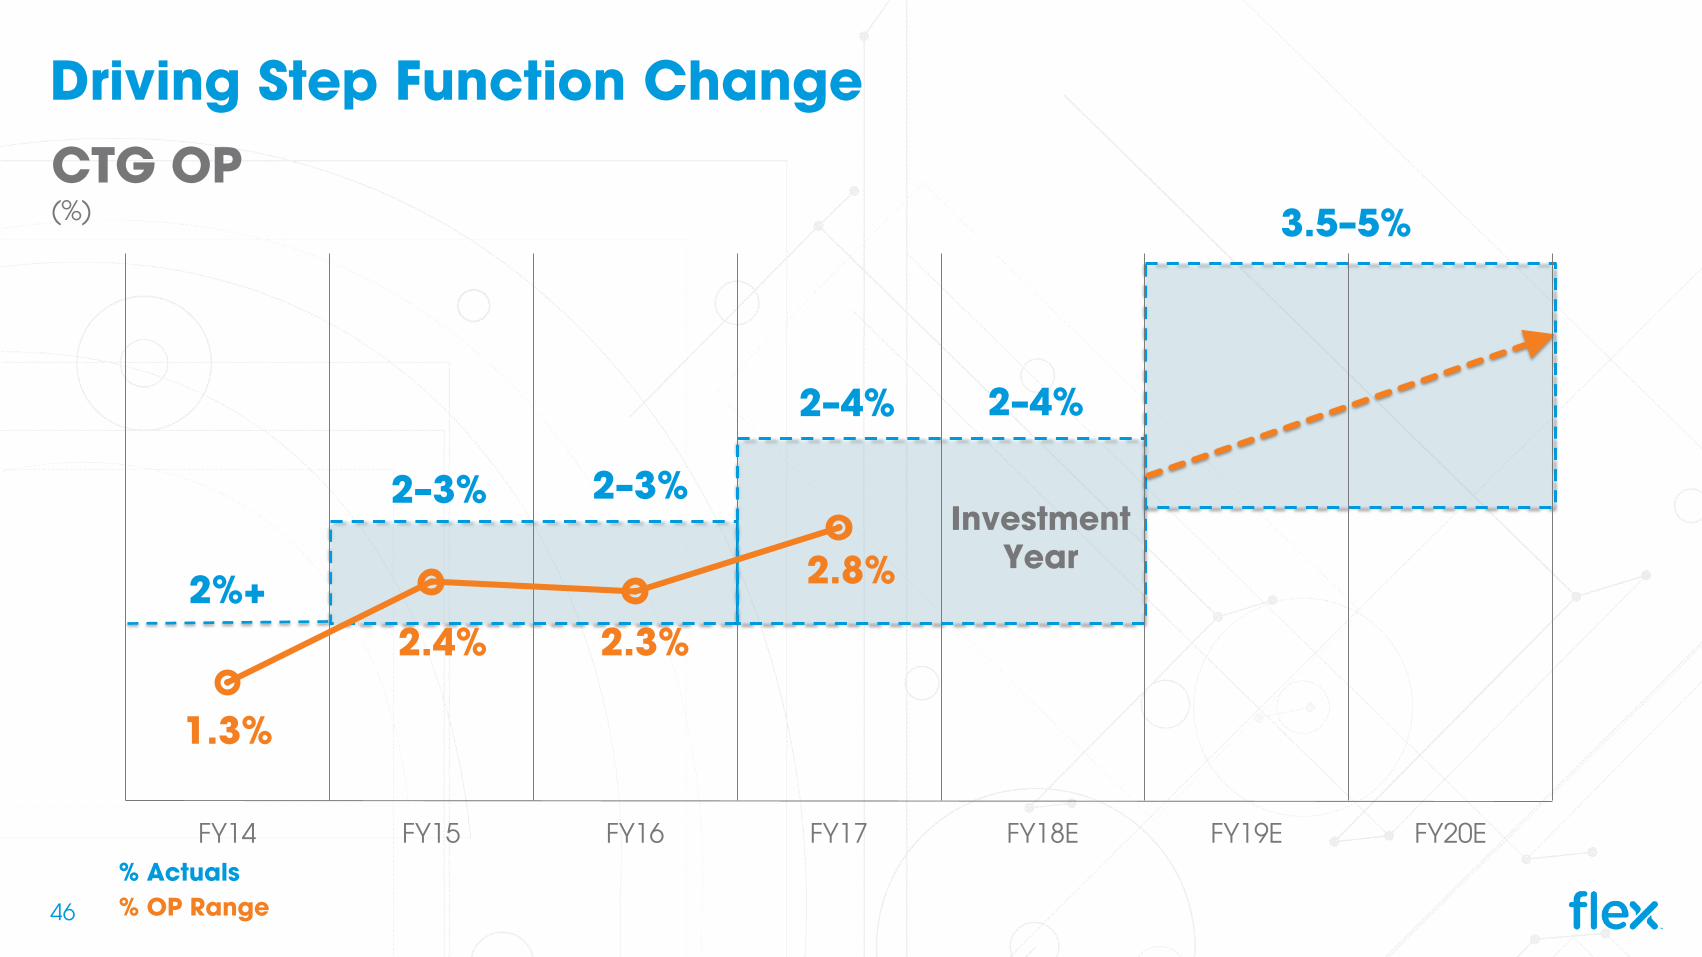
Driving Step Function ChangeCTG OP(%)
Investment Year
1.3%
2.4% 2.3%
2.8%
3.5–5%
2–4%
% Actuals% OP Range46
2%+
2–3% 2–3%
2–4%
FY14 FY15 FY16 FY17 FY18E FY19E FY20E
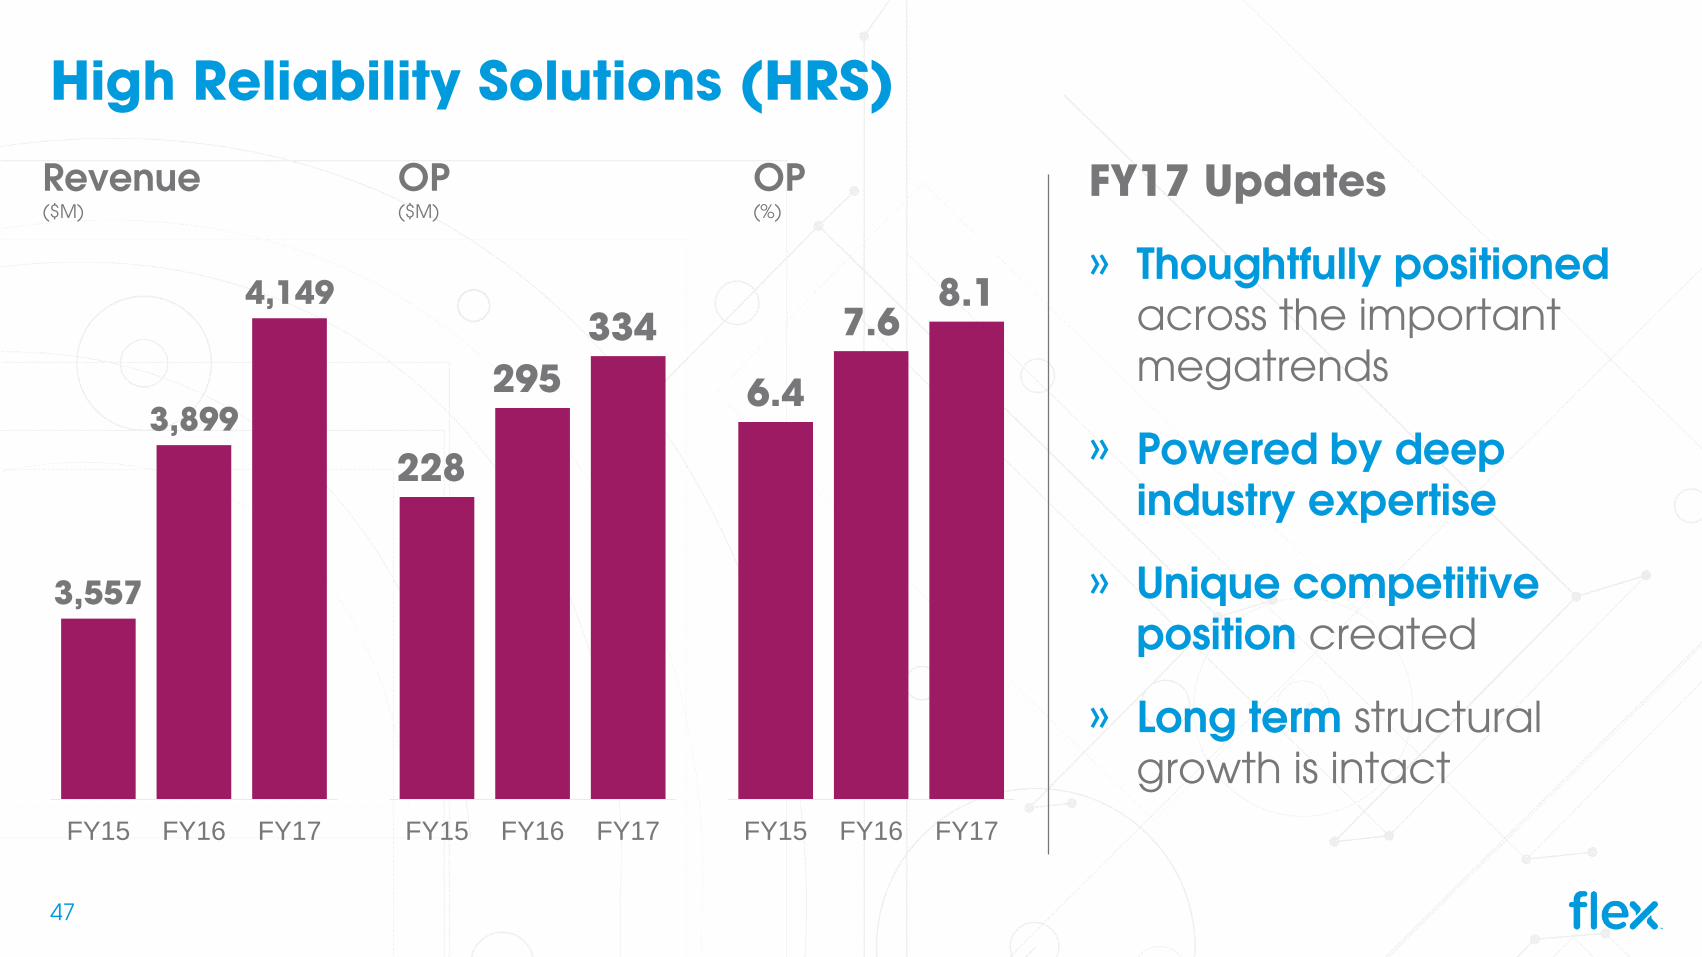
High Reliability Solutions (HRS)
FY17 Updates
» Thoughtfully positioned across the important megatrends
» Powered by deep industry expertise
» Unique competitive position created
» Long term structural growth is intact
3,557
3,899
4,149
FY15 FY16 FY17
228
295 334
FY15 FY16 FY17
6.4
7.68.1
FY15 FY16 FY17
47
Revenue($M)
OP($M)
OP(%)
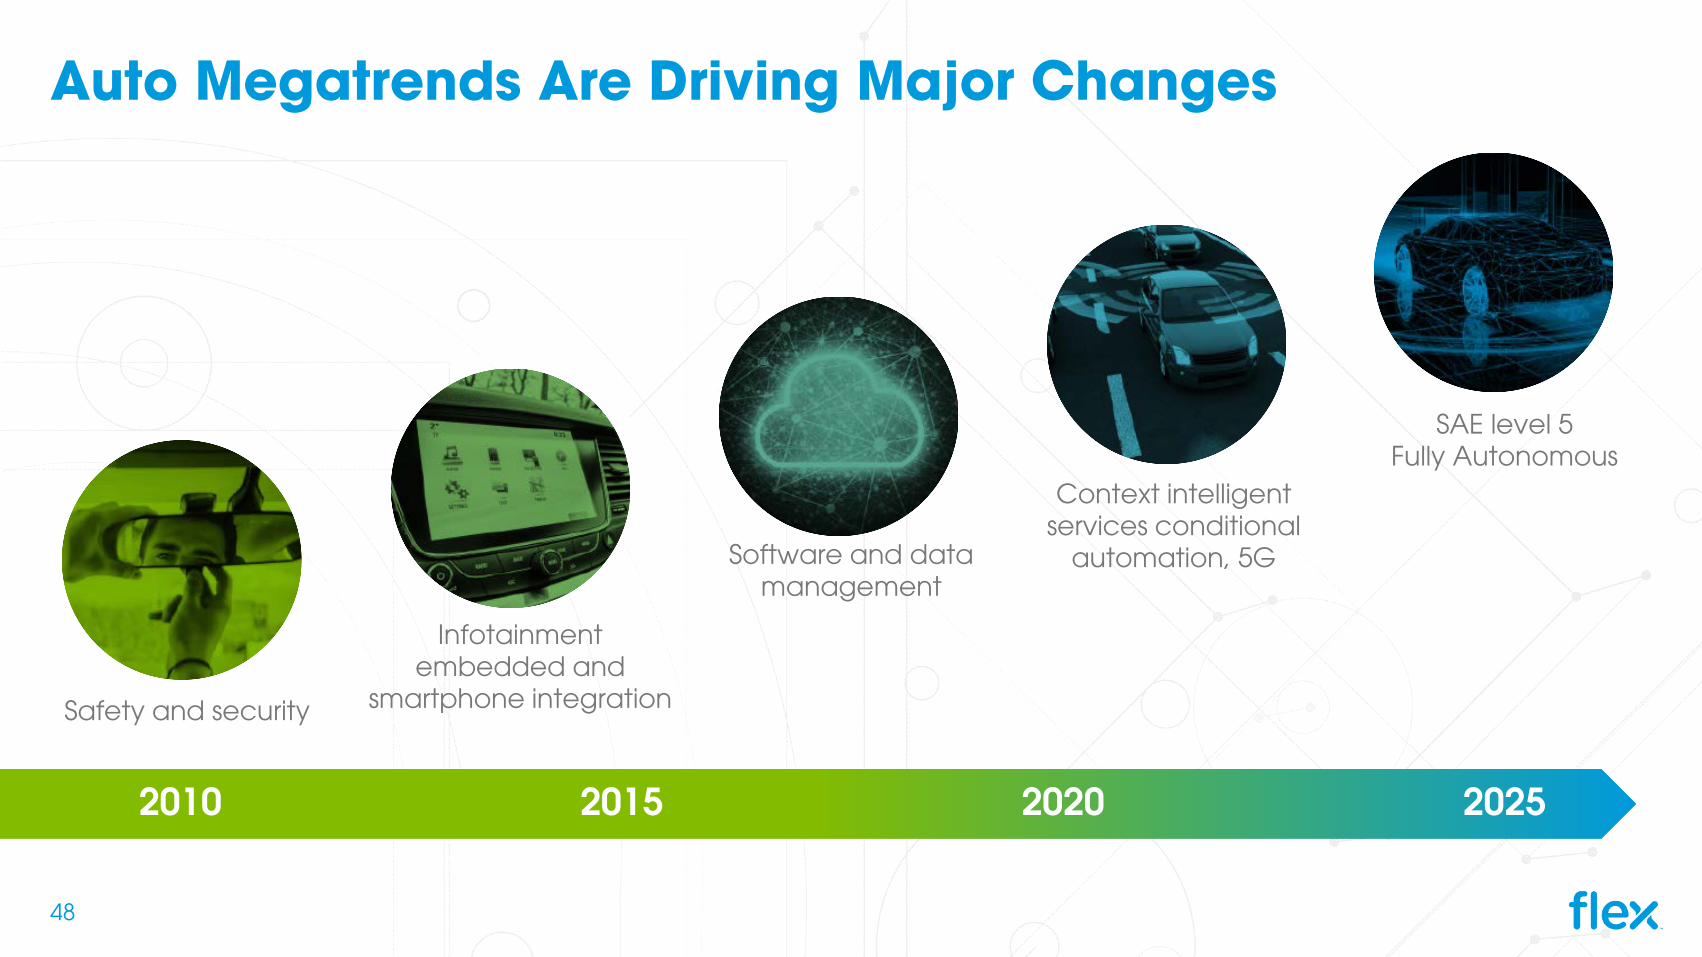
Auto Megatrends Are Driving Major Changes
Safety and security
Infotainment embedded and
smartphone integration
Software and data management
SAE level 5 Fully Autonomous
Context intelligent services conditional
automation, 5G
2010 2015 2020 2025
48
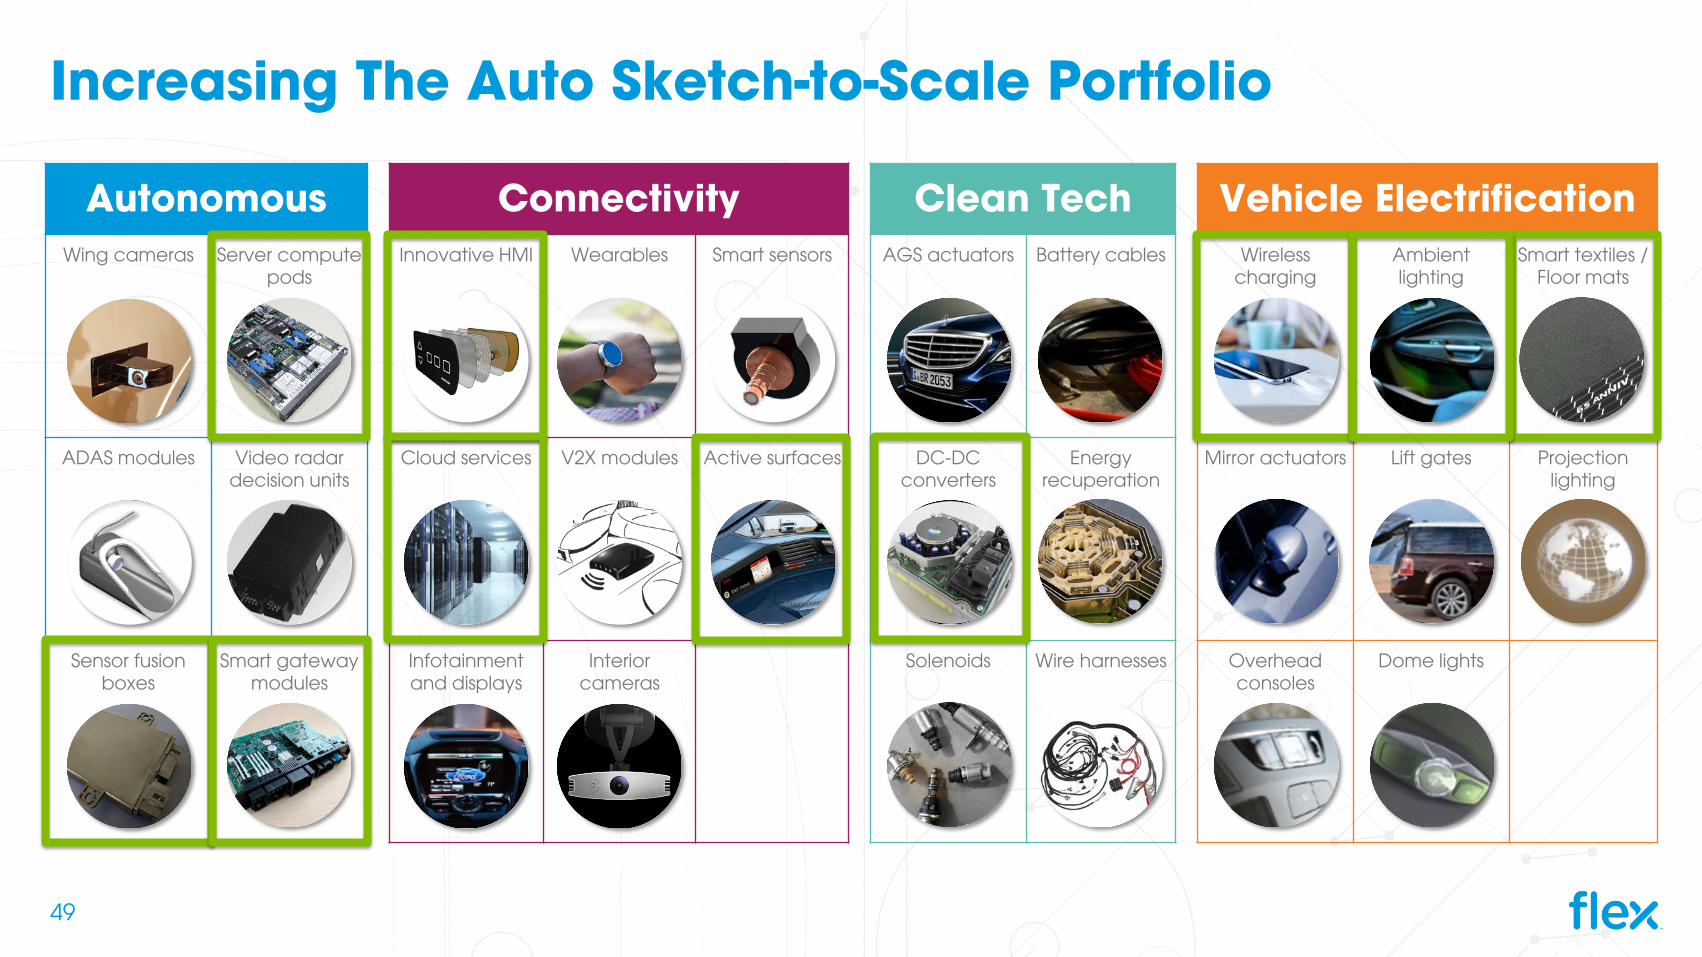
Increasing The Auto Sketch-to-Scale Portfolio
Autonomous Connectivity Clean Tech Vehicle ElectrificationWing cameras Server compute
podsInnovative HMI Wearables Smart sensors AGS actuators Battery cables Wireless
chargingAmbient lighting
Smart textiles / Floor mats
ADAS modules Video radar decision units
Cloud services V2X modules Active surfaces DC-DC converters
Energy recuperation
Mirror actuators Lift gates Projection lighting
Sensor fusion boxes
Smart gatewaymodules
Infotainment and displays
Interior cameras
Solenoids Wire harnesses Overhead consoles
Dome lights
49
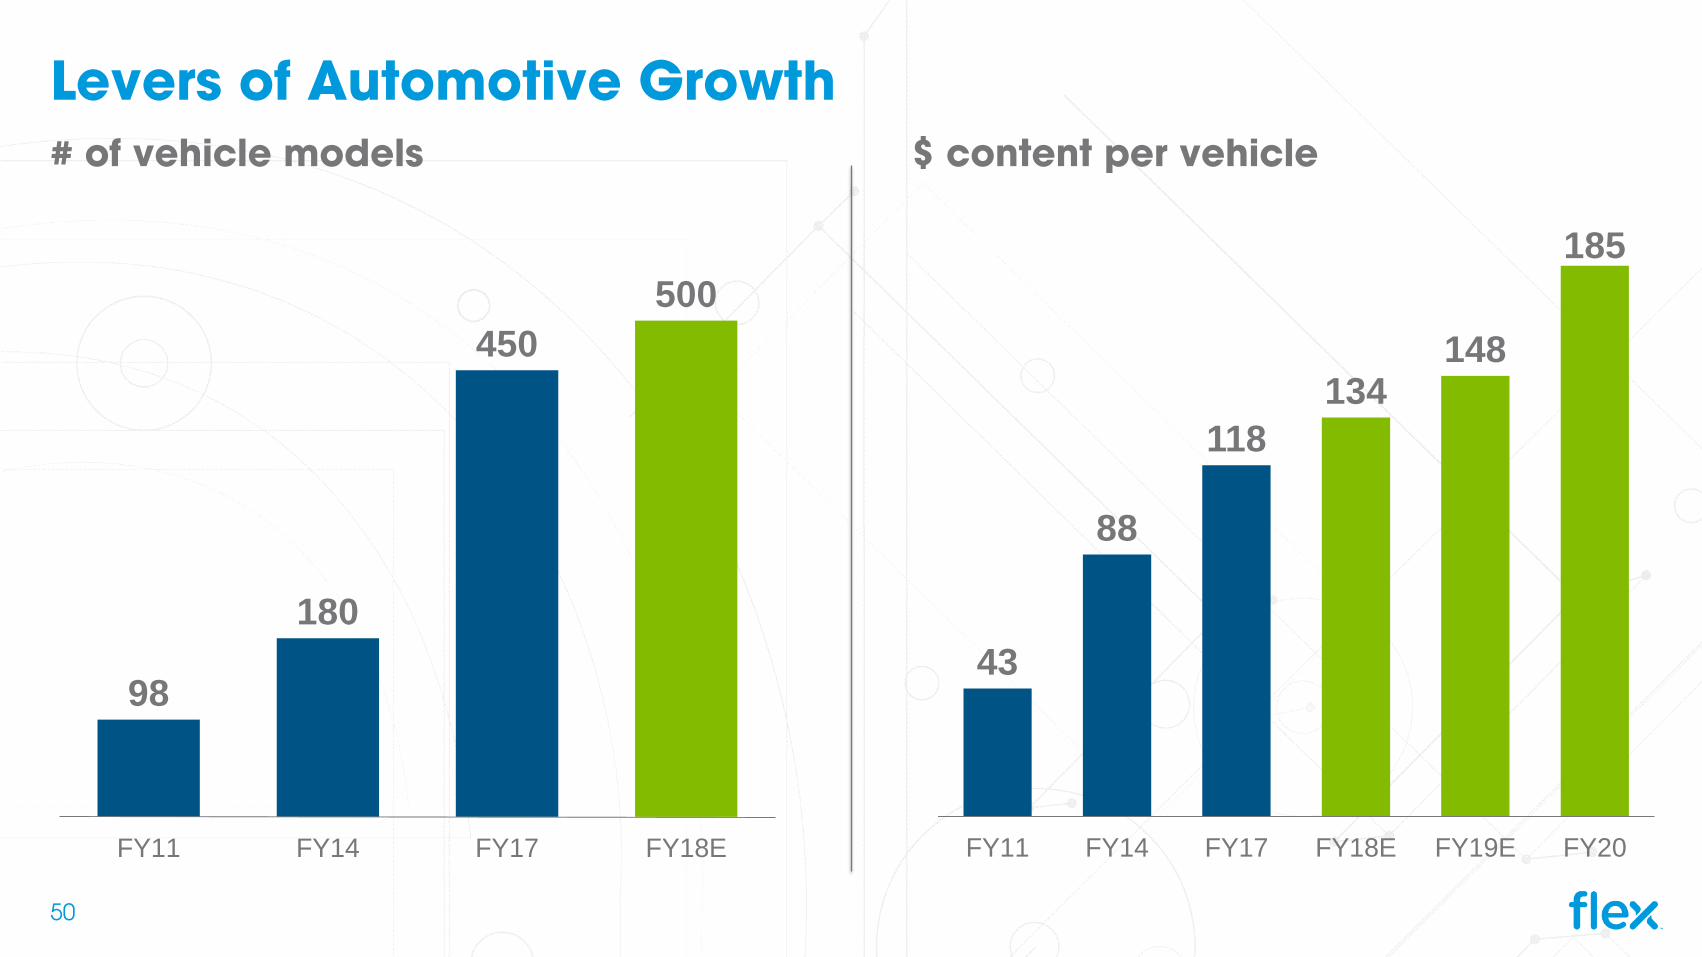
Levers of Automotive Growth
98
180
450 500
FY11 FY14 FY17 FY18E
# of vehicle models $ content per vehicle
43
88
118 134
148
185
FY11 FY14 FY17 FY18E FY19E FY20
50
51
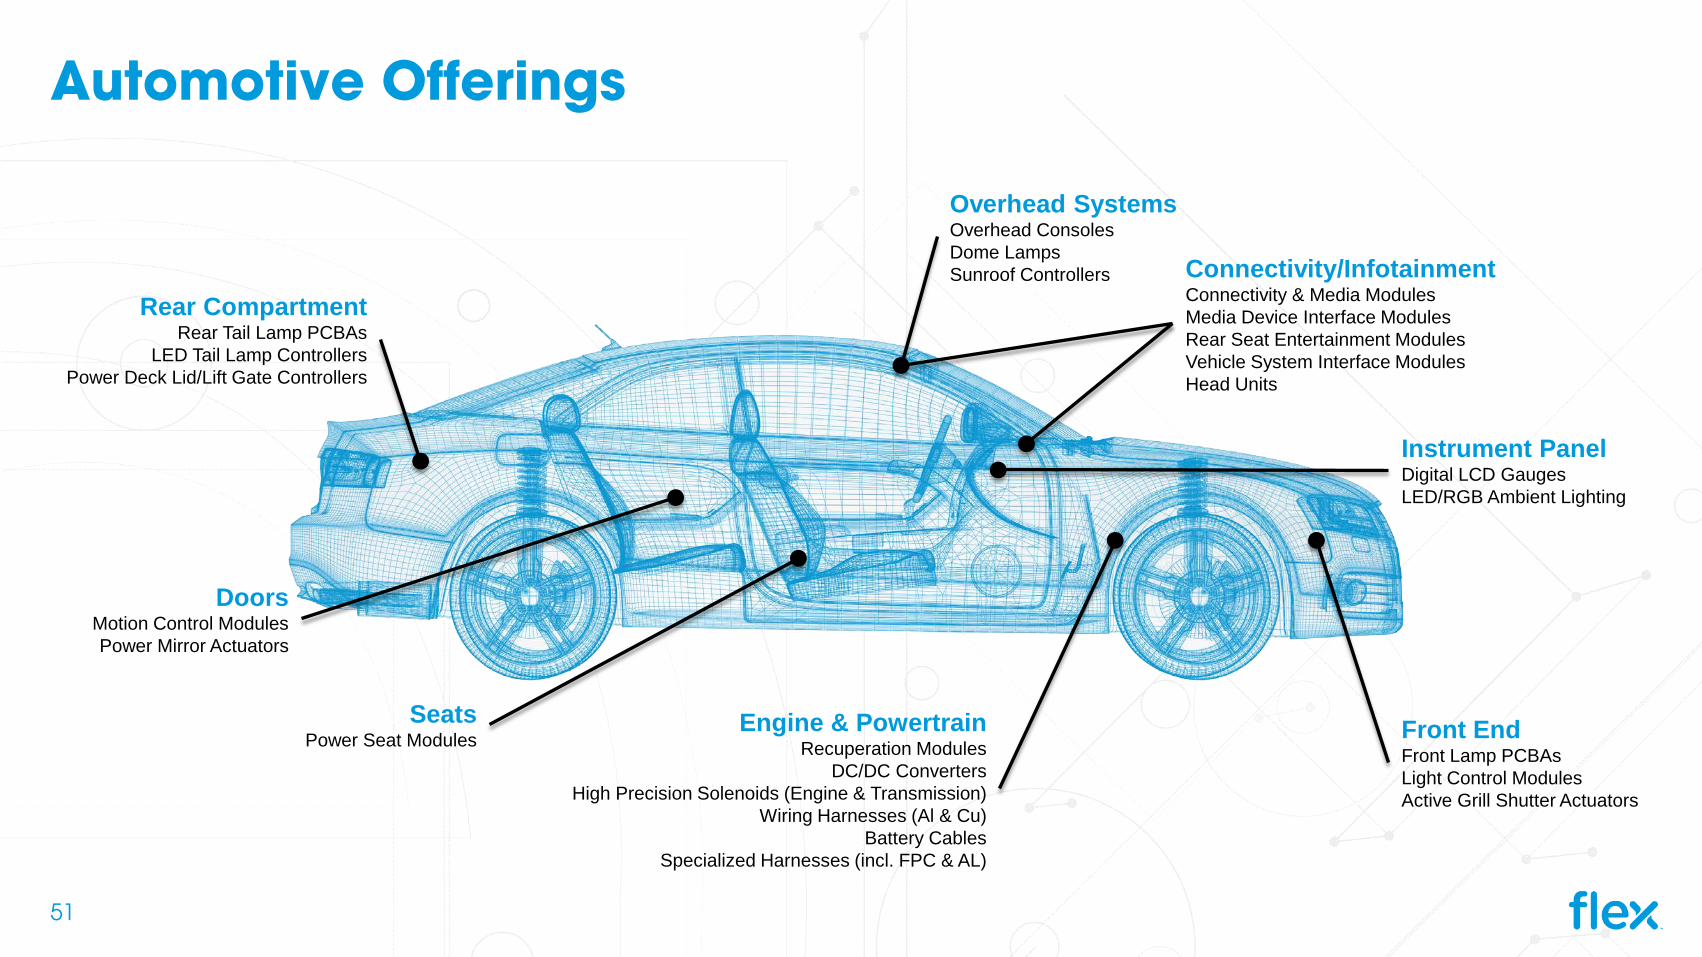
Automotive Offerings
Rear CompartmentRear Tail Lamp PCBAs
LED Tail Lamp ControllersPower Deck Lid/Lift Gate Controllers
DoorsMotion Control ModulesPower Mirror Actuators
SeatsPower Seat Modules
Engine & PowertrainRecuperation Modules
DC/DC ConvertersHigh Precision Solenoids (Engine & Transmission)
Wiring Harnesses (Al & Cu)Battery Cables
Specialized Harnesses (incl. FPC & AL)
Front EndFront Lamp PCBAsLight Control ModulesActive Grill Shutter Actuators
Instrument PanelDigital LCD GaugesLED/RGB Ambient Lighting
Overhead SystemsOverhead ConsolesDome LampsSunroof Controllers Connectivity/Infotainment
Connectivity & Media ModulesMedia Device Interface ModulesRear Seat Entertainment ModulesVehicle System Interface ModulesHead Units
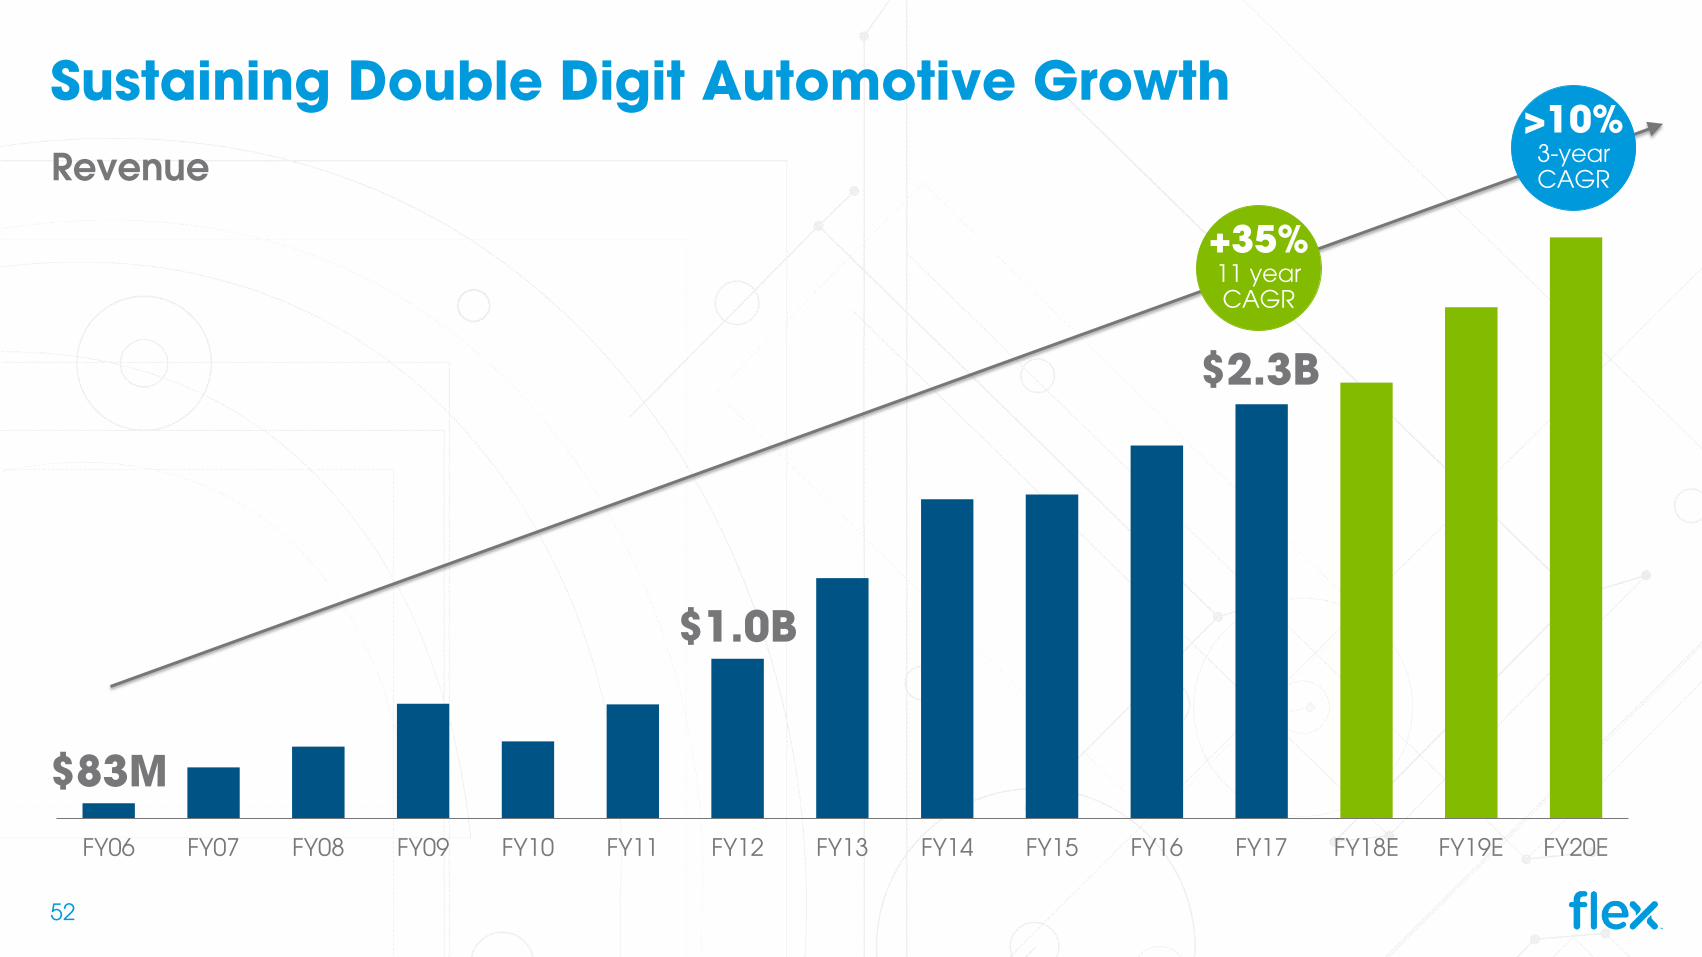
$83M
$1.0B
FY06 FY07 FY08 FY09 FY10 FY11 FY12 FY13 FY14 FY15 FY16 FY17 FY18E FY19E FY20E
Sustaining Double Digit Automotive Growth
+35%11 yearCAGR
>10%3-yearCAGR
$2.3B
52
Revenue
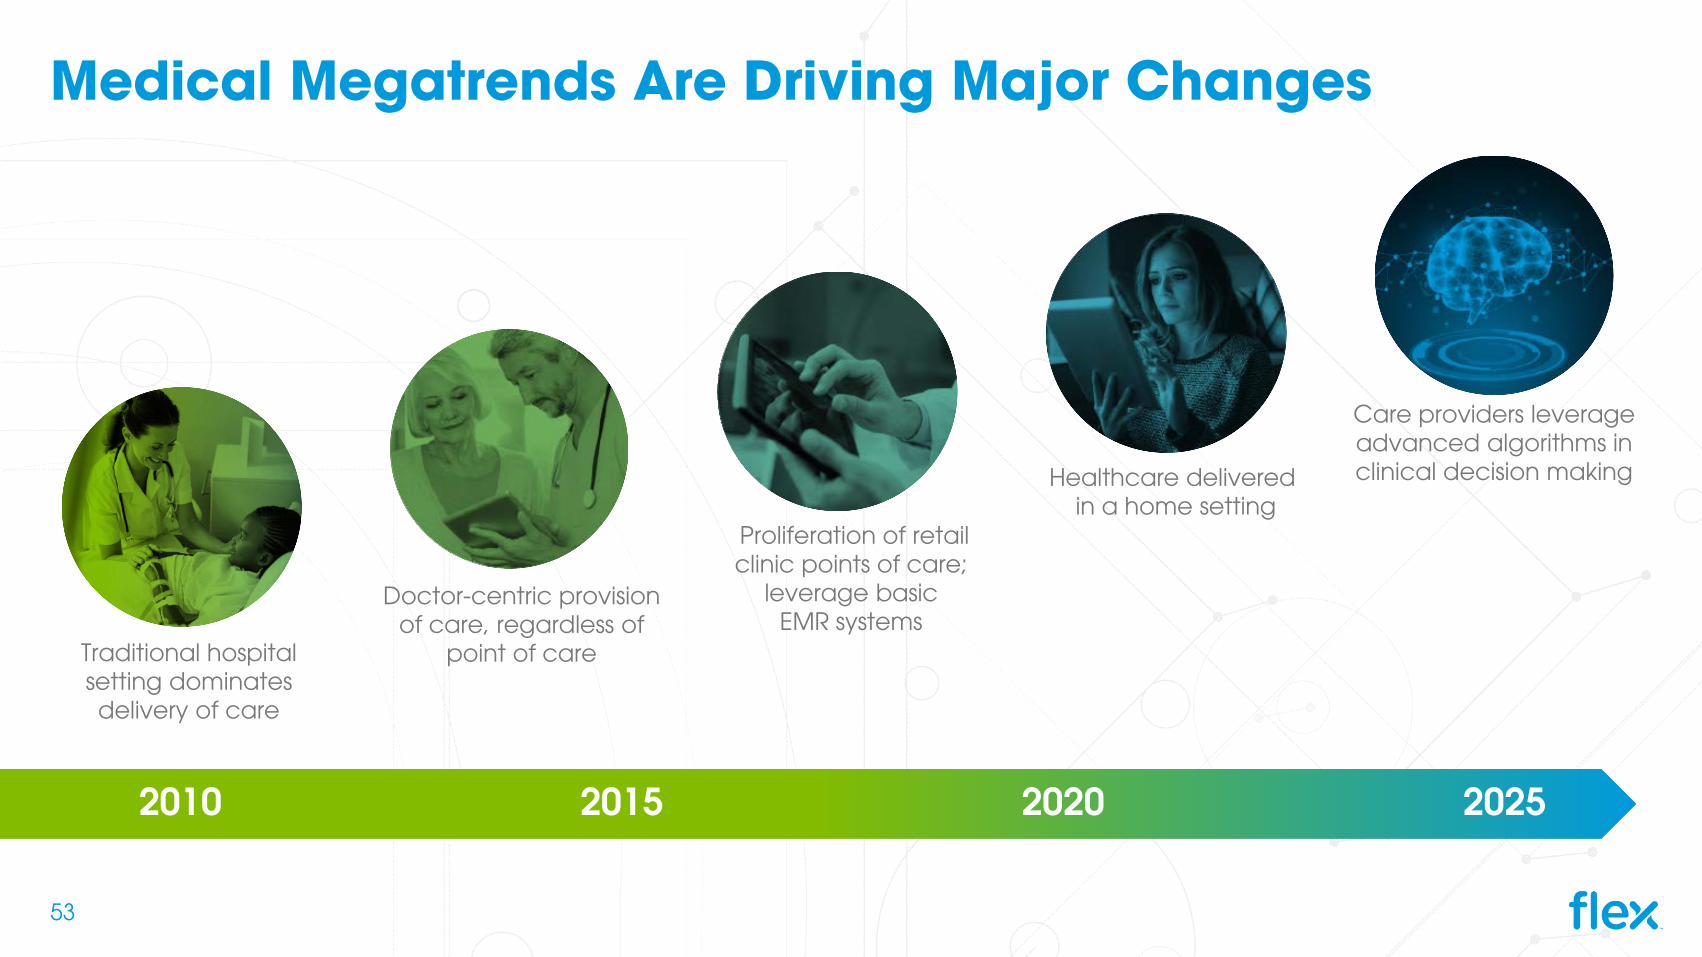
Medical Megatrends Are Driving Major Changes
Traditional hospital setting dominates delivery of care
Doctor-centric provision of care, regardless of
point of care
Proliferation of retail clinic points of care;
leverage basic EMR systems
Care providers leverage advanced algorithms in clinical decision makingHealthcare delivered
in a home setting
2010 2015 2020 2025
53

54
Medical Solutions and Technology Portfolio
2011
Blood Glucose Meter
Disposables Diagnostics
2013
Drug Delivery devices
Implantables Patient mobility Infusion sets Surgical Instruments
2016
Software solutions
CGM Ophthalmology Imaging Orthopedics Digital health Combination drug delivery
2017
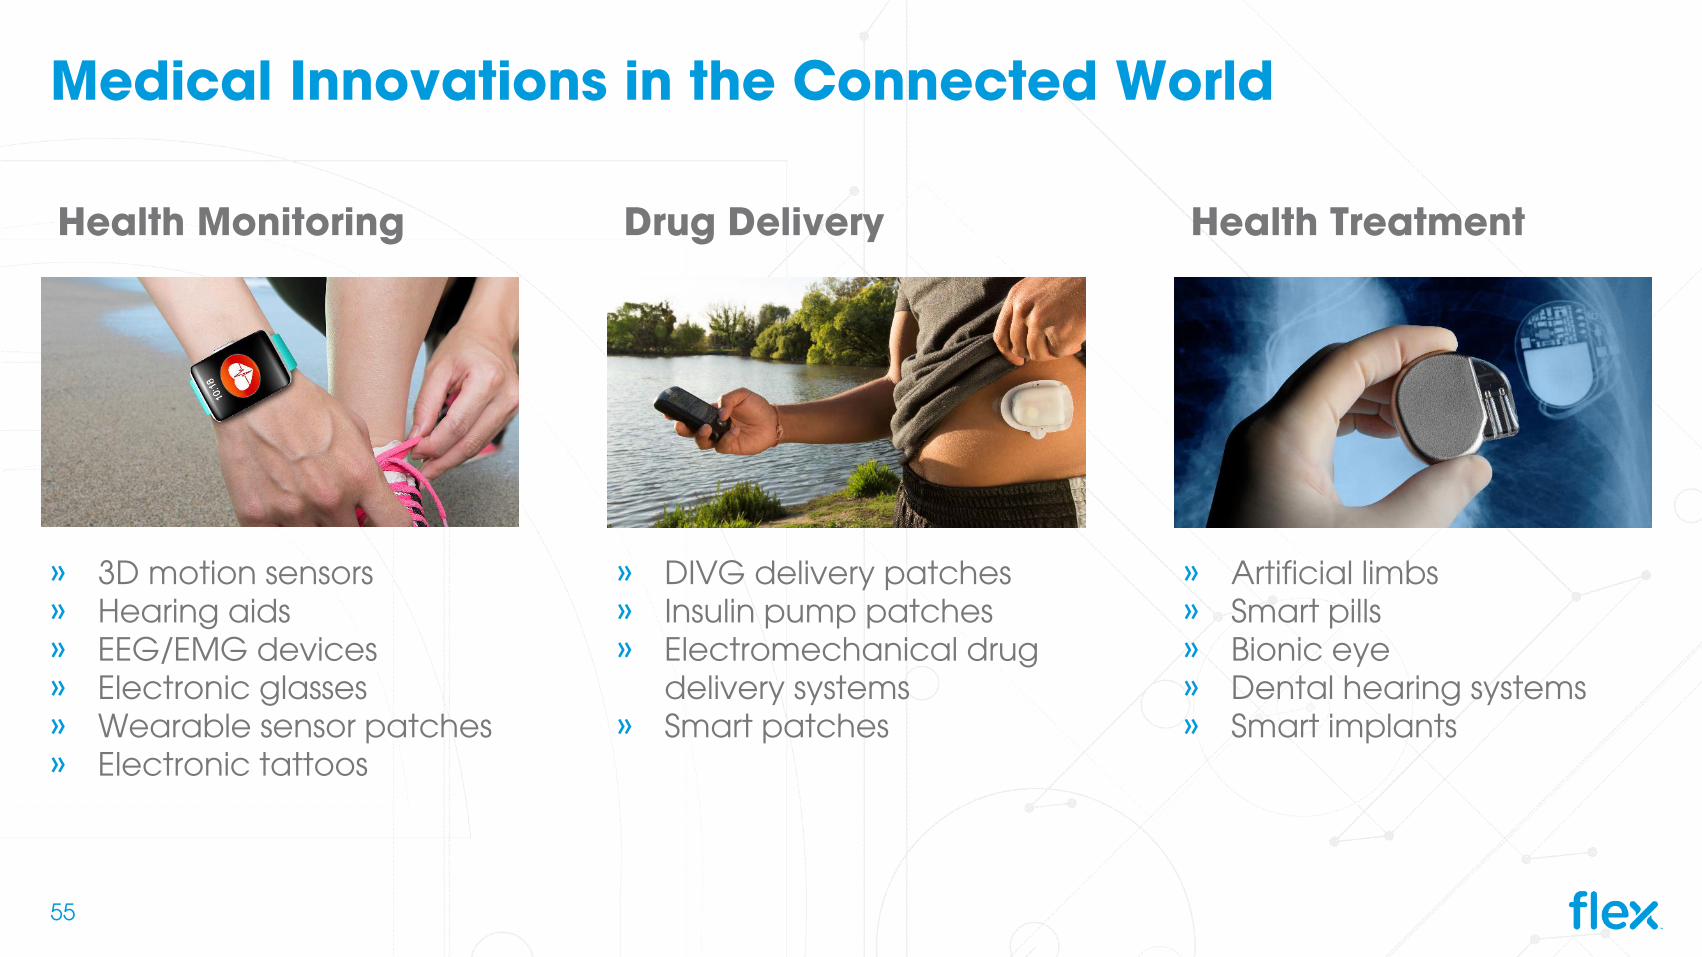
Medical Innovations in the Connected World
Health Monitoring Drug Delivery Health Treatment
» DIVG delivery patches» Insulin pump patches» Electromechanical drug
delivery systems » Smart patches
» 3D motion sensors» Hearing aids» EEG/EMG devices» Electronic glasses» Wearable sensor patches » Electronic tattoos
» Artificial limbs» Smart pills» Bionic eye» Dental hearing systems» Smart implants
55

Connectivity is the Bridge to Digital Health
Phase III: Insight GenerationMedical grade connectivity platform converts raw data into actionable insight
Phase II: Integration and ScalingScalable platform broadly supports digital health solutions, with clinical workflow and impacts patient management
Phase I: Data GenerationSmart devices enable data collection
Hospital BasedAcute and critical careNew therapies for patients
To Home BasedMobile disease management and monitoringPharma companies need home based technologies to deliver drugs
Added ConnectivityHome based connectivityIncreases safety and compliance in homes based therapy
56
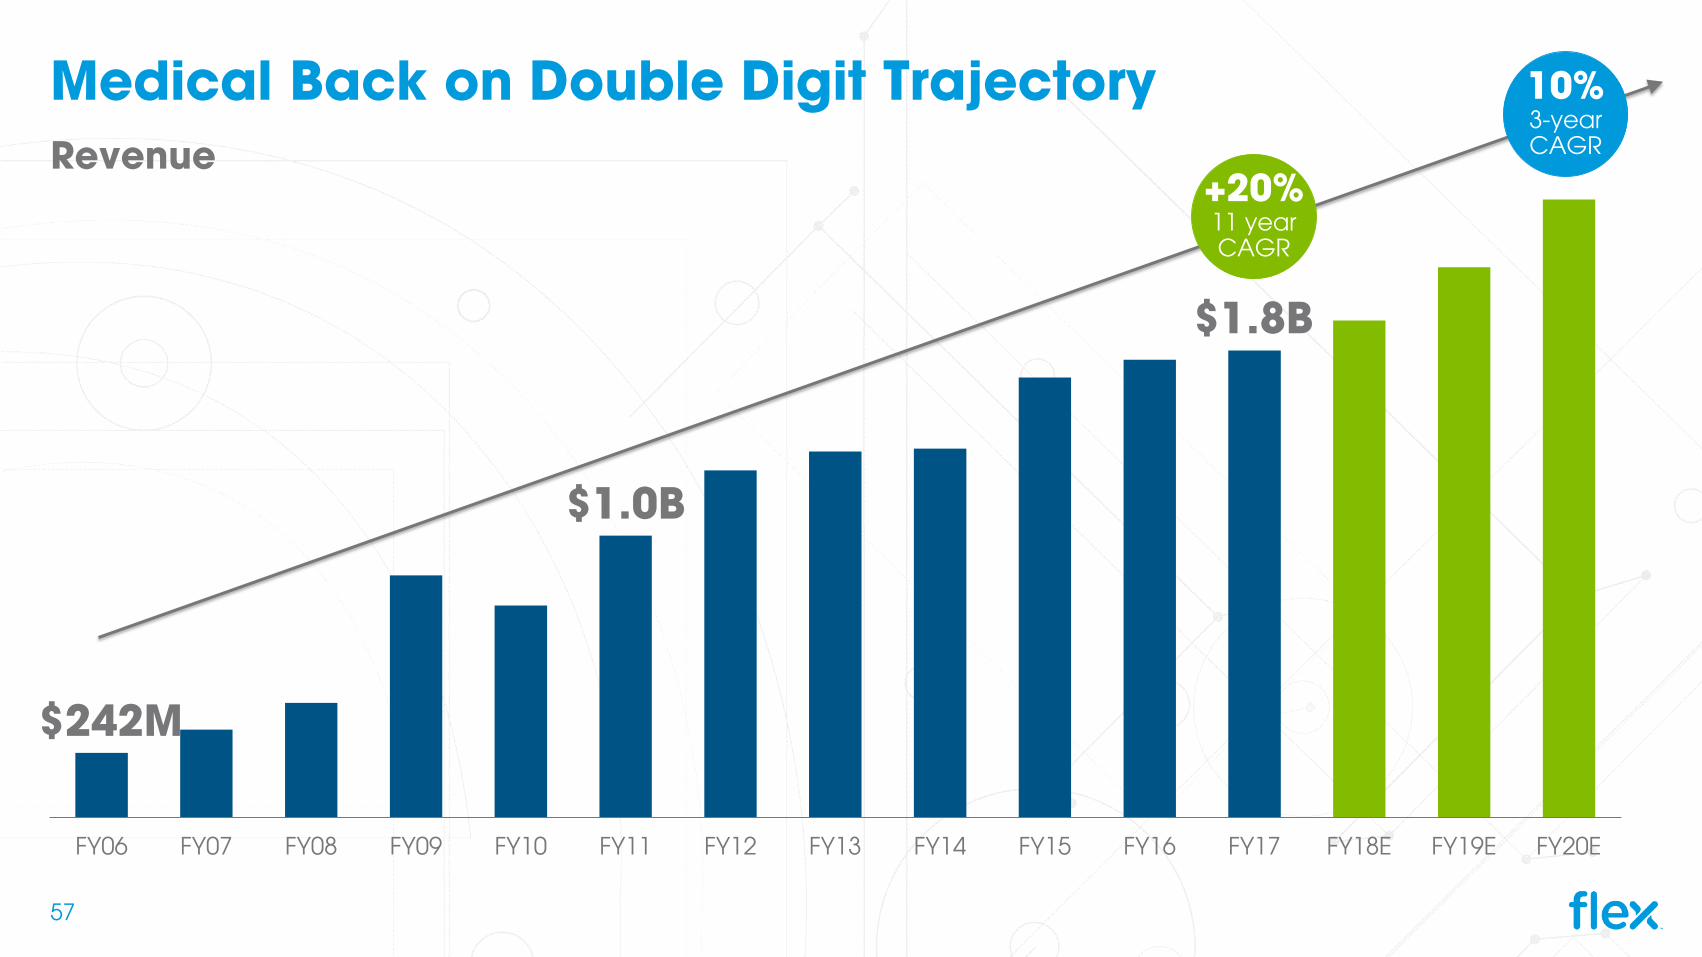
Medical Back on Double Digit Trajectory
$242M
$1.0B
FY06 FY07 FY08 FY09 FY10 FY11 FY12 FY13 FY14 FY15 FY16 FY17 FY18E FY19E FY20E
Revenue+20%11 yearCAGR
10%3-yearCAGR
$1.8B
57

127 132
158
180
FY14 FY15 FY16 FY17
3.8
4.5 4.75.0
FY14 FY15 FY16 FY17
Industrial and Emerging Industries (IEI)
Revenue($B)
OP($M)
58
FY17 Updates» $2B+ record bookings
» 26% Sketch-to-ScaleTM
revenue
» 6.1% OP growth from FY14 to FY17
» 72+ new logos
9.5%CAGR
6.1%Growth
12.3%CAGR
3.6%OP%
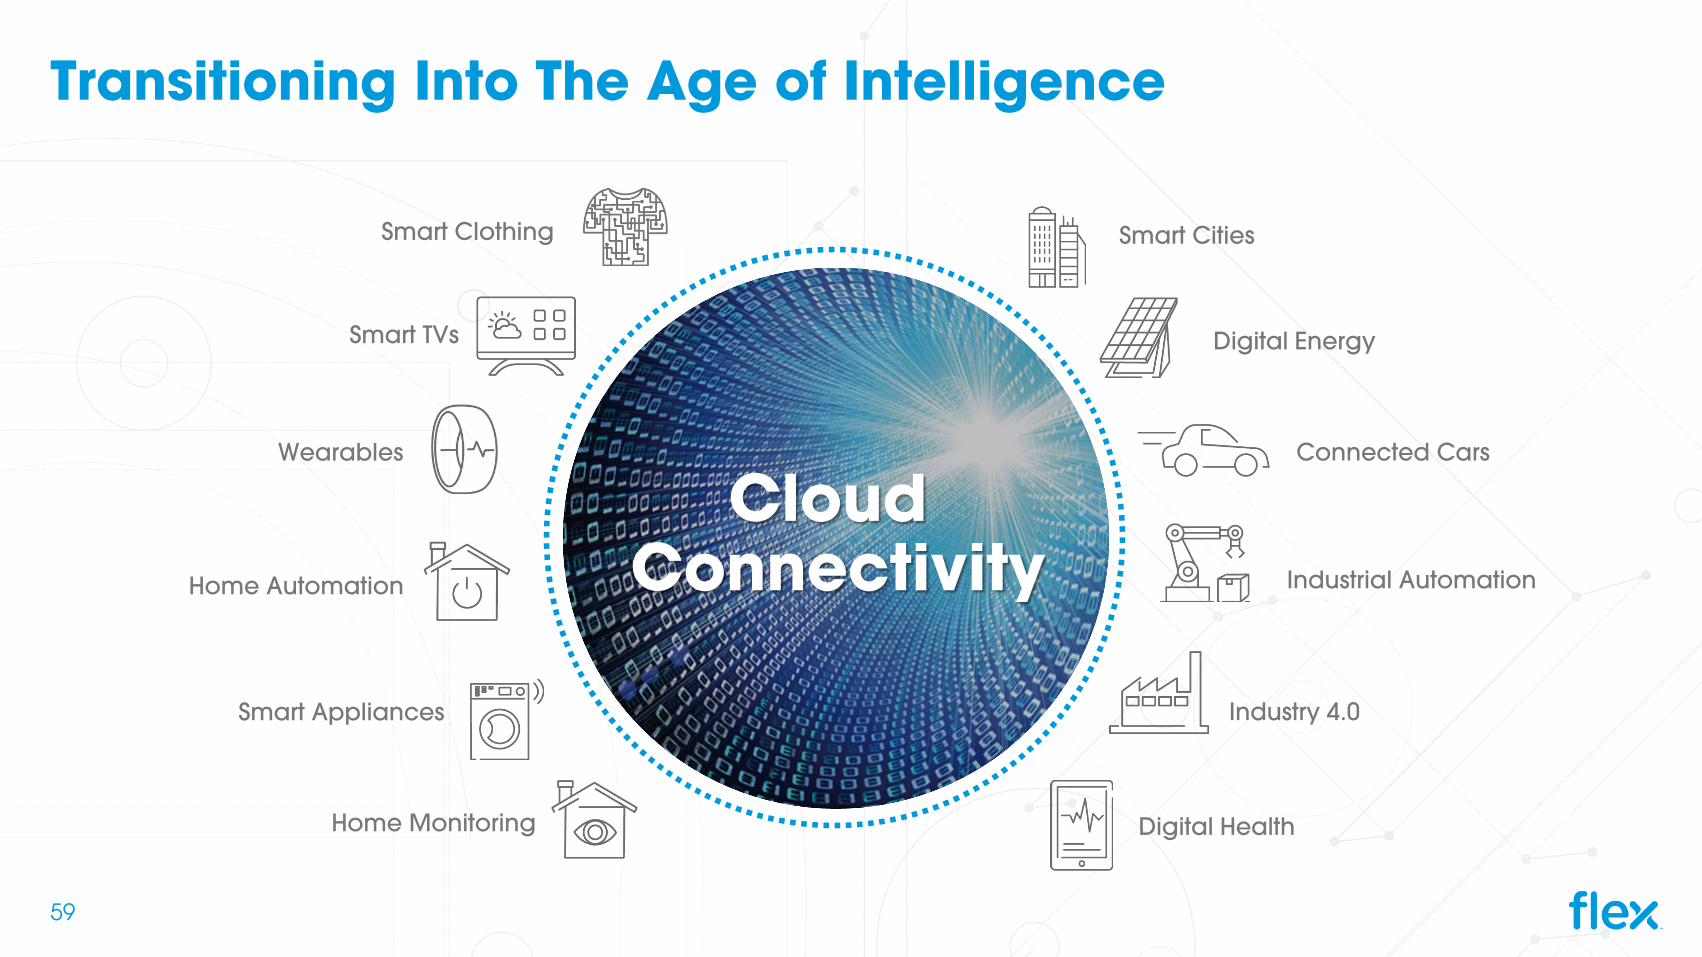
Transitioning Into The Age of Intelligence
Cloud Connectivity
Smart Cities
Digital Energy
Connected Cars
Industrial Automation
Industry 4.0
Digital Health
Smart Appliances
Wearables
Home Automation
Home Monitoring
Smart TVs
Smart Clothing
59
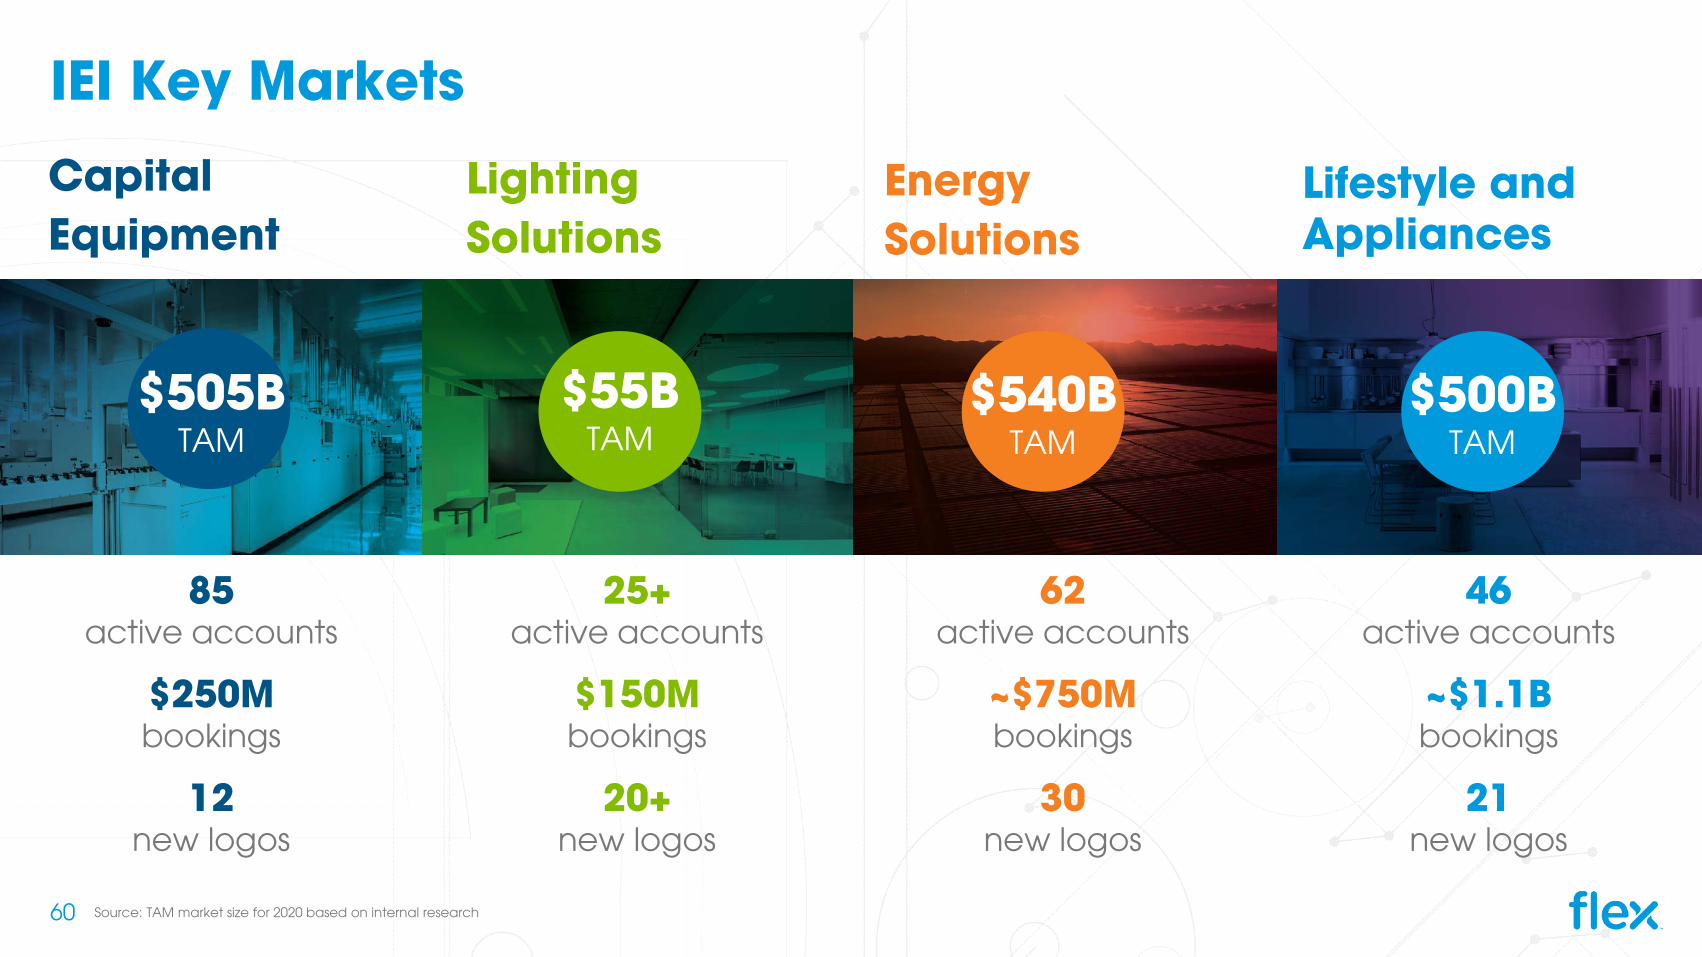
IEI Key Markets
LightingSolutions
EnergySolutions
Lifestyle and Appliances
Capital Equipment
$540BTAM
$55BTAM
$500BTAM
$505BTAM
Source: TAM market size for 2020 based on internal research 60
25+active accounts
$150Mbookings
20+new logos
85 active accounts
$250Mbookings
12new logos
62active accounts
~$750Mbookings
30new logos
46active accounts
~$1.1Bbookings
21new logos

61
There is Significant Opportunity in Solar and Storage
1
4.4
4.7
10.6
16.3
21.7
41.3
Solar
Oil
Other
Nuclear
Hydroelectric
Natural Gas
Coal
Global Electricity Production in 2015
100
2
4
6
8
10
12
14
CO2 Emissions in 2015 from Electricity and Heat GenerationBillion tonnes CO2
Source: International Energy Agency (IEA), SolarPower Europe, GreenTech Media (GTM), Flex Estimates
Global market size in $B, CAGR in %
Solar & Storage Growth
93
5
9
130
195
35
Storage
Solar
98
139
230
2015 2020 2026
+8%
Energy source as a %
Oil
Natural Gas
Coal
62
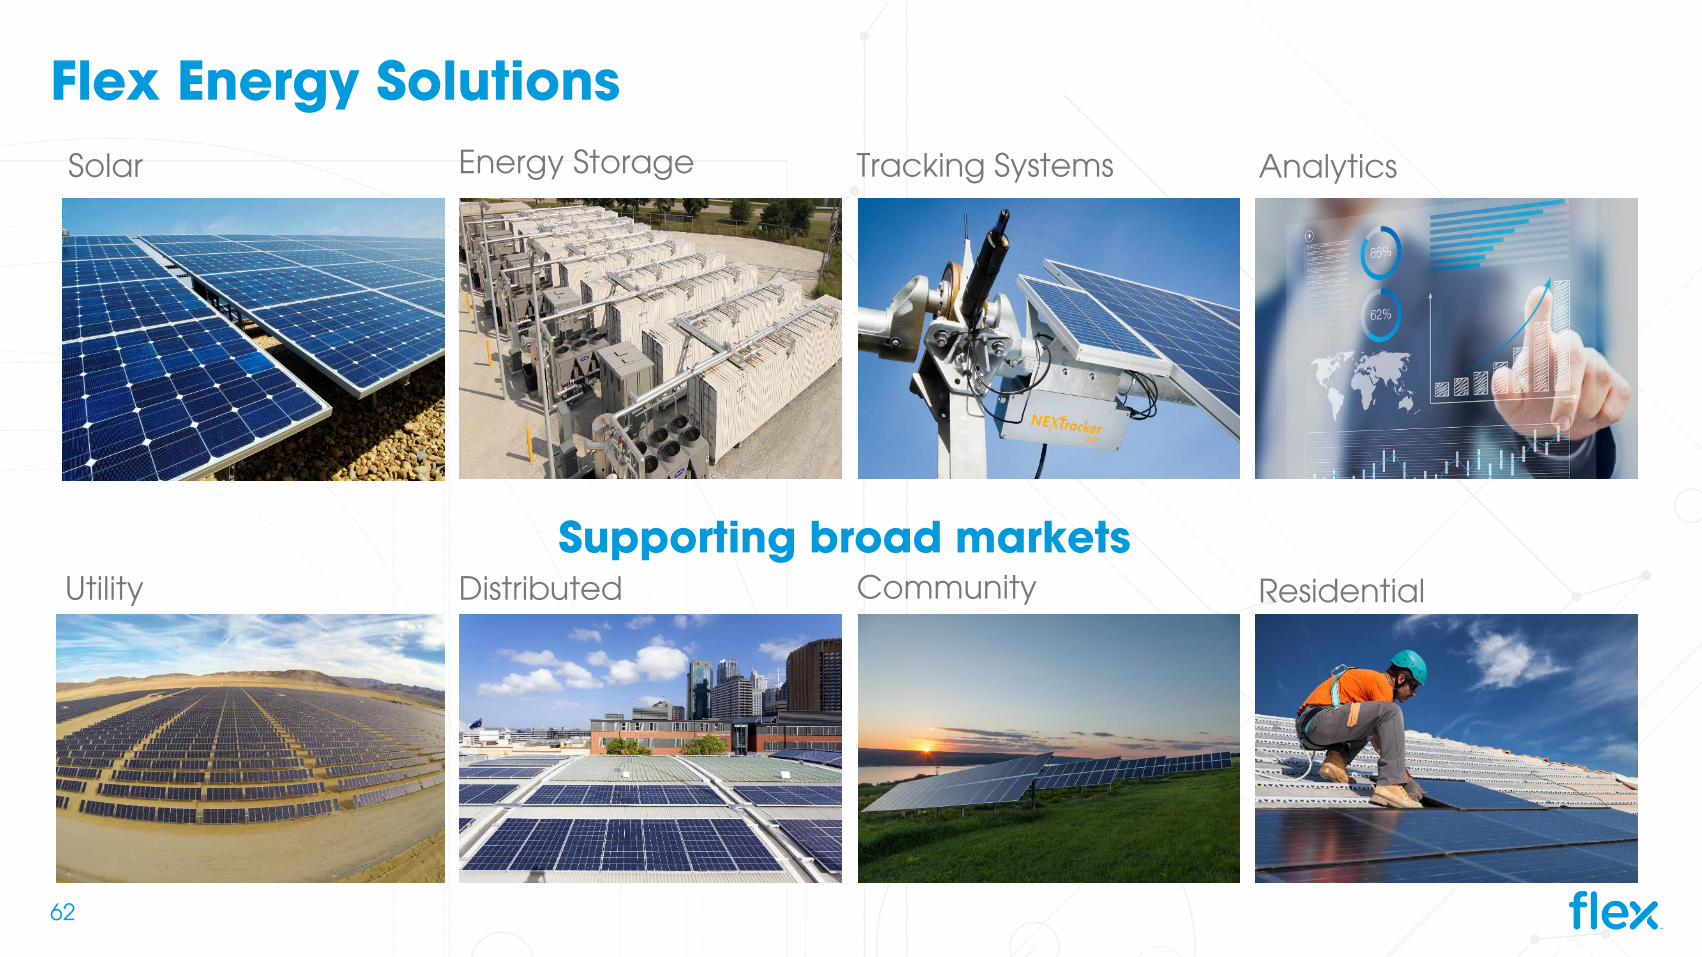
Flex Energy Solutions
Supporting broad marketsUtility CommunityDistributed
GenerationResidential
Solar Tracking SystemsEnergy Storage Analytics
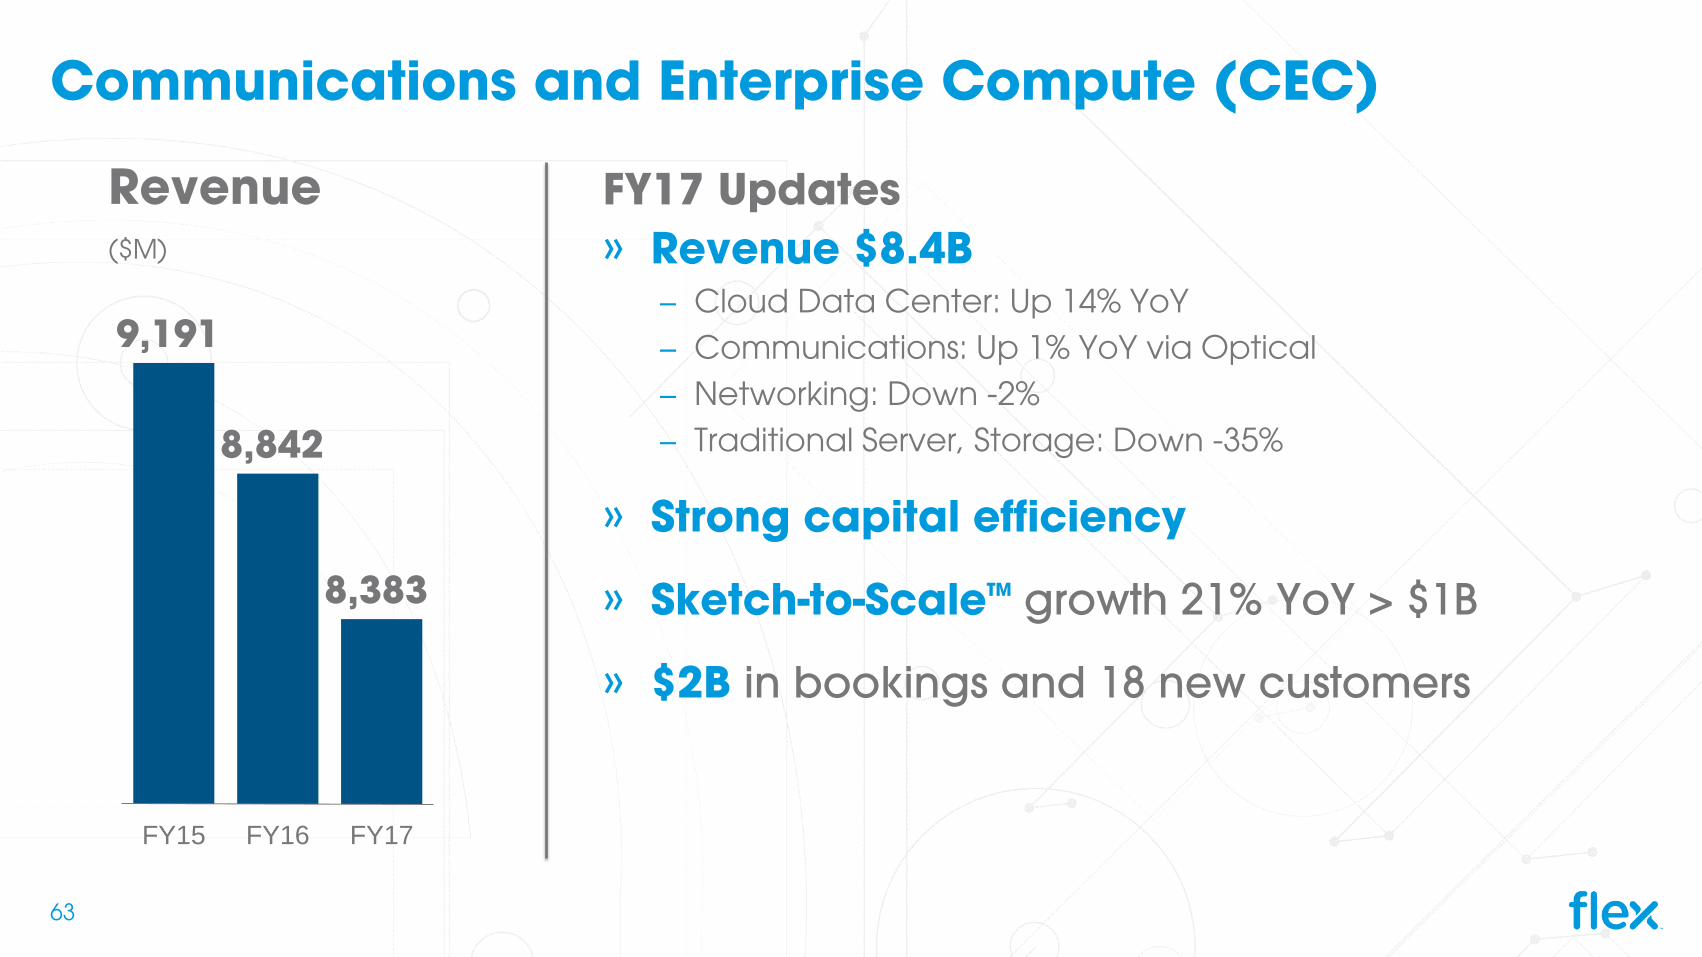
Communications and Enterprise Compute (CEC)
FY17 Updates» Revenue $8.4B
− Cloud Data Center: Up 14% YoY − Communications: Up 1% YoY via Optical − Networking: Down -2%− Traditional Server, Storage: Down -35%
» Strong capital efficiency
» Sketch-to-ScaleTM growth 21% YoY > $1B
» $2B in bookings and 18 new customers
9,191
8,842
8,383
FY15 FY16 FY17
63
Revenue ($M)
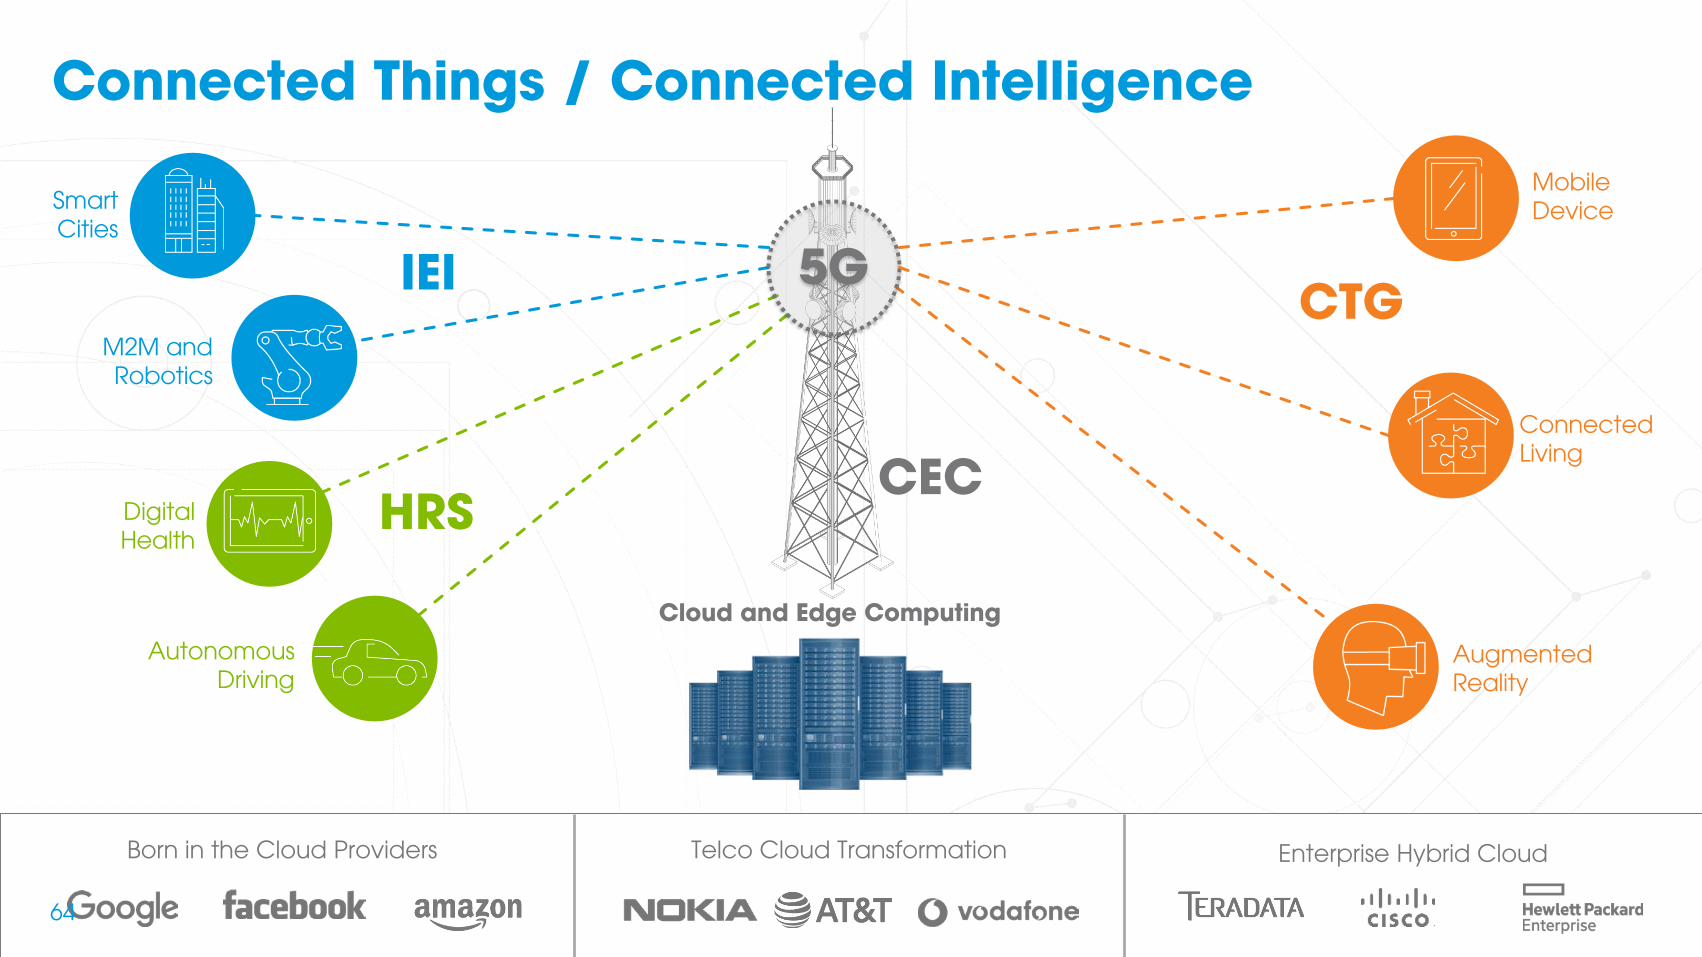
Connected Things / Connected Intelligence
Smart Cities
M2M and Robotics
IEI
Digital Health
Autonomous Driving
HRS
Born in the Cloud Providers Telco Cloud Transformation Enterprise Hybrid Cloud
Mobile Device
Connected Living
Augmented Reality
CTG
Cloud and Edge Computing
5G
CEC
64
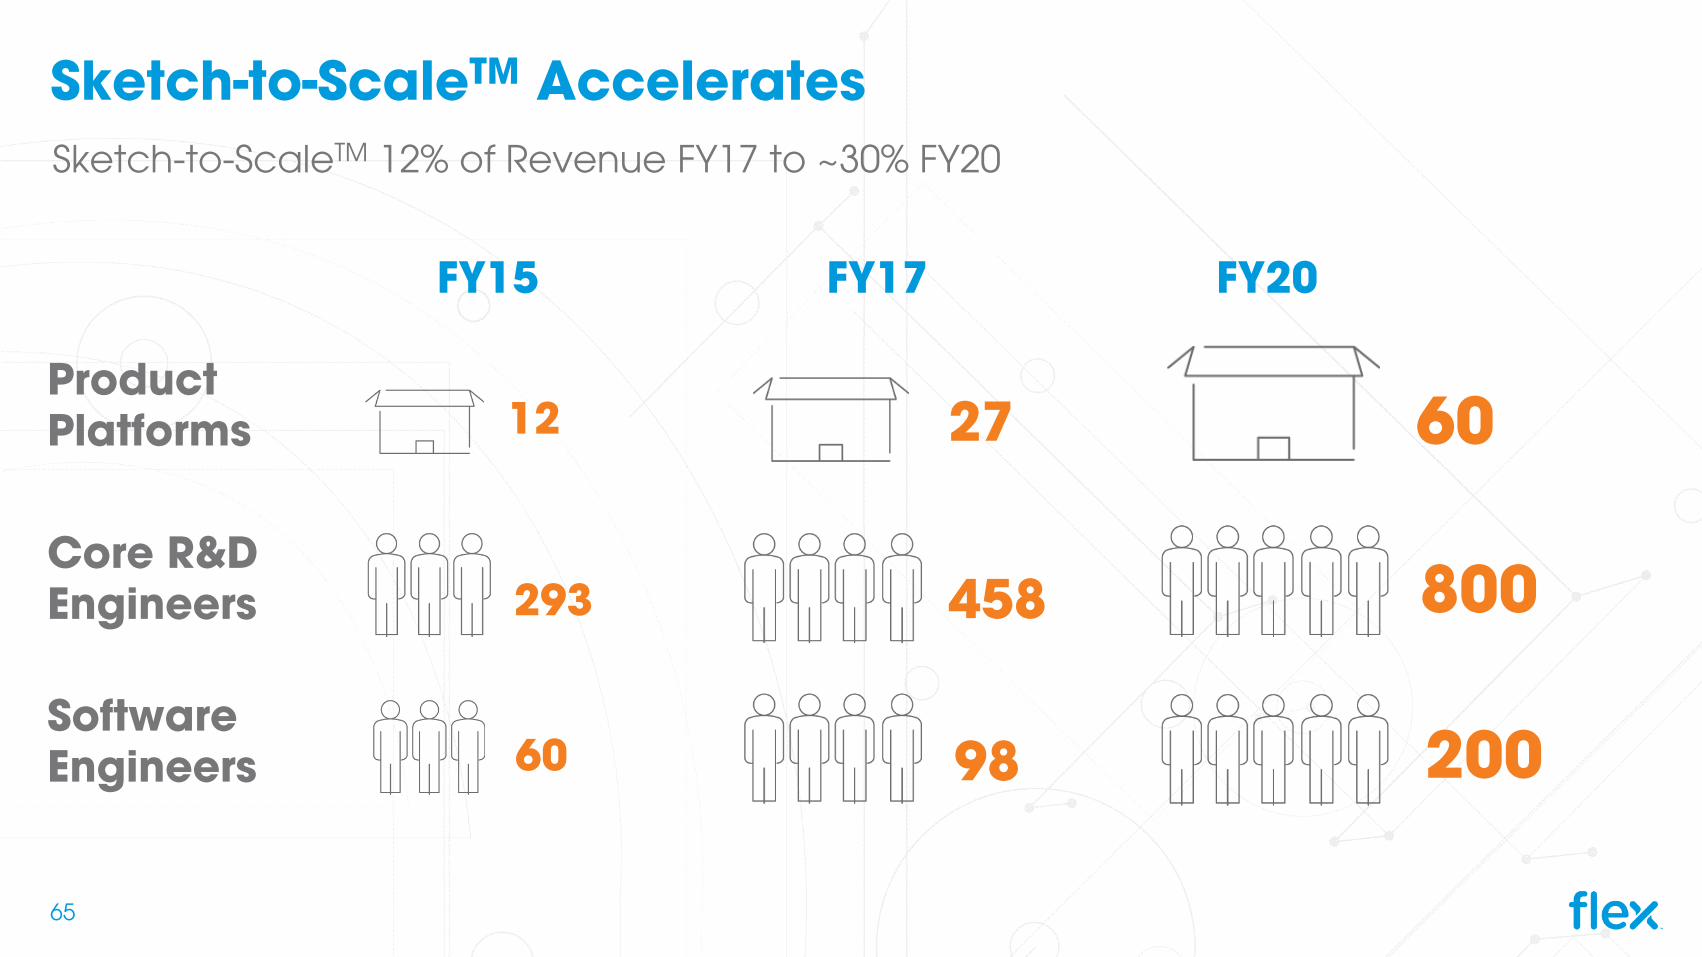
65
Sketch-to-ScaleTM Accelerates Sketch-to-ScaleTM 12% of Revenue FY17 to ~30% FY20
FY15 FY17 FY20
ProductPlatforms
Core R&DEngineers
SoftwareEngineers
12 27 60
293 458 800
60 98 200
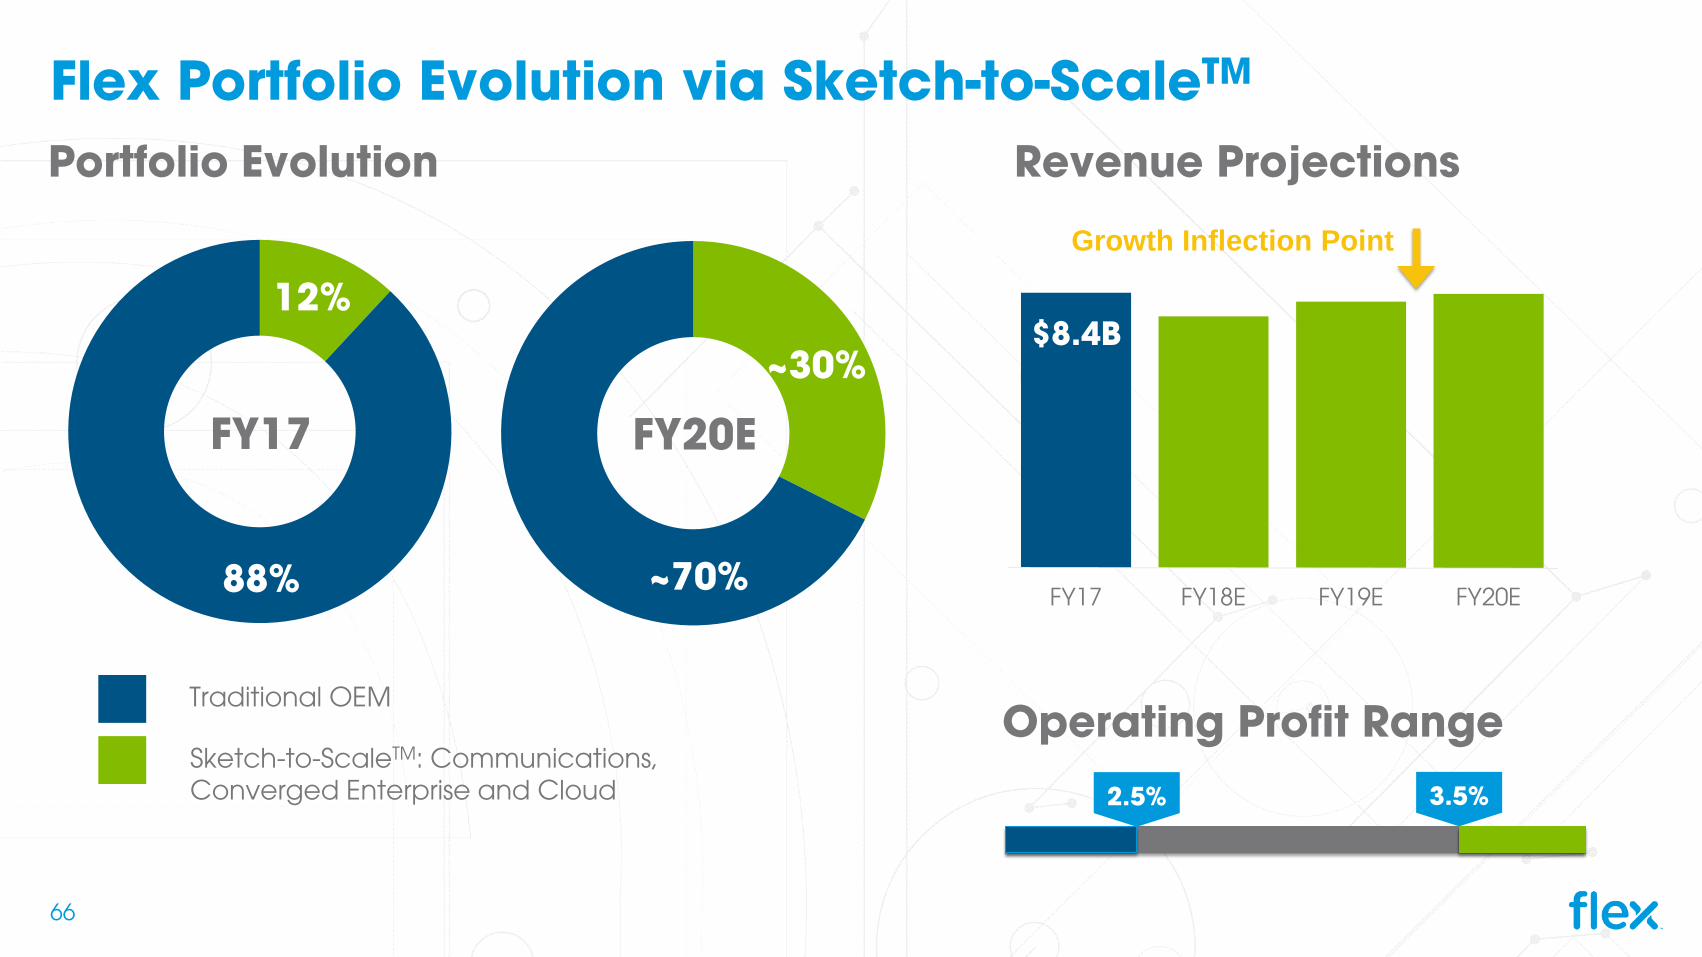
12%
88%
FY17
~30%
~70%
FY20E
Flex Portfolio Evolution via Sketch-to-ScaleTM
Portfolio Evolution
Operating Profit Range
Revenue Projections
Sketch-to-ScaleTM: Communications, Converged Enterprise and Cloud
Traditional OEM
FY17 FY18E FY19E FY20E
Growth Inflection Point
$8.4B
3.5%2.5%
66
Latest Financial Update
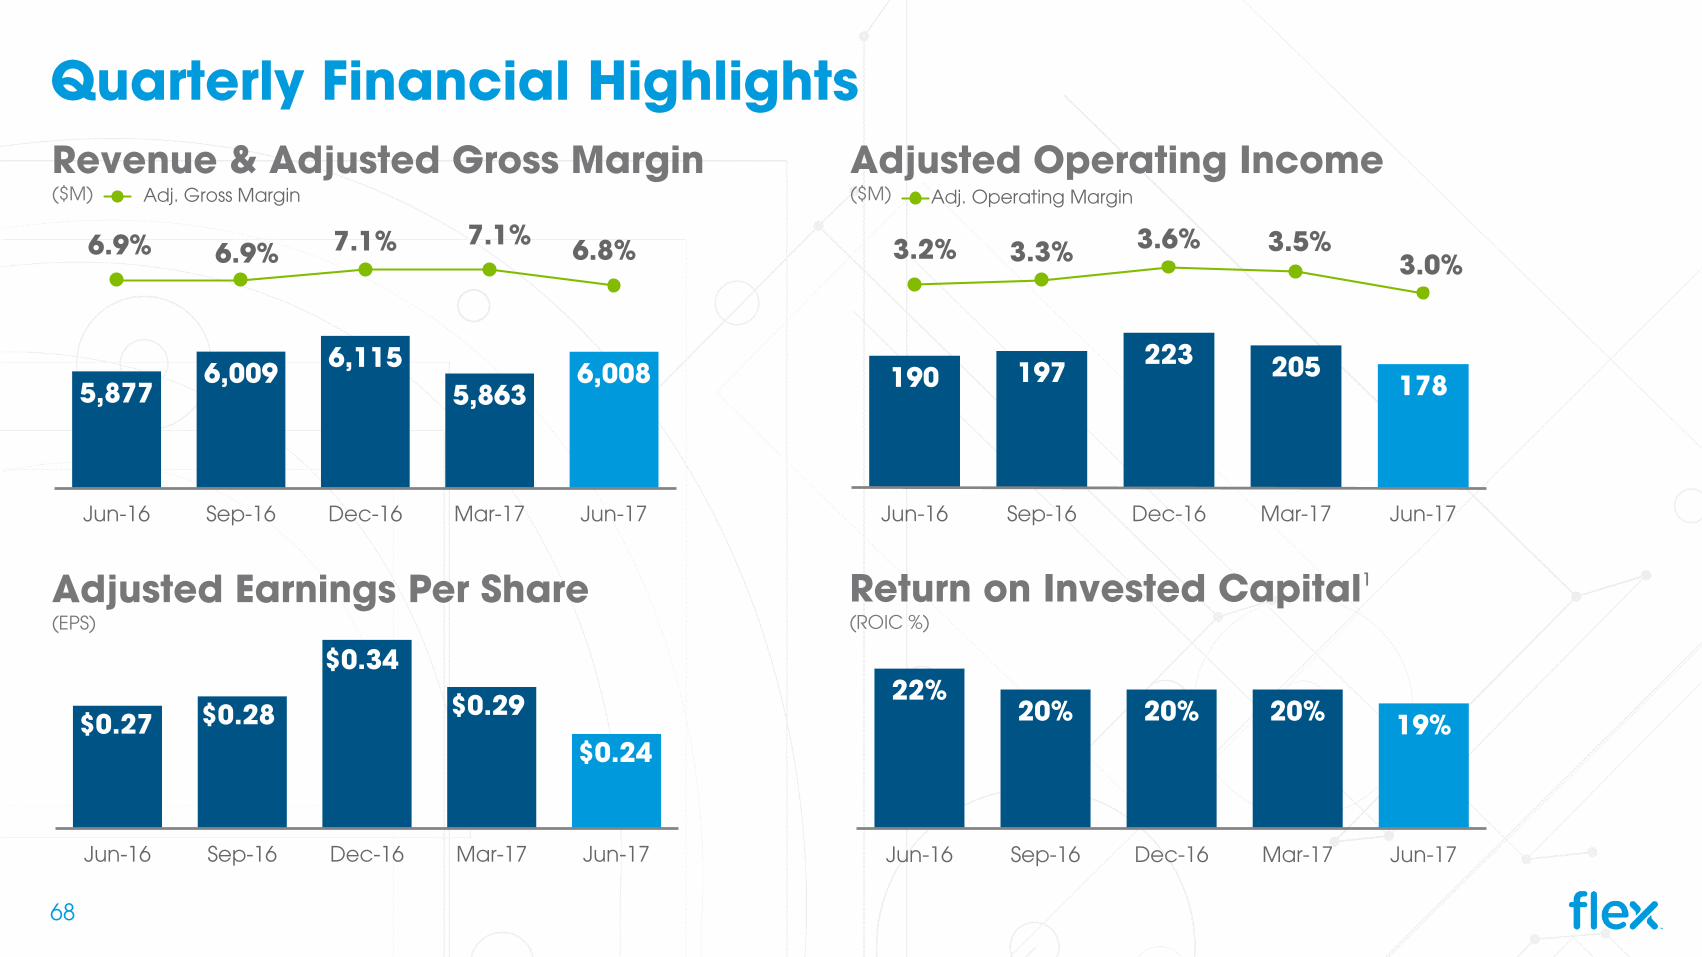
5,8776,009 6,115
5,8636,008
6.9% 6.9% 7.1% 7.1% 6.8%
Jun-16 Sep-16 Dec-16 Mar-17 Jun-17
Adj. Gross Margin
Adjusted Operating Income ($M)
190 197223 205
178
3.2% 3.3% 3.6% 3.5%3.0%
Jun-16 Sep-16 Dec-16 Mar-17 Jun-17
Adj. Operating Margin
Revenue & Adjusted Gross Margin($M)
Quarterly Financial Highlights
22%20% 20% 20% 19%
Jun-16 Sep-16 Dec-16 Mar-17 Jun-17
Return on Invested Capital1
(ROIC %)
$0.27 $0.28
$0.34
$0.29
$0.24
Jun-16 Sep-16 Dec-16 Mar-17 Jun-17
Adjusted Earnings Per Share (EPS)
68
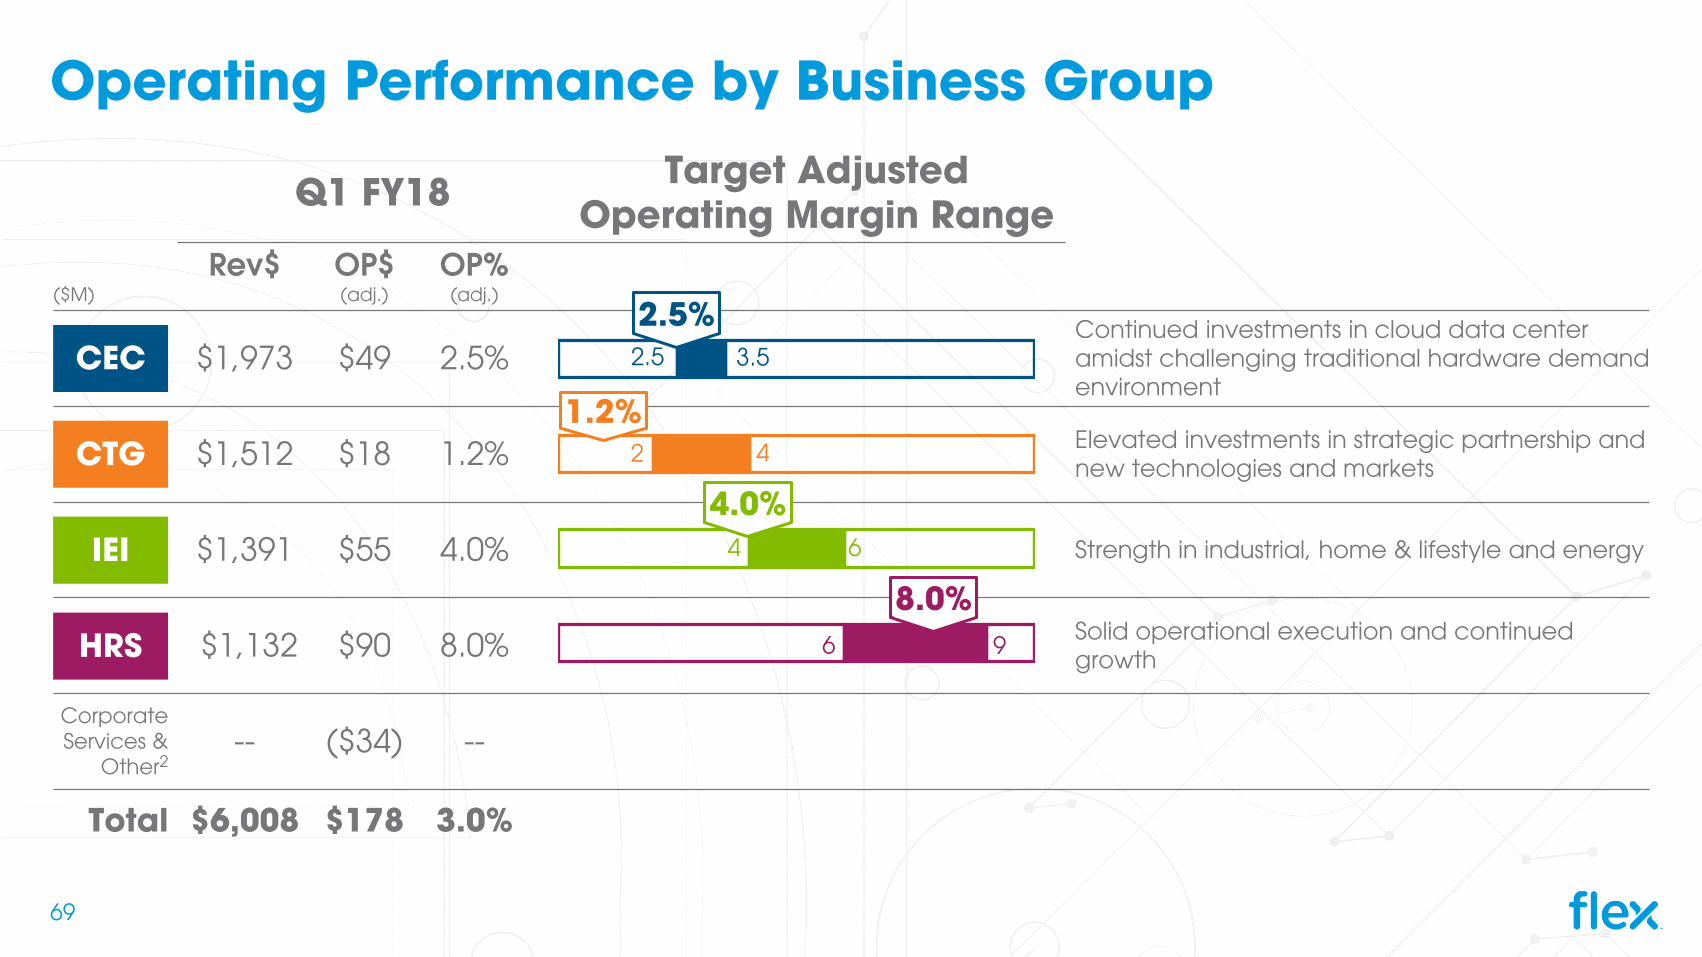
Q1 FY18 Target AdjustedOperating Margin Range
($M)Rev$ OP$
(adj.)OP%
(adj.)
$1,973 $49 2.5%Continued investments in cloud data center amidst challenging traditional hardware demand environment
$1,512 $18 1.2% Elevated investments in strategic partnership and new technologies and markets
$1,391 $55 4.0% Strength in industrial, home & lifestyle and energy
$1,132 $90 8.0% Solid operational execution and continued growth
Corporate Services &
Other2-- ($34) --
Total $6,008 $178 3.0%
6
4
2
2.5
9
6
4
3.5
Operating Performance by Business Group
1.2%
2.5%
4.0%
8.0%
CEC
CTG
IEI
HRS
69
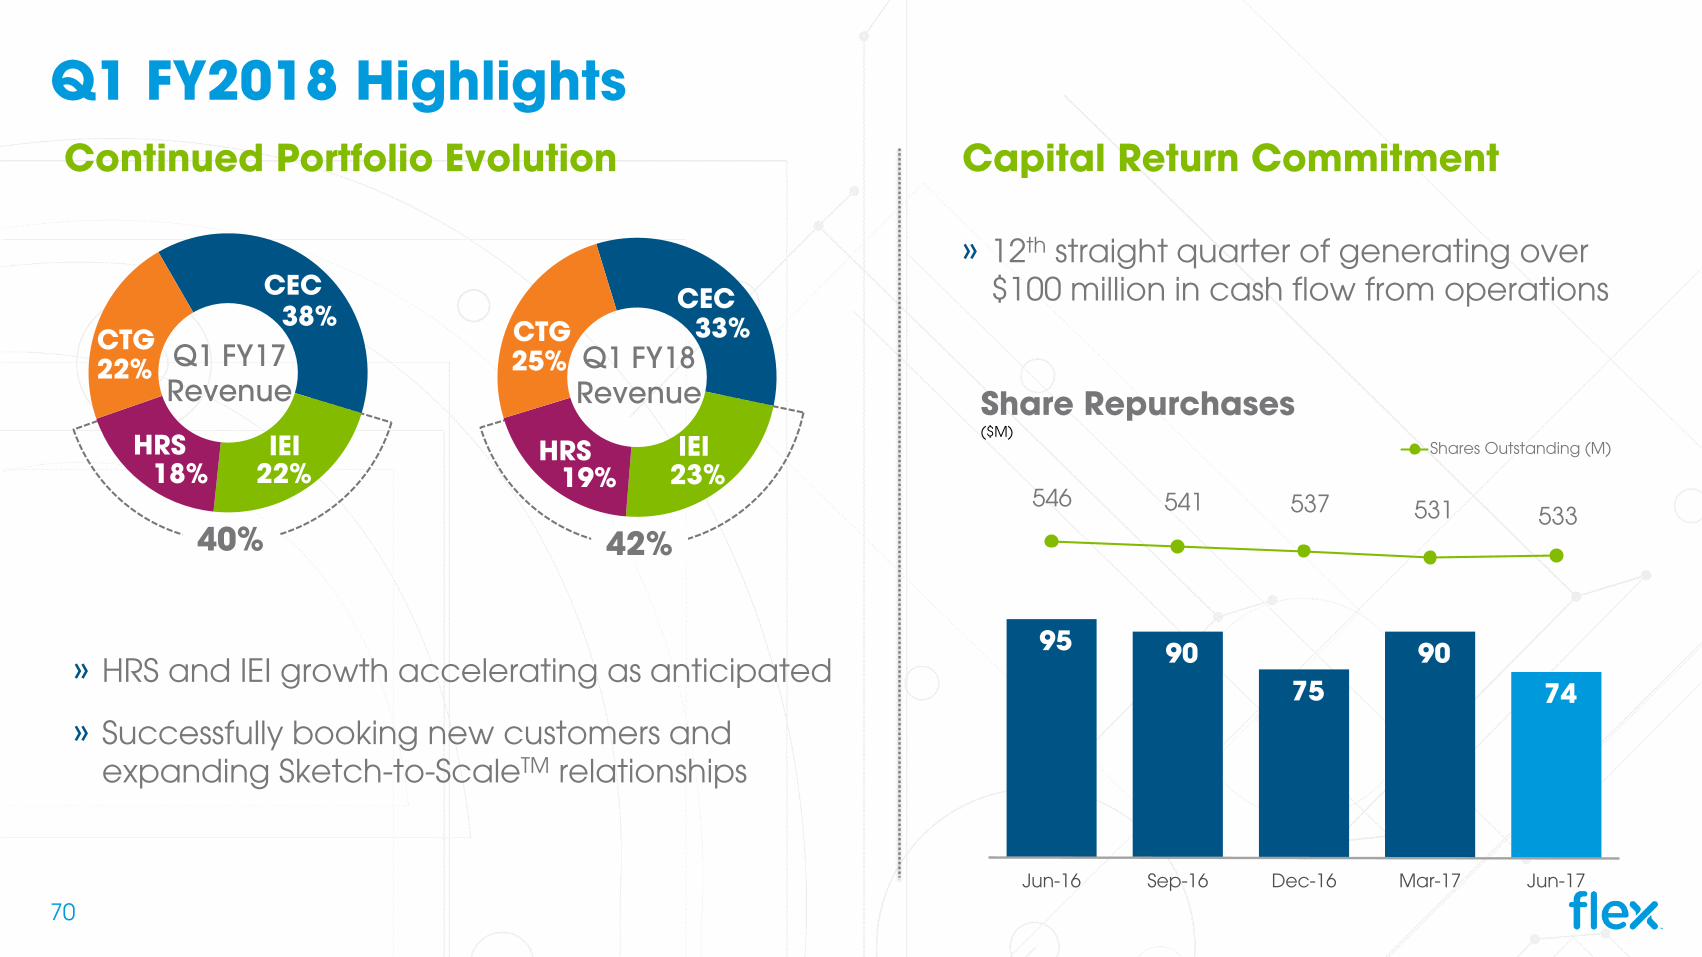
33%
23%19%
25% Q1 FY18 Revenue
42%
CTGCEC
IEIHRS
Q1 FY2018 Highlights
95 90 75
90 74
546 541 537 531 533
Jun-16 Sep-16 Dec-16 Mar-17 Jun-17
Shares Outstanding (M)
Share Repurchases($M)
Continued Portfolio Evolution Capital Return Commitment
38%
22%18%
22% Q1 FY17 Revenue
40%
CTG
CEC
IEIHRS
» HRS and IEI growth accelerating as anticipated
» Successfully booking new customers and expanding Sketch-to-ScaleTM relationships
» 12th straight quarter of generating over $100 million in cash flow from operations
70
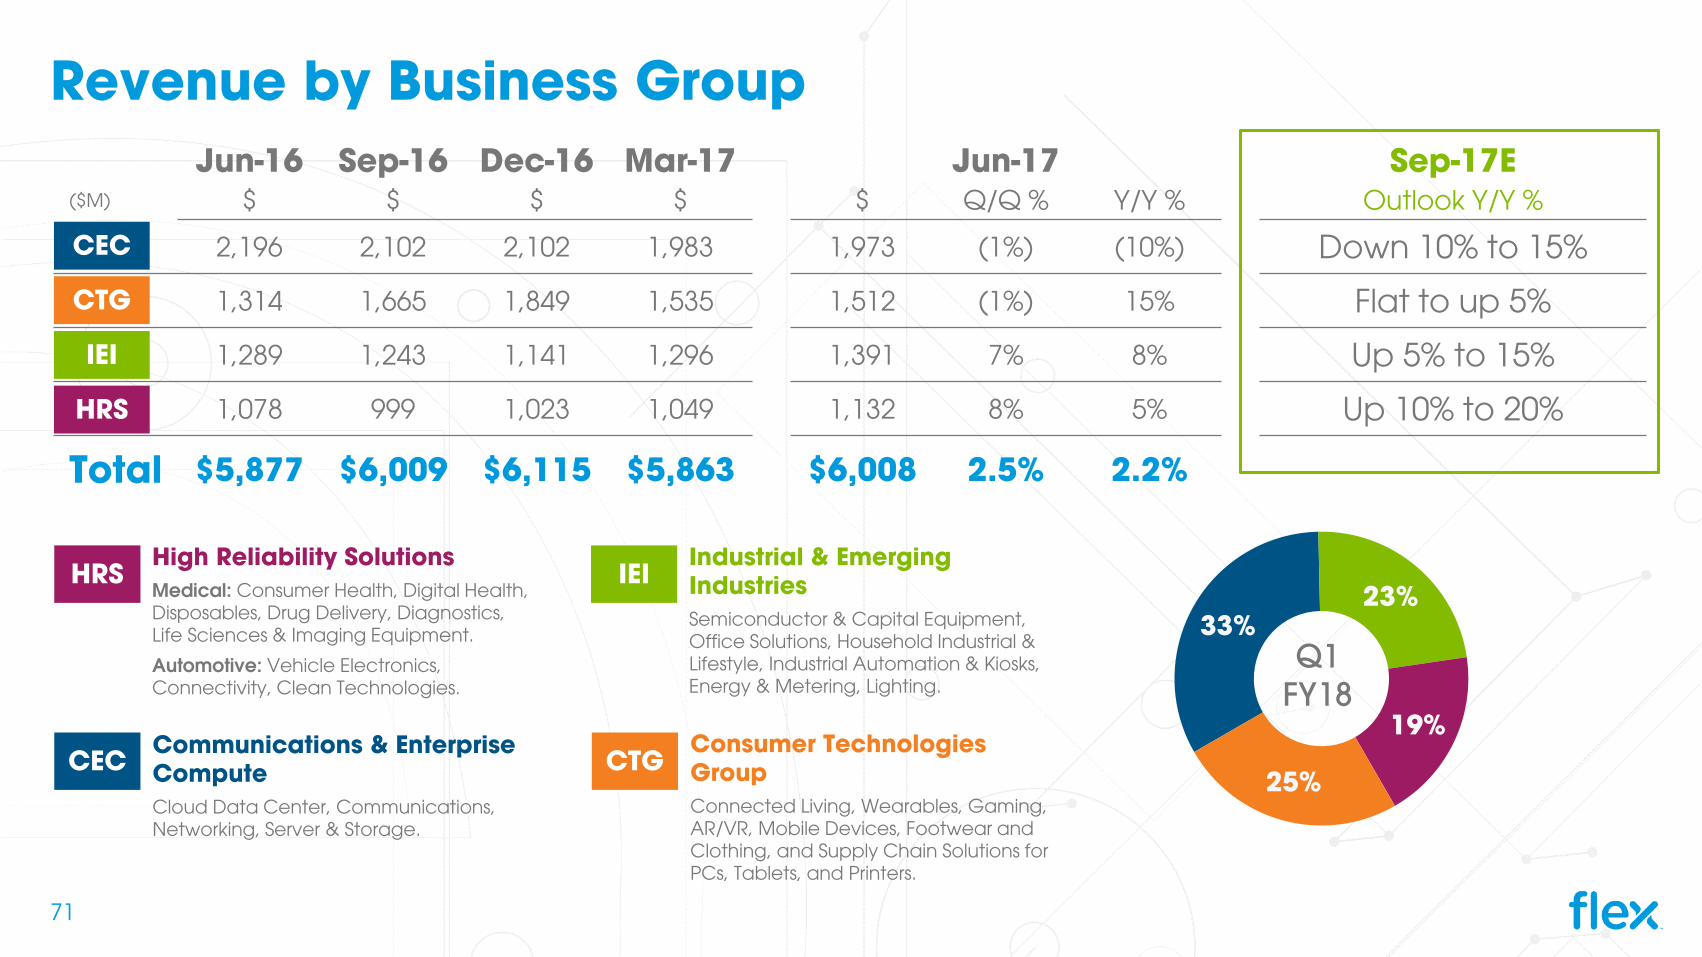
Industrial & Emerging IndustriesSemiconductor & Capital Equipment, Office Solutions, Household Industrial & Lifestyle, Industrial Automation & Kiosks, Energy & Metering, Lighting.
High Reliability SolutionsMedical: Consumer Health, Digital Health, Disposables, Drug Delivery, Diagnostics, Life Sciences & Imaging Equipment.
Automotive: Vehicle Electronics, Connectivity, Clean Technologies.
33%23%
19%
25%
Revenue by Business GroupJun-16 Sep-16 Dec-16 Mar-17 Jun-17 Sep-17E
($M) $ $ $ $ $ Q/Q % Y/Y % Outlook Y/Y %
2,196 2,102 2,102 1,983 1,973 (1%) (10%) Down 10% to 15%
1,314 1,665 1,849 1,535 1,512 (1%) 15% Flat to up 5%
1,289 1,243 1,141 1,296 1,391 7% 8% Up 5% to 15%
1,078 999 1,023 1,049 1,132 8% 5% Up 10% to 20%
Total $5,877 $6,009 $6,115 $5,863 $6,008 2.5% 2.2%
Q1 FY18
CEC
CTG
IEI
HRS
Communications & Enterprise ComputeCloud Data Center, Communications, Networking, Server & Storage.
Consumer Technologies GroupConnected Living, Wearables, Gaming, AR/VR, Mobile Devices, Footwear and Clothing, and Supply Chain Solutions for PCs, Tablets, and Printers.
HRS IEI
CEC CTG
71
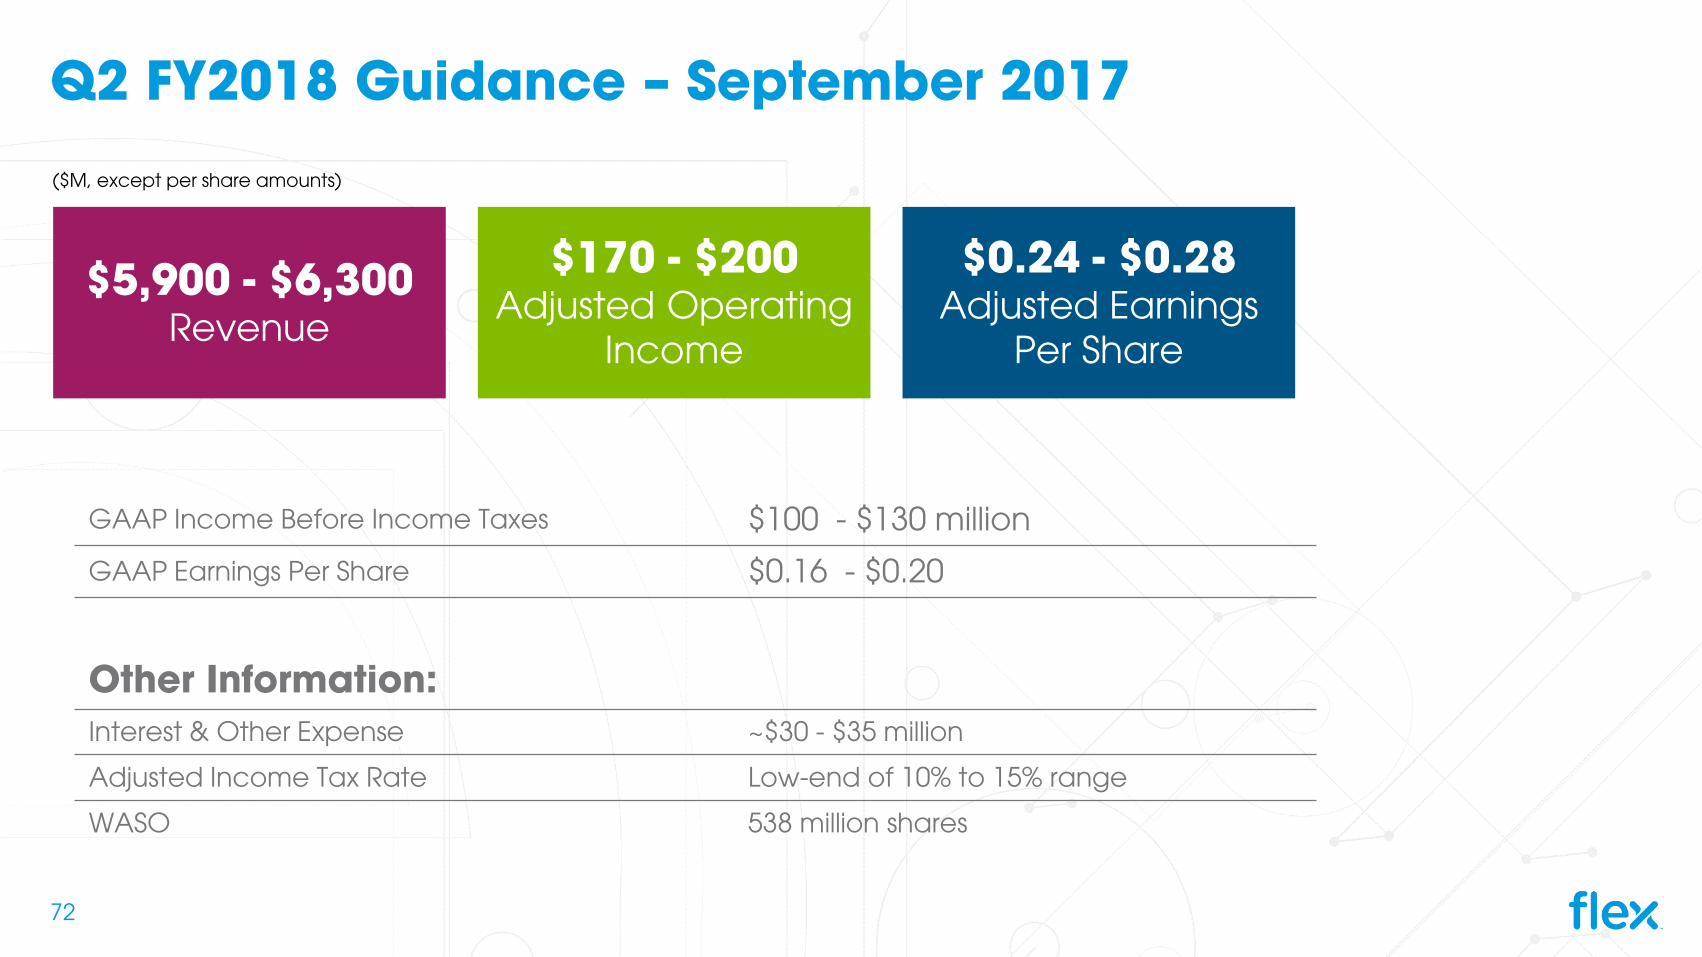
Q2 FY2018 Guidance – September 2017
GAAP Income Before Income Taxes $100 - $130 million
GAAP Earnings Per Share $0.16 - $0.20
Other Information:Interest & Other Expense ~$30 - $35 million
Adjusted Income Tax Rate Low-end of 10% to 15% range
WASO 538 million shares
($M, except per share amounts)
$5,900 - $6,300Revenue
$170 - $200Adjusted Operating
Income
$0.24 - $0.28Adjusted Earnings
Per Share
72

Appendix: Reconciliation of GAAP to Non-GAAP MeasuresQuarter-ended
June 30, 2017($Thousands, except debt to EBITDA ratio) GAAP Adjustments Non-GAAP
Pretax income $145,509 $5,532 $151,041Depreciation 108,432 -- 108,432Amortization 19,901 (19,901) --Interest, net 24,790 6,870 31,660
EBITDA4 298,632 (7,499) 291,133EBITDA – rolling 4 qtrs. 1,009,128 1,245,975Total Debt $2,964,532 -- $2,964,532
Debt to EBITDA4 2.9x (0.6x) 2.4X
Quarter-endedJune 30, 2017
ROIC %1
GAAP 13.1%Non-GAAP Adjustments 6.0%
Non-GAAP 19.1%
Quarter-endedJune 30, 2017
($Thousands, except per share amounts)
GAAP gross profit $406,932Stock-based compensation expense 3,319
Non-GAAP gross profit $410,251
GAAP income before income taxes $145,509Stock-based compensation expense 21,796Intangible amortization 19,901Interests and other, net 26,876Other charges (income), net (36,165)
Non-GAAP operating income $177,917
GAAP provision for income taxes $20,799Intangible amortization benefits 1,766
Non-GAAP provision for income taxes $22,565
GAAP net income $124,710Stock-based compensation expense 21,796Intangible amortization 19,901Adjustments for taxes (1,766)Other Charges (income), net (36,165)
Non-GAAP net income $128,476
Diluted EPS GAAP EPS $0.23Non-GAAP EPS $0.24
For more details on the GAAP to Non-GAAP adjustments for current and historical periods, please refer to the Investor Relations section of our website which includes press releases and summary financials of the respective periods.
73
Appendix: Definitions1. Return on Invested Capital (ROIC) is calculated by dividing the Company's last twelve months after-tax Non-GAAP operating income by the net invested capital asset base as of each date. After-tax non-GAAP operating income excludes charges for stock-based compensation expense and certain other charges or income. The net invested capital asset base is defined as the sum of shareholders' equity plus total debt less cash and cash equivalents averaged over the last five quarters. We believe ROIC is a useful measure in providing investors with information regarding our performance. ROIC is a widely accepted measure of earnings efficiency in relation to total capital employed. We believe that increasing the return on total capital employed, as measured by ROIC, is an effective method to sustain and increase shareholder value. ROIC is not a measure of financial performance under generally accepted accounting principles in the U.S., and may not be defined and calculated by other companies in the same manner. ROIC should not be considered in isolation or as an alternative to net income or loss as an indicator of performance.
2. Corporate services and other: corporate service costs that are not included in the assessment of the performance of each of the identified business groups.
3. Net Working Capital is calculated as accounts receivable (AR), net adding back the reduction in AR resulting from the non-cash AR sales plus inventories less accounts payable.
4. Earnings before Interest, Taxes, Depreciation and Amortization (EBITDA) and Debt/EBITDA are non-GAAP financial measures. EBITDA is derived by adjusting for net interest and adding back depreciation to non-GAAP pretax income. Quarterly Debt to EBITDA is calculated by dividing the Company's total debt as of the date presented by LTM EBITDA. Non-GAAP pretax income excludes certain amounts that are included in the most directly comparable measures under GAAP including stock-based compensation expense, intangible amortization and certain other charges. Additionally, non-GAAP interest includes the loss on the sale of accounts receivable under our global AR securitization and factoring programs.
74
Creating a smarter, more connected world
For more information contact:Kevin KesselVP, Investor [email protected](408) 576 - 7985
Or visit us at investors.flex.com
Mary LeeDirector, Investor [email protected](408) 576 - 5167
Katherine ChenAnalyst, Investor [email protected](408) 577 - 4037