Embed Size (px)
Citation preview
1
Skeletal Muscle Phospholipid Metabolism Regulates Insulin Sensitivity
and Contractile Function
Running Title: Muscle CEPT1 deficiency and insulin sensitivity
Katsuhiko Funai,1,4*
Irfan J. Lodhi,1* Larry D. Spears,
1 Li Yin,
1 Haowei Song,
1
Samuel Klein,2 and Clay F. Semenkovich
1,3
1Division of Endocrinology, Metabolism and Lipid Research,
2Division of Geriatrics and
Nutritional Science, 3Department of Cell Biology and Physiology, Washington University
School of Medicine, St. Louis, MO, 4Departments of Kinesiology and Physiology, East Carolina
University, Greenville, NC
*These authors contributed equally.
Corresponding Author:
Clay F. Semenkovich, MD
Washington University School of Medicine
660 South Euclid Avenue
Campus Box 8127
St. Louis, MO 63110
Phone: 314.362.7617
Fax: 314.362.7641
Keywords: Insulin resistance, exercise, phospholipids, type 2 diabetes
3,947 Words
6 Figures
2 Tables
Page 1 of 37 Diabetes
Diabetes Publish Ahead of Print, published online October 28, 2015
2
ABSTRACT
Skeletal muscle insulin resistance is an early defect in the development of type 2 diabetes. Lipid
overload induces insulin resistance in muscle and alters the composition of the sarcoplasmic
reticulum (SR). To test the hypothesis that skeletal muscle phospholipid metabolism regulates
systemic glucose metabolism, we perturbed choline/ethanolamine phosphotransferase-1 (CEPT1),
the terminal enzyme in the Kennedy pathway of phospholipid synthesis. In C2C12 cells, CEPT1
knockdown altered SR phospholipid composition and calcium flux. In mice, diet-induced obesity,
which decreases insulin sensitivity, increased muscle CEPT1 expression. In high-fat fed mice
with skeletal muscle-specific knockout of CEPT1, systemic and muscle-based approaches
demonstrated increased muscle insulin sensitivity. In CEPT1-deficient muscles, an altered SR
phospholipid milieu decreased sarco/endoplasmic reticulum Ca2+
ATPase (SERCA)-dependent
calcium uptake, activating calcium-signaling pathways known to improve insulin sensitivity.
Altered muscle SR calcium handling also rendered these mice exercise intolerant. In obese
humans, surgery-induced weight loss increased insulin sensitivity and decreased skeletal muscle
CEPT1 protein. In obese humans spanning a spectrum of metabolic health, muscle CEPT1
mRNA was inversely correlated with insulin sensitivity. These results suggest that high fat
feeding and obesity induce CEPT1, which remodels the SR to preserve contractile function at the
expense of insulin sensitivity.
Page 2 of 37Diabetes
3
Despite the dozens of disorders exacerbated or induced by physical inactivity (1), a sedentary
lifestyle has displaced the biologically normal exercise-trained condition in industrialized
countries (2). Skeletal muscle contractile function is intrinsically linked to exercise, and exercise
deficiency has contributed to the emergence of obesity, type 2 diabetes, and associated co-
morbidities as threats to public health. These conditions are associated with systemic insulin
resistance (3). Skeletal muscle is a major contributor to insulin-stimulated glucose disposal (4).
We recently reported an unexpected role for skeletal muscle lipogenesis in the
pathogenesis of insulin resistance (5). Fatty acid synthase (FAS), the enzyme catalyzing the
committed step in de novo lipogenesis, is suppressed in most tissues by a high fat, high calorie
diet (6), but the opposite occurs in skeletal muscle. In mice, high fat, high calorie feeding
increases skeletal muscle FAS activity, while muscle specific deficiency of FAS protects mice
from diet-induced muscle insulin resistance (5). The mechanism responsible for this relationship
involves FAS-facilitated synthesis of phosphatidylethanolamine (PE) at the sarcoplasmic
reticulum (SR) to maintain sarco/endoplasmic Ca2+
ATPase (SERCA) activity (7,8). In the
absence of FAS, altered PE content decreased SERCA activity, increased cytosolic calcium, and
triggered calcium- and AMPK-dependent pathways that increase muscle insulin sensitivity (9).
Decreased SERCA activity also induced muscle weakness, consistent with previous studies
(10,11).
Most PE synthesis in the mammalian SR/ER is mediated by choline/ethanolamine
phosphotransferase-1 (CEPT1), the terminal enzyme in the Kennedy pathway of phospholipid
synthesis (12) that generates both PE and phosphatidylcholine (PC). Since FAS has been linked
to changes in PE content, SR function, and insulin sensitivity, we evaluated the potential role of
skeletal muscle CEPT1 in glucose metabolism. Specifically, we perturbed CEPT1 in muscle,
Page 3 of 37 Diabetes

4
which included the generation of a novel mouse model of muscle-specific CEPT1 deficiency, to
test the hypothesis that skeletal muscle phospholipid metabolism regulates glucose metabolism.
Page 4 of 37Diabetes
5
RESEARCH DESIGN AND METHODS
Animals
The local Animal Studies Committee approved protocols. C57BL/6 ES cells were targeted with a
vector (European Conditional Mouse Mutagenesis Program) carrying loxP sites flanking exon 3
of mouse Cept1. A karyotypically normal clone (of 10 correctly targeted) was injected into
B6(Cg)-Tyrc-2J/J blastocysts, chimeric mice were bred with B6(Cg)-Tyrc-2J/J females, then
offspring were crossed with Flp recombinase transgenics to remove the neo cassette and yield
floxed heterozygous Cept1 mice (Cetp1 lox+/wt). Breeding with human α-skeletal actin (HSA)-
Cre mice (13) generated CEPT1 muscle knockout (CEPT1-MKO) mice, which were born in
expected Mendelian fashion, indistinguishable from their control littermates, and fertile. Floxed
mice without Cre were used as controls since previous studies showed no phenotype in Cre only
mice. Diets were Purina 4043 control chow or Harlan Teklad TD 88137 high-fat diet.
Lentivirus-mediated Knockdown
Plasmids encoding shRNA for mouse Cept1 (TRCN0000103317) and Chpt1
(TRCN0000103294) were from Open Biosystems. Packaging vector psPAX2 (ID #12260),
envelope vector pMD2.G (ID #12259) and scrambled shRNA plasmid (ID #1864) were from
Addgene. 293T cells in 10 cm dishes were transfected using Lipofectamine 2000 (Invitrogen)
with 2.66 µg psPAX2, 0.75 µg pMD2.G, and 3 µg shRNA plasmid. After 48 h, media were
collected, filtered using 0.45 µm syringe filters, and used to treat undifferentiated C2C12 cells.
After 36 h, target cells were selected with puromycin, then after 48 h cells were differentiated.
Metabolic Phenotyping
Chemistries were analyzed as described in mice fasted for 6 h (5). Leptin (Crystal Chem),
adiponectin (B-Bridge International), and insulin (PerkinElmer) ELISAs were performed
Page 5 of 37 Diabetes
6
according to manufacturers’ instructions. Glucose and insulin tolerance tests (5) were separated
by a week. Body composition was determined with an EchoMRI 3-in-1 instrument (Echo
Medical Systems). Free water mass was less than 0.1 g for all animals and did not differ by
genotype. Indirect calorimetry (Oxymax, Columbus Instruments) was performed as described (5)
over 24 h after acclimating mice. Cold tolerance testing was performed by fasting mice for 4 h,
then placing animals in a 4°C room for 6 h. Body temperatures were determined at regular
intervals with a rectal thermometer (Thermo Fisher).
Muscle Function Studies
Mouse forelimb strength was determined using a Rodent Grip Strength Meter (Harvard
Apparatus), which records peak force at the time grip is lost. Ten measurements separated by ten
min rest periods were recorded, two high and two low extremes were discarded, and the
remaining six values were averaged.
Treadmill running utilized a high-intensity protocol as described (14). Fed mice ran 1 min
intervals (with 2 min rest periods) beginning at 10 m/min and increasing by 5 m/min at each
interval until exhaustion (5 sec at electric grid).
Whole Body and Muscle-Specific Glucose Metabolism
Hyperinsulinemic-euglycemic clamps were performed as described (5). For the basal phase,
blood samples were obtained, 3-[3H]D-glucose was infused (0.05 µCi/min), then one h later a
second basal blood sample was obtained to estimate rate of appearance (Ra) or rate of
disappearance (Rd) (Ra = Rd for the basal phase). For the clamp phase, infusion of 3-[3H]D-
glucose was replaced with a solution that contained 3-[3H]D-glucose (0.05 µCi/min) and regular
human insulin at 2.5 mU/kg/min (with 50 mU/kg prime); D-glucose was infused to maintain
blood glucose at 120 mg/dl. After 75 min of steady state blood glucose at 120 mg/dl, a final
Page 6 of 37Diabetes
7
blood sample was taken to estimate Ra and Rd during the clamp phase (Ra ≠ Rd for the clamp
phase). Insulin-stimulated GDR (IS-GDR) was calculated as (Rd-clamp – Rd-basal). Hepatic
glucose production (HGP) suppression was calculated as ([Ra-basal – Ra-clamp] / Ra-basal).
2-deoxyglucose uptake in isolated muscles (15) was performed in paired soleus muscles
with one muscle incubated with 100 µU/ml of regular insulin and the other without insulin
(basal). Muscles were incubated in Krebs-Henseleit buffer (KHB) + 0.1% bovine serum albumin
(BSA) + 2 mM sodium pyruvate + 6 mM mannitol for 15 min, then transferred to a 2nd
vial with
KHB + 0.1% BSA + 1 mM 2-deoxyglucose (2DG, containing 2-deoxy-[3H]glucose, 6
mCi/mmol) + 9 mM mannitol (containing [14
C]mannitol, 0.053 mCi/mmol) for 15 min. Samples
were then processed, frozen, homogenized, and 2DG uptake was determined.
SERCA-Dependent Calcium Uptake
SR fractions isolated by differential centrifugation (5) from C2C12 myocytes or skeletal muscles
were assayed as described (5,16). The reaction was initiated with SR fractions containing 150 µg
protein, stopped with 0.15 M KCl/1 mM LaCl3, and counted after collection on a membrane.
SERCA-independent calcium transport was determined by assays in the presence of 10 µM
thapsigargin.
Phospholipid Assays
Samples reconstituted in ddH2O were mixed with extraction buffer [2:2(v/v)
chloroform/methanol] in the presence of internal standards: 14:0-PC ([M+Li]+ m/z 684.58) or
14:0-PE ([M-H]- m/z 678.62). The organic phase was collected, concentrated to dryness under
nitrogen, and reconstituted in methanol. An aliquot was removed, diluted with methanol
containing 0.6% LiCl, and analyzed by direct injection ESI-MS on a Thermo Vantage triple-
quadruple mass spectrometer in positive mode for the analysis of PC (neutral loss of 183) species.
Page 7 of 37 Diabetes
8
Another aliquot was analyzed in negative mode for PE species. Intensities of individual species
were compared to internal standards and results were generated using a standard curve.
PCR and Western Blotting
Genotyping and mouse/human RT-PCR primers were based on sequences in public databases.
For blotting, membranes were incubated with the following primary antibodies: anti-CEPT1 [sc-
133421], anti-CaMKI [sc-33165], anti-phospho-CaMKIThr177
[sc-28438] from Santa Cruz; anti-
CaMKII [#3362], anti-phospho-CaMKIIThr286
[#3361], anti-AMPKα [#2532], anti-phospho-
AMPKαThr172
[#2531], anti-Akt [#9272], anti-phospho-AktThr308
[#9275], anti-AS160 [#2447],
anti-phospho-AS160Thr642
[#4228] from Cell Signaling; anti-actin [A2066] from Sigma-Aldrich;
anti-OXPHOS cocktail [ab110413] from Abcam. Bands were quantified by densitometry.
Muscle Analyses
Fatty acid oxidation was assayed by incubating labeled palmitate with cell or tissue homogenates
and quantifying the generation of labeled CO2 using NaOH-containing filter paper (17). ATP
content in extensor digitorum longus (EDL) muscles was measured using a kit from Abcam
(ab83355). DAG was quantified using a Thermo Scientific LTQ Orbitrap Velos mass
spectrometer after extraction essentially as described (18). For electron microscopy, EDL
muscles from fasted mice were fixed in modified Karnovsky’s fixative, post-fixed in buffered
osmium tetroxide, stained with uranyl acetate, embedded, sectioned, post-stained with Venable’s
lead citrate, and imaged with a JEOL 1299EX electron microscope.
Human Studies
Fifty-five obese subjects participated in this study, which was approved by the local Human
Research Protection Office. Written informed consent was obtained from all subjects before
their participation. These subjects represent a subset of subjects reported previously as part of
Page 8 of 37Diabetes
9
other studies (surgical intervention registration: NCT00981500) that obtained muscle tissue
samples by percutaneous biopsy and evaluated skeletal muscle insulin sensitivity by using the
hyperinsulinemic-euglycemic clamp procedure in conjunction with stable isotopically labeled
glucose tracer, as previously described (19-21). No subject had diabetes or other serious illnesses,
none used tobacco, and none were taking medications that impact lipid metabolism.
Statistics
Results are expressed as means ± SEM or means with 95% confidence intervals. Comparisons
were performed using an unpaired two-tailed Student t-test (for two-group analyses) or two-way
ANOVA with Student-Newman-Keuls post hoc test (for two by two comparisons).
Page 9 of 37 Diabetes
10
RESULTS
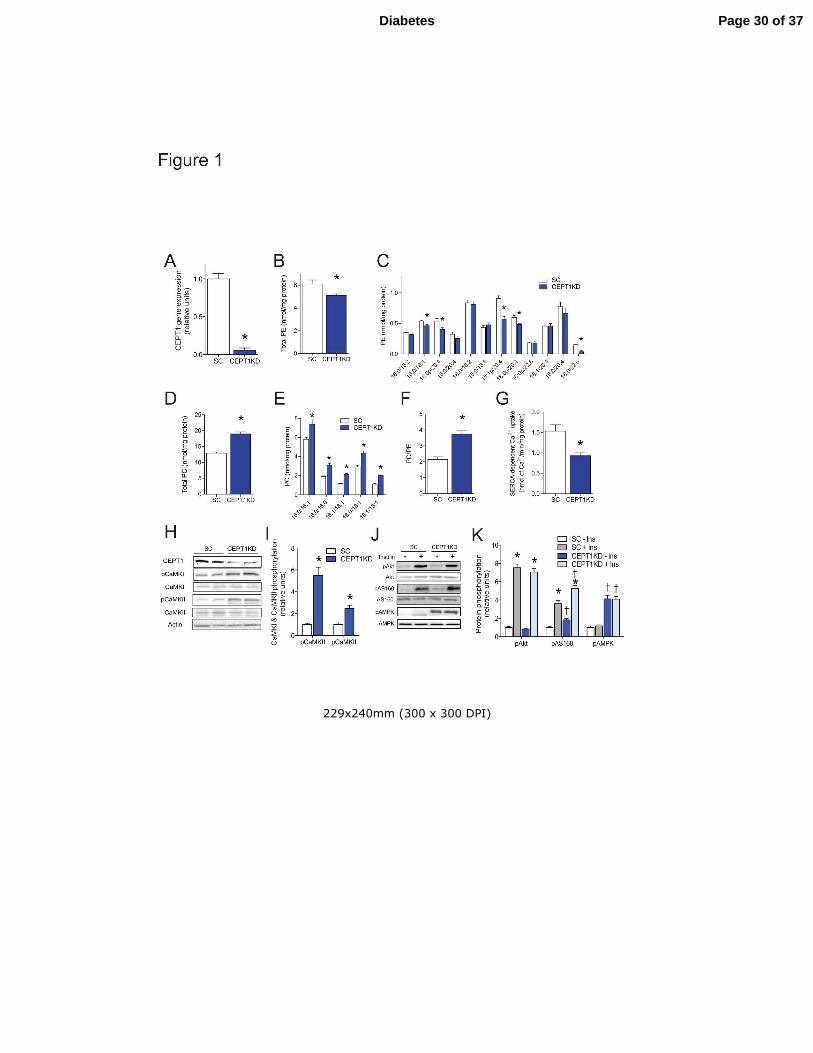
CEPT1 Knockdown in C2C12 Cells
Skeletal muscle FAS deficiency increases insulin sensitivity in mice by activating calcium-
dependent signals through the alteration of SR phospholipid composition and SERCA activity
(5). These mechanisms were defined in part by studying C2C12 cells, a skeletal muscle-like cell
line that models some canonical signaling pathways in mammalian muscle. To determine if
CEPT1, a critical enzyme in phospholipid synthesis, represents a lipid signaling node
downstream of FAS, we knocked down CEPT1 in C2C12 cells. Lentivirus-mediated knockdown
of CEPT1 (Fig. 1A), reported to reside in the ER/SR (12,22) decreased SR
phosphatidylethanolamine (PE) content as compared to cells treated with a scrambled virus (Fig.
1B,C). CEPT1 knockdown also resulted in an increase in phosphatidylcholine (PC) (Fig. 1D,E),
which nearly doubled the SR PC/PE ratio (Fig. 1F). Mirroring findings with FAS inactivation
and reports from others indicating that an increased PC:PE ratio decreases SERCA activity
(5,7,8), these changes in SR phospholipids and PC:PE ratio resulted in decreased SERCA-
dependent calcium uptake (Fig. 1G) and activation of the calcium signaling proteins CaMKI and
CaMKII (Fig. 1H,I). Similar to FAS deficiency, CEPT1 deficiency in C2C12 cells did not alter
Akt phosphorylation, but increased phosphorylation of AMPK and AS160, leading to increased
pAS160 in response to insulin signaling (Fig. 1J,K). Knockdown of CEPT1 in C2C12 cells did
not affect fatty acid oxidation (0.64 ± 0.04 nmol palmitate/mg/h in scrambled vs. 0.58 ± 0.03 in
CEPT1 KD, P=0.28). Knockdown of choline phosphotransferase-1 (ChPT1), a PC synthesizing
enzyme that resides in the Golgi (12), did not affect phospholipids, SERCA activity, or calcium
signaling (Supplementary Fig. 1A-I).
Page 10 of 37Diabetes
11
Effects of High-Fat Diet on CEPT1 in Mouse Skeletal Muscle
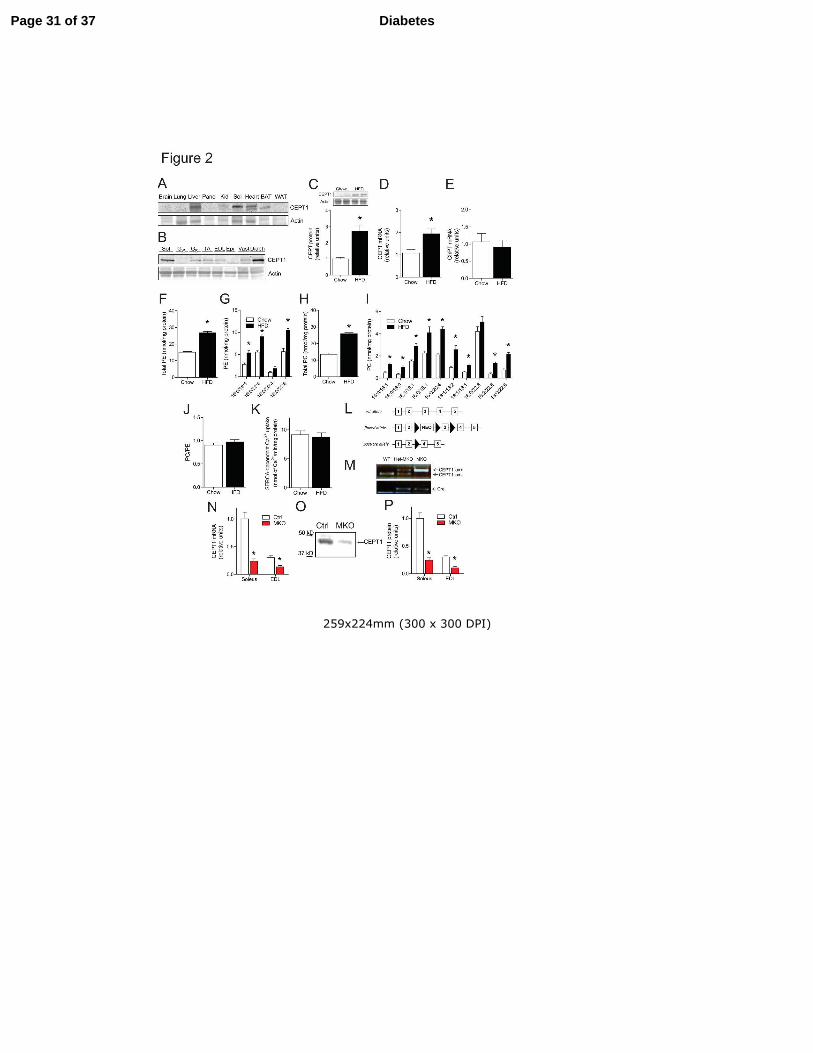
A tissue survey for CEPT1 protein by Western blotting in wild type C57BL/6 mice showed high
expression in liver, soleus muscle, heart, and brown adipose tissue (Fig. 2A). Western blotting of
eight different muscles with different physiological characteristics and different fiber-type
composition showed higher expression of CEPT1 in soleus and diaphragm (Fig. 2B). Both have
a predominance of slow-twitch fibers, which have been linked to diet-induced insulin resistance
(23,24). Six weeks of high-fat diet (HFD) feeding, which causes insulin resistance, to C57BL/6
mice increased levels of CEPT1 protein and mRNA (Fig. 2C and D), but not ChPT1 mRNA (Fig.
2E) in soleus muscle. Since high-fat diet feeding in mice is known to alter PC and PE abundance
in skeletal muscle (5,25), we fed mice standard chow or high-fat diet and isolated the SR from
gastrocnemius muscles. HFD caused proportional increases in both PE (Figure 2F,G) and PC
(Figure 2H,I) in SR. There was no difference in the SR PC:PE ratio (a determinant of SERCA
activity) or SERCA activity between chow and HFD mice (Fig. 2J,K). These data suggest that in
wild type mice, a high-fat diet induces CEPT1 expression and increases PC and PE abundance in
skeletal muscle SR, with maintenance of SR calcium handling likely due to maintenance of the
SR PC:PE ratio.
Skeletal Muscle-Specific CEPT1 Deficiency in Mice
To determine directly if CEPT1 deficiency improves insulin sensitivity after high-fat diet feeding,
we generated CEPT1 muscle-specific knockout (MKO) mice. Human α-skeletal actin (HSA)-Cre,
specific for skeletal muscle, was used to target the floxed CEPT1 locus (Fig. 2L,M). CEPT1-
MKO mice showed proportional decreases in CEPT1 message and protein in both soleus and
EDL muscles (Fig. 2N-P). With chow feeding, CEPT1-MKO and control mice did not differ in
body weight, body composition, oxygen consumption (VO2), respiratory quotient (RQ), GTT,
Page 11 of 37 Diabetes
12
ITT, circulating metabolites, or major metabolic hormones (Supplementary Fig. 2, Table 1). Like
CEPT1-MKO mice, skeletal muscle-specific FAS knockout mice also have no metabolic
phenotype with chow feeding (5).
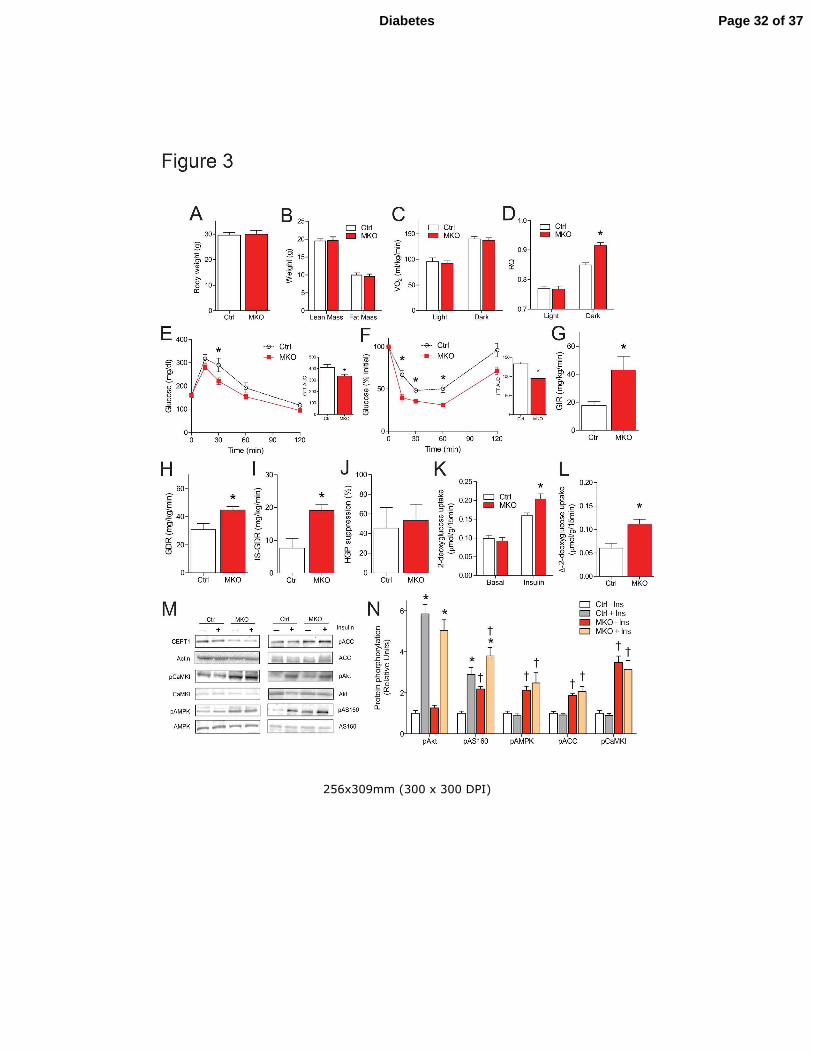
CEPT1-MKO and control mice were challenged with a high-fat diet. After six weeks,
body weight (Fig. 3A), body composition (Fig. 3B), circulating metabolites, hormones, tissue
weights (Table 1) and VO2 (Fig. 3C) did not differ between genotypes. However, RQ during
dark cycles was increased in CEPT1-MKO compared to control mice (Fig. 3D), suggesting
increased utilization of glucose by CEPT1-MKO mice when these nocturnal animals are eating.
CEPT1-MKO Mice are Protected from Diet-induced Insulin Resistance
Glucose and insulin tolerance testing showed that high-fat fed mice with skeletal muscle CEPT1
deficiency had improved glucose tolerance (Fig. 3E) and lower blood glucose after insulin
administration (Fig. 3F) compared to controls. To clarify site-specific effects on insulin
sensitivity, hyperinsulinemic-euglycemic clamp studies were conducted in high-fat diet fed
CEPT1-MKO and control mice (Fig. 3G-J). Consistent with GTT and ITT results in these
animals, the glucose infusion rate (GIR), an indicator of whole-body insulin sensitivity, was two-
fold greater in CEPT1-MKO compared to control mice (Fig. 3G). The insulin-stimulated glucose
disposal rate (IS-GDR), an indicator of peripheral insulin sensitivity, was also two-fold greater in
CEPT1-MKO compared to control mice (Fig. 3I). There was no genotype-specific effect on
insulin suppression of endogenous (mostly hepatic) glucose production (HGP suppression, Fig.
3J).
Enhanced insulin sensitivity occurred without effects on adiposity (Fig. 3B), serum FFA,
adiponectin, or leptin concentrations (Table 1), or metabolic rate (Fig. 3C), suggesting that
muscle CEPT1 deficiency increased insulin sensitivity through effects intrinsic to muscle. To
Page 12 of 37Diabetes
13
address directly the potential role of muscle in the phenotype, soleus muscles isolated from high-
fat fed CEPT1-MKO and control mice were incubated in the presence of 2-deoxyglucose with or
without 100 µU/mL insulin. Insulin-stimulated 2-deoxyglucose uptake in CEPT1-MKO muscle
was greater than in control muscle (Fig. 3K,L). Western blotting showed that calmodulin-
dependent kinase I (CaMKI) and AMPK were activated in CEPT1-MKO muscle as compared to
control muscle, but there was no genotype-specific effect on Akt (Fig. 3M,N). AMPK activation
would be expected to increase phosphorylation of acetyl-CoA carboxylase (ACC) and AS160,
both seen in CEPT1-MKO muscles (Fig. 3M,N), effects associated with increased insulin
sensitivity. This same pattern of calcium-activated signaling with no effect on Akt was also seen
in muscle-specific FAS knockout mice (5), suggesting that FAS and CEPT1 regulate muscle
insulin sensitivity through similar mechanisms.
Muscle CEPT1 Deficiency is Associated with Altered SR Phospholipid Composition,
Disrupted Calcium Handling, and Weakness
FAS deficiency in C2C12 cells as well as in skeletal muscle alters the SR PC:PE ratio to
decrease SERCA activity (5), and CEPT1 deficiency in C2C12 cells similarly increases SR
PC:PE and decreases SERCA activity (Fig. 1), so we characterized SR phospholipids and
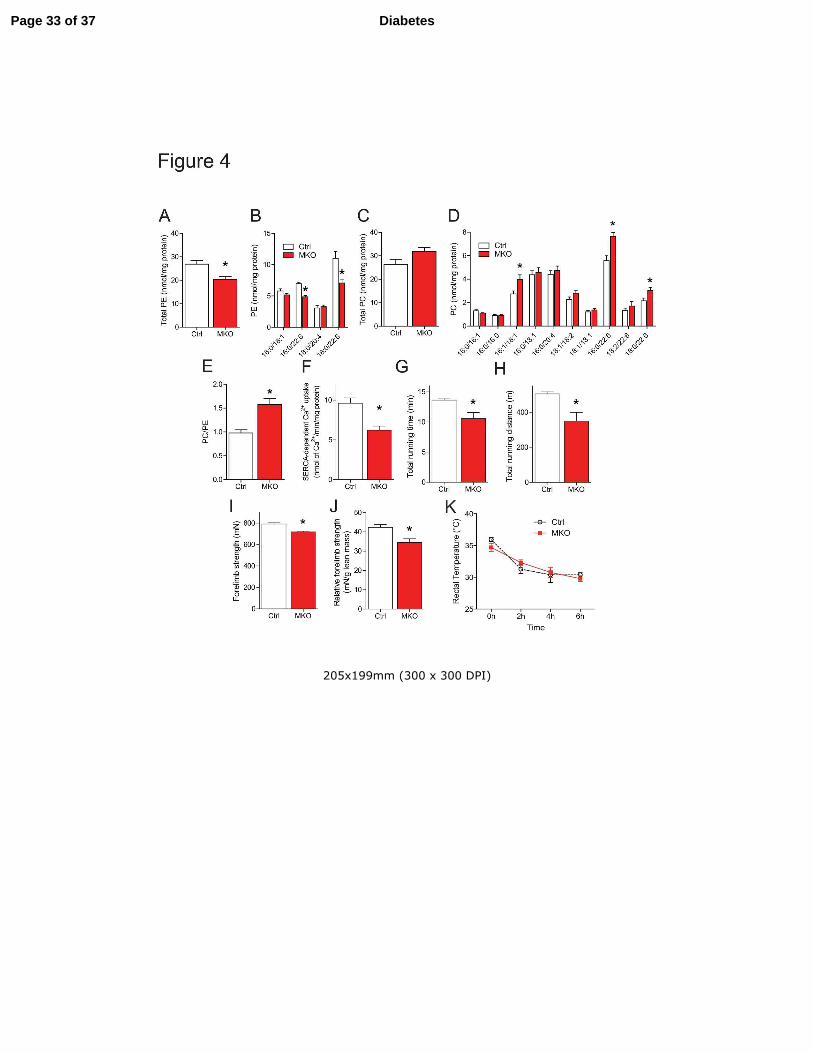
SERCA activity in gastrocnemius muscle of MKO mice. Muscle CEPT1 deficiency in high-fat
fed mice reduced SR PE (Fig. 4A,B), and increased several SR PC species (Fig. 4C,D), which
increased the SR PC/PE ratio (Fig. 4E). This membrane composition change reduced SERCA-
dependent calcium uptake in CEPT1 deficient muscles (Fig. 4F).
Intact SR calcium handling is required for normal muscle strength (26). Mimicking the
effects in high-fat fed mice with skeletal muscle FAS deficiency (5), HFD CEPT1-MKO mice
had decreased performance compared to control mice during high intensity exercise tests (Fig.
Page 13 of 37 Diabetes
14
4G,H), and had weaker forelimb grip strength than control mice (Fig. 4I,J). Altered SERCA
activity in muscle has been reported to affect thermogenesis (27), but there was no body
temperature difference between HFD-fed MKO and control mice in cold tolerance tests (Fig. 4K).
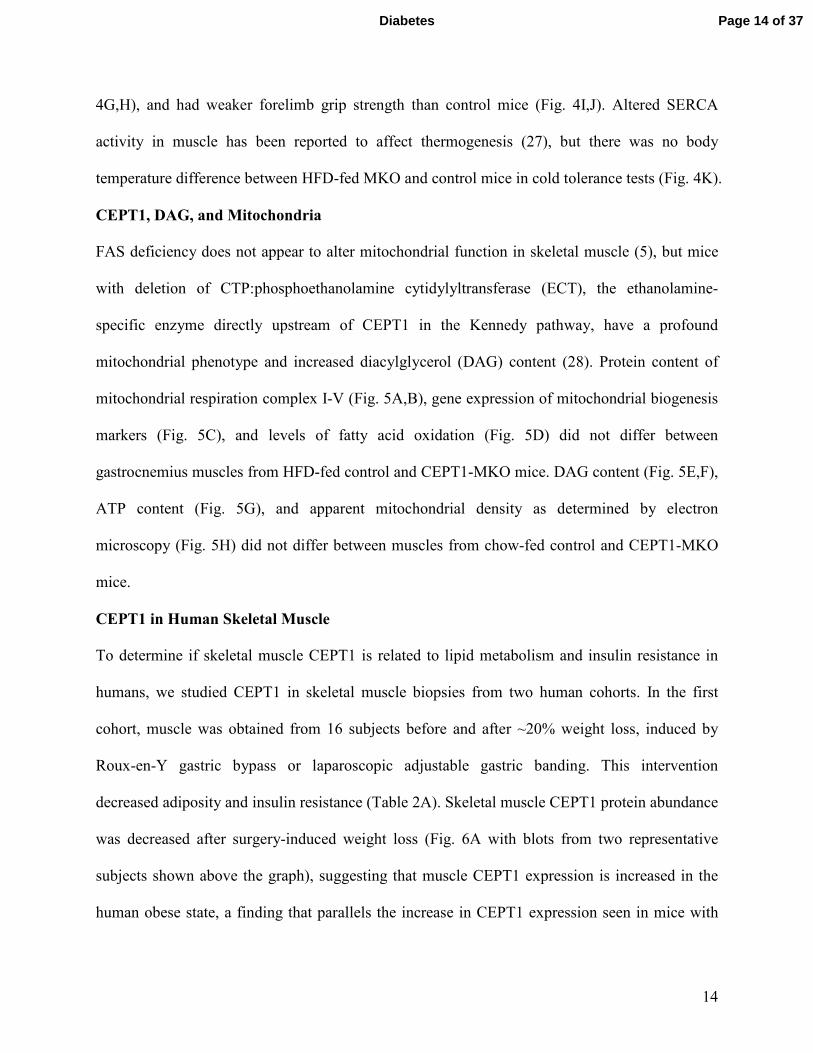
CEPT1, DAG, and Mitochondria
FAS deficiency does not appear to alter mitochondrial function in skeletal muscle (5), but mice
with deletion of CTP:phosphoethanolamine cytidylyltransferase (ECT), the ethanolamine-
specific enzyme directly upstream of CEPT1 in the Kennedy pathway, have a profound
mitochondrial phenotype and increased diacylglycerol (DAG) content (28). Protein content of
mitochondrial respiration complex I-V (Fig. 5A,B), gene expression of mitochondrial biogenesis
markers (Fig. 5C), and levels of fatty acid oxidation (Fig. 5D) did not differ between
gastrocnemius muscles from HFD-fed control and CEPT1-MKO mice. DAG content (Fig. 5E,F),
ATP content (Fig. 5G), and apparent mitochondrial density as determined by electron
microscopy (Fig. 5H) did not differ between muscles from chow-fed control and CEPT1-MKO
mice.
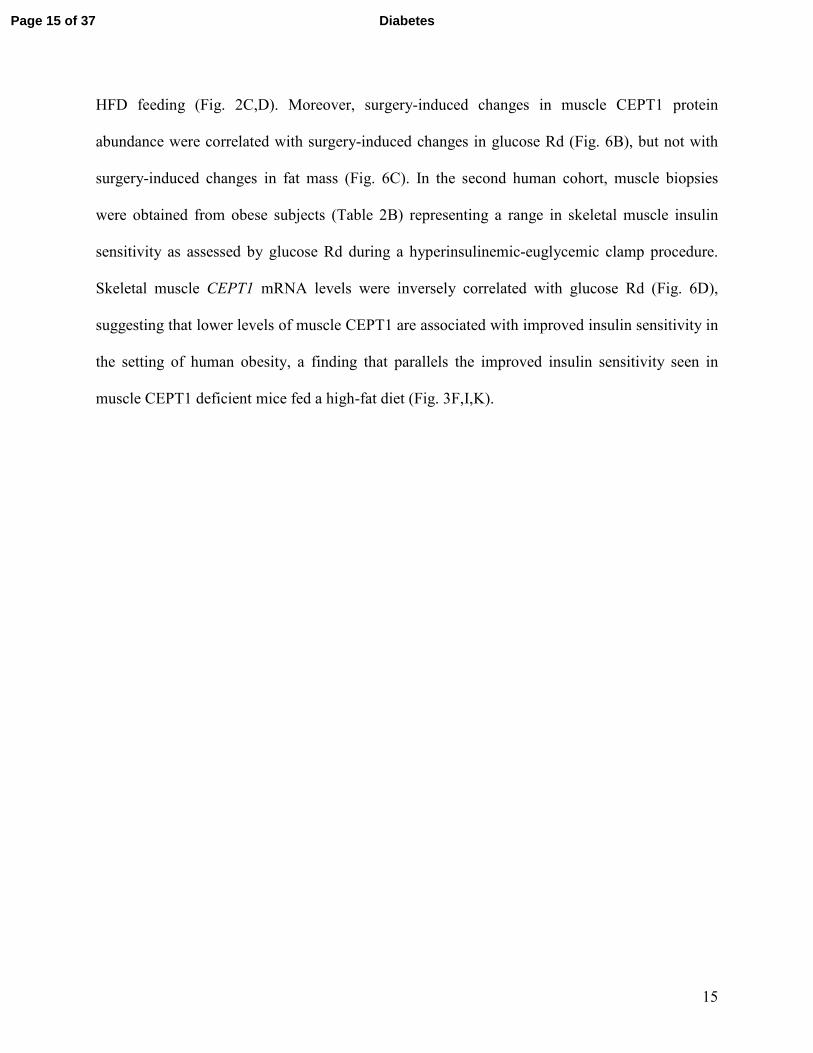
CEPT1 in Human Skeletal Muscle
To determine if skeletal muscle CEPT1 is related to lipid metabolism and insulin resistance in
humans, we studied CEPT1 in skeletal muscle biopsies from two human cohorts. In the first
cohort, muscle was obtained from 16 subjects before and after ~20% weight loss, induced by
Roux-en-Y gastric bypass or laparoscopic adjustable gastric banding. This intervention
decreased adiposity and insulin resistance (Table 2A). Skeletal muscle CEPT1 protein abundance
was decreased after surgery-induced weight loss (Fig. 6A with blots from two representative
subjects shown above the graph), suggesting that muscle CEPT1 expression is increased in the
human obese state, a finding that parallels the increase in CEPT1 expression seen in mice with
Page 14 of 37Diabetes
15
HFD feeding (Fig. 2C,D). Moreover, surgery-induced changes in muscle CEPT1 protein
abundance were correlated with surgery-induced changes in glucose Rd (Fig. 6B), but not with
surgery-induced changes in fat mass (Fig. 6C). In the second human cohort, muscle biopsies
were obtained from obese subjects (Table 2B) representing a range in skeletal muscle insulin
sensitivity as assessed by glucose Rd during a hyperinsulinemic-euglycemic clamp procedure.
Skeletal muscle CEPT1 mRNA levels were inversely correlated with glucose Rd (Fig. 6D),
suggesting that lower levels of muscle CEPT1 are associated with improved insulin sensitivity in
the setting of human obesity, a finding that parallels the improved insulin sensitivity seen in
muscle CEPT1 deficient mice fed a high-fat diet (Fig. 3F,I,K).
Page 15 of 37 Diabetes
16
DISCUSSION
How excess lipids interact with muscle to affect glucose metabolism is poorly understood.
Caloric excess and physical inactivity promote hyperlipidemia and lipid deposition in skeletal
muscle (29), leading to increased lipid content that is associated with insulin resistance (30).
However, insulin-sensitive trained athletes also have lipid-laden muscles (18,31), an observation
difficult to reconcile with findings in insulin-resistant muscle despite elegant studies of
diacylglycerols (32), acylated molecules (33-35), and ceramides (36). To provide novel insights
into the complex relationship between lipid excess and insulin sensitivity, we tested the
hypothesis that skeletal muscle phospholipid metabolism regulates glucose metabolism.
Our results show that lipid overload in the form of high fat feeding to mice and obesity in
humans is associated with increased expression of CEPT1. High-fat diet induction of CEPT1 in
mice increased phospholipid content of skeletal muscle, and disruption of CEPT1 in either cells
or mice resulted in phospholipid compositional changes linked to decreased activity of SERCA,
which sequesters calcium in the SR to preserve muscle strength. High-fat fed mice with skeletal
muscle-specific CEPT1 deficiency had increased insulin sensitivity due to increased glucose
transport into muscle. The muscle-specific CEPT1 deficient animals were weak, consistent with
decreased SERCA activity.
Our findings in mice have potential translational relevance. CEPT1 mRNA levels are
inversely correlated with insulin sensitivity, and weight loss in obese humans decreases skeletal
muscle CEPT1 protein. The latter change correlated with insulin sensitivity but not fat mass,
suggesting that CEPT1 and its products, as opposed to potentially toxic effects of other lipids,
may play a role in human insulin resistance.
Page 16 of 37Diabetes
17
These results suggest that lipid excess induces SR phospholipid adaptation in skeletal
muscle, and implicates CEPT1 as an important enzyme for maintaining SR functional integrity.
The SR releases calcium to allow contraction, and sequesters calcium through the activity of
SERCA to allow relaxation. Our data show that high-fat diet feeding increases SR phospholipid
abundance, mediated in part by an induction of CEPT1 that preserves the PC:PE ratio, a known
determinant of SERCA activity (7,37). In the absence of muscle CEPT1, an increased PC:PE
ratio decreases SERCA activity, causing muscle weakness (26).
Both CEPT1 and FAS increase in muscle with high-fat feeding. Muscle CEPT1
deficiency appears to mirror muscle FAS deficiency (5). Both models have a normal phenotype
on a chow diet, and both develop the same degree of adiposity as littermate controls with high-
fat feeding. Diet-induced obesity in mice with deficiency of CEPT1 or FAS in muscle resulted in
increased insulin sensitivity. The latter is likely caused by altered calcium flux. Increased
cystosolic calcium signaling, seen with both CEPT1 and FAS deficiency, is a known muscle
insulin sensitizer (9,38-41). One interpretation of the similarities between the FAS deficient and
CEPT1 deficient phenotypes in muscle is that FAS and CEPT1 coordinately channel lipids to
compartments responsible for maintaining contractile function in the setting of high-fat feeding.
High-fat diets compromise exercise performance (42-44), suggesting that FAS-CEPT1 lipid
channeling may compensate for detrimental dietary effects on muscle function. Lipid
compartmentalization in muscle is known to occur with acyl-CoA molecules (45).
Muscle FAS deficiency and CEPT1 deficiency are independently characterized by
selective decreases in SR PE content only in the setting of high-fat feeding, consistent with the
notion that FAS and CEPT1 coordinately channel lipids since either deficiency impacts the same
class of lipids at the same site. Since PE increases the affinity of calcium for SERCA in lipid
Page 17 of 37 Diabetes
18
bilayers (8), decreasing its content in the setting of CEPT1 or FAS deficiency provides a
molecular explanation underlying impaired SERCA activity with an altered PC:PE ratio.
Increasing SERCA1 expression restores SERCA enzyme activity and eliminates AMP activation
caused by FAS deficiency (5), suggesting that SERCA activity is more important than the PC:PE
ratio for insulin action. Neither FAS nor CEPT1 deficiency appears to impact mitochondrial
function, which might be predicted based on previous data suggesting that mitochondrial PE is
generated on the mitochondrial inner membrane through the action of phosphatidylserine
carboxylase (46,47).
While this work was in preparation, ECT-deficient mice were described (28). Like FAS
and CEPT1 deficiency with low fat feeding, these animals have no insulin sensitivity phenotype
on a chow diet. Unlike the FAS and CEPT1 models, these mice have a mitochondrial phenotype,
perhaps due to forced reliance on the activity of phosphatidylserine carboxylase to generate the
PE detected in these animals. Other features complicate comparisons between the different
models. The ECT-deficient mouse was generated using the MCK (muscle creatine kinase) Cre,
expressed in adult heart (48), suggesting that altered myocardial function could impact skeletal
muscle metabolism through altered perfusion. FAS and CEPT1 deficient mice were generated
using HSA Cre, which is not expressed in adult heart (5). Lipid channeling involving FAS and
CEPT1 is likely because FAS is substantially associated with SR in muscle (5) and CEPT1 is
predominantly an SR/ER enzyme. ECT, unlike the choline-specific enzyme directly upstream of
CEPT1 in the Kennedy pathway, appears to be predominantly cytosolic (49), suggesting that
only a subfraction of this enzyme at the SR would be required for directed lipid synthesis.
In summary, the loss of muscle CEPT1 in mice increases insulin sensitivity but impairs
muscle strength in the setting of a high-fat diet. In obese humans, weight loss decreases CEPT1
Page 18 of 37Diabetes
19
protein and these changes are correlated with insulin sensitivity but not fat mass. In a separate
group of humans, skeletal muscle CEPT1 mRNA was inversely associated with insulin
sensitivity. The phenotypes of skeletal muscle-specific CEPT1 deficiency and skeletal muscle-
specific FAS deficiency appear to be the same, suggesting that these lipogenic proteins
participate in the channeling of lipids to PE pools at the SR. The coordinate induction of FAS
and CEPT1 in muscle in the setting of insulin resistance may be required to maintain muscle
functional integrity. Identifying specific PE species linked to muscle function in humans could
lead to novel therapies for sustaining muscle contraction in the obese, a strategy that could
promote health.
FUNDING
This work was funded by NIH grants DK101392, DK076729, DK020579, DK056341,
DK094874, DK095505, and DK095774 (the last two to K.F).
DUALITY OF INTEREST
No potential conflicts of interest relevant to this article were reported by each author.
AUTHOR CONTRIBUTIONS
K.F. designed experiments, contributed to all data unless otherwise noted, and wrote the
manuscript. I.J.L. conceived the experiment and generated floxed CEPT1 mice. L.D.S. assayed
DAG and ATP in muscle, processed samples for electron microscopy, and performed
hyperinsulinemic-euglycemic clamp studies. L.Y. performed hyperinsulinemic-euglycemic
clamp studies. H.S. conducted phospholipidomic analyses. S.K. contributed to study design,
generated data involving humans, and revised the manuscript. C.F.S. designed experiments and
wrote the manuscript. K.F. is the guarantor of this work and, as such, had full access to all the
Page 19 of 37 Diabetes
20
data in the study and takes responsibility for the integrity of the data and the accuracy of the data
analysis.
PRIOR PRESENTATION
Parts of this study were presented as a poster at the American Diabetes Association Annual
Scientific Sessions, San Francisco, CA, June 13-17, 2014.
REFERENCES
1. Booth FW, Gordon SE, Carlson CJ, Hamilton MT: Waging war on modern chronic diseases:
primary prevention through exercise biology. J Appl Physiol 2000;88:774-787
2. Hawley JA, Hargreaves M, Joyner MJ, Zierath JR: Integrative biology of exercise. Cell
2014;159:738-749
3. Schenk S, Saberi M, Olefsky JM: Insulin sensitivity: modulation by nutrients and
inflammation. J Clin Invest 2008;118:2992-3002
4. DeFronzo RA, Gunnarsson R, Bjorkman O, Olsson M, Wahren J: Effects of insulin on
peripheral and splanchnic glucose metabolism in noninsulin-dependent (type II) diabetes mellitus.
J Clin Invest 1985;76:149-155
5. Funai K, Song H, Yin L, Lodhi IJ, Wei X, Yoshino J, Coleman T, Semenkovich CF: Muscle
lipogenesis balances insulin sensitivity and strength through calcium signaling. J Clin Invest
2013;123:1229-1240
6. Kersten S: Mechanisms of nutritional and hormonal regulation of lipogenesis. EMBO Rep
2001;2:282-286
7. Fu S, Yang L, Li P, Hofmann O, Dicker L, Hide W, Lin X, Watkins SM, Ivanov AR,
Hotamisligil GS: Aberrant lipid metabolism disrupts calcium homeostasis causing liver
endoplasmic reticulum stress in obesity. Nature 2011;473:528-531
8. Gustavsson M, Traaseth NJ, Veglia G: Activating and deactivating roles of lipid bilayers on
the Ca(2+)-ATPase/phospholamban complex. Biochemistry 2011;50:10367-10374
9. Wright DC, Hucker KA, Holloszy JO, Han DH: Ca2+ and AMPK both mediate stimulation of
glucose transport by muscle contractions. Diabetes 2004;53:330-335
10. Goonasekera SA, Lam CK, Millay DP, Sargent MA, Hajjar RJ, Kranias EG, Molkentin JD:
Mitigation of muscular dystrophy in mice by SERCA overexpression in skeletal muscle. J Clin
Invest 2011;121:1044-1052
11. Gehrig SM, van der Poel C, Sayer TA, Schertzer JD, Henstridge DC, Church JE, Lamon S,
Russell AP, Davies KE, Febbraio MA, Lynch GS: Hsp72 preserves muscle function and slows
progression of severe muscular dystrophy. Nature 2012;484:394-398
12. Henneberry AL, Wright MM, McMaster CR: The major sites of cellular phospholipid
synthesis and molecular determinants of fatty acid and lipid head group specificity. Mol Biol
Cell 2002;13:3148-3161
13. Miniou P, Tiziano D, Frugier T, Roblot N, Le Meur M, Melki J: Gene targeting restricted to
mouse striated muscle lineage. Nucleic Acids Res 1999;27:e27
14. Gan Z, Burkart-Hartman EM, Han DH, Finck B, Leone TC, Smith EY, Ayala JE, Holloszy J,
Kelly DP: The nuclear receptor PPARb/d programs muscle glucose metabolism in cooperation
with AMPK and MEF2. Genes Dev 2011;25:2619-2630
Page 20 of 37Diabetes
21
15. Funai K, Cartee GD: Inhibition of contraction-stimulated AMP-activated protein kinase
inhibits contraction-stimulated increases in PAS-TBC1D1 and glucose transport without altering
PAS-AS160 in rat skeletal muscle. Diabetes 2009;58:1096-1104
16. Moore L, Chen T, Knapp HR, Jr., Landon EJ: Energy-dependent calcium sequestration
activity in rat liver microsomes. J Biol Chem 1975;250:4562-4568
17. Lodhi IJ, Yin L, Jensen-Urstad AP, Funai K, Coleman T, Baird JH, El Ramahi MK, Razani
B, Song H, Fu-Hsu F, Turk J, Semenkovich CF: Inhibiting adipose tissue lipogenesis reprograms
thermogenesis and PPARgamma activation to decrease diet-induced obesity. Cell Metab
2012;16:189-201
18. Amati F, Dube JJ, Alvarez-Carnero E, Edreira MM, Chomentowski P, Coen PM, Switzer GE,
Bickel PE, Stefanovic-Racic M, Toledo FG, Goodpaster BH: Skeletal muscle triglycerides,
diacylglycerols, and ceramides in insulin resistance: another paradox in endurance-trained
athletes? Diabetes 2011;60:2588-2597
19. Magkos F, Bradley D, Schweitzer GG, Finck BN, Eagon JC, Ilkayeva O, Newgard CB, Klein
S: Effect of Roux-en-Y gastric bypass and laparoscopic adjustable gastric banding on branched-
chain amino acid metabolism. Diabetes 2013;62:2757-2761
20. Fabbrini E, Magkos F, Mohammed BS, Pietka T, Abumrad NA, Patterson BW, Okunade A,
Klein S: Intrahepatic fat, not visceral fat, is linked with metabolic complications of obesity. Proc
Natl Acad Sci USA 2009;106:15430-15435
21. Korenblat KM, Fabbrini E, Mohammed BS, Klein S: Liver, muscle, and adipose tissue
insulin action is directly related to intrahepatic triglyceride content in obese subjects.
Gastroenterology 2008;134:1369-1375
22. English AR, Voeltz GK: Rab10 GTPase regulates ER dynamics and morphology. Nat Cell
Biol 2013;15:169-178
23. Kraegen EW, James DE, Storlien LH, Burleigh KM, Chisholm DJ: In vivo insulin resistance
in individual peripheral tissues of the high fat fed rat: assessment by euglycaemic clamp plus
deoxyglucose administration. Diabetologia 1986;29:192-198
24. Albers PH, Pedersen AJ, Birk JB, Kristensen DE, Vind BF, Baba O, Nohr J, Hojlund K,
Wojtaszewski JF: Human muscle fiber type-specific insulin signaling: impact of obesity and type
2 diabetes. Diabetes 2015;64:485-497
25. Turner N, Lee JS, Bruce CR, Mitchell TW, Else PL, Hulbert AJ, Hawley JA: Greater effect
of diet than exercise training on the fatty acid profile of rat skeletal muscle. J Appl Physiol
2004;96:974-980
26. Berchtold MW, Brinkmeier H, Muntener M: Calcium ion in skeletal muscle: its crucial role
for muscle function, plasticity, and disease. Physiol Rev 2000;80:1215-1265
27. Bal NC, Maurya SK, Sopariwala DH, Sahoo SK, Gupta SC, Shaikh SA, Pant M, Rowland
LA, Bombardier E, Goonasekera SA, Tupling AR, Molkentin JD, Periasamy M: Sarcolipin is a
newly identified regulator of muscle-based thermogenesis in mammals. Nat Med 2012;18:1575-
1579
28. Selathurai A, Kowalski GM, Burch ML, Sepulveda P, Risis S, Lee-Young RS, Lamon S,
Meikle PJ, Genders AJ, McGee SL, Watt MJ, Russell AP, Frank M, Jackowski S, Febbraio MA,
Bruce CR: The CDP-ethanolamine pathway regulates skeletal muscle diacylglycerol content and
mitochondrial biogenesis without altering insulin sensitivity. Cell Metab 2015;21:718-730
29. Funai K, Semenkovich CF: Skeletal muscle lipid flux: running water carries no poison. Am J
Physiol Endocrinol Metab 2011;E245-251
Page 21 of 37 Diabetes
22
30. Pan DA, Lillioja S, Kriketos AD, Milner MR, Baur LA, Bogardus C, Jenkins AB, Storlien
LH: Skeletal muscle triglyceride levels are inversely related to insulin action. Diabetes
1997;46:983-988
31. Goodpaster BH, He J, Watkins S, Kelley DE: Skeletal muscle lipid content and insulin
resistance: evidence for a paradox in endurance-trained athletes. J Clin Endocrinol Metab
2001;86:5755-5761
32. Samuel VT, Shulman GI: Mechanisms for insulin resistance: common threads and missing
links. Cell 2012;148:852-871
33. Li LO, Klett EL, Coleman RA: Acyl-CoA synthesis, lipid metabolism and lipotoxicity.
Biochim Biophys Acta 2010;1801:246-251
34. Muoio DM, Neufer PD: Lipid-induced mitochondrial stress and insulin action in muscle. Cell
Metab 2012;15:595-605
35. Schooneman MG, Vaz FM, Houten SM, Soeters MR: Acylcarnitines: reflecting or inflicting
insulin resistance? Diabetes 2013;62:1-8
36. Chavez JA, Summers SA: A ceramide-centric view of insulin resistance. Cell Metab
2012;15:585-594
37. Fu SN, Watkins SM, Hotamisligil GS: The role of endoplasmic reticulum in hepatic lipid
homeostasis and stress signaling. Cell Metabolism 2012;15:623-634
38. Witczak CA, Fujii N, Hirshman MF, Goodyear LJ: Ca2+/calmodulin-dependent protein
kinase kinase-alpha regulates skeletal muscle glucose uptake independent of AMP-activated
protein kinase and Akt activation. Diabetes 2007;56:1403-1409
39. Xie X, Gong Z, Mansuy-Aubert V, Zhou QL, Tatulian SA, Sehrt D, Gnad F, Brill LM,
Motamedchaboki K, Chen Y, Czech MP, Mann M, Kruger M, Jiang ZY: C2 domain-containing
phosphoprotein CDP138 regulates GLUT4 insertion into the plasma membrane. Cell Metab
2011;14:378-389
40. Kramer HF, Taylor EB, Witczak CA, Fujii N, Hirshman MF, Goodyear LJ: Calmodulin-
binding domain of AS160 regulates contraction- but not insulin-stimulated glucose uptake in
skeletal muscle. Diabetes 2007;56:2854-2862
41. Park DR, Park KH, Kim BJ, Yoon CS, Kim UH: Exercise ameliorates insulin resistance via
Ca2+ signals distinct from those of insulin for GLUT4 translocation in skeletal muscles.
Diabetes 2015;64:1224-1234
42. Starling RD, Trappe TA, Parcell AC, Kerr CG, Fink WJ, Costill DL: Effects of diet on
muscle triglyceride and endurance performance. J Appl Physiol 1997;82:1185-1189
43. Fleming J, Sharman MJ, Avery NG, Love DM, Gomez AL, Scheett TP, Kraemer WJ, Volek
JS: Endurance capacity and high-intensity exercise performance responses to a high fat diet. Int J
Sport Nutr Exerc Metab 2003;13:466-478
44. Erlenbusch M, Haub M, Munoz K, MacConnie S, Stillwell B: Effect of high-fat or high-
carbohydrate diets on endurance exercise: a meta-analysis. Int J Sport Nutr Exerc Metab
2005;15:1-14
45. Li LO, Grevengoed TJ, Paul DS, Ilkayeva O, Koves TR, Pascual F, Newgard CB, Muoio
DM, Coleman RA: Compartmentalized acyl-CoA metabolism in skeletal muscle regulates
systemic glucose homeostasis. Diabetes 2015;64:23-35
46. Zborowski J, Dygas A, Wojtczak L: Phosphatidylserine decarboxylase is located on the
external side of the inner mitochondrial membrane. FEBS letters 1983;157:179-182
Page 22 of 37Diabetes
23
47. van der Veen JN, Lingrell S, da Silva RP, Jacobs RL, Vance DE: The concentration of
phosphatidylethanolamine in mitochondria can modulate ATP production and glucose
metabolism in mice. Diabetes 2014;63:2620-2630
48. Laustsen PG, Russell SJ, Cui L, Entingh-Pearsall A, Holzenberger M, Liao R, Kahn CR:
Essential role of insulin and insulin-like growth factor 1 receptor signaling in cardiac
development and function. Mol Cell Biol 2007;27:1649-1664
49. Vermeulen PS, Tijburg LB, Geelen MJ, van Golde LM: Immunological characterization,
lipid dependence, and subcellular localization of CTP:phosphoethanolamine cytidylyltransferase
purified from rat liver. Comparison with CTP:phosphocholine cytidylyltransferase. J Biol Chem
1993;268:7458-7464
Page 23 of 37 Diabetes
24
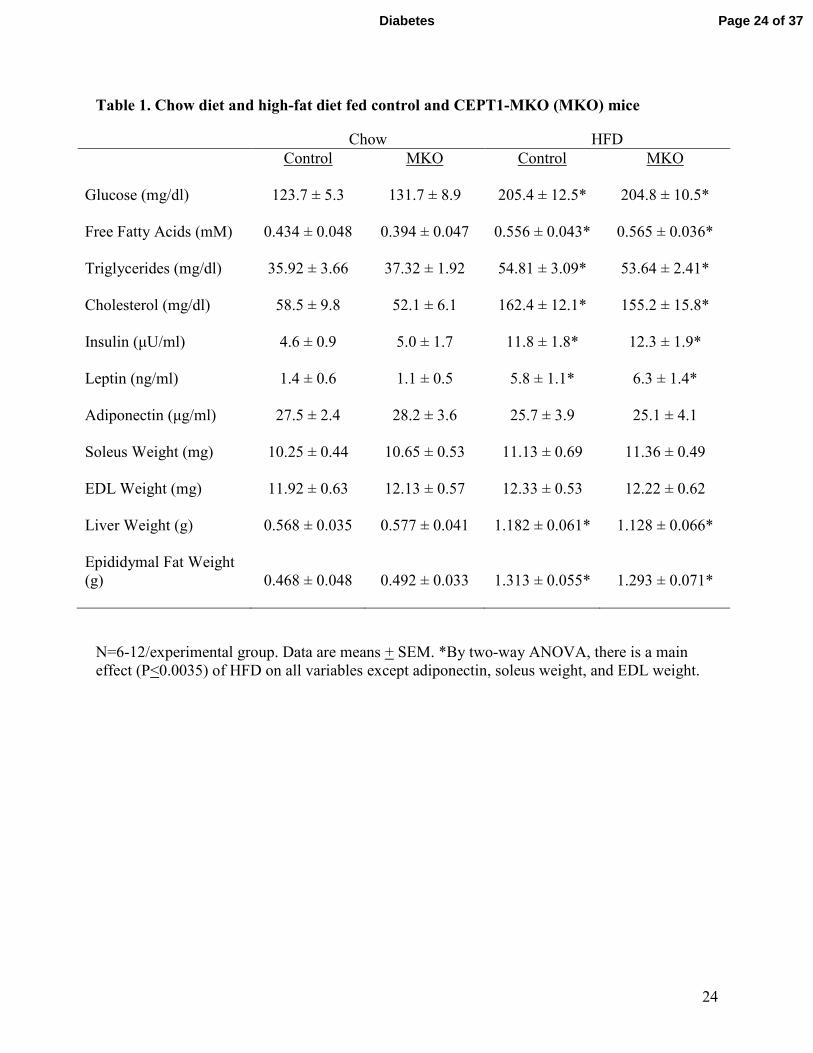
Table 1. Chow diet and high-fat diet fed control and CEPT1-MKO (MKO) mice
Chow HFD
Control MKO Control MKO
Glucose (mg/dl) 123.7 ± 5.3 131.7 ± 8.9 205.4 ± 12.5* 204.8 ± 10.5*
Free Fatty Acids (mM) 0.434 ± 0.048 0.394 ± 0.047 0.556 ± 0.043* 0.565 ± 0.036*
Triglycerides (mg/dl) 35.92 ± 3.66 37.32 ± 1.92 54.81 ± 3.09* 53.64 ± 2.41*
Cholesterol (mg/dl) 58.5 ± 9.8 52.1 ± 6.1 162.4 ± 12.1* 155.2 ± 15.8*
Insulin (µU/ml) 4.6 ± 0.9 5.0 ± 1.7 11.8 ± 1.8* 12.3 ± 1.9*
Leptin (ng/ml) 1.4 ± 0.6 1.1 ± 0.5 5.8 ± 1.1* 6.3 ± 1.4*
Adiponectin (µg/ml) 27.5 ± 2.4 28.2 ± 3.6 25.7 ± 3.9 25.1 ± 4.1
Soleus Weight (mg) 10.25 ± 0.44 10.65 ± 0.53 11.13 ± 0.69 11.36 ± 0.49
EDL Weight (mg) 11.92 ± 0.63 12.13 ± 0.57 12.33 ± 0.53 12.22 ± 0.62
Liver Weight (g) 0.568 ± 0.035 0.577 ± 0.041 1.182 ± 0.061* 1.128 ± 0.066*
Epididymal Fat Weight
(g) 0.468 ± 0.048 0.492 ± 0.033 1.313 ± 0.055* 1.293 ± 0.071*
N=6-12/experimental group. Data are means + SEM. *By two-way ANOVA, there is a main
effect (P<0.0035) of HFD on all variables except adiponectin, soleus weight, and EDL weight.
Page 24 of 37Diabetes
25
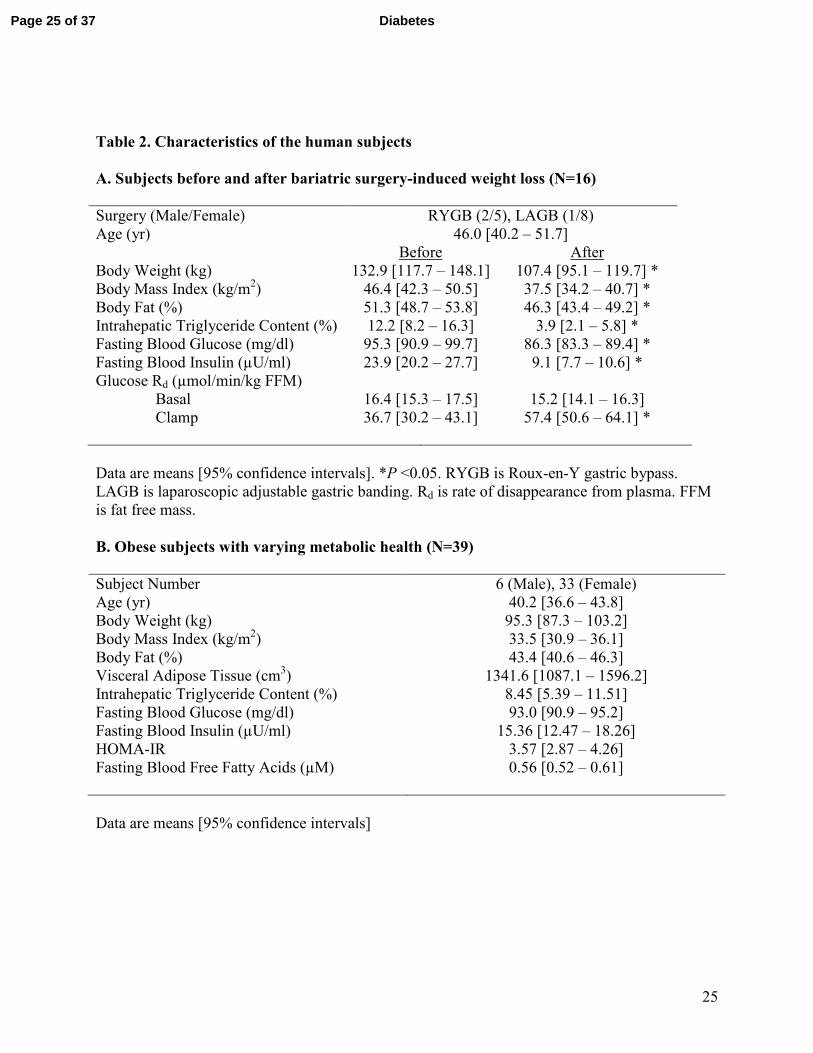
Table 2. Characteristics of the human subjects
A. Subjects before and after bariatric surgery-induced weight loss (N=16)
Surgery (Male/Female) RYGB (2/5), LAGB (1/8)
Age (yr) 46.0 [40.2 – 51.7]
Before After
Body Weight (kg) 132.9 [117.7 – 148.1] 107.4 [95.1 – 119.7] *
Body Mass Index (kg/m2) 46.4 [42.3 – 50.5] 37.5 [34.2 – 40.7] *
Body Fat (%) 51.3 [48.7 – 53.8] 46.3 [43.4 – 49.2] *
Intrahepatic Triglyceride Content (%) 12.2 [8.2 – 16.3] 3.9 [2.1 – 5.8] *
Fasting Blood Glucose (mg/dl) 95.3 [90.9 – 99.7] 86.3 [83.3 – 89.4] *
Fasting Blood Insulin (µU/ml) 23.9 [20.2 – 27.7] 9.1 [7.7 – 10.6] *
Glucose Rd (µmol/min/kg FFM)
Basal 16.4 [15.3 – 17.5] 15.2 [14.1 – 16.3]
Clamp 36.7 [30.2 – 43.1] 57.4 [50.6 – 64.1] *
Data are means [95% confidence intervals]. *P <0.05. RYGB is Roux-en-Y gastric bypass.
LAGB is laparoscopic adjustable gastric banding. Rd is rate of disappearance from plasma. FFM
is fat free mass.
B. Obese subjects with varying metabolic health (N=39)
Subject Number 6 (Male), 33 (Female)
Age (yr) 40.2 [36.6 – 43.8]
Body Weight (kg) 95.3 [87.3 – 103.2]
Body Mass Index (kg/m2) 33.5 [30.9 – 36.1]
Body Fat (%) 43.4 [40.6 – 46.3]
Visceral Adipose Tissue (cm3) 1341.6 [1087.1 – 1596.2]
Intrahepatic Triglyceride Content (%) 8.45 [5.39 – 11.51]
Fasting Blood Glucose (mg/dl) 93.0 [90.9 – 95.2]
Fasting Blood Insulin (µU/ml) 15.36 [12.47 – 18.26]
HOMA-IR 3.57 [2.87 – 4.26]
Fasting Blood Free Fatty Acids (µM)
0.56 [0.52 – 0.61]
Data are means [95% confidence intervals]
Page 25 of 37 Diabetes
26
FIGURE LEGENDS
Figure 1. CEPT1 knockdown increases sarcoplasmic reticulum (SR)
phosphatidylcholine:phosphatidylethanolamine ratio, calcium signaling, and insulin action in
C2C12 cells. (A) CEPT1 gene expression in C2C12 cells treated with scrambled (SC, the
control) or CEPT1 knockdown (CEPT1KD) shRNA. (B-F) SR phospholipid composition for SC
and CEPT1KD C2C12 cells. (B) Total SR phosphatidylethanolamine (PE). (C) SR PE species.
(D) Total SR phosphatidycholine (PC). (E) SR PC species. (F) SR PC:PE ratio. (G) SERCA-
dependent calcium uptake in SC and CEPT1KD C2C12 cells. (H-K) Western blots and
quantification of proteins for SC and CEPT1KD C2C12 cells. SERCA: sarco/endoplasmic
reticulum Ca2+
ATPase. n=4-6/experimental condition. Data are means ± SEM. * P<0.05.
�P<0.05 vs. SC.
Figure 2. High-fat diet increases mouse muscle CEPT1 but does not alter sarcoplasmic reticulum
(SR) phosphatidylcholine (PC):phosphatidylethanolamine(PE) ratio or SERCA activity, and the
generation of CEPT1-MKO mice. (A) CEPT1 protein content in multiple tissues. (B) CEPT1
protein content in multiple muscles. (C-K) CEPT1 expression, muscle SR phospholipids and
SERCA activity in chow-fed and HFD-fed C57BL/6 mice, n=5-8/experimental group. (C)
CEPT1 protein abundance in soleus. (D) CEPT1 mRNA abundance in soleus. (E) ChPT1 mRNA
abundance in soleus. (F-J) Phospholipid analyses in gastrocnemius muscles. (F) Total SR
phosphatidylethanolamine (PE). (G) SR PE species. (H) Total SR phosphatidylcholine (PC). (I)
SR PC species. (J) SR PC:PE ratio. (K) SERCA-dependent calcium uptake. (L) Strategy yielding
CEPT1-MKO mice. (M) Genotyping PCR for wild type (WT), heterozygous knockout in muscle
Page 26 of 37Diabetes
27
(Het-MKO), and homozygous muscle knockout (MKO) mice. (N) CEPT1 mRNA expression in
soleus and EDL muscles, n=6/experimental group. (O) Western blot of CEPT1 in Ctrl (CEPT1
lox/lox without Cre) and MKO soleus muscles. (P) CEPT1 protein abundance in soleus and EDL
muscles, n=6/experimental group. Panc: pancreas. Kid: kidney. Sol: soleus. BAT: brown adipose
tissue. WAT: white adipose tissue. GW: white gastrocnemius. GR: red gastrocnemius. TA: tibialis
anterior. EDL: extensor digitorum longus. Epi: epitrochlearis. Vast: vastus lateralis. Diaph:
diaphragm. HFD: high-fat diet. Data are means ± SEM. *P<0.05.
Figure 3. HFD-fed CEPT1-MKO mice are protected from diet-induced skeletal muscle insulin
resistance. (A) Body weight, n=7/experimental group. (B) Body composition by MRI,
n=9/experimental group. (C) Oxygen consumption, n=5/experimental group. (D) Respiratory
quotient, n=5-6/experimental group. (E) Glucose tolerance testing. Area under the curve (AUC)
quantification is provided as an insert, n=10/experimental group. (F) Insulin tolerance testing.
AUC quantification is provided as an insert, n=6-7/experimental group. (G-J) Hyperinsulinemic-
euglycemic clamp studies, n=4/experimental group. (G) Glucose infusion rate (GIR). (H)
Glucose disposal rate (GDR). (I) Insulin-stimulated glucose disposal rate (IS-GDR). (J) Hepatic
glucose production (HGP) suppression. (K-N) Studies of isolated soleus muscles,
n=6/experimental group. (K) 2-deoxyglucose uptake in basal and insulin-stimulated soleus. (L)
∆-2-deoxyglucose uptake was calculated by subtracting values of 2-deoxyglucose uptake in basal
muscles from values of 2-deoxyglucose uptake in insulin-stimulated muscles. (M-N) Western
blot quantification of incubated soleus muscles under basal or insulin-stimulated conditions. Data
are means ± SEM. * P<0.05. �P<0.05 vs. Ctrl.
Page 27 of 37 Diabetes
28
Figure 4. HFD-fed CEPT1-MKO mice have increased sarcoplasmic reticulum (SR)
phosphatidylcholine (PC):phosphatidylethanolamine(PE) ratio, decreased SERCA activity, and
decreased muscle contractile function. (A-E) SR phospholipid composition from gastrocnemius
muscles, n=4/experimental group. (A) Total SR PE. (B) Individual SR PE species. (C) Total SR
PC. (D) Individual SR PC species. (E) SR PC:PE ratio. (F) SERCA-dependent calcium uptake in
gastrocnemius muscles, n=8/experimental group. (G-H) High-intensity graded exercise treadmill
testing, n=6/experimental group. (G) Total running time. (H) Total running distance. (I-J)
Forelimb grip strength test, n=5-7/experimental group. (I) Absolute forelimb strength. (J)
Relative forelimb strength. (K) Cold tolerance test, n=5/experimental group. Data are means ±
SEM. * P<0.05.
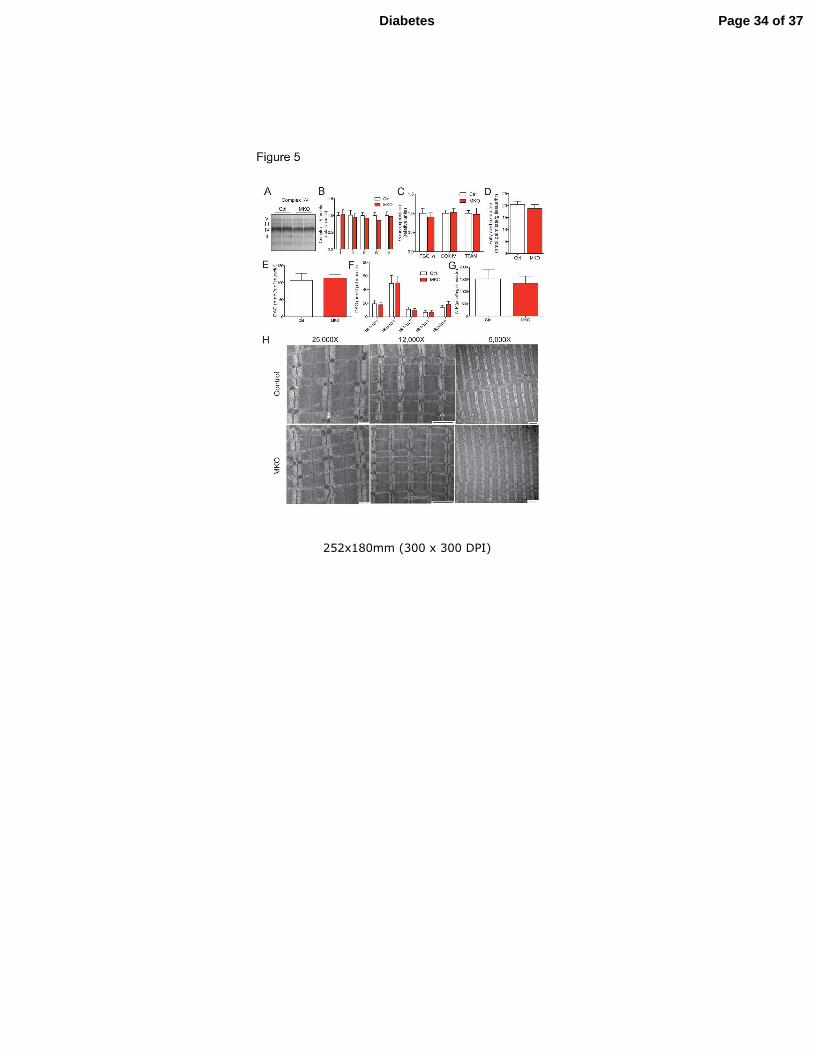
Figure 5. Muscle CEPT1 deficiency in mice does not affect mitochondrial phenotypes or
diacylglycerol (DAG) content. (A-D) Measurements in muscles from HFD-fed mice,
n=6/experimental group. (A-B) Western blot quantification of mitochondrial complex I-V in
gastrocnemius muscles. (C) Expression of genes involved in mitochondrial biogenesis in
gastrocnemius muscles. (D) Rates of fatty acid oxidation in gastrocnemius muscles. (E-F) DAG
content in soleus muscle of chow fed mice, n=7/experimental group. (E) Total DAG content. (F)
DAG species. (G) ATP content in EDL muscles of chow fed mice, n=4/experimental group. (H)
Representative EM images at varying magnification from EDL muscles of chow fed mice. Three
animals for each genotype were examined for these studies. Bars in micrographs indicate 500 nm
for 25,000X, and 2 µm for 12,000X and 5,000X. Data are means ± SEM. None of the
comparisons were statistically significant.
Page 28 of 37Diabetes
29
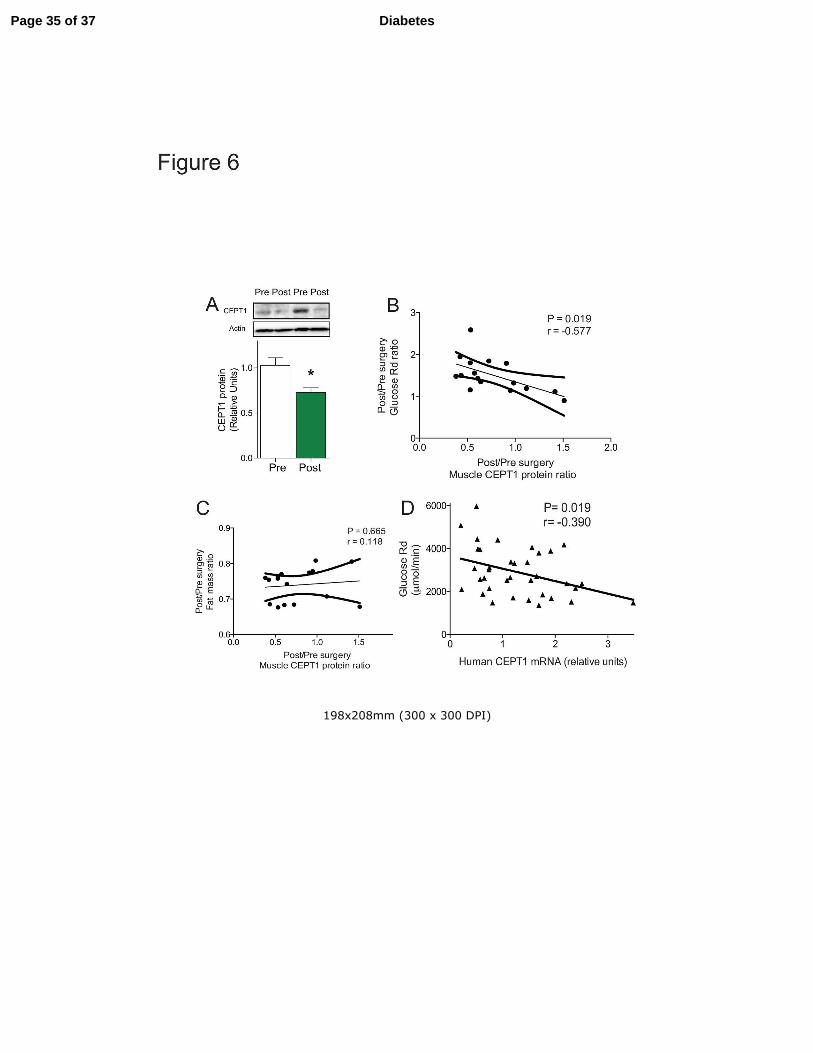
Figure 6. Human muscle CEPT1 is associated with obesity-induced insulin resistance. (A-C)
Human muscle CEPT1 protein abundance in 16 subjects (see Table 2A for characteristics) pre-
and post-gastric bypass surgery. (A) Western blot quantification of muscle CEPT1 protein. Data
are means ± SEM. * P<0.05. (B) Pearson correlation analysis between changes in muscle CEPT1
protein abundance and changes in glucose disposal rate. (C) Pearson correlation analysis
between changes in muscle CEPT1 protein abundance and changes in fat mass. (D) Pearson
correlation analysis of human muscle CEPT1 mRNA expression and glucose disposal rate
determined by clamp for 39 obese subjects of varying metabolic health (see Table 2B for
characteristics).
Page 29 of 37 Diabetes
229x240mm (300 x 300 DPI)
Page 30 of 37Diabetes
259x224mm (300 x 300 DPI)
Page 31 of 37 Diabetes
256x309mm (300 x 300 DPI)
Page 32 of 37Diabetes
205x199mm (300 x 300 DPI)
Page 33 of 37 Diabetes
252x180mm (300 x 300 DPI)
Page 34 of 37Diabetes
198x208mm (300 x 300 DPI)
Page 35 of 37 Diabetes
ONLINE APPENDIX
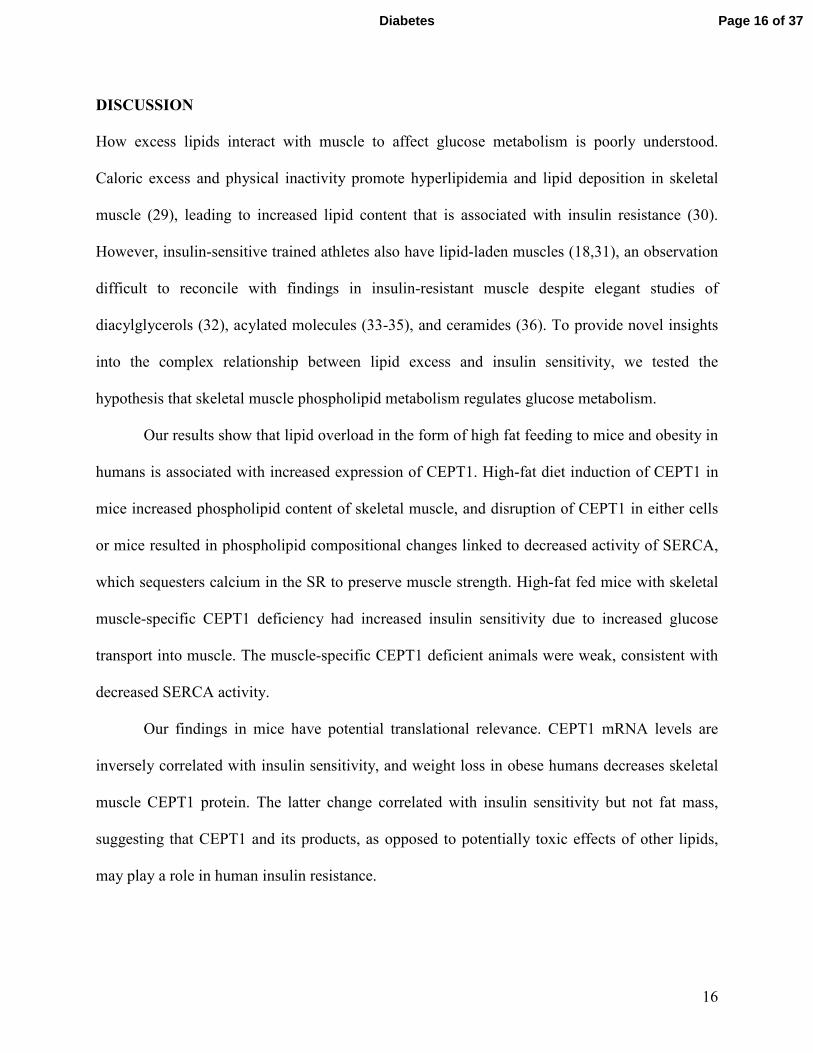
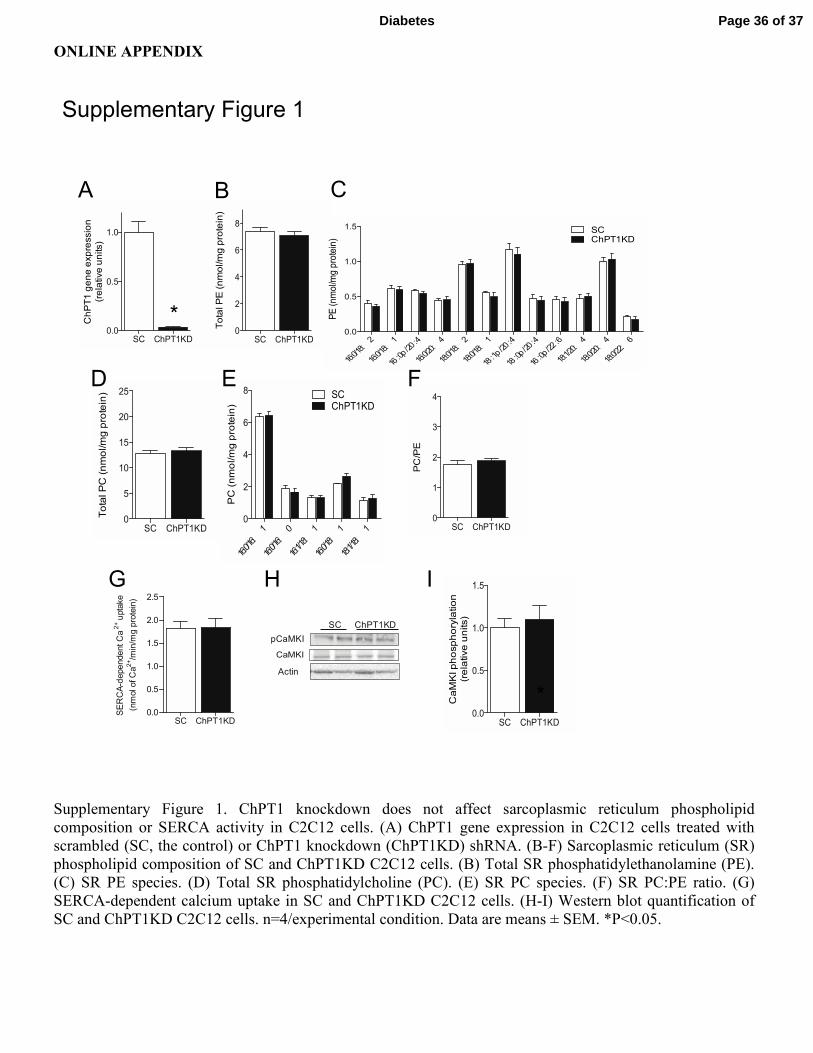
Supplementary Figure 1. ChPT1 knockdown does not affect sarcoplasmic reticulum phospholipid
composition or SERCA activity in C2C12 cells. (A) ChPT1 gene expression in C2C12 cells treated with
scrambled (SC, the control) or ChPT1 knockdown (ChPT1KD) shRNA. (B-F) Sarcoplasmic reticulum (SR)
phospholipid composition of SC and ChPT1KD C2C12 cells. (B) Total SR phosphatidylethanolamine (PE).
(C) SR PE species. (D) Total SR phosphatidylcholine (PC). (E) SR PC species. (F) SR PC:PE ratio. (G)
SERCA-dependent calcium uptake in SC and ChPT1KD C2C12 cells. (H-I) Western blot quantification of
SC and ChPT1KD C2C12 cells. n=4/experimental condition. Data are means ± SEM. *P<0.05.
Supplementary Figure 1
pCaMKI
SC ChPT1KD
Actin
SC ChPT1KD0.0
0.5
1.0
1.5
2.0
2.5
SERCA-dependent Ca2+ uptake
(nmol of Ca2+/min/mg protein)
CaMKI
G
B C
IH
SC ChPT1KD0.0
0.5
1.0
*ChPT1 gene expression
(relative units)
SC ChPT1KD0
2
4
6
8Total PE (nmol/mg protein)
16:0/18:2
16:0/18:1
16:0p/20:4
16:0/20:4
18:0/18:2
18:0/18:1
18:1p/20:4
18:0p/20:4
16:0p/22:6
18:1/20:4
18:0/20:4
18:0/22:6
0.0
0.5
1.0
1.5 SCChPT1KD
PE (nmol/mg protein)
A
SC ChPT1KD0
5
10
15
20
25
Total PC (nmol/mg protein)
16:0/16:1
16:0/16:0
16:1/18:1
16:0/18:1
18:1/18:1
0
2
4
6
8 SCChPT1KD
PC (nmol/mg protein)
SC ChPT1KD0
1
2
3
4
PC/PE
FED
SC ChPT1KD0.0
0.5
1.0
1.5
*CaMKI phosphorylation
(relative units)
Page 36 of 37Diabetes
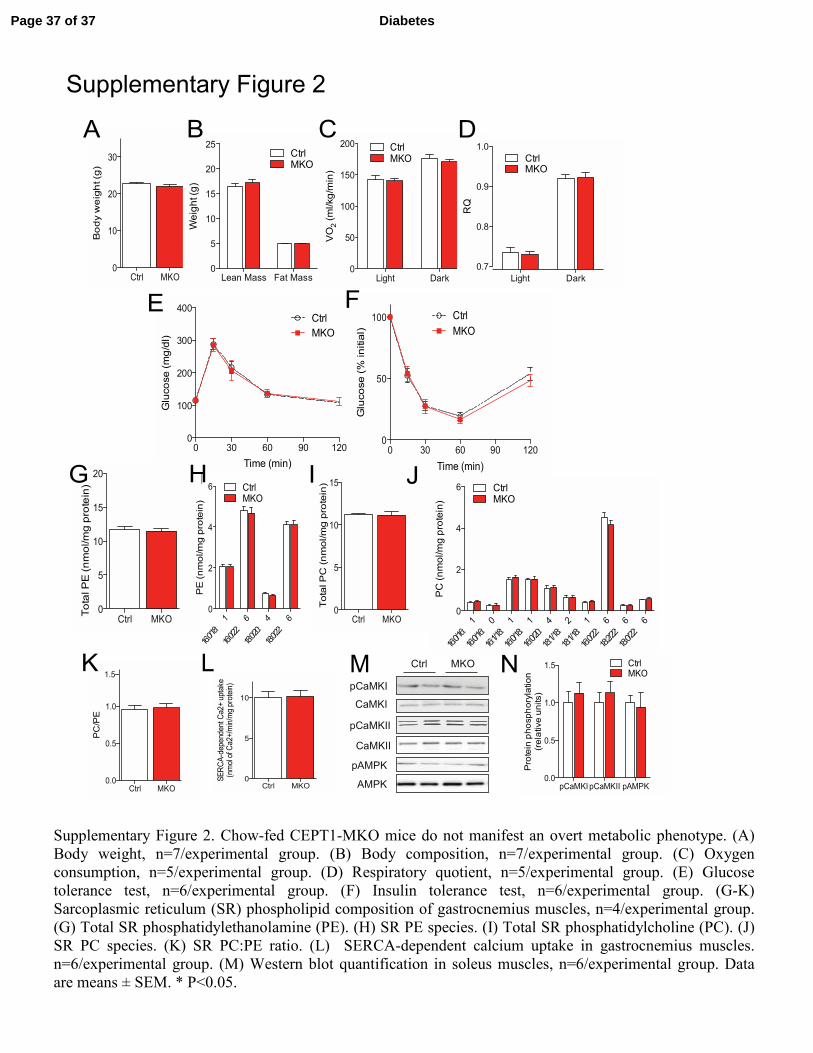
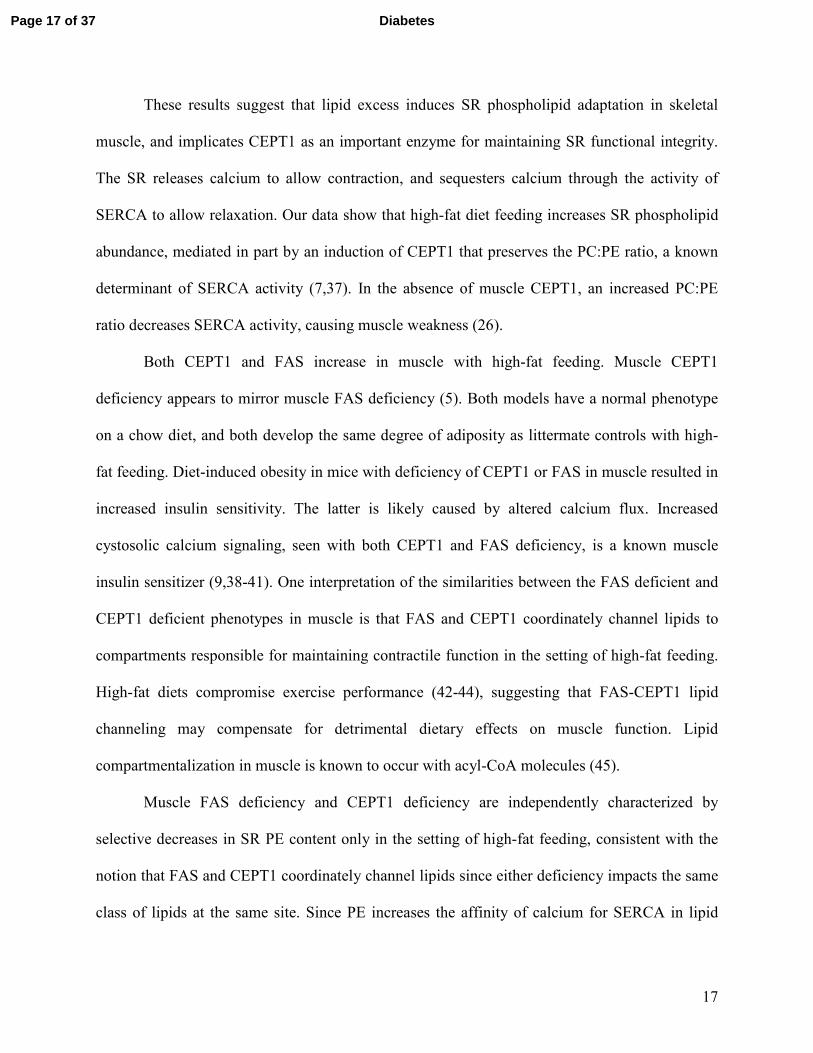
Supplementary Figure 2. Chow-fed CEPT1-MKO mice do not manifest an overt metabolic phenotype. (A)
Body weight, n=7/experimental group. (B) Body composition, n=7/experimental group. (C) Oxygen
consumption, n=5/experimental group. (D) Respiratory quotient, n=5/experimental group. (E) Glucose
tolerance test, n=6/experimental group. (F) Insulin tolerance test, n=6/experimental group. (G-K)
Sarcoplasmic reticulum (SR) phospholipid composition of gastrocnemius muscles, n=4/experimental group.
(G) Total SR phosphatidylethanolamine (PE). (H) SR PE species. (I) Total SR phosphatidylcholine (PC). (J)
SR PC species. (K) SR PC:PE ratio. (L) SERCA-dependent calcium uptake in gastrocnemius muscles.
n=6/experimental group. (M) Western blot quantification in soleus muscles, n=6/experimental group. Data
are means ± SEM. * P<0.05.
Supplementary Figure 2
H
LpCaMKI
CaMKI
pCaMKII
CaMKII
pAMPK
AMPK
Ctrl MKOM
Ctrl MKO0
10
20
30
Body weight (g)
Lean Mass Fat Mass0
5
10
15
20
25CtrlMKO
Weight (g)
Light Dark0
50
100
150
200 CtrlMKO
VO2 (ml/kg/min)
Light Dark
0.7
0.8
0.9
1.0
CtrlMKO
RQ
BA
0 30 60 90 1200
100
200
300
400Ctrl
MKO
Time (min)
Glucose (mg/dl)
0 30 60 90 1200
50
100 Ctrl
MKO
Time (min)
Glucose (% initial)
C D
E F
Ctrl MKO0
5
10
15
20
Total PE (nmol/mg protein)
16:0/18:1
16:0/22:6
18:0/20:4
18:0/22:6
0
2
4
6 CtrlMKO
PE (nmol/mg protein)
Ctrl MKO0
5
10
15
Total PC (nmol/mg protein)
Ctrl MKO0
5
10
SERCA-dependent Ca2+ uptake
(nmol of Ca2+/min/mg protein)
pCaMKIpCaMKII pAMPK0.0
0.5
1.0
1.5 CtrlMKO
Protein phosphorylation
(relative units)
G H I J
Ctrl MKO0.0
0.5
1.0
1.5
PC/PE
K N16:0/16:1
16:0/16:0
16:1/18:1
16:0/18:1
16:0/20:4
18:1/18:2
18:1/18:1
16:0/22:6
18:2/22:6
18:0/22:6
0
2
4
6 CtrlMKO
PC (nmol/mg protein)
Page 37 of 37 Diabetes