Embed Size (px)
Citation preview
J . Zool., Lond. (1990) 222, 375-389
Skeletal growth and function in the California gull (Larus californicus)
DAVID CARRIER* Department of Integrative Biology and Museum of Vertebrate Zoology, University of California,
Berkeley, CA 94720, USA
LISA R. LEON Department of Anaesthesiology, University of Michigan Medical Center, Ann Arbor, M I 48109,
USA
(Accepted 30 October 1989)
(With 6 figures in the text)
Although the bones of rapidly growing animals are composed of weak tissue, they often must function in locomotor activity. We address the conflict between development and skeletal function by analysing the ontogeny of skeletal strength in the California gull, Larus californicus. Changes in shape and mechanical properties of the femur, tibia, tarsometatarsus, humerus, ulna and carpometacarpus were analysed in a complete post-hatching growth series. During post- hatching growth, strength and stiffness of the skeletal tissue increases six- to ten-fold. At hatching, long bones of the wing are relatively weak and they remain so throughout the major portion of the growth period. However, in the hind limb, relatively thick bones in juveniles compensate for the weak tissue such that the force required to break the bones remains constant relative to body mass. This difference between hind limb and wing parallels the development of locomotor function; young gulls begin to walk within a day or two of hatching, but they do not fly until they are fully grown. Thus, in the bones ofthe hind limb, the conflict between rapid growth and skeletal function is solved by negative allometry of bone thickness.
After young gulls reach adult size, the breaking strength of the wing bones increases three- to four-fold, the mass of the pectoralis muscle triples and the surface area of the wing doubles. The one aspect ofwing development that is not delayed until shortly before fledging is linear growth of the bones. Bones of the wing increase in length at a rapid and relatively constant rate from the time of hatching to the attainment of adult size. Relatively early initiation of linear growth of the wing bones suggests that the rate at which bones grow in length may be the rate limiting factor in wing development.
Contents
Page Introduction . . . . . . . . . . . . . . . . . . . . . . . . . . . . . . . . 376 Materials and methods . . . . . . . . . . . . . . . . . . . . . . . . . . . . 376 Results . . . . . . . . . . . . . . . . . . . . . . . . . . . . . . . . . . 377
Length and diameter . . . . . . . . . . . . . . . . . . . . . . . . . . . . 377 Bending strength and modulus of elasticity . . . . . . . . . . . . . . . . . . 380 Second moment of area . . . . . . . . . . . . . . . . . . . . . . . . . . 380 Breakingload . . . . . . . . . . . . . . . . . . . . . . . . . . . . . . 380 Muscle mass . . . . . . . . . . . . . . . . . . . . . . . . . . . . . . . . 386 Foot and wing surface area . . . . . . . . . . . . . . . . . . . . . . . . . . 386
*Address for correspondence
375 0952-8369/90/011375 + I5 $03.00 0 1990 The Zoological Society of London
3 76 D. CARRIER AND L. R . LEON
Discussion . . . . . . . . . . . . . . . . . . . . . . . . . . . . . . . . . . 386 Bone growth and locomotor function . . . . . . . . . . . . . . . . . . . . 386 Altricial wing growth . . . . . . . . . . . . . . . . . . . . . . . . . . . . 387
Summary . . . . . . . . . . . . . . . . . . . . . . . . . . . . . . . . . . 388 References . . . . . . . . . . . . . . . . . . . . . . . . . . . . . . . . . . 389
Introduction
For most vertebrates, locomotor activity begins at the time of hatching or of birth. To varying degrees, young vertebrates depend on their locomotor abilities to seek shelter from environmental stress, to capture prey and to avoid predators. They do this at a time when their locomotor system is handicapped by small size and by functional limitations inherent to the processes of growth and development. Rapid growth appears to place specific constraints o n the skeletal system. The tissue of rapidly growing bones is characterized by a woven cancellous matrix with few osteons (Torzilli et al., 1982), low density (Trotter & Peterson, 1970) and low mineral content (Bonfield & Clark, 1973; Currey & Butler, 1975). These characteristics result in skeletal tissue that is highly deformable and has a low resistance to stress (Bonfield & Clark, 1973; Currey & Butler, 1975; Torzilli et al., 1982). However, bones must be stiff to provide support and transmit the forces produced by muscles. Thus, skeletal tissue of low strength and stiffness could be expected to have a detrimental effect on the locomotor capabilities of young animals.
Observations on lagomorphs suggest that changes of shape of growing bones may compensate for weak tissue (Carrier, 1983). Young hares begin to forage independently at an early age. When they do, their rate of growth is one of the highest observed in mammals (Case, 1978), and the strength of their skeletal tissue is one-quarter that of adults. However, at the same time, their bones have a relatively thick cross-section. As they mature, the skeletal tissue increases in strength and stiffness, but the bones become relatively thinner. Because of their greater relative thickness, the bones of juveniles are as strong or stronger for their size than those of the adults.
To evaluate the hypothesis that changes of shape can compensate for the intrinsic weakness of growing skeletal tissue, we compared bone growth in the wings and hind limbs of California gulls. Within a day or two of hatching, young California gulls are able to run and swim (Bent, 1947; Smith & Diem, 1972). However, they do not begin to fly until they are 42 to 48 days old and fully grown in body mass (Smith & Diem, 1972). Accordingly, in this species it is possible to compare the growth of limbs that function in locomotion throughout post-hatching ontogeny to limbs that develop independently of locomotor function. If changes of shape do compensate for the weak tissue of growing bones, we would expect very different allometric patterns in the wings and hind limbs of this species.
Materials and methods
Specimens of Larus californicus used in this study were collected from a nesting colony near the south- eastern shore of the Great Salt Lake. During collection, care was taken to reduce disruption of the colony and to restrict disturbance to as small a portion of the colony as possible. Pre-fledglings were captured by hand and immediately killed in a chloroform chamber. Adults and one fledgling were shot with a pcllet gun. A total of 32 birds was collected. Twenty-three birds of this sample were chosen to represent a complete post- hatching growth series. The series included 18 juveniles, 1 fledgling and 4 adults.
Ontogenetic changes in shape and mechanical properties were analysed for the femur, tibiotarsus and tarsometatarsus of the hind limb, and for the humerus, ulna and carpometacarpus of the wing. Right limb
SKELETAL GROWTH IN GULLS 371
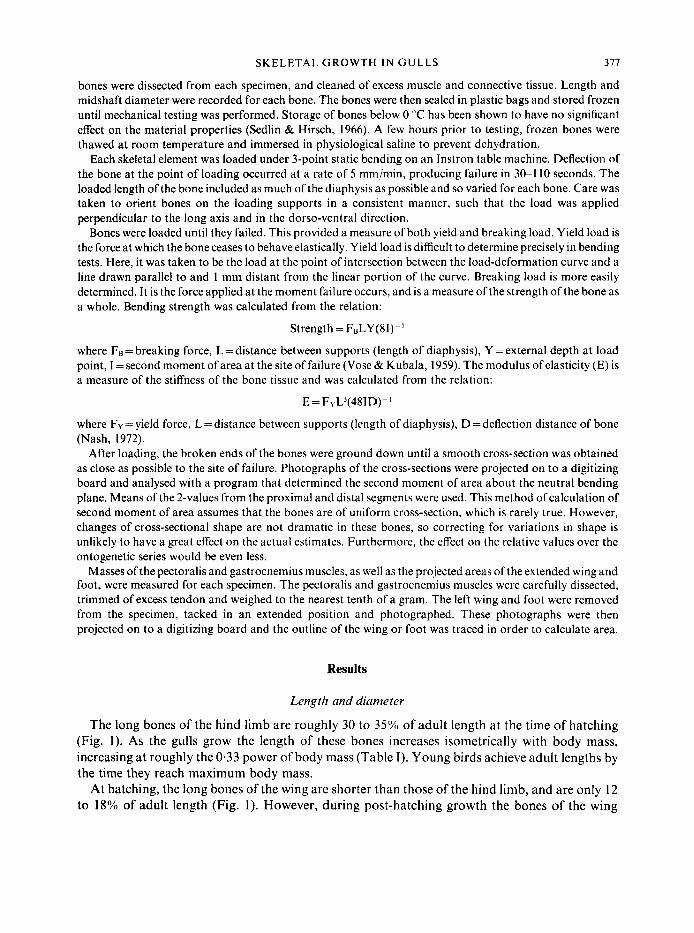
bones were dissected from each specimen, and cleaned of excess muscle and connective tissue. Length and midshaft diameter were recorded for each bone. The bones were then sealed in plastic bags and stored frozen until mechanical testing was performed. Storage of bones below 0 "C has been shown to have no significant effect on the material properties (Sedlin & Hirsch, 1966). A few hours prior to testing, frozen bones were thawed at room temperature and immersed in physiological saline to prevent dehydration.
Each skeletal element was loaded under 3-point static bending on an Instron table machine. Deflection of the bone at the point of loading occurred at a rate of 5 mm/min, producing failure in 30-1 10 seconds. The loaded length of the bone included as much of the diaphysis as possible and so varied for each bone. Care was taken to orient bones on the loading supports in a consistent manner, such that the load was applied perpendicular to the long axis and in the dorso-ventral direction.
Bones were loaded until they failed. This provided a measure of both yield and breaking load. Yield load is the force at which the bone ceases to behave elastically. Yield load is difficult to determine precisely in bending tests. Here, it was taken to be the load at the point of intersection between the load-deformation curve and a line drawn parallel to and 1 mm distant from the linear portion of the curve. Breaking load is more easily determined. It is the force applied at the moment failure occurs, and is a measure ofthe strength of the bone as a whole. Bending strength was calculated from the relation:
Strength= FBLY(81)-'
where Fe= breaking force, L=distance between supports (length of diaphysis), Y =external depth at load point, I = second moment of area at the site of failure (Vose & Kubala, 1959). The modulus of elasticity (E) is a measure of the stiffness of the bone tissue and was calculated from the relation:
E = FyL3(481D)- ' where Fu = yield force, L = distance between supports (length of diaphysis), D =deflection distance of bone (Nash, 1972).
After loading, the broken ends of the bones were ground down until a smooth cross-section was obtained as close as possible to the site of failure. Photographs of the cross-sections were projected on to a digitizing board and analysed with a program that determined the second moment of area about the neutral bending plane. Means of the 2-values from the proximal and distal segments were used. This method of calculation of second moment of area assumes that the bones are of uniform cross-section, which is rarely true. However, changes of cross-sectional shape are not dramatic in these bones, so correcting for variations in shape is unlikely to have a great effect on the actual estimates. Furthermore, the effect on the relative values over the ontogenetic series would be even less.
Masses of the pectoralis and gastrocnemius muscles, as well as the projected areas of the extended wing and foot, were measured for each specimen. The pectoralis and gastrocnemius muscles were carefully dissected, trimmed of excess tendon and weighed to the nearest tenth of a gram. The left wing and foot were removed from the specimen, tacked in an extended position and photographed. These photographs were then projected on to a digitizing board and the outline of the wing or foot was traced in order to calculate area.
Results
Length and diameter
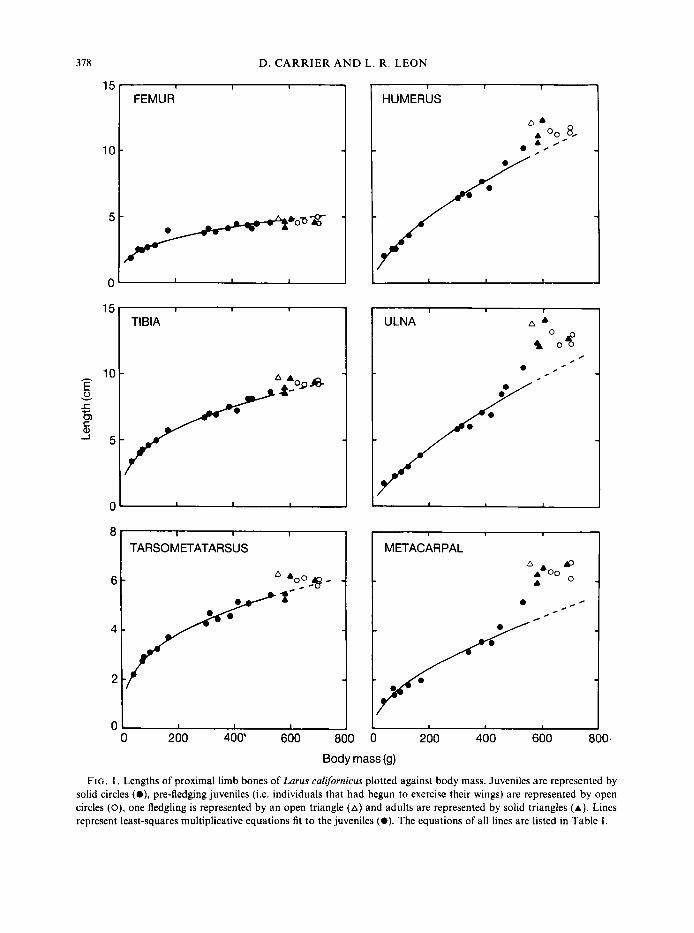
The long bones of the hind limb are roughly 30 to 35% of adult length at the time of hatching (Fig. I). As the gulls grow the length of these bones increases isometrically with body mass, increasing a t roughly the 0.33 power of body mass (Table I). Young birds achieve adult lengths by the time they reach maximum body mass.
At hatching, the long bones of the wing are shorter than those of the hind limb, and are only 12 to 18% of adult length (Fig. 1). However, during post-hatching growth the bones of the wing
378 D. CARRIER A N D L . R. LEON
I 1 I
TARSOMETATARSUS
200 400’ 600 800
1 HUMERUS
METACARPAL I A
0 . / c . . . / 0
1 0 200 400 600 800
Body mass (9)
FIG. I , Lengths of proximal limb bones of Larus californicus plotted against body mass. Juveniles are represented by solid circles (O) , pre-fledging juveniles (i.e. individuals that had begun to exercise their wings) are represented by open circles (O), one fledgling is represented by an open triangle (A) and adults are represented by solid triangles (A). Lines represent least-squares multiplicative equations fit to the juveniles (0). The equations of all lines are listed in Table I .
SKELETAL GROWTH IN GULLS 379
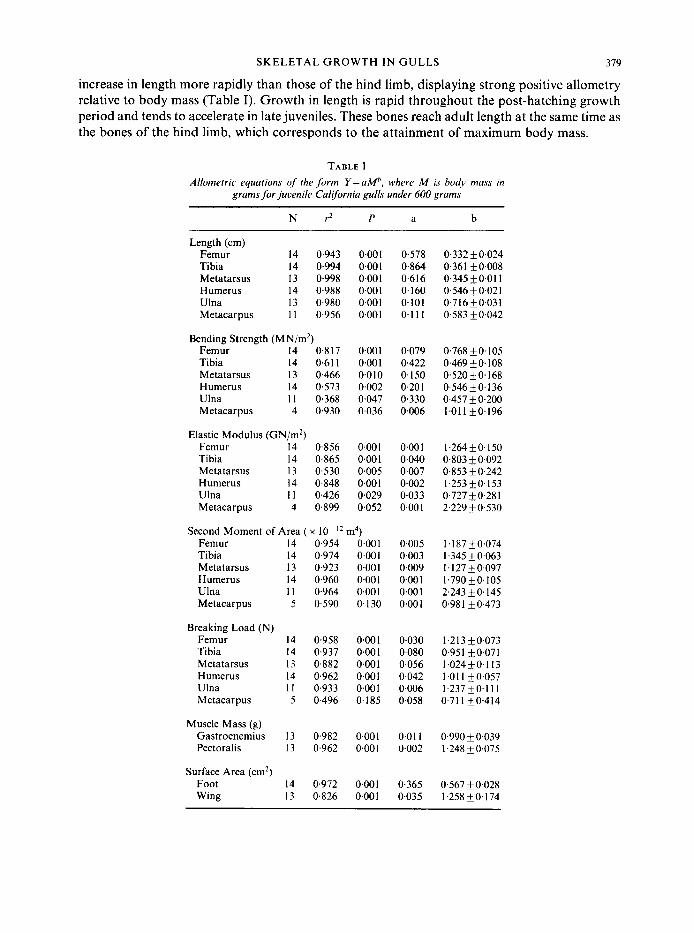
increase in length more rapidly than those of the hind limb, displaying strong positive allometry relative to body mass (Table I). Growth in length is rapid throughout the post-hatching growth period and tends to accelerate in late juveniles. These bones reach adult length at the same time as the bones of the hind limb, which corresponds to the attainment of maximum body mass.
TABLE I Allometric equarions of the form Y = a M h , where M is body mass in
grams for juvenile California gulls under 600 grams
N r2 P a b
Length (cm) Femur 14 0.943 0.001 Tibia 14 0.994 0.001 Metatarsus 13 0.998 0.001 Humerus 14 0.988 0.001 Ulna 13 0,980 0.001 Metacarpus 11 0,956 0.001
Bending Strength (MN/m2) Femur 14 0.817 0.001 Tibia 14 0.611 0.001 Metatarsus 13 0,466 0.010 Humerus 14 0.573 0.002 Ulna 11 0.368 0.047 Metacarpus 4 0.930 0.036
Elastic Modulus (GN/m2) Femur 14 0.856 0.001 Tibia 14 0.865 0.001 Metatarsus 13 0.530 0.005 Humerus 14 0,848 0.001 Ulna I 1 0.426 0.029 Metacarpus 4 0.899 0.052
Second Moment of Area ( x m4) Femur 14 0,954 0.001 Tibia 14 0.974 0.001 Metatarsus 13 0,923 0.001 Humerus 14 0.960 0.001 Ulna I 1 0.964 0.001 Metacarpus 5 0.590 0,130
Breaking Load (N) Femur 14 0.958 0.001 Tibia 14 0.937 0.001 Metatarsus 13 0.882 0.001 Humerus 14 0,962 0.001 Ulna 11 0.933 0.001 Metacarpus 5 0.496 0,185
Muscle Mass (g) Gastrocnemius 13 0.982 0.001 Pectoralis 13 0.962 0.001
Surface Area (cm2) Foot 14 0.972 0.001 Wing 13 0,826 0.001
0.578 0.864 0.6 I6 0.160 0.101 0.1 11
0.079 0,422 0. I50 0.20 1 0,330 0.006
0.00 1 0,040 0,007 0.002 0.033 0.00 1
0.005 0,003 0.009 0.00 1 0.00 1 0.00 1
0.030 0.080 0,056 0,042 0.006 0,058
0.01 1 0.002
0.365 0.035
0.332 & 0.024 0.361 & 0.008 0.345 & 0.01 1 0.546k0.021 0.716i0.031 0,583 F0.042
0.768 & 0. I05 0,469 & 0. I08 0.520 + O , I68 0546 & 0.136 0,457 k0.200 1.011 k0.196
1.264 + O . 150 0.803 i 0.092 0.853 k 0.242 1.253 k0.153 0.727 i0.281 2.229 5 0.530
I , 187 i 0,074 1.345 & 0.063 1.127+0.097 1.790+0.105 2.243 F 0. I45 0.98 1 k 0,473
1.213_+0,073 0.95 I F 0.071 1.024&0~l13 1 .O I I k0.057 1.237 &0.111 0.71 1 +0.414
0,990 i 0,039 1.248 k0.075
0.567 i 0,028 1,258 +0.174
380 D . CARRIER A N D L. R. LEON
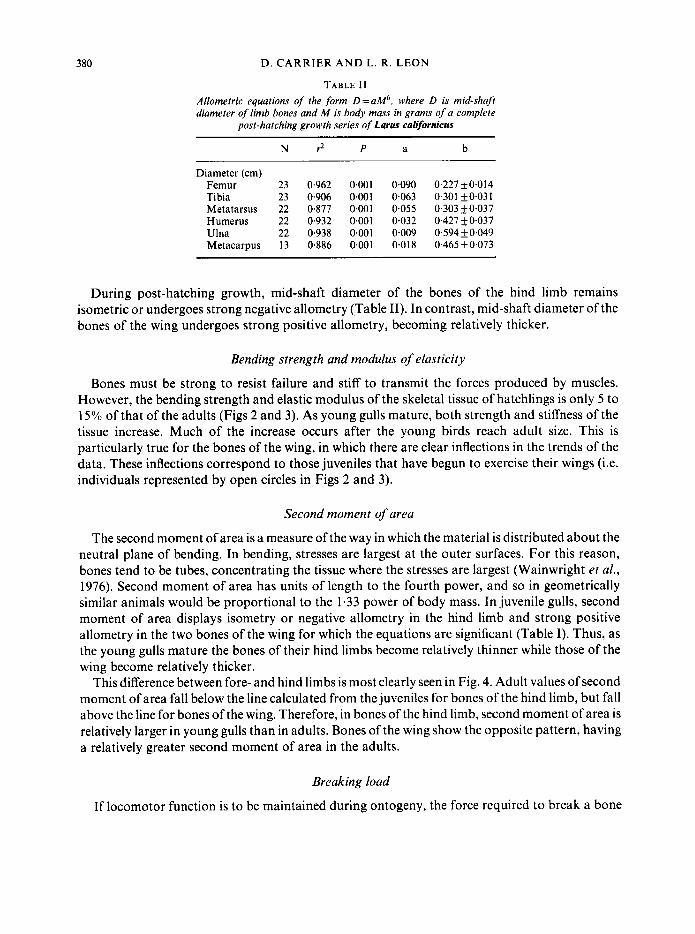
T A B L E I1 Allometric equations of the form D=aMb. where D is mid-shaft diameter of limb bones and M is body mass in grams of a complete
post-hatching growth series of Larus californicus
N G P a b
Diameter (cm) Femur 23 0.962 0.001 0.090 0.227k0.014 Tibia 23 0,906 0.001 0.063 0~301k0~031 Metatarsus 22 0.877 0.001 0.055 0.303+0.037 Humerus 22 0.932 0.001 0.032 0.427+0.037
Metacarpus 13 0.886 0.001 0.018 0,465*0.073 Ulna 22 0.938 0.001 0.009 0.594k0.049
During post-hatching growth, mid-shaft diameter of the bones of the hind limb remains isometric or undergoes strong negative allometry (Table 11). In contrast, mid-shaft diameter of the bones of the wing undergoes strong positive allometry, becoming relatively thicker.
Bending strength and modulus of elasticity
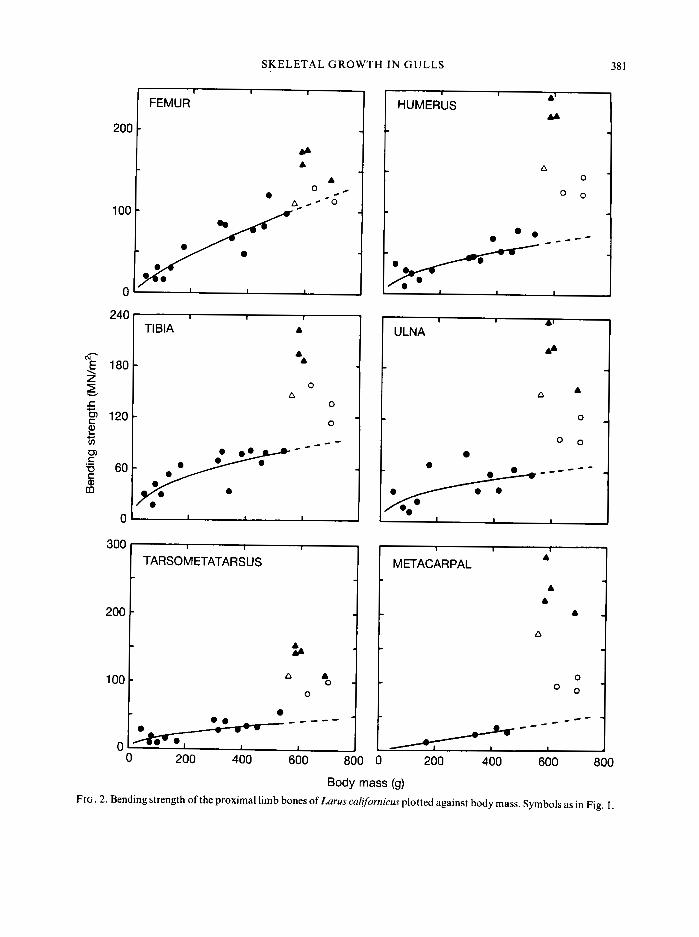
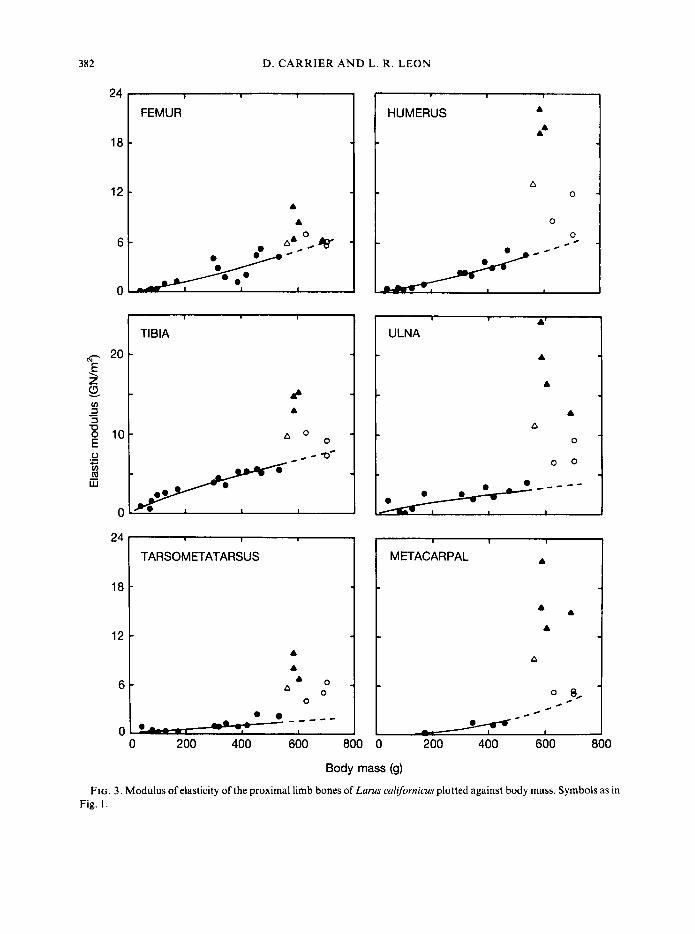
Bones must be strong to resist failure and stiff to transmit the forces produced by muscles. However, the bending strength and elastic modulus of the skeletal tissue of hatchlings is only 5 to 15% of that of the adults (Figs 2 and 3). As young gulls mature, both strength and stiffness of the tissue increase. Much of the increase occurs after the young birds reach adult size. This is particularly true for the bones of the wing, in which there are clear inflections in the trends of the data. These inflections correspond to those juveniles that have begun to exercise their wings (i.e. individuals represented by open circles in Figs 2 and 3).
Second moment of area
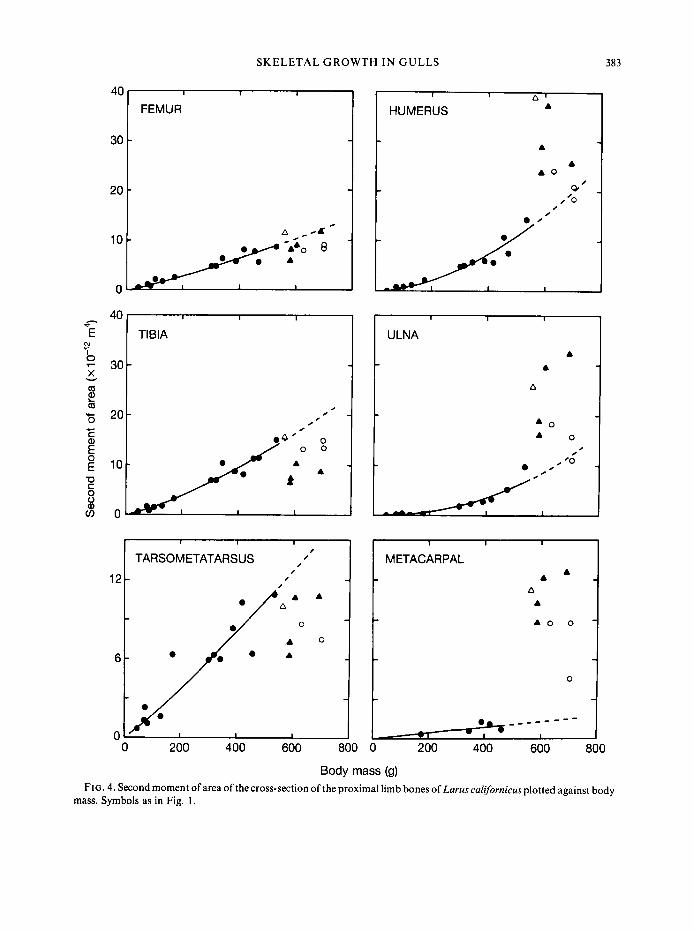
The second moment of area is a measure of the way in which the material is distributed about the neutral plane of bending. In bending, stresses are largest at the outer surfaces. For this reason, bones tend to be tubes, concentrating the tissue where the stresses are largest (Wainwright et al., 1976). Second moment of area has units of length to the fourth power, and so in geometrically similar animals would be proportional to the 1.33 power of body mass. In juvenile gulls, second moment of area displays isometry or negative allometry in the hind limb and strong positive allometry in the two bones of the wing for which the equations are significant (Table I). Thus, as the young gulls mature the bones of their hind limbs become relatively thinner while those of the wing become relatively thicker.
This difference between fore- and hind limbs is most clearly seen in Fig. 4. Adult values of second moment of area fall below the line calculated from the juveniles for bones of the hind limb, but fall above the line for bones of the wing. Therefore, in bones of the hind limb, second moment of area is relatively larger in young gulls than in adults. Bones of the wing show the opposite pattern, having a relatively greater second moment of area in the adults.
Breaking load
If locomotor function is to be maintained during ontogeny, the force required to break a bone
SKELETAL GROWTH I N GULLS 38 1
200
100
I 1 I
FEMUR 1
-
-
200 1
A - 0
0 0 - - - - -
a /----
240
% 180 t E c" 120 5
2
'- 60
c v)
0) c 2 L%
0
TIBIA A
A A
0 A
. / - - -
300 I 1 1 1 1
I TARSOMETATARSUS I
t. O . 0
0
_ - - - - 0 tk1 OG'"' I 1
200 400 600 800 0
1 1 4'
ULNA AA
a .
0
0 0
------- '. I
0 200 400 600 800
Body mass (9) FIG. 2. Bending strength of the proximal limb bones of Larus callornicus plotted against body mass. Symbols as in Fig. 1.
382 D. CARRIER A N D L. R. LEON
24
18
12
E
C
TARSOMETATARSUS
A A A 0
O O 0
_ _ _ _ _ * 400 600 800 200
A HUMERUS f
- ULNA
A
A
A A
0
0 0
METACARPAL A
A A A
0
~~ * ) :'" 1 200 400 600 800
Body mass (9)
FIG. 3 . Modulus of elasticity of the proximal limb bones of Larus calfornicus plotted against body mass. Symbols as in Fig. 1.
SKELETAL GROWTH I N GULLS 383
40
30
20
*-
2 E
b 7
X
m v
s
E
c
c 0 C 0)
E
I I I
FEMUR
- -
-
TIBIA
0 200 400 600 800 0 200 400 600 800
Body mass (9) FIG. 4. Second moment of area of the cross-section of the proximal limb bones of Lams californicus plotted against body
mass. Symbols as in Fig. I .
384 D. CARRIER AND L. R. LEON
1 I I
FEMUR
120
60
0
120 TARSOMETATARSUS
t 1
Oo&-oO 401 0 0 200 400 600 aoo
HUMERUS 1 0 0
0
-A ULNA
4 A
A
0
I 0 I
0 200 400 600 800
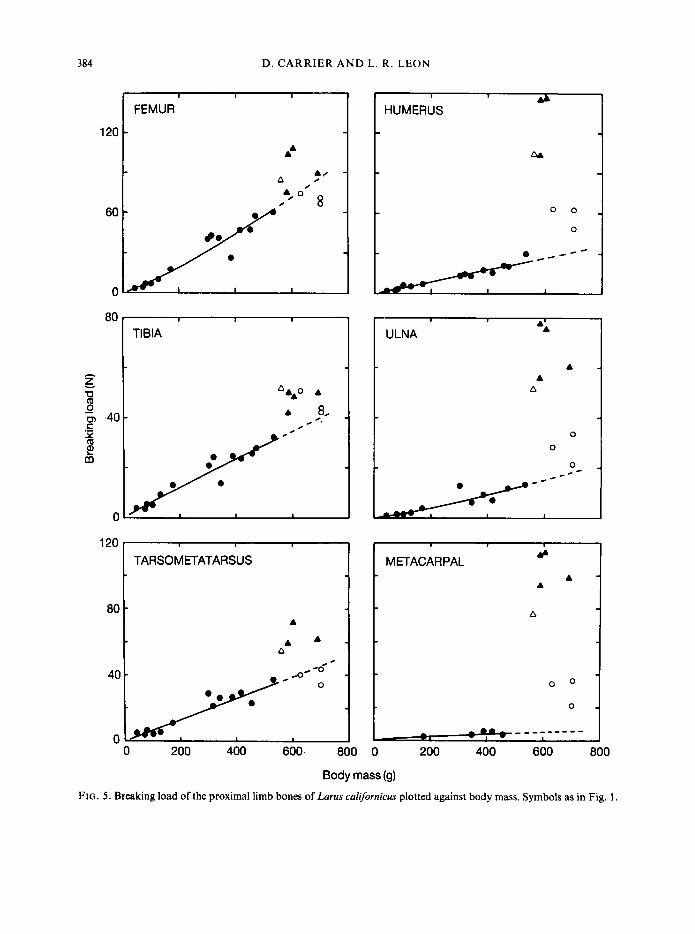
Body mass (9) FIG. 5 . Breaking load of the proximal limb bones of Larus calijornicus plotted against body mass. Symbols as in Fig. 1
S K E L E T A L GROWTH I N GULLS 385
can be expected to scale to body mass in roughly the same way as the forces imposed on the bone by the muscles. Thus, if young gulls are to maintain the same relative strength during growth, both muscular force and breaking load should scale to the 1.0 power of body mass.
Breaking load of the bones of the hind limb increases as the gulls grow (Fig. 5). Breaking load of the tibia and tarsometatarsus remains isometric with body mass, but the breaking load of the femur displays positive allometry (Table I). For all three bones of the hind limb the line generated from juveniles is a fairly good predictor of adult breaking load. However, hind limb bones of adults do tend to be relatively stronger than those of juveniles (i.e. adults fall above the line), but not to a great extent.
Changes in strength of the bones of the wing show a very different pattern (Fig. 5). Whereas the breaking load of the hind limb bones increases in a gradual and continuous manner, the bones of the wing remain relatively weak throughout most of the growth period. Then, as the gulls reach maximum body mass and begin to exercise their wings, the breaking load of the bones of the wing
1 I I J 0 i - 0 200 400 600 800 0 200 400 600 800
I I I I
GASTROCNEMIUS 8
0 200 400 600 800 0
0 200 400 600 800
Body mass (9)
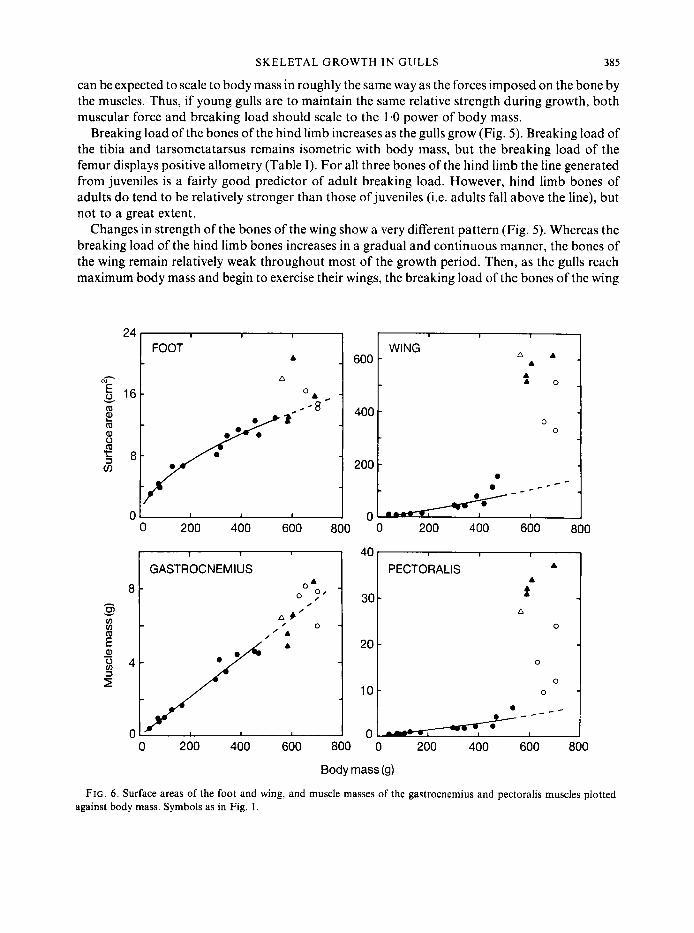
FIG. 6 . Surface areas of the foot and wing, and muscle masses of the gastrocnemius and pectoralis muscles plotted against body mass. Symbols as in Fig. 1.
386 D . CARRIER A N D L. R . LEON
begins to increase rapidly. By the time the young birds begin to fly, the breaking load of their wing bones has approached that of the adults.
Muscle mass
The muscle of the calf, the gastrocnemius, grows isometrically with body mass (Table I), and the line generated from the juveniles is a good predictor of adult values (Fig. 6). In contrast, the main flight muscle, the pectoralis, undergoes relatively little increase during the period in which the young birds increase in body mass. From the time of hatching at roughly 50 g body mass to the time when the young bird is approximately 75% of adult body mass, the pectoralis muscles remain a constant 1.1 % of body mass. Then during the latter portion ofpre-fledging ontogeny, the mass of the pectoralis increases 10-fold to represent 10*8kO.3% of body mass in adults. The inflection in the trend of the data corresponds to those juveniles that are exercising their wings.
Foot and wing surface area
Surface area has units of length squared, and therefore, in geometrically similar animals, would scale to the 0.67 power of body mass. Post-hatching growth of surface area in the wing and foot mirrors the patterns of increa ,e in bone strength and muscle mass (Fig. 6). Surface area of the foot increases isometrically with body mass and adult values fall along the line generated from the juveniles. In contrast, the surface area of the wing increases very little initially, but undergoes rapid growth during the latter portion of the growth period.
Discussion
Bone growth and locomotor function
Our observations indicate that ontogenetic changes in the shape of long bones can compensate for intrinsically weak skeletal tissue. Presumably as a result of their rapid growth (Ricklefs, 1973), the bones of growing gulls are composed of weak, flexible tissue. In the wing, weak skeletal tissue results in whole bones that have a very low resistance to bending. However, this is not the case in the hind limb, in which breaking load of the bones is maintained at a roughly constant level relative to that of adults throughout the growth period. Attainment and maintenance of bone strength equivalent to that of adults is possible only because the hind limb bones of younger gulls are relatively thicker.
The difference in skeletal ontogeny between the wing and hind limb is clearly a response to the different demands of locomotion. Although the wings are not used in locomotion during the growth period, the hind limbs become functional in locomotion shortly after the young gulls hatch. In the hind limbs, the conflict that results from the need for rapidly growing bones also to function in locomotion is solved by negative allometry of bone thickness.
Negative allometry of bone thickness is likely to characterize any species in which significant locomotor activity is required during periods of rapid growth. Relatively thick bones in young animals have been observed during the ontogeny of hares (Carrier, 1983), humans (Currey, 1977), gulls (this study) and flamingos (pers. obs.), and may be a general characteristic of birds and mammals. In contrast, ectothermic tetrapods seem to show the converse pattern. Ectotherms grow approximately 10 times more slowly than endotherms (Case, 1978). Thus, their skeletal tissues do
SKELETAL GROWTH I N GULLS 387
not experience the same structural changes common to birds and mammals (Enlow, 1969; de Ricqles, 1976). In lizards, the material properties of bone have been shown to remain relatively constant throughout ontogeny (Peterson & Zernicke, 1986, 1987). Consequently, the skeletal ontogeny of ectothermic tetrapods is characterized by isometry or positive allometry of bone thickness (Dodson, 1975; Peterson & Zernicke, 1986, 1987).
This difference between endotherms and ectotherms may be useful for inferring the relative growth and metabolic rates of extinct tetrapods. For example, demonstration of negative allometry of bone thickness in an extinct species would suggest growth rates closer to those of birds and mammals than those of ectotherms. In the same context, ontogenetic allometry of skeleton elements has recently been used to argue that the seven known specimens of Archaeopteryx represent a single species (Houck et al., 1990). In interspecific comparisons of adult birds and mammals, bone thickness exhibits isometry or positive allometry (Alexander, 1977; Alexander et al., 1979; Biewener, 1983). Thus, the observation that the seven specimens of Archaeopteryx display negative allometry in bone thickness is consistent with the hypothesis that they represent different growth stages of a single species.
A lt ricial wing growth
Although gulls have been classified as semiprecocial (Ricklefs, 1973), in terms of locomotor development they are really both altricial and precocial. California gulls begin to walk soon after hatching, but they do not fly until they are 42-48 days old and fully grown. This difference is reflected in the development of the hind limb and wing. In the hind limbs, breaking load of the bones, mass of the gastrocnemius muscle and surface area of the foot all increase approximately isometrically with body mass. In the wing these parameters increase very little until the growing bird reaches adult body mass. After the gulls reach adult size, the breaking load of the wing bones increases 3-4 times, the mass of the pectoralis muscle increases three times and the surface area of the wing doubles. Thus, while the hind limb maintains roughly constant strength relative to body mass throughout the post-hatching growth period, development of strength is delayed in the wing until shortly before the young birds begin to fly.
The process of delaying wing development until shortly before fledging may increase the rate of growth. Most species of birds do not fly until they are almost fully grown. Consequently, throughout the major portion of the growth period the wings of most species are fairly useless structures. Early wing development might, therefore, entail a wasted investment of energy. The maintenance cost of skeletal muscle is probably most significant in this regard. Oxygen consumption by tissue homogenates indicate that the metabolic rate of muscle is as high as that of liver and kidney (Malzahn, 1974) and is six times greater than that of skeletal tissue (Field, Belding & Martin, 1939). In juvenile California gulls the pectoralis muscles are very small, constituting only I e l % of body mass. However, shortly before fledging the pectoralis muscles increase 1 0-fold to represent 10.8% of adult body mass. Premature development of flight muscles of this size would require a significant expenditure of energy that might be used more appropriately in other functions critical to development.
The suggestion that delayed development of the wing allows more rapid overall development is supported by the observation that altricial birds do grow more rapidly than precocial species. Ricklefs (1973, 1979) has shown that fully altricial species increase in body mass at 2-3 times the rate of precocial species. He attributes the faster growth of altricial species to a greater portion of the available energy spent on growth than on other functions and to a reduction of intrinsic conflicts between mature function and developmental processes.
388 D. CARRIER A N D L. R . LEON
Development of skeletal strength in the wing of California gulls may be tied physiologically to development of the flight muscles. In mammals, the strength of whole bones exhibits great plasticity in response to changes in level of use (Wolff, 1870; Lanyon & Rubin, 1985). Elimination of motor function during ontogeny results in diminished strength in the bones of the adult appendage (Howell, 191 7; Lanyon, 1980). Because of the limited use of the wing by growing gulls, the same mechanisms operating in birds could produce the initial relative weakness of the bones. Increases in strength of the bones of the wing would then occur as a response to the dramatic growth of the pectoralis muscle and the flapping exercises that pre-fledgling birds perform in preparation for flight.
There is one aspect of wing development that seems paradoxical. Although overall development of the wing is delayed until shortly before fledging, linear growth of the bones of the wing is initiated early and continues throughout the growth period. If there is an advantage to be gained by postponing wing development, why not delay bone growth as well? One possible explanation is that linear growth of bones may require a longer developmental period than that of other tissues of the wing. Long bones grow via endochondral ossification (Wolbach & Hegsted, 1952), in which increases in length occur only at the two ends of the bone. Because the humerus and ulna are the longest bones in the body of a gull, their growth may require earlier initiation than other aspects of the wing. If this were true, linear growth of bone would be the rate limiting process in wing development.
Summary
1. Ontogenetic changes in shape and mechanical properties of the femur, tibia, tarsometatarsus, humerus, ulna and carpometacarpus were measured in a complete post-hatching growth series of the gull, Larus californicus. At hatching, these bones are composed of skeletal tissue of low strength and stiffness. The long bones of the wing remain relatively weak throughout the major portion of the growth period. In contrast, relatively thick bones in the hind limbs of juveniles compensate for the weak skeletal tissue such that the breaking load of the bones remains constant relative to body mass throughout post-hatching growth. 2. Differences in skeletal growth between the wing and hind limb are a response to different demands of locomotion. Although the wings are not used in locomotion during the growth period, the hind limbs become functional shortly after hatching. 3. Negative allometry of bone thickness, as observed in the hind limb of the gulls, is likely to characterize any species in which significant locomotor activity occurs during periods of rapid growth. 4. Musculo-skeletal growth of the wings of California gulls is delayed until shortly before fledging. We tentatively suggest that this pattern of altricial development results from three factors. First, as a consequence of selection for rapid and economical growth, development of the flight muscles is delayed until just before the time of fledging. Secondly, due to intrinsic differences in the rates at which the various tissues of the wing grow, linear growth of wing bones must begin early in ontogeny. Thirdly, because of the physiological plasticity of bone tissue, the wing bones remain relatively weak until they begin to be used late in pre-fledging development.
We gratefully acknowledge the assistance of David Winkler in collection of the gulls. We thank William Durrant and the Department of Mechanical Engineering of The University of Michigan for assistance in testing the bones. Carl Gans and Marvalee Wake provided facilities for analysis of the data. We also thank
S K E L E T A L G R O W T H IN G U L L S 389
Clifford Baron, Carl C a n s , Enr ique Lessa, Marva lee W a k e and one a n o n y m o u s reviewer for c o m m e n t s on early versions of the manuscript .
R E F E R E N C E S
Alexander, R. McN. (1977). Allometry of the limbs of antelopes (Bovidae). J . Zool., Lond. 183: 125-146. Alexander, R. McN., Jayes, A. S., Maloiy, G . M. 0. & Wathuta, E. M. (1979). Allometry of the limb bones of mammals
Bent, A. C. (1947). Lye histories of North American gulls and terns. New York: Dodd, Mead & Co. Biewener, A. A. (1983). Allometry of quadrupedal locomotion: the scaling of duty factor, bone curvature and limb
Bonfield, W. & Clark, E. A. (1973). Elastic deformation of compact bone. J . muter. Sci. 8 1590-1594. Carrier, D. R. (1983). Postnatal ontogeny of the musculo-skeletal system in the Black-tailed jack rabbit (Lepus
Case, T. J. (1978). On the evolution and adaptive significance of postnatal growth rates in the terrestrial vertebrates. Q. Rec.
Currey, J. D. (1977). Problems of scaling in the skeleton. In Scale efli~t.7 in animallocomotion: 153- 167. Pedley, T. J. (Ed.).
Currey, J . D. & Butler, G. (1975). The mechanical properties of bone tissue in children. J . Bone J I Surg. 57: 810-814. Dodson, P. (1975). Functional and ecological significance of relative growth of Alligaror. J . Zool., Lond. 175: 315-355. Enlow, D. H. (1969). The bone of reptiles. In Biology of the Reptilia 1: 45-77. Cans, C., Bellairs, A. d'A. & Parsons, T. S.
Field, J., Belding, H. S. & Martin, A. W. (1939). An analysis of the relation between basal metabolism and summated tissue
Houck, M. A,, Gauthier, J. A. & Strauss, R. E. (1990). Allometric scaling in the earliest fossil bird, Archaeopreryxlithogra-
Howell, J . A. (1917). An experimental study of the effect of stress and strain on bone development. Anat. Rec. 1 3 233-252. Lanyon, L. E. (1980). The influence of function on the development of bone curvature. An experimental study on the rat
Lanyon, L. E. & Rubin, C . T. (1985). Functional adaptation in skeletal structures. In Functional uertebraie morphology:
Malzahn, E. (1974). Tissue metabolism in the common shrew and the bank vole. Acta theriol. 19: 301-314. Nash, W. R. (1972). Strength ofmaterials. (2nd edn). Schaum's outline series. New York: McGraw-Hill. Peterson, J. A. & Zernicke, R. F. (1986). The mechanical properties of limb bones in the lizard Anolis equestris. Am. Zool.
Peterson. J. A. & Zernicke, R. F. (1987). The mechanical properties of limb bones in the cursorial lizard, Dipsosaurus
Ricklefs, R. E. (1973). Patterns of growth in birds. 2. Growth rate and mode of development. Ibis 115: 177-201. Ricklefs, R. E. (1979). Adaptation, constraint, and compromise in avian postnatal development. B i d . Rev. 5 4 269-290. Ricqles, A. de. (1976). On bone histology of fossil and living reptiles, with comments on its functional evolutionary
Sedlin, E. D. & Hirsch, C. (1966). Factors affecting the determination of the physical properties of femoral cortical bone.
Smith, J. E. & Diem, K. L. (1972). Growth and development of young California gulls (Larus calfornicus). Condor 7 4 462-
Torzilli, P. A,, Takebe, K., Burstein, A. H., Zika, M. & Heiple, K. G. (1982). The material properties of immature bone.
Trotter, M. & Peterson, R. R. (1970). The density of bones in the fetal skeleton. Growth 34: 283-292. Vose, G. P. & Kubala. A. L. (1959). Bone strength-its relationship to X-ray determined ash content. Hum. Biol. 31: 262-
Wainwright, S. A,, Biggs. W. D.. Currey, J. D. & Gosline, J. M. (1976). Mechanicaldesign in organisms. New York: John
Wolbach, S. B. & Hegsted, D. M. (1952). Endochondral bone growth in the chick. Archs Path. 5 4 1-29. Wolff, J. (1870). Uber die innere Architekture der Knochen und ihre Bedeutung fur die Frage vom Knochenwachstum.
from shrews (Sorex) to elephants (Loxodonto). J . Zool., Lond. 189: 305-314.
orientation to body size. J . e s p . B i d . 105: 147-171.
californicus). J . Zool. , Lond. 201: 27-55.
Biol. 5 3 243-282.
London: Academic Press.
(Eds). London: Academic Press.
respiration in the rat. I. The post-pubertal albino rat. J . cell. comp. Phvsiol. 14: 143-157.
phica. Science, Wash. 247: 195-198.
tibia. J . Zool.. Lond. 192 457-466.
1-25. Hildebrand, M., Bramble, D. M., Liem, K . F. &Wake, D. B. (Eds). Cambridge: Belknap Press.
2 6 133A.
dorsalis. Am. Zool. 27: 64A.
significance. Linn. Soc. Symp. Ser. 3: 123- 150.
Aria orrhop. scand. 37: 29-48.
470.
ASME J . Biomech. Eng. 104: 12-20.
270.
Wiley & Sons.
Virchows Arch. 5 0 389-453.