Embed Size (px)
Citation preview
January 2010
NASA/TP–2010-216169
Sizing Single Cantilever Beam Specimens for Characterizing Facesheet/Core Peel Debonding in Sandwich Structure James G. Ratcliffe National Institute of Aerospace Langley Research Center, Hampton, Virginia
https://ntrs.nasa.gov/search.jsp?R=20100003052 2019-04-11T06:48:45+00:00Z
NASA STI Program . . . in Profile
Since its founding, NASA has been dedicated to the advancement of aeronautics and space science. The NASA scientific and technical information (STI) program plays a key part in helping NASA maintain this important role.
The NASA STI program operates under the auspices of the Agency Chief Information Officer. It collects, organizes, provides for archiving, and disseminates NASA’s STI. The NASA STI program provides access to the NASA Aeronautics and Space Database and its public interface, the NASA Technical Report Server, thus providing one of the largest collections of aeronautical and space science STI in the world. Results are published in both non-NASA channels and by NASA in the NASA STI Report Series, which includes the following report types:
• TECHNICAL PUBLICATION. Reports of
completed research or a major significant phase of research that present the results of NASA programs and include extensive data or theoretical analysis. Includes compilations of significant scientific and technical data and information deemed to be of continuing reference value. NASA counterpart of peer-reviewed formal professional papers, but having less stringent limitations on manuscript length and extent of graphic presentations.
• TECHNICAL MEMORANDUM. Scientific
and technical findings that are preliminary or of specialized interest, e.g., quick release reports, working papers, and bibliographies that contain minimal annotation. Does not contain extensive analysis.
• CONTRACTOR REPORT. Scientific and
technical findings by NASA-sponsored contractors and grantees.
• CONFERENCE PUBLICATION. Collected
papers from scientific and technical conferences, symposia, seminars, or other meetings sponsored or co-sponsored by NASA.
• SPECIAL PUBLICATION. Scientific,
technical, or historical information from NASA programs, projects, and missions, often concerned with subjects having substantial public interest.
• TECHNICAL TRANSLATION. English-
language translations of foreign scientific and technical material pertinent to NASA’s mission.
Specialized services also include creating custom thesauri, building customized databases, and organizing and publishing research results. For more information about the NASA STI program, see the following: • Access the NASA STI program home page at
http://www.sti.nasa.gov • E-mail your question via the Internet to
[email protected] • Fax your question to the NASA STI Help Desk
at 443-757-5803 • Phone the NASA STI Help Desk at
443-757-5802 • Write to:
NASA STI Help Desk NASA Center for AeroSpace Information 7115 Standard Drive Hanover, MD 21076-1320
National Aeronautics and Space Administration Langley Research Center Hampton, Virginia 23681-2199
January 2010
NASA/TP–2010-216169
Sizing Single Cantilever Beam Specimens for Characterizing Facesheet/Core Peel Debonding in Sandwich Structure James G. Ratcliffe National Institute of Aerospace Langley Research Center, Hampton, Virginia
Available from:
NASA Center for AeroSpace Information 7115 Standard Drive
Hanover, MD 21076-1320 443-757-5802
Trade names and trademarks are used in this report for identification only. Their usage does not constitute an official endorsement, either expressed or implied, by the National Aeronautics and Space Administration.
1
Sizing Single Cantilever Beam Specimens for Characterizing Facesheet/Core Peel Debonding in Sandwich Structure
James G. Ratcliffe National Institute of Aerospace
100 Exploration Way, Hampton, VA 23666 Resident at:
Damage Tolerance, Durability, and Reliability Branch NASA Langley Research Center, Hampton, VA 23681
ABSTRACT: This technical publication details part of an effort focused on the development of a standardized facesheet/core peel debonding test procedure. The purpose of the test is to characterize facesheet/core peel in sandwich structure, accomplished through the measurement of the critical strain energy release rate associated with the debonding process. Following an examination of previously developed tests and a recent evaluation of a selection of these methods, a single cantilever beam (SCB) specimen was identified as being a promising candidate for establishing such a standardized test procedure. The objective of the work described here was to begin development of a protocol for conducting a SCB test that will render the procedure suitable for standardization. To this end, a sizing methodology was developed to ensure appropriate SCB specimen dimensions are selected for a given sandwich system. Application of this method to actual sandwich systems yielded SCB specimen dimensions that would be practical for use. This study resulted in the development of a practical SCB specimen sizing method, which should be well-suited for incorporation into a standardized testing protocol.
2
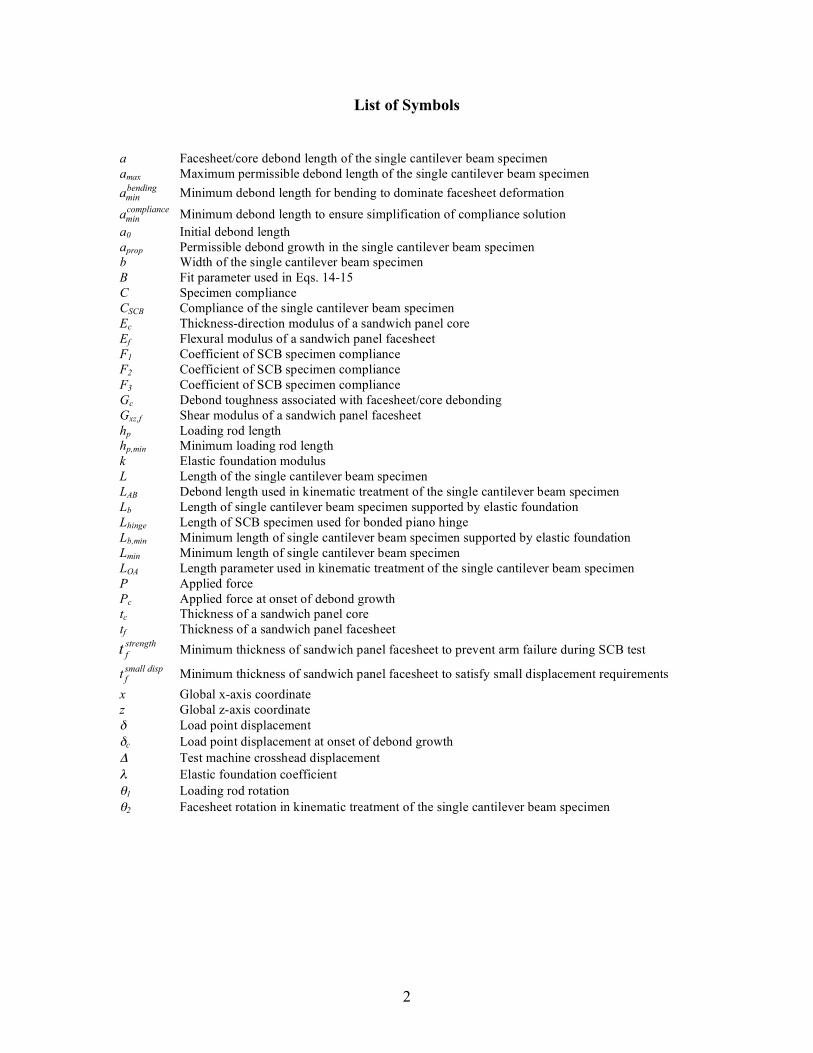
List of Symbols a Facesheet/core debond length of the single cantilever beam specimen amax Maximum permissible debond length of the single cantilever beam specimen
!
aminbending Minimum debond length for bending to dominate facesheet deformation
!
amincompliance
Minimum debond length to ensure simplification of compliance solution a0 Initial debond length aprop Permissible debond growth in the single cantilever beam specimen b Width of the single cantilever beam specimen B Fit parameter used in Eqs. 14-15 C Specimen compliance CSCB Compliance of the single cantilever beam specimen Ec Thickness-direction modulus of a sandwich panel core Ef Flexural modulus of a sandwich panel facesheet F1 Coefficient of SCB specimen compliance F2 Coefficient of SCB specimen compliance F3 Coefficient of SCB specimen compliance Gc Debond toughness associated with facesheet/core debonding Gxz,f Shear modulus of a sandwich panel facesheet hp Loading rod length hp,min Minimum loading rod length k Elastic foundation modulus L Length of the single cantilever beam specimen LAB Debond length used in kinematic treatment of the single cantilever beam specimen Lb Length of single cantilever beam specimen supported by elastic foundation Lhinge Length of SCB specimen used for bonded piano hinge Lb,min Minimum length of single cantilever beam specimen supported by elastic foundation Lmin Minimum length of single cantilever beam specimen LOA Length parameter used in kinematic treatment of the single cantilever beam specimen P Applied force Pc Applied force at onset of debond growth tc Thickness of a sandwich panel core tf Thickness of a sandwich panel facesheet
!
t fstrength Minimum thickness of sandwich panel facesheet to prevent arm failure during SCB test
!
t fsmall disp Minimum thickness of sandwich panel facesheet to satisfy small displacement requirements
x Global x-axis coordinate z Global z-axis coordinate δ Load point displacement δc Load point displacement at onset of debond growth Δ Test machine crosshead displacement λ Elastic foundation coefficient θ1 Loading rod rotation θ2 Facesheet rotation in kinematic treatment of the single cantilever beam specimen
3
1 Introduction
Sandwich structure can exhibit several different failure modes, the occurrence of which is dependent largely on the configuration of the sandwich system and loading scenario [1]. One such failure mode, facesheet/core debonding, can pose a threat to the structural integrity of a component comprised of sandwich structure. Consequently, manufactures often gauge the quality of the facesheet/core bond using the climbing drum peel (CDP) test [2]. This yields a qualitative assessment of the bond, however, use of data from this test for damage tolerance design purposes is limited (although, recent work suggests that it may be possible to estimate the critical strain energy release rate associated with facesheet/core peel in thin facesheet sandwich panels using the CDP test [3]). Thus, numerous alternative test methods have arisen from the need for a quantitative assessment of the quality of the facesheet/core bond [3-23]. These test methods largely follow a common approach, whereby facecheet/core debonding is characterized through the measurement of the corresponding critical strain energy release rate (denoted here as debond toughness).
As is the case with mode I delamination in composite laminates, the most critical debonding process in sandwich structure is likely to be mode I dominated, corresponding to loading scenarios where the facesheet is peeled from the core. Subsequently, the literature is focused on test methods designed to measure the critical strain energy release rate associated with facesheet/core peel. In general, two classes of facesheet/core peel test specimens have been developed. The general specimen configuration used in both classes is similar, involving a sandwich beam containing a debond running partially along one of the facesheet/core interfaces. The first class of specimens is based on a single cantilever beam (SCB) design, where a force is applied to the debonded facesheet, while the underside of the specimen is secured to a rigid base and prevented from rotation. An example of this configuration class is shown in Fig. 1a. The second class of specimens is based on a double cantilever beam (DCB) configuration, where equal and opposite forces are applied to the specimen, either side of the debond, as illustrated in Fig. 1b.
Several versions of each specimen class have been used for evaluating the debond toughness, associated with facesheet/core peel of a broad range of sandwich systems. There are a number of examples where slightly differing test configurations have been used to measure the debond toughness of the same, or similar, sandwich systems. For instance, values of debond toughness of a glass/polyester facesheet, H80 PVC foam core sandwich system, reported from four different tests, range from 0.2kJ/m2 to 0.53kJ/m2 (see Table A1, Appendix A). A similar amount of scatter in debond toughness was found following tests on two other sandwich systems using five test methods (Table A1, Appendix A). The differing sources of these data make it difficult to pinpoint the exact reasons for the scatter, thus limiting the quantitative value of the data. Moreover, fracture mechanics-based tools are being made available in finite element analysis codes, such as ABAQUS®1/Standard, which enable simulation of processes such as delamination and facesheet/core debonding. The accuracy, however, of such simulations resides significantly with the reliability of fracture criteria, such as debond toughness in the case of facesheet/core peel, that are used in these fracture mechanics tools. Consequently, a
1 ABAQUS® is manufactured by Dassault Systèmes Simulia Corp. (DSS), Providence, RI, USA
4
clear motivation exists for establishing a standardized test procedure for characterizing facesheet/core debonding, which is capable of producing reliable values of debond toughness. The data reduction method for calculating debond toughness using data from such a test must involve simple, closed-form calculations. The test specimen and procedure must also be simple, in order to minimize potential differences that may arise from tests being conducted at different laboratories.
An inspection of developed test methods indicates a number of specimens that may exhibit the required attributes for a standardized test. In fact, a recent study evaluated the suitability of five of these test methods for measuring debond toughness associated with facesheet/core peel [4]. A SCB type specimen, with a configuration identical to that shown in Fig. 1a was identified as the most appropriate test for standardization. However, an appropriate protocol for conducting this test as part of a standardized test procedure has yet to be established. Therefore, the objective of the current work is to begin the protocol development by establishing a systematic method for determining appropriate dimensions of the SCB specimen.
This technical publication includes the following sections. Section 2 discusses the selection of the SCB specimen as an appropriate test for standardization. Section 3 summarizes a sample set of sandwich systems that will be applied to the SCB specimen sizing method developed in Section 4. The resulting specimen dimensions are discussed in Section 5, followed by a summary of this work in Section 6.
2 Selection of SCB Test for Standardization 2.1 General Procedure of a Facesheet/Core Peel Test
The overall purpose of the proposed standardized test is to measure the static debond toughness associated with a facesheet peeling from the core of a sandwich beam. The general test procedure is analogous to that used for characterizing mode I delamination resistance in composite laminates, as employed in ASTM International Test Method D5528-01©2 [24]. A sandwich beam is prepared with a facesheet/core debond of initial length, a0, at one interface (see Fig. 1a). The specimen is loaded under displacement control (at a quasi-static displacement rate) until the debond is grown to a certain length, after which the specimen is unloaded. Applied force, P, and corresponding load point displacement values, δ, are recorded at several increments of debond growth, as shown in the force-displacement response illustrated in Fig. 2. The corresponding specimen compliance, C, is then calculated at the debond growth increments using the relationship, C=δ/P. This method for calculating specimen compliance is only valid for specimens that respond in a linear elastic manner. Furthermore, if the machine compliance is suspected to be significant, this must be subtracted from the compliance values measured during the SCB test. Machine compliance is typically measured by testing a rigid, replica specimen. Linear elastic fracture mechanics is used to compute the debond toughness, Gc, from the following relation [25]:
2 Copyright © ASTM International, 100 Barr Harbor Drive, PO Box C700, West Conshohocken, PA 19428-2959, USA
5
!
Gc =Pc
2
2bdCda
(1)
where Pc is the force at the onset of debond growth, and b is the specimen width. The derivative, dC/da, is evaluated from the compliance/debond length relationship measured using the test. Although the loading conditions at the debond front are likely to be mode I dominated, the mismatch in modulus between the core and facesheet surrounding the debond act to couple the normal and shear deformations ahead of the debond front [26]. Consequently, there will not be a pure mode I loading condition along the debond front in a sandwich specimen. For this reason, debond toughness is generally referred to as Gc, rather than GIc (for example, see Ref. 7).
Values of debond toughness are computed for each debond length increment, at which specimen compliance was measured, thus establishing the relationship between debond toughness and debond length. This relationship is analogous to an R-curve measured from DCB tests conducted on monolithic laminates. 2.2 Conditions Necessary for a Standardized Test
An ideal standardized test will satisfy the following conditions: I. Complexity of the test apparatus and procedure must be minimized. II. The data reduction method used for computing Gc should not require detailed
stress analyses, such as a finite element calculation. Solutions for specimen compliance should be closed-form.
III. Specimen loading must be mode I dominated, and this condition should be insensitive to debond length.
IV. The test must result in debond growth either at, or in the vicinity of the facesheet/core interface, parallel to the plane of the interface.
V. Debond growth must be stable, although stick-slip growth may be permitted. VI. Specimen response must be linear-elastic and must be appropriate for analysis
using linear elastic fracture mechanics (LEFM). VII. The test must result in the measurement of quasi-static values of Gc, including
an initiation value and subsequent propagation values. VIII. It must be possible to test a practical range of sandwich systems.
In the following section, the SCB test that is being considered for standardization is
described. Arguments are put forward supporting the assertions that this test is appropriate for standardization. 2.3 Single Cantilever Beam Test
A schematic of the SCB test being considered for standardization is presented in Fig. 1a. The general test procedure involving this specimen is identical to that detailed in Section 2.1. During this test, the load application point is vertically offset from the specimen via a loading rod that connects the piano hinge bonded to the specimen to the
6
crosshead of the test machine (see Fig. 1a). The end of the loading rod attached to the crosshead is connected using a pinned configuration, thus preventing development of a moment arm in the rod. The purpose of offsetting the load application point is to ensure that loading remains essentially vertical during a test, thus preventing the accumulation of shear deformation in the core, which could introduce an unwanted mode II component of loading along the debond front.
Previous investigations using this SCB specimen, and other specimen configurations, have made use of the following form for the specimen compliance solution [6-8]:
!
CSCB = m a + "( )3 (2) where the parameters m and Δ are dependent on the sandwich system tested, and are evaluated from the relationship between C1/3 and debond length, as illustrated in Fig. 3. Substituting Eq. 2 into Eq. 1 for the derivative, dC/da, gives the expression used for calculating Gc:
!
Gc =3Pc"c
2b a + #( ) (3)
The first two conditions for standardization (Section 2.2) are satisfied by the SCB
specimen, because it uses a simple test apparatus, and a straightforward, closed form data reduction method for calculating Gc, as discussed above. Furthermore, a recent investigation [4] applied the SCB test to characterizing facesheet/core peel in polyurethane foam and Nomex®3 honeycomb-based sandwich systems (both reinforced with carbon/epoxy facesheets). The response of SCB specimens made from both sandwich systems was found to be linear elastic, and debond growth was found to be stable in the Nomex® honeycomb specimens. Debond growth in the foam specimens exhibited a stick slip behavior, where growth took place in several discrete increments. In all cases, the debond grew parallel to the facesheet/core just within the core material (sub-interface debond). The measured compliance/debond length relationship of both sandwich systems was found to adopt the form given in Eq. 2.
A series of finite element analyses of the SCB specimen was also conducted during this study [4]. Results from these analyses indicated that the debond front loading conditions of the SCB specimen are mode I dominated, and are not significantly affected by debond length.
In summary, general observations indicate that the SCB specimen will likely satisfy all eight conditions necessary for standardization.
As noted in the introduction, a number of variations of the SCB specimen have also been developed [4, 6, 9-12]. Schematics of these tests are presented in Fig. 4. A brief examination of these specimens reveals that all of these alternate tests exhibit some feature that precludes them from being considered for standardization. For instance, the debond front loading conditions of the specimen illustrated in Fig. 4a have been shown to vary significantly with debond length [6]. Tests conducted on Nomex® honeycomb based sandwich systems using the specimen illustrated in Fig. 4b [4] resulted in kinking
3 Nomex® is a registered trademark of E.I DuPont de Nemours, Wilmington, DE, USA
7
of the debond into the core material. Due to it’s similarity with the latter specimen, the specimen illustrated in Fig. 4c [9] is also likely to result in a similar kind of debond growth behavior. The tilted sandwich debond (TSD) specimen illustrated in Fig. 4d [10] involves tilting the specimen, as shown in the figure, resulting in axial loading of the facesheet, and the introduction of shear loading along the debond front. Consequently, this specimen will not impart the desired form of peel loading into the specimen. The two remaining SCB type specimens illustrated in Figs. 4e and 4f rely on a carriage system for ensuring that load application remains vertical during a test [11-12]. Although these tests appear to yield reasonable measurements of Gc, the added complexity of a carriage system should be avoided in a standardized test if another option exists. In this case, the specimen illustrated in Fig. 1 provides a better option.
A series of specimens based on a DCB configuration has also been proposed for characterizing facesheet/core peel [7, 13-15]. These test configurations are illustrated in Fig. 5. A common feature of all the DCB type specimens is that a bending moment is imparted in the core below the unbonded portion of the specimen, resulting in the development of axial tensile stresses in the core material, around the location of the debond. Tests conducted on a balsa-based sandwich system using the configuration shown in Fig. 5b, for instance, resulted in kinking of the debond into the core material [16], which was attributed to the tensile stresses developed in the core. Consequently, all DCB-based specimens are considered to be unsuitable for standardization.
Two additional test methods are available for characterizing facesheet/core peel. Schematics of the corresponding specimen configurations are presented in Fig. 6. The first of these specimens is the climbing drum peel test [2] (Fig. 6a). As mentioned in the introduction, recent work has been conducted that suggested this test could be used to evaluate Gc associated with facesheet/core peel [3]. The test apparatus, however, is too complex, and the test is also limited to sandwich configurations containing thin facesheets. Questions also remain, regarding the validity of using such a method for measuring debond toughness, when the test involves energy dissipating mechanisms in addition to debond growth. A center notch flexure (CNF) test is a simplified alternative to this test [17 and 18] (Fig. 6b). However, the CNF test works on the assumption that debonding will take place symmetrically, about a centrally-located loading pin. This is unlikely to take place in reality, as observed during similar tests [19]. Subsequently, debond toughness measurements from this test are also likely to be questionable.
To summarize, the SCB specimen illustrated in Fig. 1a is the only test that appears to satisfy the conditions necessary for standardization, and is therefore deemed to be the most appropriate test specimen of those proposed in the literature. The validity of the data reduction method proposed for use with this test, however, relies upon the SCB specimen dimensions and other test parameters being kept within specific limits. These limits are dependent on the sandwich system being tested. Section 4 discusses these limitations and proposes an efficient specimen sizing methodology (Section 4.4) for selecting appropriate specimen dimensions for a given sandwich system.
8
3 Sandwich Systems
The specimen sizing procedure developed in Section 4 is applied to a range of sandwich systems thought likely to be tested using the SCB specimen. This study was conducted to ensure the procedure yields specimen dimensions that are practical for SCB testing. This section details these sandwich systems.
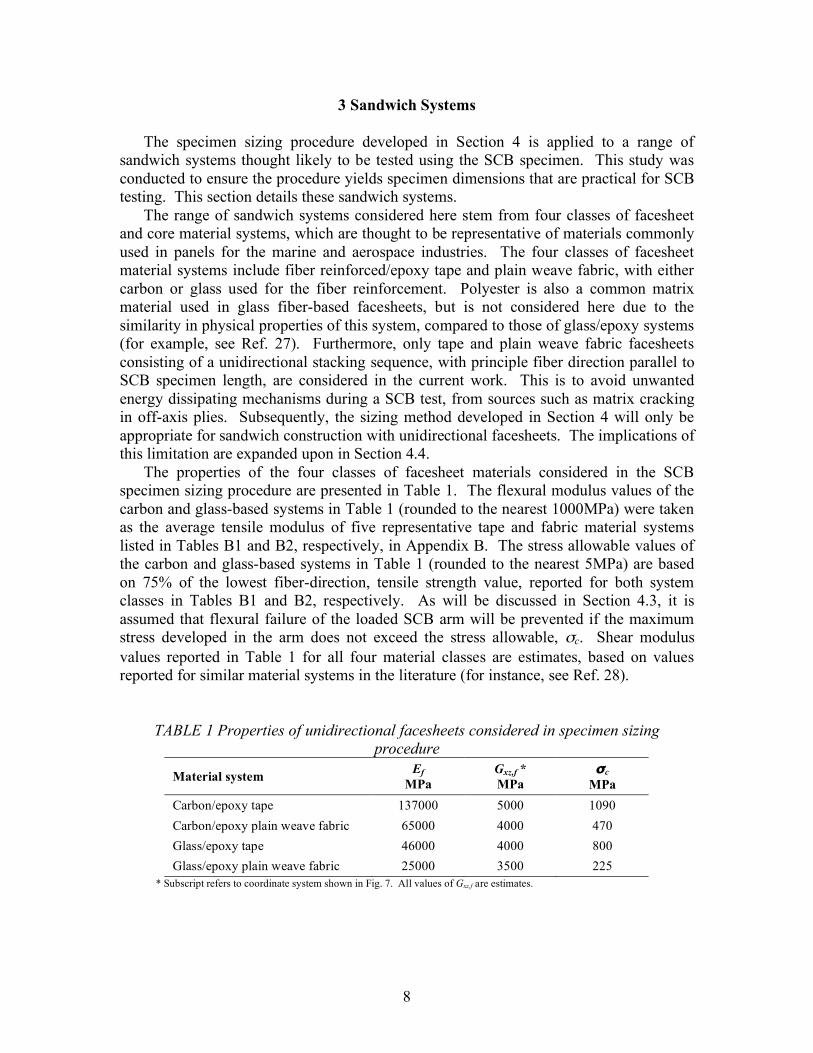
The range of sandwich systems considered here stem from four classes of facesheet and core material systems, which are thought to be representative of materials commonly used in panels for the marine and aerospace industries. The four classes of facesheet material systems include fiber reinforced/epoxy tape and plain weave fabric, with either carbon or glass used for the fiber reinforcement. Polyester is also a common matrix material used in glass fiber-based facesheets, but is not considered here due to the similarity in physical properties of this system, compared to those of glass/epoxy systems (for example, see Ref. 27). Furthermore, only tape and plain weave fabric facesheets consisting of a unidirectional stacking sequence, with principle fiber direction parallel to SCB specimen length, are considered in the current work. This is to avoid unwanted energy dissipating mechanisms during a SCB test, from sources such as matrix cracking in off-axis plies. Subsequently, the sizing method developed in Section 4 will only be appropriate for sandwich construction with unidirectional facesheets. The implications of this limitation are expanded upon in Section 4.4.
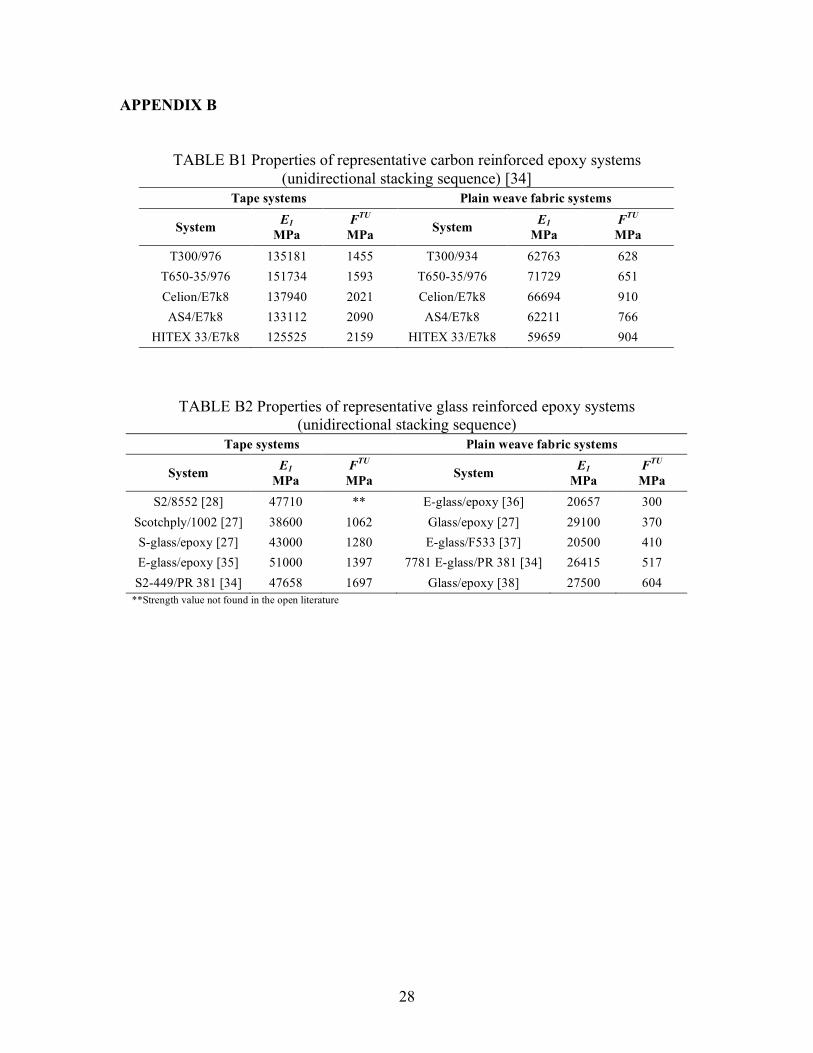
The properties of the four classes of facesheet materials considered in the SCB specimen sizing procedure are presented in Table 1. The flexural modulus values of the carbon and glass-based systems in Table 1 (rounded to the nearest 1000MPa) were taken as the average tensile modulus of five representative tape and fabric material systems listed in Tables B1 and B2, respectively, in Appendix B. The stress allowable values of the carbon and glass-based systems in Table 1 (rounded to the nearest 5MPa) are based on 75% of the lowest fiber-direction, tensile strength value, reported for both system classes in Tables B1 and B2, respectively. As will be discussed in Section 4.3, it is assumed that flexural failure of the loaded SCB arm will be prevented if the maximum stress developed in the arm does not exceed the stress allowable, σc. Shear modulus values reported in Table 1 for all four material classes are estimates, based on values reported for similar material systems in the literature (for instance, see Ref. 28).
TABLE 1 Properties of unidirectional facesheets considered in specimen sizing procedure
Material system Ef MPa
Gxz,f * MPa
σc MPa
Carbon/epoxy tape 137000 5000 1090 Carbon/epoxy plain weave fabric 65000 4000 470 Glass/epoxy tape 46000 4000 800 Glass/epoxy plain weave fabric 25000 3500 225
* Subscript refers to coordinate system shown in Fig. 7. All values of Gxz,f are estimates.
9
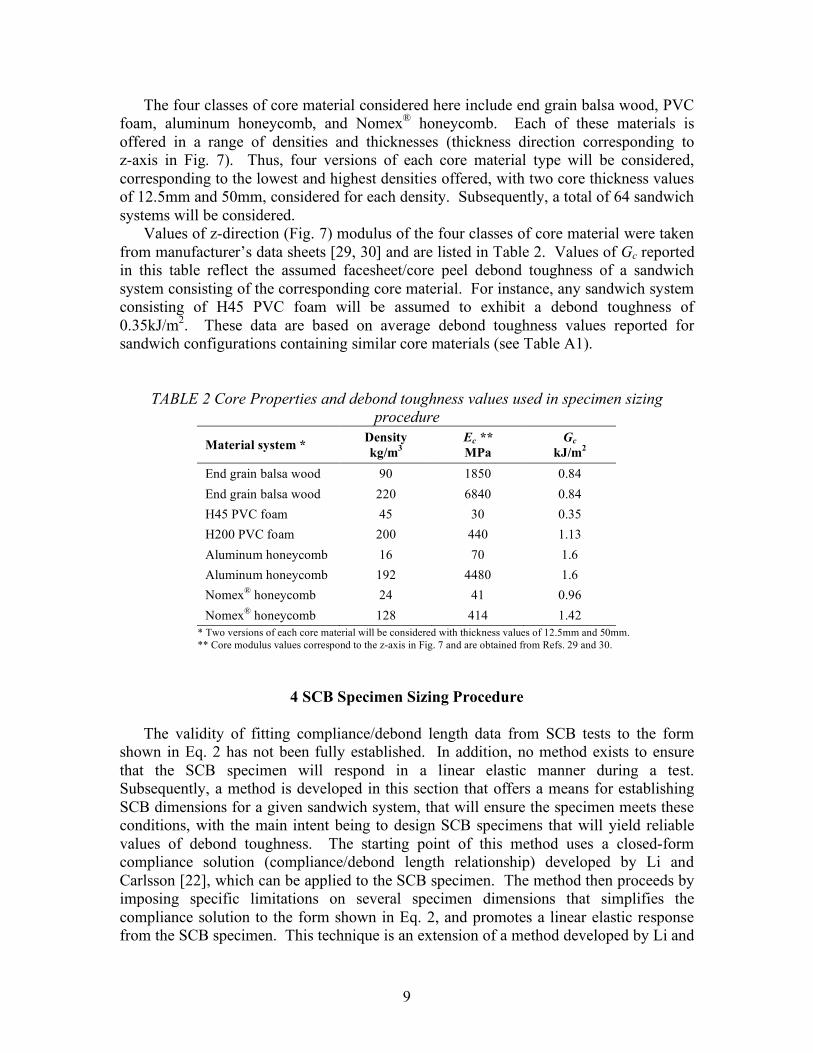
The four classes of core material considered here include end grain balsa wood, PVC foam, aluminum honeycomb, and Nomex® honeycomb. Each of these materials is offered in a range of densities and thicknesses (thickness direction corresponding to z-axis in Fig. 7). Thus, four versions of each core material type will be considered, corresponding to the lowest and highest densities offered, with two core thickness values of 12.5mm and 50mm, considered for each density. Subsequently, a total of 64 sandwich systems will be considered.
Values of z-direction (Fig. 7) modulus of the four classes of core material were taken from manufacturer’s data sheets [29, 30] and are listed in Table 2. Values of Gc reported in this table reflect the assumed facesheet/core peel debond toughness of a sandwich system consisting of the corresponding core material. For instance, any sandwich system consisting of H45 PVC foam will be assumed to exhibit a debond toughness of 0.35kJ/m2. These data are based on average debond toughness values reported for sandwich configurations containing similar core materials (see Table A1).
TABLE 2 Core Properties and debond toughness values used in specimen sizing procedure
Material system * Density kg/m3
Ec ** MPa
Gc kJ/m2
End grain balsa wood 90 1850 0.84 End grain balsa wood 220 6840 0.84 H45 PVC foam 45 30 0.35 H200 PVC foam 200 440 1.13 Aluminum honeycomb 16 70 1.6 Aluminum honeycomb 192 4480 1.6 Nomex® honeycomb 24 41 0.96 Nomex® honeycomb 128 414 1.42
* Two versions of each core material will be considered with thickness values of 12.5mm and 50mm. ** Core modulus values correspond to the z-axis in Fig. 7 and are obtained from Refs. 29 and 30.
4 SCB Specimen Sizing Procedure
The validity of fitting compliance/debond length data from SCB tests to the form shown in Eq. 2 has not been fully established. In addition, no method exists to ensure that the SCB specimen will respond in a linear elastic manner during a test. Subsequently, a method is developed in this section that offers a means for establishing SCB dimensions for a given sandwich system, that will ensure the specimen meets these conditions, with the main intent being to design SCB specimens that will yield reliable values of debond toughness. The starting point of this method uses a closed-form compliance solution (compliance/debond length relationship) developed by Li and Carlsson [22], which can be applied to the SCB specimen. The method then proceeds by imposing specific limitations on several specimen dimensions that simplifies the compliance solution to the form shown in Eq. 2, and promotes a linear elastic response from the SCB specimen. This technique is an extension of a method developed by Li and
10
Carlsson, used to establish specimen length and debond length of TSD specimens [22]. The resulting method, described at the end of this section (Section 4.4), provides a means for establishing the following dimensions of a SCB specimen made from any sandwich system:
• a0 Initial debond length (debond length at beginning of test) • amax Maximum debond length • Lmin Minimum specimen length • tf Facesheet thickness • hp Load rod length
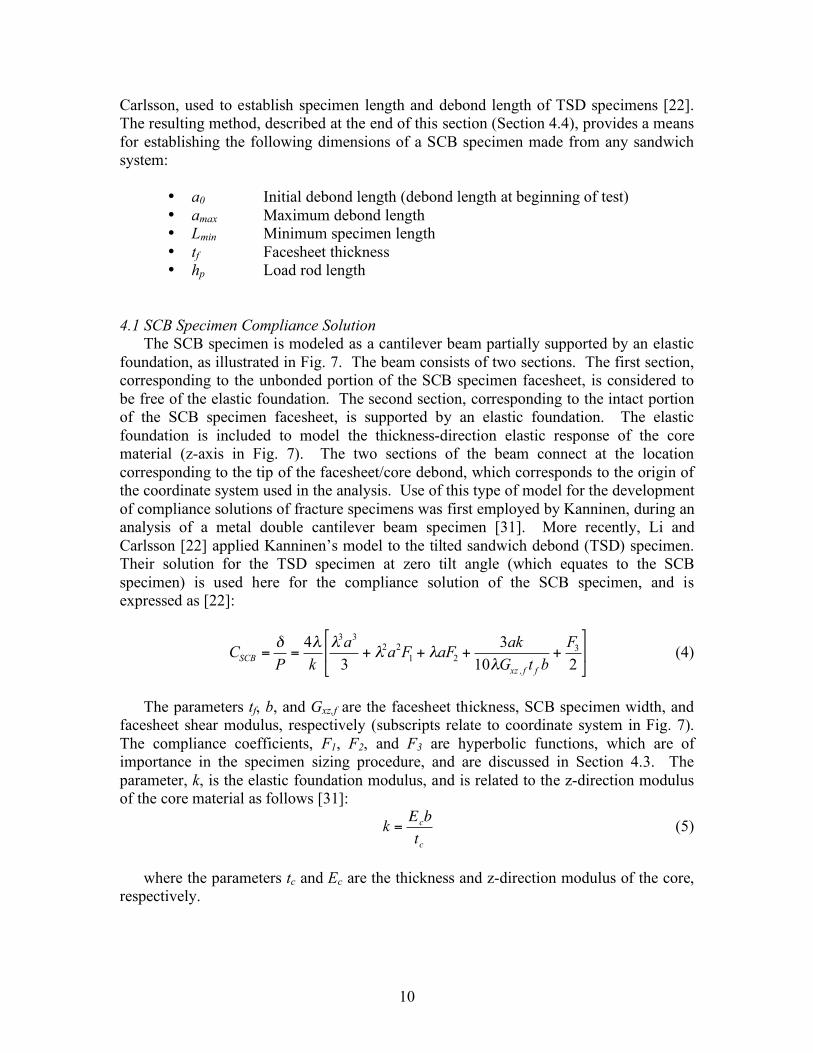
4.1 SCB Specimen Compliance Solution
The SCB specimen is modeled as a cantilever beam partially supported by an elastic foundation, as illustrated in Fig. 7. The beam consists of two sections. The first section, corresponding to the unbonded portion of the SCB specimen facesheet, is considered to be free of the elastic foundation. The second section, corresponding to the intact portion of the SCB specimen facesheet, is supported by an elastic foundation. The elastic foundation is included to model the thickness-direction elastic response of the core material (z-axis in Fig. 7). The two sections of the beam connect at the location corresponding to the tip of the facesheet/core debond, which corresponds to the origin of the coordinate system used in the analysis. Use of this type of model for the development of compliance solutions of fracture specimens was first employed by Kanninen, during an analysis of a metal double cantilever beam specimen [31]. More recently, Li and Carlsson [22] applied Kanninen’s model to the tilted sandwich debond (TSD) specimen. Their solution for the TSD specimen at zero tilt angle (which equates to the SCB specimen) is used here for the compliance solution of the SCB specimen, and is expressed as [22]:
!
CSCB ="P
=4#k
#3a3
3+ #2a2F1 + #aF2 +
3ak10#Gxz , f t f b
+F3
2
$
% &
'
( ) (4)
The parameters tf, b, and Gxz,f are the facesheet thickness, SCB specimen width, and
facesheet shear modulus, respectively (subscripts relate to coordinate system in Fig. 7). The compliance coefficients, F1, F2, and F3 are hyperbolic functions, which are of importance in the specimen sizing procedure, and are discussed in Section 4.3. The parameter, k, is the elastic foundation modulus, and is related to the z-direction modulus of the core material as follows [31]:
!
k =Ecbtc
(5)
where the parameters tc and Ec are the thickness and z-direction modulus of the core,
respectively.
11
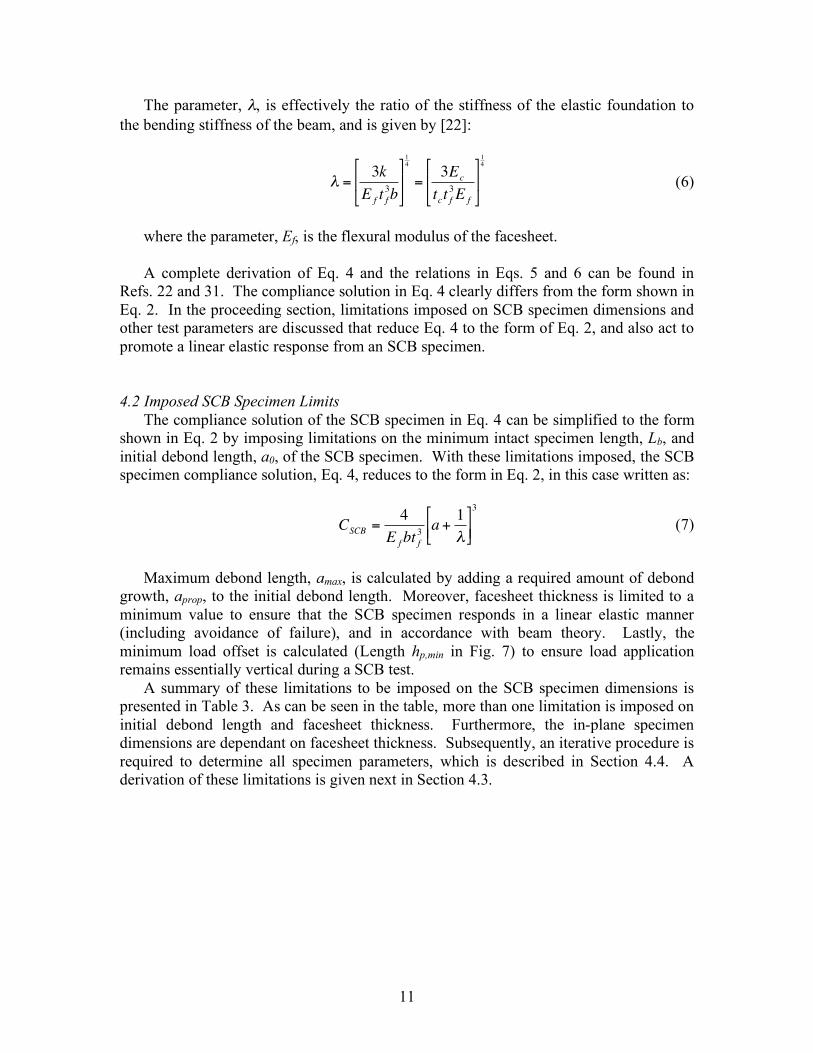
The parameter, λ, is effectively the ratio of the stiffness of the elastic foundation to the bending stiffness of the beam, and is given by [22]:
!
" =3k
E f t f3b
#
$ %
&
' (
14
=3Ec
tct f3E f
#
$ %
&
' (
14
(6)
where the parameter, Ef, is the flexural modulus of the facesheet.
A complete derivation of Eq. 4 and the relations in Eqs. 5 and 6 can be found in
Refs. 22 and 31. The compliance solution in Eq. 4 clearly differs from the form shown in Eq. 2. In the proceeding section, limitations imposed on SCB specimen dimensions and other test parameters are discussed that reduce Eq. 4 to the form of Eq. 2, and also act to promote a linear elastic response from an SCB specimen. 4.2 Imposed SCB Specimen Limits
The compliance solution of the SCB specimen in Eq. 4 can be simplified to the form shown in Eq. 2 by imposing limitations on the minimum intact specimen length, Lb, and initial debond length, a0, of the SCB specimen. With these limitations imposed, the SCB specimen compliance solution, Eq. 4, reduces to the form in Eq. 2, in this case written as:
!
CSCB =4
E fbt f3 a +
1"
#
$ % &
' (
3
(7)
Maximum debond length, amax, is calculated by adding a required amount of debond
growth, aprop, to the initial debond length. Moreover, facesheet thickness is limited to a minimum value to ensure that the SCB specimen responds in a linear elastic manner (including avoidance of failure), and in accordance with beam theory. Lastly, the minimum load offset is calculated (Length hp,min in Fig. 7) to ensure load application remains essentially vertical during a SCB test.
A summary of these limitations to be imposed on the SCB specimen dimensions is presented in Table 3. As can be seen in the table, more than one limitation is imposed on initial debond length and facesheet thickness. Furthermore, the in-plane specimen dimensions are dependant on facesheet thickness. Subsequently, an iterative procedure is required to determine all specimen parameters, which is described in Section 4.4. A derivation of these limitations is given next in Section 4.3.
12
TABLE 3 Summary of SCB specimen limitations SCB Specimen Parameter Limitation 1 Specimen width b ≥ 25mm or six honeycomb cell sizes
2 Minimum intact specimen length
!
Lb,min = 2.7tct f
3 Ef
3Ec
"
#
$ $
%
&
' '
14
3 Initial debond length to ensure bending is dominant deformation mode of facesheet
!
a0 " aminbending #
30Ef t f2
Gxz , f$ 0.59Lb,min
4 Initial debond length to ensure compliance adopts the form of Eq. 2
!
a0 " amincompliance = Lb,min
5 Maximum debond length to ensure a required amount of debond growth, aprop
!
amax " a0 + aprop
6 Minimum facesheet thickness to assume small deformation in linear analysis
!
t f " t fsmall disp =
amax
3amax2 Ef
200Gc
#
$
% %
&
'
( (
14
)tcEf
3Ec
#
$ % %
&
' ( (
14
*
+
, , , , , , ,
-
.
/ / / / / / /
43
7 Minimum facesheet thickness to prevent flexural failure of facesheet
!
t f " t fstrength #
6Ef Gcamax2
$ c2
amax +tc( t f
small disp )3 Ef
3Ec
%
&
' '
(
)
* *
14
+
,
- - - -
.
/
0 0 0 0
12
8 Minimum specimen length
!
Lmin " Lhinge + amax + Lb,min
9 Minimum load application offset to ensure vertical load application
!
hp,min " 1.062amax
4.3 Derivation of SCB Specimen Limitations
The numbers assigned to each limitation in this section correspond to the numbering used in Table 3. Limitation 1: SCB Specimen Width
The sizing method does not permit an evaluation of an appropriate value of specimen width. Instead, indications of an appropriate width are gleaned from previous tests. Tests conducted on foam and balsa-based sandwich systems using the SCB test (or similar variants) indicate that an adequate specimen width is on the order of 25 to 40 mm [4, 5, 9-11]. A complication arises if honeycomb core-based specimens are to be tested, where debonding is expected to take place within the core material. Although previous analyses have been conducted in which honeycomb structure was explicitly modeled in a simulation of facesheet/core peel [32], a method is lacking for determining an adequate number of honeycomb cells that should be present across the width of debond specimens, such as the SCB specimen. Such a method is deemed to be beyond the scope of the
13
current work. SCB type tests conducted on honeycomb-based specimens have tended to include 5-7 honeycomb cells across the specimen width, with reasonable specimen response [4,11,12]. It is therefore concluded here that honeycomb-based SCB specimens should include at least 6 cells across the specimen width. Limitation 2: Minimum Intact Specimen Length
The compliance coefficients of Eq. 4, F1, F2, and F3 consist of hyperbolic functions as shown in Eqs. 8 [31]:
!
F1 =sinh( "Lb )cosh( "Lb ) + sin( "Lb )cos( "Lb )
sinh2( "Lb )# sin2( "Lb )
F2 =sinh2( "Lb ) + sin2( "Lb )sinh2( "Lb )# sin2( "Lb )
F3 =sinh( "Lb )cosh( "Lb )# sin( "Lb )cos( "Lb )
sinh2( "Lb )# sin2( "Lb )
(8)
All three compliance coefficients reduce to, and remain at unity, as the product, λLb
increases, as illustrated in the plot of the three compliance coefficients versus λLb in Fig. 8. It was found that the compliance coefficients reduce to within 1% of unity when the product, λLb, reaches a value of 2.7. In relation to the actual SCB specimen, this observation implies that if the intact portion of the specimen, Lb, is kept above a minimum value that results in λLb ≥ 2.7, then the compliance coefficients will remain at unity. Imposing this limitation results in the minimum intact SCB specimen length [22]:
!
Lb,min =2.7"
= 2.7tct f
3E f
3Ec
#
$ %
&
' (
14
(9)
If this limitation is imposed, the compliance solution in Eq. 4 reduces to:
!
CSCB ="P
=4#k
#3a3
3+ #2a2 + #a +
3ak10#Gxz, f t f b
+12
$
% &
'
( ) (10)
Limitation 3: Minimum Debond Length Ensuring Bending is Dominant Deformation Mode
The initial debond length, a0, of a SCB specimen is governed by two separate limitations, as indicated in Table 3. The first of these limitations is that the deformation mode of the loaded facesheet be dominated by bending, as discussed in this section.
According to Eq. 10, both bending and shear deformation of the loaded facesheet contribute to the specimen compliance, with bending becoming the dominant deformation mode as debond length increases. Subsequently, a minimum debond length
14
can be calculated, above which shear deformation can be ignored, as follows. The term associated shear deformation of the facesheet in Eq. 10 is:
!
Cshear =6a
5Gxz, f t f b (11)
It is assumed that this shear deformation term can be neglected when it is 1% or less
of the specimen compliance assumed in Eq. 7. Dividing Eq. 11 by Eq. 7, this limitation can be expressed as:
!
3E f t f2a
10Gxz, f a +1"
#
$ % &
' (
3 =1100
(12)
Solving Eq. 12 for debond length, a, will result in the minimum debond length
necessary to ensure that bending dominates facesheet deformation. However, establishing the exact solutions to Eq. 12 is not practical for use in a standardized test protocol. Instead, an approximate solution is proposed, as follows. Rearranging Eq. 12 for debond length, a, gives:
!
a + 1"[ ]
3
a=
30Ef t f2
Gxz , f
(13)
The following approximation to the left hand side of Eq. 13 is assumed to be
reasonable:
!
a + 1"[ ]3
a# a +
B"
$
% &
'
( ) 2
(14)
where the term, B, is a fit parameter aimed at minimizing error in the above
approximation. Subsequently, rearranging Eq. 14 yields an approximation of debond length:
!
aapprox "aexact + 1
#[ ]3
aexact
$B#
(15)
The fit parameter, B, was evaluated by applying the approximation to a hypothetical
sandwich panel. Details of the panel are shown in the table in Fig. 9. In this figure, the approximation in Eq. 15 is plotted versus exact debond length, for three values of the fit parameter, namely B=1.0, 1.6, and 2.2. The result in Fig. 9 shows that the approximate solution agrees with the exact solution of debond length to within 1%, for debond lengths greater than 36mm, when the fit parameter is equal to 1.6. In this specific example, using the sizing procedure proposed here, the minimum debond length suggested for a SCB specimen is 54 mm. Thus, in this instance, the approximation for debond length will be
15
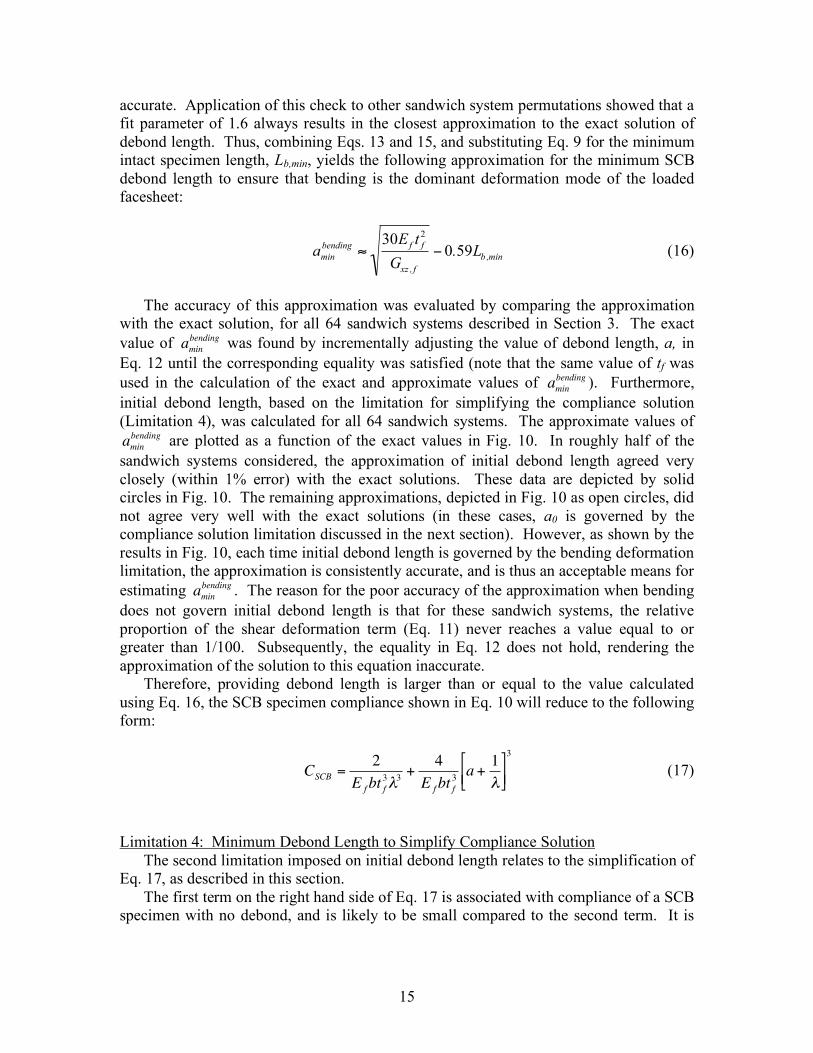
accurate. Application of this check to other sandwich system permutations showed that a fit parameter of 1.6 always results in the closest approximation to the exact solution of debond length. Thus, combining Eqs. 13 and 15, and substituting Eq. 9 for the minimum intact specimen length, Lb,min, yields the following approximation for the minimum SCB debond length to ensure that bending is the dominant deformation mode of the loaded facesheet:
!
aminbending "
30Ef t f2
Gxz , f
# 0.59Lb ,min (16)
The accuracy of this approximation was evaluated by comparing the approximation
with the exact solution, for all 64 sandwich systems described in Section 3. The exact value of
!
aminbending was found by incrementally adjusting the value of debond length, a, in
Eq. 12 until the corresponding equality was satisfied (note that the same value of tf was used in the calculation of the exact and approximate values of
!
aminbending ). Furthermore,
initial debond length, based on the limitation for simplifying the compliance solution (Limitation 4), was calculated for all 64 sandwich systems. The approximate values of
!
aminbending are plotted as a function of the exact values in Fig. 10. In roughly half of the
sandwich systems considered, the approximation of initial debond length agreed very closely (within 1% error) with the exact solutions. These data are depicted by solid circles in Fig. 10. The remaining approximations, depicted in Fig. 10 as open circles, did not agree very well with the exact solutions (in these cases, a0 is governed by the compliance solution limitation discussed in the next section). However, as shown by the results in Fig. 10, each time initial debond length is governed by the bending deformation limitation, the approximation is consistently accurate, and is thus an acceptable means for estimating
!
aminbending . The reason for the poor accuracy of the approximation when bending
does not govern initial debond length is that for these sandwich systems, the relative proportion of the shear deformation term (Eq. 11) never reaches a value equal to or greater than 1/100. Subsequently, the equality in Eq. 12 does not hold, rendering the approximation of the solution to this equation inaccurate.
Therefore, providing debond length is larger than or equal to the value calculated using Eq. 16, the SCB specimen compliance shown in Eq. 10 will reduce to the following form:
!
CSCB =2
E fbt f3"3
+4
E fbt f3 a +
1"
#
$ % &
' (
3
(17)
Limitation 4: Minimum Debond Length to Simplify Compliance Solution
The second limitation imposed on initial debond length relates to the simplification of Eq. 17, as described in this section.
The first term on the right hand side of Eq. 17 is associated with compliance of a SCB specimen with no debond, and is likely to be small compared to the second term. It is
16
assumed here that the first term can be ignored if it is 1% or less of the second term in Eq. 17. This condition can be written as:
!
2E fbt f
3"3
4E fbt f
3 a +1"
#
$ % &
' (
3 )1100
(18)
Solving Eq. 18 for debond length yields the minimum debond length necessary to
ensure the first term on the right hand side of Eq. 17 is negligible:
!
amincompliance = 2.7
tct f3 Ef
3Ec
"
# $ $
%
& ' '
14
= Lb ,min (19)
Providing the debond length is kept above the minimum length in Eq. 19, the SCB
specimen compliance solution in Eq. 17 simplifies to that shown in Eq. 7, thereby satisfying the requirement that the SCB specimen compliance solution adopts the form shown in Eq. 2.
It is noted that the actual initial debond length of the SCB specimen, a0, must be the largest of the two values computed using Eqs. 16 and 19. This will ensure that both Limitations 3 and 4 are satisfied. Limitation 5: Maximum Debond Length
The maximum debond length is determined by summing the initial debond length with the amount of propagation required during a test. An adequate amount of growth, aprop, is needed to enable use of the data reduction method introduced in Section 2.3. Previous tests on similar specimens have indicated that a sufficient amount of growth would be approximately 50mm for stable growth [4,5,9,11,12] and approximately 80mm when debond growth exhibits stick-slip behavior [4,10,22]. The maximum debond length is therefore given by:
!
amax = a0 + a prop (20)
where a0 is the largest of the two values calculated using Eqs. 16 and 19. Limitation 6: Minimum Facesheet Thickness to Ensure Small Displacements
As the compliance solution to be used for the SCB specimen (Eq. 7) is founded upon beam theory, the amount of load point displacement applied to the SCB specimen must be limited to ensure the small displacement assumptions used in beam theory are not violated. Previous analyses [33] of the DCB specimen used in ASTM International test method D5528©, indicated that specimen response will remain in accordance with beam theory, providing load point displacement does not exceed 40% of the delamination length. Given that only one arm is deformed in the SCB specimen, a reasonable limitation on load point displacement would be 20% of the debond length. The following
17
method is used to ensure this limitation is imposed. From Eqs. 1 and 7, the load point displacement of the SCB specimen at the onset of debond growth is:
!
"c =2bGc
3Pca +
1#
$
% &
'
( ) (21)
where the parameter, Gc, is the debond toughness of the SCB specimen and Pc is the
applied force at the onset of debond growth, given by:
!
Pc =E fb
2t f3Gc
6 a +1"
#
$ %
&
' (
(22)
Substituting Eq. 22 into Eq. 21 for Pc, and dividing by debond length, leads to the
following expression for limiting the load point displacement to 20% of the corresponding debond length:
!
"c
a=
24Gc
9Ef t f3
1a
a +1#
$
% &
'
( )
2
= 0.2 (23)
Substituting Eq. 6 into Eq. 23 for λ, and then rearranging Eq. 23 for facesheet
thickness, gives the minimum facesheet thickness necessary to ensure the load point displacement does not exceed 20% of the debond length:
!
t fsmall disp =
amax
3amax2 Ef
200Gc
"
# $ $
%
& ' '
14
(tcEf
3Ec
"
# $
%
& '
14
)
*
+ + + + + +
,
-
.
.
.
.
.
.
43
(24)
Limitation 7: Minimum Facesheet Thickness to Prevent Arm Failure
In this case, beam theory is used to ensure that the thickness of the loaded SCB specimen facesheet is sufficient to prevent arm failure during a test. According to beam theory, the maximum bending stress in the loaded facesheet at the onset of debond growth is:
!
" b , f =6Ef Gc
t f
amax
amax +tct f
3 Ef
3Ec
#
$ % %
&
' ( (
14
)
*
+ + +
,
-
.
.
.
(25)
18
The solution to Eq. 25 for facesheet thickness is not practical for use in a standardized test protocol. Alternatively, an approximate solution to Eq. 25 for facesheet thickness is proposed, as follows. A value of facesheet thickness has already been established, on the basis of the small displacement requirement, as described in the previous section. This value is used in the rearrangement of Eq. 25, yielding an approximation of facesheet thickness required to prevent arm failure:
!
t fstrength "
6Ef Gcamax2
# c2 amax +
tc( t fsmall disp )3 Ef
3Ec
$
% & &
'
( ) )
14
*
+
, , ,
-
.
/ / /
02
(26)
where the parameter, σc, is an allowable stress that may be experienced by the loaded
arm without failure occurring. Values of this stress allowable for each class of facesheet material considered here are listed in Table 1. It is noted that the stress allowable values of all the unidirectional facesheets considered here were sufficiently high to ensure that facesheet thickness is always governed by the small displacement limitation (Limitation 6), as detailed in the following discussion.
The accuracy of the approximation in Eq. 26 was evaluated by comparing the approximation with the exact solution, for all 64 sandwich systems described in Section 3. The exact value of
!
t fstrength was evaluated by incrementally adjusting the value
of facesheet thickness, tf, in Eq. 25 until the stress was found to be equal to the stress allowable corresponding to the facesheet material being considered (note that the same value of amax was used in the calculation of the exact and approximate values of
!
t fstrength).
The approximate values of
!
t fstrength are plotted as a function of the exact values in Fig. 11.
In the majority of cases, the approximation is reasonably accurate (within 10% of the exact values), however, in a small number of cases, the difference was on the order of 25%. That being said, in all 64 sandwich configurations considered here, the minimum facesheet thickness required to prevent arm failure (using exact solution to Eq. 25) was always smaller than that needed to satisfy the small displacement requirement (Limitation 6). Hence, it is probable that the small displacement requirement will always dictate facesheet thickness of the SCB specimen. Of course, if facesheet thickness is governed by the prevention of arm failure, and there is concern regarding the accuracy of the approximate solution, the exact solution can always be found by solving Eq. 25 incrementally. Limitation 8: Minimum SCB Specimen Length
The minimum required SCB specimen length is the sum of the three separate sections illustrated in Fig. 7. The first is the specimen length required for the piano hinge to be bonded to the specimen. The second section is the maximum debond length, and the third section is the minimum required intact specimen length.
!
Lmin = Lhinge + amax + Lb ,min (27)
19
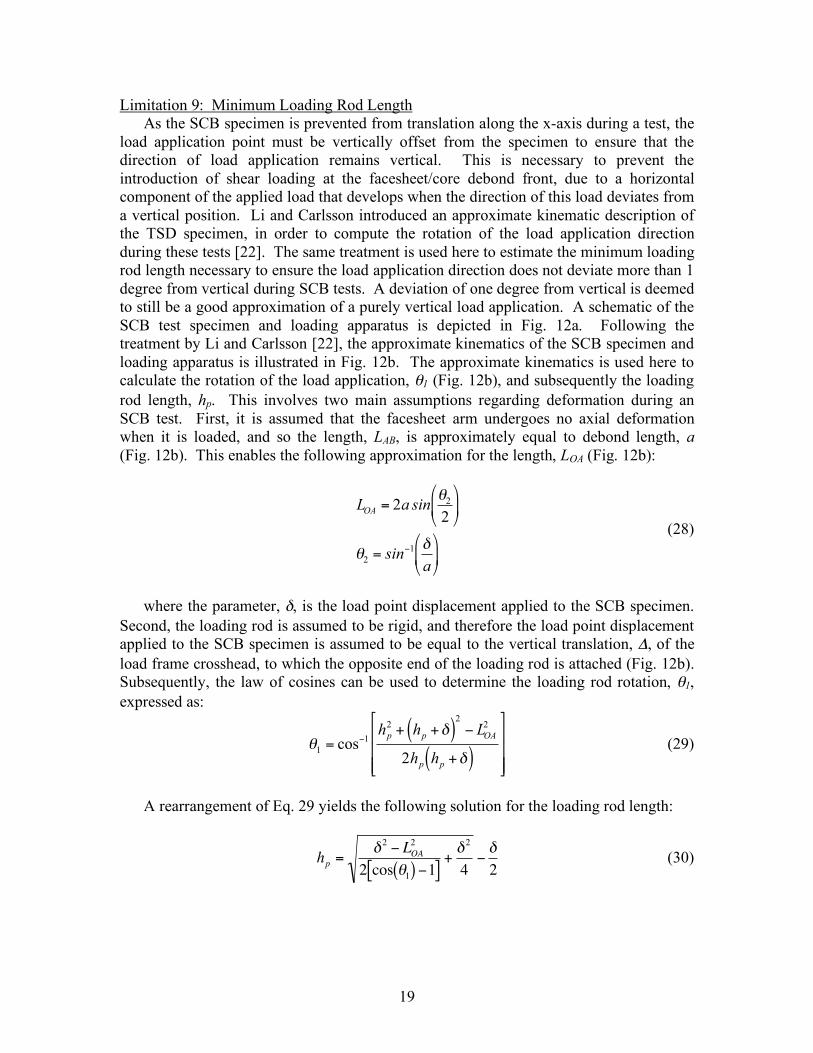
Limitation 9: Minimum Loading Rod Length As the SCB specimen is prevented from translation along the x-axis during a test, the
load application point must be vertically offset from the specimen to ensure that the direction of load application remains vertical. This is necessary to prevent the introduction of shear loading at the facesheet/core debond front, due to a horizontal component of the applied load that develops when the direction of this load deviates from a vertical position. Li and Carlsson introduced an approximate kinematic description of the TSD specimen, in order to compute the rotation of the load application direction during these tests [22]. The same treatment is used here to estimate the minimum loading rod length necessary to ensure the load application direction does not deviate more than 1 degree from vertical during SCB tests. A deviation of one degree from vertical is deemed to still be a good approximation of a purely vertical load application. A schematic of the SCB test specimen and loading apparatus is depicted in Fig. 12a. Following the treatment by Li and Carlsson [22], the approximate kinematics of the SCB specimen and loading apparatus is illustrated in Fig. 12b. The approximate kinematics is used here to calculate the rotation of the load application, θ1 (Fig. 12b), and subsequently the loading rod length, hp. This involves two main assumptions regarding deformation during an SCB test. First, it is assumed that the facesheet arm undergoes no axial deformation when it is loaded, and so the length, LAB, is approximately equal to debond length, a (Fig. 12b). This enables the following approximation for the length, LOA (Fig. 12b):
!
LOA = 2a sin "2
2#
$ %
&
' (
"2 = sin)1 *a#
$ % &
' (
(28)
where the parameter, δ, is the load point displacement applied to the SCB specimen.
Second, the loading rod is assumed to be rigid, and therefore the load point displacement applied to the SCB specimen is assumed to be equal to the vertical translation, Δ, of the load frame crosshead, to which the opposite end of the loading rod is attached (Fig. 12b). Subsequently, the law of cosines can be used to determine the loading rod rotation, θ1, expressed as:
!
"1 = cos#1hp
2 + hp +$( )2# LOA
2
2hp hp +$( )
%
&
' ' '
(
)
* * * (29)
A rearrangement of Eq. 29 yields the following solution for the loading rod length:
!
hp =" 2 # LOA
2
2 cos $1( ) #1[ ]+" 2
4#"2
(30)
20
Thus, the minimum loading rod length, necessary to ensure the direction of the applied load does not deviate more than 1 degree from the vertical position (θ1 = 1°), can be calculated using the following expression:
!
hp,min ="c2 # LOA
2
2 cos 1o( ) #1[ ]+"c2
4#"c2
(31)
Substituting Eq. 9 into Eq. 23 for λ yields the displacement at the onset of debond
growth, δc,:
!
"c =24Gc
9E f t f3 amax + 0.37Lb,min( )2 (32)
It may not be obvious from Eqs. 31 and 32, however, when δc/amax is limited to a
maximum value of 0.2 (as is the case in this sizing procedure, see Limitation 6), hp,min is dominated by amax. Figure 13 contains a plot of hp,min versus amax (data from Table 4, Section 5), and shows this is indeed the case, where hp,min is linearly proportional to amax in the following manner:
!
hp ,min "1.062amax (33) 4.4 Computing SCB Specimen Dimensions
The following procedure is developed on the basis of the SCB specimen test limitations discussed in Sections 4.2 and 4.3. This procedure offers a systematic approach for determining appropriate dimensions of an SCB specimen, based on any sandwich system (assuming unidirectional tape or plain weave fabric facesheets), that should be well-suited to incorporation into a standardized testing protocol.
The following algorithm, based on the limitations summarized in Table 3, has been developed for calculating the dimensions of a SCB specimen.
1. Select values of Lhinge, tc, Ec, Gxz,f, Ef, Gc, aprop, σc, and initial value of tf. 2. Limitation 1: Determine specimen width, b 3. Limitation 2: Compute the minimum intact specimen length,
!
Lb,min. 4. Limitation 3: Compute initial debond length to ensure bending is the dominant
deformation mode of the loaded facesheet,
!
aminbending .
5. Limitation 4: Compute initial debond length for simplifying the compliance solution:
!
amincompliance.
6. Limitation 5: Compute maximum debond length, amax. 7. Limitation 6: Compute minimum facesheet thickness to ensure assumption of
small displacements is valid,
!
t fsmall disp.
8. Limitation 7: Compute minimum facesheet thickness necessary to prevent facesheet arm failure,
!
t fstrength.
21
9. Select
!
t f ,min (largest of the two values,
!
t fsmall disp and
!
t farm fail). If
!
t f ,min is greater than the initial value selected in Step 1, repeat Steps 3-8 with
!
t f = t f ,min . Otherwise, set tf =
!
t f ,min and proceed to Step 10. 10. Limitations 8 and 9: Compute minimum specimen length, Lmin , and loading rod
length, hp,min. 11. The resulting SCB specimen dimensions are therefore, b,
!
t f ,min , a0, amax, and Lmin, and hp,min.
The above procedure assumes that sandwich panels will be manufactured to the
computed dimensions. Furthermore, the procedure is aimed at specimens that contain unidirectional facesheets, where fiber direction is parallel to specimen length. However, it may often be desirable to test specimens from existing sandwich panels, which contain non-unidirectional facesheets. In such cases, the specimen sizing procedure may be used to establish dimensions of the SCB specimens, however, these specimens may exhibit unwanted energy dissipating mechanisms from potential damage in susceptible plies, such as those oriented away from the specimen length direction. Therefore, debond toughness data from tests conducted on specimens taken from pre-manufactured panels should be treated only as qualitative values. These data would not be reliable measures of the actual debond toughness, but would be acceptable for gauging the quality of the facesheet/core bond in the panel under consideration. In such cases, Steps 1-6, and 10 of the sizing procedure would be used to establish the in-plane dimensions of the SCB specimens.
5 Computed SCB Specimen Dimensions The method summarized in Section 4.4 was applied to the 64 sandwich systems
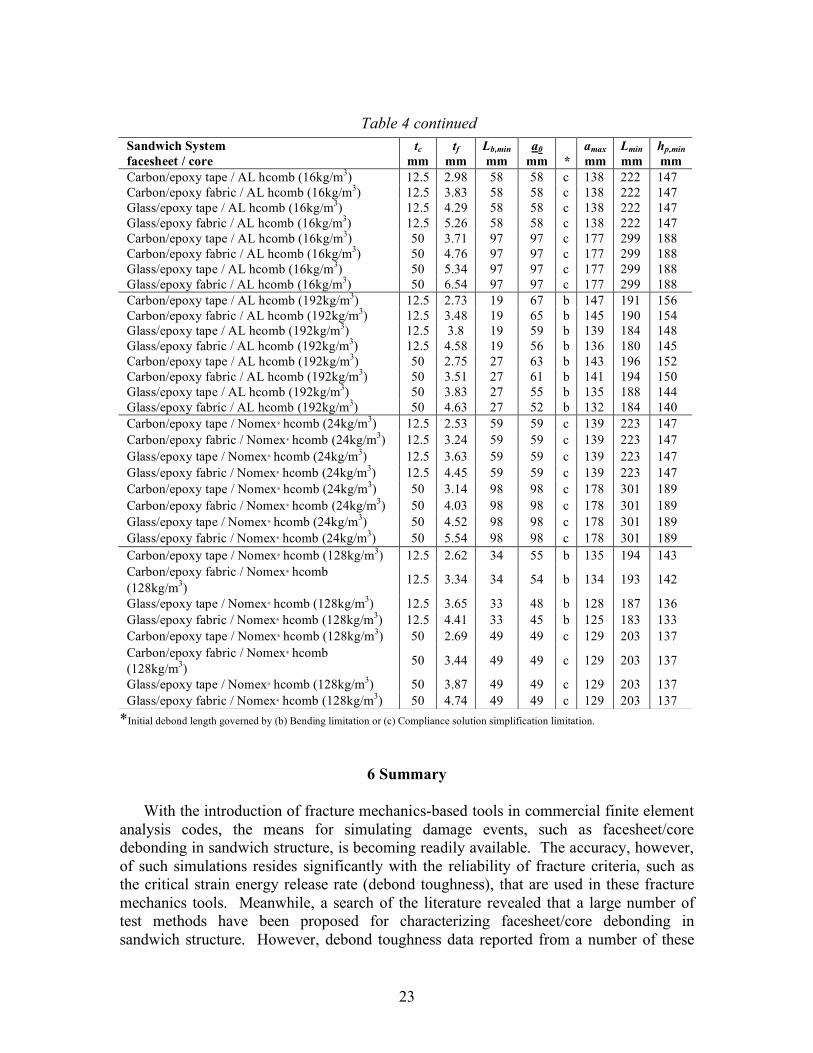
discussed previously in Section 3. The computed SCB specimen dimensions of all 64 sandwich systems considered in this study are presented in Table 4 (b=25mm in all cases). The data are meant to act as a quick guide for estimating SCB specimen dimensions for a given sandwich system. Note that only tape and plain weave fabric facesheets, with a unidirectional stacking sequence and principal fiber direction oriented parallel to specimen length, are considered. It is observed in general that the sizing procedure yields very practical specimen dimensions for the cases considered.
The following general observations were made of the computed specimen dimensions presented in Table 4 (note that quoted limitation numbers correspond to those summarized in Table 3):
• Minimum intact specimen length (Limitation 2) is always equal to the initial
debond length, when initial debond length is governed by the compliance solution simplification limitation (Limitation 4).
• Minimum intact specimen length is constant for a given core material and core thickness, regardless of facesheet material.
• Initial debond length was governed by the bending deformation limitation (Limitation 3) in approximately half of the cases considered. In the other cases,
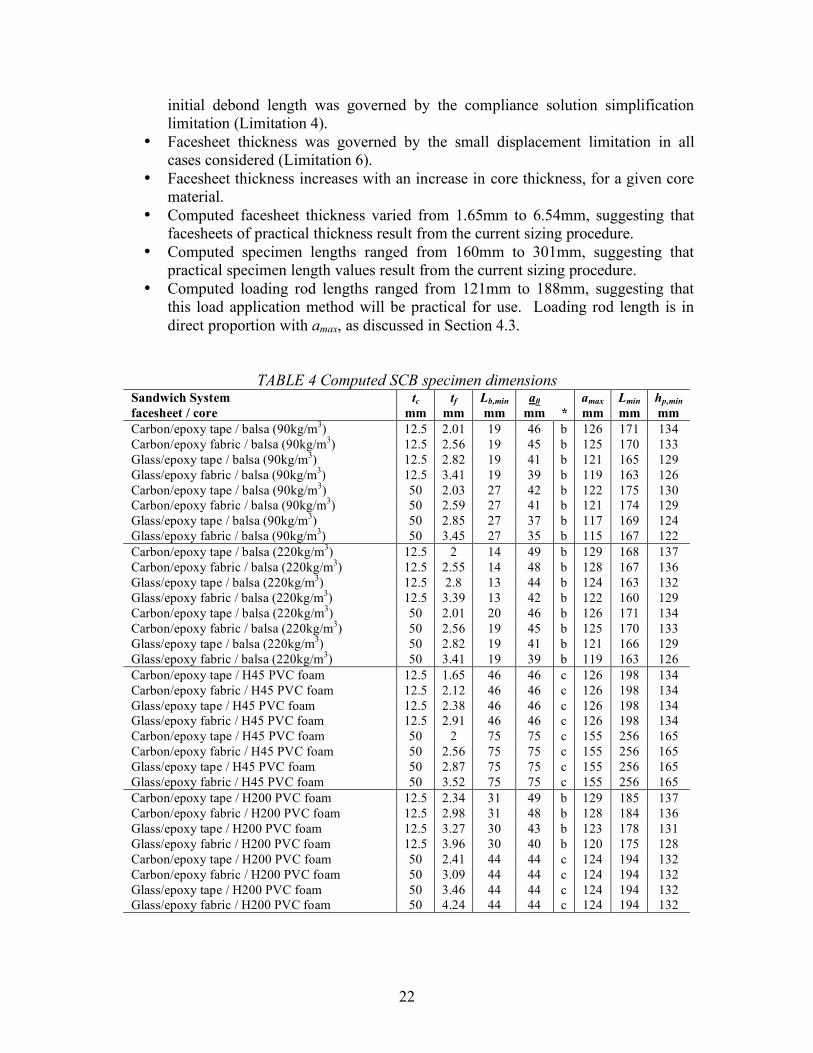
22
initial debond length was governed by the compliance solution simplification limitation (Limitation 4).
• Facesheet thickness was governed by the small displacement limitation in all cases considered (Limitation 6).
• Facesheet thickness increases with an increase in core thickness, for a given core material.
• Computed facesheet thickness varied from 1.65mm to 6.54mm, suggesting that facesheets of practical thickness result from the current sizing procedure.
• Computed specimen lengths ranged from 160mm to 301mm, suggesting that practical specimen length values result from the current sizing procedure.
• Computed loading rod lengths ranged from 121mm to 188mm, suggesting that this load application method will be practical for use. Loading rod length is in direct proportion with amax, as discussed in Section 4.3.
TABLE 4 Computed SCB specimen dimensions Sandwich System facesheet / core
tc mm
tf mm
Lb,min mm
a0 mm
*
amax mm
Lmin mm
hp,min mm
Carbon/epoxy tape / balsa (90kg/m3) 12.5 2.01 19 46 b 126 171 134 Carbon/epoxy fabric / balsa (90kg/m3) 12.5 2.56 19 45 b 125 170 133 Glass/epoxy tape / balsa (90kg/m3) 12.5 2.82 19 41 b 121 165 129 Glass/epoxy fabric / balsa (90kg/m3) 12.5 3.41 19 39 b 119 163 126 Carbon/epoxy tape / balsa (90kg/m3) 50 2.03 27 42 b 122 175 130 Carbon/epoxy fabric / balsa (90kg/m3) 50 2.59 27 41 b 121 174 129 Glass/epoxy tape / balsa (90kg/m3) 50 2.85 27 37 b 117 169 124 Glass/epoxy fabric / balsa (90kg/m3) 50 3.45 27 35 b 115 167 122 Carbon/epoxy tape / balsa (220kg/m3) 12.5 2 14 49 b 129 168 137 Carbon/epoxy fabric / balsa (220kg/m3) 12.5 2.55 14 48 b 128 167 136 Glass/epoxy tape / balsa (220kg/m3) 12.5 2.8 13 44 b 124 163 132 Glass/epoxy fabric / balsa (220kg/m3) 12.5 3.39 13 42 b 122 160 129 Carbon/epoxy tape / balsa (220kg/m3) 50 2.01 20 46 b 126 171 134 Carbon/epoxy fabric / balsa (220kg/m3) 50 2.56 19 45 b 125 170 133 Glass/epoxy tape / balsa (220kg/m3) 50 2.82 19 41 b 121 166 129 Glass/epoxy fabric / balsa (220kg/m3) 50 3.41 19 39 b 119 163 126 Carbon/epoxy tape / H45 PVC foam 12.5 1.65 46 46 c 126 198 134 Carbon/epoxy fabric / H45 PVC foam 12.5 2.12 46 46 c 126 198 134 Glass/epoxy tape / H45 PVC foam 12.5 2.38 46 46 c 126 198 134 Glass/epoxy fabric / H45 PVC foam 12.5 2.91 46 46 c 126 198 134 Carbon/epoxy tape / H45 PVC foam 50 2 75 75 c 155 256 165 Carbon/epoxy fabric / H45 PVC foam 50 2.56 75 75 c 155 256 165 Glass/epoxy tape / H45 PVC foam 50 2.87 75 75 c 155 256 165 Glass/epoxy fabric / H45 PVC foam 50 3.52 75 75 c 155 256 165 Carbon/epoxy tape / H200 PVC foam 12.5 2.34 31 49 b 129 185 137 Carbon/epoxy fabric / H200 PVC foam 12.5 2.98 31 48 b 128 184 136 Glass/epoxy tape / H200 PVC foam 12.5 3.27 30 43 b 123 178 131 Glass/epoxy fabric / H200 PVC foam 12.5 3.96 30 40 b 120 175 128 Carbon/epoxy tape / H200 PVC foam 50 2.41 44 44 c 124 194 132 Carbon/epoxy fabric / H200 PVC foam 50 3.09 44 44 c 124 194 132 Glass/epoxy tape / H200 PVC foam 50 3.46 44 44 c 124 194 132 Glass/epoxy fabric / H200 PVC foam 50 4.24 44 44 c 124 194 132
23
Table 4 continued
*Initial debond length governed by (b) Bending limitation or (c) Compliance solution simplification limitation.
6 Summary
With the introduction of fracture mechanics-based tools in commercial finite element analysis codes, the means for simulating damage events, such as facesheet/core debonding in sandwich structure, is becoming readily available. The accuracy, however, of such simulations resides significantly with the reliability of fracture criteria, such as the critical strain energy release rate (debond toughness), that are used in these fracture mechanics tools. Meanwhile, a search of the literature revealed that a large number of test methods have been proposed for characterizing facesheet/core debonding in sandwich structure. However, debond toughness data reported from a number of these
Sandwich System facesheet / core
tc mm
tf mm
Lb,min mm
a0 mm
*
amax mm
Lmin mm
hp,min mm
Carbon/epoxy tape / AL hcomb (16kg/m3) 12.5 2.98 58 58 c 138 222 147 Carbon/epoxy fabric / AL hcomb (16kg/m3) 12.5 3.83 58 58 c 138 222 147 Glass/epoxy tape / AL hcomb (16kg/m3) 12.5 4.29 58 58 c 138 222 147 Glass/epoxy fabric / AL hcomb (16kg/m3) 12.5 5.26 58 58 c 138 222 147 Carbon/epoxy tape / AL hcomb (16kg/m3) 50 3.71 97 97 c 177 299 188 Carbon/epoxy fabric / AL hcomb (16kg/m3) 50 4.76 97 97 c 177 299 188 Glass/epoxy tape / AL hcomb (16kg/m3) 50 5.34 97 97 c 177 299 188 Glass/epoxy fabric / AL hcomb (16kg/m3) 50 6.54 97 97 c 177 299 188 Carbon/epoxy tape / AL hcomb (192kg/m3) 12.5 2.73 19 67 b 147 191 156 Carbon/epoxy fabric / AL hcomb (192kg/m3) 12.5 3.48 19 65 b 145 190 154 Glass/epoxy tape / AL hcomb (192kg/m3) 12.5 3.8 19 59 b 139 184 148 Glass/epoxy fabric / AL hcomb (192kg/m3) 12.5 4.58 19 56 b 136 180 145 Carbon/epoxy tape / AL hcomb (192kg/m3) 50 2.75 27 63 b 143 196 152 Carbon/epoxy fabric / AL hcomb (192kg/m3) 50 3.51 27 61 b 141 194 150 Glass/epoxy tape / AL hcomb (192kg/m3) 50 3.83 27 55 b 135 188 144 Glass/epoxy fabric / AL hcomb (192kg/m3) 50 4.63 27 52 b 132 184 140 Carbon/epoxy tape / Nomex® hcomb (24kg/m3) 12.5 2.53 59 59 c 139 223 147 Carbon/epoxy fabric / Nomex® hcomb (24kg/m3) 12.5 3.24 59 59 c 139 223 147 Glass/epoxy tape / Nomex® hcomb (24kg/m3) 12.5 3.63 59 59 c 139 223 147 Glass/epoxy fabric / Nomex® hcomb (24kg/m3) 12.5 4.45 59 59 c 139 223 147 Carbon/epoxy tape / Nomex® hcomb (24kg/m3) 50 3.14 98 98 c 178 301 189 Carbon/epoxy fabric / Nomex® hcomb (24kg/m3) 50 4.03 98 98 c 178 301 189 Glass/epoxy tape / Nomex® hcomb (24kg/m3) 50 4.52 98 98 c 178 301 189 Glass/epoxy fabric / Nomex® hcomb (24kg/m3) 50 5.54 98 98 c 178 301 189 Carbon/epoxy tape / Nomex® hcomb (128kg/m3) 12.5 2.62 34 55 b 135 194 143 Carbon/epoxy fabric / Nomex® hcomb (128kg/m3)
12.5 3.34 34 54 b 134 193 142
Glass/epoxy tape / Nomex® hcomb (128kg/m3) 12.5 3.65 33 48 b 128 187 136 Glass/epoxy fabric / Nomex® hcomb (128kg/m3) 12.5 4.41 33 45 b 125 183 133 Carbon/epoxy tape / Nomex® hcomb (128kg/m3) 50 2.69 49 49 c 129 203 137 Carbon/epoxy fabric / Nomex® hcomb (128kg/m3) 50 3.44 49 49 c 129 203 137
Glass/epoxy tape / Nomex® hcomb (128kg/m3) 50 3.87 49 49 c 129 203 137 Glass/epoxy fabric / Nomex® hcomb (128kg/m3) 50 4.74 49 49 c 129 203 137
24
tests conducted on similar sandwich systems, exhibit a significant amount of scatter. Subsequently, the SCB specimen has been identified as a candidate for standardizing the measurement of facesheet/core debond toughness. In the current work, an analytical treatment of the SCB specimen was used in the development of a procedure for determining appropriate dimensions of a SCB specimen. The procedure aimed to result in specimens that respond in a linear elastic manner, and exhibit a well-defined compliance/debond length relationship, that is easily adapted to a data reduction method for computing debond toughness. The sizing procedure was applied to 64 different hypothetical sandwich systems consisting of unidirectional facesheets, deemed to be representative of systems used in the marine and aerospace industries. Results from this study indicate that the sizing procedure should yield practical SCB specimen dimensions. This method for sizing SCB specimens should be well-suited to incorporation into a standardized testing protocol.
7 Acknowledgements
This research was conducted at the Durability, Damage Tolerance, and Reliability Branch, NASA Langley Research Center, VA and funded by the NASA Fundamental Aeronautics Program/Subsonic Rotary Wing Program. The author also wishes to express his gratitude for the useful discussions with Dr. Ed Glaessgen of NASA Langley Research Center, and Dr. Dan Adams from the University of Utah. A special thanks to Dr. James Reeder of NASA Langley Research Center for his tireless efforts in editing this technical publication.
8 References [1] Allen, H.G., “Analysis and Design of Structural Sandwich Panels”, Permagon Press, 1969. [2] American Society for Testing and Materials, “Standard Test Method for Climbing Drum Peel for
Adhesives,” ASTM Standard D1781-98, In: ASTM Annual Book of Standards, Vol. 15.06, ASTM, 2006.
[3] Nettles, A.T., Gregory, E.D., and Jackson, J.R., “Using the Climbing Drum Peel (CDP) Test to Obtain a GIc Value for Core/Face Sheet Bonds,” Journal of Composite Materials, Vol. 41, No. 24, 2007, pp. 2863-2876.
[4] Weaver, C., “Evaluation of Mode I Fracture Mechanics Test Methods For Sandwich Composites,” M.Sc Thesis, University of Utah, Salt Lake City, UT, 2009.
[5] Cantwell, W.J., and Davies, P., “A Study of Skin-Core Adhesion in Glass Fiber Reinforced Sandwich Materials,” Applied Composite Materials, Vol. 3, 1996, pp. 407-420.
[6] Cantwell, W.J., Scudamore, R., Ratcliffe, J., and Davies, P., “Interfacial Fracture in Sandwich Laminates,” Composites Science and Technology, Vol. 54, No. 14, 1999, pp. 2079-2085.
[7] McGarva, L.D., and Åström, B.T., “Experimental Investigation of Compression Moulding of Glass/PA12-PMI foam Core Sandwich Components,” Composites: Part A, Vol. 30, 1999, pp. 1171-1185.
[8] Shivakumar, K., Chen, H., and Smith, S.A., “An Evaluation of Data Reduction Methods for Opening Mode Fracture Toughness of Sandwich Panels,” Journal of Sandwich Structure and Materials, Vol. 4, No. 1, 2005, pp. 77-90.
25
[9] Cantwell, W.J., Broster, G., and Davies, P., “The Influence of Water Immersion on Skin-Core Debonding in GFRP-Balsa Sandwich Structures,” Journal of Reinforced Plastics, and Composites, Vol. 15, 1996, pp. 1161-1172.
[10] Li, X., and Carlsson, L.A., “The Tilted Sandwich Debond (TSD) Specimen for Face/Core Interface Fracture Characterization,” Journal of Sandwich Structures and Materials, Vol. 1, 1999, pp. 60-75.
[11] Cantwell, W.J., and Davies, P., “A Test Technique For Assessing Core-Skin Adhesion in Composite Sandwich Structures,” Journal of Materials Science Letters, Vol. 13, 1994, pp. 203-205.
[12] Glaessgen, E.H., Reeder, J.R., Sleight, D.W., Wang, J.T., Raju, I.S., and Harris, C.E., “Debonding Failure of Sandwich-Composite Cryogenic Fuel Tank with Internal Core Pressure,” Journal of Spacecraft and Rockets, Vol. 42, No. 4, 2005, pp. 613-627.
[13] Prasad, S, and Carlsson, L.A., “Debonding and Crack Kinking in Foam Core Sandwich Beams–II. Experimental Investigation,” Engineering Fracture Mechanics, Vol. 47, No. 6, 1994, pp. 825-841.
[14] Smith, S.A., and Shivakumar, K.N., “Modified Mode-I Cracked Sandwich Beam (CSB) Fracture Test,” Proceedings of the AIAA/ASME/ASCE/AHS/ASC Structures, Structural Dynamics and Materials Conference, Vol. 1, 2001, AIAA, Reston, VA, pp. 1-18.
[15] Østergaard, R.C., and Sørensen, B.F., “Interface Crack In Sandwich Specimen,” International Journal of Fracture, 2007, Vol. 143, pp. 301-316.
[16] Shivakumar, K.N., and Smith, S.A., “In Situ Fracture Toughness Testing of Core Materials in Sandwich Panels,” Journal of Composite Materials, Vol. 38, No. 8, 2004, pp. 655-668.
[17] Gates, T.S., and Herring, H.M., “Facesheet Push-off Tests to Determine Composite Sandwich Toughness at Cryogenic Temperatures,” Proceedings of the AIAA/ASME/ASCE/AHS/ASC Structures, Structural Dynamics and Materials Conference, Vol. 1, 2001, AIAA, Reston, VA, pp. 323-333.
[18] Ratcliffe, J., and Cantwell, W.J., “A New Test Geometry for Characterizing Skin-Core Adhesion in Thin-Skinned Sandwich Structures,” Journal of Materials Science Letters, Vol. 19, 2000, pp. 1365-1367.
[19] Berggreen, C., Simonsen, B.C., and Borum, K.K., “Experimental and Numerical Study of Interface Crack Propagation in Foam-cored Sandwich Beams,” Journal of Composite Materials, Vol. 41, No. 4, 2007, pp. 493-520.
[20] Shipsha, A., Burman, M., and Zenkert, D., “Interfacial Fatigue Crack Growth in Foam Core Sandwich Structures,” Fatigue and Fracture of Engineering Materials and Structures, Vol. 22, 1999, pp. 123-131.
[21] Ural, A., Zehnder, A.T., and Ingraffea, A.R., “Fracture Mechanics Approach to Facesheet Delamination in Honeycomb: Measurement of Energy Release Rate of Adhesive Bond,” Engineering Fracture Mechanics, Vol. 70, 2003, pp. 93-103.
[22] Li, X., and Carlsson, L.A., “Elastic Foundation Analysis of Tilted Sandwich Debond (TSD) Specimen,” Journal of Sandwich Structures and Materials, Vol. 2, 2000, pp. 3-32.
[23] Carlsson, L.A., Sendlein, L.S., and Merry, S.L., “Characterization of Face Sheet/Core Shear Fracture of Composite Sandwich Beams,” Journal of Composite Materials, Vol. 25, 1991, pp. 101-116.
[24] American Society for Testing and Materials, “Mode I Interlaminar Fracture Toughness of Unidirectional Fiber-Reinforced Polymer Matrix Composites,” ASTM Standard D5528-01(2007), In: ASTM Annual Book of Standards, Vol. 15.03, ASTM, 2008.
[25] Irwin, G.R., “A Critical Energy Rate Analysis of Fracture Strength,” Welding Journal (Research Supplement), 1954.
[26] Suo, Z., and Hutchinson, J.W., “Sandwich Test Specimens for Measuring Interface Crack Toughness,” Materials Science and Engineering, A107, 1989, pp. 135-143.
[27] Kollar, L. P., and Springer, G. S., “Mechanics of Composite Structures,” Cambridge University Press, 2003.
[28] O'Brien, T. K., and Krueger, R., “Analysis of Flexure Tests for Transverse Tensile Strength Characterization of Unidirectional Composites,” Journal of Composites Technology and Research, Vol. 25, 2003, pp. 50-68.
[29] Manual de Productos, MEL Composites, http://www.melcomposites.com [30] Hexweb™ Honeycomb Attributes and Properties, A Comprehensive Guide to Standard Hexcel®
Honeycomb Materials, Configurations, and Mechanical Properties, Hexcel® Composites, 1999. [31] Kanninen, M.F., “An Augmented Double Cantilever Beam Model For Studying Crack Propagation
and Arrest,” International Journal of Fracture, Vol. 9, No. 1, 1973, pp. 83-92.
26
[32] TerMaath, S.C., Ingraffea, A.R., Wawrzynek, P.A., “A Computational Fracture Mechanics Approach for the Analysis of Facesheet-From-Core Disbond of Honeycomb Core Sandwich Panels,” Fatigue and Fracture Mechanics: 30th Volume, ASTM STP 1360, Paris, P.C., and Jerina, K.L., Eds., American Society for Testing and Materials, West Conshohocken, PA, 1999, pp. 169-182.
[33] Williams, J. G., “The Fracture Mechanics of Delamination Tests,” Journal of Strain Analysis, Vol. 24, No. 4, 1989, pp. 207–214.
[34] MIL-HDBK-17F, The Composite Materials Handbook, Vol. 2F, ASTM International, West Conshohocken PA, 2002.
[35] Naik, N.K., Tiwari, S.I., Kumar, R.S., “An Analytical Model for Compressive Strength of Plain Weave Fabric Composites,” Composites Science and Technology, Vol. 63, No. 5, 2003, pp. 609-625.
[36] Naik, N.K., and Ganesh, V.K., “Thermo-Mechanical Behaviour of Plain Weave Fabric Composites: Experimental Investigations,” Journal of Materials Science, Vol. 32, No. 1, 1997, pp. 267-277.
[37] Pandita, S.D, Huysmans, G., Wevers, M., and Verpoest, I., “Tensile Fatigue Behaviour of Glass Plain-Weave Fabric Composites in On- and Off-Axis Directions,” Composites Part A: Applied Science and Manufacturing, Vol. 32, No. 10, 2001, pp. 1533-1539.
[38] Xiaoa, J.R., Gamaa, B.A., and Gillespie, Jr., J.W., “Progressive Damage and Delamination in Plain Weave S-2 Glass/SC-15 Composites Under Quasi-Static Punch-Shear Loading,” Composite Structures, Vol. 78, No. 2, 2007, pp. 182-196.
27
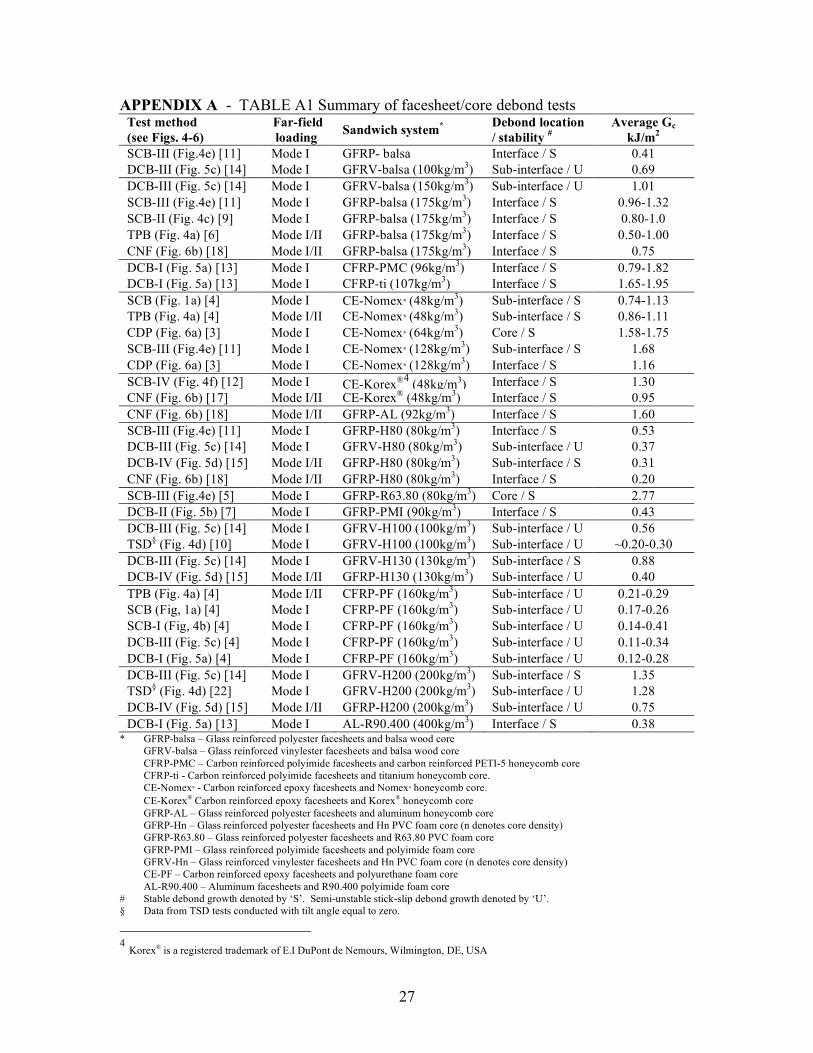
APPENDIX A - TABLE A1 Summary of facesheet/core debond tests Test method (see Figs. 4-6)
Far-field loading Sandwich system* Debond location
/ stability # Average Gc
kJ/m2 SCB-III (Fig.4e) [11] Mode I GFRP- balsa Interface / S 0.41 DCB-III (Fig. 5c) [14] Mode I GFRV-balsa (100kg/m3) Sub-interface / U 0.69 DCB-III (Fig. 5c) [14] Mode I GFRV-balsa (150kg/m3) Sub-interface / U 1.01 SCB-III (Fig.4e) [11] Mode I GFRP-balsa (175kg/m3) Interface / S 0.96-1.32 SCB-II (Fig. 4c) [9] Mode I GFRP-balsa (175kg/m3) Interface / S 0.80-1.0 TPB (Fig. 4a) [6] Mode I/II GFRP-balsa (175kg/m3) Interface / S 0.50-1.00 CNF (Fig. 6b) [18] Mode I/II GFRP-balsa (175kg/m3) Interface / S 0.75 DCB-I (Fig. 5a) [13] Mode I CFRP-PMC (96kg/m3) Interface / S 0.79-1.82 DCB-I (Fig. 5a) [13] Mode I CFRP-ti (107kg/m3) Interface / S 1.65-1.95 SCB (Fig. 1a) [4] Mode I CE-Nomex® (48kg/m3) Sub-interface / S 0.74-1.13 TPB (Fig. 4a) [4] Mode I/II CE-Nomex® (48kg/m3) Sub-interface / S 0.86-1.11 CDP (Fig. 6a) [3] Mode I CE-Nomex® (64kg/m3) Core / S 1.58-1.75 SCB-III (Fig.4e) [11] Mode I CE-Nomex® (128kg/m3) Sub-interface / S 1.68 CDP (Fig. 6a) [3] Mode I CE-Nomex® (128kg/m3) Interface / S 1.16 SCB-IV (Fig. 4f) [12] Mode I CE-Korex®4 (48kg/m3) Interface / S 1.30 CNF (Fig. 6b) [17] Mode I/II CE-Korex® (48kg/m3) Interface / S 0.95 CNF (Fig. 6b) [18] Mode I/II GFRP-AL (92kg/m3) Interface / S 1.60 SCB-III (Fig.4e) [11] Mode I GFRP-H80 (80kg/m3) Interface / S 0.53 DCB-III (Fig. 5c) [14] Mode I GFRV-H80 (80kg/m3) Sub-interface / U 0.37 DCB-IV (Fig. 5d) [15] Mode I/II GFRP-H80 (80kg/m3) Sub-interface / S 0.31 CNF (Fig. 6b) [18] Mode I/II GFRP-H80 (80kg/m3) Interface / S 0.20 SCB-III (Fig.4e) [5] Mode I GFRP-R63.80 (80kg/m3) Core / S 2.77 DCB-II (Fig. 5b) [7] Mode I GFRP-PMI (90kg/m3) Interface / S 0.43 DCB-III (Fig. 5c) [14] Mode I GFRV-H100 (100kg/m3) Sub-interface / U 0.56 TSD§ (Fig. 4d) [10] Mode I GFRV-H100 (100kg/m3) Sub-interface / U ~0.20-0.30 DCB-III (Fig. 5c) [14] Mode I GFRV-H130 (130kg/m3) Sub-interface / S 0.88 DCB-IV (Fig. 5d) [15] Mode I/II GFRP-H130 (130kg/m3) Sub-interface / U 0.40 TPB (Fig. 4a) [4] Mode I/II CFRP-PF (160kg/m3) Sub-interface / U 0.21-0.29 SCB (Fig, 1a) [4] Mode I CFRP-PF (160kg/m3) Sub-interface / U 0.17-0.26 SCB-I (Fig, 4b) [4] Mode I CFRP-PF (160kg/m3) Sub-interface / U 0.14-0.41 DCB-III (Fig. 5c) [4] Mode I CFRP-PF (160kg/m3) Sub-interface / U 0.11-0.34 DCB-I (Fig. 5a) [4] Mode I CFRP-PF (160kg/m3) Sub-interface / U 0.12-0.28 DCB-III (Fig. 5c) [14] Mode I GFRV-H200 (200kg/m3) Sub-interface / S 1.35 TSD§ (Fig. 4d) [22] Mode I GFRV-H200 (200kg/m3) Sub-interface / U 1.28 DCB-IV (Fig. 5d) [15] Mode I/II GFRP-H200 (200kg/m3) Sub-interface / U 0.75 DCB-I (Fig. 5a) [13] Mode I AL-R90.400 (400kg/m3) Interface / S 0.38
* GFRP-balsa – Glass reinforced polyester facesheets and balsa wood core GFRV-balsa – Glass reinforced vinylester facesheets and balsa wood core CFRP-PMC – Carbon reinforced polyimide facesheets and carbon reinforced PETI-5 honeycomb core CFRP-ti - Carbon reinforced polyimide facesheets and titanium honeycomb core. CE-Nomex® - Carbon reinforced epoxy facesheets and Nomex® honeycomb core. CE-Korex® Carbon reinforced epoxy facesheets and Korex® honeycomb core GFRP-AL – Glass reinforced polyester facesheets and aluminum honeycomb core GFRP-Hn – Glass reinforced polyester facesheets and Hn PVC foam core (n denotes core density) GFRP-R63.80 – Glass reinforced polyester facesheets and R63.80 PVC foam core GFRP-PMI – Glass reinforced polyimide facesheets and polyimide foam core GFRV-Hn – Glass reinforced vinylester facesheets and Hn PVC foam core (n denotes core density) CE-PF – Carbon reinforced epoxy facesheets and polyurethane foam core AL-R90.400 – Aluminum facesheets and R90.400 polyimide foam core
# Stable debond growth denoted by ‘S’. Semi-unstable stick-slip debond growth denoted by ‘U’. § Data from TSD tests conducted with tilt angle equal to zero.
4 Korex® is a registered trademark of E.I DuPont de Nemours, Wilmington, DE, USA
28
APPENDIX B
TABLE B1 Properties of representative carbon reinforced epoxy systems (unidirectional stacking sequence) [34]
Tape systems Plain weave fabric systems
System E1 MPa
FTU
MPa System E1 MPa
FTU
MPa T300/976 135181 1455 T300/934 62763 628
T650-35/976 151734 1593 T650-35/976 71729 651 Celion/E7k8 137940 2021 Celion/E7k8 66694 910 AS4/E7k8 133112 2090 AS4/E7k8 62211 766
HITEX 33/E7k8 125525 2159 HITEX 33/E7k8 59659 904
TABLE B2 Properties of representative glass reinforced epoxy systems (unidirectional stacking sequence)
Tape systems Plain weave fabric systems
System E1 MPa
FTU
MPa System E1 MPa
FTU
MPa S2/8552 [28] 47710 ** E-glass/epoxy [36] 20657 300
Scotchply/1002 [27] 38600 1062 Glass/epoxy [27] 29100 370 S-glass/epoxy [27] 43000 1280 E-glass/F533 [37] 20500 410 E-glass/epoxy [35] 51000 1397 7781 E-glass/PR 381 [34] 26415 517 S2-449/PR 381 [34] 47658 1697 Glass/epoxy [38] 27500 604
**Strength value not found in the open literature
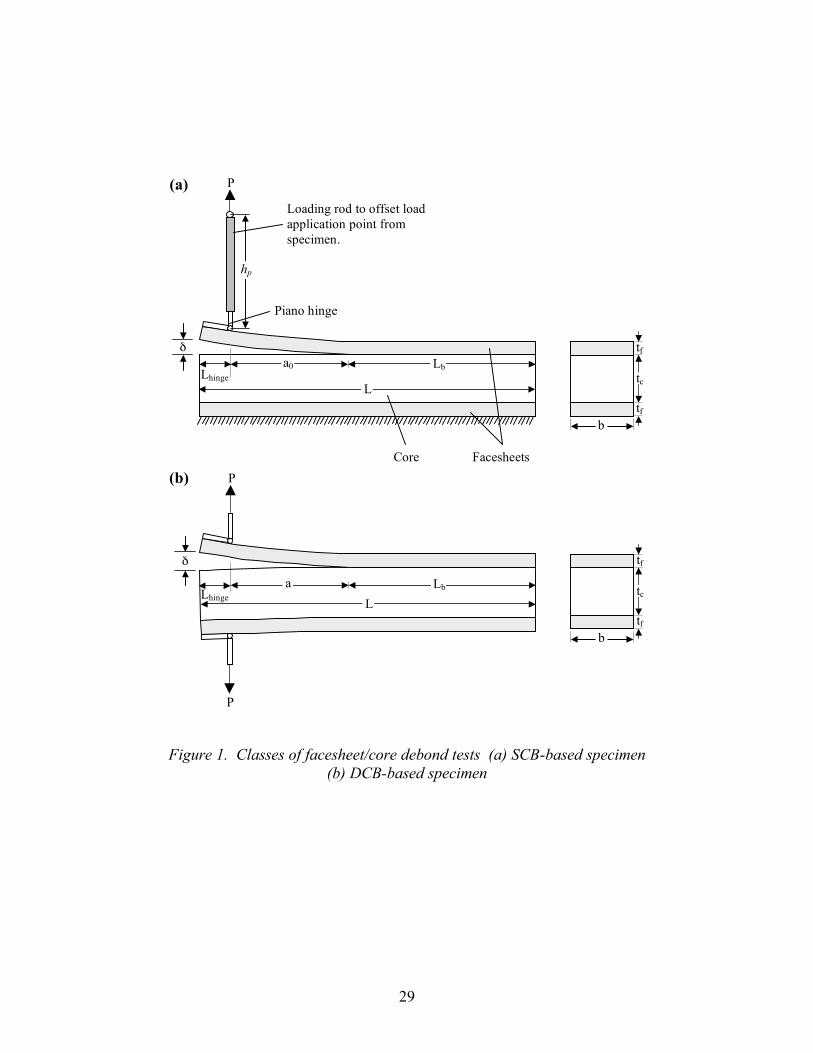
29
Figure 1. Classes of facesheet/core debond tests (a) SCB-based specimen (b) DCB-based specimen
P (a)
L
tf
tf
tc Lb a0
b
δ
Loading rod to offset load application point from specimen.
hp
Lhinge
P (b)
tf
tf
tc
b
L Lb a
P
δ
Lhinge
Facesheets Core
Piano hinge
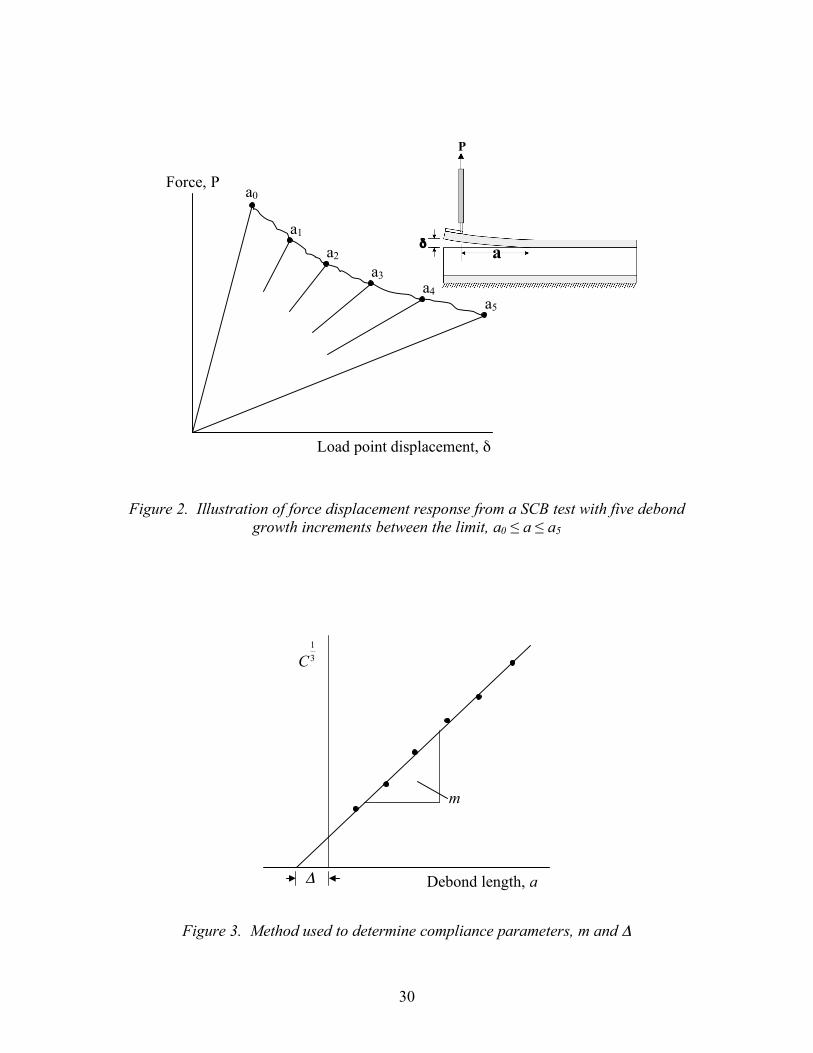
30
Figure 2. Illustration of force displacement response from a SCB test with five debond growth increments between the limit, a0 ≤ a ≤ a5
Figure 3. Method used to determine compliance parameters, m and Δ
P
δ a
Force, P
Load point displacement, δ
a0
a1 a2
a3 a4
a5
Δ
m
Debond length, a
!
C13
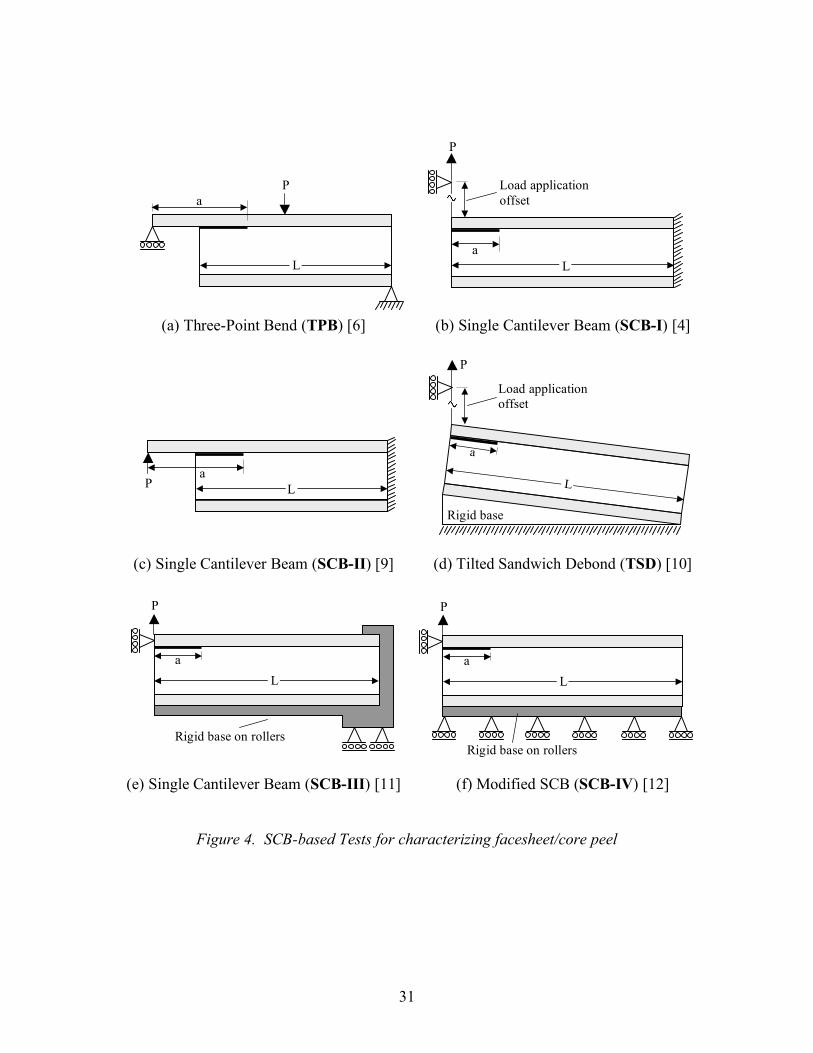
31
(a) Three-Point Bend (TPB) [6] (b) Single Cantilever Beam (SCB-I) [4] (c) Single Cantilever Beam (SCB-II) [9] (d) Tilted Sandwich Debond (TSD) [10] (e) Single Cantilever Beam (SCB-III) [11] (f) Modified SCB (SCB-IV) [12]
Figure 4. SCB-based Tests for characterizing facesheet/core peel
a
L
P
P
Load application offset
a
L
Rigid base
a L
P
Rigid base on rollers
a L
P
Rigid base on rollers
P
Load application offset
a L
P L a
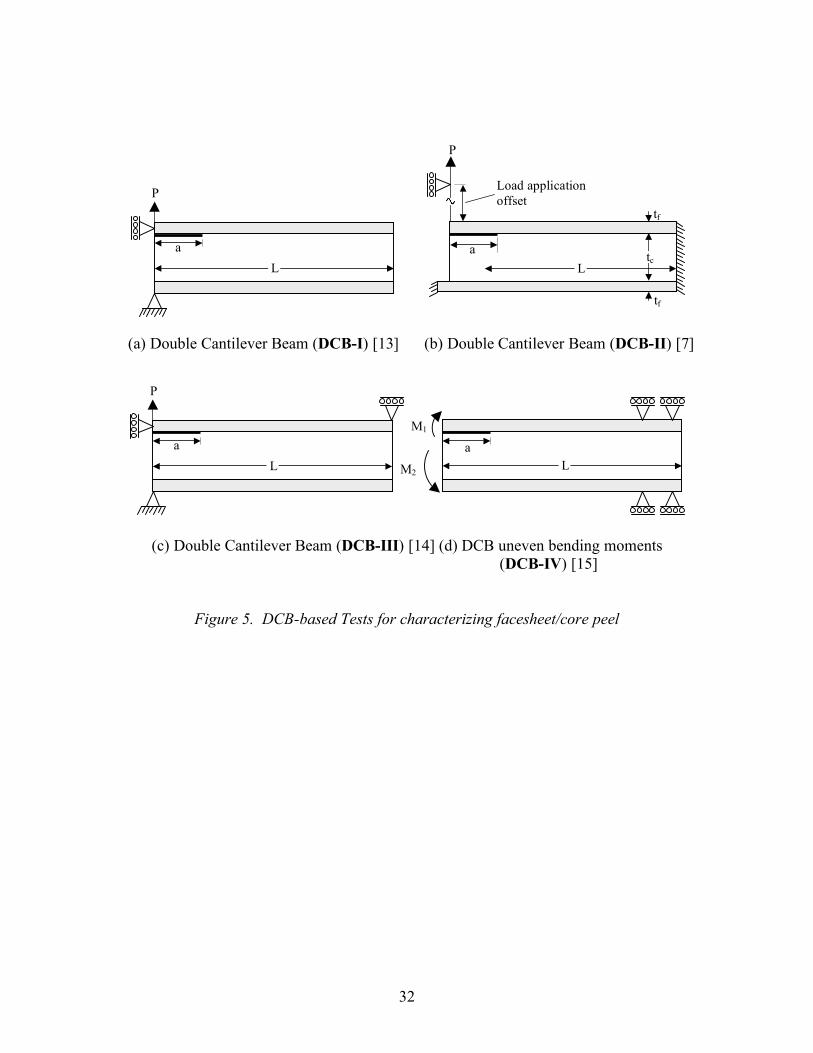
32
(a) Double Cantilever Beam (DCB-I) [13] (b) Double Cantilever Beam (DCB-II) [7]
(c) Double Cantilever Beam (DCB-III) [14] (d) DCB uneven bending moments (DCB-IV) [15]
Figure 5. DCB-based Tests for characterizing facesheet/core peel
a L
P
a L
tf
tf
tc
P
Load application offset
a L
P
L a
M1
M2
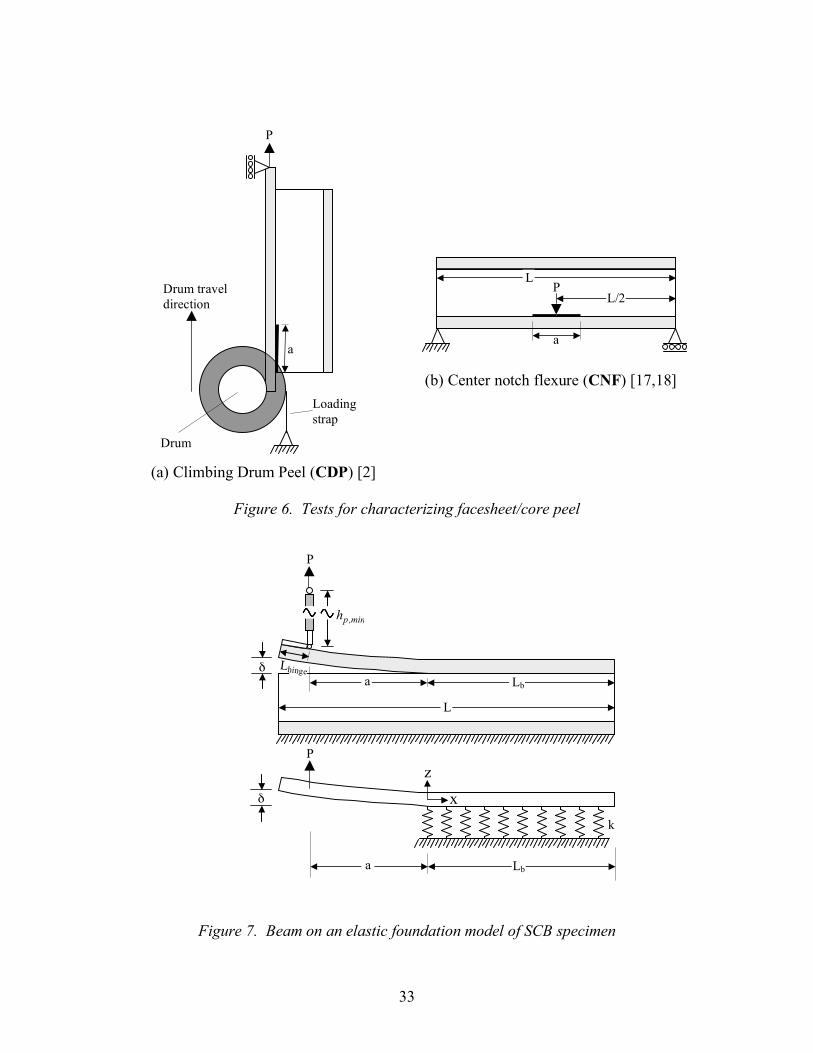
33
(b) Center notch flexure (CNF) [17,18] (a) Climbing Drum Peel (CDP) [2]
Figure 6. Tests for characterizing facesheet/core peel
Figure 7. Beam on an elastic foundation model of SCB specimen
!
hp,min
a
L P
L/2
Drum
a
Loading strap
Drum travel direction
P
P
L
Lb a δ
k
P
x
z δ
Lb a
Lhinge
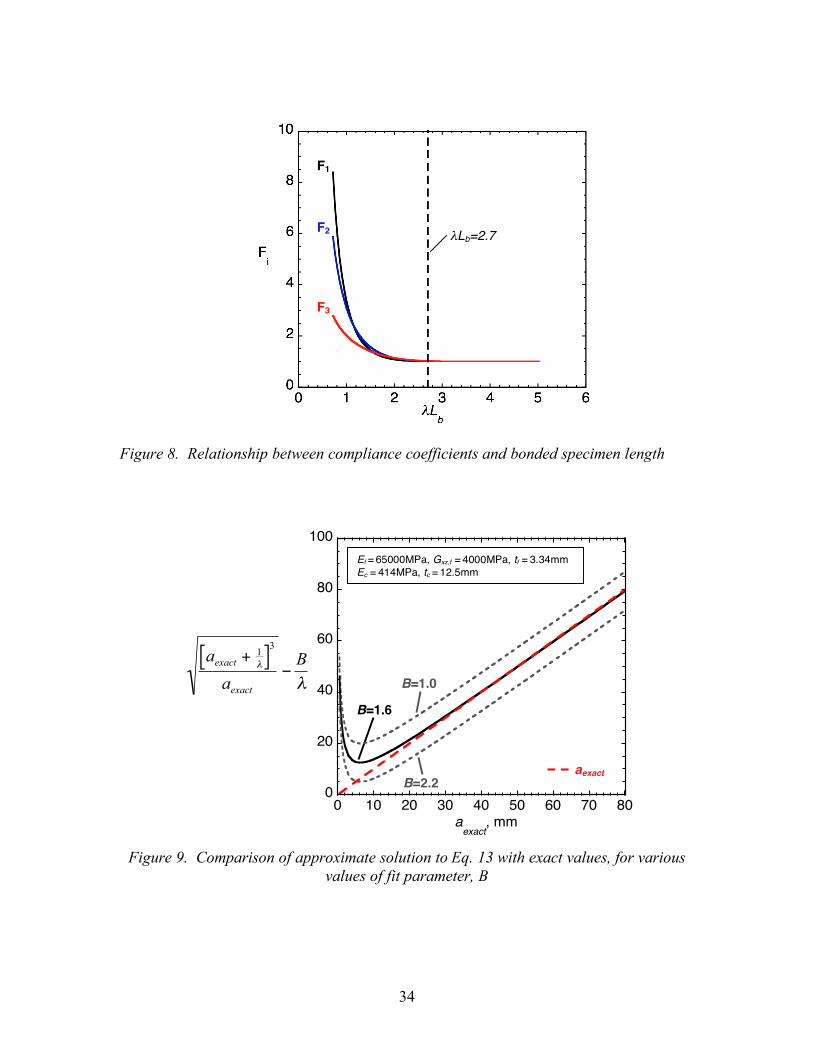
34
Figure 8. Relationship between compliance coefficients and bonded specimen length
Figure 9. Comparison of approximate solution to Eq. 13 with exact values, for various values of fit parameter, B
F1
F2
F3
λLb=2.7
B=1.6
B=1.0
B=2.2
Ef = 65000MPa, Gxz,f = 4000MPa, tf = 3.34mm Ec = 414MPa, tc = 12.5mm
!
aexact + 1"[ ]
3
aexact
#B"
aexact 0
20
40
60
80
100
0 10 20 30 40 50 60 70 80aexact
, mm
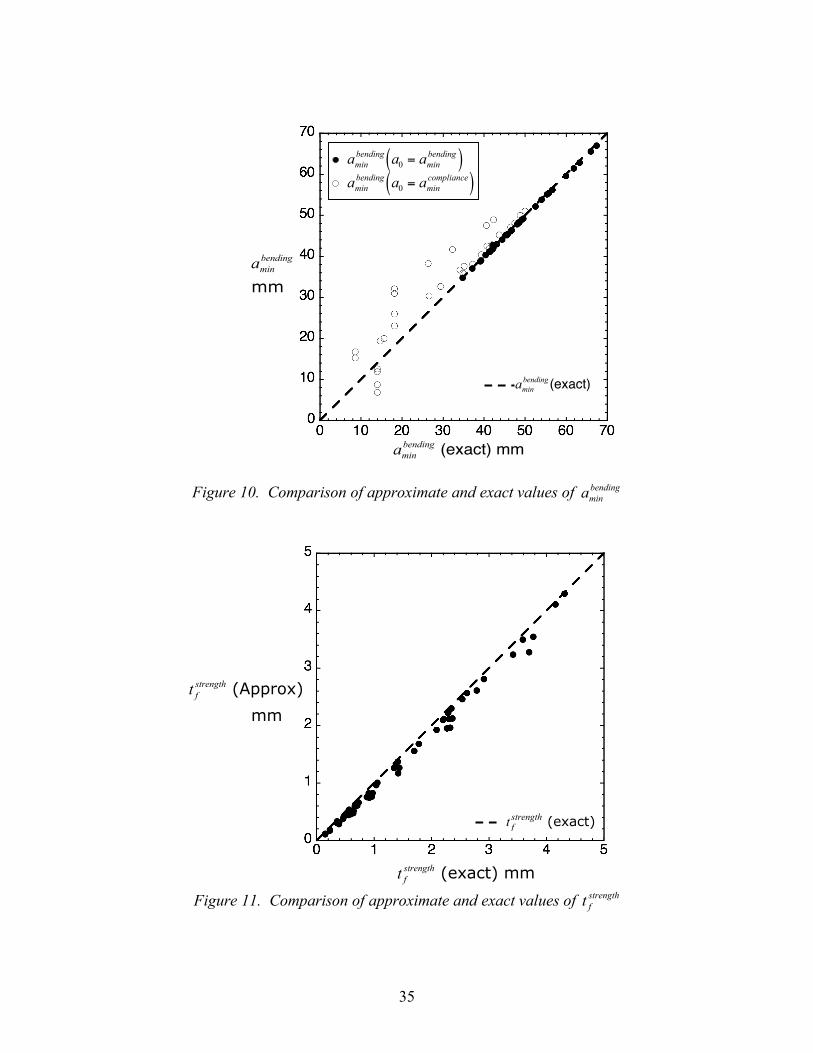
35
Figure 10. Comparison of approximate and exact values of
!
aminbending
Figure 11. Comparison of approximate and exact values of
!
t fstrength
!
t fstrength (exact) mm
!
t fstrength (Approx)
mm
!
t fstrength (exact)
!
aminbending (exact) mm
!
aminbending
mm
!
aminbending (exact)
!
aminbending a0 = amin
bending( )
!
aminbending a0 = amin
compliance( )
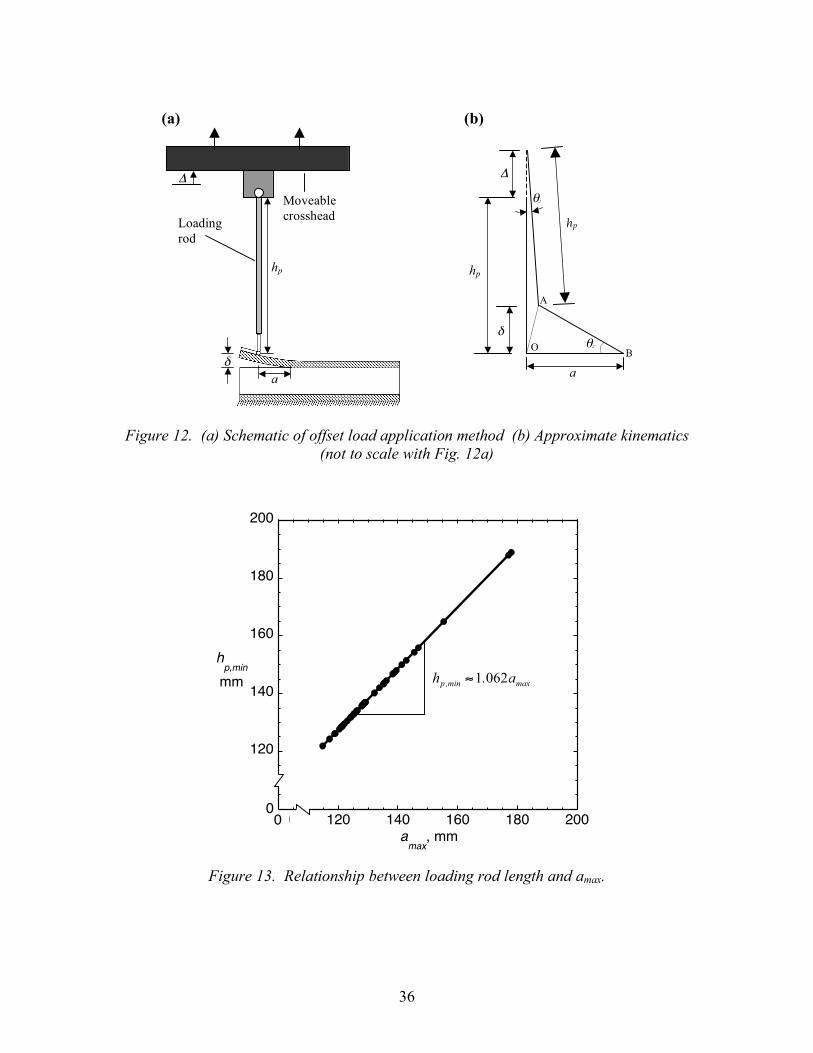
36
Figure 12. (a) Schematic of offset load application method (b) Approximate kinematics
(not to scale with Fig. 12a)
Figure 13. Relationship between loading rod length and amax.
100
120
140
160
180
200
100 120 140 160 180 200
hp,min
mm
amax
, mm
(a)
Moveable crosshead Loading
rod
hp
a δ
Δ
δ
Δ
hp
a
O
A
B
(b)
θ2
θ1
hp
0 0
!
hp ,min "1.062amax
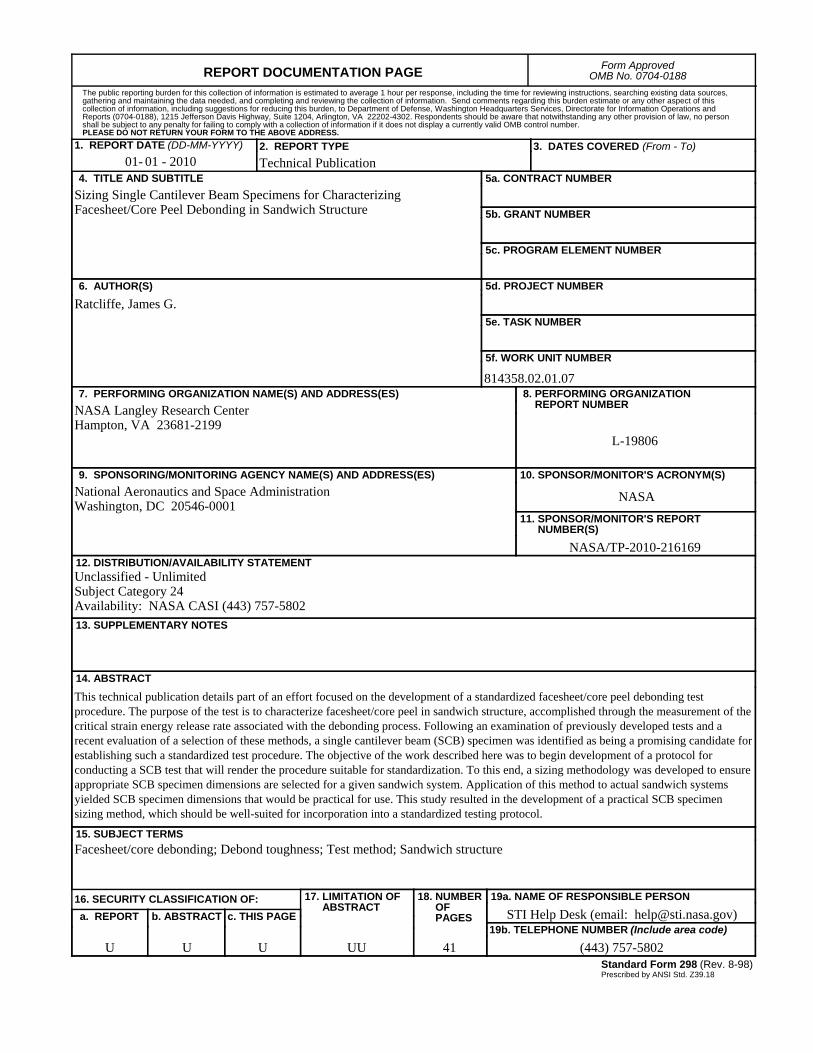
REPORT DOCUMENTATION PAGE Form ApprovedOMB No. 0704-0188
2. REPORT TYPE Technical Publication
4. TITLE AND SUBTITLESizing Single Cantilever Beam Specimens for Characterizing Facesheet/Core Peel Debonding in Sandwich Structure
5a. CONTRACT NUMBER
6. AUTHOR(S)
Ratcliffe, James G.
7. PERFORMING ORGANIZATION NAME(S) AND ADDRESS(ES)NASA Langley Research CenterHampton, VA 23681-2199
9. SPONSORING/MONITORING AGENCY NAME(S) AND ADDRESS(ES)National Aeronautics and Space AdministrationWashington, DC 20546-0001
8. PERFORMING ORGANIZATION REPORT NUMBER
L-19806
10. SPONSOR/MONITOR'S ACRONYM(S)
NASA
13. SUPPLEMENTARY NOTES
12. DISTRIBUTION/AVAILABILITY STATEMENTUnclassified - UnlimitedSubject Category 24Availability: NASA CASI (443) 757-5802
19a. NAME OF RESPONSIBLE PERSON
STI Help Desk (email: [email protected])
14. ABSTRACT
This technical publication details part of an effort focused on the development of a standardized facesheet/core peel debonding test procedure. The purpose of the test is to characterize facesheet/core peel in sandwich structure, accomplished through the measurement of the critical strain energy release rate associated with the debonding process. Following an examination of previously developed tests and a recent evaluation of a selection of these methods, a single cantilever beam (SCB) specimen was identified as being a promising candidate for establishing such a standardized test procedure. The objective of the work described here was to begin development of a protocol for conducting a SCB test that will render the procedure suitable for standardization. To this end, a sizing methodology was developed to ensure appropriate SCB specimen dimensions are selected for a given sandwich system. Application of this method to actual sandwich systems yielded SCB specimen dimensions that would be practical for use. This study resulted in the development of a practical SCB specimen sizing method, which should be well-suited for incorporation into a standardized testing protocol.
15. SUBJECT TERMSFacesheet/core debonding; Debond toughness; Test method; Sandwich structure
18. NUMBER OF PAGES
4119b. TELEPHONE NUMBER (Include area code)
(443) 757-5802
a. REPORT
U
c. THIS PAGE
U
b. ABSTRACT
U
17. LIMITATION OF ABSTRACT
UU
Prescribed by ANSI Std. Z39.18Standard Form 298 (Rev. 8-98)
3. DATES COVERED (From - To)
5b. GRANT NUMBER
5c. PROGRAM ELEMENT NUMBER
5d. PROJECT NUMBER
5e. TASK NUMBER
5f. WORK UNIT NUMBER
814358.02.01.07
11. SPONSOR/MONITOR'S REPORT NUMBER(S)
NASA/TP-2010-216169
16. SECURITY CLASSIFICATION OF:
The public reporting burden for this collection of information is estimated to average 1 hour per response, including the time for reviewing instructions, searching existing data sources, gathering and maintaining the data needed, and completing and reviewing the collection of information. Send comments regarding this burden estimate or any other aspect of this collection of information, including suggestions for reducing this burden, to Department of Defense, Washington Headquarters Services, Directorate for Information Operations and Reports (0704-0188), 1215 Jefferson Davis Highway, Suite 1204, Arlington, VA 22202-4302. Respondents should be aware that notwithstanding any other provision of law, no person shall be subject to any penalty for failing to comply with a collection of information if it does not display a currently valid OMB control number.PLEASE DO NOT RETURN YOUR FORM TO THE ABOVE ADDRESS.
1. REPORT DATE (DD-MM-YYYY)01 - 201001-