Embed Size (px)
Citation preview
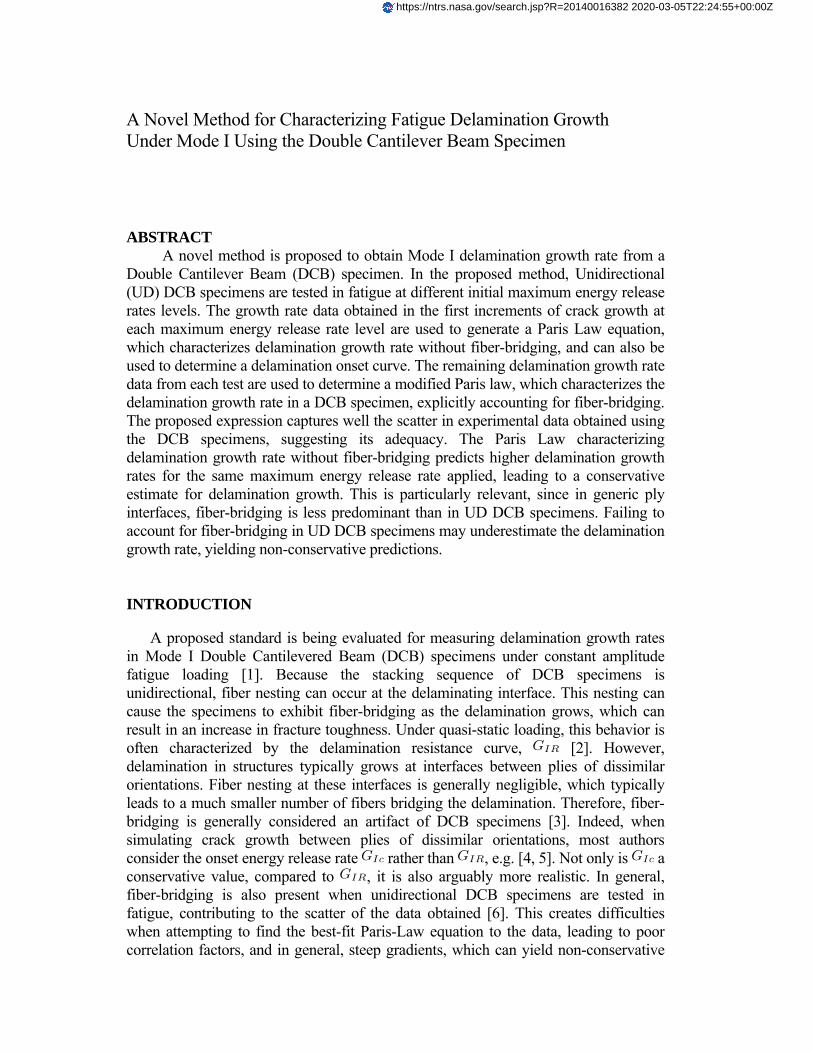
A Novel Method for Characterizing Fatigue Delamination Growth Under Mode I Using the Double Cantilever Beam Specimen
ABSTRACT
A novel method is proposed to obtain Mode I delamination growth rate from a Double Cantilever Beam (DCB) specimen. In the proposed method, Unidirectional (UD) DCB specimens are tested in fatigue at different initial maximum energy release rates levels. The growth rate data obtained in the first increments of crack growth at each maximum energy release rate level are used to generate a Paris Law equation, which characterizes delamination growth rate without fiber-bridging, and can also be used to determine a delamination onset curve. The remaining delamination growth rate data from each test are used to determine a modified Paris law, which characterizes the delamination growth rate in a DCB specimen, explicitly accounting for fiber-bridging. The proposed expression captures well the scatter in experimental data obtained using the DCB specimens, suggesting its adequacy. The Paris Law characterizing delamination growth rate without fiber-bridging predicts higher delamination growth rates for the same maximum energy release rate applied, leading to a conservative estimate for delamination growth. This is particularly relevant, since in generic ply interfaces, fiber-bridging is less predominant than in UD DCB specimens. Failing to account for fiber-bridging in UD DCB specimens may underestimate the delamination growth rate, yielding non-conservative predictions.
INTRODUCTION
A proposed standard is being evaluated for measuring delamination growth rates in Mode I Double Cantilevered Beam (DCB) specimens under constant amplitude fatigue loading [1]. Because the stacking sequence of DCB specimens is unidirectional, fiber nesting can occur at the delaminating interface. This nesting can cause the specimens to exhibit fiber-bridging as the delamination grows, which can result in an increase in fracture toughness. Under quasi-static loading, this behavior is often characterized by the delamination resistance curve, [2]. However, delamination in structures typically grows at interfaces between plies of dissimilar orientations. Fiber nesting at these interfaces is generally negligible, which typically leads to a much smaller number of fibers bridging the delamination. Therefore, fiber-bridging is generally considered an artifact of DCB specimens [3]. Indeed, when simulating crack growth between plies of dissimilar orientations, most authors consider the onset energy release rate rather than , e.g. [4, 5]. Not only is a conservative value, compared to , it is also arguably more realistic. In general, fiber-bridging is also present when unidirectional DCB specimens are tested in fatigue, contributing to the scatter of the data obtained [6]. This creates difficulties when attempting to find the best-fit Paris-Law equation to the data, leading to poor correlation factors, and in general, steep gradients, which can yield non-conservative
https://ntrs.nasa.gov/search.jsp?R=20140016382 2020-03-05T22:24:55+00:00Z
2
predictions for delamination growth (growth rates predicted to be lower than the actual rate) [6, 7]. In addition, large exponents in the Paris Law expressions means that small uncertainties in the effective energy release rate can lead to large uncertainties in the predicted delamination growth rates.
A recent study concluded that compensating for fiber-bridging by normalizing the maximum energy release rate applied by leads to the collapsing of the data obtained from the experiments and enables the determination of the growth rate
by fitting a Paris Law equation, which has a lower slope compared to the non-normalized best-fit [6]. One of the disadvantages of this method is that it requires both static and fatigue data, and assumes an arguable proportionality between fiber-bridging occurring under static and fatigue loading [8]. This leads to the definition of a Paris Law which is intrinsically related to fiber-bridging in a DCB specimen under static loading, which does not necessarily relate to the fiber-bridging (if any) at a generic interface under fatigue loading. To circumvent some of these issues, a novel method is proposed. In the present work, DCB specimens were tested in fatigue at a number of different initial levels. The first increments of delamination growth at each level are used to determine a Paris Law that estimates the growth rate , defined as the Mode I delamination growth rate in the absence of fiber-bridging. Furthermore, a procedure is outlined for deriving a fatigue onset curve directly from . The remaining growth data from each test are used to characterize the effect of fiber-bridging in the DCB specimens, obtaining an expression for , which explicitly accounts for fiber-bridging in fatigue. The advantages of this method are: (i) delamination growth rates with, and without, fiber-bridging are estimated, (ii) only fatigue data are used to characterize both
and , and (iii) no relationship is assumed between fiber-bridging in quasi-static loading and in fatigue. EXPERIMENTS Material and Specimens
In ref. 6, DCB specimens of IM7/8552 graphite/epoxy were tested under Mode I static and fatigue loading. Specimens were cut from panels made by two different manufacturers (Source 1 and Source 2) using IM7/8552 prepreg that was made according to each source’s own internal specifications, and hence, may have slight differences in material properties. The objectives of ref. 6 were to characterize static and fatigue delamination growth, and to determine the sensitivity of these data to changes in end-user material specifications. The data generated in ref. 6 from Sources 1 and 2 were used in this study.
Each source manufactured 24-ply unidirectional panels from the prepreg material and then cut the panels into 0° coupons for testing. The cut specimens were nominally 1 in (25.4 mm) wide and 7 in (178 mm) long. To simulate an initial delamination in the specimens, a thin (13 μm) polytetrafluoroethylene (PTFE) film was embedded at the midplane at one end of the specimens. The film spanned the width of the specimen and was nominally 3 in (76.2 mm) long. The average specimen width, , was 0.9989 in (25.37 mm) for Source 1 and 0.9973 in (25.33 mm) for Source 2. The average specimen thickness, , was 0.1771 in (4.50 mm) for both sources. However, specimen
3
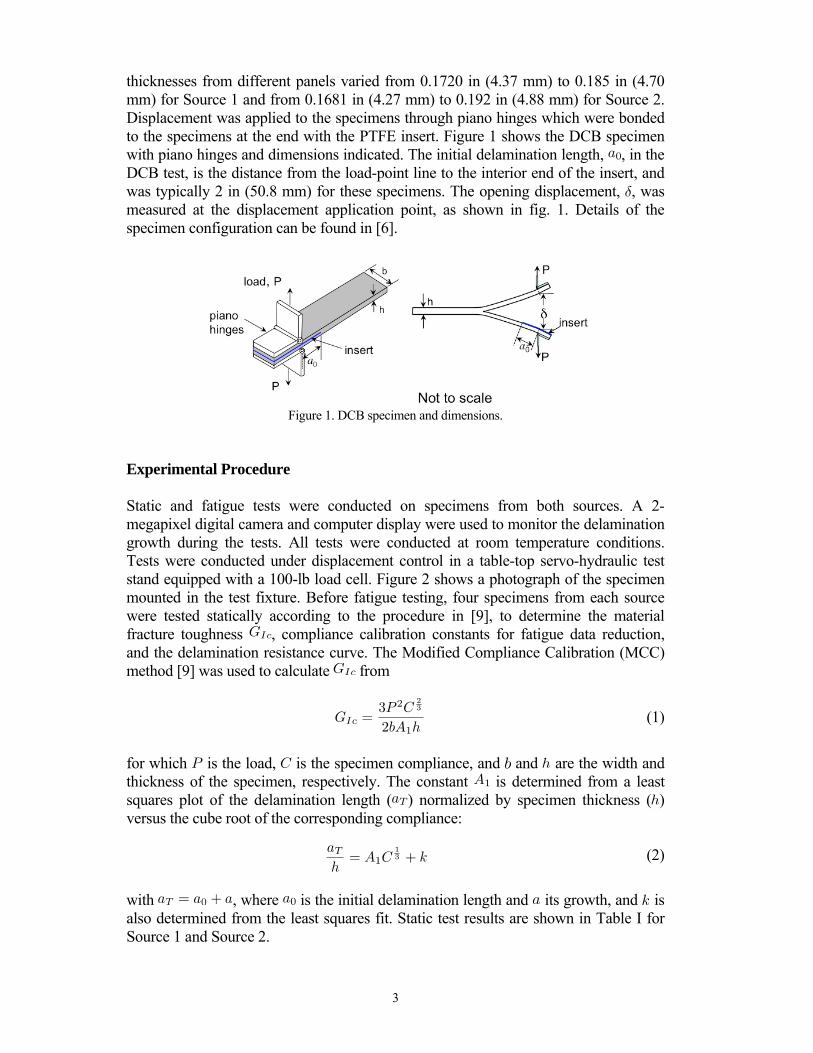
thicknesses from different panels varied from 0.1720 in (4.37 mm) to 0.185 in (4.70 mm) for Source 1 and from 0.1681 in (4.27 mm) to 0.192 in (4.88 mm) for Source 2. Displacement was applied to the specimens through piano hinges which were bonded to the specimens at the end with the PTFE insert. Figure 1 shows the DCB specimen with piano hinges and dimensions indicated. The initial delamination length, , in the DCB test, is the distance from the load-point line to the interior end of the insert, and was typically 2 in (50.8 mm) for these specimens. The opening displacement, , was measured at the displacement application point, as shown in fig. 1. Details of the specimen configuration can be found in [6].
Figure 1. DCB specimen and dimensions.
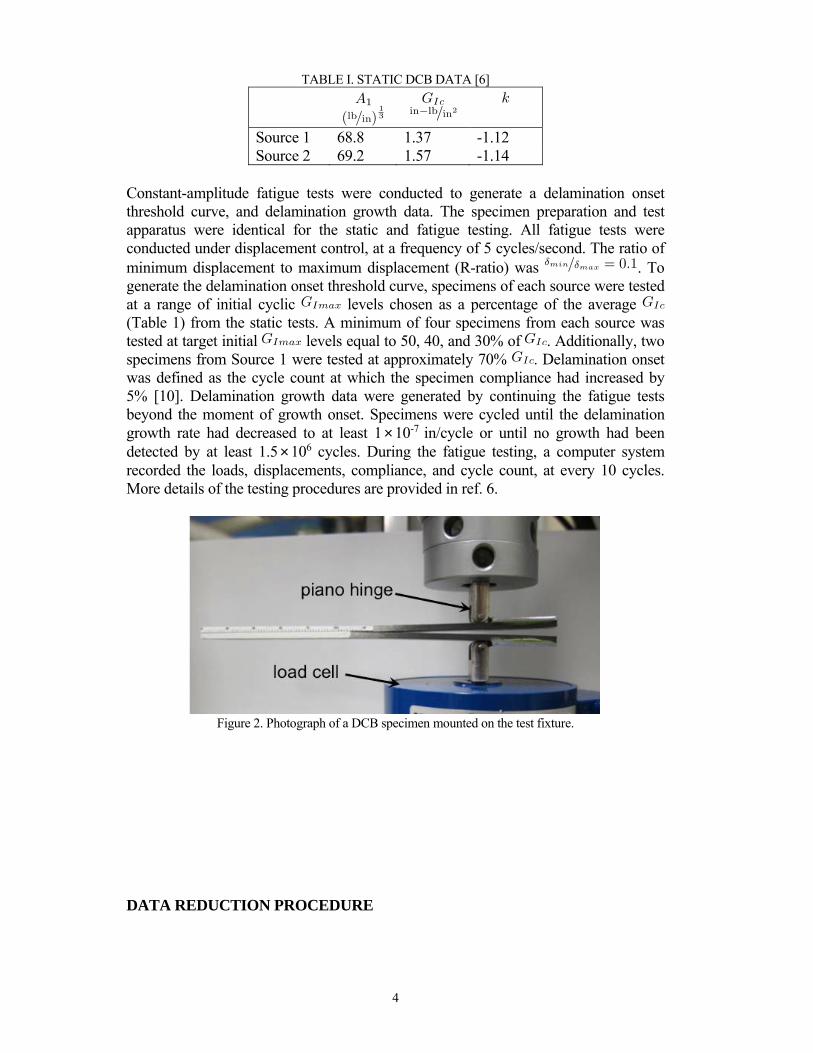
Experimental Procedure Static and fatigue tests were conducted on specimens from both sources. A 2-megapixel digital camera and computer display were used to monitor the delamination growth during the tests. All tests were conducted at room temperature conditions. Tests were conducted under displacement control in a table-top servo-hydraulic test stand equipped with a 100-lb load cell. Figure 2 shows a photograph of the specimen mounted in the test fixture. Before fatigue testing, four specimens from each source were tested statically according to the procedure in [9], to determine the material fracture toughness , compliance calibration constants for fatigue data reduction, and the delamination resistance curve. The Modified Compliance Calibration (MCC) method [9] was used to calculate from
(1)
for which is the load, is the specimen compliance, and and are the width and thickness of the specimen, respectively. The constant is determined from a least squares plot of the delamination length ( ) normalized by specimen thickness ( ) versus the cube root of the corresponding compliance:
(2)
with , where is the initial delamination length and its growth, and is also determined from the least squares fit. Static test results are shown in Table I for Source 1 and Source 2.
4
TABLE I. STATIC DCB DATA [6]
Source 1 68.8 1.37 -1.12 Source 2 69.2 1.57 -1.14
Constant-amplitude fatigue tests were conducted to generate a delamination onset threshold curve, and delamination growth data. The specimen preparation and test apparatus were identical for the static and fatigue testing. All fatigue tests were conducted under displacement control, at a frequency of 5 cycles/second. The ratio of minimum displacement to maximum displacement (R-ratio) was . To generate the delamination onset threshold curve, specimens of each source were tested at a range of initial cyclic levels chosen as a percentage of the average (Table 1) from the static tests. A minimum of four specimens from each source was tested at target initial levels equal to 50, 40, and 30% of . Additionally, two specimens from Source 1 were tested at approximately 70% . Delamination onset was defined as the cycle count at which the specimen compliance had increased by 5% [10]. Delamination growth data were generated by continuing the fatigue tests beyond the moment of growth onset. Specimens were cycled until the delamination growth rate had decreased to at least 1×10⁻⁷ in/cycle or until no growth had been detected by at least 1.5×10⁶ cycles. During the fatigue testing, a computer system recorded the loads, displacements, compliance, and cycle count, at every 10 cycles. More details of the testing procedures are provided in ref. 6.
Figure 2. Photograph of a DCB specimen mounted on the test fixture.
DATA REDUCTION PROCEDURE
5
In this section, the procedure used in [6], where the delamination growth rate is determined by normalizing the applied by the R-curve, is reviewed. Next, a proposed methodology to determine Mode I delamination fatigue growth rate both with and without fiber-bridging, and , respectively, is described in detail. Additionally, a procedure is demonstrated which uses to determine an
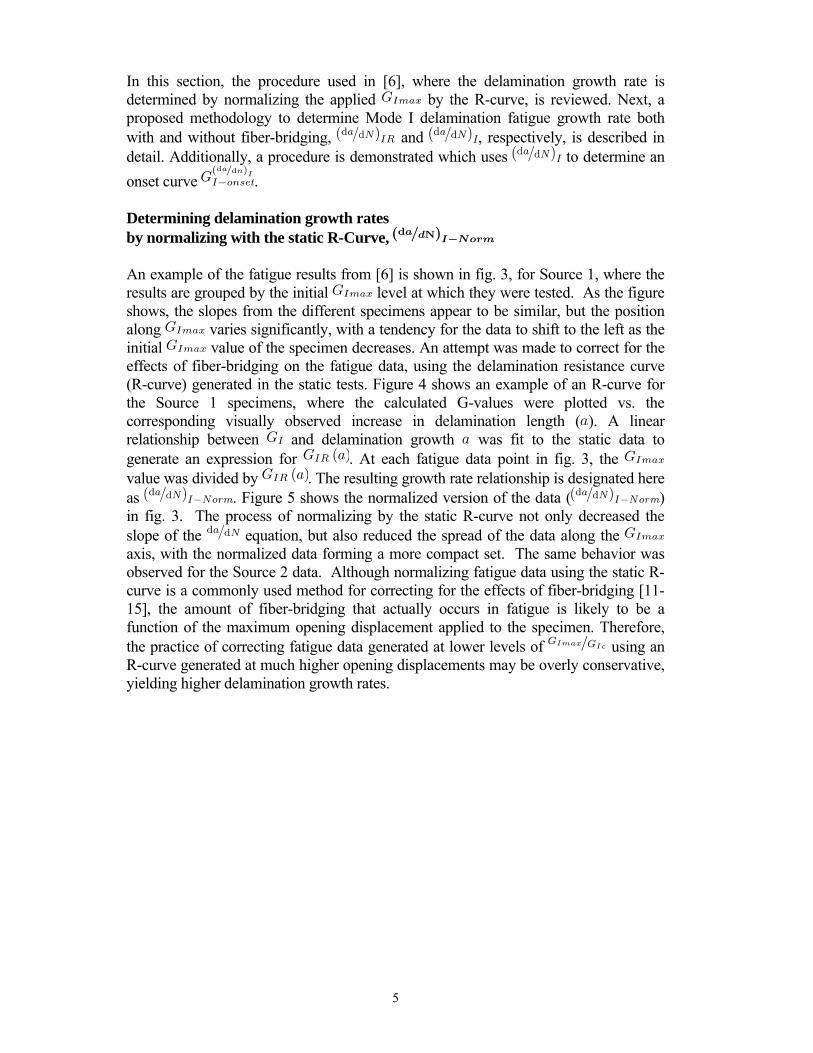
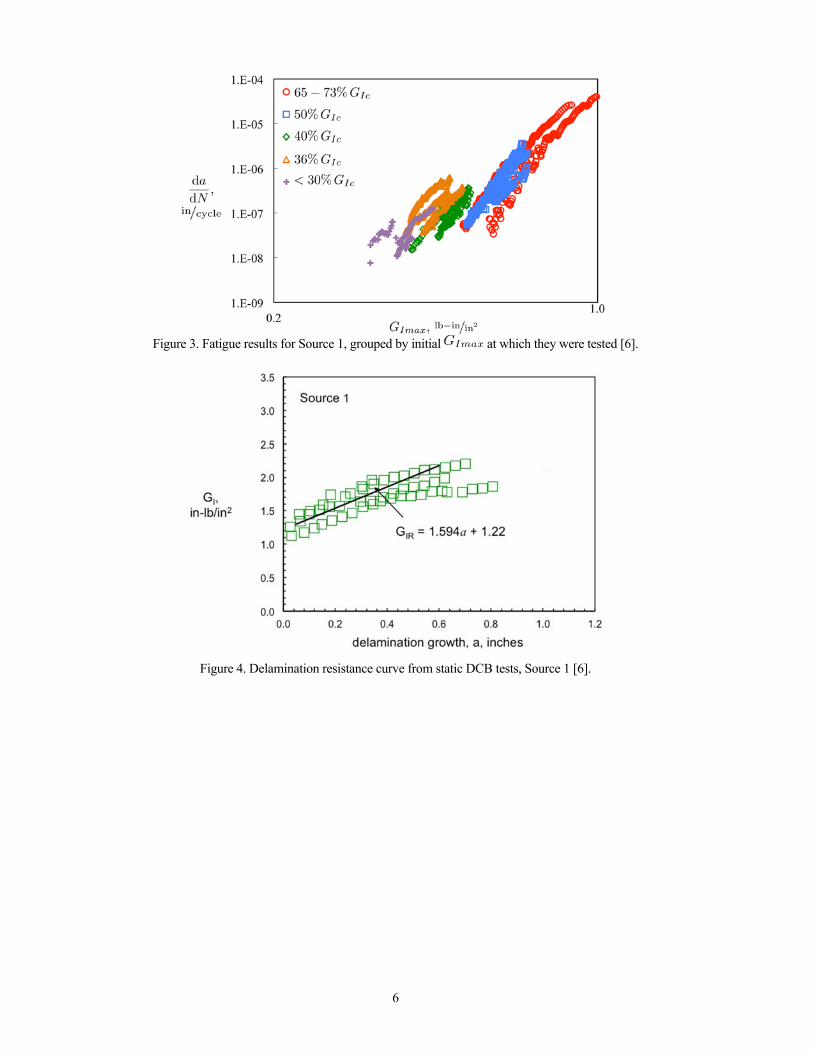
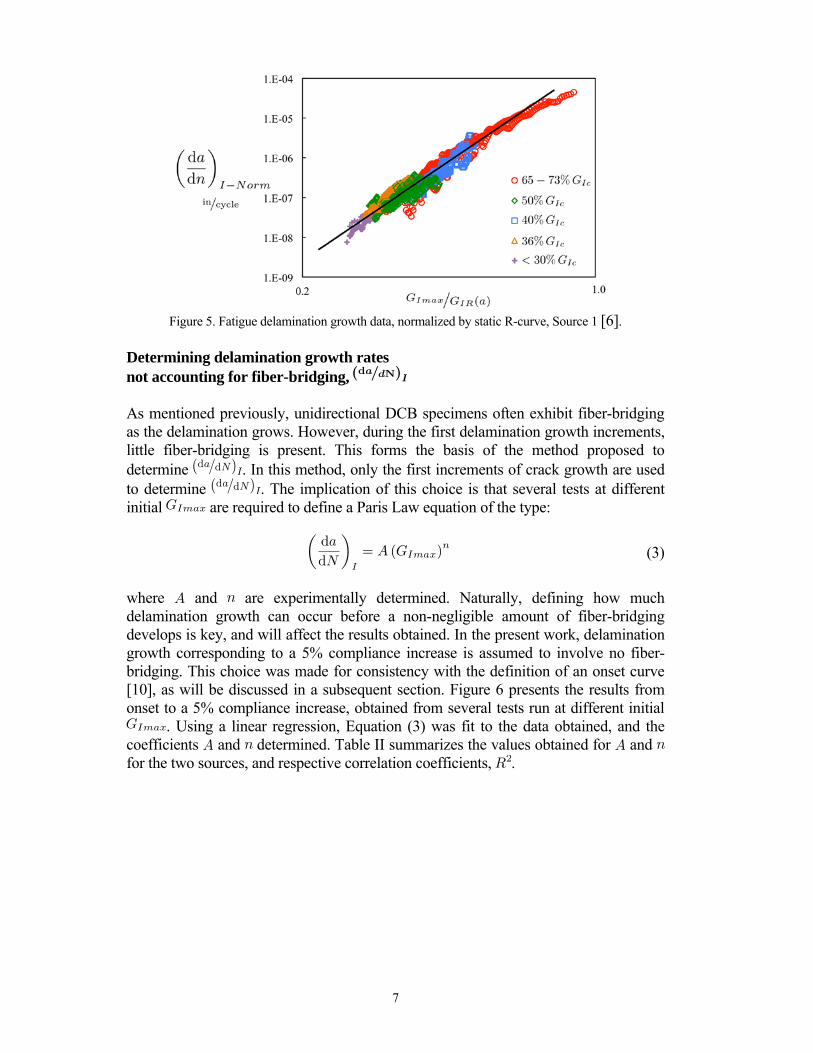
onset curve . Determining delamination growth rates by normalizing with the static R-Curve, An example of the fatigue results from [6] is shown in fig. 3, for Source 1, where the results are grouped by the initial level at which they were tested. As the figure shows, the slopes from the different specimens appear to be similar, but the position along varies significantly, with a tendency for the data to shift to the left as the initial value of the specimen decreases. An attempt was made to correct for the effects of fiber-bridging on the fatigue data, using the delamination resistance curve (R-curve) generated in the static tests. Figure 4 shows an example of an R-curve for the Source 1 specimens, where the calculated G-values were plotted vs. the corresponding visually observed increase in delamination length ( ). A linear relationship between and delamination growth was fit to the static data to generate an expression for . At each fatigue data point in fig. 3, the value was divided by . The resulting growth rate relationship is designated here as . Figure 5 shows the normalized version of the data ( ) in fig. 3. The process of normalizing by the static R-curve not only decreased the slope of the equation, but also reduced the spread of the data along the axis, with the normalized data forming a more compact set. The same behavior was observed for the Source 2 data. Although normalizing fatigue data using the static R-curve is a commonly used method for correcting for the effects of fiber-bridging [11-15], the amount of fiber-bridging that actually occurs in fatigue is likely to be a function of the maximum opening displacement applied to the specimen. Therefore, the practice of correcting fatigue data generated at lower levels of using an R-curve generated at much higher opening displacements may be overly conservative, yielding higher delamination growth rates.
6
Figure 3. Fatigue results for Source 1, grouped by initial at which they were tested [6].
Figure 4. Delamination resistance curve from static DCB tests, Source 1 [6].
7
Figure 5. Fatigue delamination growth data, normalized by static R-curve, Source 1 [6].
Determining delamination growth rates not accounting for fiber-bridging, As mentioned previously, unidirectional DCB specimens often exhibit fiber-bridging as the delamination grows. However, during the first delamination growth increments, little fiber-bridging is present. This forms the basis of the method proposed to determine . In this method, only the first increments of crack growth are used to determine . The implication of this choice is that several tests at different initial are required to define a Paris Law equation of the type:
(3)
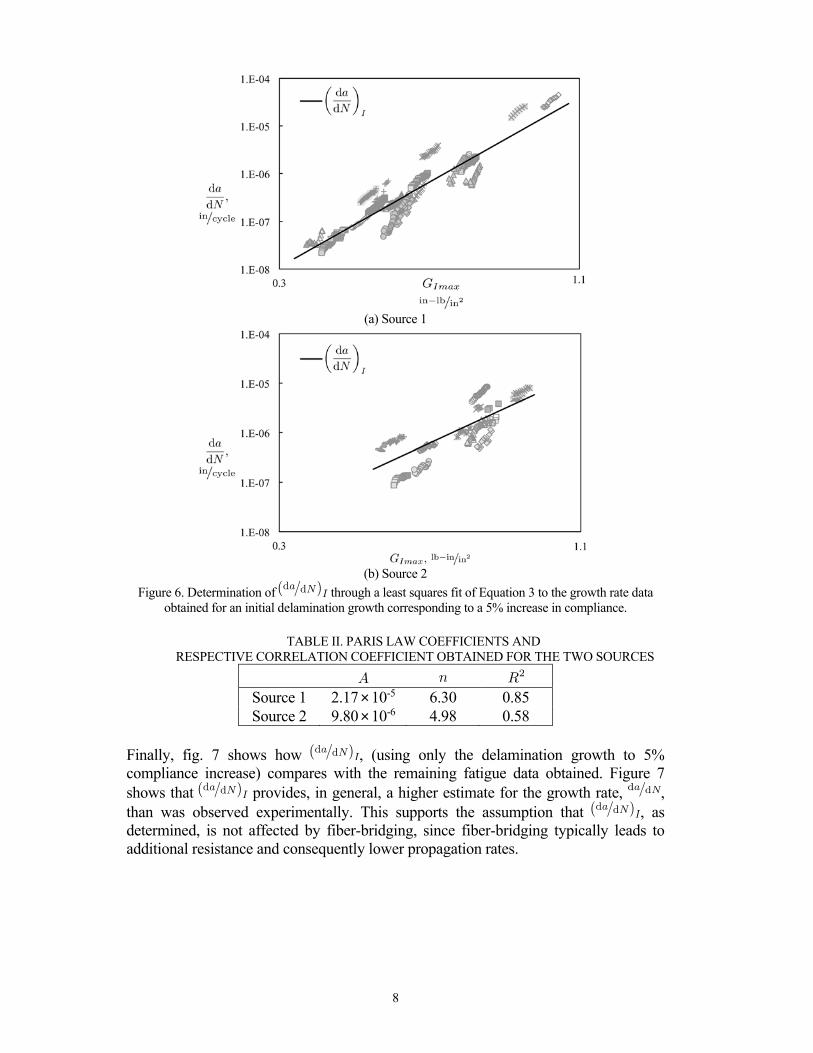
where and are experimentally determined. Naturally, defining how much delamination growth can occur before a non-negligible amount of fiber-bridging develops is key, and will affect the results obtained. In the present work, delamination growth corresponding to a 5% compliance increase is assumed to involve no fiber-bridging. This choice was made for consistency with the definition of an onset curve [10], as will be discussed in a subsequent section. Figure 6 presents the results from onset to a 5% compliance increase, obtained from several tests run at different initial
. Using a linear regression, Equation (3) was fit to the data obtained, and the coefficients and determined. Table II summarizes the values obtained for and for the two sources, and respective correlation coefficients, .
8
(a) Source 1
(b) Source 2
Figure 6. Determination of through a least squares fit of Equation 3 to the growth rate data obtained for an initial delamination growth corresponding to a 5% increase in compliance.
TABLE II. PARIS LAW COEFFICIENTS AND
RESPECTIVE CORRELATION COEFFICIENT OBTAINED FOR THE TWO SOURCES
Source 1 2.17×10⁻⁵ 6.30 0.85 Source 2 9.80×10⁻⁶ 4.98 0.58
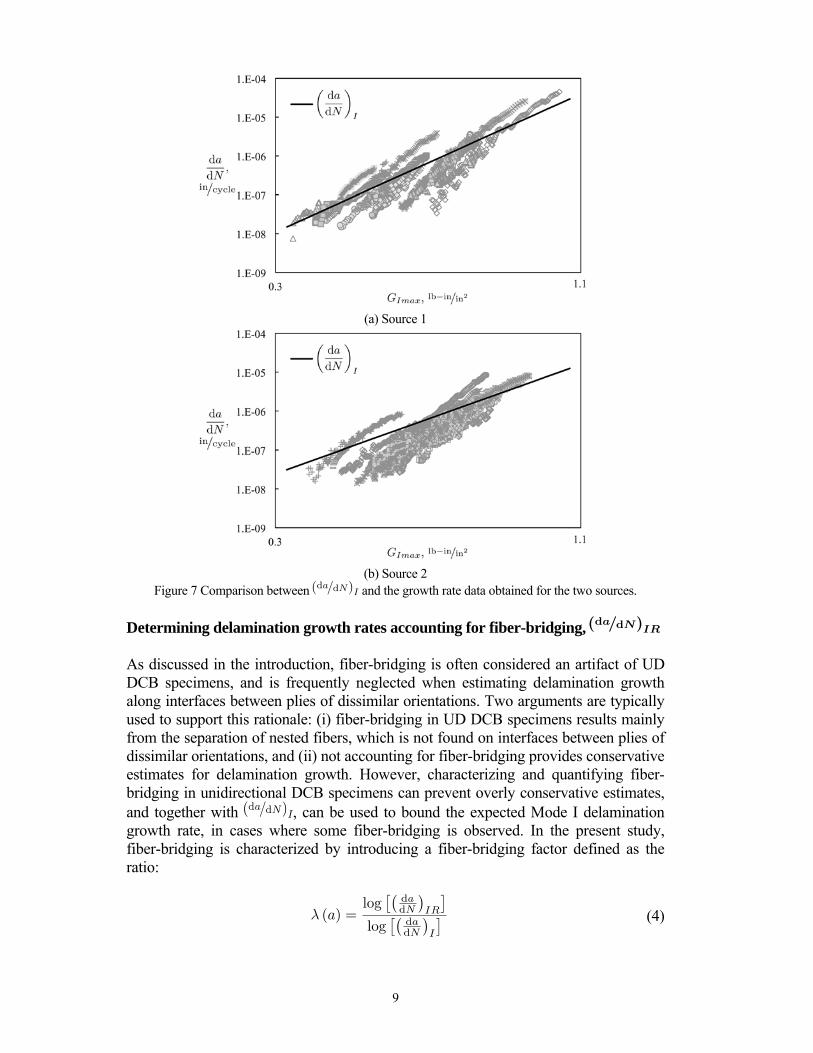
Finally, fig. 7 shows how , (using only the delamination growth to 5% compliance increase) compares with the remaining fatigue data obtained. Figure 7 shows that provides, in general, a higher estimate for the growth rate, , than was observed experimentally. This supports the assumption that , as determined, is not affected by fiber-bridging, since fiber-bridging typically leads to additional resistance and consequently lower propagation rates.
9
(a) Source 1
(b) Source 2
Figure 7 Comparison between and the growth rate data obtained for the two sources. Determining delamination growth rates accounting for fiber-bridging, As discussed in the introduction, fiber-bridging is often considered an artifact of UD DCB specimens, and is frequently neglected when estimating delamination growth along interfaces between plies of dissimilar orientations. Two arguments are typically used to support this rationale: (i) fiber-bridging in UD DCB specimens results mainly from the separation of nested fibers, which is not found on interfaces between plies of dissimilar orientations, and (ii) not accounting for fiber-bridging provides conservative estimates for delamination growth. However, characterizing and quantifying fiber- bridging in unidirectional DCB specimens can prevent overly conservative estimates, and together with , can be used to bound the expected Mode I delamination growth rate, in cases where some fiber-bridging is observed. In the present study, fiber-bridging is characterized by introducing a fiber-bridging factor defined as the ratio:
(4)
10
where is the delamination growth rate without fiber-bridging, as determined in the previous section, (Equation 3), and is the growth rate accounting for fiber-bridging. In the present study, fiber-bridging is assumed to vary with crack length only, . Combining Equations 3 and 4, can be simply written as:
(5)
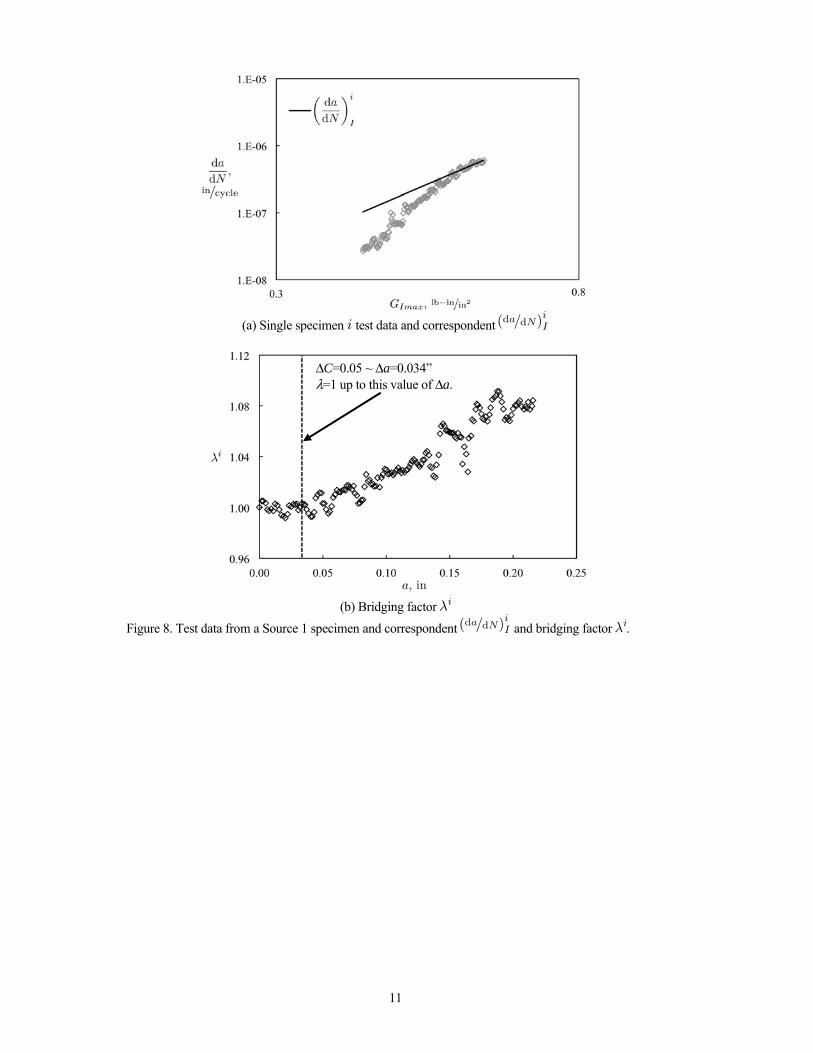
where and are the Paris law coefficients of , obtained in the previous section, and is the delamination growth. Next, a method to obtain an approximate expression for is proposed. For each specimen , the ratio:
(6)
is determined, where is the fatigue data obtained from the complete test, and
is determined by fitting a Paris Law to the first increments of delamination growth, corresponding to a 5% increase in compliance. Figure 8(a) shows the
data and for a specimen from Source 1. Figure 8(b) shows the calculated vs. delamination growth from Equation 6.
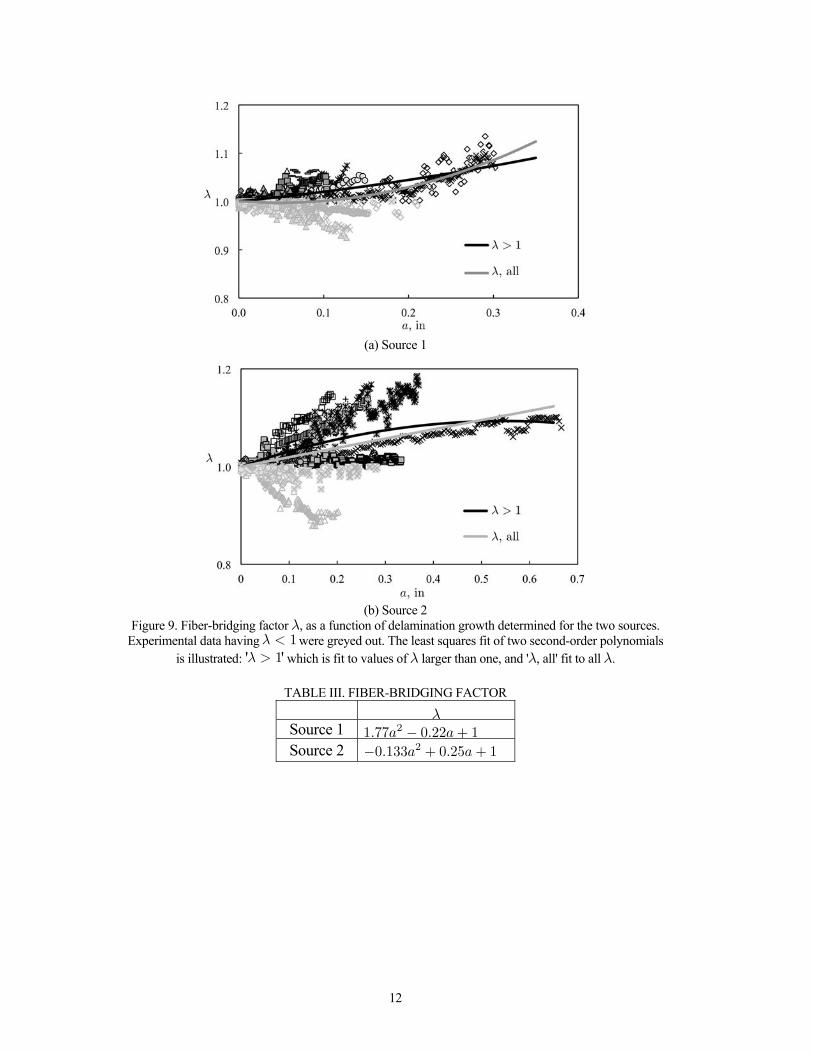
All individual for Sources 1 and 2 are presented in fig. 9. Growth rates corresponding to were not used, to avoid using experimental
data outside the fatigue linear regime. Figure 9 shows that some specimens exhibit a negative . This typically results from a high delamination rate verified at the onset,
and used to determine . Nevertheless, a positive trend can be identified for both sources. Additionally, fig. 9 shows that the best fit of a quadratic polynomial to all values of , labeled ' , all', or only to values of larger than one, labeled ' ', gives similar results. The choice of a second-order polynomial for is empirical, and other expressions can be considered. Figure 9(a) shows that, for Source 1 and the delamination growth considered, the fiber-bridging factor does not plateau, which indicates that a steady-state of breaking and generating bridging fibers has not been reached. Although fig. 9(b) (Source 2) also does not show an evident plateau, the specimen tested to the longest delamination growth , seems to exhibit a decreasing gradient for . Table III provides the expressions for the bridging factors obtained for the two sources corresponding to the curves ' , all', in fig. 9.
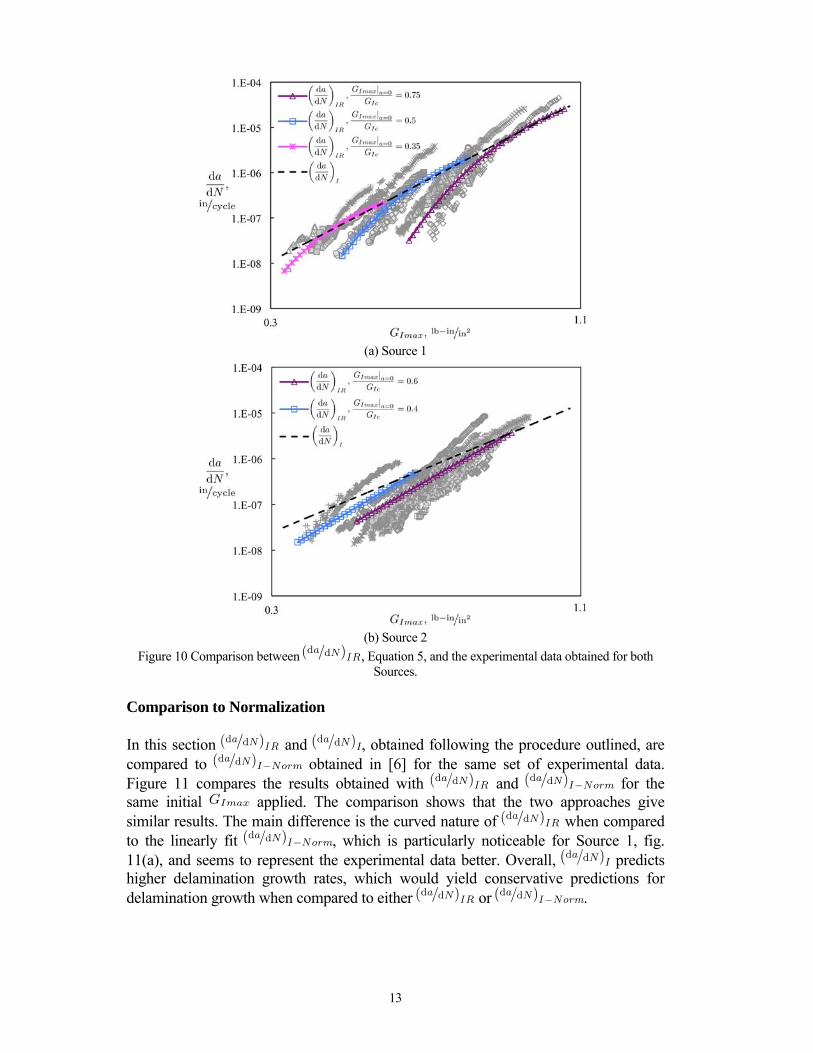
Having determined (Table III), and and , (Table II), Equation 5 is now fully defined for both sources. Figure 10 presents the curves obtained with , Equation 5, for different values of initial applied. Note that each test is run at a fixed applied displacement, which leads to a decrease in applied as delamination grows. Results show that for both Source 1 and Source 2, Equation 5 is capable of capturing the spread observed in the experimental data. This is particularly noticeable for Source 1 where the observed spread was higher. Additionally, often tests show an increase in the gradient of as the test progresses (and decreases) which is also well captured by Equation 5.
11
(a) Single specimen test data and correspondent
(b) Bridging factor
Figure 8. Test data from a Source 1 specimen and correspondent and bridging factor .
ΔC=0.05 ~ Δa=0.034” λ=1 up to this value of Δa.
12
(a) Source 1
(b) Source 2
Figure 9. Fiber-bridging factor , as a function of delamination growth determined for the two sources. Experimental data having were greyed out. The least squares fit of two second-order polynomials
is illustrated: ' ' which is fit to values of larger than one, and ' , all' fit to all .
TABLE III. FIBER-BRIDGING FACTOR Source 1 Source 2
13
(a) Source 1
(b) Source 2
Figure 10 Comparison between , Equation 5, and the experimental data obtained for both Sources.
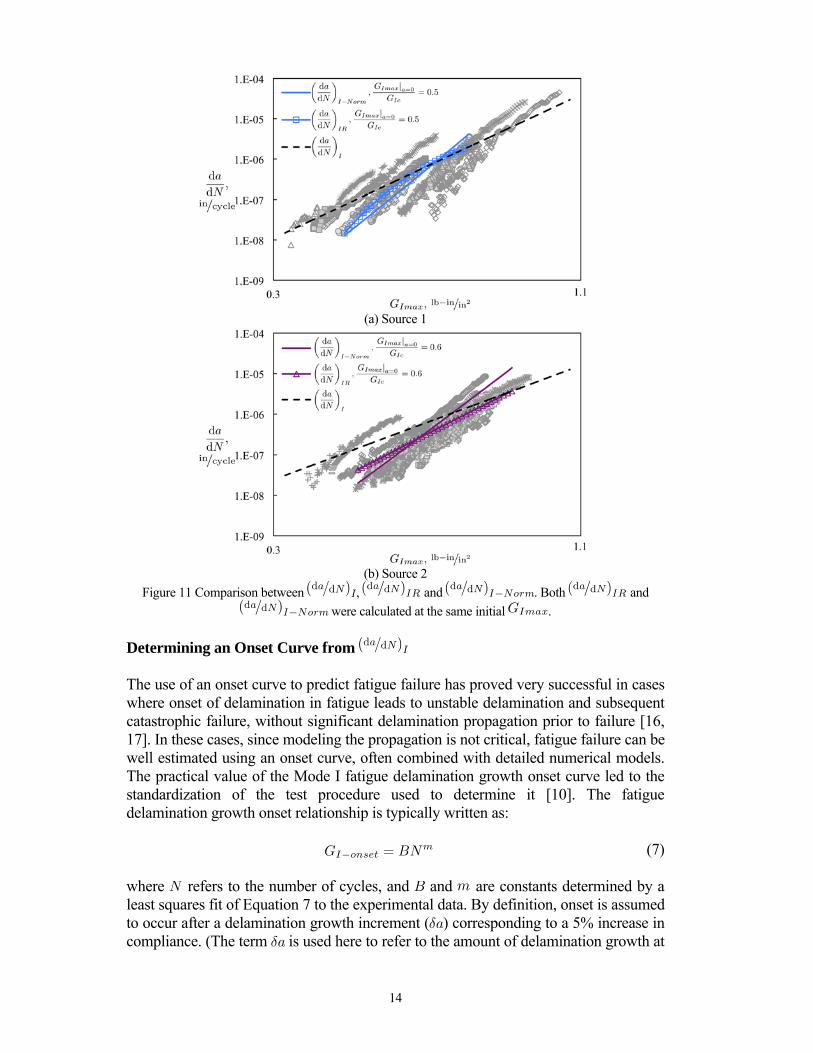
Comparison to Normalization In this section and , obtained following the procedure outlined, are compared to obtained in [6] for the same set of experimental data. Figure 11 compares the results obtained with and for the same initial applied. The comparison shows that the two approaches give similar results. The main difference is the curved nature of when compared to the linearly fit , which is particularly noticeable for Source 1, fig. 11(a), and seems to represent the experimental data better. Overall, predicts higher delamination growth rates, which would yield conservative predictions for delamination growth when compared to either or .
14
(a) Source 1
(b) Source 2
Figure 11 Comparison between , and . Both and
were calculated at the same initial . Determining an Onset Curve from The use of an onset curve to predict fatigue failure has proved very successful in cases where onset of delamination in fatigue leads to unstable delamination and subsequent catastrophic failure, without significant delamination propagation prior to failure [16, 17]. In these cases, since modeling the propagation is not critical, fatigue failure can be well estimated using an onset curve, often combined with detailed numerical models. The practical value of the Mode I fatigue delamination growth onset curve led to the standardization of the test procedure used to determine it [10]. The fatigue delamination growth onset relationship is typically written as:
(7) where refers to the number of cycles, and and are constants determined by a least squares fit of Equation 7 to the experimental data. By definition, onset is assumed to occur after a delamination growth increment ( ) corresponding to a 5% increase in compliance. (The term is used here to refer to the amount of delamination growth at
15
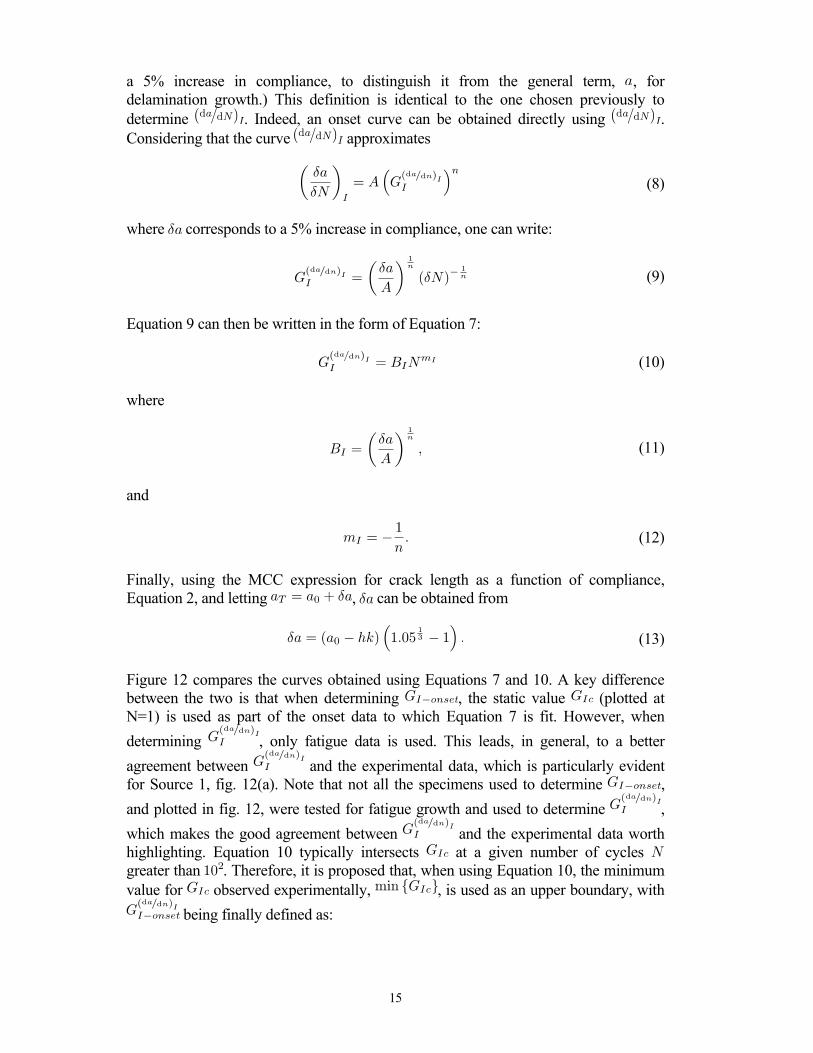
a 5% increase in compliance, to distinguish it from the general term, , for delamination growth.) This definition is identical to the one chosen previously to determine . Indeed, an onset curve can be obtained directly using . Considering that the curve approximates
(8)
where corresponds to a 5% increase in compliance, one can write:
(9)
Equation 9 can then be written in the form of Equation 7:
(10) where
(11)
and
(12)
Finally, using the MCC expression for crack length as a function of compliance, Equation 2, and letting , can be obtained from
(13)
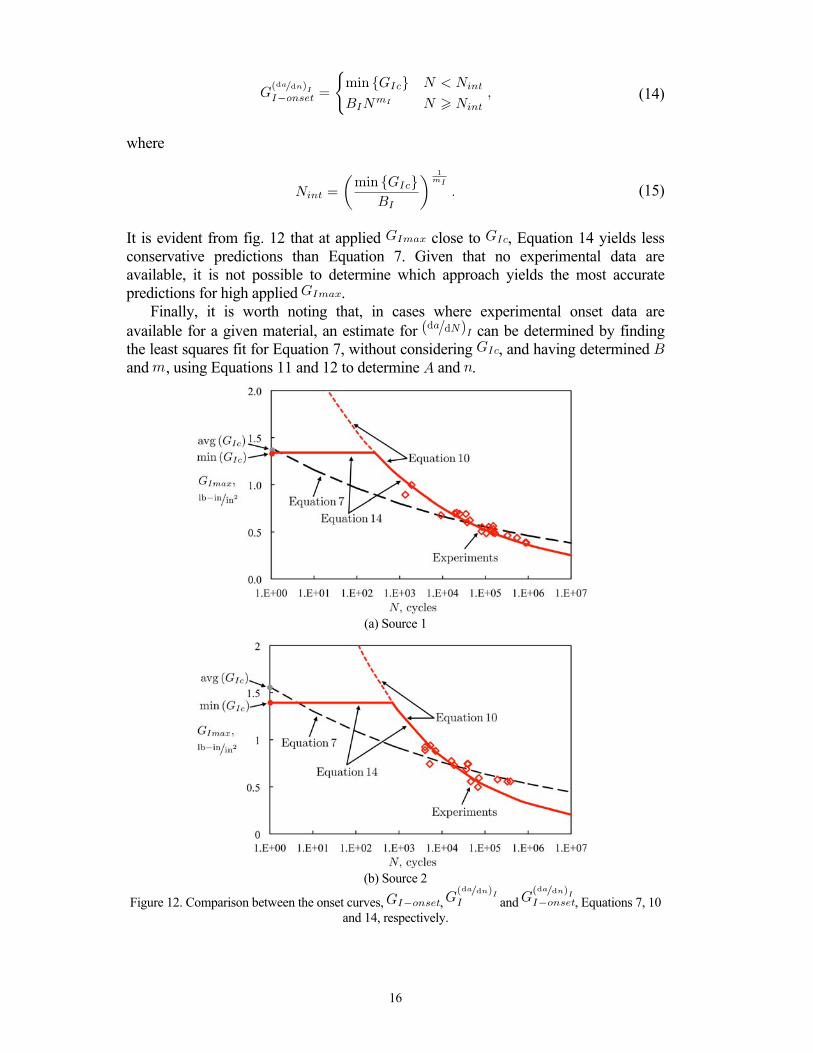
Figure 12 compares the curves obtained using Equations 7 and 10. A key difference between the two is that when determining , the static value (plotted at N=1) is used as part of the onset data to which Equation 7 is fit. However, when
determining , only fatigue data is used. This leads, in general, to a better
agreement between and the experimental data, which is particularly evident for Source 1, fig. 12(a). Note that not all the specimens used to determine ,
and plotted in fig. 12, were tested for fatigue growth and used to determine ,
which makes the good agreement between and the experimental data worth highlighting. Equation 10 typically intersects at a given number of cycles greater than . Therefore, it is proposed that, when using Equation 10, the minimum value for observed experimentally, , is used as an upper boundary, with
being finally defined as:
16
(14)
where
(15)
It is evident from fig. 12 that at applied close to , Equation 14 yields less conservative predictions than Equation 7. Given that no experimental data are available, it is not possible to determine which approach yields the most accurate predictions for high applied .
Finally, it is worth noting that, in cases where experimental onset data are available for a given material, an estimate for can be determined by finding the least squares fit for Equation 7, without considering , and having determined and , using Equations 11 and 12 to determine and .
(a) Source 1
(b) Source 2
Figure 12. Comparison between the onset curves, , and , Equations 7, 10 and 14, respectively.
17
DISCUSSION The procedure outlined in the previous section provides an estimate for and
, the Mode I delamination growth rates with and without fiber-bridging, respectively. As expected, yields a more conservative estimate for delamination growth under Mode I fatigue loading (higher delamination growth rates) than , (see fig. 10). This is of particular significance since at a generic interface between plies of dissimilar orientation, the expected fiber-bridging is less (if any) than that typically observed in DCB specimens, and therefore using (or
) can lead to an underestimation of the delamination growth, yielding non-conservative predictions. On the other hand, the expression proposed for
, and the method used to characterize it, is capable of capturing well the observed spread in the experimental data, (fig. 10), suggesting its adequacy to characterize the effect of fiber-bridging as observed in DCB specimens. Furthermore, it is also shown that gives similar results to these obtained with the normalization approach . The main difference between the two is that
captures the experimentally observed increase in gradient of with decreasing .
Overall, the approach proposed in the present work has the following key advantages over the commonly proposed normalization approach (e.g., [1, 6, 15]: (i) delamination growth rates are estimated with and without fiber-bridging; (ii) only fatigue data are used to characterize both and ; and (iii) no relationship is assumed between fiber-bridging in quasi-static loading and in fatigue. CONCLUSIONS A novel method is proposed to obtain Mode I delamination growth rate from a DCB specimen. The method enables determination of the Mode I delamination growth rates with and without fiber-bridging, and , respectively. Results show that the expression proposed for is capable of capturing well the spread observed in the experimental data, suggesting its adequacy to characterize the effect of fiber-bridging as observed in DCB specimens. Compared to , the growth rate
provides a conservative estimate for delamination growth. This is of key importance since at a generic interface between plies of dissimilar orientation the expected fiber-bridging is less than that observed in DCB specimens. Therefore, the use of can lead to non-conservative predictions, where the predicted delamination growth is less than actually verified. Finally, a procedure to obtain an onset curve from is also outlined, showing good agreement with experimental data.
18
REFERENCES 1. “Standard Test Method for Mode I Fatigue Delamination Propagation of Unidirectional Fiber-
Reinforced Polymer Matrix Composites,” Draft standard, ASTM International, Committee D30 on Composites, 2009.
2. Suo, Z., G. Bao, B. Fan. 1992. “Delamination R-curve Phenomena Due to Damage,” Journal of the Mechanics and Physics of Solids, 40(1):1-16.
3. Robinson, P., D.Q. Song. 1992. “A Modified DCB Specimen for Mode I Testing of Multidirectional Laminates,” Journal of Composite Materials, 26(11):1554-1577.
4. Hallett, S. R., W. G. Jiang, B. Khan and M. R. Wisnom. 2008. “Modelling the Interaction Between Matrix Cracks and Delamination Damage in Scaled Quasi-isotropic Specimens,” Composites Science and Technology, 68(1):80-89.
5. Iarve, E. V., M. R. Gurvich, D. H. Mollenhauer, C. A. Rose and C. G. Dávila. 2011. “Mesh-Independent Matrix Cracking and Delamination Modeling in Laminated Composites,” International Journal for Numerical Methods in Engineering, 88(8):749-773.
6. Murri, G. B. 2013. “Evaluation of Delamination Onset and Growth Characterization Methods Under Mode I Fatigue Loading,” NASA/TM-2013-217966.
7. Martin, R. H, G.B. Murri. 1998. “Characterization of Mode I and Mode II Delamination Growth and Thresholds in Graphite/Peek Composites,” NASA/TM-100577 AVSCOM/TM-88-B-011.
8. Pascoe, J. A., R. C. Alderliesten, and R. Benedictus. 2013. “Methods for the Prediction of Fatigue Delamination Growth in Composites and Adhesive Bonds - A Critical Review,” Engineering Fracture Mechanics 112-113: 72-96.
9. ASTM D 5528-13. 2014. “Standard Test Method for Mode I Interlaminar Fracture Toughness of Unidirectional Fiber-Reinforced Polymer Matrix Composites,” in Annual Book of ASTM Standards. Vol. 15.03, American Society for Testing and Materials, 2014.
10. ASTM D 6115-97. 2011. “Standard Test Method for Mode I Fatigue Delamination Growth Onset of Unidirectional Fiber-Reinforced Polymer Matrix Composites,” in Annual Book of ASTM Standards. Vol. 15.03, American Society for Testing and Materials, 2014.
11. Poursartip, A. 1987. “The Characterization of Edge Delamination Growth in Laminates Under Fatigue Loading,” Toughened Composites, ASTM STP 937, Norman J. Johnston, Ed., American Society for Testing and Materials, Philadelphia, 1987.
12. Shivakumar, K., H. Chen, and F. Abali. 2006. “A Total Fatigue Life Model for Mode I Loaded Composite Laminates,” International Journal of Fatigue, 28(1):33-42.
13. Giannis, S., K. Hansen, and R. H. Martin. 2010. “Accounting for the R-curve Effects on the Mode I Fatigue Delamination Growth Characterisation of Unidirectional Composites,” in Proceedings of the American Society for Composites, Twenty-fifth Technical Conference, Dayton, Ohio, September 20-22, 2010.
14. Murri, G. B. 2011. “Effect of Data Reduction and Fiber-Bridging on Mode I Delamination Characterization of Unidirectional Composites,” in Proceedings of the American Society for Composites, 26th ASC Annual Technical Conference/2nd Joint US-Canada Conference on Composites, Montreal, Quebec, Canada, September 26-28, 2011.
15. “Fatigue Fracture Toughness,” in Composite Materials Handbook CMH-17, Rev. G, Vol. 1, Section 6.9.4, SAE International, 2012.
16. Murri, G. B., T. K. O’Brien, and C. Q. Rousseau. 1998. “Fatigue Life Methodology for Tapered Composite Flexbeam Laminates,” Journal of the American Helicopter Society, 43(2):146-155.
17. Krueger, R., I. L. Paris, T. K. O’Brien and P. J. Minguet. 2001. “Fatigue Life Methodology for Bonded Composite Skin/Stringer Configurations,” NASA/TM-2001-210842 ARL-TR-2432.


![5 Fracture and Fatigue Models for Compositesstructures.dhu.edu.cn/_upload/article/files/14/76/... · to simulate delamination processes [362] and fatigue damage [62,277] in fibre-](https://img.pdfslide.us/doc/110x75/60cab7d5f65603418c5f1103/5-fracture-and-fatigue-models-for-to-simulate-delamination-processes-362-and-fatigue.jpg)