SIZE EFFECT IN CONCRETE STRUCTURES: FAILURES, SAFETY AND...
97
SPONSORS: DoT – ITI, NSF fib HUNGARIAN GROUP & TU BUDAPEST, MAY 10, 2016 SIZE EFFECT IN CONCRETE STRUCTURES: FAILURES, SAFETY AND DESIGN CODES Z D E N Ě K P. B A Ž A N T MAIN COLLABORATORS: QIANG YU, M.T. KAZEMI
SIZE EFFECT IN CONCRETE STRUCTURES: FAILURES, SAFETY AND ...fib.bme.hu/2016-05-10-fib-ankent/fib_SizEff-Failures.pdf · SIZE EFFECT IN CONCRETE STRUCTURES: FAILURES, SAFETY AND DESIGN
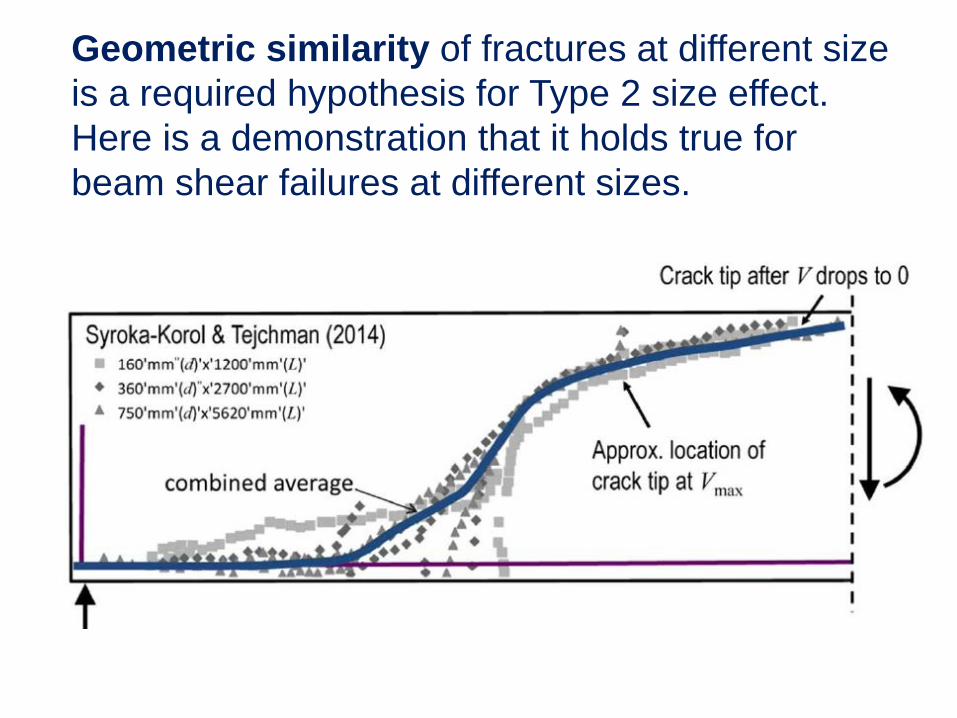
Geometric similarity of fractures at different size is a required hypothesis for Type 2 size effect Here is a demonstration that it holds true for beam shear failures at different sizes
Small Large
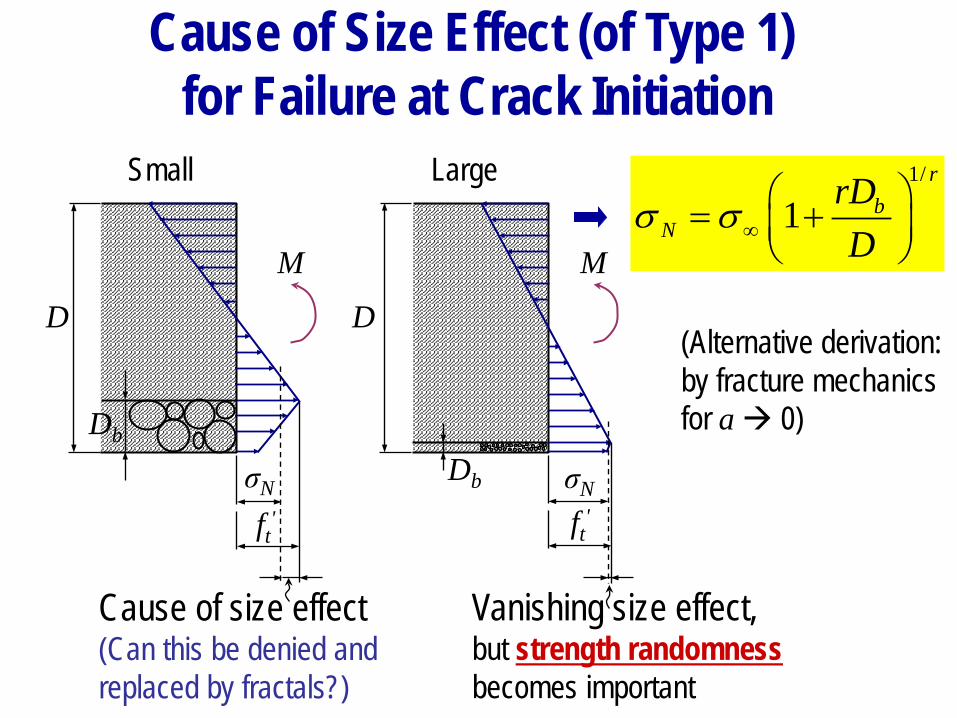
Cause of Size Effect (of Type 1) for Failure at Crack Initiation
D
Db
D
Db
M M
ft ft
σN σN
Cause of size effect(Can this be denied andreplaced by fractals)
Vanishing size effect but strength randomnessbecomes important
1
1r
bN
rDDinfin
= +
σ σ
(Alternative derivationby fracture mechanicsfor a 0)
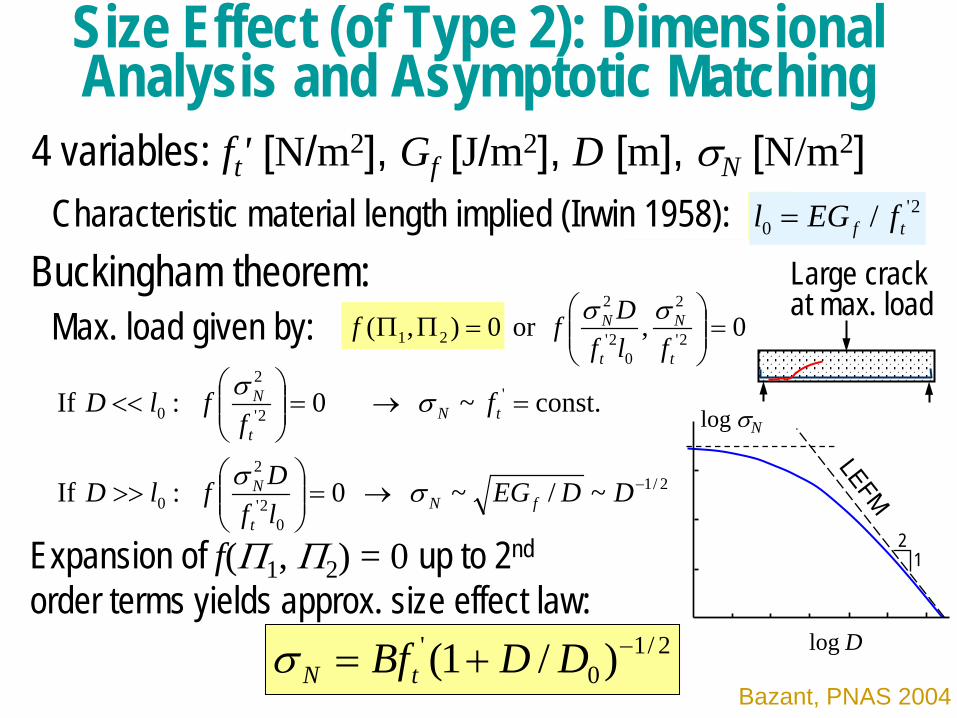
Size Effect (of Type 2) Dimensional Analysis and Asymptotic Matching
0 or 0)( 2
2
02
2
21 =
=ΠΠ
t
N
t
N
flfDff σσ
20 tf fEGl =
21
02
2
0
2
2
0
~~ 0 If
const~ 0 If
minusrarr=
gtgt
=rarr=
ltlt
DDEGlfDflD
ff
flD
fNt
N
tNt
N
σσ
σσ
4 variables ft [Nm2] Gf [Jm2] D [m] σN [Nm2]Characteristic material length implied (Irwin 1958)
Buckingham theoremMax load given by
Expansion of f(Π1 Π2) = 0 up to 2nd
order terms yields approx size effect law21
0 )1( minus+= DDBftNσ
21
log σN
log D
Large crack at max load
Bazant PNAS 2004
Derivations of Size Effect Law1 Analyticalndash Simplified energy release analysisndash Simplified contour integration of J-
integralndash Dimensional analysis with
asymptotic matchingndash Asymptotic transformations of
diffeqs with boundary conditionsndash Asymptotic analysis of equivalent
LEFMndash Asymptotics of cohesive crack
model (smeared-tip method)ndash Asymptotic expansion of J-integralndash Deterministic limit of probabilistic
nonlocal theory
2 Numericalndash FEM with strongly nonlocal damage modelsndash FEM with gradient (weakly nonlocal) modelsndash Random Lattice Discrete Particle Modelndash Limit of nonlocal probabilistic FEM
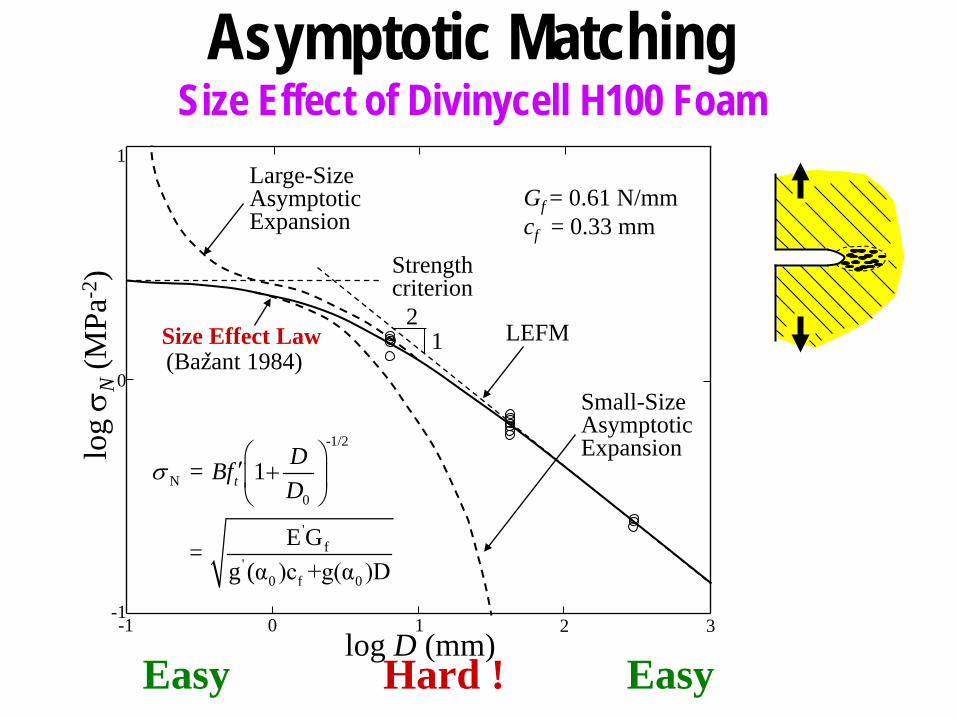
Asymptotic MatchingSize Effect of Divinycell H100 Foam
1
Size Effect Law(Bazant 1984)
Gf = 061 Nmmcf = 033 mm
log D (mm)
log
σ N(M
Pa-2
)
0
-1-1 10 32
Strength criterion
Large-SizeAsymptoticExpansion
21 LEFM
Small-SizeAsymptoticExpansion-12
N0
= 1tDBfD
σ prime +
f
0 f 0
E G=g (α )c +g(α )D
Easy EasyHard
( ) 1 1
0
rN rk minus+= ϑσσ
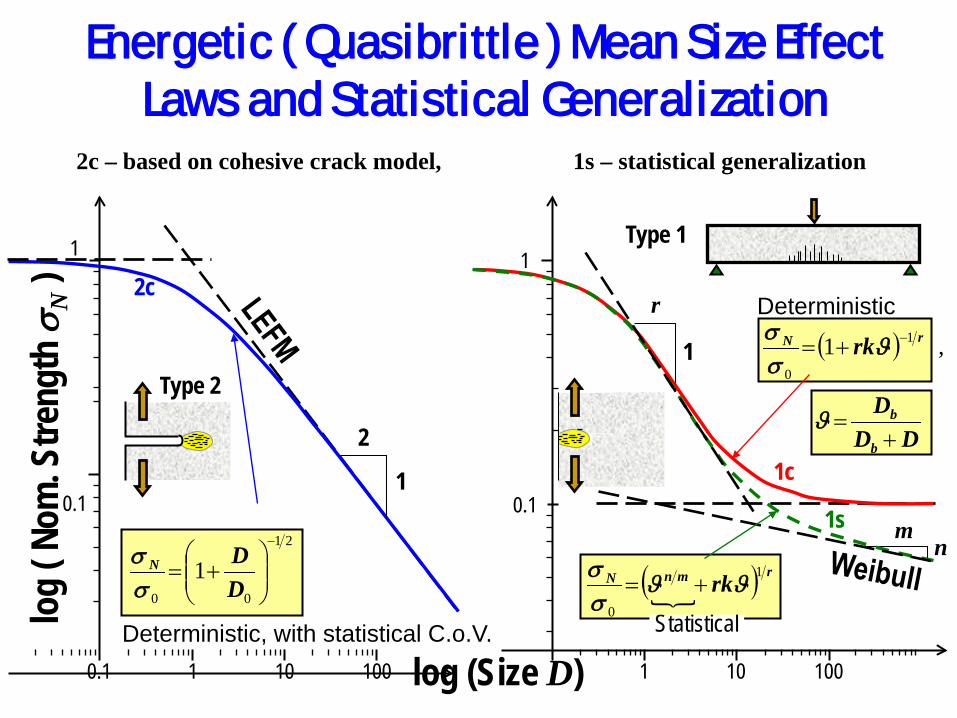
Energetic ( Quasibrittle ) Mean Size EffectLaws and Statistical Generalization
2c ndash based on cohesive crack model 1s ndash statistical generalization
log (Size D)
Type 2
log
( Nom
Stre
ngth
σN
)
1
01
01 1 10 100
2c
2
1
21
00
1minus
+=
DDN
σσ
Type 1
1 10 100
1
01m
n
r
1
( ) rmnN rk 1
0
ϑϑσσ
+=
Statistical
1s
1cDD
D
b
b
+=ϑ
Deterministic
Deterministic with statistical CoV
1000100
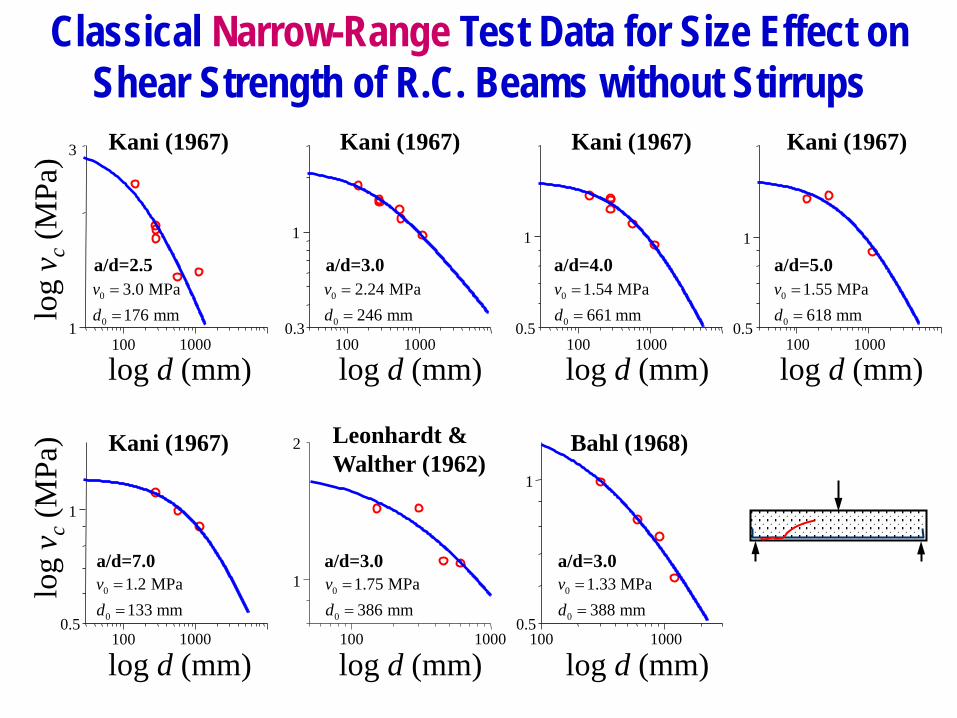
Classical Narrow-Range Test Data for Size Effect on Shear Strength of RC Beams without Stirrups
Kani (1967)
ad=25
Kani (1967)
ad=30
Kani (1967)
ad=40
Kani (1967)
ad=50
Kani (1967)
ad=70
Leonhardt amp Walther (1962)
ad=30
Bahl (1968)
ad=30
1
03
1
05
1
051
3
100 1000 100 1000 100 1000
2
1
100 1000 1000
1
05100
0
0
30 MPa176 mm
vd
=
=0
0
224 MPa246 mm
vd
=
=0
0
154 MPa661 mm
vd
=
=0
0
155 MPa618 mm
vd
=
=
0
0
12 MPa133 mm
vd
=
=0
0
175 MPa386 mm
vd
=
=0
0
133 MPa388 mm
vd
=
=
log
v c(M
Pa)
log
v c(M
Pa)
log d (mm) log d (mm) log d (mm)log d (mm)
1
05100 1000
log d (mm) log d (mm)log d (mm)
Reduced-Scale Tests of Beam Shear Failure at Northwestern (aggregate lt 48 mm)
1 20(1 )N p d dσ σ minus= +
Incorporating the size effect into design code formulas for reinforced concrete is easy
011
dd+=ϑ
Multiply the formula for the strength contribution of concrete by the size effect factor
(type 2 size effect)
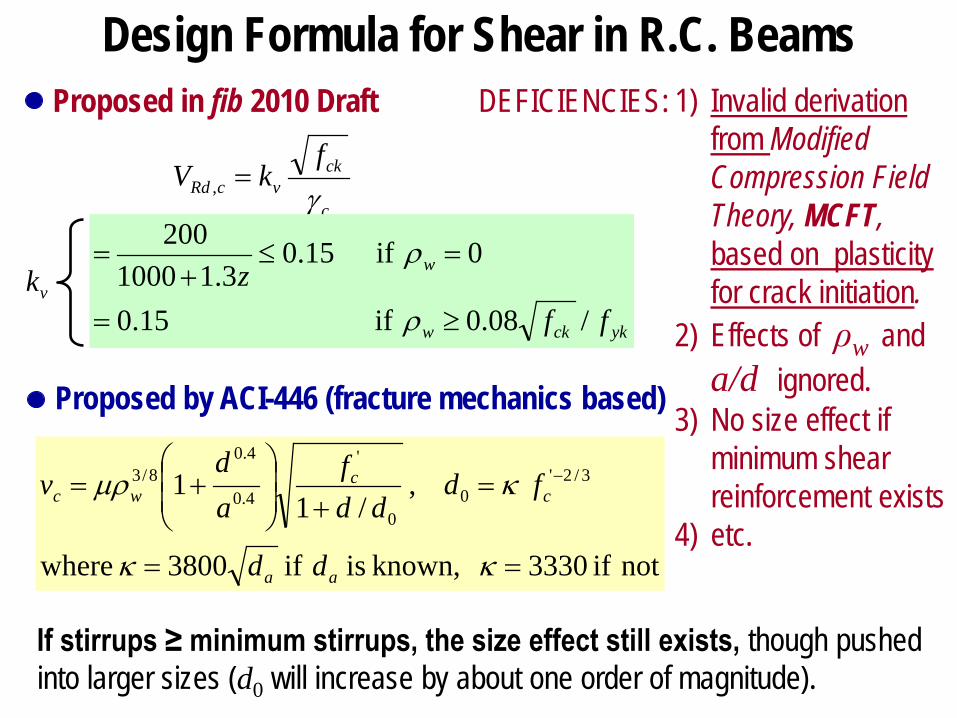
Design Formula for Shear in RC Beams Proposed in fib 2010 Draft 1) Invalid derivation
from Modified Compression Field Theory MCFT based on plasticity for crack initiation
2) Effects of ρw andad ignored
3) No size effect if minimum shear reinforcement exists
4) etc
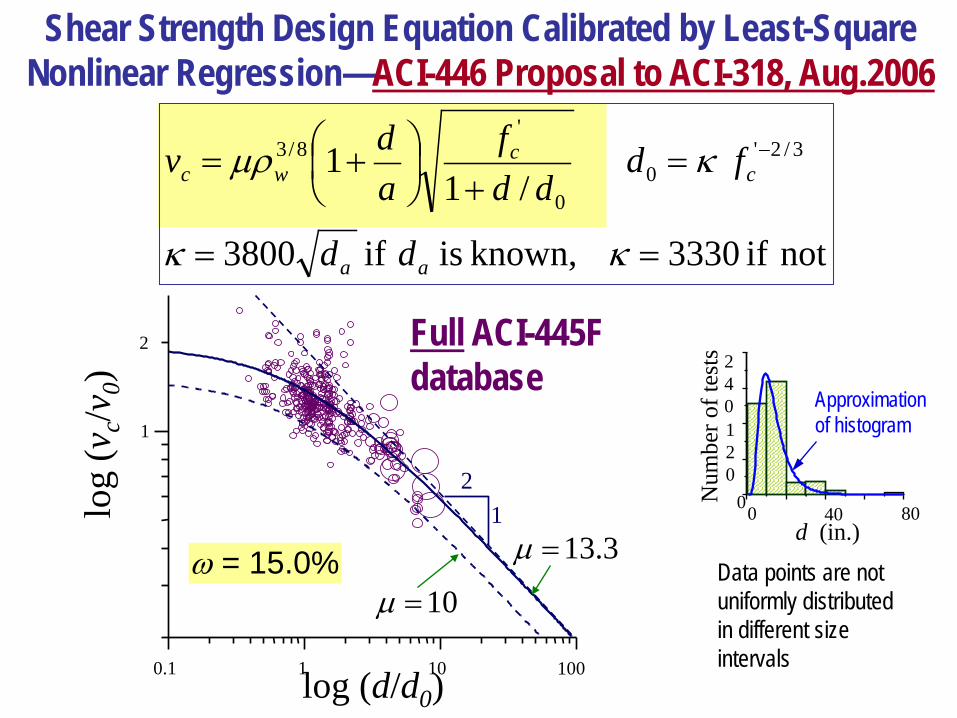
Proposed by ACI-446 (fracture mechanics based)
not if 3330 known is if 3800 where
1
1 320
0
40
4083
==
=+
+= minus
κκ
κmicroρ
aa
cc
wc
dd
fddd
fad
v
c
ckvcRd
fkV
γ=
ykckw
w
ffz
080 if 150
0 if 150311000
200
ge=
=le+
=
ρ
ρvk
If stirrups ge minimum stirrups the size effect still exists though pushed into larger sizes (d0 will increase by about one order of magnitude)
DEFICIENCIES
0
5
10
15
20
25
30
0 2 4 6
Vu
size d
Pd
d) fib Model Code 2010MCVmax
No size effect
VuVu
Vu prop d1
Vu prop d3 4 = d(dminus1 4 )
Vu propd
1+ d d0
Vu propd
1+ cda horizontal asymptote (unphysical)
Comparison of CURVES OF SHEAR FORCE Vu = bw d vu
vs SIZE d in current codes
Note The curves are scaled to the same initial tangent
Stress transmitted across crack is not the reason 2P V=
0C
V
ϕ
c b
0Ra
crack
0001
0074 111 151
3162 10minustimes
sεPodgorniak-Stanik( 1998) TorontoTest BN50
Measured steel strains
1CV
V
1C ϕ
75
0
F
2 cfasympσ
1 tfltltσ
Main diagonal crack
σ
Vσy
σt σn
tf
For small beams the contribution of crack-bridging stress is significant ie 40 while for 18 m deep beams it is negligible ie 9
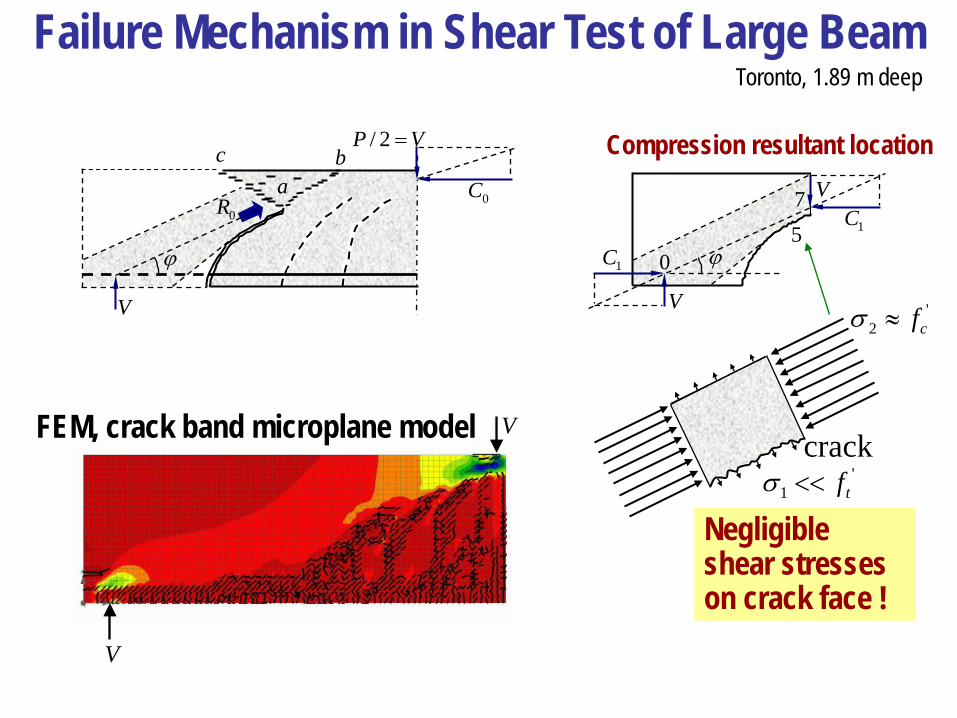
Failure Mechanism in Shear Test of Large Beam
2P V=
0C
V
ϕ
c b
0Ra
1CV
V
1C ϕ
75
0
2 cfσ asymp
crack
Compression resultant location
Negligible shear stresseson crack face
1 tfltltσ
V
V
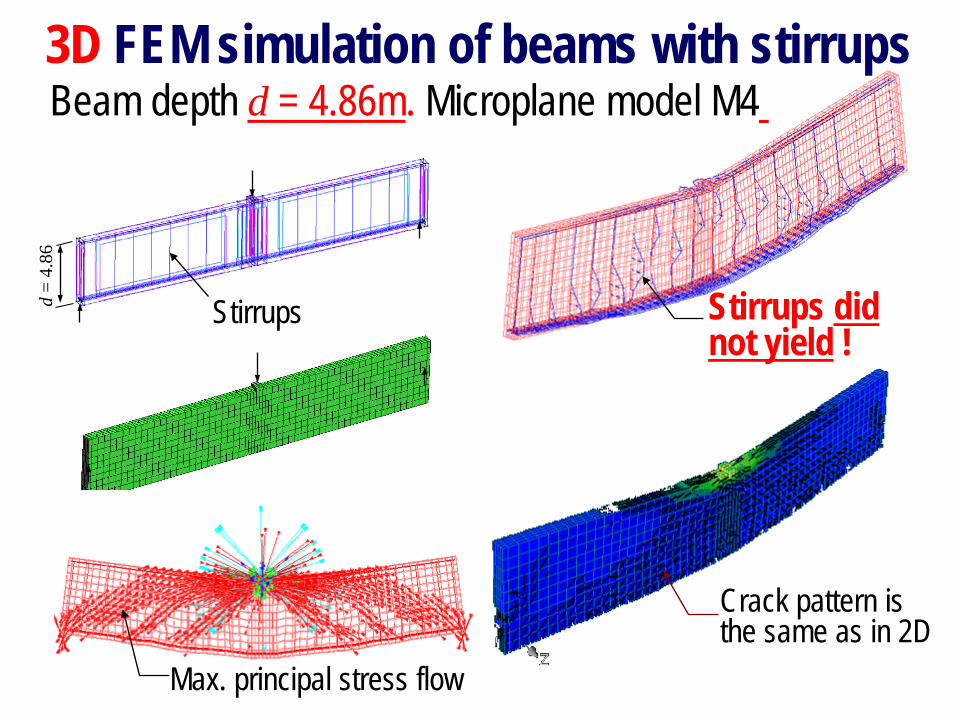
FEM crack band microplane model
Toronto 189 m deep
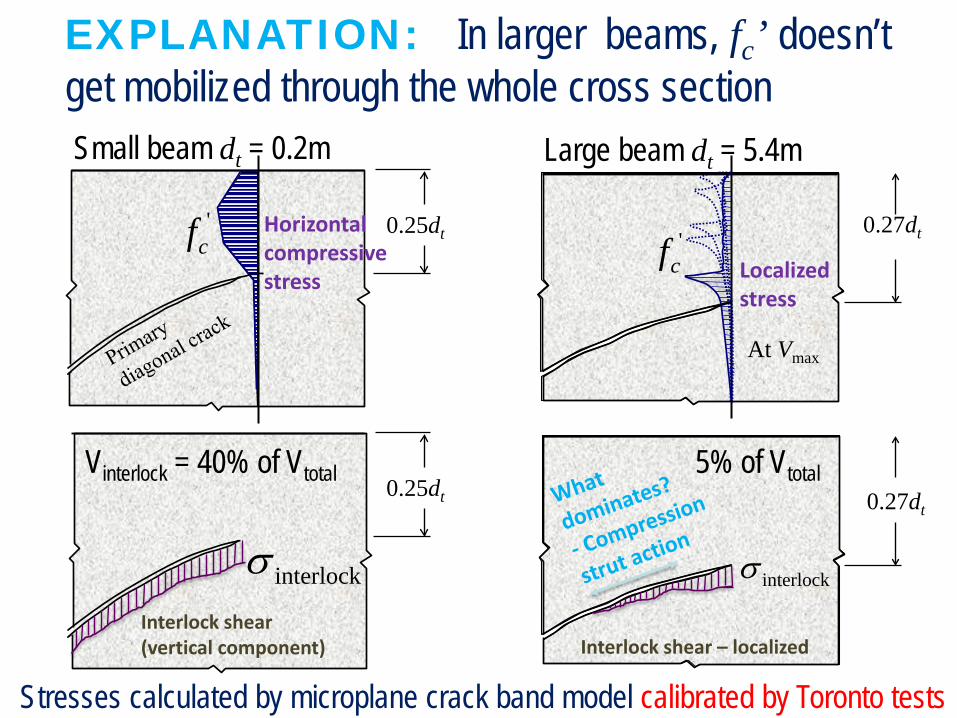
Small beam dt = 02m Large beam dt = 54m
cf 025dt
cf027dt
025dt 027dt
Interlock shear ndash localized
interlockσinterlockσ
At Vmax
Horizontal compressive stress Localized
stress
Interlock shear (vertical component)
Stresses calculated by microplane crack band model calibrated by Toronto tests
EXPLANATION In larger beams fcrsquo doesnrsquot get mobilized through the whole cross section
Vinterlock = 40 of Vtotal 5 of Vtotal
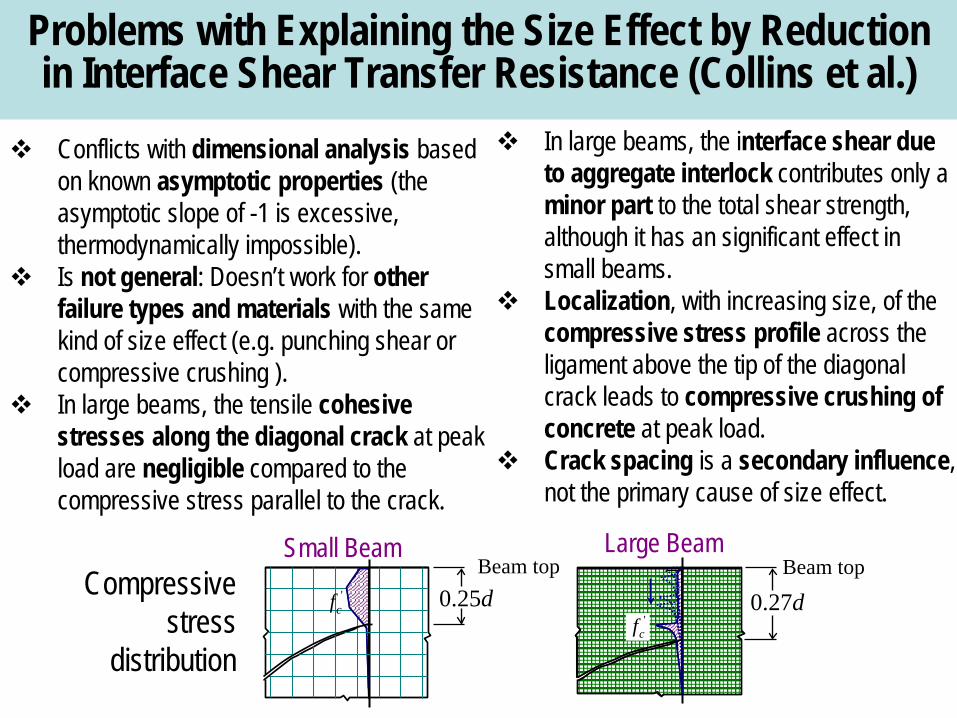
Problems with Explaining the Size Effect by Reduction in Interface Shear Transfer Resistance (Collins et al)
Conflicts with dimensional analysis based on known asymptotic properties (the asymptotic slope of -1 is excessive thermodynamically impossible)
Is not general Doesnrsquot work for other failure types and materials with the same kind of size effect (eg punching shear or compressive crushing )
In large beams the tensile cohesive stresses along the diagonal crack at peak load are negligible compared to the compressive stress parallel to the crack
In large beams the interface shear due to aggregate interlock contributes only a minor part to the total shear strength although it has an significant effect in small beams
Localization with increasing size of the compressive stress profile across the ligament above the tip of the diagonal crack leads to compressive crushing of concrete at peak load
Crack spacing is a secondary influence not the primary cause of size effect
Small Beam Large BeamBeam top
cf 025d
cf
027dBeam topCompressive
stress distribution
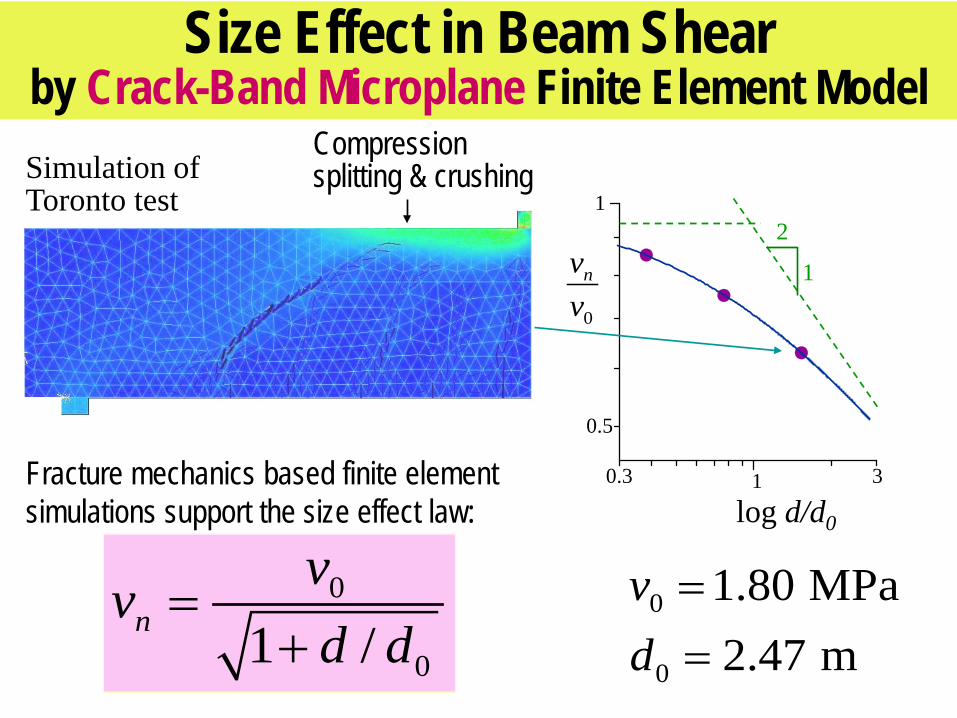
1
05
2
1
03 3
log dd0
0
nvv
0
01 =
+nvvd d
0
0
180 MPa247 m
==
vd
Size Effect in Beam Shear by Crack-Band Microplane Finite Element ModelSimulation of Toronto test
1
Compressionsplitting amp crushing
Fracture mechanics based finite elementsimulations support the size effect law
Structural Failures with Evidence of Size Effect
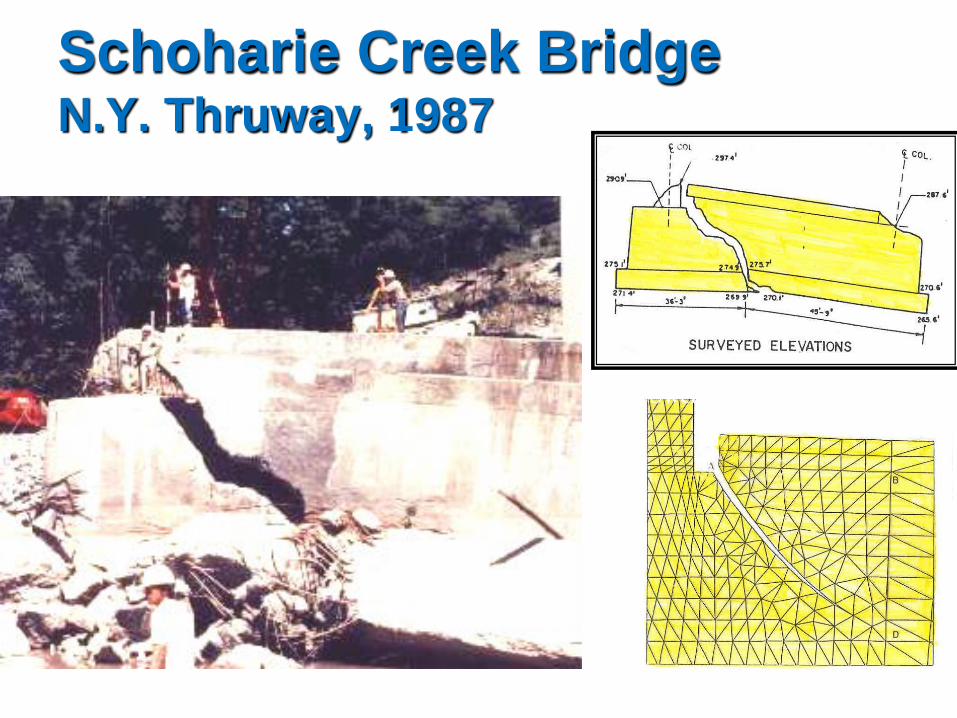
Schoharie Creek BridgeNY Thruway 1987
DV Swenson amp AR Ingraffea
Sleipner A Platform Norway
Sank 23 Aug 1991~ 82 m deep water~ 190 m tall
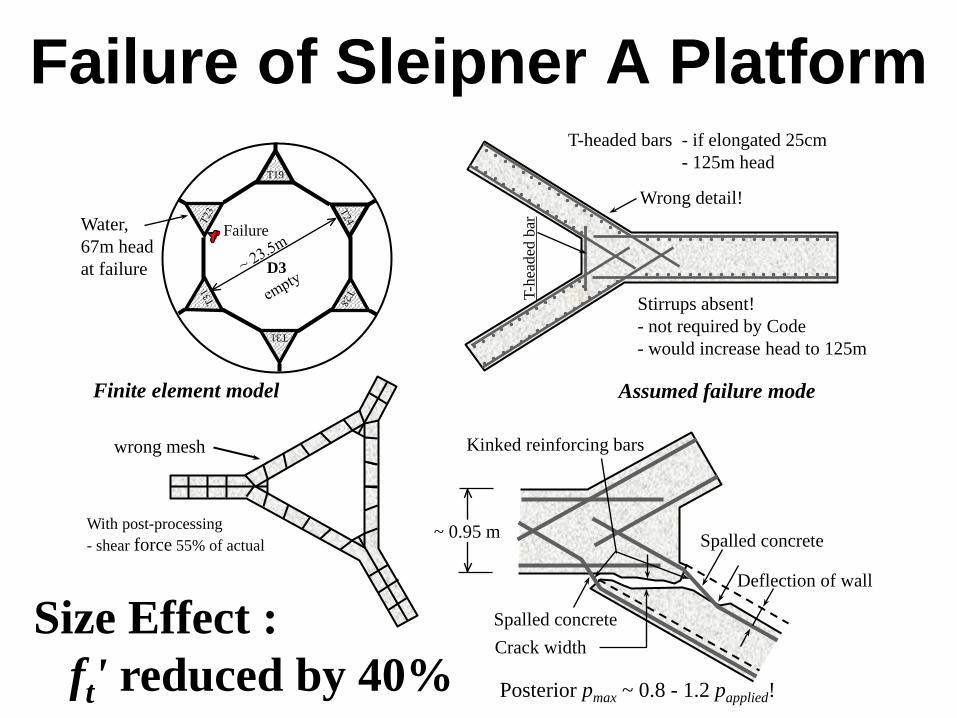
Failure of Sleipner A Platform
Water 67m head at failure
T19
T31
D3
Failure
Finite element model
Size Effect ft reduced by 40
wrong mesh
With post-processing- shear force 55 of actual
Wrong detail
Stirrups absent- not required by Code- would increase head to 125m
1905 Kangra India 357000 831906 San Francisco California USA 700 831908 Messina Italy 160000 751920 Gansu China 100000 861923 Sagami Bay Japan 200000 831976 Tangshan North East China 695000 791985 Mexico City Mexico 7000 811988 Armenia 45000 691989 San Francisco North California USA 67 711990 North West Iran 40000 771993 South West India 13000 641994 Northridge California USA 61 671995 Kobe Japan 5000 72
- Size effect due to compression fracture (in bending)
Cypress Viaduct (1989)Nimitz Freeway Oakland CA
Hinge
Crack Initiation at Hinge Location
Hinge
Cypress Structure Typical Bent with Hinged Frames
Hinge
Typical Failure Mode of Bent After Salvadori
Loma Prieta Earthquake
Schoharie Creek BridgeNY Thruway 1987
DV Swenson amp AR Ingraffea
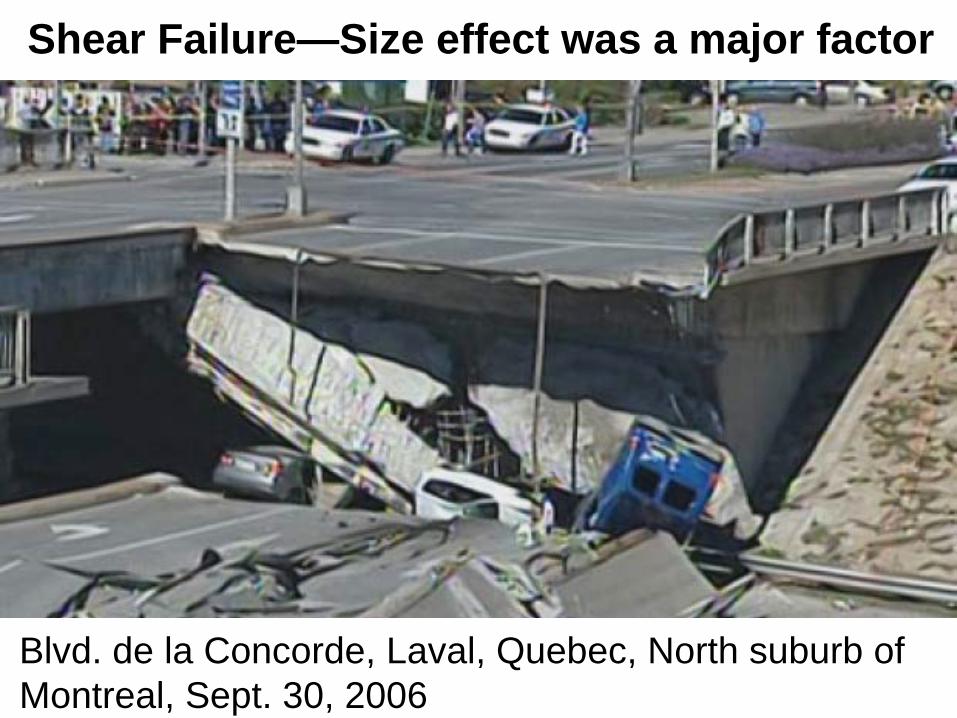
Blvd de la Concorde Laval Quebec North suburb of Montreal Sept 30 2006
Shear FailuremdashSize effect was a major factor
Wilkins Air ForceDepot WarehouseShelby OhioFailed 1955
Beam Depth 0914 m
Koror-Babeldaob Bridge in PalauBuilt 1977 failed 1996 Max girder depth 14 m span 241 m (world record)
AA Yee ACI ConcrIntJune197922-23
Koror-Babeldaob Bridge in Palau Built 1977 failed 1996
Our Verdict Compression and shear failure with wave from prestress failure after creep amp vertical prestress loss Size effect must have been strong
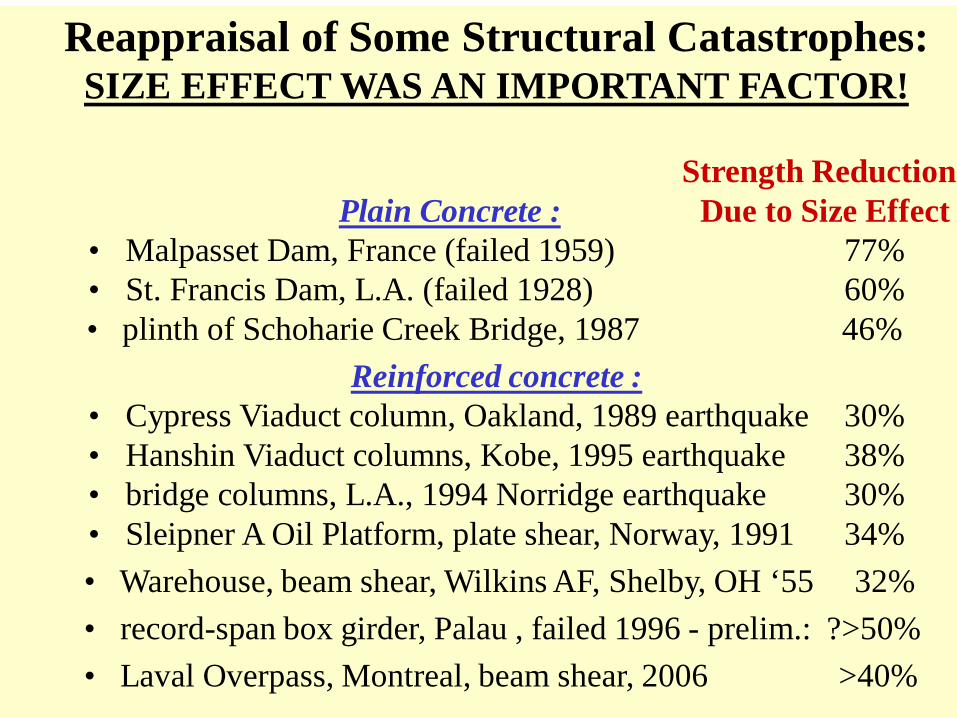
Reappraisal of Some Structural CatastrophesSIZE EFFECT WAS AN IMPORTANT FACTOR
Strength ReductionPlain Concrete Due to Size Effect
bull Malpasset Dam France (failed 1959) 77bull St Francis Dam LA (failed 1928) 60bull plinth of Schoharie Creek Bridge 1987 46
Reappraisal of Some Structural Catastrophes SIZE EFFECT WAS AN IMPORTANT FACTOR
Strength Reduction Plain Concrete Due to Size Effect bullMalpasset Dam France (failed 1959) 77 bullSt Francis Dam LA (failed 1928) 60 bull plinth of Schoharie Creek Bridge 1987 46
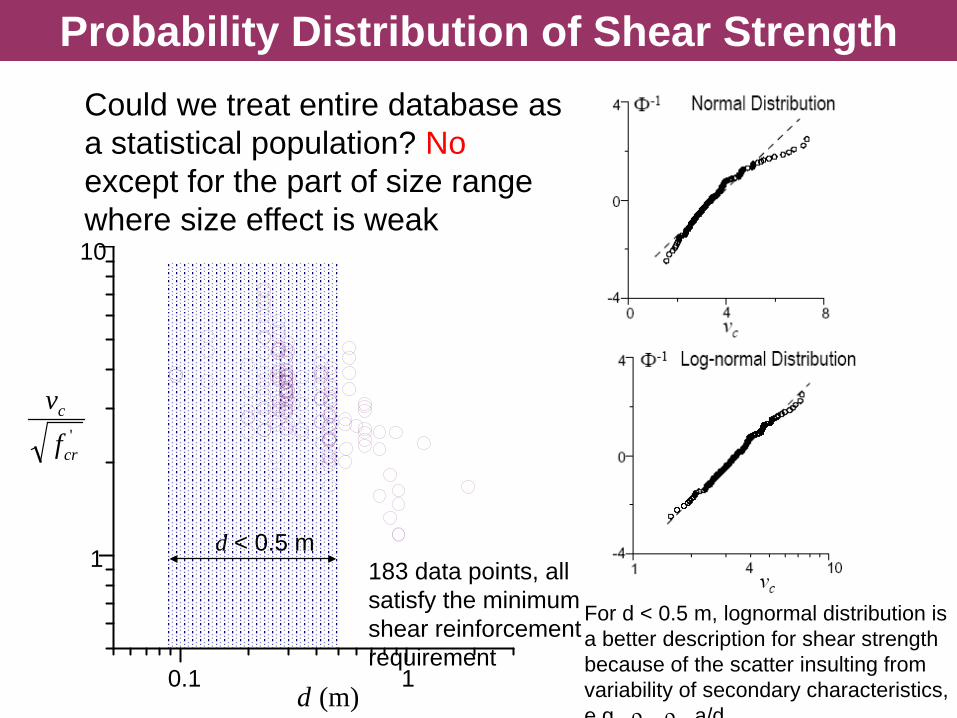
Could we treat entire database as a statistical population Noexcept for the part of size range where size effect is weak
183 data points all satisfy the minimum shear reinforcement requirement
d lt 05 m
For d lt 05 m lognormal distribution is a better description for shear strength because of the scatter insulting from variability of secondary characteristics e g ρ ρ ad
Relation of Size Effect Test Result to pdf of Database
cr
c
fv
Toronto tests (1998-2000)
2 cc fv =
psi 5365 =crf
1
6
1 100
21
364 in
100
Entire database
1
6
10
Smallsize
Largesize
2 crc fv =
= required averagecompr strength
crf
(in) d
2 crc fv =
2 cc fv =
Portion of database for small size range
12 in
1
6
3 50
4 in
10Log-normal in log - scale
Small size
2750 cc fv times=
(in) d(in) d
70 crc ff asymp= specified
compressive strength
a
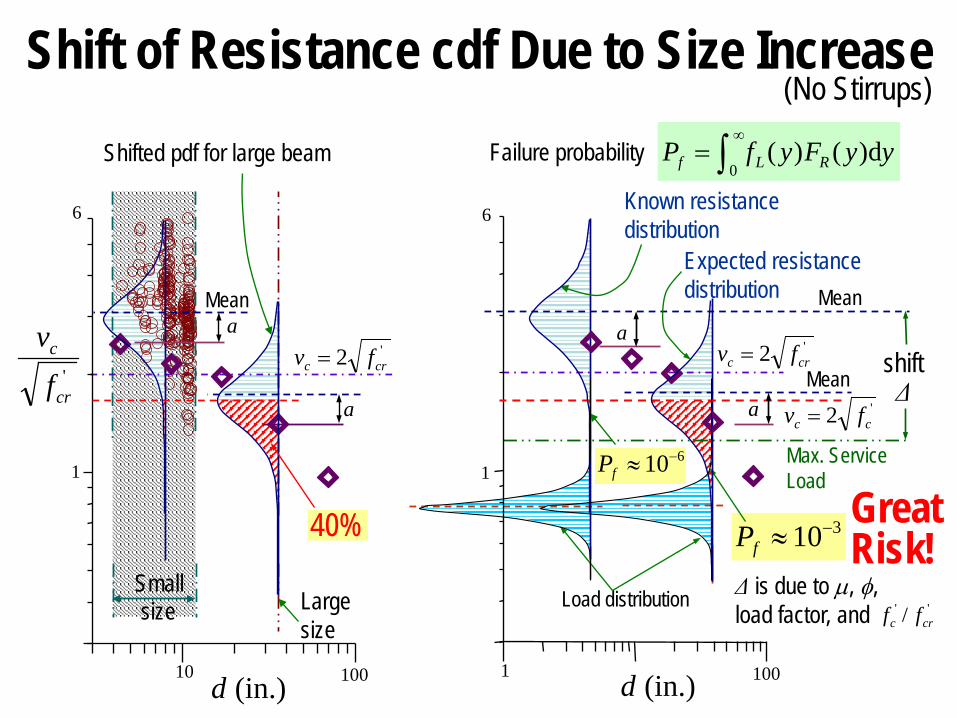
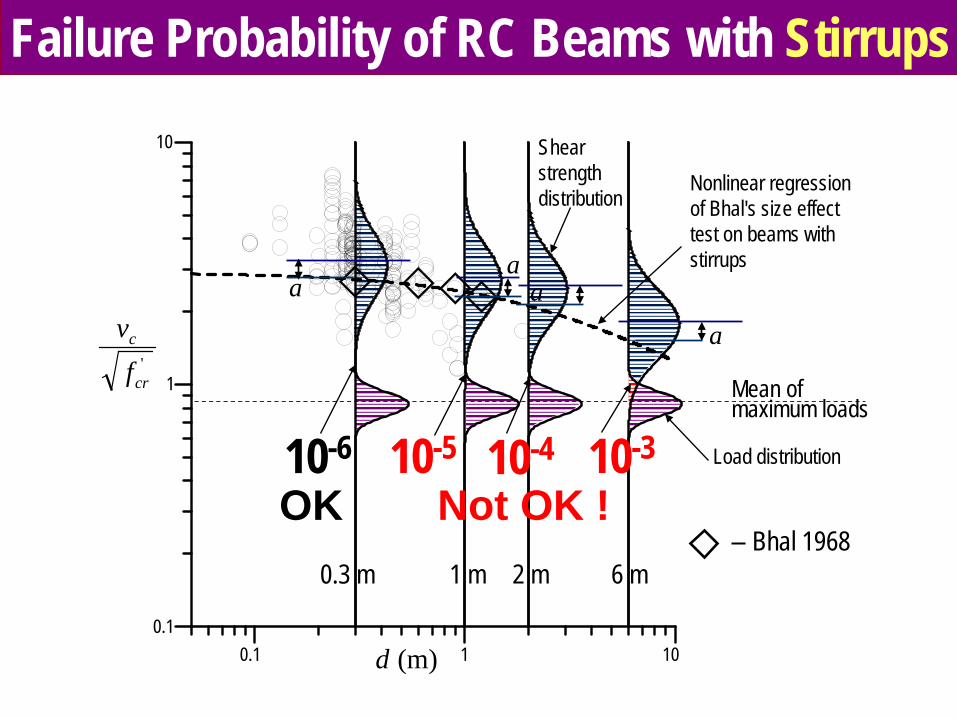
610minusasympfP
Shift of Resistance cdf Due to Size Increase
310minusasympfP
100
Shifted pdf for large beam
1
6
10
Smallsize Large
size
2 crc fv =
Meana
a
40
Failure probability
Load distribution
a
1
6
1 100
aMean
Expected resistance distribution
Mean2 cc fv =
2 crc fv =
cr
c
fv
Max Service Load
shiftΔ
Δ is due to micro φload factor and crc ff
Known resistance distribution
(in) d(in) d
intinfin
=
0 d)()( yyFyfP RLf
(No Stirrups)
GreatRisk
Do stirrups suppress the size effect
Size effect factor for beams with stirrups
011
ss dd+
=ϑ
(type 2 size effect)
00 10dds =
log d (m) log d (m)2
5
02 0802 115
19Bahl Kong amp Rangan
ad =30σs = 96 psi gt 50 psi
21
2
1
ad =24σs = 130 psi gt 50 psi
5
2
01 1log d (m)
log
v n(M
Pa)
21
Walraven ampLehwalter
Classical tests of geometrically similar RC beams made with the same concrete indicate that stirrups mitigate but do not eliminate the size effect
a) Deep beams b) Slender beams
ad =10
= 0
= 015
ρw= 033
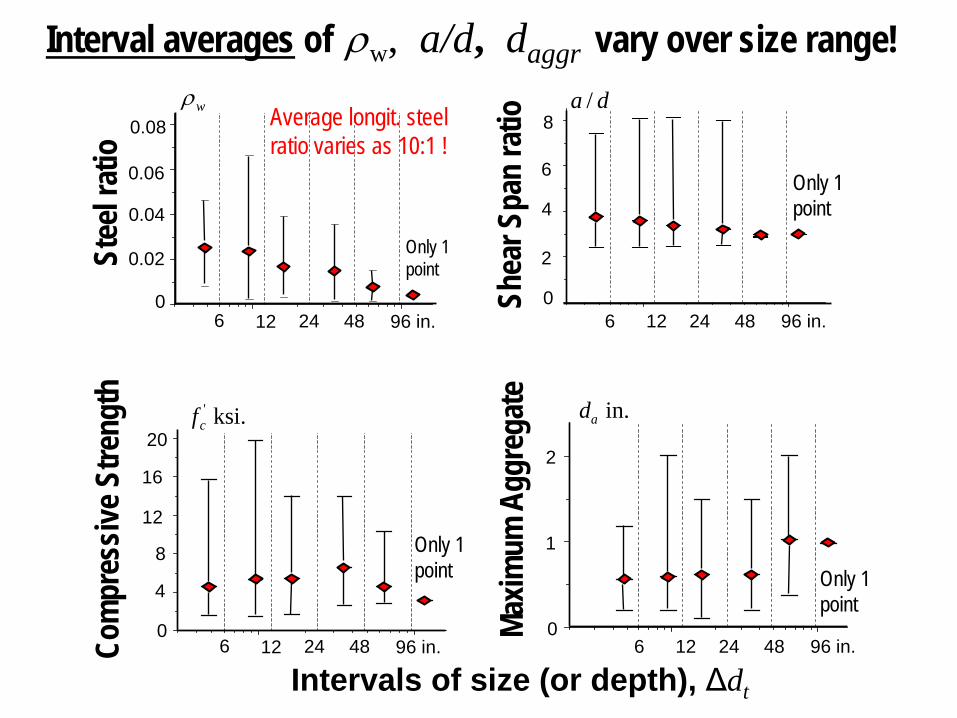
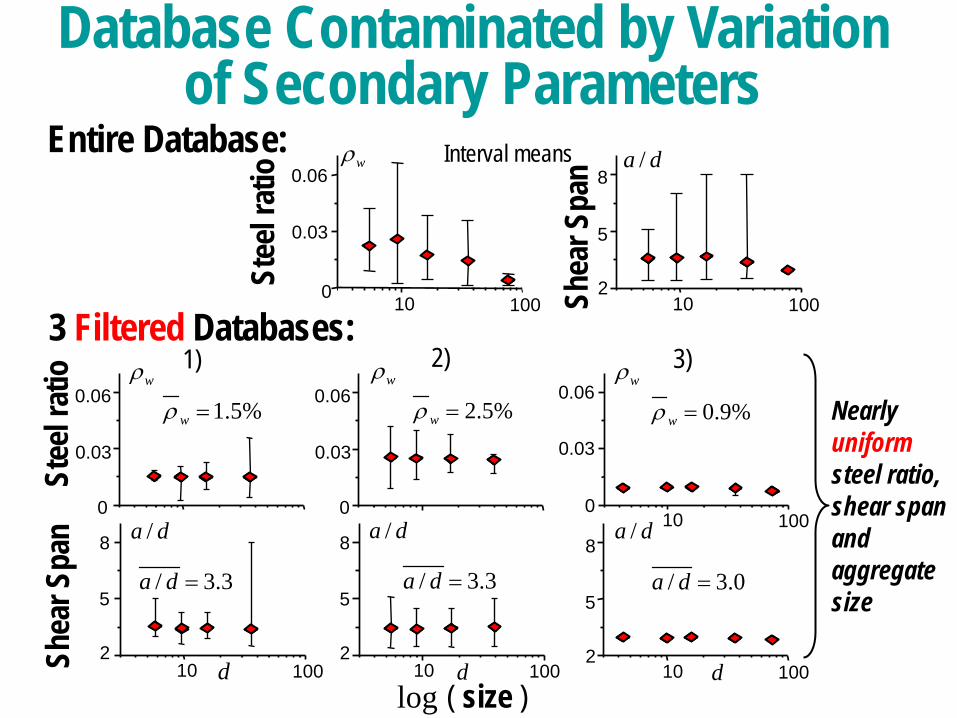
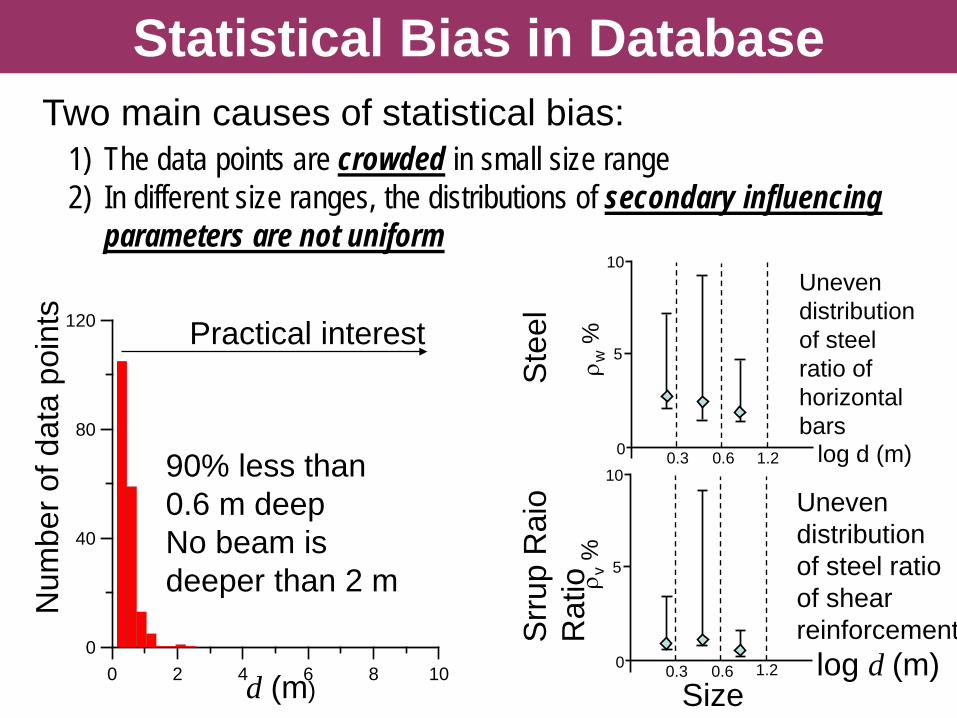
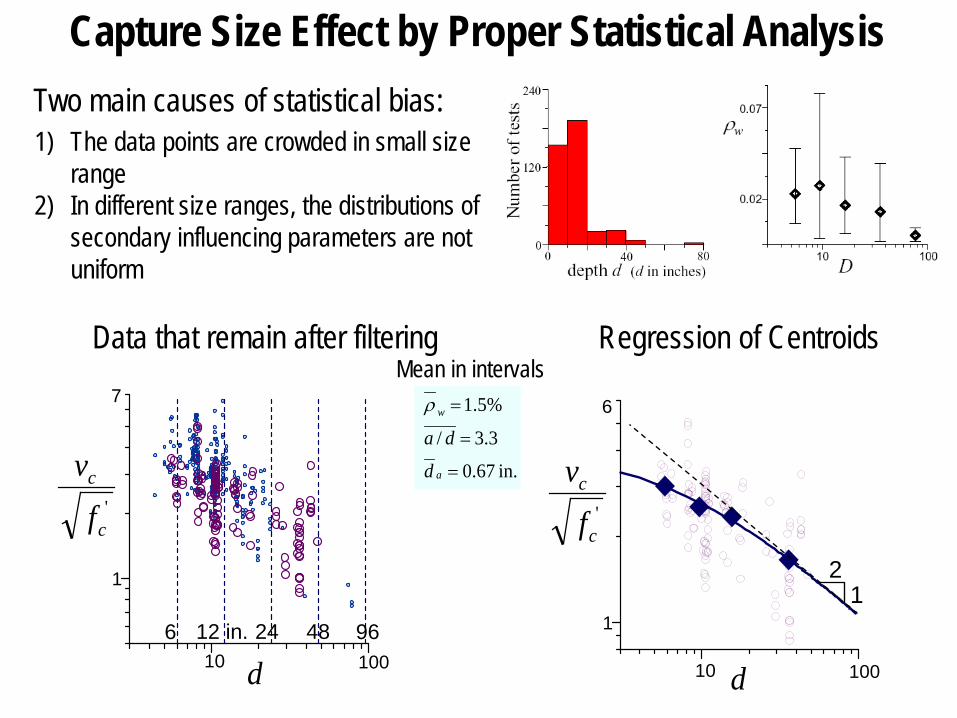
Statistical Bias in Database
1) The data points are crowded in small size range2) In different size ranges the distributions of secondary influencing
parameters are not uniform
Two main causes of statistical bias
0 2 4 6 8 100
40
80
120
Num
ber o
f dat
a po
ints
d (m)
90 less than 06 m deepNo beam is deeper than 2 m
Practical interest
03 06 12
10
5
0 log d (m)
ρ w
03 06 12
10
5
0 log d (m)
ρ v
Uneven distribution of steel ratio of horizontal bars
Uneven distribution of steel ratio of shear reinforcementS
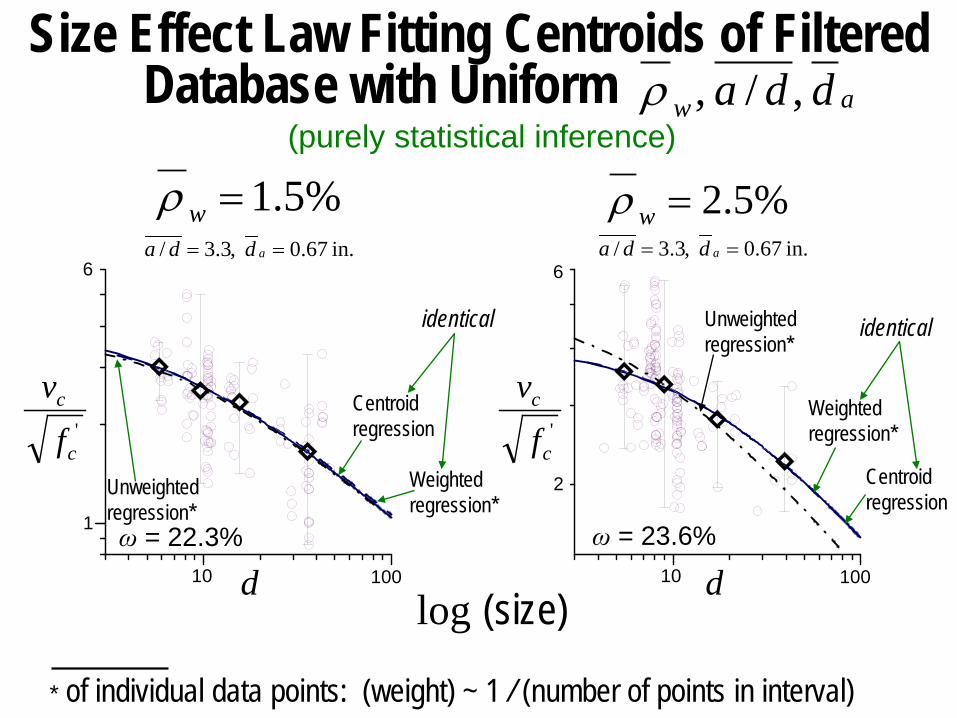
of individual data points (weight) ~ 1 (number of points in interval)
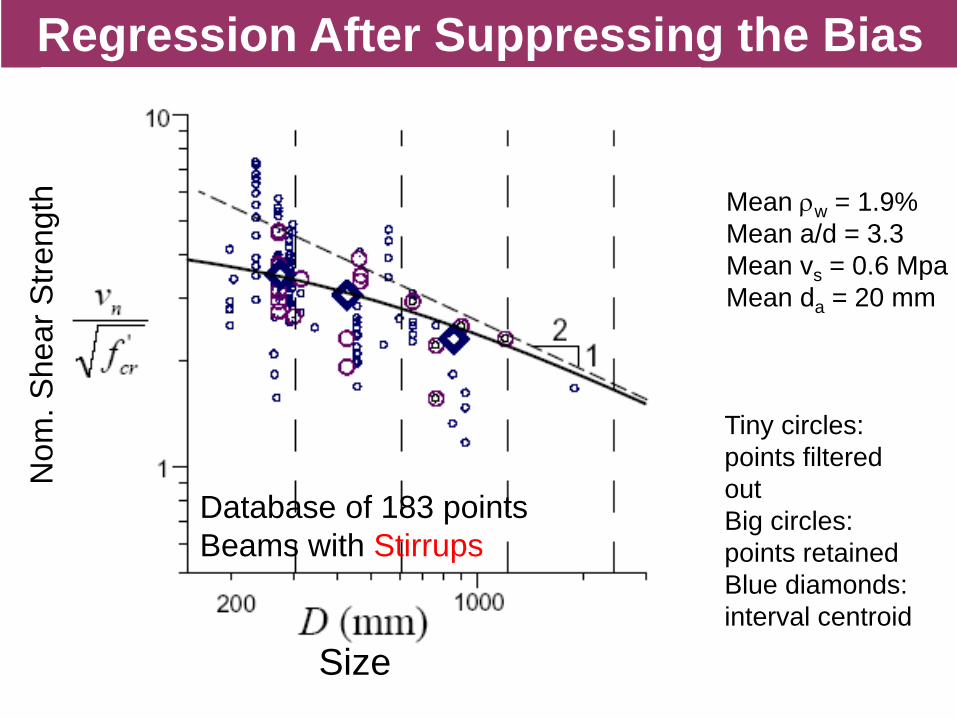
Weighted regression
in 670 33 == addain 670 33 == adda
10 100d
c
c
fv
6
10 100d
1
6
c
c
fv
ω = 223 ω = 236
2
Weighted regression
Unweighted regression
Centroid regression
Centroid regression
Unweighted regression
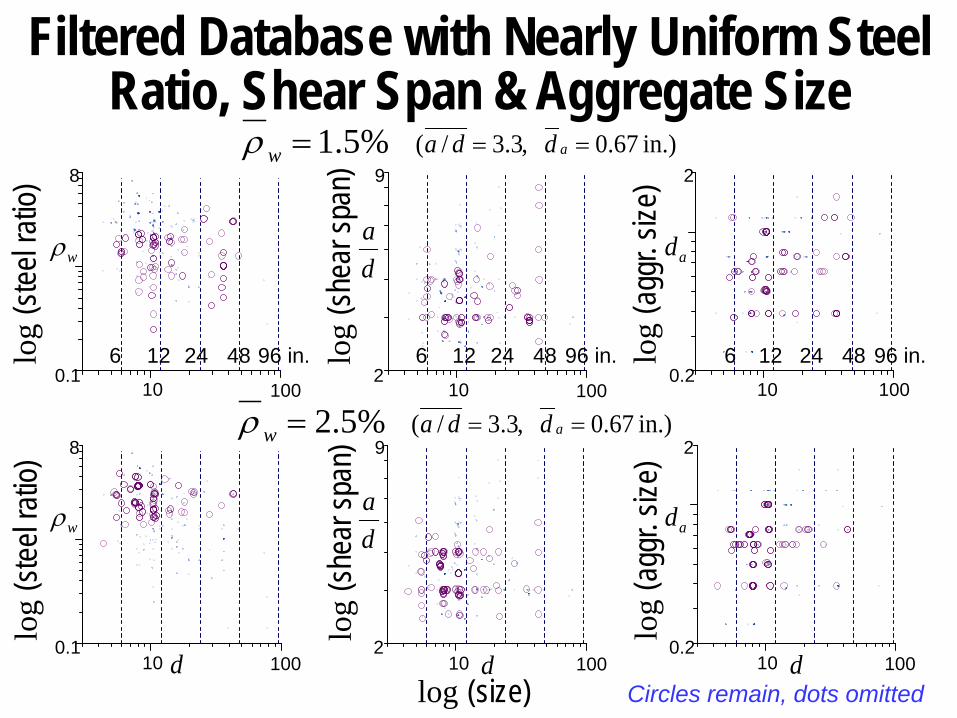
Size Effect Law Fitting Centroids of FilteredDatabase with Uniform
51=wρ 52=wρ
aw dda ρ
log (size)
identical identical
(purely statistical inference)
EFFECT OF STIRRUPS
bull Stirrups can push the size effect up by an order of magnitude of Dl0 but cannot prevent it
bull Increasing stirrup ratio in large beams is ineffective and caneven reduce the shear strength
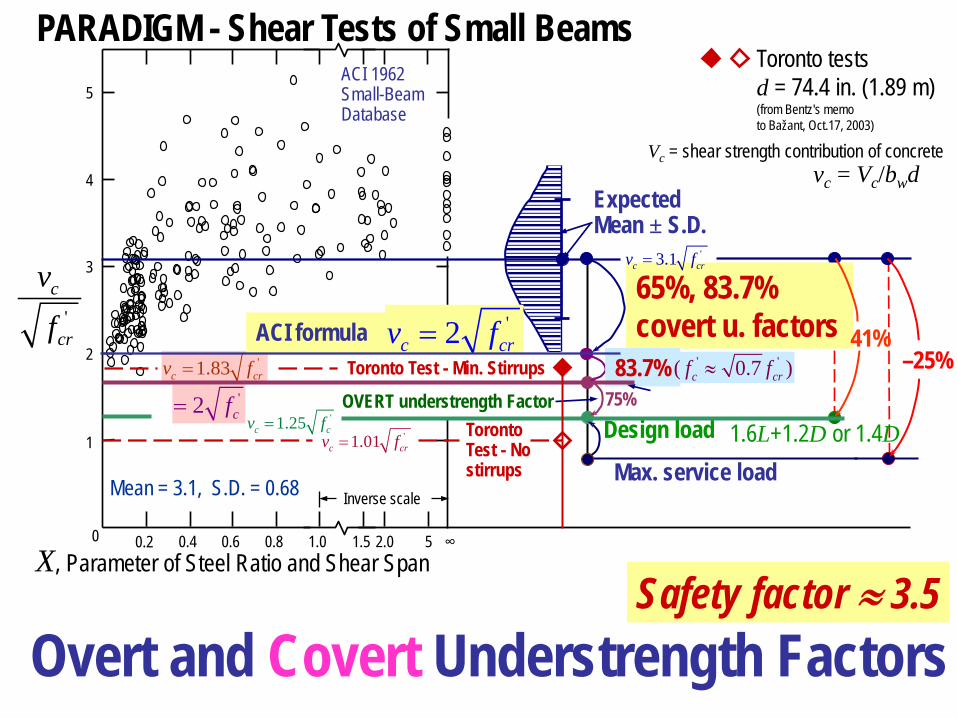
Covert Safety Factors
OVERT understrength Factor
65 837covert u factors
83775
( 07 )c crf fasymp
Design load 16L+12D or 14D
Inverse scale
02 04 06 08 10 15 20 5 infin0
1
2
3
4
5
TorontoTest - No stirrups
Expected Mean plusmn SD
2 cf=
31c crv f=
183c crv f=
101c crv f=
Toronto testsd = 744 in (189 m) (from Bentzs memo to Bažant Oct17 2003)
X Parameter of Steel Ratio and Shear Span
c
cr
vf
Vc = shear strength contribution of concrete
Mean = 31 SD = 068
ACI 1962 Small-BeamDatabase
vc = Vcbwd
ACI formula
125c cv f=
2c crv f=Toronto Test - Min Stirrups ndash25
41
Overt and Covert Understrength Factors
PARADIGM - Shear Tests of Small Beams
Safety factor asymp 35
Max service load
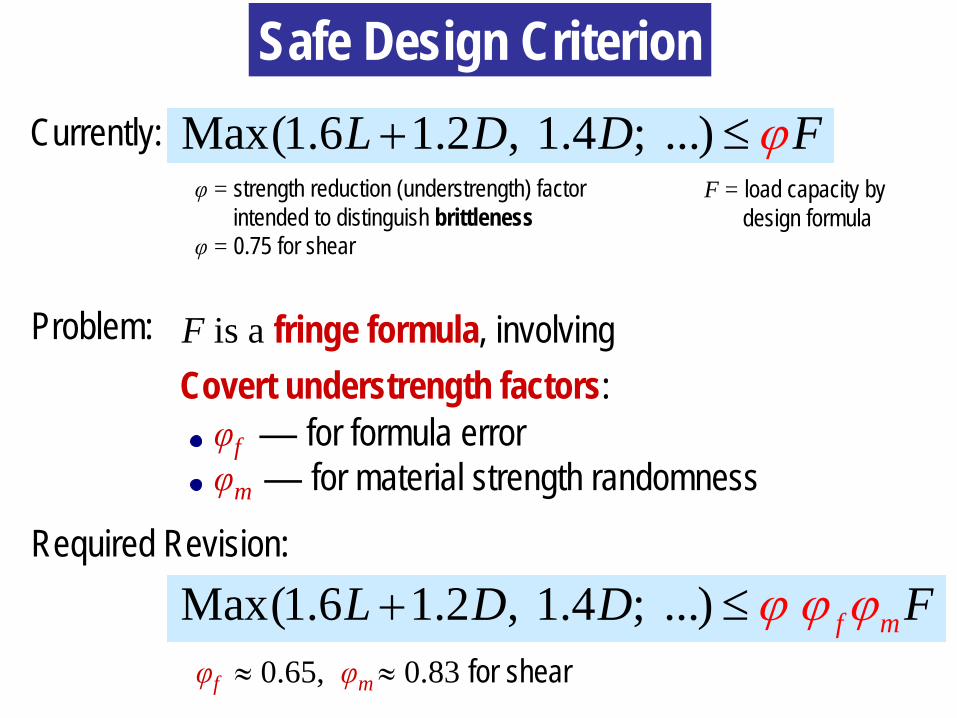
Max(16 12 14 ) f mL D D F+ le ϕ ϕ ϕ
Max(16 12 14 )L D D F+ le ϕ
Safe Design CriterionCurrently
φ = strength reduction (understrength) factorintended to distinguish brittleness
φ = 075 for shear
Problem F is a fringe formula involvingCovert understrength factors
φf mdash for formula errorφm mdash for material strength randomness
Required Revision
φf asymp 065 φm asymp 083 for shear
F = load capacity by design formula
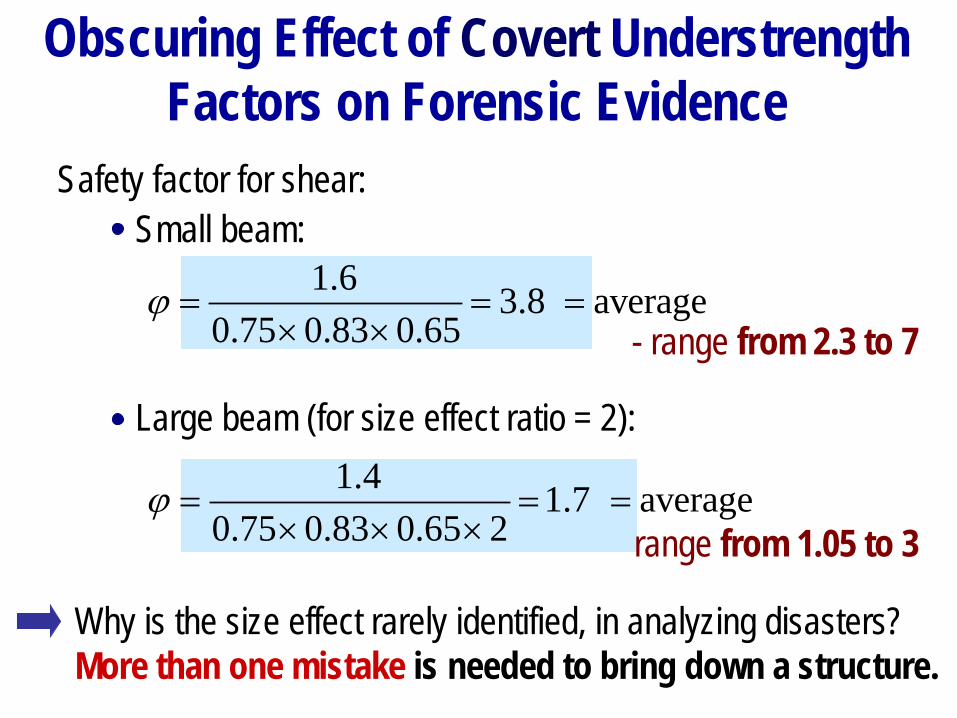
Obscuring Effect of Covert Understrength Factors on Forensic Evidence
Safety factor for shearSmall beam
Large beam (for size effect ratio = 2)
16 38 average075 083 065
= = =times times
ϕ- range from 23 to 7
14 17 average075 083 065 2
= = =times times times
ϕrange from 105 to 3
Why is the size effect rarely identified in analyzing disastersMore than one mistake is needed to bring down a structure
Failure of Sleipner A Platform
Water 67m head at failure
T19
T31
D3
Failure
Finite element model
Size Effect ft reduced by 40
wrong mesh
With post-processing- shear force 55 of actual
Wrong detail
Stirrups absent- not required by Code- would increase head to 125m
T-he
aded
bar
T-headed bars - if elongated 25cm- 125m head
Assumed failure mode
Kinked reinforcing bars
~ 095 m Spalled concrete
Deflection of wall
Spalled concreteCrack width
Posterior pmax ~ 08 - 12 papplied
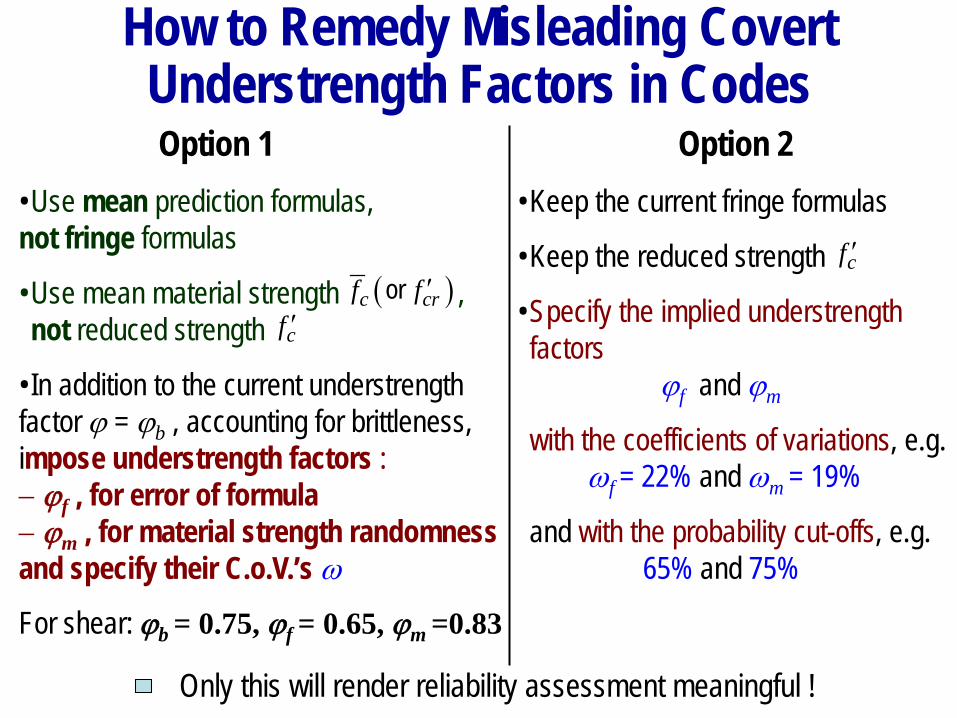
How to Remedy Misleading CovertUnderstrength Factors in CodesOption 1
bullUse mean prediction formulas not fringe formulas
bullUse mean material strength not reduced strength
bull In addition to the current understrength factor ϕ = ϕb accounting for brittleness impose understrength factors minus ϕf for error of formulaminus ϕm for material strength randomness and specify their CoVrsquos ω
For shear ϕb = 075 ϕf = 065 ϕm =083
( ) c crf f primeorcf prime
Option 2bullKeep the current fringe formulas
bullKeep the reduced strength
bullSpecify the implied understrength factors
ϕf and ϕm
with the coefficients of variations egωf = 22 and ωm = 19
and with the probability cut-offs eg 65 and 75
cf prime
Only this will render reliability assessment meaningful
L
p
q
Hidden size effect factor
d
1 2
1 1 2
105 16Max(14 12 16 )
075 to 1
CodeNTrueN
C d CC d C d C
+= =
+=
σϕσ
Max( 12 161 )
105 16
4CodeNTrueN
D D LD L
σ
σ
= +
= +
Wrong Size Effect Hidden in Excessive Self Weight Factor
2
1
1
075
001 10 10000
Hidden inload factor
logφ
log( )s ize
Actual
SmallLarge
(d = size)Wrong for Flexural vs shear failure high-strength vs normal concrete prestressed vs normal concrete etc
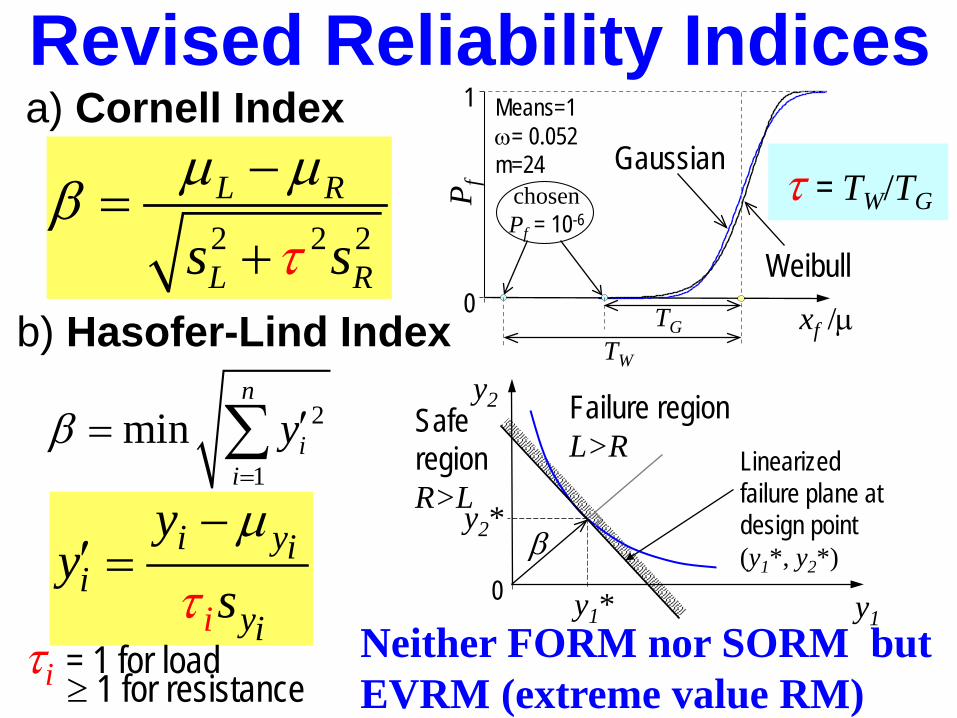
Revised Reliability Indicesa) Cornell Index
2 2 2L R
L Rs sτ
micro microβ minus=
+
i
i
yii
yi
yy
smicro
τ
minusprime =
b) Hasofer-Lind Index
2
1min
n
ii
yβ=
prime= sumP f
0
1
chosenPf = 10-6
Gaussian
Weibullxf micro
Means=1ω= 0052m=24
TGTW
τ = TWTG
0
Linearizedfailure plane at design point(y1 y2) β
y2
y1
Safe regionRgtL
Failure regionLgtR
y1
y2
τi = 1 for loadge 1 for resistance
Neither FORM nor SORM but EVRM (extreme value RM)
Max(16 12 14 ) f mL D D F+ le ϕ ϕ ϕ
Max(16 12 14 )L D D F+ le ϕ
Safe Design CriterionCurrently
φ = strength reduction (understrength) factorintended to distinguish brittleness
φ = 075 for shear
Problem F is a fringe formula involvingCovert understrength factors
φf mdash for formula errorφm mdash for material strength randomness
Required Revision
φf asymp 065 φm asymp 083 for shear
F = load capacity by design formula
Size Effect in Punching Shear
II Size Effect in Punching Shear of RC Slabs
ACI-445C-Database for Punching of Slabs
440 Tests (60 researchers)d (effective depth of slabs) ranges from 118 in to 263 in (from 30 to 668 mm)fc (concrete strength) ranges from 1160 to 17114 psi (from 8 to 118 MPa)ρ (longit reinforcement ratio) ranges from 01 to 73
Formulae in Main Design Codes
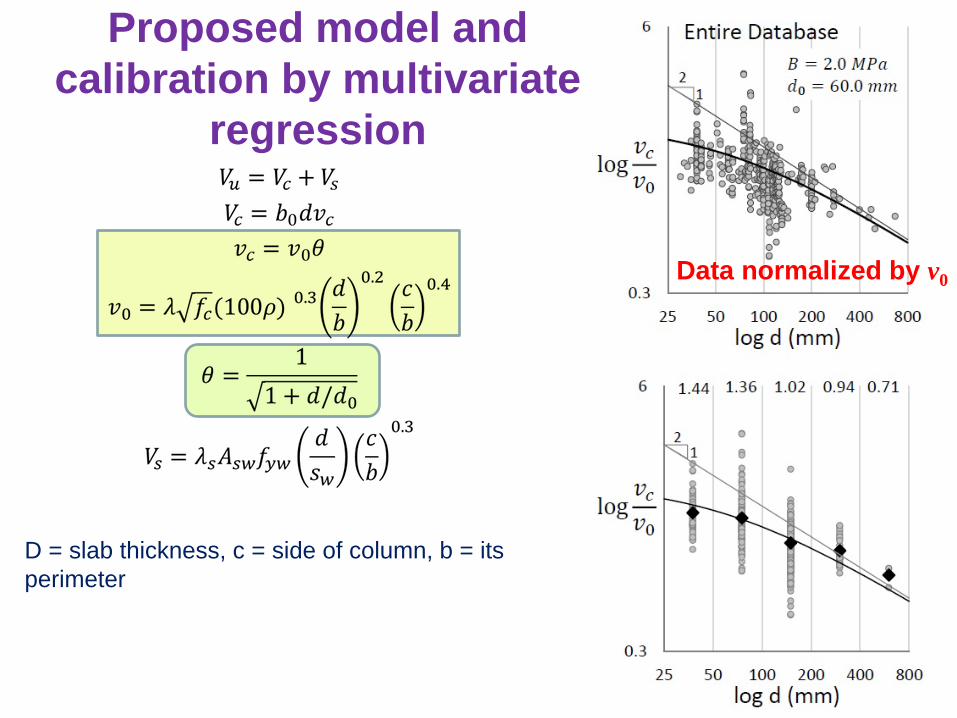
Vc=total capacityb0=control perimeterb0E=control perimeter (EC)d =effective depthfc =concrete strengthξ =Size effect term in ECρ =reinforcement ratio (longitudinal)ψ =slab rotation term (MC)θ =size effect term in proposed model
Asymptotic slope -1 isimpossible
Database Filteringto reveal the size effect
trend without any calculations
Unfiltered
Filtered mean steel ratio
Filtered mean bd
Filtered mean cb
Database filtering(continued)
Mean steel ratios
Mean bd
Mean cb
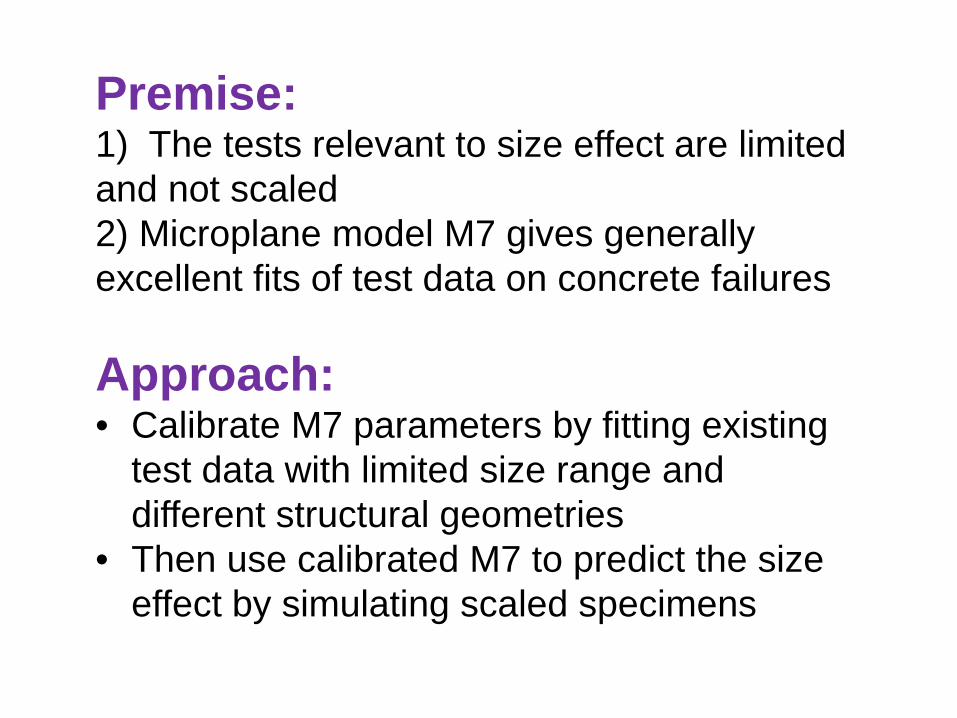
Premise1) The tests relevant to size effect are limited and not scaled2) Microplane model M7 gives generally excellent fits of test data on concrete failures
Approachbull Calibrate M7 parameters by fitting existing
test data with limited size range and different structural geometries
bull Then use calibrated M7 to predict the size effect by simulating scaled specimens
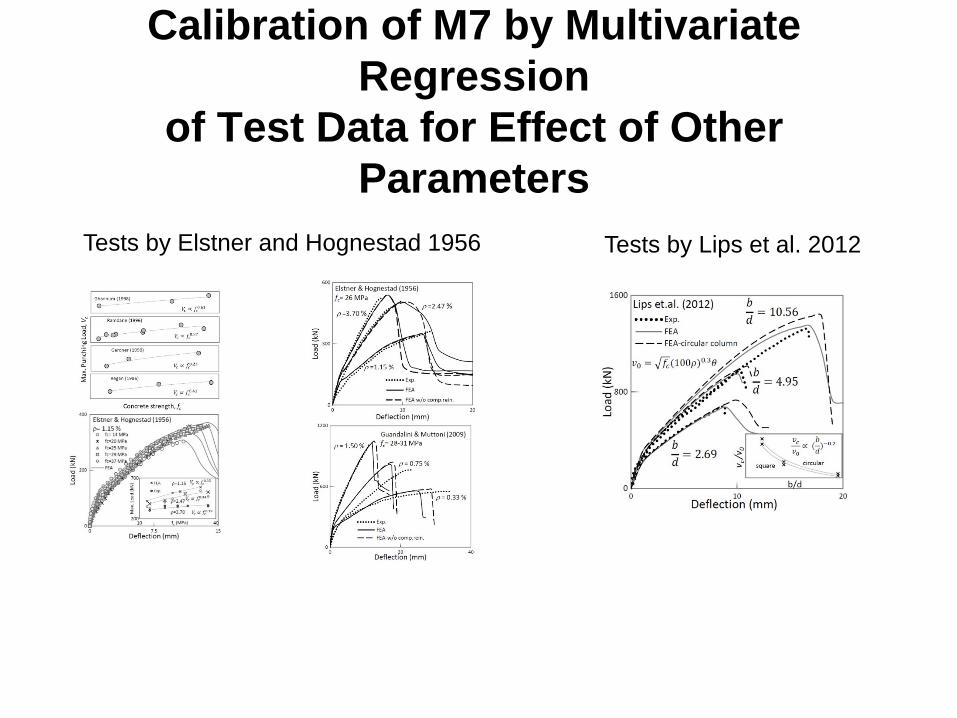
Calibration of M7 by Multivariate Regression
of Test Data for Effect of Other Parameters
Tests by Elstner and Hognestad 1956 Tests by Lips et al 2012
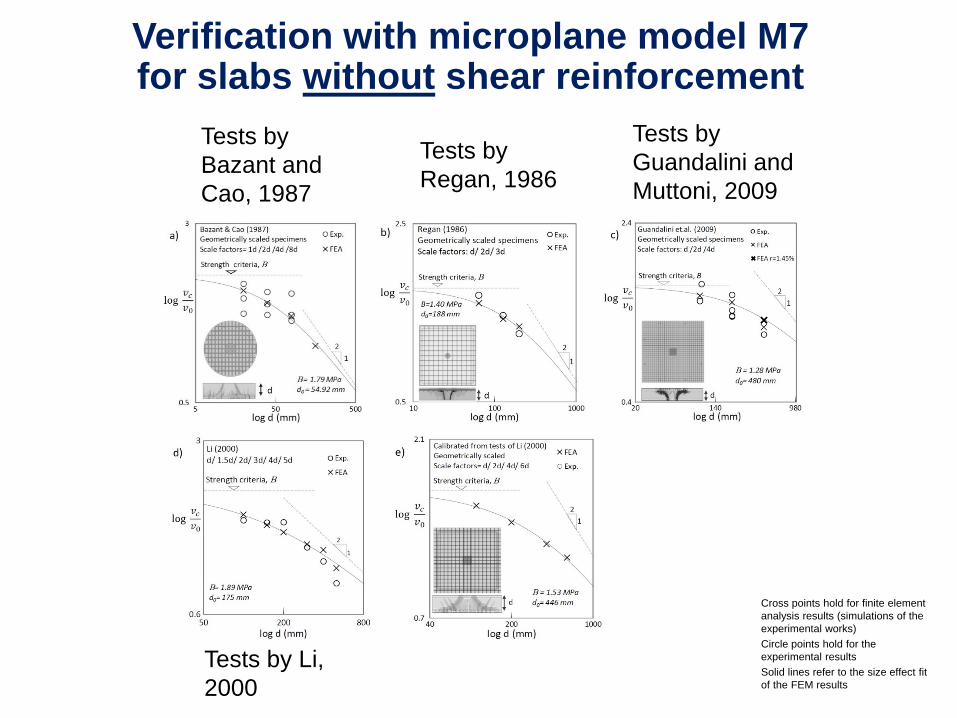
Cross points hold for finite element analysis results (simulations of the experimental works)Circle points hold for the experimental resultsSolid lines refer to the size effect fit of the FEM results
Verification with microplane model M7 for slabs without shear reinforcement
Tests by Bazant and Cao 1987
Tests by Regan 1986
Tests by Guandalini and Muttoni 2009
Tests by Li 2000
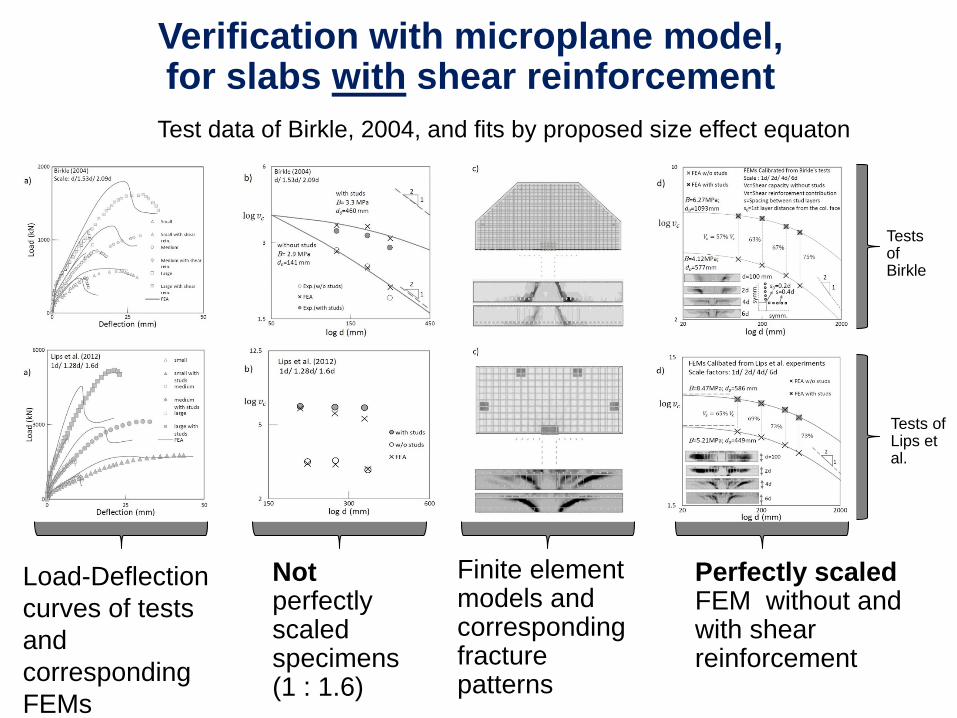
Verification with microplane model for slabs with shear reinforcement
Load-Deflection curves of tests and corresponding FEMs
Notperfectlyscaledspecimens(1 16)
Finite element models and corresponding fracture patterns
Perfectly scaled FEM without and with shear reinforcement
Tests of Birkle
Tests of Lips et al
Test data of Birkle 2004 and fits by proposed size effect equaton
Proposed model and calibration by multivariate
regression
D = slab thickness c = side of column b = its perimeter
Data normalized by v0
Size Effect in Torsion
Type I
Bažant Z P and Sener S ldquoSize Effect in Torsional Failure of Concrete Beamsrdquo Journal of Structural Engineering V 113 No 10 1987 pp 2125-2136 90
II Size Effect in Torsional FailuresPlain concrete beams solid cross sections
Size effect plot (log-scale) Failure pattern
MODEL
AFTER TESTTests by Bazant Sener 1987
91
Size Effect on Torsional Failure
bull 3 sizes tested in lab d = 15rdquo 3rdquo 6rdquo)bull Size range extended using microplane model M7 to 113bull Type I failure ndash as soon as peak torque is reached
Scaled computed torque-twist curves
T T
max
Twist (deg)
Bažant Z P and Sener S ldquoSize Effect in Torsional Failure of Concrete Beamsrdquo Journal of Structural Engineering V 113 No 10 1987 pp 2125-2136
Plain concrete beams ndash reduced scale tests
Hsu T T C ldquoTorsion of Structural ConcretemdashPlain Concrete Rectangular Sectionsrdquo Torsion of Structural Concrete SP-18 American Concrete Institute Farmington Hills MI Jan 1968 pp 203-238 92
Torsional failures model validationPlain concrete beams tested by Hsu (1968)
10rdquox20rdquo
10rdquox15rdquo
10rdquox10rdquo
6rdquox195rdquo
6rdquox11rdquo
bull Effects of size (and shape) observed in tests bull Model predictions match tests very well ndash lends
confidence to the model
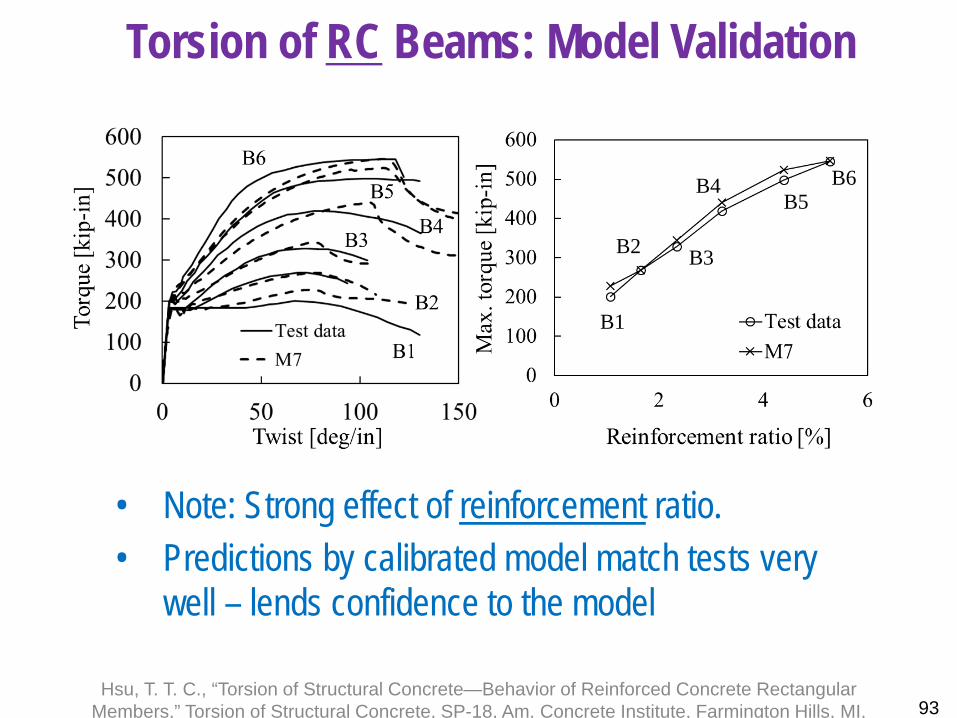
Hsu T T C ldquoTorsion of Structural ConcretemdashBehavior of Reinforced Concrete Rectangular Membersrdquo Torsion of Structural Concrete SP-18 Am Concrete Institute Farmington Hills MI
93
Torsion of RC Beams Model Validation
bull Note Strong effect of reinforcement ratiobull Predictions by calibrated model match tests very
well ndash lends confidence to the model
B1B1
B2 B3
B4B5
B6
94
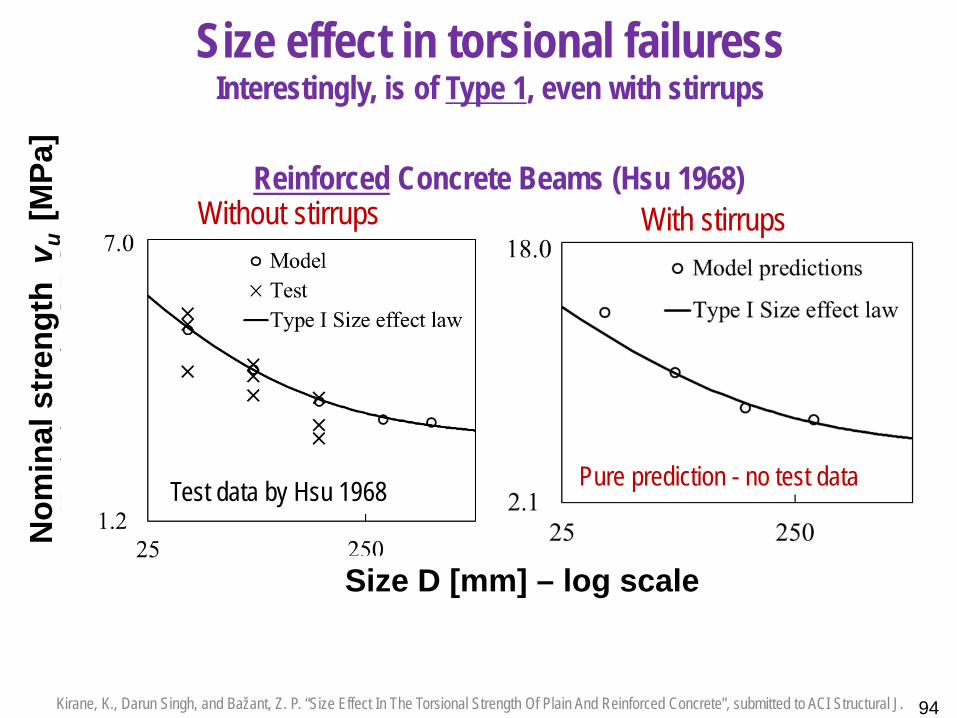
Size effect in torsional failuressInterestingly is of Type 1 even with stirrups
Reinforced Concrete Beams (Hsu 1968)Without stirrups With stirrups
Size D [mm] ndash log scale
Kirane K Darun Singh and Bažant Z P ldquoSize Effect In The Torsional Strength Of Plain And Reinforced Concreterdquo submitted to ACI Structural J
Pure prediction - no test data
Nom
inal
str
engt
h v
u [M
Pa]
Test data by Hsu 1968
Size Effect on Columns Prestressed Beam Flexure
Composite Beams andOther Types of Failure
See Bazantrsquos website
Code Articles Requiring Size Effectbull shear of beams without
and with stirrupsbull torsion of beams bull punching of slabs bull shear of deep beams bull bar splices and
development length bull all failures due to
compression crushing of concrete as in-- columns -- prestressed beams -- arches -- bearing strength -- strut-and-tie models
bull failure of composite beams due to failure of connections
EFFECT OF STIRRUPSbull Stirrups can push the size effect up by an order of magnitude of Dl0 but cannot prevent itbull Increasing stirrup ratio in large beams is ineffective and can even reduce the shear strength
Slide Number 70
Slide Number 71
Slide Number 72
Slide Number 73
Failure of Sleipner A Platform
How to Remedy Misleading CovertUnderstrength Factors in Codes
Slide Number 76
Revised Reliability Indices
Slide Number 78
Slide Number 79
II Size Effect in Punching Shear of RC Slabs
Formulae in Main Design Codes
Database Filteringto reveal the size effect trend without any calculations
Slide Number 83
Slide Number 84
Calibration of M7 by Multivariate Regression of Test Data for Effect of Other Parameters
Slide Number 86
Slide Number 87
Proposed model and calibration by multivariate regression
Slide Number 89
Slide Number 90
Slide Number 91
Slide Number 92
Slide Number 93
Slide Number 94
Slide Number 95
Code Articles Requiring Size Effect
Slide Number 97
Basic Facts about Quasibrittle Size Effect
a) Plasticbull No localization simultane-
ous strengths are summed
bull CoV decreases with structure size as
bull Gaussian distribution
1 D
b) Brittlebull Localizes propagates
one element controls Pmax
bull No decrease of CoV with size D high scatter
bull Weibull distribution
c) QuasibrittleFinite fracture process zone- charact length Transitional SIZE EFFECT
Geometric similarity of fractures at different size is a required hypothesis for Type 2 size effect Here is a demonstration that it holds true for beam shear failures at different sizes
Small Large
Cause of Size Effect (of Type 1) for Failure at Crack Initiation
D
Db
D
Db
M M
ft ft
σN σN
Cause of size effect(Can this be denied andreplaced by fractals)
Vanishing size effect but strength randomnessbecomes important
1
1r
bN
rDDinfin
= +
σ σ
(Alternative derivationby fracture mechanicsfor a 0)
Size Effect (of Type 2) Dimensional Analysis and Asymptotic Matching
0 or 0)( 2
2
02
2
21 =
=ΠΠ
t
N
t
N
flfDff σσ
20 tf fEGl =
21
02
2
0
2
2
0
~~ 0 If
const~ 0 If
minusrarr=
gtgt
=rarr=
ltlt
DDEGlfDflD
ff
flD
fNt
N
tNt
N
σσ
σσ
4 variables ft [Nm2] Gf [Jm2] D [m] σN [Nm2]Characteristic material length implied (Irwin 1958)
Buckingham theoremMax load given by
Expansion of f(Π1 Π2) = 0 up to 2nd
order terms yields approx size effect law21
0 )1( minus+= DDBftNσ
21
log σN
log D
Large crack at max load
Bazant PNAS 2004
Derivations of Size Effect Law1 Analyticalndash Simplified energy release analysisndash Simplified contour integration of J-
integralndash Dimensional analysis with
asymptotic matchingndash Asymptotic transformations of
diffeqs with boundary conditionsndash Asymptotic analysis of equivalent
LEFMndash Asymptotics of cohesive crack
model (smeared-tip method)ndash Asymptotic expansion of J-integralndash Deterministic limit of probabilistic
nonlocal theory
2 Numericalndash FEM with strongly nonlocal damage modelsndash FEM with gradient (weakly nonlocal) modelsndash Random Lattice Discrete Particle Modelndash Limit of nonlocal probabilistic FEM
Asymptotic MatchingSize Effect of Divinycell H100 Foam
1
Size Effect Law(Bazant 1984)
Gf = 061 Nmmcf = 033 mm
log D (mm)
log
σ N(M
Pa-2
)
0
-1-1 10 32
Strength criterion
Large-SizeAsymptoticExpansion
21 LEFM
Small-SizeAsymptoticExpansion-12
N0
= 1tDBfD
σ prime +
f
0 f 0
E G=g (α )c +g(α )D
Easy EasyHard
( ) 1 1
0
rN rk minus+= ϑσσ
Energetic ( Quasibrittle ) Mean Size EffectLaws and Statistical Generalization
2c ndash based on cohesive crack model 1s ndash statistical generalization
log (Size D)
Type 2
log
( Nom
Stre
ngth
σN
)
1
01
01 1 10 100
2c
2
1
21
00
1minus
+=
DDN
σσ
Type 1
1 10 100
1
01m
n
r
1
( ) rmnN rk 1
0
ϑϑσσ
+=
Statistical
1s
1cDD
D
b
b
+=ϑ
Deterministic
Deterministic with statistical CoV
1000100
Classical Narrow-Range Test Data for Size Effect on Shear Strength of RC Beams without Stirrups
Kani (1967)
ad=25
Kani (1967)
ad=30
Kani (1967)
ad=40
Kani (1967)
ad=50
Kani (1967)
ad=70
Leonhardt amp Walther (1962)
ad=30
Bahl (1968)
ad=30
1
03
1
05
1
051
3
100 1000 100 1000 100 1000
2
1
100 1000 1000
1
05100
0
0
30 MPa176 mm
vd
=
=0
0
224 MPa246 mm
vd
=
=0
0
154 MPa661 mm
vd
=
=0
0
155 MPa618 mm
vd
=
=
0
0
12 MPa133 mm
vd
=
=0
0
175 MPa386 mm
vd
=
=0
0
133 MPa388 mm
vd
=
=
log
v c(M
Pa)
log
v c(M
Pa)
log d (mm) log d (mm) log d (mm)log d (mm)
1
05100 1000
log d (mm) log d (mm)log d (mm)
Reduced-Scale Tests of Beam Shear Failure at Northwestern (aggregate lt 48 mm)
1 20(1 )N p d dσ σ minus= +
Incorporating the size effect into design code formulas for reinforced concrete is easy
011
dd+=ϑ
Multiply the formula for the strength contribution of concrete by the size effect factor
(type 2 size effect)
Design Formula for Shear in RC Beams Proposed in fib 2010 Draft 1) Invalid derivation
from Modified Compression Field Theory MCFT based on plasticity for crack initiation
2) Effects of ρw andad ignored
3) No size effect if minimum shear reinforcement exists
4) etc
Proposed by ACI-446 (fracture mechanics based)
not if 3330 known is if 3800 where
1
1 320
0
40
4083
==
=+
+= minus
κκ
κmicroρ
aa
cc
wc
dd
fddd
fad
v
c
ckvcRd
fkV
γ=
ykckw
w
ffz
080 if 150
0 if 150311000
200
ge=
=le+
=
ρ
ρvk
If stirrups ge minimum stirrups the size effect still exists though pushed into larger sizes (d0 will increase by about one order of magnitude)
DEFICIENCIES
0
5
10
15
20
25
30
0 2 4 6
Vu
size d
Pd
d) fib Model Code 2010MCVmax
No size effect
VuVu
Vu prop d1
Vu prop d3 4 = d(dminus1 4 )
Vu propd
1+ d d0
Vu propd
1+ cda horizontal asymptote (unphysical)
Comparison of CURVES OF SHEAR FORCE Vu = bw d vu
vs SIZE d in current codes
Note The curves are scaled to the same initial tangent
Stress transmitted across crack is not the reason 2P V=
0C
V
ϕ
c b
0Ra
crack
0001
0074 111 151
3162 10minustimes
sεPodgorniak-Stanik( 1998) TorontoTest BN50
Measured steel strains
1CV
V
1C ϕ
75
0
F
2 cfasympσ
1 tfltltσ
Main diagonal crack
σ
Vσy
σt σn
tf
For small beams the contribution of crack-bridging stress is significant ie 40 while for 18 m deep beams it is negligible ie 9
Failure Mechanism in Shear Test of Large Beam
2P V=
0C
V
ϕ
c b
0Ra
1CV
V
1C ϕ
75
0
2 cfσ asymp
crack
Compression resultant location
Negligible shear stresseson crack face
1 tfltltσ
V
V
FEM crack band microplane model
Toronto 189 m deep
Small beam dt = 02m Large beam dt = 54m
cf 025dt
cf027dt
025dt 027dt
Interlock shear ndash localized
interlockσinterlockσ
At Vmax
Horizontal compressive stress Localized
stress
Interlock shear (vertical component)
Stresses calculated by microplane crack band model calibrated by Toronto tests
EXPLANATION In larger beams fcrsquo doesnrsquot get mobilized through the whole cross section
Vinterlock = 40 of Vtotal 5 of Vtotal
Problems with Explaining the Size Effect by Reduction in Interface Shear Transfer Resistance (Collins et al)
Conflicts with dimensional analysis based on known asymptotic properties (the asymptotic slope of -1 is excessive thermodynamically impossible)
Is not general Doesnrsquot work for other failure types and materials with the same kind of size effect (eg punching shear or compressive crushing )
In large beams the tensile cohesive stresses along the diagonal crack at peak load are negligible compared to the compressive stress parallel to the crack
In large beams the interface shear due to aggregate interlock contributes only a minor part to the total shear strength although it has an significant effect in small beams
Localization with increasing size of the compressive stress profile across the ligament above the tip of the diagonal crack leads to compressive crushing of concrete at peak load
Crack spacing is a secondary influence not the primary cause of size effect
Small Beam Large BeamBeam top
cf 025d
cf
027dBeam topCompressive
stress distribution
1
05
2
1
03 3
log dd0
0
nvv
0
01 =
+nvvd d
0
0
180 MPa247 m
==
vd
Size Effect in Beam Shear by Crack-Band Microplane Finite Element ModelSimulation of Toronto test
1
Compressionsplitting amp crushing
Fracture mechanics based finite elementsimulations support the size effect law
Structural Failures with Evidence of Size Effect
Schoharie Creek BridgeNY Thruway 1987
DV Swenson amp AR Ingraffea
Sleipner A Platform Norway
Sank 23 Aug 1991~ 82 m deep water~ 190 m tall
Failure of Sleipner A Platform
Water 67m head at failure
T19
T31
D3
Failure
Finite element model
Size Effect ft reduced by 40
wrong mesh
With post-processing- shear force 55 of actual
Wrong detail
Stirrups absent- not required by Code- would increase head to 125m
1905 Kangra India 357000 831906 San Francisco California USA 700 831908 Messina Italy 160000 751920 Gansu China 100000 861923 Sagami Bay Japan 200000 831976 Tangshan North East China 695000 791985 Mexico City Mexico 7000 811988 Armenia 45000 691989 San Francisco North California USA 67 711990 North West Iran 40000 771993 South West India 13000 641994 Northridge California USA 61 671995 Kobe Japan 5000 72
- Size effect due to compression fracture (in bending)
Cypress Viaduct (1989)Nimitz Freeway Oakland CA
Hinge
Crack Initiation at Hinge Location
Hinge
Cypress Structure Typical Bent with Hinged Frames
Hinge
Typical Failure Mode of Bent After Salvadori
Loma Prieta Earthquake
Schoharie Creek BridgeNY Thruway 1987
DV Swenson amp AR Ingraffea
Blvd de la Concorde Laval Quebec North suburb of Montreal Sept 30 2006
Shear FailuremdashSize effect was a major factor
Wilkins Air ForceDepot WarehouseShelby OhioFailed 1955
Beam Depth 0914 m
Koror-Babeldaob Bridge in PalauBuilt 1977 failed 1996 Max girder depth 14 m span 241 m (world record)
AA Yee ACI ConcrIntJune197922-23
Koror-Babeldaob Bridge in Palau Built 1977 failed 1996
Our Verdict Compression and shear failure with wave from prestress failure after creep amp vertical prestress loss Size effect must have been strong
Reappraisal of Some Structural CatastrophesSIZE EFFECT WAS AN IMPORTANT FACTOR
Strength ReductionPlain Concrete Due to Size Effect
bull Malpasset Dam France (failed 1959) 77bull St Francis Dam LA (failed 1928) 60bull plinth of Schoharie Creek Bridge 1987 46
Reappraisal of Some Structural Catastrophes SIZE EFFECT WAS AN IMPORTANT FACTOR
Strength Reduction Plain Concrete Due to Size Effect bullMalpasset Dam France (failed 1959) 77 bullSt Francis Dam LA (failed 1928) 60 bull plinth of Schoharie Creek Bridge 1987 46
Could we treat entire database as a statistical population Noexcept for the part of size range where size effect is weak
183 data points all satisfy the minimum shear reinforcement requirement
d lt 05 m
For d lt 05 m lognormal distribution is a better description for shear strength because of the scatter insulting from variability of secondary characteristics e g ρ ρ ad
Relation of Size Effect Test Result to pdf of Database
cr
c
fv
Toronto tests (1998-2000)
2 cc fv =
psi 5365 =crf
1
6
1 100
21
364 in
100
Entire database
1
6
10
Smallsize
Largesize
2 crc fv =
= required averagecompr strength
crf
(in) d
2 crc fv =
2 cc fv =
Portion of database for small size range
12 in
1
6
3 50
4 in
10Log-normal in log - scale
Small size
2750 cc fv times=
(in) d(in) d
70 crc ff asymp= specified
compressive strength
a
610minusasympfP
Shift of Resistance cdf Due to Size Increase
310minusasympfP
100
Shifted pdf for large beam
1
6
10
Smallsize Large
size
2 crc fv =
Meana
a
40
Failure probability
Load distribution
a
1
6
1 100
aMean
Expected resistance distribution
Mean2 cc fv =
2 crc fv =
cr
c
fv
Max Service Load
shiftΔ
Δ is due to micro φload factor and crc ff
Known resistance distribution
(in) d(in) d
intinfin
=
0 d)()( yyFyfP RLf
(No Stirrups)
GreatRisk
Do stirrups suppress the size effect
Size effect factor for beams with stirrups
011
ss dd+
=ϑ
(type 2 size effect)
00 10dds =
log d (m) log d (m)2
5
02 0802 115
19Bahl Kong amp Rangan
ad =30σs = 96 psi gt 50 psi
21
2
1
ad =24σs = 130 psi gt 50 psi
5
2
01 1log d (m)
log
v n(M
Pa)
21
Walraven ampLehwalter
Classical tests of geometrically similar RC beams made with the same concrete indicate that stirrups mitigate but do not eliminate the size effect
a) Deep beams b) Slender beams
ad =10
= 0
= 015
ρw= 033
Statistical Bias in Database
1) The data points are crowded in small size range2) In different size ranges the distributions of secondary influencing
parameters are not uniform
Two main causes of statistical bias
0 2 4 6 8 100
40
80
120
Num
ber o
f dat
a po
ints
d (m)
90 less than 06 m deepNo beam is deeper than 2 m
Practical interest
03 06 12
10
5
0 log d (m)
ρ w
03 06 12
10
5
0 log d (m)
ρ v
Uneven distribution of steel ratio of horizontal bars
Uneven distribution of steel ratio of shear reinforcementS
of individual data points (weight) ~ 1 (number of points in interval)
Weighted regression
in 670 33 == addain 670 33 == adda
10 100d
c
c
fv
6
10 100d
1
6
c
c
fv
ω = 223 ω = 236
2
Weighted regression
Unweighted regression
Centroid regression
Centroid regression
Unweighted regression
Size Effect Law Fitting Centroids of FilteredDatabase with Uniform
51=wρ 52=wρ
aw dda ρ
log (size)
identical identical
(purely statistical inference)
EFFECT OF STIRRUPS
bull Stirrups can push the size effect up by an order of magnitude of Dl0 but cannot prevent it
bull Increasing stirrup ratio in large beams is ineffective and caneven reduce the shear strength
Covert Safety Factors
OVERT understrength Factor
65 837covert u factors
83775
( 07 )c crf fasymp
Design load 16L+12D or 14D
Inverse scale
02 04 06 08 10 15 20 5 infin0
1
2
3
4
5
TorontoTest - No stirrups
Expected Mean plusmn SD
2 cf=
31c crv f=
183c crv f=
101c crv f=
Toronto testsd = 744 in (189 m) (from Bentzs memo to Bažant Oct17 2003)
X Parameter of Steel Ratio and Shear Span
c
cr
vf
Vc = shear strength contribution of concrete
Mean = 31 SD = 068
ACI 1962 Small-BeamDatabase
vc = Vcbwd
ACI formula
125c cv f=
2c crv f=Toronto Test - Min Stirrups ndash25
41
Overt and Covert Understrength Factors
PARADIGM - Shear Tests of Small Beams
Safety factor asymp 35
Max service load
Max(16 12 14 ) f mL D D F+ le ϕ ϕ ϕ
Max(16 12 14 )L D D F+ le ϕ
Safe Design CriterionCurrently
φ = strength reduction (understrength) factorintended to distinguish brittleness
φ = 075 for shear
Problem F is a fringe formula involvingCovert understrength factors
φf mdash for formula errorφm mdash for material strength randomness
Required Revision
φf asymp 065 φm asymp 083 for shear
F = load capacity by design formula
Obscuring Effect of Covert Understrength Factors on Forensic Evidence
Safety factor for shearSmall beam
Large beam (for size effect ratio = 2)
16 38 average075 083 065
= = =times times
ϕ- range from 23 to 7
14 17 average075 083 065 2
= = =times times times
ϕrange from 105 to 3
Why is the size effect rarely identified in analyzing disastersMore than one mistake is needed to bring down a structure
Failure of Sleipner A Platform
Water 67m head at failure
T19
T31
D3
Failure
Finite element model
Size Effect ft reduced by 40
wrong mesh
With post-processing- shear force 55 of actual
Wrong detail
Stirrups absent- not required by Code- would increase head to 125m
T-he
aded
bar
T-headed bars - if elongated 25cm- 125m head
Assumed failure mode
Kinked reinforcing bars
~ 095 m Spalled concrete
Deflection of wall
Spalled concreteCrack width
Posterior pmax ~ 08 - 12 papplied
How to Remedy Misleading CovertUnderstrength Factors in CodesOption 1
bullUse mean prediction formulas not fringe formulas
bullUse mean material strength not reduced strength
bull In addition to the current understrength factor ϕ = ϕb accounting for brittleness impose understrength factors minus ϕf for error of formulaminus ϕm for material strength randomness and specify their CoVrsquos ω
For shear ϕb = 075 ϕf = 065 ϕm =083
( ) c crf f primeorcf prime
Option 2bullKeep the current fringe formulas
bullKeep the reduced strength
bullSpecify the implied understrength factors
ϕf and ϕm
with the coefficients of variations egωf = 22 and ωm = 19
and with the probability cut-offs eg 65 and 75
cf prime
Only this will render reliability assessment meaningful
L
p
q
Hidden size effect factor
d
1 2
1 1 2
105 16Max(14 12 16 )
075 to 1
CodeNTrueN
C d CC d C d C
+= =
+=
σϕσ
Max( 12 161 )
105 16
4CodeNTrueN
D D LD L
σ
σ
= +
= +
Wrong Size Effect Hidden in Excessive Self Weight Factor
2
1
1
075
001 10 10000
Hidden inload factor
logφ
log( )s ize
Actual
SmallLarge
(d = size)Wrong for Flexural vs shear failure high-strength vs normal concrete prestressed vs normal concrete etc
Revised Reliability Indicesa) Cornell Index
2 2 2L R
L Rs sτ
micro microβ minus=
+
i
i
yii
yi
yy
smicro
τ
minusprime =
b) Hasofer-Lind Index
2
1min
n
ii
yβ=
prime= sumP f
0
1
chosenPf = 10-6
Gaussian
Weibullxf micro
Means=1ω= 0052m=24
TGTW
τ = TWTG
0
Linearizedfailure plane at design point(y1 y2) β
y2
y1
Safe regionRgtL
Failure regionLgtR
y1
y2
τi = 1 for loadge 1 for resistance
Neither FORM nor SORM but EVRM (extreme value RM)
Max(16 12 14 ) f mL D D F+ le ϕ ϕ ϕ
Max(16 12 14 )L D D F+ le ϕ
Safe Design CriterionCurrently
φ = strength reduction (understrength) factorintended to distinguish brittleness
φ = 075 for shear
Problem F is a fringe formula involvingCovert understrength factors
φf mdash for formula errorφm mdash for material strength randomness
Required Revision
φf asymp 065 φm asymp 083 for shear
F = load capacity by design formula
Size Effect in Punching Shear
II Size Effect in Punching Shear of RC Slabs
ACI-445C-Database for Punching of Slabs
440 Tests (60 researchers)d (effective depth of slabs) ranges from 118 in to 263 in (from 30 to 668 mm)fc (concrete strength) ranges from 1160 to 17114 psi (from 8 to 118 MPa)ρ (longit reinforcement ratio) ranges from 01 to 73
Formulae in Main Design Codes
Vc=total capacityb0=control perimeterb0E=control perimeter (EC)d =effective depthfc =concrete strengthξ =Size effect term in ECρ =reinforcement ratio (longitudinal)ψ =slab rotation term (MC)θ =size effect term in proposed model
Asymptotic slope -1 isimpossible
Database Filteringto reveal the size effect
trend without any calculations
Unfiltered
Filtered mean steel ratio
Filtered mean bd
Filtered mean cb
Database filtering(continued)
Mean steel ratios
Mean bd
Mean cb
Premise1) The tests relevant to size effect are limited and not scaled2) Microplane model M7 gives generally excellent fits of test data on concrete failures
Approachbull Calibrate M7 parameters by fitting existing
test data with limited size range and different structural geometries
bull Then use calibrated M7 to predict the size effect by simulating scaled specimens
Calibration of M7 by Multivariate Regression
of Test Data for Effect of Other Parameters
Tests by Elstner and Hognestad 1956 Tests by Lips et al 2012
Cross points hold for finite element analysis results (simulations of the experimental works)Circle points hold for the experimental resultsSolid lines refer to the size effect fit of the FEM results
Verification with microplane model M7 for slabs without shear reinforcement
Tests by Bazant and Cao 1987
Tests by Regan 1986
Tests by Guandalini and Muttoni 2009
Tests by Li 2000
Verification with microplane model for slabs with shear reinforcement
Load-Deflection curves of tests and corresponding FEMs
Notperfectlyscaledspecimens(1 16)
Finite element models and corresponding fracture patterns
Perfectly scaled FEM without and with shear reinforcement
Tests of Birkle
Tests of Lips et al
Test data of Birkle 2004 and fits by proposed size effect equaton
Proposed model and calibration by multivariate
regression
D = slab thickness c = side of column b = its perimeter
Data normalized by v0
Size Effect in Torsion
Type I
Bažant Z P and Sener S ldquoSize Effect in Torsional Failure of Concrete Beamsrdquo Journal of Structural Engineering V 113 No 10 1987 pp 2125-2136 90
II Size Effect in Torsional FailuresPlain concrete beams solid cross sections
Size effect plot (log-scale) Failure pattern
MODEL
AFTER TESTTests by Bazant Sener 1987
91
Size Effect on Torsional Failure
bull 3 sizes tested in lab d = 15rdquo 3rdquo 6rdquo)bull Size range extended using microplane model M7 to 113bull Type I failure ndash as soon as peak torque is reached
Scaled computed torque-twist curves
T T
max
Twist (deg)
Bažant Z P and Sener S ldquoSize Effect in Torsional Failure of Concrete Beamsrdquo Journal of Structural Engineering V 113 No 10 1987 pp 2125-2136
Plain concrete beams ndash reduced scale tests
Hsu T T C ldquoTorsion of Structural ConcretemdashPlain Concrete Rectangular Sectionsrdquo Torsion of Structural Concrete SP-18 American Concrete Institute Farmington Hills MI Jan 1968 pp 203-238 92
Torsional failures model validationPlain concrete beams tested by Hsu (1968)
10rdquox20rdquo
10rdquox15rdquo
10rdquox10rdquo
6rdquox195rdquo
6rdquox11rdquo
bull Effects of size (and shape) observed in tests bull Model predictions match tests very well ndash lends
confidence to the model
Hsu T T C ldquoTorsion of Structural ConcretemdashBehavior of Reinforced Concrete Rectangular Membersrdquo Torsion of Structural Concrete SP-18 Am Concrete Institute Farmington Hills MI
93
Torsion of RC Beams Model Validation
bull Note Strong effect of reinforcement ratiobull Predictions by calibrated model match tests very
well ndash lends confidence to the model
B1B1
B2 B3
B4B5
B6
94
Size effect in torsional failuressInterestingly is of Type 1 even with stirrups
Reinforced Concrete Beams (Hsu 1968)Without stirrups With stirrups
Size D [mm] ndash log scale
Kirane K Darun Singh and Bažant Z P ldquoSize Effect In The Torsional Strength Of Plain And Reinforced Concreterdquo submitted to ACI Structural J
Pure prediction - no test data
Nom
inal
str
engt
h v
u [M
Pa]
Test data by Hsu 1968
Size Effect on Columns Prestressed Beam Flexure
Composite Beams andOther Types of Failure
See Bazantrsquos website
Code Articles Requiring Size Effectbull shear of beams without
and with stirrupsbull torsion of beams bull punching of slabs bull shear of deep beams bull bar splices and
development length bull all failures due to
compression crushing of concrete as in-- columns -- prestressed beams -- arches -- bearing strength -- strut-and-tie models
bull failure of composite beams due to failure of connections
EFFECT OF STIRRUPSbull Stirrups can push the size effect up by an order of magnitude of Dl0 but cannot prevent itbull Increasing stirrup ratio in large beams is ineffective and can even reduce the shear strength
Slide Number 70
Slide Number 71
Slide Number 72
Slide Number 73
Failure of Sleipner A Platform
How to Remedy Misleading CovertUnderstrength Factors in Codes
Slide Number 76
Revised Reliability Indices
Slide Number 78
Slide Number 79
II Size Effect in Punching Shear of RC Slabs
Formulae in Main Design Codes
Database Filteringto reveal the size effect trend without any calculations
Slide Number 83
Slide Number 84
Calibration of M7 by Multivariate Regression of Test Data for Effect of Other Parameters
Slide Number 86
Slide Number 87
Proposed model and calibration by multivariate regression
Slide Number 89
Slide Number 90
Slide Number 91
Slide Number 92
Slide Number 93
Slide Number 94
Slide Number 95
Code Articles Requiring Size Effect
Slide Number 97
a) Plasticbull No localization simultane-
ous strengths are summed
bull CoV decreases with structure size as
bull Gaussian distribution
1 D
b) Brittlebull Localizes propagates
one element controls Pmax
bull No decrease of CoV with size D high scatter
bull Weibull distribution
c) QuasibrittleFinite fracture process zone- charact length Transitional SIZE EFFECT
Geometric similarity of fractures at different size is a required hypothesis for Type 2 size effect Here is a demonstration that it holds true for beam shear failures at different sizes
Small Large
Cause of Size Effect (of Type 1) for Failure at Crack Initiation
D
Db
D
Db
M M
ft ft
σN σN
Cause of size effect(Can this be denied andreplaced by fractals)
Vanishing size effect but strength randomnessbecomes important
1
1r
bN
rDDinfin
= +
σ σ
(Alternative derivationby fracture mechanicsfor a 0)
Size Effect (of Type 2) Dimensional Analysis and Asymptotic Matching
0 or 0)( 2
2
02
2
21 =
=ΠΠ
t
N
t
N
flfDff σσ
20 tf fEGl =
21
02
2
0
2
2
0
~~ 0 If
const~ 0 If
minusrarr=
gtgt
=rarr=
ltlt
DDEGlfDflD
ff
flD
fNt
N
tNt
N
σσ
σσ
4 variables ft [Nm2] Gf [Jm2] D [m] σN [Nm2]Characteristic material length implied (Irwin 1958)
Buckingham theoremMax load given by
Expansion of f(Π1 Π2) = 0 up to 2nd
order terms yields approx size effect law21
0 )1( minus+= DDBftNσ
21
log σN
log D
Large crack at max load
Bazant PNAS 2004
Derivations of Size Effect Law1 Analyticalndash Simplified energy release analysisndash Simplified contour integration of J-
integralndash Dimensional analysis with
asymptotic matchingndash Asymptotic transformations of
diffeqs with boundary conditionsndash Asymptotic analysis of equivalent
LEFMndash Asymptotics of cohesive crack
model (smeared-tip method)ndash Asymptotic expansion of J-integralndash Deterministic limit of probabilistic
nonlocal theory
2 Numericalndash FEM with strongly nonlocal damage modelsndash FEM with gradient (weakly nonlocal) modelsndash Random Lattice Discrete Particle Modelndash Limit of nonlocal probabilistic FEM
Asymptotic MatchingSize Effect of Divinycell H100 Foam
1
Size Effect Law(Bazant 1984)
Gf = 061 Nmmcf = 033 mm
log D (mm)
log
σ N(M
Pa-2
)
0
-1-1 10 32
Strength criterion
Large-SizeAsymptoticExpansion
21 LEFM
Small-SizeAsymptoticExpansion-12
N0
= 1tDBfD
σ prime +
f
0 f 0
E G=g (α )c +g(α )D
Easy EasyHard
( ) 1 1
0
rN rk minus+= ϑσσ
Energetic ( Quasibrittle ) Mean Size EffectLaws and Statistical Generalization
2c ndash based on cohesive crack model 1s ndash statistical generalization
log (Size D)
Type 2
log
( Nom
Stre
ngth
σN
)
1
01
01 1 10 100
2c
2
1
21
00
1minus
+=
DDN
σσ
Type 1
1 10 100
1
01m
n
r
1
( ) rmnN rk 1
0
ϑϑσσ
+=
Statistical
1s
1cDD
D
b
b
+=ϑ
Deterministic
Deterministic with statistical CoV
1000100
Classical Narrow-Range Test Data for Size Effect on Shear Strength of RC Beams without Stirrups
Kani (1967)
ad=25
Kani (1967)
ad=30
Kani (1967)
ad=40
Kani (1967)
ad=50
Kani (1967)
ad=70
Leonhardt amp Walther (1962)
ad=30
Bahl (1968)
ad=30
1
03
1
05
1
051
3
100 1000 100 1000 100 1000
2
1
100 1000 1000
1
05100
0
0
30 MPa176 mm
vd
=
=0
0
224 MPa246 mm
vd
=
=0
0
154 MPa661 mm
vd
=
=0
0
155 MPa618 mm
vd
=
=
0
0
12 MPa133 mm
vd
=
=0
0
175 MPa386 mm
vd
=
=0
0
133 MPa388 mm
vd
=
=
log
v c(M
Pa)
log
v c(M
Pa)
log d (mm) log d (mm) log d (mm)log d (mm)
1
05100 1000
log d (mm) log d (mm)log d (mm)
Reduced-Scale Tests of Beam Shear Failure at Northwestern (aggregate lt 48 mm)
1 20(1 )N p d dσ σ minus= +
Incorporating the size effect into design code formulas for reinforced concrete is easy
011
dd+=ϑ
Multiply the formula for the strength contribution of concrete by the size effect factor
(type 2 size effect)
Design Formula for Shear in RC Beams Proposed in fib 2010 Draft 1) Invalid derivation
from Modified Compression Field Theory MCFT based on plasticity for crack initiation
2) Effects of ρw andad ignored
3) No size effect if minimum shear reinforcement exists
4) etc
Proposed by ACI-446 (fracture mechanics based)
not if 3330 known is if 3800 where
1
1 320
0
40
4083
==
=+
+= minus
κκ
κmicroρ
aa
cc
wc
dd
fddd
fad
v
c
ckvcRd
fkV
γ=
ykckw
w
ffz
080 if 150
0 if 150311000
200
ge=
=le+
=
ρ
ρvk
If stirrups ge minimum stirrups the size effect still exists though pushed into larger sizes (d0 will increase by about one order of magnitude)
DEFICIENCIES
0
5
10
15
20
25
30
0 2 4 6
Vu
size d
Pd
d) fib Model Code 2010MCVmax
No size effect
VuVu
Vu prop d1
Vu prop d3 4 = d(dminus1 4 )
Vu propd
1+ d d0
Vu propd
1+ cda horizontal asymptote (unphysical)
Comparison of CURVES OF SHEAR FORCE Vu = bw d vu
vs SIZE d in current codes
Note The curves are scaled to the same initial tangent
Stress transmitted across crack is not the reason 2P V=
0C
V
ϕ
c b
0Ra
crack
0001
0074 111 151
3162 10minustimes
sεPodgorniak-Stanik( 1998) TorontoTest BN50
Measured steel strains
1CV
V
1C ϕ
75
0
F
2 cfasympσ
1 tfltltσ
Main diagonal crack
σ
Vσy
σt σn
tf
For small beams the contribution of crack-bridging stress is significant ie 40 while for 18 m deep beams it is negligible ie 9
Failure Mechanism in Shear Test of Large Beam
2P V=
0C
V
ϕ
c b
0Ra
1CV
V
1C ϕ
75
0
2 cfσ asymp
crack
Compression resultant location
Negligible shear stresseson crack face
1 tfltltσ
V
V
FEM crack band microplane model
Toronto 189 m deep
Small beam dt = 02m Large beam dt = 54m
cf 025dt
cf027dt
025dt 027dt
Interlock shear ndash localized
interlockσinterlockσ
At Vmax
Horizontal compressive stress Localized
stress
Interlock shear (vertical component)
Stresses calculated by microplane crack band model calibrated by Toronto tests
EXPLANATION In larger beams fcrsquo doesnrsquot get mobilized through the whole cross section
Vinterlock = 40 of Vtotal 5 of Vtotal
Problems with Explaining the Size Effect by Reduction in Interface Shear Transfer Resistance (Collins et al)
Conflicts with dimensional analysis based on known asymptotic properties (the asymptotic slope of -1 is excessive thermodynamically impossible)
Is not general Doesnrsquot work for other failure types and materials with the same kind of size effect (eg punching shear or compressive crushing )
In large beams the tensile cohesive stresses along the diagonal crack at peak load are negligible compared to the compressive stress parallel to the crack
In large beams the interface shear due to aggregate interlock contributes only a minor part to the total shear strength although it has an significant effect in small beams
Localization with increasing size of the compressive stress profile across the ligament above the tip of the diagonal crack leads to compressive crushing of concrete at peak load
Crack spacing is a secondary influence not the primary cause of size effect
Small Beam Large BeamBeam top
cf 025d
cf
027dBeam topCompressive
stress distribution
1
05
2
1
03 3
log dd0
0
nvv
0
01 =
+nvvd d
0
0
180 MPa247 m
==
vd
Size Effect in Beam Shear by Crack-Band Microplane Finite Element ModelSimulation of Toronto test
1
Compressionsplitting amp crushing
Fracture mechanics based finite elementsimulations support the size effect law
Structural Failures with Evidence of Size Effect
Schoharie Creek BridgeNY Thruway 1987
DV Swenson amp AR Ingraffea
Sleipner A Platform Norway
Sank 23 Aug 1991~ 82 m deep water~ 190 m tall
Failure of Sleipner A Platform
Water 67m head at failure
T19
T31
D3
Failure
Finite element model
Size Effect ft reduced by 40
wrong mesh
With post-processing- shear force 55 of actual
Wrong detail
Stirrups absent- not required by Code- would increase head to 125m
1905 Kangra India 357000 831906 San Francisco California USA 700 831908 Messina Italy 160000 751920 Gansu China 100000 861923 Sagami Bay Japan 200000 831976 Tangshan North East China 695000 791985 Mexico City Mexico 7000 811988 Armenia 45000 691989 San Francisco North California USA 67 711990 North West Iran 40000 771993 South West India 13000 641994 Northridge California USA 61 671995 Kobe Japan 5000 72
- Size effect due to compression fracture (in bending)
Cypress Viaduct (1989)Nimitz Freeway Oakland CA
Hinge
Crack Initiation at Hinge Location
Hinge
Cypress Structure Typical Bent with Hinged Frames
Hinge
Typical Failure Mode of Bent After Salvadori
Loma Prieta Earthquake
Schoharie Creek BridgeNY Thruway 1987
DV Swenson amp AR Ingraffea
Blvd de la Concorde Laval Quebec North suburb of Montreal Sept 30 2006
Shear FailuremdashSize effect was a major factor
Wilkins Air ForceDepot WarehouseShelby OhioFailed 1955
Beam Depth 0914 m
Koror-Babeldaob Bridge in PalauBuilt 1977 failed 1996 Max girder depth 14 m span 241 m (world record)
AA Yee ACI ConcrIntJune197922-23
Koror-Babeldaob Bridge in Palau Built 1977 failed 1996
Our Verdict Compression and shear failure with wave from prestress failure after creep amp vertical prestress loss Size effect must have been strong
Reappraisal of Some Structural CatastrophesSIZE EFFECT WAS AN IMPORTANT FACTOR
Strength ReductionPlain Concrete Due to Size Effect
bull Malpasset Dam France (failed 1959) 77bull St Francis Dam LA (failed 1928) 60bull plinth of Schoharie Creek Bridge 1987 46
Reappraisal of Some Structural Catastrophes SIZE EFFECT WAS AN IMPORTANT FACTOR
Strength Reduction Plain Concrete Due to Size Effect bullMalpasset Dam France (failed 1959) 77 bullSt Francis Dam LA (failed 1928) 60 bull plinth of Schoharie Creek Bridge 1987 46
Could we treat entire database as a statistical population Noexcept for the part of size range where size effect is weak
183 data points all satisfy the minimum shear reinforcement requirement
d lt 05 m
For d lt 05 m lognormal distribution is a better description for shear strength because of the scatter insulting from variability of secondary characteristics e g ρ ρ ad
Relation of Size Effect Test Result to pdf of Database
cr
c
fv
Toronto tests (1998-2000)
2 cc fv =
psi 5365 =crf
1
6
1 100
21
364 in
100
Entire database
1
6
10
Smallsize
Largesize
2 crc fv =
= required averagecompr strength
crf
(in) d
2 crc fv =
2 cc fv =
Portion of database for small size range
12 in
1
6
3 50
4 in
10Log-normal in log - scale
Small size
2750 cc fv times=
(in) d(in) d
70 crc ff asymp= specified
compressive strength
a
610minusasympfP
Shift of Resistance cdf Due to Size Increase
310minusasympfP
100
Shifted pdf for large beam
1
6
10
Smallsize Large
size
2 crc fv =
Meana
a
40
Failure probability
Load distribution
a
1
6
1 100
aMean
Expected resistance distribution
Mean2 cc fv =
2 crc fv =
cr
c
fv
Max Service Load
shiftΔ
Δ is due to micro φload factor and crc ff
Known resistance distribution
(in) d(in) d
intinfin
=
0 d)()( yyFyfP RLf
(No Stirrups)
GreatRisk
Do stirrups suppress the size effect
Size effect factor for beams with stirrups
011
ss dd+
=ϑ
(type 2 size effect)
00 10dds =
log d (m) log d (m)2
5
02 0802 115
19Bahl Kong amp Rangan
ad =30σs = 96 psi gt 50 psi
21
2
1
ad =24σs = 130 psi gt 50 psi
5
2
01 1log d (m)
log
v n(M
Pa)
21
Walraven ampLehwalter
Classical tests of geometrically similar RC beams made with the same concrete indicate that stirrups mitigate but do not eliminate the size effect
a) Deep beams b) Slender beams
ad =10
= 0
= 015
ρw= 033
Statistical Bias in Database
1) The data points are crowded in small size range2) In different size ranges the distributions of secondary influencing
parameters are not uniform
Two main causes of statistical bias
0 2 4 6 8 100
40
80
120
Num
ber o
f dat
a po
ints
d (m)
90 less than 06 m deepNo beam is deeper than 2 m
Practical interest
03 06 12
10
5
0 log d (m)
ρ w
03 06 12
10
5
0 log d (m)
ρ v
Uneven distribution of steel ratio of horizontal bars
Uneven distribution of steel ratio of shear reinforcementS
of individual data points (weight) ~ 1 (number of points in interval)
Weighted regression
in 670 33 == addain 670 33 == adda
10 100d
c
c
fv
6
10 100d
1
6
c
c
fv
ω = 223 ω = 236
2
Weighted regression
Unweighted regression
Centroid regression
Centroid regression
Unweighted regression
Size Effect Law Fitting Centroids of FilteredDatabase with Uniform
51=wρ 52=wρ
aw dda ρ
log (size)
identical identical
(purely statistical inference)
EFFECT OF STIRRUPS
bull Stirrups can push the size effect up by an order of magnitude of Dl0 but cannot prevent it
bull Increasing stirrup ratio in large beams is ineffective and caneven reduce the shear strength
Covert Safety Factors
OVERT understrength Factor
65 837covert u factors
83775
( 07 )c crf fasymp
Design load 16L+12D or 14D
Inverse scale
02 04 06 08 10 15 20 5 infin0
1
2
3
4
5
TorontoTest - No stirrups
Expected Mean plusmn SD
2 cf=
31c crv f=
183c crv f=
101c crv f=
Toronto testsd = 744 in (189 m) (from Bentzs memo to Bažant Oct17 2003)
X Parameter of Steel Ratio and Shear Span
c
cr
vf
Vc = shear strength contribution of concrete
Mean = 31 SD = 068
ACI 1962 Small-BeamDatabase
vc = Vcbwd
ACI formula
125c cv f=
2c crv f=Toronto Test - Min Stirrups ndash25
41
Overt and Covert Understrength Factors
PARADIGM - Shear Tests of Small Beams
Safety factor asymp 35
Max service load
Max(16 12 14 ) f mL D D F+ le ϕ ϕ ϕ
Max(16 12 14 )L D D F+ le ϕ
Safe Design CriterionCurrently
φ = strength reduction (understrength) factorintended to distinguish brittleness
φ = 075 for shear
Problem F is a fringe formula involvingCovert understrength factors
φf mdash for formula errorφm mdash for material strength randomness
Required Revision
φf asymp 065 φm asymp 083 for shear
F = load capacity by design formula
Obscuring Effect of Covert Understrength Factors on Forensic Evidence
Safety factor for shearSmall beam
Large beam (for size effect ratio = 2)
16 38 average075 083 065
= = =times times
ϕ- range from 23 to 7
14 17 average075 083 065 2
= = =times times times
ϕrange from 105 to 3
Why is the size effect rarely identified in analyzing disastersMore than one mistake is needed to bring down a structure
Failure of Sleipner A Platform
Water 67m head at failure
T19
T31
D3
Failure
Finite element model
Size Effect ft reduced by 40
wrong mesh
With post-processing- shear force 55 of actual
Wrong detail
Stirrups absent- not required by Code- would increase head to 125m
T-he
aded
bar
T-headed bars - if elongated 25cm- 125m head
Assumed failure mode
Kinked reinforcing bars
~ 095 m Spalled concrete
Deflection of wall
Spalled concreteCrack width
Posterior pmax ~ 08 - 12 papplied
How to Remedy Misleading CovertUnderstrength Factors in CodesOption 1
bullUse mean prediction formulas not fringe formulas
bullUse mean material strength not reduced strength
bull In addition to the current understrength factor ϕ = ϕb accounting for brittleness impose understrength factors minus ϕf for error of formulaminus ϕm for material strength randomness and specify their CoVrsquos ω
For shear ϕb = 075 ϕf = 065 ϕm =083
( ) c crf f primeorcf prime
Option 2bullKeep the current fringe formulas
bullKeep the reduced strength
bullSpecify the implied understrength factors
ϕf and ϕm
with the coefficients of variations egωf = 22 and ωm = 19
and with the probability cut-offs eg 65 and 75
cf prime
Only this will render reliability assessment meaningful
L
p
q
Hidden size effect factor
d
1 2
1 1 2
105 16Max(14 12 16 )
075 to 1
CodeNTrueN
C d CC d C d C
+= =
+=
σϕσ
Max( 12 161 )
105 16
4CodeNTrueN
D D LD L
σ
σ
= +
= +
Wrong Size Effect Hidden in Excessive Self Weight Factor
2
1
1
075
001 10 10000
Hidden inload factor
logφ
log( )s ize
Actual
SmallLarge
(d = size)Wrong for Flexural vs shear failure high-strength vs normal concrete prestressed vs normal concrete etc
Revised Reliability Indicesa) Cornell Index
2 2 2L R
L Rs sτ
micro microβ minus=
+
i
i
yii
yi
yy
smicro
τ
minusprime =
b) Hasofer-Lind Index
2
1min
n
ii
yβ=
prime= sumP f
0
1
chosenPf = 10-6
Gaussian
Weibullxf micro
Means=1ω= 0052m=24
TGTW
τ = TWTG
0
Linearizedfailure plane at design point(y1 y2) β
y2
y1
Safe regionRgtL
Failure regionLgtR
y1
y2
τi = 1 for loadge 1 for resistance
Neither FORM nor SORM but EVRM (extreme value RM)
Max(16 12 14 ) f mL D D F+ le ϕ ϕ ϕ
Max(16 12 14 )L D D F+ le ϕ
Safe Design CriterionCurrently
φ = strength reduction (understrength) factorintended to distinguish brittleness
φ = 075 for shear
Problem F is a fringe formula involvingCovert understrength factors
φf mdash for formula errorφm mdash for material strength randomness
Required Revision
φf asymp 065 φm asymp 083 for shear
F = load capacity by design formula
Size Effect in Punching Shear
II Size Effect in Punching Shear of RC Slabs
ACI-445C-Database for Punching of Slabs
440 Tests (60 researchers)d (effective depth of slabs) ranges from 118 in to 263 in (from 30 to 668 mm)fc (concrete strength) ranges from 1160 to 17114 psi (from 8 to 118 MPa)ρ (longit reinforcement ratio) ranges from 01 to 73
Formulae in Main Design Codes
Vc=total capacityb0=control perimeterb0E=control perimeter (EC)d =effective depthfc =concrete strengthξ =Size effect term in ECρ =reinforcement ratio (longitudinal)ψ =slab rotation term (MC)θ =size effect term in proposed model
Asymptotic slope -1 isimpossible
Database Filteringto reveal the size effect
trend without any calculations
Unfiltered
Filtered mean steel ratio
Filtered mean bd
Filtered mean cb
Database filtering(continued)
Mean steel ratios
Mean bd
Mean cb
Premise1) The tests relevant to size effect are limited and not scaled2) Microplane model M7 gives generally excellent fits of test data on concrete failures
Approachbull Calibrate M7 parameters by fitting existing
test data with limited size range and different structural geometries
bull Then use calibrated M7 to predict the size effect by simulating scaled specimens
Calibration of M7 by Multivariate Regression
of Test Data for Effect of Other Parameters
Tests by Elstner and Hognestad 1956 Tests by Lips et al 2012
Cross points hold for finite element analysis results (simulations of the experimental works)Circle points hold for the experimental resultsSolid lines refer to the size effect fit of the FEM results
Verification with microplane model M7 for slabs without shear reinforcement
Tests by Bazant and Cao 1987
Tests by Regan 1986
Tests by Guandalini and Muttoni 2009
Tests by Li 2000
Verification with microplane model for slabs with shear reinforcement
Load-Deflection curves of tests and corresponding FEMs
Notperfectlyscaledspecimens(1 16)
Finite element models and corresponding fracture patterns
Perfectly scaled FEM without and with shear reinforcement
Tests of Birkle
Tests of Lips et al
Test data of Birkle 2004 and fits by proposed size effect equaton
Proposed model and calibration by multivariate
regression
D = slab thickness c = side of column b = its perimeter
Data normalized by v0
Size Effect in Torsion
Type I
Bažant Z P and Sener S ldquoSize Effect in Torsional Failure of Concrete Beamsrdquo Journal of Structural Engineering V 113 No 10 1987 pp 2125-2136 90
II Size Effect in Torsional FailuresPlain concrete beams solid cross sections
Size effect plot (log-scale) Failure pattern
MODEL
AFTER TESTTests by Bazant Sener 1987
91
Size Effect on Torsional Failure
bull 3 sizes tested in lab d = 15rdquo 3rdquo 6rdquo)bull Size range extended using microplane model M7 to 113bull Type I failure ndash as soon as peak torque is reached
Scaled computed torque-twist curves
T T
max
Twist (deg)
Bažant Z P and Sener S ldquoSize Effect in Torsional Failure of Concrete Beamsrdquo Journal of Structural Engineering V 113 No 10 1987 pp 2125-2136
Plain concrete beams ndash reduced scale tests
Hsu T T C ldquoTorsion of Structural ConcretemdashPlain Concrete Rectangular Sectionsrdquo Torsion of Structural Concrete SP-18 American Concrete Institute Farmington Hills MI Jan 1968 pp 203-238 92
Torsional failures model validationPlain concrete beams tested by Hsu (1968)
10rdquox20rdquo
10rdquox15rdquo
10rdquox10rdquo
6rdquox195rdquo
6rdquox11rdquo
bull Effects of size (and shape) observed in tests bull Model predictions match tests very well ndash lends
confidence to the model
Hsu T T C ldquoTorsion of Structural ConcretemdashBehavior of Reinforced Concrete Rectangular Membersrdquo Torsion of Structural Concrete SP-18 Am Concrete Institute Farmington Hills MI
93
Torsion of RC Beams Model Validation
bull Note Strong effect of reinforcement ratiobull Predictions by calibrated model match tests very
well ndash lends confidence to the model
B1B1
B2 B3
B4B5
B6
94
Size effect in torsional failuressInterestingly is of Type 1 even with stirrups
Reinforced Concrete Beams (Hsu 1968)Without stirrups With stirrups
Size D [mm] ndash log scale
Kirane K Darun Singh and Bažant Z P ldquoSize Effect In The Torsional Strength Of Plain And Reinforced Concreterdquo submitted to ACI Structural J
Pure prediction - no test data
Nom
inal
str
engt
h v
u [M
Pa]
Test data by Hsu 1968
Size Effect on Columns Prestressed Beam Flexure
Composite Beams andOther Types of Failure
See Bazantrsquos website
Code Articles Requiring Size Effectbull shear of beams without
and with stirrupsbull torsion of beams bull punching of slabs bull shear of deep beams bull bar splices and
development length bull all failures due to
compression crushing of concrete as in-- columns -- prestressed beams -- arches -- bearing strength -- strut-and-tie models
bull failure of composite beams due to failure of connections
EFFECT OF STIRRUPSbull Stirrups can push the size effect up by an order of magnitude of Dl0 but cannot prevent itbull Increasing stirrup ratio in large beams is ineffective and can even reduce the shear strength
Slide Number 70
Slide Number 71
Slide Number 72
Slide Number 73
Failure of Sleipner A Platform
How to Remedy Misleading CovertUnderstrength Factors in Codes
Slide Number 76
Revised Reliability Indices
Slide Number 78
Slide Number 79
II Size Effect in Punching Shear of RC Slabs
Formulae in Main Design Codes
Database Filteringto reveal the size effect trend without any calculations
Slide Number 83
Slide Number 84
Calibration of M7 by Multivariate Regression of Test Data for Effect of Other Parameters
Slide Number 86
Slide Number 87
Proposed model and calibration by multivariate regression
Slide Number 89
Slide Number 90
Slide Number 91
Slide Number 92
Slide Number 93
Slide Number 94
Slide Number 95
Code Articles Requiring Size Effect
Slide Number 97
0
5
10
15
20
25
30
0 2 4 6
Vu
size d
Pd
d) fib Model Code 2010MCVmax
No size effect
VuVu
Vu prop d1
Vu prop d3 4 = d(dminus1 4 )
Vu propd
1+ d d0
Vu propd
1+ cda horizontal asymptote (unphysical)
Comparison of CURVES OF SHEAR FORCE Vu = bw d vu
vs SIZE d in current codes
Note The curves are scaled to the same initial tangent
Stress transmitted across crack is not the reason 2P V=
0C
V
ϕ
c b
0Ra
crack
0001
0074 111 151
3162 10minustimes
sεPodgorniak-Stanik( 1998) TorontoTest BN50
Measured steel strains
1CV
V
1C ϕ
75
0
F
2 cfasympσ
1 tfltltσ
Main diagonal crack
σ
Vσy
σt σn
tf
For small beams the contribution of crack-bridging stress is significant ie 40 while for 18 m deep beams it is negligible ie 9
Failure Mechanism in Shear Test of Large Beam
2P V=
0C
V
ϕ
c b
0Ra
1CV
V
1C ϕ
75
0
2 cfσ asymp
crack
Compression resultant location
Negligible shear stresseson crack face
1 tfltltσ
V
V
FEM crack band microplane model
Toronto 189 m deep
Small beam dt = 02m Large beam dt = 54m
cf 025dt
cf027dt
025dt 027dt
Interlock shear ndash localized
interlockσinterlockσ
At Vmax
Horizontal compressive stress Localized
stress
Interlock shear (vertical component)
Stresses calculated by microplane crack band model calibrated by Toronto tests
EXPLANATION In larger beams fcrsquo doesnrsquot get mobilized through the whole cross section
Vinterlock = 40 of Vtotal 5 of Vtotal
Problems with Explaining the Size Effect by Reduction in Interface Shear Transfer Resistance (Collins et al)
Conflicts with dimensional analysis based on known asymptotic properties (the asymptotic slope of -1 is excessive thermodynamically impossible)
Is not general Doesnrsquot work for other failure types and materials with the same kind of size effect (eg punching shear or compressive crushing )
In large beams the tensile cohesive stresses along the diagonal crack at peak load are negligible compared to the compressive stress parallel to the crack
In large beams the interface shear due to aggregate interlock contributes only a minor part to the total shear strength although it has an significant effect in small beams
Localization with increasing size of the compressive stress profile across the ligament above the tip of the diagonal crack leads to compressive crushing of concrete at peak load
Crack spacing is a secondary influence not the primary cause of size effect
Small Beam Large BeamBeam top
cf 025d
cf
027dBeam topCompressive
stress distribution
1
05
2
1
03 3
log dd0
0
nvv
0
01 =
+nvvd d
0
0
180 MPa247 m
==
vd
Size Effect in Beam Shear by Crack-Band Microplane Finite Element ModelSimulation of Toronto test
1
Compressionsplitting amp crushing
Fracture mechanics based finite elementsimulations support the size effect law
Structural Failures with Evidence of Size Effect
Schoharie Creek BridgeNY Thruway 1987
DV Swenson amp AR Ingraffea
Sleipner A Platform Norway
Sank 23 Aug 1991~ 82 m deep water~ 190 m tall
Failure of Sleipner A Platform
Water 67m head at failure
T19
T31
D3
Failure
Finite element model
Size Effect ft reduced by 40
wrong mesh
With post-processing- shear force 55 of actual
Wrong detail
Stirrups absent- not required by Code- would increase head to 125m
1905 Kangra India 357000 831906 San Francisco California USA 700 831908 Messina Italy 160000 751920 Gansu China 100000 861923 Sagami Bay Japan 200000 831976 Tangshan North East China 695000 791985 Mexico City Mexico 7000 811988 Armenia 45000 691989 San Francisco North California USA 67 711990 North West Iran 40000 771993 South West India 13000 641994 Northridge California USA 61 671995 Kobe Japan 5000 72
- Size effect due to compression fracture (in bending)
Cypress Viaduct (1989)Nimitz Freeway Oakland CA
Hinge
Crack Initiation at Hinge Location
Hinge
Cypress Structure Typical Bent with Hinged Frames
Hinge
Typical Failure Mode of Bent After Salvadori
Loma Prieta Earthquake
Schoharie Creek BridgeNY Thruway 1987
DV Swenson amp AR Ingraffea
Blvd de la Concorde Laval Quebec North suburb of Montreal Sept 30 2006
Shear FailuremdashSize effect was a major factor
Wilkins Air ForceDepot WarehouseShelby OhioFailed 1955
Beam Depth 0914 m
Koror-Babeldaob Bridge in PalauBuilt 1977 failed 1996 Max girder depth 14 m span 241 m (world record)
AA Yee ACI ConcrIntJune197922-23
Koror-Babeldaob Bridge in Palau Built 1977 failed 1996
Our Verdict Compression and shear failure with wave from prestress failure after creep amp vertical prestress loss Size effect must have been strong
Reappraisal of Some Structural CatastrophesSIZE EFFECT WAS AN IMPORTANT FACTOR
Strength ReductionPlain Concrete Due to Size Effect
bull Malpasset Dam France (failed 1959) 77bull St Francis Dam LA (failed 1928) 60bull plinth of Schoharie Creek Bridge 1987 46
Reappraisal of Some Structural Catastrophes SIZE EFFECT WAS AN IMPORTANT FACTOR
Strength Reduction Plain Concrete Due to Size Effect bullMalpasset Dam France (failed 1959) 77 bullSt Francis Dam LA (failed 1928) 60 bull plinth of Schoharie Creek Bridge 1987 46
Could we treat entire database as a statistical population Noexcept for the part of size range where size effect is weak
183 data points all satisfy the minimum shear reinforcement requirement
d lt 05 m
For d lt 05 m lognormal distribution is a better description for shear strength because of the scatter insulting from variability of secondary characteristics e g ρ ρ ad
Relation of Size Effect Test Result to pdf of Database
cr
c
fv
Toronto tests (1998-2000)
2 cc fv =
psi 5365 =crf
1
6
1 100
21
364 in
100
Entire database
1
6
10
Smallsize
Largesize
2 crc fv =
= required averagecompr strength
crf
(in) d
2 crc fv =
2 cc fv =
Portion of database for small size range
12 in
1
6
3 50
4 in
10Log-normal in log - scale
Small size
2750 cc fv times=
(in) d(in) d
70 crc ff asymp= specified
compressive strength
a
610minusasympfP
Shift of Resistance cdf Due to Size Increase
310minusasympfP
100
Shifted pdf for large beam
1
6
10
Smallsize Large
size
2 crc fv =
Meana
a
40
Failure probability
Load distribution
a
1
6
1 100
aMean
Expected resistance distribution
Mean2 cc fv =
2 crc fv =
cr
c
fv
Max Service Load
shiftΔ
Δ is due to micro φload factor and crc ff
Known resistance distribution
(in) d(in) d
intinfin
=
0 d)()( yyFyfP RLf
(No Stirrups)
GreatRisk
Do stirrups suppress the size effect
Size effect factor for beams with stirrups
011
ss dd+
=ϑ
(type 2 size effect)
00 10dds =
log d (m) log d (m)2
5
02 0802 115
19Bahl Kong amp Rangan
ad =30σs = 96 psi gt 50 psi
21
2
1
ad =24σs = 130 psi gt 50 psi
5
2
01 1log d (m)
log
v n(M
Pa)
21
Walraven ampLehwalter
Classical tests of geometrically similar RC beams made with the same concrete indicate that stirrups mitigate but do not eliminate the size effect
a) Deep beams b) Slender beams
ad =10
= 0
= 015
ρw= 033
Statistical Bias in Database
1) The data points are crowded in small size range2) In different size ranges the distributions of secondary influencing
parameters are not uniform
Two main causes of statistical bias
0 2 4 6 8 100
40
80
120
Num
ber o
f dat
a po
ints
d (m)
90 less than 06 m deepNo beam is deeper than 2 m
Practical interest
03 06 12
10
5
0 log d (m)
ρ w
03 06 12
10
5
0 log d (m)
ρ v
Uneven distribution of steel ratio of horizontal bars
Uneven distribution of steel ratio of shear reinforcementS
of individual data points (weight) ~ 1 (number of points in interval)
Weighted regression
in 670 33 == addain 670 33 == adda
10 100d
c
c
fv
6
10 100d
1
6
c
c
fv
ω = 223 ω = 236
2
Weighted regression
Unweighted regression
Centroid regression
Centroid regression
Unweighted regression
Size Effect Law Fitting Centroids of FilteredDatabase with Uniform
51=wρ 52=wρ
aw dda ρ
log (size)
identical identical
(purely statistical inference)
EFFECT OF STIRRUPS
bull Stirrups can push the size effect up by an order of magnitude of Dl0 but cannot prevent it
bull Increasing stirrup ratio in large beams is ineffective and caneven reduce the shear strength
Covert Safety Factors
OVERT understrength Factor
65 837covert u factors
83775
( 07 )c crf fasymp
Design load 16L+12D or 14D
Inverse scale
02 04 06 08 10 15 20 5 infin0
1
2
3
4
5
TorontoTest - No stirrups
Expected Mean plusmn SD
2 cf=
31c crv f=
183c crv f=
101c crv f=
Toronto testsd = 744 in (189 m) (from Bentzs memo to Bažant Oct17 2003)
X Parameter of Steel Ratio and Shear Span
c
cr
vf
Vc = shear strength contribution of concrete
Mean = 31 SD = 068
ACI 1962 Small-BeamDatabase
vc = Vcbwd
ACI formula
125c cv f=
2c crv f=Toronto Test - Min Stirrups ndash25
41
Overt and Covert Understrength Factors
PARADIGM - Shear Tests of Small Beams
Safety factor asymp 35
Max service load
Max(16 12 14 ) f mL D D F+ le ϕ ϕ ϕ
Max(16 12 14 )L D D F+ le ϕ
Safe Design CriterionCurrently
φ = strength reduction (understrength) factorintended to distinguish brittleness
φ = 075 for shear
Problem F is a fringe formula involvingCovert understrength factors
φf mdash for formula errorφm mdash for material strength randomness
Required Revision
φf asymp 065 φm asymp 083 for shear
F = load capacity by design formula
Obscuring Effect of Covert Understrength Factors on Forensic Evidence
Safety factor for shearSmall beam
Large beam (for size effect ratio = 2)
16 38 average075 083 065
= = =times times
ϕ- range from 23 to 7
14 17 average075 083 065 2
= = =times times times
ϕrange from 105 to 3
Why is the size effect rarely identified in analyzing disastersMore than one mistake is needed to bring down a structure
Failure of Sleipner A Platform
Water 67m head at failure
T19
T31
D3
Failure
Finite element model
Size Effect ft reduced by 40
wrong mesh
With post-processing- shear force 55 of actual
Wrong detail
Stirrups absent- not required by Code- would increase head to 125m
T-he
aded
bar
T-headed bars - if elongated 25cm- 125m head
Assumed failure mode
Kinked reinforcing bars
~ 095 m Spalled concrete
Deflection of wall
Spalled concreteCrack width
Posterior pmax ~ 08 - 12 papplied
How to Remedy Misleading CovertUnderstrength Factors in CodesOption 1
bullUse mean prediction formulas not fringe formulas
bullUse mean material strength not reduced strength
bull In addition to the current understrength factor ϕ = ϕb accounting for brittleness impose understrength factors minus ϕf for error of formulaminus ϕm for material strength randomness and specify their CoVrsquos ω
For shear ϕb = 075 ϕf = 065 ϕm =083
( ) c crf f primeorcf prime
Option 2bullKeep the current fringe formulas
bullKeep the reduced strength
bullSpecify the implied understrength factors
ϕf and ϕm
with the coefficients of variations egωf = 22 and ωm = 19
and with the probability cut-offs eg 65 and 75
cf prime
Only this will render reliability assessment meaningful
L
p
q
Hidden size effect factor
d
1 2
1 1 2
105 16Max(14 12 16 )
075 to 1
CodeNTrueN
C d CC d C d C
+= =
+=
σϕσ
Max( 12 161 )
105 16
4CodeNTrueN
D D LD L
σ
σ
= +
= +
Wrong Size Effect Hidden in Excessive Self Weight Factor
2
1
1
075
001 10 10000
Hidden inload factor
logφ
log( )s ize
Actual
SmallLarge
(d = size)Wrong for Flexural vs shear failure high-strength vs normal concrete prestressed vs normal concrete etc
Revised Reliability Indicesa) Cornell Index
2 2 2L R
L Rs sτ
micro microβ minus=
+
i
i
yii
yi
yy
smicro
τ
minusprime =
b) Hasofer-Lind Index
2
1min
n
ii
yβ=
prime= sumP f
0
1
chosenPf = 10-6
Gaussian
Weibullxf micro
Means=1ω= 0052m=24
TGTW
τ = TWTG
0
Linearizedfailure plane at design point(y1 y2) β
y2
y1
Safe regionRgtL
Failure regionLgtR
y1
y2
τi = 1 for loadge 1 for resistance
Neither FORM nor SORM but EVRM (extreme value RM)
Max(16 12 14 ) f mL D D F+ le ϕ ϕ ϕ
Max(16 12 14 )L D D F+ le ϕ
Safe Design CriterionCurrently
φ = strength reduction (understrength) factorintended to distinguish brittleness
φ = 075 for shear
Problem F is a fringe formula involvingCovert understrength factors
φf mdash for formula errorφm mdash for material strength randomness
Required Revision
φf asymp 065 φm asymp 083 for shear
F = load capacity by design formula
Size Effect in Punching Shear
II Size Effect in Punching Shear of RC Slabs
ACI-445C-Database for Punching of Slabs
440 Tests (60 researchers)d (effective depth of slabs) ranges from 118 in to 263 in (from 30 to 668 mm)fc (concrete strength) ranges from 1160 to 17114 psi (from 8 to 118 MPa)ρ (longit reinforcement ratio) ranges from 01 to 73
Formulae in Main Design Codes
Vc=total capacityb0=control perimeterb0E=control perimeter (EC)d =effective depthfc =concrete strengthξ =Size effect term in ECρ =reinforcement ratio (longitudinal)ψ =slab rotation term (MC)θ =size effect term in proposed model
Asymptotic slope -1 isimpossible
Database Filteringto reveal the size effect
trend without any calculations
Unfiltered
Filtered mean steel ratio
Filtered mean bd
Filtered mean cb
Database filtering(continued)
Mean steel ratios
Mean bd
Mean cb
Premise1) The tests relevant to size effect are limited and not scaled2) Microplane model M7 gives generally excellent fits of test data on concrete failures
Approachbull Calibrate M7 parameters by fitting existing
test data with limited size range and different structural geometries
bull Then use calibrated M7 to predict the size effect by simulating scaled specimens
Calibration of M7 by Multivariate Regression
of Test Data for Effect of Other Parameters
Tests by Elstner and Hognestad 1956 Tests by Lips et al 2012
Cross points hold for finite element analysis results (simulations of the experimental works)Circle points hold for the experimental resultsSolid lines refer to the size effect fit of the FEM results
Verification with microplane model M7 for slabs without shear reinforcement
Tests by Bazant and Cao 1987
Tests by Regan 1986
Tests by Guandalini and Muttoni 2009
Tests by Li 2000
Verification with microplane model for slabs with shear reinforcement
Load-Deflection curves of tests and corresponding FEMs
Notperfectlyscaledspecimens(1 16)
Finite element models and corresponding fracture patterns
Perfectly scaled FEM without and with shear reinforcement
Tests of Birkle
Tests of Lips et al
Test data of Birkle 2004 and fits by proposed size effect equaton
Proposed model and calibration by multivariate
regression
D = slab thickness c = side of column b = its perimeter
Data normalized by v0
Size Effect in Torsion
Type I
Bažant Z P and Sener S ldquoSize Effect in Torsional Failure of Concrete Beamsrdquo Journal of Structural Engineering V 113 No 10 1987 pp 2125-2136 90
II Size Effect in Torsional FailuresPlain concrete beams solid cross sections
Size effect plot (log-scale) Failure pattern
MODEL
AFTER TESTTests by Bazant Sener 1987
91
Size Effect on Torsional Failure
bull 3 sizes tested in lab d = 15rdquo 3rdquo 6rdquo)bull Size range extended using microplane model M7 to 113bull Type I failure ndash as soon as peak torque is reached
Scaled computed torque-twist curves
T T
max
Twist (deg)
Bažant Z P and Sener S ldquoSize Effect in Torsional Failure of Concrete Beamsrdquo Journal of Structural Engineering V 113 No 10 1987 pp 2125-2136
Plain concrete beams ndash reduced scale tests
Hsu T T C ldquoTorsion of Structural ConcretemdashPlain Concrete Rectangular Sectionsrdquo Torsion of Structural Concrete SP-18 American Concrete Institute Farmington Hills MI Jan 1968 pp 203-238 92
Torsional failures model validationPlain concrete beams tested by Hsu (1968)
10rdquox20rdquo
10rdquox15rdquo
10rdquox10rdquo
6rdquox195rdquo
6rdquox11rdquo
bull Effects of size (and shape) observed in tests bull Model predictions match tests very well ndash lends
confidence to the model
Hsu T T C ldquoTorsion of Structural ConcretemdashBehavior of Reinforced Concrete Rectangular Membersrdquo Torsion of Structural Concrete SP-18 Am Concrete Institute Farmington Hills MI
93
Torsion of RC Beams Model Validation
bull Note Strong effect of reinforcement ratiobull Predictions by calibrated model match tests very
well ndash lends confidence to the model
B1B1
B2 B3
B4B5
B6
94
Size effect in torsional failuressInterestingly is of Type 1 even with stirrups
Reinforced Concrete Beams (Hsu 1968)Without stirrups With stirrups
Size D [mm] ndash log scale
Kirane K Darun Singh and Bažant Z P ldquoSize Effect In The Torsional Strength Of Plain And Reinforced Concreterdquo submitted to ACI Structural J
Pure prediction - no test data
Nom
inal
str
engt
h v
u [M
Pa]
Test data by Hsu 1968
Size Effect on Columns Prestressed Beam Flexure
Composite Beams andOther Types of Failure
See Bazantrsquos website
Code Articles Requiring Size Effectbull shear of beams without
and with stirrupsbull torsion of beams bull punching of slabs bull shear of deep beams bull bar splices and
development length bull all failures due to
compression crushing of concrete as in-- columns -- prestressed beams -- arches -- bearing strength -- strut-and-tie models
bull failure of composite beams due to failure of connections
EFFECT OF STIRRUPSbull Stirrups can push the size effect up by an order of magnitude of Dl0 but cannot prevent itbull Increasing stirrup ratio in large beams is ineffective and can even reduce the shear strength
Slide Number 70
Slide Number 71
Slide Number 72
Slide Number 73
Failure of Sleipner A Platform
How to Remedy Misleading CovertUnderstrength Factors in Codes
Slide Number 76
Revised Reliability Indices
Slide Number 78
Slide Number 79
II Size Effect in Punching Shear of RC Slabs
Formulae in Main Design Codes
Database Filteringto reveal the size effect trend without any calculations
Slide Number 83
Slide Number 84
Calibration of M7 by Multivariate Regression of Test Data for Effect of Other Parameters
Slide Number 86
Slide Number 87
Proposed model and calibration by multivariate regression
Slide Number 89
Slide Number 90
Slide Number 91
Slide Number 92
Slide Number 93
Slide Number 94
Slide Number 95
Code Articles Requiring Size Effect
Slide Number 97
1
05
2
1
03 3
log dd0
0
nvv
0
01 =
+nvvd d
0
0
180 MPa247 m
==
vd
Size Effect in Beam Shear by Crack-Band Microplane Finite Element ModelSimulation of Toronto test
1
Compressionsplitting amp crushing
Fracture mechanics based finite elementsimulations support the size effect law
Structural Failures with Evidence of Size Effect
Schoharie Creek BridgeNY Thruway 1987
DV Swenson amp AR Ingraffea
Sleipner A Platform Norway
Sank 23 Aug 1991~ 82 m deep water~ 190 m tall
Failure of Sleipner A Platform
Water 67m head at failure
T19
T31
D3
Failure
Finite element model
Size Effect ft reduced by 40
wrong mesh
With post-processing- shear force 55 of actual
Wrong detail
Stirrups absent- not required by Code- would increase head to 125m
1905 Kangra India 357000 831906 San Francisco California USA 700 831908 Messina Italy 160000 751920 Gansu China 100000 861923 Sagami Bay Japan 200000 831976 Tangshan North East China 695000 791985 Mexico City Mexico 7000 811988 Armenia 45000 691989 San Francisco North California USA 67 711990 North West Iran 40000 771993 South West India 13000 641994 Northridge California USA 61 671995 Kobe Japan 5000 72
- Size effect due to compression fracture (in bending)
Cypress Viaduct (1989)Nimitz Freeway Oakland CA
Hinge
Crack Initiation at Hinge Location
Hinge
Cypress Structure Typical Bent with Hinged Frames
Hinge
Typical Failure Mode of Bent After Salvadori
Loma Prieta Earthquake
Schoharie Creek BridgeNY Thruway 1987
DV Swenson amp AR Ingraffea
Blvd de la Concorde Laval Quebec North suburb of Montreal Sept 30 2006
Shear FailuremdashSize effect was a major factor
Wilkins Air ForceDepot WarehouseShelby OhioFailed 1955
Beam Depth 0914 m
Koror-Babeldaob Bridge in PalauBuilt 1977 failed 1996 Max girder depth 14 m span 241 m (world record)
AA Yee ACI ConcrIntJune197922-23
Koror-Babeldaob Bridge in Palau Built 1977 failed 1996
Our Verdict Compression and shear failure with wave from prestress failure after creep amp vertical prestress loss Size effect must have been strong
Reappraisal of Some Structural CatastrophesSIZE EFFECT WAS AN IMPORTANT FACTOR
Strength ReductionPlain Concrete Due to Size Effect
bull Malpasset Dam France (failed 1959) 77bull St Francis Dam LA (failed 1928) 60bull plinth of Schoharie Creek Bridge 1987 46
Reappraisal of Some Structural Catastrophes SIZE EFFECT WAS AN IMPORTANT FACTOR
Strength Reduction Plain Concrete Due to Size Effect bullMalpasset Dam France (failed 1959) 77 bullSt Francis Dam LA (failed 1928) 60 bull plinth of Schoharie Creek Bridge 1987 46
Could we treat entire database as a statistical population Noexcept for the part of size range where size effect is weak
183 data points all satisfy the minimum shear reinforcement requirement
d lt 05 m
For d lt 05 m lognormal distribution is a better description for shear strength because of the scatter insulting from variability of secondary characteristics e g ρ ρ ad
Relation of Size Effect Test Result to pdf of Database
cr
c
fv
Toronto tests (1998-2000)
2 cc fv =
psi 5365 =crf
1
6
1 100
21
364 in
100
Entire database
1
6
10
Smallsize
Largesize
2 crc fv =
= required averagecompr strength
crf
(in) d
2 crc fv =
2 cc fv =
Portion of database for small size range
12 in
1
6
3 50
4 in
10Log-normal in log - scale
Small size
2750 cc fv times=
(in) d(in) d
70 crc ff asymp= specified
compressive strength
a
610minusasympfP
Shift of Resistance cdf Due to Size Increase
310minusasympfP
100
Shifted pdf for large beam
1
6
10
Smallsize Large
size
2 crc fv =
Meana
a
40
Failure probability
Load distribution
a
1
6
1 100
aMean
Expected resistance distribution
Mean2 cc fv =
2 crc fv =
cr
c
fv
Max Service Load
shiftΔ
Δ is due to micro φload factor and crc ff
Known resistance distribution
(in) d(in) d
intinfin
=
0 d)()( yyFyfP RLf
(No Stirrups)
GreatRisk
Do stirrups suppress the size effect
Size effect factor for beams with stirrups
011
ss dd+
=ϑ
(type 2 size effect)
00 10dds =
log d (m) log d (m)2
5
02 0802 115
19Bahl Kong amp Rangan
ad =30σs = 96 psi gt 50 psi
21
2
1
ad =24σs = 130 psi gt 50 psi
5
2
01 1log d (m)
log
v n(M
Pa)
21
Walraven ampLehwalter
Classical tests of geometrically similar RC beams made with the same concrete indicate that stirrups mitigate but do not eliminate the size effect
a) Deep beams b) Slender beams
ad =10
= 0
= 015
ρw= 033
Statistical Bias in Database
1) The data points are crowded in small size range2) In different size ranges the distributions of secondary influencing
parameters are not uniform
Two main causes of statistical bias
0 2 4 6 8 100
40
80
120
Num
ber o
f dat
a po
ints
d (m)
90 less than 06 m deepNo beam is deeper than 2 m
Practical interest
03 06 12
10
5
0 log d (m)
ρ w
03 06 12
10
5
0 log d (m)
ρ v
Uneven distribution of steel ratio of horizontal bars
Uneven distribution of steel ratio of shear reinforcementS
of individual data points (weight) ~ 1 (number of points in interval)
Weighted regression
in 670 33 == addain 670 33 == adda
10 100d
c
c
fv
6
10 100d
1
6
c
c
fv
ω = 223 ω = 236
2
Weighted regression
Unweighted regression
Centroid regression
Centroid regression
Unweighted regression
Size Effect Law Fitting Centroids of FilteredDatabase with Uniform
51=wρ 52=wρ
aw dda ρ
log (size)
identical identical
(purely statistical inference)
EFFECT OF STIRRUPS
bull Stirrups can push the size effect up by an order of magnitude of Dl0 but cannot prevent it
bull Increasing stirrup ratio in large beams is ineffective and caneven reduce the shear strength
Covert Safety Factors
OVERT understrength Factor
65 837covert u factors
83775
( 07 )c crf fasymp
Design load 16L+12D or 14D
Inverse scale
02 04 06 08 10 15 20 5 infin0
1
2
3
4
5
TorontoTest - No stirrups
Expected Mean plusmn SD
2 cf=
31c crv f=
183c crv f=
101c crv f=
Toronto testsd = 744 in (189 m) (from Bentzs memo to Bažant Oct17 2003)
X Parameter of Steel Ratio and Shear Span
c
cr
vf
Vc = shear strength contribution of concrete
Mean = 31 SD = 068
ACI 1962 Small-BeamDatabase
vc = Vcbwd
ACI formula
125c cv f=
2c crv f=Toronto Test - Min Stirrups ndash25
41
Overt and Covert Understrength Factors
PARADIGM - Shear Tests of Small Beams
Safety factor asymp 35
Max service load
Max(16 12 14 ) f mL D D F+ le ϕ ϕ ϕ
Max(16 12 14 )L D D F+ le ϕ
Safe Design CriterionCurrently
φ = strength reduction (understrength) factorintended to distinguish brittleness
φ = 075 for shear
Problem F is a fringe formula involvingCovert understrength factors
φf mdash for formula errorφm mdash for material strength randomness
Required Revision
φf asymp 065 φm asymp 083 for shear
F = load capacity by design formula
Obscuring Effect of Covert Understrength Factors on Forensic Evidence
Safety factor for shearSmall beam
Large beam (for size effect ratio = 2)
16 38 average075 083 065
= = =times times
ϕ- range from 23 to 7
14 17 average075 083 065 2
= = =times times times
ϕrange from 105 to 3
Why is the size effect rarely identified in analyzing disastersMore than one mistake is needed to bring down a structure
Failure of Sleipner A Platform
Water 67m head at failure
T19
T31
D3
Failure
Finite element model
Size Effect ft reduced by 40
wrong mesh
With post-processing- shear force 55 of actual
Wrong detail
Stirrups absent- not required by Code- would increase head to 125m
T-he
aded
bar
T-headed bars - if elongated 25cm- 125m head
Assumed failure mode
Kinked reinforcing bars
~ 095 m Spalled concrete
Deflection of wall
Spalled concreteCrack width
Posterior pmax ~ 08 - 12 papplied
How to Remedy Misleading CovertUnderstrength Factors in CodesOption 1
bullUse mean prediction formulas not fringe formulas
bullUse mean material strength not reduced strength
bull In addition to the current understrength factor ϕ = ϕb accounting for brittleness impose understrength factors minus ϕf for error of formulaminus ϕm for material strength randomness and specify their CoVrsquos ω
For shear ϕb = 075 ϕf = 065 ϕm =083
( ) c crf f primeorcf prime
Option 2bullKeep the current fringe formulas
bullKeep the reduced strength
bullSpecify the implied understrength factors
ϕf and ϕm
with the coefficients of variations egωf = 22 and ωm = 19
and with the probability cut-offs eg 65 and 75
cf prime
Only this will render reliability assessment meaningful
L
p
q
Hidden size effect factor
d
1 2
1 1 2
105 16Max(14 12 16 )
075 to 1
CodeNTrueN
C d CC d C d C
+= =
+=
σϕσ
Max( 12 161 )
105 16
4CodeNTrueN
D D LD L
σ
σ
= +
= +
Wrong Size Effect Hidden in Excessive Self Weight Factor
2
1
1
075
001 10 10000
Hidden inload factor
logφ
log( )s ize
Actual
SmallLarge
(d = size)Wrong for Flexural vs shear failure high-strength vs normal concrete prestressed vs normal concrete etc
Revised Reliability Indicesa) Cornell Index
2 2 2L R
L Rs sτ
micro microβ minus=
+
i
i
yii
yi
yy
smicro
τ
minusprime =
b) Hasofer-Lind Index
2
1min
n
ii
yβ=
prime= sumP f
0
1
chosenPf = 10-6
Gaussian
Weibullxf micro
Means=1ω= 0052m=24
TGTW
τ = TWTG
0
Linearizedfailure plane at design point(y1 y2) β
y2
y1
Safe regionRgtL
Failure regionLgtR
y1
y2
τi = 1 for loadge 1 for resistance
Neither FORM nor SORM but EVRM (extreme value RM)
Max(16 12 14 ) f mL D D F+ le ϕ ϕ ϕ
Max(16 12 14 )L D D F+ le ϕ
Safe Design CriterionCurrently
φ = strength reduction (understrength) factorintended to distinguish brittleness
φ = 075 for shear
Problem F is a fringe formula involvingCovert understrength factors
φf mdash for formula errorφm mdash for material strength randomness
Required Revision
φf asymp 065 φm asymp 083 for shear
F = load capacity by design formula
Size Effect in Punching Shear
II Size Effect in Punching Shear of RC Slabs
ACI-445C-Database for Punching of Slabs
440 Tests (60 researchers)d (effective depth of slabs) ranges from 118 in to 263 in (from 30 to 668 mm)fc (concrete strength) ranges from 1160 to 17114 psi (from 8 to 118 MPa)ρ (longit reinforcement ratio) ranges from 01 to 73
Formulae in Main Design Codes
Vc=total capacityb0=control perimeterb0E=control perimeter (EC)d =effective depthfc =concrete strengthξ =Size effect term in ECρ =reinforcement ratio (longitudinal)ψ =slab rotation term (MC)θ =size effect term in proposed model
Asymptotic slope -1 isimpossible
Database Filteringto reveal the size effect
trend without any calculations
Unfiltered
Filtered mean steel ratio
Filtered mean bd
Filtered mean cb
Database filtering(continued)
Mean steel ratios
Mean bd
Mean cb
Premise1) The tests relevant to size effect are limited and not scaled2) Microplane model M7 gives generally excellent fits of test data on concrete failures
Approachbull Calibrate M7 parameters by fitting existing
test data with limited size range and different structural geometries
bull Then use calibrated M7 to predict the size effect by simulating scaled specimens
Calibration of M7 by Multivariate Regression
of Test Data for Effect of Other Parameters
Tests by Elstner and Hognestad 1956 Tests by Lips et al 2012
Cross points hold for finite element analysis results (simulations of the experimental works)Circle points hold for the experimental resultsSolid lines refer to the size effect fit of the FEM results
Verification with microplane model M7 for slabs without shear reinforcement
Tests by Bazant and Cao 1987
Tests by Regan 1986
Tests by Guandalini and Muttoni 2009
Tests by Li 2000
Verification with microplane model for slabs with shear reinforcement
Load-Deflection curves of tests and corresponding FEMs
Notperfectlyscaledspecimens(1 16)
Finite element models and corresponding fracture patterns
Perfectly scaled FEM without and with shear reinforcement
Tests of Birkle
Tests of Lips et al
Test data of Birkle 2004 and fits by proposed size effect equaton
Proposed model and calibration by multivariate
regression
D = slab thickness c = side of column b = its perimeter
Data normalized by v0
Size Effect in Torsion
Type I
Bažant Z P and Sener S ldquoSize Effect in Torsional Failure of Concrete Beamsrdquo Journal of Structural Engineering V 113 No 10 1987 pp 2125-2136 90
II Size Effect in Torsional FailuresPlain concrete beams solid cross sections
Size effect plot (log-scale) Failure pattern
MODEL
AFTER TESTTests by Bazant Sener 1987
91
Size Effect on Torsional Failure
bull 3 sizes tested in lab d = 15rdquo 3rdquo 6rdquo)bull Size range extended using microplane model M7 to 113bull Type I failure ndash as soon as peak torque is reached
Scaled computed torque-twist curves
T T
max
Twist (deg)
Bažant Z P and Sener S ldquoSize Effect in Torsional Failure of Concrete Beamsrdquo Journal of Structural Engineering V 113 No 10 1987 pp 2125-2136
Plain concrete beams ndash reduced scale tests
Hsu T T C ldquoTorsion of Structural ConcretemdashPlain Concrete Rectangular Sectionsrdquo Torsion of Structural Concrete SP-18 American Concrete Institute Farmington Hills MI Jan 1968 pp 203-238 92
Torsional failures model validationPlain concrete beams tested by Hsu (1968)
10rdquox20rdquo
10rdquox15rdquo
10rdquox10rdquo
6rdquox195rdquo
6rdquox11rdquo
bull Effects of size (and shape) observed in tests bull Model predictions match tests very well ndash lends
confidence to the model
Hsu T T C ldquoTorsion of Structural ConcretemdashBehavior of Reinforced Concrete Rectangular Membersrdquo Torsion of Structural Concrete SP-18 Am Concrete Institute Farmington Hills MI
93
Torsion of RC Beams Model Validation
bull Note Strong effect of reinforcement ratiobull Predictions by calibrated model match tests very
well ndash lends confidence to the model
B1B1
B2 B3
B4B5
B6
94
Size effect in torsional failuressInterestingly is of Type 1 even with stirrups
Reinforced Concrete Beams (Hsu 1968)Without stirrups With stirrups
Size D [mm] ndash log scale
Kirane K Darun Singh and Bažant Z P ldquoSize Effect In The Torsional Strength Of Plain And Reinforced Concreterdquo submitted to ACI Structural J
Pure prediction - no test data
Nom
inal
str
engt
h v
u [M
Pa]
Test data by Hsu 1968
Size Effect on Columns Prestressed Beam Flexure
Composite Beams andOther Types of Failure
See Bazantrsquos website
Code Articles Requiring Size Effectbull shear of beams without
and with stirrupsbull torsion of beams bull punching of slabs bull shear of deep beams bull bar splices and
development length bull all failures due to
compression crushing of concrete as in-- columns -- prestressed beams -- arches -- bearing strength -- strut-and-tie models
bull failure of composite beams due to failure of connections
EFFECT OF STIRRUPSbull Stirrups can push the size effect up by an order of magnitude of Dl0 but cannot prevent itbull Increasing stirrup ratio in large beams is ineffective and can even reduce the shear strength
Slide Number 70
Slide Number 71
Slide Number 72
Slide Number 73
Failure of Sleipner A Platform
How to Remedy Misleading CovertUnderstrength Factors in Codes
Slide Number 76
Revised Reliability Indices
Slide Number 78
Slide Number 79
II Size Effect in Punching Shear of RC Slabs
Formulae in Main Design Codes
Database Filteringto reveal the size effect trend without any calculations
Slide Number 83
Slide Number 84
Calibration of M7 by Multivariate Regression of Test Data for Effect of Other Parameters
Slide Number 86
Slide Number 87
Proposed model and calibration by multivariate regression
Slide Number 89
Slide Number 90
Slide Number 91
Slide Number 92
Slide Number 93
Slide Number 94
Slide Number 95
Code Articles Requiring Size Effect
Slide Number 97
Schoharie Creek BridgeNY Thruway 1987
DV Swenson amp AR Ingraffea
Sleipner A Platform Norway
Sank 23 Aug 1991~ 82 m deep water~ 190 m tall
Failure of Sleipner A Platform
Water 67m head at failure
T19
T31
D3
Failure
Finite element model
Size Effect ft reduced by 40
wrong mesh
With post-processing- shear force 55 of actual
Wrong detail
Stirrups absent- not required by Code- would increase head to 125m
1905 Kangra India 357000 831906 San Francisco California USA 700 831908 Messina Italy 160000 751920 Gansu China 100000 861923 Sagami Bay Japan 200000 831976 Tangshan North East China 695000 791985 Mexico City Mexico 7000 811988 Armenia 45000 691989 San Francisco North California USA 67 711990 North West Iran 40000 771993 South West India 13000 641994 Northridge California USA 61 671995 Kobe Japan 5000 72
- Size effect due to compression fracture (in bending)
Cypress Viaduct (1989)Nimitz Freeway Oakland CA
Hinge
Crack Initiation at Hinge Location
Hinge
Cypress Structure Typical Bent with Hinged Frames
Hinge
Typical Failure Mode of Bent After Salvadori
Loma Prieta Earthquake
Schoharie Creek BridgeNY Thruway 1987
DV Swenson amp AR Ingraffea
Blvd de la Concorde Laval Quebec North suburb of Montreal Sept 30 2006
Shear FailuremdashSize effect was a major factor
Wilkins Air ForceDepot WarehouseShelby OhioFailed 1955
Beam Depth 0914 m
Koror-Babeldaob Bridge in PalauBuilt 1977 failed 1996 Max girder depth 14 m span 241 m (world record)
AA Yee ACI ConcrIntJune197922-23
Koror-Babeldaob Bridge in Palau Built 1977 failed 1996
Our Verdict Compression and shear failure with wave from prestress failure after creep amp vertical prestress loss Size effect must have been strong
Reappraisal of Some Structural CatastrophesSIZE EFFECT WAS AN IMPORTANT FACTOR
Strength ReductionPlain Concrete Due to Size Effect
bull Malpasset Dam France (failed 1959) 77bull St Francis Dam LA (failed 1928) 60bull plinth of Schoharie Creek Bridge 1987 46
Reappraisal of Some Structural Catastrophes SIZE EFFECT WAS AN IMPORTANT FACTOR
Strength Reduction Plain Concrete Due to Size Effect bullMalpasset Dam France (failed 1959) 77 bullSt Francis Dam LA (failed 1928) 60 bull plinth of Schoharie Creek Bridge 1987 46
Could we treat entire database as a statistical population Noexcept for the part of size range where size effect is weak
183 data points all satisfy the minimum shear reinforcement requirement
d lt 05 m
For d lt 05 m lognormal distribution is a better description for shear strength because of the scatter insulting from variability of secondary characteristics e g ρ ρ ad
Relation of Size Effect Test Result to pdf of Database
cr
c
fv
Toronto tests (1998-2000)
2 cc fv =
psi 5365 =crf
1
6
1 100
21
364 in
100
Entire database
1
6
10
Smallsize
Largesize
2 crc fv =
= required averagecompr strength
crf
(in) d
2 crc fv =
2 cc fv =
Portion of database for small size range
12 in
1
6
3 50
4 in
10Log-normal in log - scale
Small size
2750 cc fv times=
(in) d(in) d
70 crc ff asymp= specified
compressive strength
a
610minusasympfP
Shift of Resistance cdf Due to Size Increase
310minusasympfP
100
Shifted pdf for large beam
1
6
10
Smallsize Large
size
2 crc fv =
Meana
a
40
Failure probability
Load distribution
a
1
6
1 100
aMean
Expected resistance distribution
Mean2 cc fv =
2 crc fv =
cr
c
fv
Max Service Load
shiftΔ
Δ is due to micro φload factor and crc ff
Known resistance distribution
(in) d(in) d
intinfin
=
0 d)()( yyFyfP RLf
(No Stirrups)
GreatRisk
Do stirrups suppress the size effect
Size effect factor for beams with stirrups
011
ss dd+
=ϑ
(type 2 size effect)
00 10dds =
log d (m) log d (m)2
5
02 0802 115
19Bahl Kong amp Rangan
ad =30σs = 96 psi gt 50 psi
21
2
1
ad =24σs = 130 psi gt 50 psi
5
2
01 1log d (m)
log
v n(M
Pa)
21
Walraven ampLehwalter
Classical tests of geometrically similar RC beams made with the same concrete indicate that stirrups mitigate but do not eliminate the size effect
a) Deep beams b) Slender beams
ad =10
= 0
= 015
ρw= 033
Statistical Bias in Database
1) The data points are crowded in small size range2) In different size ranges the distributions of secondary influencing
parameters are not uniform
Two main causes of statistical bias
0 2 4 6 8 100
40
80
120
Num
ber o
f dat
a po
ints
d (m)
90 less than 06 m deepNo beam is deeper than 2 m
Practical interest
03 06 12
10
5
0 log d (m)
ρ w
03 06 12
10
5
0 log d (m)
ρ v
Uneven distribution of steel ratio of horizontal bars
Uneven distribution of steel ratio of shear reinforcementS
of individual data points (weight) ~ 1 (number of points in interval)
Weighted regression
in 670 33 == addain 670 33 == adda
10 100d
c
c
fv
6
10 100d
1
6
c
c
fv
ω = 223 ω = 236
2
Weighted regression
Unweighted regression
Centroid regression
Centroid regression
Unweighted regression
Size Effect Law Fitting Centroids of FilteredDatabase with Uniform
51=wρ 52=wρ
aw dda ρ
log (size)
identical identical
(purely statistical inference)
EFFECT OF STIRRUPS
bull Stirrups can push the size effect up by an order of magnitude of Dl0 but cannot prevent it
bull Increasing stirrup ratio in large beams is ineffective and caneven reduce the shear strength
Covert Safety Factors
OVERT understrength Factor
65 837covert u factors
83775
( 07 )c crf fasymp
Design load 16L+12D or 14D
Inverse scale
02 04 06 08 10 15 20 5 infin0
1
2
3
4
5
TorontoTest - No stirrups
Expected Mean plusmn SD
2 cf=
31c crv f=
183c crv f=
101c crv f=
Toronto testsd = 744 in (189 m) (from Bentzs memo to Bažant Oct17 2003)
X Parameter of Steel Ratio and Shear Span
c
cr
vf
Vc = shear strength contribution of concrete
Mean = 31 SD = 068
ACI 1962 Small-BeamDatabase
vc = Vcbwd
ACI formula
125c cv f=
2c crv f=Toronto Test - Min Stirrups ndash25
41
Overt and Covert Understrength Factors
PARADIGM - Shear Tests of Small Beams
Safety factor asymp 35
Max service load
Max(16 12 14 ) f mL D D F+ le ϕ ϕ ϕ
Max(16 12 14 )L D D F+ le ϕ
Safe Design CriterionCurrently
φ = strength reduction (understrength) factorintended to distinguish brittleness
φ = 075 for shear
Problem F is a fringe formula involvingCovert understrength factors
φf mdash for formula errorφm mdash for material strength randomness
Required Revision
φf asymp 065 φm asymp 083 for shear
F = load capacity by design formula
Obscuring Effect of Covert Understrength Factors on Forensic Evidence
Safety factor for shearSmall beam
Large beam (for size effect ratio = 2)
16 38 average075 083 065
= = =times times
ϕ- range from 23 to 7
14 17 average075 083 065 2
= = =times times times
ϕrange from 105 to 3
Why is the size effect rarely identified in analyzing disastersMore than one mistake is needed to bring down a structure
Failure of Sleipner A Platform
Water 67m head at failure
T19
T31
D3
Failure
Finite element model
Size Effect ft reduced by 40
wrong mesh
With post-processing- shear force 55 of actual
Wrong detail
Stirrups absent- not required by Code- would increase head to 125m
T-he
aded
bar
T-headed bars - if elongated 25cm- 125m head
Assumed failure mode
Kinked reinforcing bars
~ 095 m Spalled concrete
Deflection of wall
Spalled concreteCrack width
Posterior pmax ~ 08 - 12 papplied
How to Remedy Misleading CovertUnderstrength Factors in CodesOption 1
bullUse mean prediction formulas not fringe formulas
bullUse mean material strength not reduced strength
bull In addition to the current understrength factor ϕ = ϕb accounting for brittleness impose understrength factors minus ϕf for error of formulaminus ϕm for material strength randomness and specify their CoVrsquos ω
For shear ϕb = 075 ϕf = 065 ϕm =083
( ) c crf f primeorcf prime
Option 2bullKeep the current fringe formulas
bullKeep the reduced strength
bullSpecify the implied understrength factors
ϕf and ϕm
with the coefficients of variations egωf = 22 and ωm = 19
and with the probability cut-offs eg 65 and 75
cf prime
Only this will render reliability assessment meaningful
L
p
q
Hidden size effect factor
d
1 2
1 1 2
105 16Max(14 12 16 )
075 to 1
CodeNTrueN
C d CC d C d C
+= =
+=
σϕσ
Max( 12 161 )
105 16
4CodeNTrueN
D D LD L
σ
σ
= +
= +
Wrong Size Effect Hidden in Excessive Self Weight Factor
2
1
1
075
001 10 10000
Hidden inload factor
logφ
log( )s ize
Actual
SmallLarge
(d = size)Wrong for Flexural vs shear failure high-strength vs normal concrete prestressed vs normal concrete etc
Revised Reliability Indicesa) Cornell Index
2 2 2L R
L Rs sτ
micro microβ minus=
+
i
i
yii
yi
yy
smicro
τ
minusprime =
b) Hasofer-Lind Index
2
1min
n
ii
yβ=
prime= sumP f
0
1
chosenPf = 10-6
Gaussian
Weibullxf micro
Means=1ω= 0052m=24
TGTW
τ = TWTG
0
Linearizedfailure plane at design point(y1 y2) β
y2
y1
Safe regionRgtL
Failure regionLgtR
y1
y2
τi = 1 for loadge 1 for resistance
Neither FORM nor SORM but EVRM (extreme value RM)
Max(16 12 14 ) f mL D D F+ le ϕ ϕ ϕ
Max(16 12 14 )L D D F+ le ϕ
Safe Design CriterionCurrently
φ = strength reduction (understrength) factorintended to distinguish brittleness
φ = 075 for shear
Problem F is a fringe formula involvingCovert understrength factors
φf mdash for formula errorφm mdash for material strength randomness
Required Revision
φf asymp 065 φm asymp 083 for shear
F = load capacity by design formula
Size Effect in Punching Shear
II Size Effect in Punching Shear of RC Slabs
ACI-445C-Database for Punching of Slabs
440 Tests (60 researchers)d (effective depth of slabs) ranges from 118 in to 263 in (from 30 to 668 mm)fc (concrete strength) ranges from 1160 to 17114 psi (from 8 to 118 MPa)ρ (longit reinforcement ratio) ranges from 01 to 73
Formulae in Main Design Codes
Vc=total capacityb0=control perimeterb0E=control perimeter (EC)d =effective depthfc =concrete strengthξ =Size effect term in ECρ =reinforcement ratio (longitudinal)ψ =slab rotation term (MC)θ =size effect term in proposed model
Asymptotic slope -1 isimpossible
Database Filteringto reveal the size effect
trend without any calculations
Unfiltered
Filtered mean steel ratio
Filtered mean bd
Filtered mean cb
Database filtering(continued)
Mean steel ratios
Mean bd
Mean cb
Premise1) The tests relevant to size effect are limited and not scaled2) Microplane model M7 gives generally excellent fits of test data on concrete failures
Approachbull Calibrate M7 parameters by fitting existing
test data with limited size range and different structural geometries
bull Then use calibrated M7 to predict the size effect by simulating scaled specimens
Calibration of M7 by Multivariate Regression
of Test Data for Effect of Other Parameters
Tests by Elstner and Hognestad 1956 Tests by Lips et al 2012
Cross points hold for finite element analysis results (simulations of the experimental works)Circle points hold for the experimental resultsSolid lines refer to the size effect fit of the FEM results
Verification with microplane model M7 for slabs without shear reinforcement
Tests by Bazant and Cao 1987
Tests by Regan 1986
Tests by Guandalini and Muttoni 2009
Tests by Li 2000
Verification with microplane model for slabs with shear reinforcement
Load-Deflection curves of tests and corresponding FEMs
Notperfectlyscaledspecimens(1 16)
Finite element models and corresponding fracture patterns
Perfectly scaled FEM without and with shear reinforcement
Tests of Birkle
Tests of Lips et al
Test data of Birkle 2004 and fits by proposed size effect equaton
Proposed model and calibration by multivariate
regression
D = slab thickness c = side of column b = its perimeter
Data normalized by v0
Size Effect in Torsion
Type I
Bažant Z P and Sener S ldquoSize Effect in Torsional Failure of Concrete Beamsrdquo Journal of Structural Engineering V 113 No 10 1987 pp 2125-2136 90
II Size Effect in Torsional FailuresPlain concrete beams solid cross sections
Size effect plot (log-scale) Failure pattern
MODEL
AFTER TESTTests by Bazant Sener 1987
91
Size Effect on Torsional Failure
bull 3 sizes tested in lab d = 15rdquo 3rdquo 6rdquo)bull Size range extended using microplane model M7 to 113bull Type I failure ndash as soon as peak torque is reached
Scaled computed torque-twist curves
T T
max
Twist (deg)
Bažant Z P and Sener S ldquoSize Effect in Torsional Failure of Concrete Beamsrdquo Journal of Structural Engineering V 113 No 10 1987 pp 2125-2136
Plain concrete beams ndash reduced scale tests
Hsu T T C ldquoTorsion of Structural ConcretemdashPlain Concrete Rectangular Sectionsrdquo Torsion of Structural Concrete SP-18 American Concrete Institute Farmington Hills MI Jan 1968 pp 203-238 92
Torsional failures model validationPlain concrete beams tested by Hsu (1968)
10rdquox20rdquo
10rdquox15rdquo
10rdquox10rdquo
6rdquox195rdquo
6rdquox11rdquo
bull Effects of size (and shape) observed in tests bull Model predictions match tests very well ndash lends
confidence to the model
Hsu T T C ldquoTorsion of Structural ConcretemdashBehavior of Reinforced Concrete Rectangular Membersrdquo Torsion of Structural Concrete SP-18 Am Concrete Institute Farmington Hills MI
93
Torsion of RC Beams Model Validation
bull Note Strong effect of reinforcement ratiobull Predictions by calibrated model match tests very
well ndash lends confidence to the model
B1B1
B2 B3
B4B5
B6
94
Size effect in torsional failuressInterestingly is of Type 1 even with stirrups
Reinforced Concrete Beams (Hsu 1968)Without stirrups With stirrups
Size D [mm] ndash log scale
Kirane K Darun Singh and Bažant Z P ldquoSize Effect In The Torsional Strength Of Plain And Reinforced Concreterdquo submitted to ACI Structural J
Pure prediction - no test data
Nom
inal
str
engt
h v
u [M
Pa]
Test data by Hsu 1968
Size Effect on Columns Prestressed Beam Flexure
Composite Beams andOther Types of Failure
See Bazantrsquos website
Code Articles Requiring Size Effectbull shear of beams without
and with stirrupsbull torsion of beams bull punching of slabs bull shear of deep beams bull bar splices and
development length bull all failures due to
compression crushing of concrete as in-- columns -- prestressed beams -- arches -- bearing strength -- strut-and-tie models
bull failure of composite beams due to failure of connections
EFFECT OF STIRRUPSbull Stirrups can push the size effect up by an order of magnitude of Dl0 but cannot prevent itbull Increasing stirrup ratio in large beams is ineffective and can even reduce the shear strength
Slide Number 70
Slide Number 71
Slide Number 72
Slide Number 73
Failure of Sleipner A Platform
How to Remedy Misleading CovertUnderstrength Factors in Codes
Slide Number 76
Revised Reliability Indices
Slide Number 78
Slide Number 79
II Size Effect in Punching Shear of RC Slabs
Formulae in Main Design Codes
Database Filteringto reveal the size effect trend without any calculations
Slide Number 83
Slide Number 84
Calibration of M7 by Multivariate Regression of Test Data for Effect of Other Parameters
Slide Number 86
Slide Number 87
Proposed model and calibration by multivariate regression
Slide Number 89
Slide Number 90
Slide Number 91
Slide Number 92
Slide Number 93
Slide Number 94
Slide Number 95
Code Articles Requiring Size Effect
Slide Number 97
Failure of Sleipner A Platform
Water 67m head at failure
T19
T31
D3
Failure
Finite element model
Size Effect ft reduced by 40
wrong mesh
With post-processing- shear force 55 of actual
Wrong detail
Stirrups absent- not required by Code- would increase head to 125m
1905 Kangra India 357000 831906 San Francisco California USA 700 831908 Messina Italy 160000 751920 Gansu China 100000 861923 Sagami Bay Japan 200000 831976 Tangshan North East China 695000 791985 Mexico City Mexico 7000 811988 Armenia 45000 691989 San Francisco North California USA 67 711990 North West Iran 40000 771993 South West India 13000 641994 Northridge California USA 61 671995 Kobe Japan 5000 72
- Size effect due to compression fracture (in bending)
Cypress Viaduct (1989)Nimitz Freeway Oakland CA
Hinge
Crack Initiation at Hinge Location
Hinge
Cypress Structure Typical Bent with Hinged Frames
Hinge
Typical Failure Mode of Bent After Salvadori
Loma Prieta Earthquake
Schoharie Creek BridgeNY Thruway 1987
DV Swenson amp AR Ingraffea
Blvd de la Concorde Laval Quebec North suburb of Montreal Sept 30 2006
Shear FailuremdashSize effect was a major factor
Wilkins Air ForceDepot WarehouseShelby OhioFailed 1955
Beam Depth 0914 m
Koror-Babeldaob Bridge in PalauBuilt 1977 failed 1996 Max girder depth 14 m span 241 m (world record)
AA Yee ACI ConcrIntJune197922-23
Koror-Babeldaob Bridge in Palau Built 1977 failed 1996
Our Verdict Compression and shear failure with wave from prestress failure after creep amp vertical prestress loss Size effect must have been strong
Reappraisal of Some Structural CatastrophesSIZE EFFECT WAS AN IMPORTANT FACTOR
Strength ReductionPlain Concrete Due to Size Effect
bull Malpasset Dam France (failed 1959) 77bull St Francis Dam LA (failed 1928) 60bull plinth of Schoharie Creek Bridge 1987 46
Reappraisal of Some Structural Catastrophes SIZE EFFECT WAS AN IMPORTANT FACTOR
Strength Reduction Plain Concrete Due to Size Effect bullMalpasset Dam France (failed 1959) 77 bullSt Francis Dam LA (failed 1928) 60 bull plinth of Schoharie Creek Bridge 1987 46
Could we treat entire database as a statistical population Noexcept for the part of size range where size effect is weak
183 data points all satisfy the minimum shear reinforcement requirement
d lt 05 m
For d lt 05 m lognormal distribution is a better description for shear strength because of the scatter insulting from variability of secondary characteristics e g ρ ρ ad
Relation of Size Effect Test Result to pdf of Database
cr
c
fv
Toronto tests (1998-2000)
2 cc fv =
psi 5365 =crf
1
6
1 100
21
364 in
100
Entire database
1
6
10
Smallsize
Largesize
2 crc fv =
= required averagecompr strength
crf
(in) d
2 crc fv =
2 cc fv =
Portion of database for small size range
12 in
1
6
3 50
4 in
10Log-normal in log - scale
Small size
2750 cc fv times=
(in) d(in) d
70 crc ff asymp= specified
compressive strength
a
610minusasympfP
Shift of Resistance cdf Due to Size Increase
310minusasympfP
100
Shifted pdf for large beam
1
6
10
Smallsize Large
size
2 crc fv =
Meana
a
40
Failure probability
Load distribution
a
1
6
1 100
aMean
Expected resistance distribution
Mean2 cc fv =
2 crc fv =
cr
c
fv
Max Service Load
shiftΔ
Δ is due to micro φload factor and crc ff
Known resistance distribution
(in) d(in) d
intinfin
=
0 d)()( yyFyfP RLf
(No Stirrups)
GreatRisk
Do stirrups suppress the size effect
Size effect factor for beams with stirrups
011
ss dd+
=ϑ
(type 2 size effect)
00 10dds =
log d (m) log d (m)2
5
02 0802 115
19Bahl Kong amp Rangan
ad =30σs = 96 psi gt 50 psi
21
2
1
ad =24σs = 130 psi gt 50 psi
5
2
01 1log d (m)
log
v n(M
Pa)
21
Walraven ampLehwalter
Classical tests of geometrically similar RC beams made with the same concrete indicate that stirrups mitigate but do not eliminate the size effect
a) Deep beams b) Slender beams
ad =10
= 0
= 015
ρw= 033
Statistical Bias in Database
1) The data points are crowded in small size range2) In different size ranges the distributions of secondary influencing
parameters are not uniform
Two main causes of statistical bias
0 2 4 6 8 100
40
80
120
Num
ber o
f dat
a po
ints
d (m)
90 less than 06 m deepNo beam is deeper than 2 m
Practical interest
03 06 12
10
5
0 log d (m)
ρ w
03 06 12
10
5
0 log d (m)
ρ v
Uneven distribution of steel ratio of horizontal bars
Uneven distribution of steel ratio of shear reinforcementS
of individual data points (weight) ~ 1 (number of points in interval)
Weighted regression
in 670 33 == addain 670 33 == adda
10 100d
c
c
fv
6
10 100d
1
6
c
c
fv
ω = 223 ω = 236
2
Weighted regression
Unweighted regression
Centroid regression
Centroid regression
Unweighted regression
Size Effect Law Fitting Centroids of FilteredDatabase with Uniform
51=wρ 52=wρ
aw dda ρ
log (size)
identical identical
(purely statistical inference)
EFFECT OF STIRRUPS
bull Stirrups can push the size effect up by an order of magnitude of Dl0 but cannot prevent it
bull Increasing stirrup ratio in large beams is ineffective and caneven reduce the shear strength
Covert Safety Factors
OVERT understrength Factor
65 837covert u factors
83775
( 07 )c crf fasymp
Design load 16L+12D or 14D
Inverse scale
02 04 06 08 10 15 20 5 infin0
1
2
3
4
5
TorontoTest - No stirrups
Expected Mean plusmn SD
2 cf=
31c crv f=
183c crv f=
101c crv f=
Toronto testsd = 744 in (189 m) (from Bentzs memo to Bažant Oct17 2003)
X Parameter of Steel Ratio and Shear Span
c
cr
vf
Vc = shear strength contribution of concrete
Mean = 31 SD = 068
ACI 1962 Small-BeamDatabase
vc = Vcbwd
ACI formula
125c cv f=
2c crv f=Toronto Test - Min Stirrups ndash25
41
Overt and Covert Understrength Factors
PARADIGM - Shear Tests of Small Beams
Safety factor asymp 35
Max service load
Max(16 12 14 ) f mL D D F+ le ϕ ϕ ϕ
Max(16 12 14 )L D D F+ le ϕ
Safe Design CriterionCurrently
φ = strength reduction (understrength) factorintended to distinguish brittleness
φ = 075 for shear
Problem F is a fringe formula involvingCovert understrength factors
φf mdash for formula errorφm mdash for material strength randomness
Required Revision
φf asymp 065 φm asymp 083 for shear
F = load capacity by design formula
Obscuring Effect of Covert Understrength Factors on Forensic Evidence
Safety factor for shearSmall beam
Large beam (for size effect ratio = 2)
16 38 average075 083 065
= = =times times
ϕ- range from 23 to 7
14 17 average075 083 065 2
= = =times times times
ϕrange from 105 to 3
Why is the size effect rarely identified in analyzing disastersMore than one mistake is needed to bring down a structure
Failure of Sleipner A Platform
Water 67m head at failure
T19
T31
D3
Failure
Finite element model
Size Effect ft reduced by 40
wrong mesh
With post-processing- shear force 55 of actual
Wrong detail
Stirrups absent- not required by Code- would increase head to 125m
T-he
aded
bar
T-headed bars - if elongated 25cm- 125m head
Assumed failure mode
Kinked reinforcing bars
~ 095 m Spalled concrete
Deflection of wall
Spalled concreteCrack width
Posterior pmax ~ 08 - 12 papplied
How to Remedy Misleading CovertUnderstrength Factors in CodesOption 1
bullUse mean prediction formulas not fringe formulas
bullUse mean material strength not reduced strength
bull In addition to the current understrength factor ϕ = ϕb accounting for brittleness impose understrength factors minus ϕf for error of formulaminus ϕm for material strength randomness and specify their CoVrsquos ω
For shear ϕb = 075 ϕf = 065 ϕm =083
( ) c crf f primeorcf prime
Option 2bullKeep the current fringe formulas
bullKeep the reduced strength
bullSpecify the implied understrength factors
ϕf and ϕm
with the coefficients of variations egωf = 22 and ωm = 19
and with the probability cut-offs eg 65 and 75
cf prime
Only this will render reliability assessment meaningful
L
p
q
Hidden size effect factor
d
1 2
1 1 2
105 16Max(14 12 16 )
075 to 1
CodeNTrueN
C d CC d C d C
+= =
+=
σϕσ
Max( 12 161 )
105 16
4CodeNTrueN
D D LD L
σ
σ
= +
= +
Wrong Size Effect Hidden in Excessive Self Weight Factor
2
1
1
075
001 10 10000
Hidden inload factor
logφ
log( )s ize
Actual
SmallLarge
(d = size)Wrong for Flexural vs shear failure high-strength vs normal concrete prestressed vs normal concrete etc
Revised Reliability Indicesa) Cornell Index
2 2 2L R
L Rs sτ
micro microβ minus=
+
i
i
yii
yi
yy
smicro
τ
minusprime =
b) Hasofer-Lind Index
2
1min
n
ii
yβ=
prime= sumP f
0
1
chosenPf = 10-6
Gaussian
Weibullxf micro
Means=1ω= 0052m=24
TGTW
τ = TWTG
0
Linearizedfailure plane at design point(y1 y2) β
y2
y1
Safe regionRgtL
Failure regionLgtR
y1
y2
τi = 1 for loadge 1 for resistance
Neither FORM nor SORM but EVRM (extreme value RM)
Max(16 12 14 ) f mL D D F+ le ϕ ϕ ϕ
Max(16 12 14 )L D D F+ le ϕ
Safe Design CriterionCurrently
φ = strength reduction (understrength) factorintended to distinguish brittleness
φ = 075 for shear
Problem F is a fringe formula involvingCovert understrength factors
φf mdash for formula errorφm mdash for material strength randomness
Required Revision
φf asymp 065 φm asymp 083 for shear
F = load capacity by design formula
Size Effect in Punching Shear
II Size Effect in Punching Shear of RC Slabs
ACI-445C-Database for Punching of Slabs
440 Tests (60 researchers)d (effective depth of slabs) ranges from 118 in to 263 in (from 30 to 668 mm)fc (concrete strength) ranges from 1160 to 17114 psi (from 8 to 118 MPa)ρ (longit reinforcement ratio) ranges from 01 to 73
Formulae in Main Design Codes
Vc=total capacityb0=control perimeterb0E=control perimeter (EC)d =effective depthfc =concrete strengthξ =Size effect term in ECρ =reinforcement ratio (longitudinal)ψ =slab rotation term (MC)θ =size effect term in proposed model
Asymptotic slope -1 isimpossible
Database Filteringto reveal the size effect
trend without any calculations
Unfiltered
Filtered mean steel ratio
Filtered mean bd
Filtered mean cb
Database filtering(continued)
Mean steel ratios
Mean bd
Mean cb
Premise1) The tests relevant to size effect are limited and not scaled2) Microplane model M7 gives generally excellent fits of test data on concrete failures
Approachbull Calibrate M7 parameters by fitting existing
test data with limited size range and different structural geometries
bull Then use calibrated M7 to predict the size effect by simulating scaled specimens
Calibration of M7 by Multivariate Regression
of Test Data for Effect of Other Parameters
Tests by Elstner and Hognestad 1956 Tests by Lips et al 2012
Cross points hold for finite element analysis results (simulations of the experimental works)Circle points hold for the experimental resultsSolid lines refer to the size effect fit of the FEM results
Verification with microplane model M7 for slabs without shear reinforcement
Tests by Bazant and Cao 1987
Tests by Regan 1986
Tests by Guandalini and Muttoni 2009
Tests by Li 2000
Verification with microplane model for slabs with shear reinforcement
Load-Deflection curves of tests and corresponding FEMs
Notperfectlyscaledspecimens(1 16)
Finite element models and corresponding fracture patterns
Perfectly scaled FEM without and with shear reinforcement
Tests of Birkle
Tests of Lips et al
Test data of Birkle 2004 and fits by proposed size effect equaton
Proposed model and calibration by multivariate
regression
D = slab thickness c = side of column b = its perimeter
Data normalized by v0
Size Effect in Torsion
Type I
Bažant Z P and Sener S ldquoSize Effect in Torsional Failure of Concrete Beamsrdquo Journal of Structural Engineering V 113 No 10 1987 pp 2125-2136 90
II Size Effect in Torsional FailuresPlain concrete beams solid cross sections
Size effect plot (log-scale) Failure pattern
MODEL
AFTER TESTTests by Bazant Sener 1987
91
Size Effect on Torsional Failure
bull 3 sizes tested in lab d = 15rdquo 3rdquo 6rdquo)bull Size range extended using microplane model M7 to 113bull Type I failure ndash as soon as peak torque is reached
Scaled computed torque-twist curves
T T
max
Twist (deg)
Bažant Z P and Sener S ldquoSize Effect in Torsional Failure of Concrete Beamsrdquo Journal of Structural Engineering V 113 No 10 1987 pp 2125-2136
Plain concrete beams ndash reduced scale tests
Hsu T T C ldquoTorsion of Structural ConcretemdashPlain Concrete Rectangular Sectionsrdquo Torsion of Structural Concrete SP-18 American Concrete Institute Farmington Hills MI Jan 1968 pp 203-238 92
Torsional failures model validationPlain concrete beams tested by Hsu (1968)
10rdquox20rdquo
10rdquox15rdquo
10rdquox10rdquo
6rdquox195rdquo
6rdquox11rdquo
bull Effects of size (and shape) observed in tests bull Model predictions match tests very well ndash lends
confidence to the model
Hsu T T C ldquoTorsion of Structural ConcretemdashBehavior of Reinforced Concrete Rectangular Membersrdquo Torsion of Structural Concrete SP-18 Am Concrete Institute Farmington Hills MI
93
Torsion of RC Beams Model Validation
bull Note Strong effect of reinforcement ratiobull Predictions by calibrated model match tests very
well ndash lends confidence to the model
B1B1
B2 B3
B4B5
B6
94
Size effect in torsional failuressInterestingly is of Type 1 even with stirrups
Reinforced Concrete Beams (Hsu 1968)Without stirrups With stirrups
Size D [mm] ndash log scale
Kirane K Darun Singh and Bažant Z P ldquoSize Effect In The Torsional Strength Of Plain And Reinforced Concreterdquo submitted to ACI Structural J
Pure prediction - no test data
Nom
inal
str
engt
h v
u [M
Pa]
Test data by Hsu 1968
Size Effect on Columns Prestressed Beam Flexure
Composite Beams andOther Types of Failure
See Bazantrsquos website
Code Articles Requiring Size Effectbull shear of beams without
and with stirrupsbull torsion of beams bull punching of slabs bull shear of deep beams bull bar splices and
development length bull all failures due to
compression crushing of concrete as in-- columns -- prestressed beams -- arches -- bearing strength -- strut-and-tie models
bull failure of composite beams due to failure of connections
EFFECT OF STIRRUPSbull Stirrups can push the size effect up by an order of magnitude of Dl0 but cannot prevent itbull Increasing stirrup ratio in large beams is ineffective and can even reduce the shear strength
Slide Number 70
Slide Number 71
Slide Number 72
Slide Number 73
Failure of Sleipner A Platform
How to Remedy Misleading CovertUnderstrength Factors in Codes
Slide Number 76
Revised Reliability Indices
Slide Number 78
Slide Number 79
II Size Effect in Punching Shear of RC Slabs
Formulae in Main Design Codes
Database Filteringto reveal the size effect trend without any calculations
Slide Number 83
Slide Number 84
Calibration of M7 by Multivariate Regression of Test Data for Effect of Other Parameters
Slide Number 86
Slide Number 87
Proposed model and calibration by multivariate regression
Slide Number 89
Slide Number 90
Slide Number 91
Slide Number 92
Slide Number 93
Slide Number 94
Slide Number 95
Code Articles Requiring Size Effect
Slide Number 97
Kobe Earthquake 1995 Hanshin Viaduct
The centurys worst quakesVictims Richter scale
1905 Kangra India 357000 831906 San Francisco California USA 700 831908 Messina Italy 160000 751920 Gansu China 100000 861923 Sagami Bay Japan 200000 831976 Tangshan North East China 695000 791985 Mexico City Mexico 7000 811988 Armenia 45000 691989 San Francisco North California USA 67 711990 North West Iran 40000 771993 South West India 13000 641994 Northridge California USA 61 671995 Kobe Japan 5000 72
- Size effect due to compression fracture (in bending)
Cypress Viaduct (1989)Nimitz Freeway Oakland CA
Hinge
Crack Initiation at Hinge Location
Hinge
Cypress Structure Typical Bent with Hinged Frames
Hinge
Typical Failure Mode of Bent After Salvadori
Loma Prieta Earthquake
Schoharie Creek BridgeNY Thruway 1987
DV Swenson amp AR Ingraffea
Blvd de la Concorde Laval Quebec North suburb of Montreal Sept 30 2006
Shear FailuremdashSize effect was a major factor
Wilkins Air ForceDepot WarehouseShelby OhioFailed 1955
Beam Depth 0914 m
Koror-Babeldaob Bridge in PalauBuilt 1977 failed 1996 Max girder depth 14 m span 241 m (world record)
AA Yee ACI ConcrIntJune197922-23
Koror-Babeldaob Bridge in Palau Built 1977 failed 1996
Our Verdict Compression and shear failure with wave from prestress failure after creep amp vertical prestress loss Size effect must have been strong
Reappraisal of Some Structural CatastrophesSIZE EFFECT WAS AN IMPORTANT FACTOR
Strength ReductionPlain Concrete Due to Size Effect
bull Malpasset Dam France (failed 1959) 77bull St Francis Dam LA (failed 1928) 60bull plinth of Schoharie Creek Bridge 1987 46
Reappraisal of Some Structural Catastrophes SIZE EFFECT WAS AN IMPORTANT FACTOR
Strength Reduction Plain Concrete Due to Size Effect bullMalpasset Dam France (failed 1959) 77 bullSt Francis Dam LA (failed 1928) 60 bull plinth of Schoharie Creek Bridge 1987 46
Could we treat entire database as a statistical population Noexcept for the part of size range where size effect is weak
183 data points all satisfy the minimum shear reinforcement requirement
d lt 05 m
For d lt 05 m lognormal distribution is a better description for shear strength because of the scatter insulting from variability of secondary characteristics e g ρ ρ ad
Relation of Size Effect Test Result to pdf of Database
cr
c
fv
Toronto tests (1998-2000)
2 cc fv =
psi 5365 =crf
1
6
1 100
21
364 in
100
Entire database
1
6
10
Smallsize
Largesize
2 crc fv =
= required averagecompr strength
crf
(in) d
2 crc fv =
2 cc fv =
Portion of database for small size range
12 in
1
6
3 50
4 in
10Log-normal in log - scale
Small size
2750 cc fv times=
(in) d(in) d
70 crc ff asymp= specified
compressive strength
a
610minusasympfP
Shift of Resistance cdf Due to Size Increase
310minusasympfP
100
Shifted pdf for large beam
1
6
10
Smallsize Large
size
2 crc fv =
Meana
a
40
Failure probability
Load distribution
a
1
6
1 100
aMean
Expected resistance distribution
Mean2 cc fv =
2 crc fv =
cr
c
fv
Max Service Load
shiftΔ
Δ is due to micro φload factor and crc ff
Known resistance distribution
(in) d(in) d
intinfin
=
0 d)()( yyFyfP RLf
(No Stirrups)
GreatRisk
Do stirrups suppress the size effect
Size effect factor for beams with stirrups
011
ss dd+
=ϑ
(type 2 size effect)
00 10dds =
log d (m) log d (m)2
5
02 0802 115
19Bahl Kong amp Rangan
ad =30σs = 96 psi gt 50 psi
21
2
1
ad =24σs = 130 psi gt 50 psi
5
2
01 1log d (m)
log
v n(M
Pa)
21
Walraven ampLehwalter
Classical tests of geometrically similar RC beams made with the same concrete indicate that stirrups mitigate but do not eliminate the size effect
a) Deep beams b) Slender beams
ad =10
= 0
= 015
ρw= 033
Statistical Bias in Database
1) The data points are crowded in small size range2) In different size ranges the distributions of secondary influencing
parameters are not uniform
Two main causes of statistical bias
0 2 4 6 8 100
40
80
120
Num
ber o
f dat
a po
ints
d (m)
90 less than 06 m deepNo beam is deeper than 2 m
Practical interest
03 06 12
10
5
0 log d (m)
ρ w
03 06 12
10
5
0 log d (m)
ρ v
Uneven distribution of steel ratio of horizontal bars
Uneven distribution of steel ratio of shear reinforcementS
of individual data points (weight) ~ 1 (number of points in interval)
Weighted regression
in 670 33 == addain 670 33 == adda
10 100d
c
c
fv
6
10 100d
1
6
c
c
fv
ω = 223 ω = 236
2
Weighted regression
Unweighted regression
Centroid regression
Centroid regression
Unweighted regression
Size Effect Law Fitting Centroids of FilteredDatabase with Uniform
51=wρ 52=wρ
aw dda ρ
log (size)
identical identical
(purely statistical inference)
EFFECT OF STIRRUPS
bull Stirrups can push the size effect up by an order of magnitude of Dl0 but cannot prevent it
bull Increasing stirrup ratio in large beams is ineffective and caneven reduce the shear strength
Covert Safety Factors
OVERT understrength Factor
65 837covert u factors
83775
( 07 )c crf fasymp
Design load 16L+12D or 14D
Inverse scale
02 04 06 08 10 15 20 5 infin0
1
2
3
4
5
TorontoTest - No stirrups
Expected Mean plusmn SD
2 cf=
31c crv f=
183c crv f=
101c crv f=
Toronto testsd = 744 in (189 m) (from Bentzs memo to Bažant Oct17 2003)
X Parameter of Steel Ratio and Shear Span
c
cr
vf
Vc = shear strength contribution of concrete
Mean = 31 SD = 068
ACI 1962 Small-BeamDatabase
vc = Vcbwd
ACI formula
125c cv f=
2c crv f=Toronto Test - Min Stirrups ndash25
41
Overt and Covert Understrength Factors
PARADIGM - Shear Tests of Small Beams
Safety factor asymp 35
Max service load
Max(16 12 14 ) f mL D D F+ le ϕ ϕ ϕ
Max(16 12 14 )L D D F+ le ϕ
Safe Design CriterionCurrently
φ = strength reduction (understrength) factorintended to distinguish brittleness
φ = 075 for shear
Problem F is a fringe formula involvingCovert understrength factors
φf mdash for formula errorφm mdash for material strength randomness
Required Revision
φf asymp 065 φm asymp 083 for shear
F = load capacity by design formula
Obscuring Effect of Covert Understrength Factors on Forensic Evidence
Safety factor for shearSmall beam
Large beam (for size effect ratio = 2)
16 38 average075 083 065
= = =times times
ϕ- range from 23 to 7
14 17 average075 083 065 2
= = =times times times
ϕrange from 105 to 3
Why is the size effect rarely identified in analyzing disastersMore than one mistake is needed to bring down a structure
Failure of Sleipner A Platform
Water 67m head at failure
T19
T31
D3
Failure
Finite element model
Size Effect ft reduced by 40
wrong mesh
With post-processing- shear force 55 of actual
Wrong detail
Stirrups absent- not required by Code- would increase head to 125m
T-he
aded
bar
T-headed bars - if elongated 25cm- 125m head
Assumed failure mode
Kinked reinforcing bars
~ 095 m Spalled concrete
Deflection of wall
Spalled concreteCrack width
Posterior pmax ~ 08 - 12 papplied
How to Remedy Misleading CovertUnderstrength Factors in CodesOption 1
bullUse mean prediction formulas not fringe formulas
bullUse mean material strength not reduced strength
bull In addition to the current understrength factor ϕ = ϕb accounting for brittleness impose understrength factors minus ϕf for error of formulaminus ϕm for material strength randomness and specify their CoVrsquos ω
For shear ϕb = 075 ϕf = 065 ϕm =083
( ) c crf f primeorcf prime
Option 2bullKeep the current fringe formulas
bullKeep the reduced strength
bullSpecify the implied understrength factors
ϕf and ϕm
with the coefficients of variations egωf = 22 and ωm = 19
and with the probability cut-offs eg 65 and 75
cf prime
Only this will render reliability assessment meaningful
L
p
q
Hidden size effect factor
d
1 2
1 1 2
105 16Max(14 12 16 )
075 to 1
CodeNTrueN
C d CC d C d C
+= =
+=
σϕσ
Max( 12 161 )
105 16
4CodeNTrueN
D D LD L
σ
σ
= +
= +
Wrong Size Effect Hidden in Excessive Self Weight Factor
2
1
1
075
001 10 10000
Hidden inload factor
logφ
log( )s ize
Actual
SmallLarge
(d = size)Wrong for Flexural vs shear failure high-strength vs normal concrete prestressed vs normal concrete etc
Revised Reliability Indicesa) Cornell Index
2 2 2L R
L Rs sτ
micro microβ minus=
+
i
i
yii
yi
yy
smicro
τ
minusprime =
b) Hasofer-Lind Index
2
1min
n
ii
yβ=
prime= sumP f
0
1
chosenPf = 10-6
Gaussian
Weibullxf micro
Means=1ω= 0052m=24
TGTW
τ = TWTG
0
Linearizedfailure plane at design point(y1 y2) β
y2
y1
Safe regionRgtL
Failure regionLgtR
y1
y2
τi = 1 for loadge 1 for resistance
Neither FORM nor SORM but EVRM (extreme value RM)
Max(16 12 14 ) f mL D D F+ le ϕ ϕ ϕ
Max(16 12 14 )L D D F+ le ϕ
Safe Design CriterionCurrently
φ = strength reduction (understrength) factorintended to distinguish brittleness
φ = 075 for shear
Problem F is a fringe formula involvingCovert understrength factors
φf mdash for formula errorφm mdash for material strength randomness
Required Revision
φf asymp 065 φm asymp 083 for shear
F = load capacity by design formula
Size Effect in Punching Shear
II Size Effect in Punching Shear of RC Slabs
ACI-445C-Database for Punching of Slabs
440 Tests (60 researchers)d (effective depth of slabs) ranges from 118 in to 263 in (from 30 to 668 mm)fc (concrete strength) ranges from 1160 to 17114 psi (from 8 to 118 MPa)ρ (longit reinforcement ratio) ranges from 01 to 73
Formulae in Main Design Codes
Vc=total capacityb0=control perimeterb0E=control perimeter (EC)d =effective depthfc =concrete strengthξ =Size effect term in ECρ =reinforcement ratio (longitudinal)ψ =slab rotation term (MC)θ =size effect term in proposed model
Asymptotic slope -1 isimpossible
Database Filteringto reveal the size effect
trend without any calculations
Unfiltered
Filtered mean steel ratio
Filtered mean bd
Filtered mean cb
Database filtering(continued)
Mean steel ratios
Mean bd
Mean cb
Premise1) The tests relevant to size effect are limited and not scaled2) Microplane model M7 gives generally excellent fits of test data on concrete failures
Approachbull Calibrate M7 parameters by fitting existing
test data with limited size range and different structural geometries
bull Then use calibrated M7 to predict the size effect by simulating scaled specimens
Calibration of M7 by Multivariate Regression
of Test Data for Effect of Other Parameters
Tests by Elstner and Hognestad 1956 Tests by Lips et al 2012
Cross points hold for finite element analysis results (simulations of the experimental works)Circle points hold for the experimental resultsSolid lines refer to the size effect fit of the FEM results
Verification with microplane model M7 for slabs without shear reinforcement
Tests by Bazant and Cao 1987
Tests by Regan 1986
Tests by Guandalini and Muttoni 2009
Tests by Li 2000
Verification with microplane model for slabs with shear reinforcement
Load-Deflection curves of tests and corresponding FEMs
Notperfectlyscaledspecimens(1 16)
Finite element models and corresponding fracture patterns
Perfectly scaled FEM without and with shear reinforcement
Tests of Birkle
Tests of Lips et al
Test data of Birkle 2004 and fits by proposed size effect equaton
Proposed model and calibration by multivariate
regression
D = slab thickness c = side of column b = its perimeter
Data normalized by v0
Size Effect in Torsion
Type I
Bažant Z P and Sener S ldquoSize Effect in Torsional Failure of Concrete Beamsrdquo Journal of Structural Engineering V 113 No 10 1987 pp 2125-2136 90
II Size Effect in Torsional FailuresPlain concrete beams solid cross sections
Size effect plot (log-scale) Failure pattern
MODEL
AFTER TESTTests by Bazant Sener 1987
91
Size Effect on Torsional Failure
bull 3 sizes tested in lab d = 15rdquo 3rdquo 6rdquo)bull Size range extended using microplane model M7 to 113bull Type I failure ndash as soon as peak torque is reached
Scaled computed torque-twist curves
T T
max
Twist (deg)
Bažant Z P and Sener S ldquoSize Effect in Torsional Failure of Concrete Beamsrdquo Journal of Structural Engineering V 113 No 10 1987 pp 2125-2136
Plain concrete beams ndash reduced scale tests
Hsu T T C ldquoTorsion of Structural ConcretemdashPlain Concrete Rectangular Sectionsrdquo Torsion of Structural Concrete SP-18 American Concrete Institute Farmington Hills MI Jan 1968 pp 203-238 92
Torsional failures model validationPlain concrete beams tested by Hsu (1968)
10rdquox20rdquo
10rdquox15rdquo
10rdquox10rdquo
6rdquox195rdquo
6rdquox11rdquo
bull Effects of size (and shape) observed in tests bull Model predictions match tests very well ndash lends
confidence to the model
Hsu T T C ldquoTorsion of Structural ConcretemdashBehavior of Reinforced Concrete Rectangular Membersrdquo Torsion of Structural Concrete SP-18 Am Concrete Institute Farmington Hills MI
93
Torsion of RC Beams Model Validation
bull Note Strong effect of reinforcement ratiobull Predictions by calibrated model match tests very
well ndash lends confidence to the model
B1B1
B2 B3
B4B5
B6
94
Size effect in torsional failuressInterestingly is of Type 1 even with stirrups
Reinforced Concrete Beams (Hsu 1968)Without stirrups With stirrups
Size D [mm] ndash log scale
Kirane K Darun Singh and Bažant Z P ldquoSize Effect In The Torsional Strength Of Plain And Reinforced Concreterdquo submitted to ACI Structural J
Pure prediction - no test data
Nom
inal
str
engt
h v
u [M
Pa]
Test data by Hsu 1968
Size Effect on Columns Prestressed Beam Flexure
Composite Beams andOther Types of Failure
See Bazantrsquos website
Code Articles Requiring Size Effectbull shear of beams without
and with stirrupsbull torsion of beams bull punching of slabs bull shear of deep beams bull bar splices and
development length bull all failures due to
compression crushing of concrete as in-- columns -- prestressed beams -- arches -- bearing strength -- strut-and-tie models
bull failure of composite beams due to failure of connections
EFFECT OF STIRRUPSbull Stirrups can push the size effect up by an order of magnitude of Dl0 but cannot prevent itbull Increasing stirrup ratio in large beams is ineffective and can even reduce the shear strength
Slide Number 70
Slide Number 71
Slide Number 72
Slide Number 73
Failure of Sleipner A Platform
How to Remedy Misleading CovertUnderstrength Factors in Codes
Slide Number 76
Revised Reliability Indices
Slide Number 78
Slide Number 79
II Size Effect in Punching Shear of RC Slabs
Formulae in Main Design Codes
Database Filteringto reveal the size effect trend without any calculations
Slide Number 83
Slide Number 84
Calibration of M7 by Multivariate Regression of Test Data for Effect of Other Parameters
Slide Number 86
Slide Number 87
Proposed model and calibration by multivariate regression
Slide Number 89
Slide Number 90
Slide Number 91
Slide Number 92
Slide Number 93
Slide Number 94
Slide Number 95
Code Articles Requiring Size Effect
Slide Number 97
Evidence from Individual Laboratory Tests onthe Same Concrete
1
05
2
1
03 3log dd0
0
nvv
0
01 =
+nvvd d
0
0
180 MPa247 m
==
vd
Toronto test V
V
Compressionsplitting amp crushing
Stress Intensity Field
Evidence from Large Worldwide Laboratory
Database
101 10
01
1
001
Size (or depth) d [m]
log
[M
Pa]
14
121
1
ACI-445F Database with 784 points (biased by ad daggr varying with d )
13
Limit analysis
ACI-446 and present proposal
ρ
250 150500
200
100
0100 200
86 of data
Extrapolation (theory required)
Practical range for size effect
Beam Depth D (inches)
Numb
er of
Tests
Beam Shear Histogram
Stee
l rat
iowρ
002
0
004
006
da
Shea
r Spa
n ra
tio
2
0
4
6
8
6 96 in
008
fc ksi
4
0
8
12
16
20
Com
pres
sive S
treng
th
1
0
2
Maxim
um A
ggre
gate
da in
12 24 48 6 96 in12 24 48
6 96 in12 24 48 6 96 in12 24 48
Only 1 point
Only 1 point
Only 1 point
Only 1 point
Intervals of size (or depth) Δdt
Interval averages of w ad daggr vary over size rangeρ
Average longit steel ratio varies as 101
Restricting Strength Range of Data to Achieve Approximately the Same Means of ρw ad da in All Size Intervals
Could we treat entire database as a statistical population Noexcept for the part of size range where size effect is weak
183 data points all satisfy the minimum shear reinforcement requirement
d lt 05 m
For d lt 05 m lognormal distribution is a better description for shear strength because of the scatter insulting from variability of secondary characteristics e g ρ ρ ad
Relation of Size Effect Test Result to pdf of Database
cr
c
fv
Toronto tests (1998-2000)
2 cc fv =
psi 5365 =crf
1
6
1 100
21
364 in
100
Entire database
1
6
10
Smallsize
Largesize
2 crc fv =
= required averagecompr strength
crf
(in) d
2 crc fv =
2 cc fv =
Portion of database for small size range
12 in
1
6
3 50
4 in
10Log-normal in log - scale
Small size
2750 cc fv times=
(in) d(in) d
70 crc ff asymp= specified
compressive strength
a
610minusasympfP
Shift of Resistance cdf Due to Size Increase
310minusasympfP
100
Shifted pdf for large beam
1
6
10
Smallsize Large
size
2 crc fv =
Meana
a
40
Failure probability
Load distribution
a
1
6
1 100
aMean
Expected resistance distribution
Mean2 cc fv =
2 crc fv =
cr
c
fv
Max Service Load
shiftΔ
Δ is due to micro φload factor and crc ff
Known resistance distribution
(in) d(in) d
intinfin
=
0 d)()( yyFyfP RLf
(No Stirrups)
GreatRisk
Do stirrups suppress the size effect
Size effect factor for beams with stirrups
011
ss dd+
=ϑ
(type 2 size effect)
00 10dds =
log d (m) log d (m)2
5
02 0802 115
19Bahl Kong amp Rangan
ad =30σs = 96 psi gt 50 psi
21
2
1
ad =24σs = 130 psi gt 50 psi
5
2
01 1log d (m)
log
v n(M
Pa)
21
Walraven ampLehwalter
Classical tests of geometrically similar RC beams made with the same concrete indicate that stirrups mitigate but do not eliminate the size effect
a) Deep beams b) Slender beams
ad =10
= 0
= 015
ρw= 033
Statistical Bias in Database
1) The data points are crowded in small size range2) In different size ranges the distributions of secondary influencing
parameters are not uniform
Two main causes of statistical bias
0 2 4 6 8 100
40
80
120
Num
ber o
f dat
a po
ints
d (m)
90 less than 06 m deepNo beam is deeper than 2 m
Practical interest
03 06 12
10
5
0 log d (m)
ρ w
03 06 12
10
5
0 log d (m)
ρ v
Uneven distribution of steel ratio of horizontal bars
Uneven distribution of steel ratio of shear reinforcementS
of individual data points (weight) ~ 1 (number of points in interval)
Weighted regression
in 670 33 == addain 670 33 == adda
10 100d
c
c
fv
6
10 100d
1
6
c
c
fv
ω = 223 ω = 236
2
Weighted regression
Unweighted regression
Centroid regression
Centroid regression
Unweighted regression
Size Effect Law Fitting Centroids of FilteredDatabase with Uniform
51=wρ 52=wρ
aw dda ρ
log (size)
identical identical
(purely statistical inference)
EFFECT OF STIRRUPS
bull Stirrups can push the size effect up by an order of magnitude of Dl0 but cannot prevent it
bull Increasing stirrup ratio in large beams is ineffective and caneven reduce the shear strength
Covert Safety Factors
OVERT understrength Factor
65 837covert u factors
83775
( 07 )c crf fasymp
Design load 16L+12D or 14D
Inverse scale
02 04 06 08 10 15 20 5 infin0
1
2
3
4
5
TorontoTest - No stirrups
Expected Mean plusmn SD
2 cf=
31c crv f=
183c crv f=
101c crv f=
Toronto testsd = 744 in (189 m) (from Bentzs memo to Bažant Oct17 2003)
X Parameter of Steel Ratio and Shear Span
c
cr
vf
Vc = shear strength contribution of concrete
Mean = 31 SD = 068
ACI 1962 Small-BeamDatabase
vc = Vcbwd
ACI formula
125c cv f=
2c crv f=Toronto Test - Min Stirrups ndash25
41
Overt and Covert Understrength Factors
PARADIGM - Shear Tests of Small Beams
Safety factor asymp 35
Max service load
Max(16 12 14 ) f mL D D F+ le ϕ ϕ ϕ
Max(16 12 14 )L D D F+ le ϕ
Safe Design CriterionCurrently
φ = strength reduction (understrength) factorintended to distinguish brittleness
φ = 075 for shear
Problem F is a fringe formula involvingCovert understrength factors
φf mdash for formula errorφm mdash for material strength randomness
Required Revision
φf asymp 065 φm asymp 083 for shear
F = load capacity by design formula
Obscuring Effect of Covert Understrength Factors on Forensic Evidence
Safety factor for shearSmall beam
Large beam (for size effect ratio = 2)
16 38 average075 083 065
= = =times times
ϕ- range from 23 to 7
14 17 average075 083 065 2
= = =times times times
ϕrange from 105 to 3
Why is the size effect rarely identified in analyzing disastersMore than one mistake is needed to bring down a structure
Failure of Sleipner A Platform
Water 67m head at failure
T19
T31
D3
Failure
Finite element model
Size Effect ft reduced by 40
wrong mesh
With post-processing- shear force 55 of actual
Wrong detail
Stirrups absent- not required by Code- would increase head to 125m
T-he
aded
bar
T-headed bars - if elongated 25cm- 125m head
Assumed failure mode
Kinked reinforcing bars
~ 095 m Spalled concrete
Deflection of wall
Spalled concreteCrack width
Posterior pmax ~ 08 - 12 papplied
How to Remedy Misleading CovertUnderstrength Factors in CodesOption 1
bullUse mean prediction formulas not fringe formulas
bullUse mean material strength not reduced strength
bull In addition to the current understrength factor ϕ = ϕb accounting for brittleness impose understrength factors minus ϕf for error of formulaminus ϕm for material strength randomness and specify their CoVrsquos ω
For shear ϕb = 075 ϕf = 065 ϕm =083
( ) c crf f primeorcf prime
Option 2bullKeep the current fringe formulas
bullKeep the reduced strength
bullSpecify the implied understrength factors
ϕf and ϕm
with the coefficients of variations egωf = 22 and ωm = 19
and with the probability cut-offs eg 65 and 75
cf prime
Only this will render reliability assessment meaningful
L
p
q
Hidden size effect factor
d
1 2
1 1 2
105 16Max(14 12 16 )
075 to 1
CodeNTrueN
C d CC d C d C
+= =
+=
σϕσ
Max( 12 161 )
105 16
4CodeNTrueN
D D LD L
σ
σ
= +
= +
Wrong Size Effect Hidden in Excessive Self Weight Factor
2
1
1
075
001 10 10000
Hidden inload factor
logφ
log( )s ize
Actual
SmallLarge
(d = size)Wrong for Flexural vs shear failure high-strength vs normal concrete prestressed vs normal concrete etc
Revised Reliability Indicesa) Cornell Index
2 2 2L R
L Rs sτ
micro microβ minus=
+
i
i
yii
yi
yy
smicro
τ
minusprime =
b) Hasofer-Lind Index
2
1min
n
ii
yβ=
prime= sumP f
0
1
chosenPf = 10-6
Gaussian
Weibullxf micro
Means=1ω= 0052m=24
TGTW
τ = TWTG
0
Linearizedfailure plane at design point(y1 y2) β
y2
y1
Safe regionRgtL
Failure regionLgtR
y1
y2
τi = 1 for loadge 1 for resistance
Neither FORM nor SORM but EVRM (extreme value RM)
Max(16 12 14 ) f mL D D F+ le ϕ ϕ ϕ
Max(16 12 14 )L D D F+ le ϕ
Safe Design CriterionCurrently
φ = strength reduction (understrength) factorintended to distinguish brittleness
φ = 075 for shear
Problem F is a fringe formula involvingCovert understrength factors
φf mdash for formula errorφm mdash for material strength randomness
Required Revision
φf asymp 065 φm asymp 083 for shear
F = load capacity by design formula
Size Effect in Punching Shear
II Size Effect in Punching Shear of RC Slabs
ACI-445C-Database for Punching of Slabs
440 Tests (60 researchers)d (effective depth of slabs) ranges from 118 in to 263 in (from 30 to 668 mm)fc (concrete strength) ranges from 1160 to 17114 psi (from 8 to 118 MPa)ρ (longit reinforcement ratio) ranges from 01 to 73
Formulae in Main Design Codes
Vc=total capacityb0=control perimeterb0E=control perimeter (EC)d =effective depthfc =concrete strengthξ =Size effect term in ECρ =reinforcement ratio (longitudinal)ψ =slab rotation term (MC)θ =size effect term in proposed model
Asymptotic slope -1 isimpossible
Database Filteringto reveal the size effect
trend without any calculations
Unfiltered
Filtered mean steel ratio
Filtered mean bd
Filtered mean cb
Database filtering(continued)
Mean steel ratios
Mean bd
Mean cb
Premise1) The tests relevant to size effect are limited and not scaled2) Microplane model M7 gives generally excellent fits of test data on concrete failures
Approachbull Calibrate M7 parameters by fitting existing
test data with limited size range and different structural geometries
bull Then use calibrated M7 to predict the size effect by simulating scaled specimens
Calibration of M7 by Multivariate Regression
of Test Data for Effect of Other Parameters
Tests by Elstner and Hognestad 1956 Tests by Lips et al 2012
Cross points hold for finite element analysis results (simulations of the experimental works)Circle points hold for the experimental resultsSolid lines refer to the size effect fit of the FEM results
Verification with microplane model M7 for slabs without shear reinforcement
Tests by Bazant and Cao 1987
Tests by Regan 1986
Tests by Guandalini and Muttoni 2009
Tests by Li 2000
Verification with microplane model for slabs with shear reinforcement
Load-Deflection curves of tests and corresponding FEMs
Notperfectlyscaledspecimens(1 16)
Finite element models and corresponding fracture patterns
Perfectly scaled FEM without and with shear reinforcement
Tests of Birkle
Tests of Lips et al
Test data of Birkle 2004 and fits by proposed size effect equaton
Proposed model and calibration by multivariate
regression
D = slab thickness c = side of column b = its perimeter
Data normalized by v0
Size Effect in Torsion
Type I
Bažant Z P and Sener S ldquoSize Effect in Torsional Failure of Concrete Beamsrdquo Journal of Structural Engineering V 113 No 10 1987 pp 2125-2136 90
II Size Effect in Torsional FailuresPlain concrete beams solid cross sections
Size effect plot (log-scale) Failure pattern
MODEL
AFTER TESTTests by Bazant Sener 1987
91
Size Effect on Torsional Failure
bull 3 sizes tested in lab d = 15rdquo 3rdquo 6rdquo)bull Size range extended using microplane model M7 to 113bull Type I failure ndash as soon as peak torque is reached
Scaled computed torque-twist curves
T T
max
Twist (deg)
Bažant Z P and Sener S ldquoSize Effect in Torsional Failure of Concrete Beamsrdquo Journal of Structural Engineering V 113 No 10 1987 pp 2125-2136
Plain concrete beams ndash reduced scale tests
Hsu T T C ldquoTorsion of Structural ConcretemdashPlain Concrete Rectangular Sectionsrdquo Torsion of Structural Concrete SP-18 American Concrete Institute Farmington Hills MI Jan 1968 pp 203-238 92
Torsional failures model validationPlain concrete beams tested by Hsu (1968)
10rdquox20rdquo
10rdquox15rdquo
10rdquox10rdquo
6rdquox195rdquo
6rdquox11rdquo
bull Effects of size (and shape) observed in tests bull Model predictions match tests very well ndash lends
confidence to the model
Hsu T T C ldquoTorsion of Structural ConcretemdashBehavior of Reinforced Concrete Rectangular Membersrdquo Torsion of Structural Concrete SP-18 Am Concrete Institute Farmington Hills MI
93
Torsion of RC Beams Model Validation
bull Note Strong effect of reinforcement ratiobull Predictions by calibrated model match tests very
well ndash lends confidence to the model
B1B1
B2 B3
B4B5
B6
94
Size effect in torsional failuressInterestingly is of Type 1 even with stirrups
Reinforced Concrete Beams (Hsu 1968)Without stirrups With stirrups
Size D [mm] ndash log scale
Kirane K Darun Singh and Bažant Z P ldquoSize Effect In The Torsional Strength Of Plain And Reinforced Concreterdquo submitted to ACI Structural J
Pure prediction - no test data
Nom
inal
str
engt
h v
u [M
Pa]
Test data by Hsu 1968
Size Effect on Columns Prestressed Beam Flexure
Composite Beams andOther Types of Failure
See Bazantrsquos website
Code Articles Requiring Size Effectbull shear of beams without
and with stirrupsbull torsion of beams bull punching of slabs bull shear of deep beams bull bar splices and
development length bull all failures due to
compression crushing of concrete as in-- columns -- prestressed beams -- arches -- bearing strength -- strut-and-tie models
bull failure of composite beams due to failure of connections
EFFECT OF STIRRUPSbull Stirrups can push the size effect up by an order of magnitude of Dl0 but cannot prevent itbull Increasing stirrup ratio in large beams is ineffective and can even reduce the shear strength
Slide Number 70
Slide Number 71
Slide Number 72
Slide Number 73
Failure of Sleipner A Platform
How to Remedy Misleading CovertUnderstrength Factors in Codes
Slide Number 76
Revised Reliability Indices
Slide Number 78
Slide Number 79
II Size Effect in Punching Shear of RC Slabs
Formulae in Main Design Codes
Database Filteringto reveal the size effect trend without any calculations
Slide Number 83
Slide Number 84
Calibration of M7 by Multivariate Regression of Test Data for Effect of Other Parameters
Slide Number 86
Slide Number 87
Proposed model and calibration by multivariate regression
Slide Number 89
Slide Number 90
Slide Number 91
Slide Number 92
Slide Number 93
Slide Number 94
Slide Number 95
Code Articles Requiring Size Effect
Slide Number 97
1
05
2
1
03 3log dd0
0
nvv
0
01 =
+nvvd d
0
0
180 MPa247 m
==
vd
Toronto test V
V
Compressionsplitting amp crushing
Stress Intensity Field
Evidence from Large Worldwide Laboratory
Database
101 10
01
1
001
Size (or depth) d [m]
log
[M
Pa]
14
121
1
ACI-445F Database with 784 points (biased by ad daggr varying with d )
13
Limit analysis
ACI-446 and present proposal
ρ
250 150500
200
100
0100 200
86 of data
Extrapolation (theory required)
Practical range for size effect
Beam Depth D (inches)
Numb
er of
Tests
Beam Shear Histogram
Stee
l rat
iowρ
002
0
004
006
da
Shea
r Spa
n ra
tio
2
0
4
6
8
6 96 in
008
fc ksi
4
0
8
12
16
20
Com
pres
sive S
treng
th
1
0
2
Maxim
um A
ggre
gate
da in
12 24 48 6 96 in12 24 48
6 96 in12 24 48 6 96 in12 24 48
Only 1 point
Only 1 point
Only 1 point
Only 1 point
Intervals of size (or depth) Δdt
Interval averages of w ad daggr vary over size rangeρ
Average longit steel ratio varies as 101
Restricting Strength Range of Data to Achieve Approximately the Same Means of ρw ad da in All Size Intervals
Could we treat entire database as a statistical population Noexcept for the part of size range where size effect is weak
183 data points all satisfy the minimum shear reinforcement requirement
d lt 05 m
For d lt 05 m lognormal distribution is a better description for shear strength because of the scatter insulting from variability of secondary characteristics e g ρ ρ ad
Relation of Size Effect Test Result to pdf of Database
cr
c
fv
Toronto tests (1998-2000)
2 cc fv =
psi 5365 =crf
1
6
1 100
21
364 in
100
Entire database
1
6
10
Smallsize
Largesize
2 crc fv =
= required averagecompr strength
crf
(in) d
2 crc fv =
2 cc fv =
Portion of database for small size range
12 in
1
6
3 50
4 in
10Log-normal in log - scale
Small size
2750 cc fv times=
(in) d(in) d
70 crc ff asymp= specified
compressive strength
a
610minusasympfP
Shift of Resistance cdf Due to Size Increase
310minusasympfP
100
Shifted pdf for large beam
1
6
10
Smallsize Large
size
2 crc fv =
Meana
a
40
Failure probability
Load distribution
a
1
6
1 100
aMean
Expected resistance distribution
Mean2 cc fv =
2 crc fv =
cr
c
fv
Max Service Load
shiftΔ
Δ is due to micro φload factor and crc ff
Known resistance distribution
(in) d(in) d
intinfin
=
0 d)()( yyFyfP RLf
(No Stirrups)
GreatRisk
Do stirrups suppress the size effect
Size effect factor for beams with stirrups
011
ss dd+
=ϑ
(type 2 size effect)
00 10dds =
log d (m) log d (m)2
5
02 0802 115
19Bahl Kong amp Rangan
ad =30σs = 96 psi gt 50 psi
21
2
1
ad =24σs = 130 psi gt 50 psi
5
2
01 1log d (m)
log
v n(M
Pa)
21
Walraven ampLehwalter
Classical tests of geometrically similar RC beams made with the same concrete indicate that stirrups mitigate but do not eliminate the size effect
a) Deep beams b) Slender beams
ad =10
= 0
= 015
ρw= 033
Statistical Bias in Database
1) The data points are crowded in small size range2) In different size ranges the distributions of secondary influencing
parameters are not uniform
Two main causes of statistical bias
0 2 4 6 8 100
40
80
120
Num
ber o
f dat
a po
ints
d (m)
90 less than 06 m deepNo beam is deeper than 2 m
Practical interest
03 06 12
10
5
0 log d (m)
ρ w
03 06 12
10
5
0 log d (m)
ρ v
Uneven distribution of steel ratio of horizontal bars
Uneven distribution of steel ratio of shear reinforcementS
of individual data points (weight) ~ 1 (number of points in interval)
Weighted regression
in 670 33 == addain 670 33 == adda
10 100d
c
c
fv
6
10 100d
1
6
c
c
fv
ω = 223 ω = 236
2
Weighted regression
Unweighted regression
Centroid regression
Centroid regression
Unweighted regression
Size Effect Law Fitting Centroids of FilteredDatabase with Uniform
51=wρ 52=wρ
aw dda ρ
log (size)
identical identical
(purely statistical inference)
EFFECT OF STIRRUPS
bull Stirrups can push the size effect up by an order of magnitude of Dl0 but cannot prevent it
bull Increasing stirrup ratio in large beams is ineffective and caneven reduce the shear strength
Covert Safety Factors
OVERT understrength Factor
65 837covert u factors
83775
( 07 )c crf fasymp
Design load 16L+12D or 14D
Inverse scale
02 04 06 08 10 15 20 5 infin0
1
2
3
4
5
TorontoTest - No stirrups
Expected Mean plusmn SD
2 cf=
31c crv f=
183c crv f=
101c crv f=
Toronto testsd = 744 in (189 m) (from Bentzs memo to Bažant Oct17 2003)
X Parameter of Steel Ratio and Shear Span
c
cr
vf
Vc = shear strength contribution of concrete
Mean = 31 SD = 068
ACI 1962 Small-BeamDatabase
vc = Vcbwd
ACI formula
125c cv f=
2c crv f=Toronto Test - Min Stirrups ndash25
41
Overt and Covert Understrength Factors
PARADIGM - Shear Tests of Small Beams
Safety factor asymp 35
Max service load
Max(16 12 14 ) f mL D D F+ le ϕ ϕ ϕ
Max(16 12 14 )L D D F+ le ϕ
Safe Design CriterionCurrently
φ = strength reduction (understrength) factorintended to distinguish brittleness
φ = 075 for shear
Problem F is a fringe formula involvingCovert understrength factors
φf mdash for formula errorφm mdash for material strength randomness
Required Revision
φf asymp 065 φm asymp 083 for shear
F = load capacity by design formula
Obscuring Effect of Covert Understrength Factors on Forensic Evidence
Safety factor for shearSmall beam
Large beam (for size effect ratio = 2)
16 38 average075 083 065
= = =times times
ϕ- range from 23 to 7
14 17 average075 083 065 2
= = =times times times
ϕrange from 105 to 3
Why is the size effect rarely identified in analyzing disastersMore than one mistake is needed to bring down a structure
Failure of Sleipner A Platform
Water 67m head at failure
T19
T31
D3
Failure
Finite element model
Size Effect ft reduced by 40
wrong mesh
With post-processing- shear force 55 of actual
Wrong detail
Stirrups absent- not required by Code- would increase head to 125m
T-he
aded
bar
T-headed bars - if elongated 25cm- 125m head
Assumed failure mode
Kinked reinforcing bars
~ 095 m Spalled concrete
Deflection of wall
Spalled concreteCrack width
Posterior pmax ~ 08 - 12 papplied
How to Remedy Misleading CovertUnderstrength Factors in CodesOption 1
bullUse mean prediction formulas not fringe formulas
bullUse mean material strength not reduced strength
bull In addition to the current understrength factor ϕ = ϕb accounting for brittleness impose understrength factors minus ϕf for error of formulaminus ϕm for material strength randomness and specify their CoVrsquos ω
For shear ϕb = 075 ϕf = 065 ϕm =083
( ) c crf f primeorcf prime
Option 2bullKeep the current fringe formulas
bullKeep the reduced strength
bullSpecify the implied understrength factors
ϕf and ϕm
with the coefficients of variations egωf = 22 and ωm = 19
and with the probability cut-offs eg 65 and 75
cf prime
Only this will render reliability assessment meaningful
L
p
q
Hidden size effect factor
d
1 2
1 1 2
105 16Max(14 12 16 )
075 to 1
CodeNTrueN
C d CC d C d C
+= =
+=
σϕσ
Max( 12 161 )
105 16
4CodeNTrueN
D D LD L
σ
σ
= +
= +
Wrong Size Effect Hidden in Excessive Self Weight Factor
2
1
1
075
001 10 10000
Hidden inload factor
logφ
log( )s ize
Actual
SmallLarge
(d = size)Wrong for Flexural vs shear failure high-strength vs normal concrete prestressed vs normal concrete etc
Revised Reliability Indicesa) Cornell Index
2 2 2L R
L Rs sτ
micro microβ minus=
+
i
i
yii
yi
yy
smicro
τ
minusprime =
b) Hasofer-Lind Index
2
1min
n
ii
yβ=
prime= sumP f
0
1
chosenPf = 10-6
Gaussian
Weibullxf micro
Means=1ω= 0052m=24
TGTW
τ = TWTG
0
Linearizedfailure plane at design point(y1 y2) β
y2
y1
Safe regionRgtL
Failure regionLgtR
y1
y2
τi = 1 for loadge 1 for resistance
Neither FORM nor SORM but EVRM (extreme value RM)
Max(16 12 14 ) f mL D D F+ le ϕ ϕ ϕ
Max(16 12 14 )L D D F+ le ϕ
Safe Design CriterionCurrently
φ = strength reduction (understrength) factorintended to distinguish brittleness
φ = 075 for shear
Problem F is a fringe formula involvingCovert understrength factors
φf mdash for formula errorφm mdash for material strength randomness
Required Revision
φf asymp 065 φm asymp 083 for shear
F = load capacity by design formula
Size Effect in Punching Shear
II Size Effect in Punching Shear of RC Slabs
ACI-445C-Database for Punching of Slabs
440 Tests (60 researchers)d (effective depth of slabs) ranges from 118 in to 263 in (from 30 to 668 mm)fc (concrete strength) ranges from 1160 to 17114 psi (from 8 to 118 MPa)ρ (longit reinforcement ratio) ranges from 01 to 73
Formulae in Main Design Codes
Vc=total capacityb0=control perimeterb0E=control perimeter (EC)d =effective depthfc =concrete strengthξ =Size effect term in ECρ =reinforcement ratio (longitudinal)ψ =slab rotation term (MC)θ =size effect term in proposed model
Asymptotic slope -1 isimpossible
Database Filteringto reveal the size effect
trend without any calculations
Unfiltered
Filtered mean steel ratio
Filtered mean bd
Filtered mean cb
Database filtering(continued)
Mean steel ratios
Mean bd
Mean cb
Premise1) The tests relevant to size effect are limited and not scaled2) Microplane model M7 gives generally excellent fits of test data on concrete failures
Approachbull Calibrate M7 parameters by fitting existing
test data with limited size range and different structural geometries
bull Then use calibrated M7 to predict the size effect by simulating scaled specimens
Calibration of M7 by Multivariate Regression
of Test Data for Effect of Other Parameters
Tests by Elstner and Hognestad 1956 Tests by Lips et al 2012
Cross points hold for finite element analysis results (simulations of the experimental works)Circle points hold for the experimental resultsSolid lines refer to the size effect fit of the FEM results
Verification with microplane model M7 for slabs without shear reinforcement
Tests by Bazant and Cao 1987
Tests by Regan 1986
Tests by Guandalini and Muttoni 2009
Tests by Li 2000
Verification with microplane model for slabs with shear reinforcement
Load-Deflection curves of tests and corresponding FEMs
Notperfectlyscaledspecimens(1 16)
Finite element models and corresponding fracture patterns
Perfectly scaled FEM without and with shear reinforcement
Tests of Birkle
Tests of Lips et al
Test data of Birkle 2004 and fits by proposed size effect equaton
Proposed model and calibration by multivariate
regression
D = slab thickness c = side of column b = its perimeter
Data normalized by v0
Size Effect in Torsion
Type I
Bažant Z P and Sener S ldquoSize Effect in Torsional Failure of Concrete Beamsrdquo Journal of Structural Engineering V 113 No 10 1987 pp 2125-2136 90
II Size Effect in Torsional FailuresPlain concrete beams solid cross sections
Size effect plot (log-scale) Failure pattern
MODEL
AFTER TESTTests by Bazant Sener 1987
91
Size Effect on Torsional Failure
bull 3 sizes tested in lab d = 15rdquo 3rdquo 6rdquo)bull Size range extended using microplane model M7 to 113bull Type I failure ndash as soon as peak torque is reached
Scaled computed torque-twist curves
T T
max
Twist (deg)
Bažant Z P and Sener S ldquoSize Effect in Torsional Failure of Concrete Beamsrdquo Journal of Structural Engineering V 113 No 10 1987 pp 2125-2136
Plain concrete beams ndash reduced scale tests
Hsu T T C ldquoTorsion of Structural ConcretemdashPlain Concrete Rectangular Sectionsrdquo Torsion of Structural Concrete SP-18 American Concrete Institute Farmington Hills MI Jan 1968 pp 203-238 92
Torsional failures model validationPlain concrete beams tested by Hsu (1968)
10rdquox20rdquo
10rdquox15rdquo
10rdquox10rdquo
6rdquox195rdquo
6rdquox11rdquo
bull Effects of size (and shape) observed in tests bull Model predictions match tests very well ndash lends
confidence to the model
Hsu T T C ldquoTorsion of Structural ConcretemdashBehavior of Reinforced Concrete Rectangular Membersrdquo Torsion of Structural Concrete SP-18 Am Concrete Institute Farmington Hills MI
93
Torsion of RC Beams Model Validation
bull Note Strong effect of reinforcement ratiobull Predictions by calibrated model match tests very
well ndash lends confidence to the model
B1B1
B2 B3
B4B5
B6
94
Size effect in torsional failuressInterestingly is of Type 1 even with stirrups
Reinforced Concrete Beams (Hsu 1968)Without stirrups With stirrups
Size D [mm] ndash log scale
Kirane K Darun Singh and Bažant Z P ldquoSize Effect In The Torsional Strength Of Plain And Reinforced Concreterdquo submitted to ACI Structural J
Pure prediction - no test data
Nom
inal
str
engt
h v
u [M
Pa]
Test data by Hsu 1968
Size Effect on Columns Prestressed Beam Flexure
Composite Beams andOther Types of Failure
See Bazantrsquos website
Code Articles Requiring Size Effectbull shear of beams without
and with stirrupsbull torsion of beams bull punching of slabs bull shear of deep beams bull bar splices and
development length bull all failures due to
compression crushing of concrete as in-- columns -- prestressed beams -- arches -- bearing strength -- strut-and-tie models
bull failure of composite beams due to failure of connections
EFFECT OF STIRRUPSbull Stirrups can push the size effect up by an order of magnitude of Dl0 but cannot prevent itbull Increasing stirrup ratio in large beams is ineffective and can even reduce the shear strength
Slide Number 70
Slide Number 71
Slide Number 72
Slide Number 73
Failure of Sleipner A Platform
How to Remedy Misleading CovertUnderstrength Factors in Codes
Slide Number 76
Revised Reliability Indices
Slide Number 78
Slide Number 79
II Size Effect in Punching Shear of RC Slabs
Formulae in Main Design Codes
Database Filteringto reveal the size effect trend without any calculations
Slide Number 83
Slide Number 84
Calibration of M7 by Multivariate Regression of Test Data for Effect of Other Parameters
Slide Number 86
Slide Number 87
Proposed model and calibration by multivariate regression
Slide Number 89
Slide Number 90
Slide Number 91
Slide Number 92
Slide Number 93
Slide Number 94
Slide Number 95
Code Articles Requiring Size Effect
Slide Number 97
u
c
Vbd f prime
6 12 24 48 96 in 6 12 24 48 96 in 6 12 24 48 96 in
6 12 24 48 96 in 6 12 24 48 96 in 6 12 24 48 96 in
u
c
Vbd f prime
d d d
21
21
21
21
21
21
Mean size effects revealed by several data subbases with bias filtered out to make averages of ρw ad daggr uniform
Note The means agree with ACI-446 size effect curve The slope is never steeper than -12 (thermodynamically impossible anyway)
33a d =
da
2
8
5
2
8
wρ wρ
da wρ
003
0
006
5
Entire Database
3 Filtered Databases
003
0
00625wρ =
003
wρ
0
00615wρ =
10 100
d
003
0
00609wρ =
da
2
8
5 33a d =
10 100d
da
2
8
5 30a d =
10 100 10 100
d10 100 10 100
Nearly uniformsteel ratio shear span and aggregate size
Stee
l rat
io
Shea
r Spa
nInterval means
1) 2) 3)
log ( size )
Database Contaminated by Variation of Secondary Parameters
Stee
l rat
ioSh
ear S
pan
Filtered Database with Nearly Uniform Steel Ratio Shear Span amp Aggregate Size
Could we treat entire database as a statistical population Noexcept for the part of size range where size effect is weak
183 data points all satisfy the minimum shear reinforcement requirement
d lt 05 m
For d lt 05 m lognormal distribution is a better description for shear strength because of the scatter insulting from variability of secondary characteristics e g ρ ρ ad
Relation of Size Effect Test Result to pdf of Database
cr
c
fv
Toronto tests (1998-2000)
2 cc fv =
psi 5365 =crf
1
6
1 100
21
364 in
100
Entire database
1
6
10
Smallsize
Largesize
2 crc fv =
= required averagecompr strength
crf
(in) d
2 crc fv =
2 cc fv =
Portion of database for small size range
12 in
1
6
3 50
4 in
10Log-normal in log - scale
Small size
2750 cc fv times=
(in) d(in) d
70 crc ff asymp= specified
compressive strength
a
610minusasympfP
Shift of Resistance cdf Due to Size Increase
310minusasympfP
100
Shifted pdf for large beam
1
6
10
Smallsize Large
size
2 crc fv =
Meana
a
40
Failure probability
Load distribution
a
1
6
1 100
aMean
Expected resistance distribution
Mean2 cc fv =
2 crc fv =
cr
c
fv
Max Service Load
shiftΔ
Δ is due to micro φload factor and crc ff
Known resistance distribution
(in) d(in) d
intinfin
=
0 d)()( yyFyfP RLf
(No Stirrups)
GreatRisk
Do stirrups suppress the size effect
Size effect factor for beams with stirrups
011
ss dd+
=ϑ
(type 2 size effect)
00 10dds =
log d (m) log d (m)2
5
02 0802 115
19Bahl Kong amp Rangan
ad =30σs = 96 psi gt 50 psi
21
2
1
ad =24σs = 130 psi gt 50 psi
5
2
01 1log d (m)
log
v n(M
Pa)
21
Walraven ampLehwalter
Classical tests of geometrically similar RC beams made with the same concrete indicate that stirrups mitigate but do not eliminate the size effect
a) Deep beams b) Slender beams
ad =10
= 0
= 015
ρw= 033
Statistical Bias in Database
1) The data points are crowded in small size range2) In different size ranges the distributions of secondary influencing
parameters are not uniform
Two main causes of statistical bias
0 2 4 6 8 100
40
80
120
Num
ber o
f dat
a po
ints
d (m)
90 less than 06 m deepNo beam is deeper than 2 m
Practical interest
03 06 12
10
5
0 log d (m)
ρ w
03 06 12
10
5
0 log d (m)
ρ v
Uneven distribution of steel ratio of horizontal bars
Uneven distribution of steel ratio of shear reinforcementS
of individual data points (weight) ~ 1 (number of points in interval)
Weighted regression
in 670 33 == addain 670 33 == adda
10 100d
c
c
fv
6
10 100d
1
6
c
c
fv
ω = 223 ω = 236
2
Weighted regression
Unweighted regression
Centroid regression
Centroid regression
Unweighted regression
Size Effect Law Fitting Centroids of FilteredDatabase with Uniform
51=wρ 52=wρ
aw dda ρ
log (size)
identical identical
(purely statistical inference)
EFFECT OF STIRRUPS
bull Stirrups can push the size effect up by an order of magnitude of Dl0 but cannot prevent it
bull Increasing stirrup ratio in large beams is ineffective and caneven reduce the shear strength
Covert Safety Factors
OVERT understrength Factor
65 837covert u factors
83775
( 07 )c crf fasymp
Design load 16L+12D or 14D
Inverse scale
02 04 06 08 10 15 20 5 infin0
1
2
3
4
5
TorontoTest - No stirrups
Expected Mean plusmn SD
2 cf=
31c crv f=
183c crv f=
101c crv f=
Toronto testsd = 744 in (189 m) (from Bentzs memo to Bažant Oct17 2003)
X Parameter of Steel Ratio and Shear Span
c
cr
vf
Vc = shear strength contribution of concrete
Mean = 31 SD = 068
ACI 1962 Small-BeamDatabase
vc = Vcbwd
ACI formula
125c cv f=
2c crv f=Toronto Test - Min Stirrups ndash25
41
Overt and Covert Understrength Factors
PARADIGM - Shear Tests of Small Beams
Safety factor asymp 35
Max service load
Max(16 12 14 ) f mL D D F+ le ϕ ϕ ϕ
Max(16 12 14 )L D D F+ le ϕ
Safe Design CriterionCurrently
φ = strength reduction (understrength) factorintended to distinguish brittleness
φ = 075 for shear
Problem F is a fringe formula involvingCovert understrength factors
φf mdash for formula errorφm mdash for material strength randomness
Required Revision
φf asymp 065 φm asymp 083 for shear
F = load capacity by design formula
Obscuring Effect of Covert Understrength Factors on Forensic Evidence
Safety factor for shearSmall beam
Large beam (for size effect ratio = 2)
16 38 average075 083 065
= = =times times
ϕ- range from 23 to 7
14 17 average075 083 065 2
= = =times times times
ϕrange from 105 to 3
Why is the size effect rarely identified in analyzing disastersMore than one mistake is needed to bring down a structure
Failure of Sleipner A Platform
Water 67m head at failure
T19
T31
D3
Failure
Finite element model
Size Effect ft reduced by 40
wrong mesh
With post-processing- shear force 55 of actual
Wrong detail
Stirrups absent- not required by Code- would increase head to 125m
T-he
aded
bar
T-headed bars - if elongated 25cm- 125m head
Assumed failure mode
Kinked reinforcing bars
~ 095 m Spalled concrete
Deflection of wall
Spalled concreteCrack width
Posterior pmax ~ 08 - 12 papplied
How to Remedy Misleading CovertUnderstrength Factors in CodesOption 1
bullUse mean prediction formulas not fringe formulas
bullUse mean material strength not reduced strength
bull In addition to the current understrength factor ϕ = ϕb accounting for brittleness impose understrength factors minus ϕf for error of formulaminus ϕm for material strength randomness and specify their CoVrsquos ω
For shear ϕb = 075 ϕf = 065 ϕm =083
( ) c crf f primeorcf prime
Option 2bullKeep the current fringe formulas
bullKeep the reduced strength
bullSpecify the implied understrength factors
ϕf and ϕm
with the coefficients of variations egωf = 22 and ωm = 19
and with the probability cut-offs eg 65 and 75
cf prime
Only this will render reliability assessment meaningful
L
p
q
Hidden size effect factor
d
1 2
1 1 2
105 16Max(14 12 16 )
075 to 1
CodeNTrueN
C d CC d C d C
+= =
+=
σϕσ
Max( 12 161 )
105 16
4CodeNTrueN
D D LD L
σ
σ
= +
= +
Wrong Size Effect Hidden in Excessive Self Weight Factor
2
1
1
075
001 10 10000
Hidden inload factor
logφ
log( )s ize
Actual
SmallLarge
(d = size)Wrong for Flexural vs shear failure high-strength vs normal concrete prestressed vs normal concrete etc
Revised Reliability Indicesa) Cornell Index
2 2 2L R
L Rs sτ
micro microβ minus=
+
i
i
yii
yi
yy
smicro
τ
minusprime =
b) Hasofer-Lind Index
2
1min
n
ii
yβ=
prime= sumP f
0
1
chosenPf = 10-6
Gaussian
Weibullxf micro
Means=1ω= 0052m=24
TGTW
τ = TWTG
0
Linearizedfailure plane at design point(y1 y2) β
y2
y1
Safe regionRgtL
Failure regionLgtR
y1
y2
τi = 1 for loadge 1 for resistance
Neither FORM nor SORM but EVRM (extreme value RM)
Max(16 12 14 ) f mL D D F+ le ϕ ϕ ϕ
Max(16 12 14 )L D D F+ le ϕ
Safe Design CriterionCurrently
φ = strength reduction (understrength) factorintended to distinguish brittleness
φ = 075 for shear
Problem F is a fringe formula involvingCovert understrength factors
φf mdash for formula errorφm mdash for material strength randomness
Required Revision
φf asymp 065 φm asymp 083 for shear
F = load capacity by design formula
Size Effect in Punching Shear
II Size Effect in Punching Shear of RC Slabs
ACI-445C-Database for Punching of Slabs
440 Tests (60 researchers)d (effective depth of slabs) ranges from 118 in to 263 in (from 30 to 668 mm)fc (concrete strength) ranges from 1160 to 17114 psi (from 8 to 118 MPa)ρ (longit reinforcement ratio) ranges from 01 to 73
Formulae in Main Design Codes
Vc=total capacityb0=control perimeterb0E=control perimeter (EC)d =effective depthfc =concrete strengthξ =Size effect term in ECρ =reinforcement ratio (longitudinal)ψ =slab rotation term (MC)θ =size effect term in proposed model
Asymptotic slope -1 isimpossible
Database Filteringto reveal the size effect
trend without any calculations
Unfiltered
Filtered mean steel ratio
Filtered mean bd
Filtered mean cb
Database filtering(continued)
Mean steel ratios
Mean bd
Mean cb
Premise1) The tests relevant to size effect are limited and not scaled2) Microplane model M7 gives generally excellent fits of test data on concrete failures
Approachbull Calibrate M7 parameters by fitting existing
test data with limited size range and different structural geometries
bull Then use calibrated M7 to predict the size effect by simulating scaled specimens
Calibration of M7 by Multivariate Regression
of Test Data for Effect of Other Parameters
Tests by Elstner and Hognestad 1956 Tests by Lips et al 2012
Cross points hold for finite element analysis results (simulations of the experimental works)Circle points hold for the experimental resultsSolid lines refer to the size effect fit of the FEM results
Verification with microplane model M7 for slabs without shear reinforcement
Tests by Bazant and Cao 1987
Tests by Regan 1986
Tests by Guandalini and Muttoni 2009
Tests by Li 2000
Verification with microplane model for slabs with shear reinforcement
Load-Deflection curves of tests and corresponding FEMs
Notperfectlyscaledspecimens(1 16)
Finite element models and corresponding fracture patterns
Perfectly scaled FEM without and with shear reinforcement
Tests of Birkle
Tests of Lips et al
Test data of Birkle 2004 and fits by proposed size effect equaton
Proposed model and calibration by multivariate
regression
D = slab thickness c = side of column b = its perimeter
Data normalized by v0
Size Effect in Torsion
Type I
Bažant Z P and Sener S ldquoSize Effect in Torsional Failure of Concrete Beamsrdquo Journal of Structural Engineering V 113 No 10 1987 pp 2125-2136 90
II Size Effect in Torsional FailuresPlain concrete beams solid cross sections
Size effect plot (log-scale) Failure pattern
MODEL
AFTER TESTTests by Bazant Sener 1987
91
Size Effect on Torsional Failure
bull 3 sizes tested in lab d = 15rdquo 3rdquo 6rdquo)bull Size range extended using microplane model M7 to 113bull Type I failure ndash as soon as peak torque is reached
Scaled computed torque-twist curves
T T
max
Twist (deg)
Bažant Z P and Sener S ldquoSize Effect in Torsional Failure of Concrete Beamsrdquo Journal of Structural Engineering V 113 No 10 1987 pp 2125-2136
Plain concrete beams ndash reduced scale tests
Hsu T T C ldquoTorsion of Structural ConcretemdashPlain Concrete Rectangular Sectionsrdquo Torsion of Structural Concrete SP-18 American Concrete Institute Farmington Hills MI Jan 1968 pp 203-238 92
Torsional failures model validationPlain concrete beams tested by Hsu (1968)
10rdquox20rdquo
10rdquox15rdquo
10rdquox10rdquo
6rdquox195rdquo
6rdquox11rdquo
bull Effects of size (and shape) observed in tests bull Model predictions match tests very well ndash lends
confidence to the model
Hsu T T C ldquoTorsion of Structural ConcretemdashBehavior of Reinforced Concrete Rectangular Membersrdquo Torsion of Structural Concrete SP-18 Am Concrete Institute Farmington Hills MI
93
Torsion of RC Beams Model Validation
bull Note Strong effect of reinforcement ratiobull Predictions by calibrated model match tests very
well ndash lends confidence to the model
B1B1
B2 B3
B4B5
B6
94
Size effect in torsional failuressInterestingly is of Type 1 even with stirrups
Reinforced Concrete Beams (Hsu 1968)Without stirrups With stirrups
Size D [mm] ndash log scale
Kirane K Darun Singh and Bažant Z P ldquoSize Effect In The Torsional Strength Of Plain And Reinforced Concreterdquo submitted to ACI Structural J
Pure prediction - no test data
Nom
inal
str
engt
h v
u [M
Pa]
Test data by Hsu 1968
Size Effect on Columns Prestressed Beam Flexure
Composite Beams andOther Types of Failure
See Bazantrsquos website
Code Articles Requiring Size Effectbull shear of beams without
and with stirrupsbull torsion of beams bull punching of slabs bull shear of deep beams bull bar splices and
development length bull all failures due to
compression crushing of concrete as in-- columns -- prestressed beams -- arches -- bearing strength -- strut-and-tie models
bull failure of composite beams due to failure of connections
EFFECT OF STIRRUPSbull Stirrups can push the size effect up by an order of magnitude of Dl0 but cannot prevent itbull Increasing stirrup ratio in large beams is ineffective and can even reduce the shear strength
Slide Number 70
Slide Number 71
Slide Number 72
Slide Number 73
Failure of Sleipner A Platform
How to Remedy Misleading CovertUnderstrength Factors in Codes
Slide Number 76
Revised Reliability Indices
Slide Number 78
Slide Number 79
II Size Effect in Punching Shear of RC Slabs
Formulae in Main Design Codes
Database Filteringto reveal the size effect trend without any calculations
Slide Number 83
Slide Number 84
Calibration of M7 by Multivariate Regression of Test Data for Effect of Other Parameters
Slide Number 86
Slide Number 87
Proposed model and calibration by multivariate regression
Slide Number 89
Slide Number 90
Slide Number 91
Slide Number 92
Slide Number 93
Slide Number 94
Slide Number 95
Code Articles Requiring Size Effect
Slide Number 97
Decrease of Safety Margin with Increasing Size
Probability Distribution of Shear Strength
cr
c
fv
(m) d01 1
1
10
Could we treat entire database as a statistical population Noexcept for the part of size range where size effect is weak
183 data points all satisfy the minimum shear reinforcement requirement
d lt 05 m
For d lt 05 m lognormal distribution is a better description for shear strength because of the scatter insulting from variability of secondary characteristics e g ρ ρ ad
Relation of Size Effect Test Result to pdf of Database
cr
c
fv
Toronto tests (1998-2000)
2 cc fv =
psi 5365 =crf
1
6
1 100
21
364 in
100
Entire database
1
6
10
Smallsize
Largesize
2 crc fv =
= required averagecompr strength
crf
(in) d
2 crc fv =
2 cc fv =
Portion of database for small size range
12 in
1
6
3 50
4 in
10Log-normal in log - scale
Small size
2750 cc fv times=
(in) d(in) d
70 crc ff asymp= specified
compressive strength
a
610minusasympfP
Shift of Resistance cdf Due to Size Increase
310minusasympfP
100
Shifted pdf for large beam
1
6
10
Smallsize Large
size
2 crc fv =
Meana
a
40
Failure probability
Load distribution
a
1
6
1 100
aMean
Expected resistance distribution
Mean2 cc fv =
2 crc fv =
cr
c
fv
Max Service Load
shiftΔ
Δ is due to micro φload factor and crc ff
Known resistance distribution
(in) d(in) d
intinfin
=
0 d)()( yyFyfP RLf
(No Stirrups)
GreatRisk
Do stirrups suppress the size effect
Size effect factor for beams with stirrups
011
ss dd+
=ϑ
(type 2 size effect)
00 10dds =
log d (m) log d (m)2
5
02 0802 115
19Bahl Kong amp Rangan
ad =30σs = 96 psi gt 50 psi
21
2
1
ad =24σs = 130 psi gt 50 psi
5
2
01 1log d (m)
log
v n(M
Pa)
21
Walraven ampLehwalter
Classical tests of geometrically similar RC beams made with the same concrete indicate that stirrups mitigate but do not eliminate the size effect
a) Deep beams b) Slender beams
ad =10
= 0
= 015
ρw= 033
Statistical Bias in Database
1) The data points are crowded in small size range2) In different size ranges the distributions of secondary influencing
parameters are not uniform
Two main causes of statistical bias
0 2 4 6 8 100
40
80
120
Num
ber o
f dat
a po
ints
d (m)
90 less than 06 m deepNo beam is deeper than 2 m
Practical interest
03 06 12
10
5
0 log d (m)
ρ w
03 06 12
10
5
0 log d (m)
ρ v
Uneven distribution of steel ratio of horizontal bars
Uneven distribution of steel ratio of shear reinforcementS
of individual data points (weight) ~ 1 (number of points in interval)
Weighted regression
in 670 33 == addain 670 33 == adda
10 100d
c
c
fv
6
10 100d
1
6
c
c
fv
ω = 223 ω = 236
2
Weighted regression
Unweighted regression
Centroid regression
Centroid regression
Unweighted regression
Size Effect Law Fitting Centroids of FilteredDatabase with Uniform
51=wρ 52=wρ
aw dda ρ
log (size)
identical identical
(purely statistical inference)
EFFECT OF STIRRUPS
bull Stirrups can push the size effect up by an order of magnitude of Dl0 but cannot prevent it
bull Increasing stirrup ratio in large beams is ineffective and caneven reduce the shear strength
Covert Safety Factors
OVERT understrength Factor
65 837covert u factors
83775
( 07 )c crf fasymp
Design load 16L+12D or 14D
Inverse scale
02 04 06 08 10 15 20 5 infin0
1
2
3
4
5
TorontoTest - No stirrups
Expected Mean plusmn SD
2 cf=
31c crv f=
183c crv f=
101c crv f=
Toronto testsd = 744 in (189 m) (from Bentzs memo to Bažant Oct17 2003)
X Parameter of Steel Ratio and Shear Span
c
cr
vf
Vc = shear strength contribution of concrete
Mean = 31 SD = 068
ACI 1962 Small-BeamDatabase
vc = Vcbwd
ACI formula
125c cv f=
2c crv f=Toronto Test - Min Stirrups ndash25
41
Overt and Covert Understrength Factors
PARADIGM - Shear Tests of Small Beams
Safety factor asymp 35
Max service load
Max(16 12 14 ) f mL D D F+ le ϕ ϕ ϕ
Max(16 12 14 )L D D F+ le ϕ
Safe Design CriterionCurrently
φ = strength reduction (understrength) factorintended to distinguish brittleness
φ = 075 for shear
Problem F is a fringe formula involvingCovert understrength factors
φf mdash for formula errorφm mdash for material strength randomness
Required Revision
φf asymp 065 φm asymp 083 for shear
F = load capacity by design formula
Obscuring Effect of Covert Understrength Factors on Forensic Evidence
Safety factor for shearSmall beam
Large beam (for size effect ratio = 2)
16 38 average075 083 065
= = =times times
ϕ- range from 23 to 7
14 17 average075 083 065 2
= = =times times times
ϕrange from 105 to 3
Why is the size effect rarely identified in analyzing disastersMore than one mistake is needed to bring down a structure
Failure of Sleipner A Platform
Water 67m head at failure
T19
T31
D3
Failure
Finite element model
Size Effect ft reduced by 40
wrong mesh
With post-processing- shear force 55 of actual
Wrong detail
Stirrups absent- not required by Code- would increase head to 125m
T-he
aded
bar
T-headed bars - if elongated 25cm- 125m head
Assumed failure mode
Kinked reinforcing bars
~ 095 m Spalled concrete
Deflection of wall
Spalled concreteCrack width
Posterior pmax ~ 08 - 12 papplied
How to Remedy Misleading CovertUnderstrength Factors in CodesOption 1
bullUse mean prediction formulas not fringe formulas
bullUse mean material strength not reduced strength
bull In addition to the current understrength factor ϕ = ϕb accounting for brittleness impose understrength factors minus ϕf for error of formulaminus ϕm for material strength randomness and specify their CoVrsquos ω
For shear ϕb = 075 ϕf = 065 ϕm =083
( ) c crf f primeorcf prime
Option 2bullKeep the current fringe formulas
bullKeep the reduced strength
bullSpecify the implied understrength factors
ϕf and ϕm
with the coefficients of variations egωf = 22 and ωm = 19
and with the probability cut-offs eg 65 and 75
cf prime
Only this will render reliability assessment meaningful
L
p
q
Hidden size effect factor
d
1 2
1 1 2
105 16Max(14 12 16 )
075 to 1
CodeNTrueN
C d CC d C d C
+= =
+=
σϕσ
Max( 12 161 )
105 16
4CodeNTrueN
D D LD L
σ
σ
= +
= +
Wrong Size Effect Hidden in Excessive Self Weight Factor
2
1
1
075
001 10 10000
Hidden inload factor
logφ
log( )s ize
Actual
SmallLarge
(d = size)Wrong for Flexural vs shear failure high-strength vs normal concrete prestressed vs normal concrete etc
Revised Reliability Indicesa) Cornell Index
2 2 2L R
L Rs sτ
micro microβ minus=
+
i
i
yii
yi
yy
smicro
τ
minusprime =
b) Hasofer-Lind Index
2
1min
n
ii
yβ=
prime= sumP f
0
1
chosenPf = 10-6
Gaussian
Weibullxf micro
Means=1ω= 0052m=24
TGTW
τ = TWTG
0
Linearizedfailure plane at design point(y1 y2) β
y2
y1
Safe regionRgtL
Failure regionLgtR
y1
y2
τi = 1 for loadge 1 for resistance
Neither FORM nor SORM but EVRM (extreme value RM)
Max(16 12 14 ) f mL D D F+ le ϕ ϕ ϕ
Max(16 12 14 )L D D F+ le ϕ
Safe Design CriterionCurrently
φ = strength reduction (understrength) factorintended to distinguish brittleness
φ = 075 for shear
Problem F is a fringe formula involvingCovert understrength factors
φf mdash for formula errorφm mdash for material strength randomness
Required Revision
φf asymp 065 φm asymp 083 for shear
F = load capacity by design formula
Size Effect in Punching Shear
II Size Effect in Punching Shear of RC Slabs
ACI-445C-Database for Punching of Slabs
440 Tests (60 researchers)d (effective depth of slabs) ranges from 118 in to 263 in (from 30 to 668 mm)fc (concrete strength) ranges from 1160 to 17114 psi (from 8 to 118 MPa)ρ (longit reinforcement ratio) ranges from 01 to 73
Formulae in Main Design Codes
Vc=total capacityb0=control perimeterb0E=control perimeter (EC)d =effective depthfc =concrete strengthξ =Size effect term in ECρ =reinforcement ratio (longitudinal)ψ =slab rotation term (MC)θ =size effect term in proposed model
Asymptotic slope -1 isimpossible
Database Filteringto reveal the size effect
trend without any calculations
Unfiltered
Filtered mean steel ratio
Filtered mean bd
Filtered mean cb
Database filtering(continued)
Mean steel ratios
Mean bd
Mean cb
Premise1) The tests relevant to size effect are limited and not scaled2) Microplane model M7 gives generally excellent fits of test data on concrete failures
Approachbull Calibrate M7 parameters by fitting existing
test data with limited size range and different structural geometries
bull Then use calibrated M7 to predict the size effect by simulating scaled specimens
Calibration of M7 by Multivariate Regression
of Test Data for Effect of Other Parameters
Tests by Elstner and Hognestad 1956 Tests by Lips et al 2012
Cross points hold for finite element analysis results (simulations of the experimental works)Circle points hold for the experimental resultsSolid lines refer to the size effect fit of the FEM results
Verification with microplane model M7 for slabs without shear reinforcement
Tests by Bazant and Cao 1987
Tests by Regan 1986
Tests by Guandalini and Muttoni 2009
Tests by Li 2000
Verification with microplane model for slabs with shear reinforcement
Load-Deflection curves of tests and corresponding FEMs
Notperfectlyscaledspecimens(1 16)
Finite element models and corresponding fracture patterns
Perfectly scaled FEM without and with shear reinforcement
Tests of Birkle
Tests of Lips et al
Test data of Birkle 2004 and fits by proposed size effect equaton
Proposed model and calibration by multivariate
regression
D = slab thickness c = side of column b = its perimeter
Data normalized by v0
Size Effect in Torsion
Type I
Bažant Z P and Sener S ldquoSize Effect in Torsional Failure of Concrete Beamsrdquo Journal of Structural Engineering V 113 No 10 1987 pp 2125-2136 90
II Size Effect in Torsional FailuresPlain concrete beams solid cross sections
Size effect plot (log-scale) Failure pattern
MODEL
AFTER TESTTests by Bazant Sener 1987
91
Size Effect on Torsional Failure
bull 3 sizes tested in lab d = 15rdquo 3rdquo 6rdquo)bull Size range extended using microplane model M7 to 113bull Type I failure ndash as soon as peak torque is reached
Scaled computed torque-twist curves
T T
max
Twist (deg)
Bažant Z P and Sener S ldquoSize Effect in Torsional Failure of Concrete Beamsrdquo Journal of Structural Engineering V 113 No 10 1987 pp 2125-2136
Plain concrete beams ndash reduced scale tests
Hsu T T C ldquoTorsion of Structural ConcretemdashPlain Concrete Rectangular Sectionsrdquo Torsion of Structural Concrete SP-18 American Concrete Institute Farmington Hills MI Jan 1968 pp 203-238 92
Torsional failures model validationPlain concrete beams tested by Hsu (1968)
10rdquox20rdquo
10rdquox15rdquo
10rdquox10rdquo
6rdquox195rdquo
6rdquox11rdquo
bull Effects of size (and shape) observed in tests bull Model predictions match tests very well ndash lends
confidence to the model
Hsu T T C ldquoTorsion of Structural ConcretemdashBehavior of Reinforced Concrete Rectangular Membersrdquo Torsion of Structural Concrete SP-18 Am Concrete Institute Farmington Hills MI
93
Torsion of RC Beams Model Validation
bull Note Strong effect of reinforcement ratiobull Predictions by calibrated model match tests very
well ndash lends confidence to the model
B1B1
B2 B3
B4B5
B6
94
Size effect in torsional failuressInterestingly is of Type 1 even with stirrups
Reinforced Concrete Beams (Hsu 1968)Without stirrups With stirrups
Size D [mm] ndash log scale
Kirane K Darun Singh and Bažant Z P ldquoSize Effect In The Torsional Strength Of Plain And Reinforced Concreterdquo submitted to ACI Structural J
Pure prediction - no test data
Nom
inal
str
engt
h v
u [M
Pa]
Test data by Hsu 1968
Size Effect on Columns Prestressed Beam Flexure
Composite Beams andOther Types of Failure
See Bazantrsquos website
Code Articles Requiring Size Effectbull shear of beams without
and with stirrupsbull torsion of beams bull punching of slabs bull shear of deep beams bull bar splices and
development length bull all failures due to
compression crushing of concrete as in-- columns -- prestressed beams -- arches -- bearing strength -- strut-and-tie models
bull failure of composite beams due to failure of connections
EFFECT OF STIRRUPSbull Stirrups can push the size effect up by an order of magnitude of Dl0 but cannot prevent itbull Increasing stirrup ratio in large beams is ineffective and can even reduce the shear strength
Slide Number 70
Slide Number 71
Slide Number 72
Slide Number 73
Failure of Sleipner A Platform
How to Remedy Misleading CovertUnderstrength Factors in Codes
Slide Number 76
Revised Reliability Indices
Slide Number 78
Slide Number 79
II Size Effect in Punching Shear of RC Slabs
Formulae in Main Design Codes
Database Filteringto reveal the size effect trend without any calculations
Slide Number 83
Slide Number 84
Calibration of M7 by Multivariate Regression of Test Data for Effect of Other Parameters
Slide Number 86
Slide Number 87
Proposed model and calibration by multivariate regression
Slide Number 89
Slide Number 90
Slide Number 91
Slide Number 92
Slide Number 93
Slide Number 94
Slide Number 95
Code Articles Requiring Size Effect
Slide Number 97
Statistical Bias in Database
1) The data points are crowded in small size range2) In different size ranges the distributions of secondary influencing
parameters are not uniform
Two main causes of statistical bias
0 2 4 6 8 100
40
80
120
Num
ber o
f dat
a po
ints
d (m)
90 less than 06 m deepNo beam is deeper than 2 m
Practical interest
03 06 12
10
5
0 log d (m)
ρ w
03 06 12
10
5
0 log d (m)
ρ v
Uneven distribution of steel ratio of horizontal bars
Uneven distribution of steel ratio of shear reinforcementS
of individual data points (weight) ~ 1 (number of points in interval)
Weighted regression
in 670 33 == addain 670 33 == adda
10 100d
c
c
fv
6
10 100d
1
6
c
c
fv
ω = 223 ω = 236
2
Weighted regression
Unweighted regression
Centroid regression
Centroid regression
Unweighted regression
Size Effect Law Fitting Centroids of FilteredDatabase with Uniform
51=wρ 52=wρ
aw dda ρ
log (size)
identical identical
(purely statistical inference)
EFFECT OF STIRRUPS
bull Stirrups can push the size effect up by an order of magnitude of Dl0 but cannot prevent it
bull Increasing stirrup ratio in large beams is ineffective and caneven reduce the shear strength
Covert Safety Factors
OVERT understrength Factor
65 837covert u factors
83775
( 07 )c crf fasymp
Design load 16L+12D or 14D
Inverse scale
02 04 06 08 10 15 20 5 infin0
1
2
3
4
5
TorontoTest - No stirrups
Expected Mean plusmn SD
2 cf=
31c crv f=
183c crv f=
101c crv f=
Toronto testsd = 744 in (189 m) (from Bentzs memo to Bažant Oct17 2003)
X Parameter of Steel Ratio and Shear Span
c
cr
vf
Vc = shear strength contribution of concrete
Mean = 31 SD = 068
ACI 1962 Small-BeamDatabase
vc = Vcbwd
ACI formula
125c cv f=
2c crv f=Toronto Test - Min Stirrups ndash25
41
Overt and Covert Understrength Factors
PARADIGM - Shear Tests of Small Beams
Safety factor asymp 35
Max service load
Max(16 12 14 ) f mL D D F+ le ϕ ϕ ϕ
Max(16 12 14 )L D D F+ le ϕ
Safe Design CriterionCurrently
φ = strength reduction (understrength) factorintended to distinguish brittleness
φ = 075 for shear
Problem F is a fringe formula involvingCovert understrength factors
φf mdash for formula errorφm mdash for material strength randomness
Required Revision
φf asymp 065 φm asymp 083 for shear
F = load capacity by design formula
Obscuring Effect of Covert Understrength Factors on Forensic Evidence
Safety factor for shearSmall beam
Large beam (for size effect ratio = 2)
16 38 average075 083 065
= = =times times
ϕ- range from 23 to 7
14 17 average075 083 065 2
= = =times times times
ϕrange from 105 to 3
Why is the size effect rarely identified in analyzing disastersMore than one mistake is needed to bring down a structure
Failure of Sleipner A Platform
Water 67m head at failure
T19
T31
D3
Failure
Finite element model
Size Effect ft reduced by 40
wrong mesh
With post-processing- shear force 55 of actual
Wrong detail
Stirrups absent- not required by Code- would increase head to 125m
T-he
aded
bar
T-headed bars - if elongated 25cm- 125m head
Assumed failure mode
Kinked reinforcing bars
~ 095 m Spalled concrete
Deflection of wall
Spalled concreteCrack width
Posterior pmax ~ 08 - 12 papplied
How to Remedy Misleading CovertUnderstrength Factors in CodesOption 1
bullUse mean prediction formulas not fringe formulas
bullUse mean material strength not reduced strength
bull In addition to the current understrength factor ϕ = ϕb accounting for brittleness impose understrength factors minus ϕf for error of formulaminus ϕm for material strength randomness and specify their CoVrsquos ω
For shear ϕb = 075 ϕf = 065 ϕm =083
( ) c crf f primeorcf prime
Option 2bullKeep the current fringe formulas
bullKeep the reduced strength
bullSpecify the implied understrength factors
ϕf and ϕm
with the coefficients of variations egωf = 22 and ωm = 19
and with the probability cut-offs eg 65 and 75
cf prime
Only this will render reliability assessment meaningful
L
p
q
Hidden size effect factor
d
1 2
1 1 2
105 16Max(14 12 16 )
075 to 1
CodeNTrueN
C d CC d C d C
+= =
+=
σϕσ
Max( 12 161 )
105 16
4CodeNTrueN
D D LD L
σ
σ
= +
= +
Wrong Size Effect Hidden in Excessive Self Weight Factor
2
1
1
075
001 10 10000
Hidden inload factor
logφ
log( )s ize
Actual
SmallLarge
(d = size)Wrong for Flexural vs shear failure high-strength vs normal concrete prestressed vs normal concrete etc
Revised Reliability Indicesa) Cornell Index
2 2 2L R
L Rs sτ
micro microβ minus=
+
i
i
yii
yi
yy
smicro
τ
minusprime =
b) Hasofer-Lind Index
2
1min
n
ii
yβ=
prime= sumP f
0
1
chosenPf = 10-6
Gaussian
Weibullxf micro
Means=1ω= 0052m=24
TGTW
τ = TWTG
0
Linearizedfailure plane at design point(y1 y2) β
y2
y1
Safe regionRgtL
Failure regionLgtR
y1
y2
τi = 1 for loadge 1 for resistance
Neither FORM nor SORM but EVRM (extreme value RM)
Max(16 12 14 ) f mL D D F+ le ϕ ϕ ϕ
Max(16 12 14 )L D D F+ le ϕ
Safe Design CriterionCurrently
φ = strength reduction (understrength) factorintended to distinguish brittleness
φ = 075 for shear
Problem F is a fringe formula involvingCovert understrength factors
φf mdash for formula errorφm mdash for material strength randomness
Required Revision
φf asymp 065 φm asymp 083 for shear
F = load capacity by design formula
Size Effect in Punching Shear
II Size Effect in Punching Shear of RC Slabs
ACI-445C-Database for Punching of Slabs
440 Tests (60 researchers)d (effective depth of slabs) ranges from 118 in to 263 in (from 30 to 668 mm)fc (concrete strength) ranges from 1160 to 17114 psi (from 8 to 118 MPa)ρ (longit reinforcement ratio) ranges from 01 to 73
Formulae in Main Design Codes
Vc=total capacityb0=control perimeterb0E=control perimeter (EC)d =effective depthfc =concrete strengthξ =Size effect term in ECρ =reinforcement ratio (longitudinal)ψ =slab rotation term (MC)θ =size effect term in proposed model
Asymptotic slope -1 isimpossible
Database Filteringto reveal the size effect
trend without any calculations
Unfiltered
Filtered mean steel ratio
Filtered mean bd
Filtered mean cb
Database filtering(continued)
Mean steel ratios
Mean bd
Mean cb
Premise1) The tests relevant to size effect are limited and not scaled2) Microplane model M7 gives generally excellent fits of test data on concrete failures
Approachbull Calibrate M7 parameters by fitting existing
test data with limited size range and different structural geometries
bull Then use calibrated M7 to predict the size effect by simulating scaled specimens
Calibration of M7 by Multivariate Regression
of Test Data for Effect of Other Parameters
Tests by Elstner and Hognestad 1956 Tests by Lips et al 2012
Cross points hold for finite element analysis results (simulations of the experimental works)Circle points hold for the experimental resultsSolid lines refer to the size effect fit of the FEM results
Verification with microplane model M7 for slabs without shear reinforcement
Tests by Bazant and Cao 1987
Tests by Regan 1986
Tests by Guandalini and Muttoni 2009
Tests by Li 2000
Verification with microplane model for slabs with shear reinforcement
Load-Deflection curves of tests and corresponding FEMs
Notperfectlyscaledspecimens(1 16)
Finite element models and corresponding fracture patterns
Perfectly scaled FEM without and with shear reinforcement
Tests of Birkle
Tests of Lips et al
Test data of Birkle 2004 and fits by proposed size effect equaton
Proposed model and calibration by multivariate
regression
D = slab thickness c = side of column b = its perimeter
Data normalized by v0
Size Effect in Torsion
Type I
Bažant Z P and Sener S ldquoSize Effect in Torsional Failure of Concrete Beamsrdquo Journal of Structural Engineering V 113 No 10 1987 pp 2125-2136 90
II Size Effect in Torsional FailuresPlain concrete beams solid cross sections
Size effect plot (log-scale) Failure pattern
MODEL
AFTER TESTTests by Bazant Sener 1987
91
Size Effect on Torsional Failure
bull 3 sizes tested in lab d = 15rdquo 3rdquo 6rdquo)bull Size range extended using microplane model M7 to 113bull Type I failure ndash as soon as peak torque is reached
Scaled computed torque-twist curves
T T
max
Twist (deg)
Bažant Z P and Sener S ldquoSize Effect in Torsional Failure of Concrete Beamsrdquo Journal of Structural Engineering V 113 No 10 1987 pp 2125-2136
Plain concrete beams ndash reduced scale tests
Hsu T T C ldquoTorsion of Structural ConcretemdashPlain Concrete Rectangular Sectionsrdquo Torsion of Structural Concrete SP-18 American Concrete Institute Farmington Hills MI Jan 1968 pp 203-238 92
Torsional failures model validationPlain concrete beams tested by Hsu (1968)
10rdquox20rdquo
10rdquox15rdquo
10rdquox10rdquo
6rdquox195rdquo
6rdquox11rdquo
bull Effects of size (and shape) observed in tests bull Model predictions match tests very well ndash lends
confidence to the model
Hsu T T C ldquoTorsion of Structural ConcretemdashBehavior of Reinforced Concrete Rectangular Membersrdquo Torsion of Structural Concrete SP-18 Am Concrete Institute Farmington Hills MI
93
Torsion of RC Beams Model Validation
bull Note Strong effect of reinforcement ratiobull Predictions by calibrated model match tests very
well ndash lends confidence to the model
B1B1
B2 B3
B4B5
B6
94
Size effect in torsional failuressInterestingly is of Type 1 even with stirrups
Reinforced Concrete Beams (Hsu 1968)Without stirrups With stirrups
Size D [mm] ndash log scale
Kirane K Darun Singh and Bažant Z P ldquoSize Effect In The Torsional Strength Of Plain And Reinforced Concreterdquo submitted to ACI Structural J
Pure prediction - no test data
Nom
inal
str
engt
h v
u [M
Pa]
Test data by Hsu 1968
Size Effect on Columns Prestressed Beam Flexure
Composite Beams andOther Types of Failure
See Bazantrsquos website
Code Articles Requiring Size Effectbull shear of beams without
and with stirrupsbull torsion of beams bull punching of slabs bull shear of deep beams bull bar splices and
development length bull all failures due to
compression crushing of concrete as in-- columns -- prestressed beams -- arches -- bearing strength -- strut-and-tie models
bull failure of composite beams due to failure of connections
EFFECT OF STIRRUPSbull Stirrups can push the size effect up by an order of magnitude of Dl0 but cannot prevent itbull Increasing stirrup ratio in large beams is ineffective and can even reduce the shear strength
Slide Number 70
Slide Number 71
Slide Number 72
Slide Number 73
Failure of Sleipner A Platform
How to Remedy Misleading CovertUnderstrength Factors in Codes
Slide Number 76
Revised Reliability Indices
Slide Number 78
Slide Number 79
II Size Effect in Punching Shear of RC Slabs
Formulae in Main Design Codes
Database Filteringto reveal the size effect trend without any calculations
Slide Number 83
Slide Number 84
Calibration of M7 by Multivariate Regression of Test Data for Effect of Other Parameters
Slide Number 86
Slide Number 87
Proposed model and calibration by multivariate regression
Slide Number 89
Slide Number 90
Slide Number 91
Slide Number 92
Slide Number 93
Slide Number 94
Slide Number 95
Code Articles Requiring Size Effect
Slide Number 97
Numerical Simulations Based on M4 ModelCalibrated by Toronto Tests
δS0 002
12
744
Min stirrups
Toronto beam
d = 186 in
d = 744 in
d = 2976 in
vn d = 1488 in
d = 744 inwithout stirrups
V
V
1 10
v0 = 148 MPad0 = 213 m
d (m)
vc 1
05
21
ρw= 148
Simulations
Stirrups
3D FEM simulation of beams with stirrups
Stirrups did not yield
Crack pattern is the same as in 2D
Max principal stress flow
d=
486
Beam depth d = 486m Microplane model M4
Crack-Band Microplane FEM Simulations of 189 m Deep Toronto Beam Min Stirrups
V
Defl δSpan L0 0016
12
Test
744
Min stirrups
Toronto beam
d = 186 ind = 744 in
d = 2976 in
d (m)
Total
shea
r stre
ngth
v nvn
1 9
1
08v0 = 128 MPad0 = 55 m
d (m)Conc
rete
shea
r stre
ngth
v c
1 9
1
05 v0 = 10 MPad0 = 24 m
Scaled down
Scaled up
fit by SEL fit by SEL
matches the test
matches the test
log (size)
21
21
MuchDeeperBeam
Load (189m)
(756m)
1
05
2
1
03 3log dd0
0
01 =
+nvvd d
21
03
1
06 5log dd0
0
01 =
+cvvd d
12 204
14
12
10
ρ = s
w
Ab d
wb
dMin stirrups
v n(M
Pa)
Flexural failureShear failure
V
12
08
0
04
0 0001 0002
075 ρbd = 372 in
d = 1488 ind = 744 in
2 286= =a l d
744 in=d
ρ () of longitudinal steelδ l
vn
Total
shea
r stre
nth v n
v0
Conc
rete
shea
r stre
ngth
v cv
0
Crack-Band Microplane FEM Simulations of Shear of Beams with Minimum Stirrups
v0 = 180 MPa
d0 = 247 mv0 = 159 MPa
d0 = 121 m
COMPAREFor no stirrupsd0 = 027 m So the stirrups push the size effect up by ~ 1 order of magnitude
(094m)
(189m)(378m)
d0
Toronto Test
Newly Collected Database for Shear Beams with Stirrups
cr
n
fv
D (mm) 1000100
1
10
When the data are treated as a statistical population
Unequal Safety Margin if Size Effect Ignored
Bhal 1968
Nonlinear regression of Bhals size effect test on beams with stirrups
01 1 10
1
10
cr
c
fv
(m) d
2 cc fv =
ACI
41951
a
aa
a
03 m 1 m 2 m 6 m
Same aassumed
Distance a is calibrated here
Failure Probability of RC Beams with Stirrups
Mean of maximum loads
01 1 1001
1
10
10-310-410-510-6
a
a
aa
cr
c
fv
(m) d
03 m 1 m 2 m 6 mBhal 1968
Nonlinear regression of Bhals size effect test on beams with stirrups
Load distribution
Shear strength distribution
OK Not OK
of individual data points (weight) ~ 1 (number of points in interval)
Weighted regression
in 670 33 == addain 670 33 == adda
10 100d
c
c
fv
6
10 100d
1
6
c
c
fv
ω = 223 ω = 236
2
Weighted regression
Unweighted regression
Centroid regression
Centroid regression
Unweighted regression
Size Effect Law Fitting Centroids of FilteredDatabase with Uniform
51=wρ 52=wρ
aw dda ρ
log (size)
identical identical
(purely statistical inference)
EFFECT OF STIRRUPS
bull Stirrups can push the size effect up by an order of magnitude of Dl0 but cannot prevent it
bull Increasing stirrup ratio in large beams is ineffective and caneven reduce the shear strength
Covert Safety Factors
OVERT understrength Factor
65 837covert u factors
83775
( 07 )c crf fasymp
Design load 16L+12D or 14D
Inverse scale
02 04 06 08 10 15 20 5 infin0
1
2
3
4
5
TorontoTest - No stirrups
Expected Mean plusmn SD
2 cf=
31c crv f=
183c crv f=
101c crv f=
Toronto testsd = 744 in (189 m) (from Bentzs memo to Bažant Oct17 2003)
X Parameter of Steel Ratio and Shear Span
c
cr
vf
Vc = shear strength contribution of concrete
Mean = 31 SD = 068
ACI 1962 Small-BeamDatabase
vc = Vcbwd
ACI formula
125c cv f=
2c crv f=Toronto Test - Min Stirrups ndash25
41
Overt and Covert Understrength Factors
PARADIGM - Shear Tests of Small Beams
Safety factor asymp 35
Max service load
Max(16 12 14 ) f mL D D F+ le ϕ ϕ ϕ
Max(16 12 14 )L D D F+ le ϕ
Safe Design CriterionCurrently
φ = strength reduction (understrength) factorintended to distinguish brittleness
φ = 075 for shear
Problem F is a fringe formula involvingCovert understrength factors
φf mdash for formula errorφm mdash for material strength randomness
Required Revision
φf asymp 065 φm asymp 083 for shear
F = load capacity by design formula
Obscuring Effect of Covert Understrength Factors on Forensic Evidence
Safety factor for shearSmall beam
Large beam (for size effect ratio = 2)
16 38 average075 083 065
= = =times times
ϕ- range from 23 to 7
14 17 average075 083 065 2
= = =times times times
ϕrange from 105 to 3
Why is the size effect rarely identified in analyzing disastersMore than one mistake is needed to bring down a structure
Failure of Sleipner A Platform
Water 67m head at failure
T19
T31
D3
Failure
Finite element model
Size Effect ft reduced by 40
wrong mesh
With post-processing- shear force 55 of actual
Wrong detail
Stirrups absent- not required by Code- would increase head to 125m
T-he
aded
bar
T-headed bars - if elongated 25cm- 125m head
Assumed failure mode
Kinked reinforcing bars
~ 095 m Spalled concrete
Deflection of wall
Spalled concreteCrack width
Posterior pmax ~ 08 - 12 papplied
How to Remedy Misleading CovertUnderstrength Factors in CodesOption 1
bullUse mean prediction formulas not fringe formulas
bullUse mean material strength not reduced strength
bull In addition to the current understrength factor ϕ = ϕb accounting for brittleness impose understrength factors minus ϕf for error of formulaminus ϕm for material strength randomness and specify their CoVrsquos ω
For shear ϕb = 075 ϕf = 065 ϕm =083
( ) c crf f primeorcf prime
Option 2bullKeep the current fringe formulas
bullKeep the reduced strength
bullSpecify the implied understrength factors
ϕf and ϕm
with the coefficients of variations egωf = 22 and ωm = 19
and with the probability cut-offs eg 65 and 75
cf prime
Only this will render reliability assessment meaningful
L
p
q
Hidden size effect factor
d
1 2
1 1 2
105 16Max(14 12 16 )
075 to 1
CodeNTrueN
C d CC d C d C
+= =
+=
σϕσ
Max( 12 161 )
105 16
4CodeNTrueN
D D LD L
σ
σ
= +
= +
Wrong Size Effect Hidden in Excessive Self Weight Factor
2
1
1
075
001 10 10000
Hidden inload factor
logφ
log( )s ize
Actual
SmallLarge
(d = size)Wrong for Flexural vs shear failure high-strength vs normal concrete prestressed vs normal concrete etc
Revised Reliability Indicesa) Cornell Index
2 2 2L R
L Rs sτ
micro microβ minus=
+
i
i
yii
yi
yy
smicro
τ
minusprime =
b) Hasofer-Lind Index
2
1min
n
ii
yβ=
prime= sumP f
0
1
chosenPf = 10-6
Gaussian
Weibullxf micro
Means=1ω= 0052m=24
TGTW
τ = TWTG
0
Linearizedfailure plane at design point(y1 y2) β
y2
y1
Safe regionRgtL
Failure regionLgtR
y1
y2
τi = 1 for loadge 1 for resistance
Neither FORM nor SORM but EVRM (extreme value RM)
Max(16 12 14 ) f mL D D F+ le ϕ ϕ ϕ
Max(16 12 14 )L D D F+ le ϕ
Safe Design CriterionCurrently
φ = strength reduction (understrength) factorintended to distinguish brittleness
φ = 075 for shear
Problem F is a fringe formula involvingCovert understrength factors
φf mdash for formula errorφm mdash for material strength randomness
Required Revision
φf asymp 065 φm asymp 083 for shear
F = load capacity by design formula
Size Effect in Punching Shear
II Size Effect in Punching Shear of RC Slabs
ACI-445C-Database for Punching of Slabs
440 Tests (60 researchers)d (effective depth of slabs) ranges from 118 in to 263 in (from 30 to 668 mm)fc (concrete strength) ranges from 1160 to 17114 psi (from 8 to 118 MPa)ρ (longit reinforcement ratio) ranges from 01 to 73
Formulae in Main Design Codes
Vc=total capacityb0=control perimeterb0E=control perimeter (EC)d =effective depthfc =concrete strengthξ =Size effect term in ECρ =reinforcement ratio (longitudinal)ψ =slab rotation term (MC)θ =size effect term in proposed model
Asymptotic slope -1 isimpossible
Database Filteringto reveal the size effect
trend without any calculations
Unfiltered
Filtered mean steel ratio
Filtered mean bd
Filtered mean cb
Database filtering(continued)
Mean steel ratios
Mean bd
Mean cb
Premise1) The tests relevant to size effect are limited and not scaled2) Microplane model M7 gives generally excellent fits of test data on concrete failures
Approachbull Calibrate M7 parameters by fitting existing
test data with limited size range and different structural geometries
bull Then use calibrated M7 to predict the size effect by simulating scaled specimens
Calibration of M7 by Multivariate Regression
of Test Data for Effect of Other Parameters
Tests by Elstner and Hognestad 1956 Tests by Lips et al 2012
Cross points hold for finite element analysis results (simulations of the experimental works)Circle points hold for the experimental resultsSolid lines refer to the size effect fit of the FEM results
Verification with microplane model M7 for slabs without shear reinforcement
Tests by Bazant and Cao 1987
Tests by Regan 1986
Tests by Guandalini and Muttoni 2009
Tests by Li 2000
Verification with microplane model for slabs with shear reinforcement
Load-Deflection curves of tests and corresponding FEMs
Notperfectlyscaledspecimens(1 16)
Finite element models and corresponding fracture patterns
Perfectly scaled FEM without and with shear reinforcement
Tests of Birkle
Tests of Lips et al
Test data of Birkle 2004 and fits by proposed size effect equaton
Proposed model and calibration by multivariate
regression
D = slab thickness c = side of column b = its perimeter
Data normalized by v0
Size Effect in Torsion
Type I
Bažant Z P and Sener S ldquoSize Effect in Torsional Failure of Concrete Beamsrdquo Journal of Structural Engineering V 113 No 10 1987 pp 2125-2136 90
II Size Effect in Torsional FailuresPlain concrete beams solid cross sections
Size effect plot (log-scale) Failure pattern
MODEL
AFTER TESTTests by Bazant Sener 1987
91
Size Effect on Torsional Failure
bull 3 sizes tested in lab d = 15rdquo 3rdquo 6rdquo)bull Size range extended using microplane model M7 to 113bull Type I failure ndash as soon as peak torque is reached
Scaled computed torque-twist curves
T T
max
Twist (deg)
Bažant Z P and Sener S ldquoSize Effect in Torsional Failure of Concrete Beamsrdquo Journal of Structural Engineering V 113 No 10 1987 pp 2125-2136
Plain concrete beams ndash reduced scale tests
Hsu T T C ldquoTorsion of Structural ConcretemdashPlain Concrete Rectangular Sectionsrdquo Torsion of Structural Concrete SP-18 American Concrete Institute Farmington Hills MI Jan 1968 pp 203-238 92
Torsional failures model validationPlain concrete beams tested by Hsu (1968)
10rdquox20rdquo
10rdquox15rdquo
10rdquox10rdquo
6rdquox195rdquo
6rdquox11rdquo
bull Effects of size (and shape) observed in tests bull Model predictions match tests very well ndash lends
confidence to the model
Hsu T T C ldquoTorsion of Structural ConcretemdashBehavior of Reinforced Concrete Rectangular Membersrdquo Torsion of Structural Concrete SP-18 Am Concrete Institute Farmington Hills MI
93
Torsion of RC Beams Model Validation
bull Note Strong effect of reinforcement ratiobull Predictions by calibrated model match tests very
well ndash lends confidence to the model
B1B1
B2 B3
B4B5
B6
94
Size effect in torsional failuressInterestingly is of Type 1 even with stirrups
Reinforced Concrete Beams (Hsu 1968)Without stirrups With stirrups
Size D [mm] ndash log scale
Kirane K Darun Singh and Bažant Z P ldquoSize Effect In The Torsional Strength Of Plain And Reinforced Concreterdquo submitted to ACI Structural J
Pure prediction - no test data
Nom
inal
str
engt
h v
u [M
Pa]
Test data by Hsu 1968
Size Effect on Columns Prestressed Beam Flexure
Composite Beams andOther Types of Failure
See Bazantrsquos website
Code Articles Requiring Size Effectbull shear of beams without
and with stirrupsbull torsion of beams bull punching of slabs bull shear of deep beams bull bar splices and
development length bull all failures due to
compression crushing of concrete as in-- columns -- prestressed beams -- arches -- bearing strength -- strut-and-tie models
bull failure of composite beams due to failure of connections
EFFECT OF STIRRUPSbull Stirrups can push the size effect up by an order of magnitude of Dl0 but cannot prevent itbull Increasing stirrup ratio in large beams is ineffective and can even reduce the shear strength
Slide Number 70
Slide Number 71
Slide Number 72
Slide Number 73
Failure of Sleipner A Platform
How to Remedy Misleading CovertUnderstrength Factors in Codes
Slide Number 76
Revised Reliability Indices
Slide Number 78
Slide Number 79
II Size Effect in Punching Shear of RC Slabs
Formulae in Main Design Codes
Database Filteringto reveal the size effect trend without any calculations
Slide Number 83
Slide Number 84
Calibration of M7 by Multivariate Regression of Test Data for Effect of Other Parameters
Slide Number 86
Slide Number 87
Proposed model and calibration by multivariate regression
Slide Number 89
Slide Number 90
Slide Number 91
Slide Number 92
Slide Number 93
Slide Number 94
Slide Number 95
Code Articles Requiring Size Effect
Slide Number 97
1
05
2
1
03 3log dd0
0
01 =
+nvvd d
21
03
1
06 5log dd0
0
01 =
+cvvd d
12 204
14
12
10
ρ = s
w
Ab d
wb
dMin stirrups
v n(M
Pa)
Flexural failureShear failure
V
12
08
0
04
0 0001 0002
075 ρbd = 372 in
d = 1488 ind = 744 in
2 286= =a l d
744 in=d
ρ () of longitudinal steelδ l
vn
Total
shea
r stre
nth v n
v0
Conc
rete
shea
r stre
ngth
v cv
0
Crack-Band Microplane FEM Simulations of Shear of Beams with Minimum Stirrups
v0 = 180 MPa
d0 = 247 mv0 = 159 MPa
d0 = 121 m
COMPAREFor no stirrupsd0 = 027 m So the stirrups push the size effect up by ~ 1 order of magnitude
(094m)
(189m)(378m)
d0
Toronto Test
Newly Collected Database for Shear Beams with Stirrups
cr
n
fv
D (mm) 1000100
1
10
When the data are treated as a statistical population
Unequal Safety Margin if Size Effect Ignored
Bhal 1968
Nonlinear regression of Bhals size effect test on beams with stirrups
01 1 10
1
10
cr
c
fv
(m) d
2 cc fv =
ACI
41951
a
aa
a
03 m 1 m 2 m 6 m
Same aassumed
Distance a is calibrated here
Failure Probability of RC Beams with Stirrups
Mean of maximum loads
01 1 1001
1
10
10-310-410-510-6
a
a
aa
cr
c
fv
(m) d
03 m 1 m 2 m 6 mBhal 1968
Nonlinear regression of Bhals size effect test on beams with stirrups
Load distribution
Shear strength distribution
OK Not OK
of individual data points (weight) ~ 1 (number of points in interval)
Weighted regression
in 670 33 == addain 670 33 == adda
10 100d
c
c
fv
6
10 100d
1
6
c
c
fv
ω = 223 ω = 236
2
Weighted regression
Unweighted regression
Centroid regression
Centroid regression
Unweighted regression
Size Effect Law Fitting Centroids of FilteredDatabase with Uniform
of individual data points (weight) ~ 1 (number of points in interval)
Weighted regression
in 670 33 == addain 670 33 == adda
10 100d
c
c
fv
6
10 100d
1
6
c
c
fv
ω = 223 ω = 236
2
Weighted regression
Unweighted regression
Centroid regression
Centroid regression
Unweighted regression
Size Effect Law Fitting Centroids of FilteredDatabase with Uniform
51=wρ 52=wρ
aw dda ρ
log (size)
identical identical
(purely statistical inference)
EFFECT OF STIRRUPS
bull Stirrups can push the size effect up by an order of magnitude of Dl0 but cannot prevent it
bull Increasing stirrup ratio in large beams is ineffective and caneven reduce the shear strength
Covert Safety Factors
OVERT understrength Factor
65 837covert u factors
83775
( 07 )c crf fasymp
Design load 16L+12D or 14D
Inverse scale
02 04 06 08 10 15 20 5 infin0
1
2
3
4
5
TorontoTest - No stirrups
Expected Mean plusmn SD
2 cf=
31c crv f=
183c crv f=
101c crv f=
Toronto testsd = 744 in (189 m) (from Bentzs memo to Bažant Oct17 2003)
X Parameter of Steel Ratio and Shear Span
c
cr
vf
Vc = shear strength contribution of concrete
Mean = 31 SD = 068
ACI 1962 Small-BeamDatabase
vc = Vcbwd
ACI formula
125c cv f=
2c crv f=Toronto Test - Min Stirrups ndash25
41
Overt and Covert Understrength Factors
PARADIGM - Shear Tests of Small Beams
Safety factor asymp 35
Max service load
Max(16 12 14 ) f mL D D F+ le ϕ ϕ ϕ
Max(16 12 14 )L D D F+ le ϕ
Safe Design CriterionCurrently
φ = strength reduction (understrength) factorintended to distinguish brittleness
φ = 075 for shear
Problem F is a fringe formula involvingCovert understrength factors
φf mdash for formula errorφm mdash for material strength randomness
Required Revision
φf asymp 065 φm asymp 083 for shear
F = load capacity by design formula
Obscuring Effect of Covert Understrength Factors on Forensic Evidence
Safety factor for shearSmall beam
Large beam (for size effect ratio = 2)
16 38 average075 083 065
= = =times times
ϕ- range from 23 to 7
14 17 average075 083 065 2
= = =times times times
ϕrange from 105 to 3
Why is the size effect rarely identified in analyzing disastersMore than one mistake is needed to bring down a structure
Failure of Sleipner A Platform
Water 67m head at failure
T19
T31
D3
Failure
Finite element model
Size Effect ft reduced by 40
wrong mesh
With post-processing- shear force 55 of actual
Wrong detail
Stirrups absent- not required by Code- would increase head to 125m
T-he
aded
bar
T-headed bars - if elongated 25cm- 125m head
Assumed failure mode
Kinked reinforcing bars
~ 095 m Spalled concrete
Deflection of wall
Spalled concreteCrack width
Posterior pmax ~ 08 - 12 papplied
How to Remedy Misleading CovertUnderstrength Factors in CodesOption 1
bullUse mean prediction formulas not fringe formulas
bullUse mean material strength not reduced strength
bull In addition to the current understrength factor ϕ = ϕb accounting for brittleness impose understrength factors minus ϕf for error of formulaminus ϕm for material strength randomness and specify their CoVrsquos ω
For shear ϕb = 075 ϕf = 065 ϕm =083
( ) c crf f primeorcf prime
Option 2bullKeep the current fringe formulas
bullKeep the reduced strength
bullSpecify the implied understrength factors
ϕf and ϕm
with the coefficients of variations egωf = 22 and ωm = 19
and with the probability cut-offs eg 65 and 75
cf prime
Only this will render reliability assessment meaningful
L
p
q
Hidden size effect factor
d
1 2
1 1 2
105 16Max(14 12 16 )
075 to 1
CodeNTrueN
C d CC d C d C
+= =
+=
σϕσ
Max( 12 161 )
105 16
4CodeNTrueN
D D LD L
σ
σ
= +
= +
Wrong Size Effect Hidden in Excessive Self Weight Factor
2
1
1
075
001 10 10000
Hidden inload factor
logφ
log( )s ize
Actual
SmallLarge
(d = size)Wrong for Flexural vs shear failure high-strength vs normal concrete prestressed vs normal concrete etc
Revised Reliability Indicesa) Cornell Index
2 2 2L R
L Rs sτ
micro microβ minus=
+
i
i
yii
yi
yy
smicro
τ
minusprime =
b) Hasofer-Lind Index
2
1min
n
ii
yβ=
prime= sumP f
0
1
chosenPf = 10-6
Gaussian
Weibullxf micro
Means=1ω= 0052m=24
TGTW
τ = TWTG
0
Linearizedfailure plane at design point(y1 y2) β
y2
y1
Safe regionRgtL
Failure regionLgtR
y1
y2
τi = 1 for loadge 1 for resistance
Neither FORM nor SORM but EVRM (extreme value RM)
Max(16 12 14 ) f mL D D F+ le ϕ ϕ ϕ
Max(16 12 14 )L D D F+ le ϕ
Safe Design CriterionCurrently
φ = strength reduction (understrength) factorintended to distinguish brittleness
φ = 075 for shear
Problem F is a fringe formula involvingCovert understrength factors
φf mdash for formula errorφm mdash for material strength randomness
Required Revision
φf asymp 065 φm asymp 083 for shear
F = load capacity by design formula
Size Effect in Punching Shear
II Size Effect in Punching Shear of RC Slabs
ACI-445C-Database for Punching of Slabs
440 Tests (60 researchers)d (effective depth of slabs) ranges from 118 in to 263 in (from 30 to 668 mm)fc (concrete strength) ranges from 1160 to 17114 psi (from 8 to 118 MPa)ρ (longit reinforcement ratio) ranges from 01 to 73
Formulae in Main Design Codes
Vc=total capacityb0=control perimeterb0E=control perimeter (EC)d =effective depthfc =concrete strengthξ =Size effect term in ECρ =reinforcement ratio (longitudinal)ψ =slab rotation term (MC)θ =size effect term in proposed model
Asymptotic slope -1 isimpossible
Database Filteringto reveal the size effect
trend without any calculations
Unfiltered
Filtered mean steel ratio
Filtered mean bd
Filtered mean cb
Database filtering(continued)
Mean steel ratios
Mean bd
Mean cb
Premise1) The tests relevant to size effect are limited and not scaled2) Microplane model M7 gives generally excellent fits of test data on concrete failures
Approachbull Calibrate M7 parameters by fitting existing
test data with limited size range and different structural geometries
bull Then use calibrated M7 to predict the size effect by simulating scaled specimens
Calibration of M7 by Multivariate Regression
of Test Data for Effect of Other Parameters
Tests by Elstner and Hognestad 1956 Tests by Lips et al 2012
Cross points hold for finite element analysis results (simulations of the experimental works)Circle points hold for the experimental resultsSolid lines refer to the size effect fit of the FEM results
Verification with microplane model M7 for slabs without shear reinforcement
Tests by Bazant and Cao 1987
Tests by Regan 1986
Tests by Guandalini and Muttoni 2009
Tests by Li 2000
Verification with microplane model for slabs with shear reinforcement
Load-Deflection curves of tests and corresponding FEMs
Notperfectlyscaledspecimens(1 16)
Finite element models and corresponding fracture patterns
Perfectly scaled FEM without and with shear reinforcement
Tests of Birkle
Tests of Lips et al
Test data of Birkle 2004 and fits by proposed size effect equaton
Proposed model and calibration by multivariate
regression
D = slab thickness c = side of column b = its perimeter
Data normalized by v0
Size Effect in Torsion
Type I
Bažant Z P and Sener S ldquoSize Effect in Torsional Failure of Concrete Beamsrdquo Journal of Structural Engineering V 113 No 10 1987 pp 2125-2136 90
II Size Effect in Torsional FailuresPlain concrete beams solid cross sections
Size effect plot (log-scale) Failure pattern
MODEL
AFTER TESTTests by Bazant Sener 1987
91
Size Effect on Torsional Failure
bull 3 sizes tested in lab d = 15rdquo 3rdquo 6rdquo)bull Size range extended using microplane model M7 to 113bull Type I failure ndash as soon as peak torque is reached
Scaled computed torque-twist curves
T T
max
Twist (deg)
Bažant Z P and Sener S ldquoSize Effect in Torsional Failure of Concrete Beamsrdquo Journal of Structural Engineering V 113 No 10 1987 pp 2125-2136
Plain concrete beams ndash reduced scale tests
Hsu T T C ldquoTorsion of Structural ConcretemdashPlain Concrete Rectangular Sectionsrdquo Torsion of Structural Concrete SP-18 American Concrete Institute Farmington Hills MI Jan 1968 pp 203-238 92
Torsional failures model validationPlain concrete beams tested by Hsu (1968)
10rdquox20rdquo
10rdquox15rdquo
10rdquox10rdquo
6rdquox195rdquo
6rdquox11rdquo
bull Effects of size (and shape) observed in tests bull Model predictions match tests very well ndash lends
confidence to the model
Hsu T T C ldquoTorsion of Structural ConcretemdashBehavior of Reinforced Concrete Rectangular Membersrdquo Torsion of Structural Concrete SP-18 Am Concrete Institute Farmington Hills MI
93
Torsion of RC Beams Model Validation
bull Note Strong effect of reinforcement ratiobull Predictions by calibrated model match tests very
well ndash lends confidence to the model
B1B1
B2 B3
B4B5
B6
94
Size effect in torsional failuressInterestingly is of Type 1 even with stirrups
Reinforced Concrete Beams (Hsu 1968)Without stirrups With stirrups
Size D [mm] ndash log scale
Kirane K Darun Singh and Bažant Z P ldquoSize Effect In The Torsional Strength Of Plain And Reinforced Concreterdquo submitted to ACI Structural J
Pure prediction - no test data
Nom
inal
str
engt
h v
u [M
Pa]
Test data by Hsu 1968
Size Effect on Columns Prestressed Beam Flexure
Composite Beams andOther Types of Failure
See Bazantrsquos website
Code Articles Requiring Size Effectbull shear of beams without
and with stirrupsbull torsion of beams bull punching of slabs bull shear of deep beams bull bar splices and
development length bull all failures due to
compression crushing of concrete as in-- columns -- prestressed beams -- arches -- bearing strength -- strut-and-tie models
bull failure of composite beams due to failure of connections
EFFECT OF STIRRUPSbull Stirrups can push the size effect up by an order of magnitude of Dl0 but cannot prevent itbull Increasing stirrup ratio in large beams is ineffective and can even reduce the shear strength
Slide Number 70
Slide Number 71
Slide Number 72
Slide Number 73
Failure of Sleipner A Platform
How to Remedy Misleading CovertUnderstrength Factors in Codes
Slide Number 76
Revised Reliability Indices
Slide Number 78
Slide Number 79
II Size Effect in Punching Shear of RC Slabs
Formulae in Main Design Codes
Database Filteringto reveal the size effect trend without any calculations
Slide Number 83
Slide Number 84
Calibration of M7 by Multivariate Regression of Test Data for Effect of Other Parameters
Slide Number 86
Slide Number 87
Proposed model and calibration by multivariate regression
Slide Number 89
Slide Number 90
Slide Number 91
Slide Number 92
Slide Number 93
Slide Number 94
Slide Number 95
Code Articles Requiring Size Effect
Slide Number 97
of individual data points (weight) ~ 1 (number of points in interval)
Weighted regression
in 670 33 == addain 670 33 == adda
10 100d
c
c
fv
6
10 100d
1
6
c
c
fv
ω = 223 ω = 236
2
Weighted regression
Unweighted regression
Centroid regression
Centroid regression
Unweighted regression
Size Effect Law Fitting Centroids of FilteredDatabase with Uniform
51=wρ 52=wρ
aw dda ρ
log (size)
identical identical
(purely statistical inference)
EFFECT OF STIRRUPS
bull Stirrups can push the size effect up by an order of magnitude of Dl0 but cannot prevent it
bull Increasing stirrup ratio in large beams is ineffective and caneven reduce the shear strength
Covert Safety Factors
OVERT understrength Factor
65 837covert u factors
83775
( 07 )c crf fasymp
Design load 16L+12D or 14D
Inverse scale
02 04 06 08 10 15 20 5 infin0
1
2
3
4
5
TorontoTest - No stirrups
Expected Mean plusmn SD
2 cf=
31c crv f=
183c crv f=
101c crv f=
Toronto testsd = 744 in (189 m) (from Bentzs memo to Bažant Oct17 2003)
X Parameter of Steel Ratio and Shear Span
c
cr
vf
Vc = shear strength contribution of concrete
Mean = 31 SD = 068
ACI 1962 Small-BeamDatabase
vc = Vcbwd
ACI formula
125c cv f=
2c crv f=Toronto Test - Min Stirrups ndash25
41
Overt and Covert Understrength Factors
PARADIGM - Shear Tests of Small Beams
Safety factor asymp 35
Max service load
Max(16 12 14 ) f mL D D F+ le ϕ ϕ ϕ
Max(16 12 14 )L D D F+ le ϕ
Safe Design CriterionCurrently
φ = strength reduction (understrength) factorintended to distinguish brittleness
φ = 075 for shear
Problem F is a fringe formula involvingCovert understrength factors
φf mdash for formula errorφm mdash for material strength randomness
Required Revision
φf asymp 065 φm asymp 083 for shear
F = load capacity by design formula
Obscuring Effect of Covert Understrength Factors on Forensic Evidence
Safety factor for shearSmall beam
Large beam (for size effect ratio = 2)
16 38 average075 083 065
= = =times times
ϕ- range from 23 to 7
14 17 average075 083 065 2
= = =times times times
ϕrange from 105 to 3
Why is the size effect rarely identified in analyzing disastersMore than one mistake is needed to bring down a structure
Failure of Sleipner A Platform
Water 67m head at failure
T19
T31
D3
Failure
Finite element model
Size Effect ft reduced by 40
wrong mesh
With post-processing- shear force 55 of actual
Wrong detail
Stirrups absent- not required by Code- would increase head to 125m
T-he
aded
bar
T-headed bars - if elongated 25cm- 125m head
Assumed failure mode
Kinked reinforcing bars
~ 095 m Spalled concrete
Deflection of wall
Spalled concreteCrack width
Posterior pmax ~ 08 - 12 papplied
How to Remedy Misleading CovertUnderstrength Factors in CodesOption 1
bullUse mean prediction formulas not fringe formulas
bullUse mean material strength not reduced strength
bull In addition to the current understrength factor ϕ = ϕb accounting for brittleness impose understrength factors minus ϕf for error of formulaminus ϕm for material strength randomness and specify their CoVrsquos ω
For shear ϕb = 075 ϕf = 065 ϕm =083
( ) c crf f primeorcf prime
Option 2bullKeep the current fringe formulas
bullKeep the reduced strength
bullSpecify the implied understrength factors
ϕf and ϕm
with the coefficients of variations egωf = 22 and ωm = 19
and with the probability cut-offs eg 65 and 75
cf prime
Only this will render reliability assessment meaningful
L
p
q
Hidden size effect factor
d
1 2
1 1 2
105 16Max(14 12 16 )
075 to 1
CodeNTrueN
C d CC d C d C
+= =
+=
σϕσ
Max( 12 161 )
105 16
4CodeNTrueN
D D LD L
σ
σ
= +
= +
Wrong Size Effect Hidden in Excessive Self Weight Factor
2
1
1
075
001 10 10000
Hidden inload factor
logφ
log( )s ize
Actual
SmallLarge
(d = size)Wrong for Flexural vs shear failure high-strength vs normal concrete prestressed vs normal concrete etc
Revised Reliability Indicesa) Cornell Index
2 2 2L R
L Rs sτ
micro microβ minus=
+
i
i
yii
yi
yy
smicro
τ
minusprime =
b) Hasofer-Lind Index
2
1min
n
ii
yβ=
prime= sumP f
0
1
chosenPf = 10-6
Gaussian
Weibullxf micro
Means=1ω= 0052m=24
TGTW
τ = TWTG
0
Linearizedfailure plane at design point(y1 y2) β
y2
y1
Safe regionRgtL
Failure regionLgtR
y1
y2
τi = 1 for loadge 1 for resistance
Neither FORM nor SORM but EVRM (extreme value RM)
Max(16 12 14 ) f mL D D F+ le ϕ ϕ ϕ
Max(16 12 14 )L D D F+ le ϕ
Safe Design CriterionCurrently
φ = strength reduction (understrength) factorintended to distinguish brittleness
φ = 075 for shear
Problem F is a fringe formula involvingCovert understrength factors
φf mdash for formula errorφm mdash for material strength randomness
Required Revision
φf asymp 065 φm asymp 083 for shear
F = load capacity by design formula
Size Effect in Punching Shear
II Size Effect in Punching Shear of RC Slabs
ACI-445C-Database for Punching of Slabs
440 Tests (60 researchers)d (effective depth of slabs) ranges from 118 in to 263 in (from 30 to 668 mm)fc (concrete strength) ranges from 1160 to 17114 psi (from 8 to 118 MPa)ρ (longit reinforcement ratio) ranges from 01 to 73
Formulae in Main Design Codes
Vc=total capacityb0=control perimeterb0E=control perimeter (EC)d =effective depthfc =concrete strengthξ =Size effect term in ECρ =reinforcement ratio (longitudinal)ψ =slab rotation term (MC)θ =size effect term in proposed model
Asymptotic slope -1 isimpossible
Database Filteringto reveal the size effect
trend without any calculations
Unfiltered
Filtered mean steel ratio
Filtered mean bd
Filtered mean cb
Database filtering(continued)
Mean steel ratios
Mean bd
Mean cb
Premise1) The tests relevant to size effect are limited and not scaled2) Microplane model M7 gives generally excellent fits of test data on concrete failures
Approachbull Calibrate M7 parameters by fitting existing
test data with limited size range and different structural geometries
bull Then use calibrated M7 to predict the size effect by simulating scaled specimens
Calibration of M7 by Multivariate Regression
of Test Data for Effect of Other Parameters
Tests by Elstner and Hognestad 1956 Tests by Lips et al 2012
Cross points hold for finite element analysis results (simulations of the experimental works)Circle points hold for the experimental resultsSolid lines refer to the size effect fit of the FEM results
Verification with microplane model M7 for slabs without shear reinforcement
Tests by Bazant and Cao 1987
Tests by Regan 1986
Tests by Guandalini and Muttoni 2009
Tests by Li 2000
Verification with microplane model for slabs with shear reinforcement
Load-Deflection curves of tests and corresponding FEMs
Notperfectlyscaledspecimens(1 16)
Finite element models and corresponding fracture patterns
Perfectly scaled FEM without and with shear reinforcement
Tests of Birkle
Tests of Lips et al
Test data of Birkle 2004 and fits by proposed size effect equaton
Proposed model and calibration by multivariate
regression
D = slab thickness c = side of column b = its perimeter
Data normalized by v0
Size Effect in Torsion
Type I
Bažant Z P and Sener S ldquoSize Effect in Torsional Failure of Concrete Beamsrdquo Journal of Structural Engineering V 113 No 10 1987 pp 2125-2136 90
II Size Effect in Torsional FailuresPlain concrete beams solid cross sections
Size effect plot (log-scale) Failure pattern
MODEL
AFTER TESTTests by Bazant Sener 1987
91
Size Effect on Torsional Failure
bull 3 sizes tested in lab d = 15rdquo 3rdquo 6rdquo)bull Size range extended using microplane model M7 to 113bull Type I failure ndash as soon as peak torque is reached
Scaled computed torque-twist curves
T T
max
Twist (deg)
Bažant Z P and Sener S ldquoSize Effect in Torsional Failure of Concrete Beamsrdquo Journal of Structural Engineering V 113 No 10 1987 pp 2125-2136
Plain concrete beams ndash reduced scale tests
Hsu T T C ldquoTorsion of Structural ConcretemdashPlain Concrete Rectangular Sectionsrdquo Torsion of Structural Concrete SP-18 American Concrete Institute Farmington Hills MI Jan 1968 pp 203-238 92
Torsional failures model validationPlain concrete beams tested by Hsu (1968)
10rdquox20rdquo
10rdquox15rdquo
10rdquox10rdquo
6rdquox195rdquo
6rdquox11rdquo
bull Effects of size (and shape) observed in tests bull Model predictions match tests very well ndash lends
confidence to the model
Hsu T T C ldquoTorsion of Structural ConcretemdashBehavior of Reinforced Concrete Rectangular Membersrdquo Torsion of Structural Concrete SP-18 Am Concrete Institute Farmington Hills MI
93
Torsion of RC Beams Model Validation
bull Note Strong effect of reinforcement ratiobull Predictions by calibrated model match tests very
well ndash lends confidence to the model
B1B1
B2 B3
B4B5
B6
94
Size effect in torsional failuressInterestingly is of Type 1 even with stirrups
Reinforced Concrete Beams (Hsu 1968)Without stirrups With stirrups
Size D [mm] ndash log scale
Kirane K Darun Singh and Bažant Z P ldquoSize Effect In The Torsional Strength Of Plain And Reinforced Concreterdquo submitted to ACI Structural J
Pure prediction - no test data
Nom
inal
str
engt
h v
u [M
Pa]
Test data by Hsu 1968
Size Effect on Columns Prestressed Beam Flexure
Composite Beams andOther Types of Failure
See Bazantrsquos website
Code Articles Requiring Size Effectbull shear of beams without
and with stirrupsbull torsion of beams bull punching of slabs bull shear of deep beams bull bar splices and
development length bull all failures due to
compression crushing of concrete as in-- columns -- prestressed beams -- arches -- bearing strength -- strut-and-tie models
bull failure of composite beams due to failure of connections
EFFECT OF STIRRUPSbull Stirrups can push the size effect up by an order of magnitude of Dl0 but cannot prevent itbull Increasing stirrup ratio in large beams is ineffective and can even reduce the shear strength
Slide Number 70
Slide Number 71
Slide Number 72
Slide Number 73
Failure of Sleipner A Platform
How to Remedy Misleading CovertUnderstrength Factors in Codes
Slide Number 76
Revised Reliability Indices
Slide Number 78
Slide Number 79
II Size Effect in Punching Shear of RC Slabs
Formulae in Main Design Codes
Database Filteringto reveal the size effect trend without any calculations
Slide Number 83
Slide Number 84
Calibration of M7 by Multivariate Regression of Test Data for Effect of Other Parameters
Slide Number 86
Slide Number 87
Proposed model and calibration by multivariate regression
Slide Number 89
Slide Number 90
Slide Number 91
Slide Number 92
Slide Number 93
Slide Number 94
Slide Number 95
Code Articles Requiring Size Effect
Slide Number 97
01 1 10 100
1
log
(vcv
0)
Full ACI-445Fdatabase
log (dd0)
313=micro
10=micro
21
2
Shear Strength Design Equation Calibrated by Least-Square Nonlinear RegressionmdashACI-446 Proposal to ACI-318 Aug2006
ω = 150
not if 3330 known is if 3800
1
1 32 0
0
83
==
=+
+= minus
κκ
κmicroρ
aa
cc
wc
dd
fddd
fadv
d (in)
Num
ber o
f tes
ts
Approximation of histogram
00
240
8040
120
Data points are not uniformly distributed in different size intervals
Capture Size Effect by Proper Statistical Analysis
1) The data points are crowded in small size range
2) In different size ranges the distributions of secondary influencing parameters are not uniform
Two main causes of statistical bias
6 12 in 24 48 9610 100
1
7
c
c
fv
10 100
1
6
c
c
fvin 670
33
51
=
=
=
a
w
d
da
ρ
21
dd
Data that remain after filtering Regression of CentroidsMean in intervals
33a d =
da
2
8
5
2
8
wρ wρ
da wρ
003
0
006
5
Entire Database
3 Filtered Databases
003
0
00625wρ =
003
wρ
0
00615wρ =
10 100
d
003
0
00609wρ =
da
2
8
5 33a d =
10 100d
da
2
8
5 30a d =
10 100 10 100
d10 100 10 100
AchievedNearly uniformsteel ratio shear span and aggregate size
Stee
l rat
io
Shea
r Spa
nInterval means
1) 2) 3)
log ( size )
Database Contaminated by Variation of Secondary Parameters
Stee
l rat
ioSh
ear S
pan
Filtered Database with Nearly Uniform Steel Ratio Shear Span amp Aggregate Size
of individual data points (weight) ~ 1 (number of points in interval)
Weighted regression
in 670 33 == addain 670 33 == adda
10 100d
c
c
fv
6
10 100d
1
6
c
c
fv
ω = 223 ω = 236
2
Weighted regression
Unweighted regression
Centroid regression
Centroid regression
Unweighted regression
Size Effect Law Fitting Centroids of FilteredDatabase with Uniform
51=wρ 52=wρ
aw dda ρ
log (size)
identical identical
(purely statistical inference)
EFFECT OF STIRRUPS
bull Stirrups can push the size effect up by an order of magnitude of Dl0 but cannot prevent it
bull Increasing stirrup ratio in large beams is ineffective and caneven reduce the shear strength
Covert Safety Factors
OVERT understrength Factor
65 837covert u factors
83775
( 07 )c crf fasymp
Design load 16L+12D or 14D
Inverse scale
02 04 06 08 10 15 20 5 infin0
1
2
3
4
5
TorontoTest - No stirrups
Expected Mean plusmn SD
2 cf=
31c crv f=
183c crv f=
101c crv f=
Toronto testsd = 744 in (189 m) (from Bentzs memo to Bažant Oct17 2003)
X Parameter of Steel Ratio and Shear Span
c
cr
vf
Vc = shear strength contribution of concrete
Mean = 31 SD = 068
ACI 1962 Small-BeamDatabase
vc = Vcbwd
ACI formula
125c cv f=
2c crv f=Toronto Test - Min Stirrups ndash25
41
Overt and Covert Understrength Factors
PARADIGM - Shear Tests of Small Beams
Safety factor asymp 35
Max service load
Max(16 12 14 ) f mL D D F+ le ϕ ϕ ϕ
Max(16 12 14 )L D D F+ le ϕ
Safe Design CriterionCurrently
φ = strength reduction (understrength) factorintended to distinguish brittleness
φ = 075 for shear
Problem F is a fringe formula involvingCovert understrength factors
φf mdash for formula errorφm mdash for material strength randomness
Required Revision
φf asymp 065 φm asymp 083 for shear
F = load capacity by design formula
Obscuring Effect of Covert Understrength Factors on Forensic Evidence
Safety factor for shearSmall beam
Large beam (for size effect ratio = 2)
16 38 average075 083 065
= = =times times
ϕ- range from 23 to 7
14 17 average075 083 065 2
= = =times times times
ϕrange from 105 to 3
Why is the size effect rarely identified in analyzing disastersMore than one mistake is needed to bring down a structure
Failure of Sleipner A Platform
Water 67m head at failure
T19
T31
D3
Failure
Finite element model
Size Effect ft reduced by 40
wrong mesh
With post-processing- shear force 55 of actual
Wrong detail
Stirrups absent- not required by Code- would increase head to 125m
T-he
aded
bar
T-headed bars - if elongated 25cm- 125m head
Assumed failure mode
Kinked reinforcing bars
~ 095 m Spalled concrete
Deflection of wall
Spalled concreteCrack width
Posterior pmax ~ 08 - 12 papplied
How to Remedy Misleading CovertUnderstrength Factors in CodesOption 1
bullUse mean prediction formulas not fringe formulas
bullUse mean material strength not reduced strength
bull In addition to the current understrength factor ϕ = ϕb accounting for brittleness impose understrength factors minus ϕf for error of formulaminus ϕm for material strength randomness and specify their CoVrsquos ω
For shear ϕb = 075 ϕf = 065 ϕm =083
( ) c crf f primeorcf prime
Option 2bullKeep the current fringe formulas
bullKeep the reduced strength
bullSpecify the implied understrength factors
ϕf and ϕm
with the coefficients of variations egωf = 22 and ωm = 19
and with the probability cut-offs eg 65 and 75
cf prime
Only this will render reliability assessment meaningful
L
p
q
Hidden size effect factor
d
1 2
1 1 2
105 16Max(14 12 16 )
075 to 1
CodeNTrueN
C d CC d C d C
+= =
+=
σϕσ
Max( 12 161 )
105 16
4CodeNTrueN
D D LD L
σ
σ
= +
= +
Wrong Size Effect Hidden in Excessive Self Weight Factor
2
1
1
075
001 10 10000
Hidden inload factor
logφ
log( )s ize
Actual
SmallLarge
(d = size)Wrong for Flexural vs shear failure high-strength vs normal concrete prestressed vs normal concrete etc
Revised Reliability Indicesa) Cornell Index
2 2 2L R
L Rs sτ
micro microβ minus=
+
i
i
yii
yi
yy
smicro
τ
minusprime =
b) Hasofer-Lind Index
2
1min
n
ii
yβ=
prime= sumP f
0
1
chosenPf = 10-6
Gaussian
Weibullxf micro
Means=1ω= 0052m=24
TGTW
τ = TWTG
0
Linearizedfailure plane at design point(y1 y2) β
y2
y1
Safe regionRgtL
Failure regionLgtR
y1
y2
τi = 1 for loadge 1 for resistance
Neither FORM nor SORM but EVRM (extreme value RM)
Max(16 12 14 ) f mL D D F+ le ϕ ϕ ϕ
Max(16 12 14 )L D D F+ le ϕ
Safe Design CriterionCurrently
φ = strength reduction (understrength) factorintended to distinguish brittleness
φ = 075 for shear
Problem F is a fringe formula involvingCovert understrength factors
φf mdash for formula errorφm mdash for material strength randomness
Required Revision
φf asymp 065 φm asymp 083 for shear
F = load capacity by design formula
Size Effect in Punching Shear
II Size Effect in Punching Shear of RC Slabs
ACI-445C-Database for Punching of Slabs
440 Tests (60 researchers)d (effective depth of slabs) ranges from 118 in to 263 in (from 30 to 668 mm)fc (concrete strength) ranges from 1160 to 17114 psi (from 8 to 118 MPa)ρ (longit reinforcement ratio) ranges from 01 to 73
Formulae in Main Design Codes
Vc=total capacityb0=control perimeterb0E=control perimeter (EC)d =effective depthfc =concrete strengthξ =Size effect term in ECρ =reinforcement ratio (longitudinal)ψ =slab rotation term (MC)θ =size effect term in proposed model
Asymptotic slope -1 isimpossible
Database Filteringto reveal the size effect
trend without any calculations
Unfiltered
Filtered mean steel ratio
Filtered mean bd
Filtered mean cb
Database filtering(continued)
Mean steel ratios
Mean bd
Mean cb
Premise1) The tests relevant to size effect are limited and not scaled2) Microplane model M7 gives generally excellent fits of test data on concrete failures
Approachbull Calibrate M7 parameters by fitting existing
test data with limited size range and different structural geometries
bull Then use calibrated M7 to predict the size effect by simulating scaled specimens
Calibration of M7 by Multivariate Regression
of Test Data for Effect of Other Parameters
Tests by Elstner and Hognestad 1956 Tests by Lips et al 2012
Cross points hold for finite element analysis results (simulations of the experimental works)Circle points hold for the experimental resultsSolid lines refer to the size effect fit of the FEM results
Verification with microplane model M7 for slabs without shear reinforcement
Tests by Bazant and Cao 1987
Tests by Regan 1986
Tests by Guandalini and Muttoni 2009
Tests by Li 2000
Verification with microplane model for slabs with shear reinforcement
Load-Deflection curves of tests and corresponding FEMs
Notperfectlyscaledspecimens(1 16)
Finite element models and corresponding fracture patterns
Perfectly scaled FEM without and with shear reinforcement
Tests of Birkle
Tests of Lips et al
Test data of Birkle 2004 and fits by proposed size effect equaton
Proposed model and calibration by multivariate
regression
D = slab thickness c = side of column b = its perimeter
Data normalized by v0
Size Effect in Torsion
Type I
Bažant Z P and Sener S ldquoSize Effect in Torsional Failure of Concrete Beamsrdquo Journal of Structural Engineering V 113 No 10 1987 pp 2125-2136 90
II Size Effect in Torsional FailuresPlain concrete beams solid cross sections
Size effect plot (log-scale) Failure pattern
MODEL
AFTER TESTTests by Bazant Sener 1987
91
Size Effect on Torsional Failure
bull 3 sizes tested in lab d = 15rdquo 3rdquo 6rdquo)bull Size range extended using microplane model M7 to 113bull Type I failure ndash as soon as peak torque is reached
Scaled computed torque-twist curves
T T
max
Twist (deg)
Bažant Z P and Sener S ldquoSize Effect in Torsional Failure of Concrete Beamsrdquo Journal of Structural Engineering V 113 No 10 1987 pp 2125-2136
Plain concrete beams ndash reduced scale tests
Hsu T T C ldquoTorsion of Structural ConcretemdashPlain Concrete Rectangular Sectionsrdquo Torsion of Structural Concrete SP-18 American Concrete Institute Farmington Hills MI Jan 1968 pp 203-238 92
Torsional failures model validationPlain concrete beams tested by Hsu (1968)
10rdquox20rdquo
10rdquox15rdquo
10rdquox10rdquo
6rdquox195rdquo
6rdquox11rdquo
bull Effects of size (and shape) observed in tests bull Model predictions match tests very well ndash lends
confidence to the model
Hsu T T C ldquoTorsion of Structural ConcretemdashBehavior of Reinforced Concrete Rectangular Membersrdquo Torsion of Structural Concrete SP-18 Am Concrete Institute Farmington Hills MI
93
Torsion of RC Beams Model Validation
bull Note Strong effect of reinforcement ratiobull Predictions by calibrated model match tests very
well ndash lends confidence to the model
B1B1
B2 B3
B4B5
B6
94
Size effect in torsional failuressInterestingly is of Type 1 even with stirrups
Reinforced Concrete Beams (Hsu 1968)Without stirrups With stirrups
Size D [mm] ndash log scale
Kirane K Darun Singh and Bažant Z P ldquoSize Effect In The Torsional Strength Of Plain And Reinforced Concreterdquo submitted to ACI Structural J
Pure prediction - no test data
Nom
inal
str
engt
h v
u [M
Pa]
Test data by Hsu 1968
Size Effect on Columns Prestressed Beam Flexure
Composite Beams andOther Types of Failure
See Bazantrsquos website
Code Articles Requiring Size Effectbull shear of beams without
and with stirrupsbull torsion of beams bull punching of slabs bull shear of deep beams bull bar splices and
development length bull all failures due to
compression crushing of concrete as in-- columns -- prestressed beams -- arches -- bearing strength -- strut-and-tie models
bull failure of composite beams due to failure of connections
EFFECT OF STIRRUPSbull Stirrups can push the size effect up by an order of magnitude of Dl0 but cannot prevent itbull Increasing stirrup ratio in large beams is ineffective and can even reduce the shear strength
Slide Number 70
Slide Number 71
Slide Number 72
Slide Number 73
Failure of Sleipner A Platform
How to Remedy Misleading CovertUnderstrength Factors in Codes
Slide Number 76
Revised Reliability Indices
Slide Number 78
Slide Number 79
II Size Effect in Punching Shear of RC Slabs
Formulae in Main Design Codes
Database Filteringto reveal the size effect trend without any calculations
Slide Number 83
Slide Number 84
Calibration of M7 by Multivariate Regression of Test Data for Effect of Other Parameters
Slide Number 86
Slide Number 87
Proposed model and calibration by multivariate regression
Slide Number 89
Slide Number 90
Slide Number 91
Slide Number 92
Slide Number 93
Slide Number 94
Slide Number 95
Code Articles Requiring Size Effect
Slide Number 97
Restricting Strength Range of Data to Achieve Approx the Same Means of ρw ad da in All Size Intervals
of individual data points (weight) ~ 1 (number of points in interval)
Weighted regression
in 670 33 == addain 670 33 == adda
10 100d
c
c
fv
6
10 100d
1
6
c
c
fv
ω = 223 ω = 236
2
Weighted regression
Unweighted regression
Centroid regression
Centroid regression
Unweighted regression
Size Effect Law Fitting Centroids of FilteredDatabase with Uniform
51=wρ 52=wρ
aw dda ρ
log (size)
identical identical
(purely statistical inference)
EFFECT OF STIRRUPS
bull Stirrups can push the size effect up by an order of magnitude of Dl0 but cannot prevent it
bull Increasing stirrup ratio in large beams is ineffective and caneven reduce the shear strength
Covert Safety Factors
OVERT understrength Factor
65 837covert u factors
83775
( 07 )c crf fasymp
Design load 16L+12D or 14D
Inverse scale
02 04 06 08 10 15 20 5 infin0
1
2
3
4
5
TorontoTest - No stirrups
Expected Mean plusmn SD
2 cf=
31c crv f=
183c crv f=
101c crv f=
Toronto testsd = 744 in (189 m) (from Bentzs memo to Bažant Oct17 2003)
X Parameter of Steel Ratio and Shear Span
c
cr
vf
Vc = shear strength contribution of concrete
Mean = 31 SD = 068
ACI 1962 Small-BeamDatabase
vc = Vcbwd
ACI formula
125c cv f=
2c crv f=Toronto Test - Min Stirrups ndash25
41
Overt and Covert Understrength Factors
PARADIGM - Shear Tests of Small Beams
Safety factor asymp 35
Max service load
Max(16 12 14 ) f mL D D F+ le ϕ ϕ ϕ
Max(16 12 14 )L D D F+ le ϕ
Safe Design CriterionCurrently
φ = strength reduction (understrength) factorintended to distinguish brittleness
φ = 075 for shear
Problem F is a fringe formula involvingCovert understrength factors
φf mdash for formula errorφm mdash for material strength randomness
Required Revision
φf asymp 065 φm asymp 083 for shear
F = load capacity by design formula
Obscuring Effect of Covert Understrength Factors on Forensic Evidence
Safety factor for shearSmall beam
Large beam (for size effect ratio = 2)
16 38 average075 083 065
= = =times times
ϕ- range from 23 to 7
14 17 average075 083 065 2
= = =times times times
ϕrange from 105 to 3
Why is the size effect rarely identified in analyzing disastersMore than one mistake is needed to bring down a structure
Failure of Sleipner A Platform
Water 67m head at failure
T19
T31
D3
Failure
Finite element model
Size Effect ft reduced by 40
wrong mesh
With post-processing- shear force 55 of actual
Wrong detail
Stirrups absent- not required by Code- would increase head to 125m
T-he
aded
bar
T-headed bars - if elongated 25cm- 125m head
Assumed failure mode
Kinked reinforcing bars
~ 095 m Spalled concrete
Deflection of wall
Spalled concreteCrack width
Posterior pmax ~ 08 - 12 papplied
How to Remedy Misleading CovertUnderstrength Factors in CodesOption 1
bullUse mean prediction formulas not fringe formulas
bullUse mean material strength not reduced strength
bull In addition to the current understrength factor ϕ = ϕb accounting for brittleness impose understrength factors minus ϕf for error of formulaminus ϕm for material strength randomness and specify their CoVrsquos ω
For shear ϕb = 075 ϕf = 065 ϕm =083
( ) c crf f primeorcf prime
Option 2bullKeep the current fringe formulas
bullKeep the reduced strength
bullSpecify the implied understrength factors
ϕf and ϕm
with the coefficients of variations egωf = 22 and ωm = 19
and with the probability cut-offs eg 65 and 75
cf prime
Only this will render reliability assessment meaningful
L
p
q
Hidden size effect factor
d
1 2
1 1 2
105 16Max(14 12 16 )
075 to 1
CodeNTrueN
C d CC d C d C
+= =
+=
σϕσ
Max( 12 161 )
105 16
4CodeNTrueN
D D LD L
σ
σ
= +
= +
Wrong Size Effect Hidden in Excessive Self Weight Factor
2
1
1
075
001 10 10000
Hidden inload factor
logφ
log( )s ize
Actual
SmallLarge
(d = size)Wrong for Flexural vs shear failure high-strength vs normal concrete prestressed vs normal concrete etc
Revised Reliability Indicesa) Cornell Index
2 2 2L R
L Rs sτ
micro microβ minus=
+
i
i
yii
yi
yy
smicro
τ
minusprime =
b) Hasofer-Lind Index
2
1min
n
ii
yβ=
prime= sumP f
0
1
chosenPf = 10-6
Gaussian
Weibullxf micro
Means=1ω= 0052m=24
TGTW
τ = TWTG
0
Linearizedfailure plane at design point(y1 y2) β
y2
y1
Safe regionRgtL
Failure regionLgtR
y1
y2
τi = 1 for loadge 1 for resistance
Neither FORM nor SORM but EVRM (extreme value RM)
Max(16 12 14 ) f mL D D F+ le ϕ ϕ ϕ
Max(16 12 14 )L D D F+ le ϕ
Safe Design CriterionCurrently
φ = strength reduction (understrength) factorintended to distinguish brittleness
φ = 075 for shear
Problem F is a fringe formula involvingCovert understrength factors
φf mdash for formula errorφm mdash for material strength randomness
Required Revision
φf asymp 065 φm asymp 083 for shear
F = load capacity by design formula
Size Effect in Punching Shear
II Size Effect in Punching Shear of RC Slabs
ACI-445C-Database for Punching of Slabs
440 Tests (60 researchers)d (effective depth of slabs) ranges from 118 in to 263 in (from 30 to 668 mm)fc (concrete strength) ranges from 1160 to 17114 psi (from 8 to 118 MPa)ρ (longit reinforcement ratio) ranges from 01 to 73
Formulae in Main Design Codes
Vc=total capacityb0=control perimeterb0E=control perimeter (EC)d =effective depthfc =concrete strengthξ =Size effect term in ECρ =reinforcement ratio (longitudinal)ψ =slab rotation term (MC)θ =size effect term in proposed model
Asymptotic slope -1 isimpossible
Database Filteringto reveal the size effect
trend without any calculations
Unfiltered
Filtered mean steel ratio
Filtered mean bd
Filtered mean cb
Database filtering(continued)
Mean steel ratios
Mean bd
Mean cb
Premise1) The tests relevant to size effect are limited and not scaled2) Microplane model M7 gives generally excellent fits of test data on concrete failures
Approachbull Calibrate M7 parameters by fitting existing
test data with limited size range and different structural geometries
bull Then use calibrated M7 to predict the size effect by simulating scaled specimens
Calibration of M7 by Multivariate Regression
of Test Data for Effect of Other Parameters
Tests by Elstner and Hognestad 1956 Tests by Lips et al 2012
Cross points hold for finite element analysis results (simulations of the experimental works)Circle points hold for the experimental resultsSolid lines refer to the size effect fit of the FEM results
Verification with microplane model M7 for slabs without shear reinforcement
Tests by Bazant and Cao 1987
Tests by Regan 1986
Tests by Guandalini and Muttoni 2009
Tests by Li 2000
Verification with microplane model for slabs with shear reinforcement
Load-Deflection curves of tests and corresponding FEMs
Notperfectlyscaledspecimens(1 16)
Finite element models and corresponding fracture patterns
Perfectly scaled FEM without and with shear reinforcement
Tests of Birkle
Tests of Lips et al
Test data of Birkle 2004 and fits by proposed size effect equaton
Proposed model and calibration by multivariate
regression
D = slab thickness c = side of column b = its perimeter
Data normalized by v0
Size Effect in Torsion
Type I
Bažant Z P and Sener S ldquoSize Effect in Torsional Failure of Concrete Beamsrdquo Journal of Structural Engineering V 113 No 10 1987 pp 2125-2136 90
II Size Effect in Torsional FailuresPlain concrete beams solid cross sections
Size effect plot (log-scale) Failure pattern
MODEL
AFTER TESTTests by Bazant Sener 1987
91
Size Effect on Torsional Failure
bull 3 sizes tested in lab d = 15rdquo 3rdquo 6rdquo)bull Size range extended using microplane model M7 to 113bull Type I failure ndash as soon as peak torque is reached
Scaled computed torque-twist curves
T T
max
Twist (deg)
Bažant Z P and Sener S ldquoSize Effect in Torsional Failure of Concrete Beamsrdquo Journal of Structural Engineering V 113 No 10 1987 pp 2125-2136
Plain concrete beams ndash reduced scale tests
Hsu T T C ldquoTorsion of Structural ConcretemdashPlain Concrete Rectangular Sectionsrdquo Torsion of Structural Concrete SP-18 American Concrete Institute Farmington Hills MI Jan 1968 pp 203-238 92
Torsional failures model validationPlain concrete beams tested by Hsu (1968)
10rdquox20rdquo
10rdquox15rdquo
10rdquox10rdquo
6rdquox195rdquo
6rdquox11rdquo
bull Effects of size (and shape) observed in tests bull Model predictions match tests very well ndash lends
confidence to the model
Hsu T T C ldquoTorsion of Structural ConcretemdashBehavior of Reinforced Concrete Rectangular Membersrdquo Torsion of Structural Concrete SP-18 Am Concrete Institute Farmington Hills MI
93
Torsion of RC Beams Model Validation
bull Note Strong effect of reinforcement ratiobull Predictions by calibrated model match tests very
well ndash lends confidence to the model
B1B1
B2 B3
B4B5
B6
94
Size effect in torsional failuressInterestingly is of Type 1 even with stirrups
Reinforced Concrete Beams (Hsu 1968)Without stirrups With stirrups
Size D [mm] ndash log scale
Kirane K Darun Singh and Bažant Z P ldquoSize Effect In The Torsional Strength Of Plain And Reinforced Concreterdquo submitted to ACI Structural J
Pure prediction - no test data
Nom
inal
str
engt
h v
u [M
Pa]
Test data by Hsu 1968
Size Effect on Columns Prestressed Beam Flexure
Composite Beams andOther Types of Failure
See Bazantrsquos website
Code Articles Requiring Size Effectbull shear of beams without
and with stirrupsbull torsion of beams bull punching of slabs bull shear of deep beams bull bar splices and
development length bull all failures due to
compression crushing of concrete as in-- columns -- prestressed beams -- arches -- bearing strength -- strut-and-tie models
bull failure of composite beams due to failure of connections
EFFECT OF STIRRUPSbull Stirrups can push the size effect up by an order of magnitude of Dl0 but cannot prevent itbull Increasing stirrup ratio in large beams is ineffective and can even reduce the shear strength
Slide Number 70
Slide Number 71
Slide Number 72
Slide Number 73
Failure of Sleipner A Platform
How to Remedy Misleading CovertUnderstrength Factors in Codes
Slide Number 76
Revised Reliability Indices
Slide Number 78
Slide Number 79
II Size Effect in Punching Shear of RC Slabs
Formulae in Main Design Codes
Database Filteringto reveal the size effect trend without any calculations
Slide Number 83
Slide Number 84
Calibration of M7 by Multivariate Regression of Test Data for Effect of Other Parameters
Slide Number 86
Slide Number 87
Proposed model and calibration by multivariate regression
Slide Number 89
Slide Number 90
Slide Number 91
Slide Number 92
Slide Number 93
Slide Number 94
Slide Number 95
Code Articles Requiring Size Effect
Slide Number 97
Max(16 12 14 ) f mL D D F+ le ϕ ϕ ϕ
Max(16 12 14 )L D D F+ le ϕ
Safe Design CriterionCurrently
φ = strength reduction (understrength) factorintended to distinguish brittleness
φ = 075 for shear
Problem F is a fringe formula involvingCovert understrength factors
φf mdash for formula errorφm mdash for material strength randomness
Required Revision
φf asymp 065 φm asymp 083 for shear
F = load capacity by design formula
Obscuring Effect of Covert Understrength Factors on Forensic Evidence
Safety factor for shearSmall beam
Large beam (for size effect ratio = 2)
16 38 average075 083 065
= = =times times
ϕ- range from 23 to 7
14 17 average075 083 065 2
= = =times times times
ϕrange from 105 to 3
Why is the size effect rarely identified in analyzing disastersMore than one mistake is needed to bring down a structure
Failure of Sleipner A Platform
Water 67m head at failure
T19
T31
D3
Failure
Finite element model
Size Effect ft reduced by 40
wrong mesh
With post-processing- shear force 55 of actual
Wrong detail
Stirrups absent- not required by Code- would increase head to 125m
T-he
aded
bar
T-headed bars - if elongated 25cm- 125m head
Assumed failure mode
Kinked reinforcing bars
~ 095 m Spalled concrete
Deflection of wall
Spalled concreteCrack width
Posterior pmax ~ 08 - 12 papplied
How to Remedy Misleading CovertUnderstrength Factors in CodesOption 1
bullUse mean prediction formulas not fringe formulas
bullUse mean material strength not reduced strength
bull In addition to the current understrength factor ϕ = ϕb accounting for brittleness impose understrength factors minus ϕf for error of formulaminus ϕm for material strength randomness and specify their CoVrsquos ω
For shear ϕb = 075 ϕf = 065 ϕm =083
( ) c crf f primeorcf prime
Option 2bullKeep the current fringe formulas
bullKeep the reduced strength
bullSpecify the implied understrength factors
ϕf and ϕm
with the coefficients of variations egωf = 22 and ωm = 19
and with the probability cut-offs eg 65 and 75
cf prime
Only this will render reliability assessment meaningful
L
p
q
Hidden size effect factor
d
1 2
1 1 2
105 16Max(14 12 16 )
075 to 1
CodeNTrueN
C d CC d C d C
+= =
+=
σϕσ
Max( 12 161 )
105 16
4CodeNTrueN
D D LD L
σ
σ
= +
= +
Wrong Size Effect Hidden in Excessive Self Weight Factor
2
1
1
075
001 10 10000
Hidden inload factor
logφ
log( )s ize
Actual
SmallLarge
(d = size)Wrong for Flexural vs shear failure high-strength vs normal concrete prestressed vs normal concrete etc
Revised Reliability Indicesa) Cornell Index
2 2 2L R
L Rs sτ
micro microβ minus=
+
i
i
yii
yi
yy
smicro
τ
minusprime =
b) Hasofer-Lind Index
2
1min
n
ii
yβ=
prime= sumP f
0
1
chosenPf = 10-6
Gaussian
Weibullxf micro
Means=1ω= 0052m=24
TGTW
τ = TWTG
0
Linearizedfailure plane at design point(y1 y2) β
y2
y1
Safe regionRgtL
Failure regionLgtR
y1
y2
τi = 1 for loadge 1 for resistance
Neither FORM nor SORM but EVRM (extreme value RM)
Max(16 12 14 ) f mL D D F+ le ϕ ϕ ϕ
Max(16 12 14 )L D D F+ le ϕ
Safe Design CriterionCurrently
φ = strength reduction (understrength) factorintended to distinguish brittleness
φ = 075 for shear
Problem F is a fringe formula involvingCovert understrength factors
φf mdash for formula errorφm mdash for material strength randomness
Required Revision
φf asymp 065 φm asymp 083 for shear
F = load capacity by design formula
Size Effect in Punching Shear
II Size Effect in Punching Shear of RC Slabs
ACI-445C-Database for Punching of Slabs
440 Tests (60 researchers)d (effective depth of slabs) ranges from 118 in to 263 in (from 30 to 668 mm)fc (concrete strength) ranges from 1160 to 17114 psi (from 8 to 118 MPa)ρ (longit reinforcement ratio) ranges from 01 to 73
Formulae in Main Design Codes
Vc=total capacityb0=control perimeterb0E=control perimeter (EC)d =effective depthfc =concrete strengthξ =Size effect term in ECρ =reinforcement ratio (longitudinal)ψ =slab rotation term (MC)θ =size effect term in proposed model
Asymptotic slope -1 isimpossible
Database Filteringto reveal the size effect
trend without any calculations
Unfiltered
Filtered mean steel ratio
Filtered mean bd
Filtered mean cb
Database filtering(continued)
Mean steel ratios
Mean bd
Mean cb
Premise1) The tests relevant to size effect are limited and not scaled2) Microplane model M7 gives generally excellent fits of test data on concrete failures
Approachbull Calibrate M7 parameters by fitting existing
test data with limited size range and different structural geometries
bull Then use calibrated M7 to predict the size effect by simulating scaled specimens
Calibration of M7 by Multivariate Regression
of Test Data for Effect of Other Parameters
Tests by Elstner and Hognestad 1956 Tests by Lips et al 2012
Cross points hold for finite element analysis results (simulations of the experimental works)Circle points hold for the experimental resultsSolid lines refer to the size effect fit of the FEM results
Verification with microplane model M7 for slabs without shear reinforcement
Tests by Bazant and Cao 1987
Tests by Regan 1986
Tests by Guandalini and Muttoni 2009
Tests by Li 2000
Verification with microplane model for slabs with shear reinforcement
Load-Deflection curves of tests and corresponding FEMs
Notperfectlyscaledspecimens(1 16)
Finite element models and corresponding fracture patterns
Perfectly scaled FEM without and with shear reinforcement
Tests of Birkle
Tests of Lips et al
Test data of Birkle 2004 and fits by proposed size effect equaton
Proposed model and calibration by multivariate
regression
D = slab thickness c = side of column b = its perimeter
Data normalized by v0
Size Effect in Torsion
Type I
Bažant Z P and Sener S ldquoSize Effect in Torsional Failure of Concrete Beamsrdquo Journal of Structural Engineering V 113 No 10 1987 pp 2125-2136 90
II Size Effect in Torsional FailuresPlain concrete beams solid cross sections
Size effect plot (log-scale) Failure pattern
MODEL
AFTER TESTTests by Bazant Sener 1987
91
Size Effect on Torsional Failure
bull 3 sizes tested in lab d = 15rdquo 3rdquo 6rdquo)bull Size range extended using microplane model M7 to 113bull Type I failure ndash as soon as peak torque is reached
Scaled computed torque-twist curves
T T
max
Twist (deg)
Bažant Z P and Sener S ldquoSize Effect in Torsional Failure of Concrete Beamsrdquo Journal of Structural Engineering V 113 No 10 1987 pp 2125-2136
Plain concrete beams ndash reduced scale tests
Hsu T T C ldquoTorsion of Structural ConcretemdashPlain Concrete Rectangular Sectionsrdquo Torsion of Structural Concrete SP-18 American Concrete Institute Farmington Hills MI Jan 1968 pp 203-238 92
Torsional failures model validationPlain concrete beams tested by Hsu (1968)
10rdquox20rdquo
10rdquox15rdquo
10rdquox10rdquo
6rdquox195rdquo
6rdquox11rdquo
bull Effects of size (and shape) observed in tests bull Model predictions match tests very well ndash lends
confidence to the model
Hsu T T C ldquoTorsion of Structural ConcretemdashBehavior of Reinforced Concrete Rectangular Membersrdquo Torsion of Structural Concrete SP-18 Am Concrete Institute Farmington Hills MI
93
Torsion of RC Beams Model Validation
bull Note Strong effect of reinforcement ratiobull Predictions by calibrated model match tests very
well ndash lends confidence to the model
B1B1
B2 B3
B4B5
B6
94
Size effect in torsional failuressInterestingly is of Type 1 even with stirrups
Reinforced Concrete Beams (Hsu 1968)Without stirrups With stirrups
Size D [mm] ndash log scale
Kirane K Darun Singh and Bažant Z P ldquoSize Effect In The Torsional Strength Of Plain And Reinforced Concreterdquo submitted to ACI Structural J
Pure prediction - no test data
Nom
inal
str
engt
h v
u [M
Pa]
Test data by Hsu 1968
Size Effect on Columns Prestressed Beam Flexure
Composite Beams andOther Types of Failure
See Bazantrsquos website
Code Articles Requiring Size Effectbull shear of beams without
and with stirrupsbull torsion of beams bull punching of slabs bull shear of deep beams bull bar splices and
development length bull all failures due to
compression crushing of concrete as in-- columns -- prestressed beams -- arches -- bearing strength -- strut-and-tie models
bull failure of composite beams due to failure of connections
EFFECT OF STIRRUPSbull Stirrups can push the size effect up by an order of magnitude of Dl0 but cannot prevent itbull Increasing stirrup ratio in large beams is ineffective and can even reduce the shear strength
Slide Number 70
Slide Number 71
Slide Number 72
Slide Number 73
Failure of Sleipner A Platform
How to Remedy Misleading CovertUnderstrength Factors in Codes
Slide Number 76
Revised Reliability Indices
Slide Number 78
Slide Number 79
II Size Effect in Punching Shear of RC Slabs
Formulae in Main Design Codes
Database Filteringto reveal the size effect trend without any calculations
Slide Number 83
Slide Number 84
Calibration of M7 by Multivariate Regression of Test Data for Effect of Other Parameters
Slide Number 86
Slide Number 87
Proposed model and calibration by multivariate regression
Slide Number 89
Slide Number 90
Slide Number 91
Slide Number 92
Slide Number 93
Slide Number 94
Slide Number 95
Code Articles Requiring Size Effect
Slide Number 97
Failure of Sleipner A Platform
Water 67m head at failure
T19
T31
D3
Failure
Finite element model
Size Effect ft reduced by 40
wrong mesh
With post-processing- shear force 55 of actual
Wrong detail
Stirrups absent- not required by Code- would increase head to 125m
T-he
aded
bar
T-headed bars - if elongated 25cm- 125m head
Assumed failure mode
Kinked reinforcing bars
~ 095 m Spalled concrete
Deflection of wall
Spalled concreteCrack width
Posterior pmax ~ 08 - 12 papplied
How to Remedy Misleading CovertUnderstrength Factors in CodesOption 1
bullUse mean prediction formulas not fringe formulas
bullUse mean material strength not reduced strength
bull In addition to the current understrength factor ϕ = ϕb accounting for brittleness impose understrength factors minus ϕf for error of formulaminus ϕm for material strength randomness and specify their CoVrsquos ω
For shear ϕb = 075 ϕf = 065 ϕm =083
( ) c crf f primeorcf prime
Option 2bullKeep the current fringe formulas
bullKeep the reduced strength
bullSpecify the implied understrength factors
ϕf and ϕm
with the coefficients of variations egωf = 22 and ωm = 19
and with the probability cut-offs eg 65 and 75
cf prime
Only this will render reliability assessment meaningful
L
p
q
Hidden size effect factor
d
1 2
1 1 2
105 16Max(14 12 16 )
075 to 1
CodeNTrueN
C d CC d C d C
+= =
+=
σϕσ
Max( 12 161 )
105 16
4CodeNTrueN
D D LD L
σ
σ
= +
= +
Wrong Size Effect Hidden in Excessive Self Weight Factor
2
1
1
075
001 10 10000
Hidden inload factor
logφ
log( )s ize
Actual
SmallLarge
(d = size)Wrong for Flexural vs shear failure high-strength vs normal concrete prestressed vs normal concrete etc
Revised Reliability Indicesa) Cornell Index
2 2 2L R
L Rs sτ
micro microβ minus=
+
i
i
yii
yi
yy
smicro
τ
minusprime =
b) Hasofer-Lind Index
2
1min
n
ii
yβ=
prime= sumP f
0
1
chosenPf = 10-6
Gaussian
Weibullxf micro
Means=1ω= 0052m=24
TGTW
τ = TWTG
0
Linearizedfailure plane at design point(y1 y2) β
y2
y1
Safe regionRgtL
Failure regionLgtR
y1
y2
τi = 1 for loadge 1 for resistance
Neither FORM nor SORM but EVRM (extreme value RM)
Max(16 12 14 ) f mL D D F+ le ϕ ϕ ϕ
Max(16 12 14 )L D D F+ le ϕ
Safe Design CriterionCurrently
φ = strength reduction (understrength) factorintended to distinguish brittleness
φ = 075 for shear
Problem F is a fringe formula involvingCovert understrength factors
φf mdash for formula errorφm mdash for material strength randomness
Required Revision
φf asymp 065 φm asymp 083 for shear
F = load capacity by design formula
Size Effect in Punching Shear
II Size Effect in Punching Shear of RC Slabs
ACI-445C-Database for Punching of Slabs
440 Tests (60 researchers)d (effective depth of slabs) ranges from 118 in to 263 in (from 30 to 668 mm)fc (concrete strength) ranges from 1160 to 17114 psi (from 8 to 118 MPa)ρ (longit reinforcement ratio) ranges from 01 to 73
Formulae in Main Design Codes
Vc=total capacityb0=control perimeterb0E=control perimeter (EC)d =effective depthfc =concrete strengthξ =Size effect term in ECρ =reinforcement ratio (longitudinal)ψ =slab rotation term (MC)θ =size effect term in proposed model
Asymptotic slope -1 isimpossible
Database Filteringto reveal the size effect
trend without any calculations
Unfiltered
Filtered mean steel ratio
Filtered mean bd
Filtered mean cb
Database filtering(continued)
Mean steel ratios
Mean bd
Mean cb
Premise1) The tests relevant to size effect are limited and not scaled2) Microplane model M7 gives generally excellent fits of test data on concrete failures
Approachbull Calibrate M7 parameters by fitting existing
test data with limited size range and different structural geometries
bull Then use calibrated M7 to predict the size effect by simulating scaled specimens
Calibration of M7 by Multivariate Regression
of Test Data for Effect of Other Parameters
Tests by Elstner and Hognestad 1956 Tests by Lips et al 2012
Cross points hold for finite element analysis results (simulations of the experimental works)Circle points hold for the experimental resultsSolid lines refer to the size effect fit of the FEM results
Verification with microplane model M7 for slabs without shear reinforcement
Tests by Bazant and Cao 1987
Tests by Regan 1986
Tests by Guandalini and Muttoni 2009
Tests by Li 2000
Verification with microplane model for slabs with shear reinforcement
Load-Deflection curves of tests and corresponding FEMs
Notperfectlyscaledspecimens(1 16)
Finite element models and corresponding fracture patterns
Perfectly scaled FEM without and with shear reinforcement
Tests of Birkle
Tests of Lips et al
Test data of Birkle 2004 and fits by proposed size effect equaton
Proposed model and calibration by multivariate
regression
D = slab thickness c = side of column b = its perimeter
Data normalized by v0
Size Effect in Torsion
Type I
Bažant Z P and Sener S ldquoSize Effect in Torsional Failure of Concrete Beamsrdquo Journal of Structural Engineering V 113 No 10 1987 pp 2125-2136 90
II Size Effect in Torsional FailuresPlain concrete beams solid cross sections
Size effect plot (log-scale) Failure pattern
MODEL
AFTER TESTTests by Bazant Sener 1987
91
Size Effect on Torsional Failure
bull 3 sizes tested in lab d = 15rdquo 3rdquo 6rdquo)bull Size range extended using microplane model M7 to 113bull Type I failure ndash as soon as peak torque is reached
Scaled computed torque-twist curves
T T
max
Twist (deg)
Bažant Z P and Sener S ldquoSize Effect in Torsional Failure of Concrete Beamsrdquo Journal of Structural Engineering V 113 No 10 1987 pp 2125-2136
Plain concrete beams ndash reduced scale tests
Hsu T T C ldquoTorsion of Structural ConcretemdashPlain Concrete Rectangular Sectionsrdquo Torsion of Structural Concrete SP-18 American Concrete Institute Farmington Hills MI Jan 1968 pp 203-238 92
Torsional failures model validationPlain concrete beams tested by Hsu (1968)
10rdquox20rdquo
10rdquox15rdquo
10rdquox10rdquo
6rdquox195rdquo
6rdquox11rdquo
bull Effects of size (and shape) observed in tests bull Model predictions match tests very well ndash lends
confidence to the model
Hsu T T C ldquoTorsion of Structural ConcretemdashBehavior of Reinforced Concrete Rectangular Membersrdquo Torsion of Structural Concrete SP-18 Am Concrete Institute Farmington Hills MI
93
Torsion of RC Beams Model Validation
bull Note Strong effect of reinforcement ratiobull Predictions by calibrated model match tests very
well ndash lends confidence to the model
B1B1
B2 B3
B4B5
B6
94
Size effect in torsional failuressInterestingly is of Type 1 even with stirrups
Reinforced Concrete Beams (Hsu 1968)Without stirrups With stirrups
Size D [mm] ndash log scale
Kirane K Darun Singh and Bažant Z P ldquoSize Effect In The Torsional Strength Of Plain And Reinforced Concreterdquo submitted to ACI Structural J
Pure prediction - no test data
Nom
inal
str
engt
h v
u [M
Pa]
Test data by Hsu 1968
Size Effect on Columns Prestressed Beam Flexure
Composite Beams andOther Types of Failure
See Bazantrsquos website
Code Articles Requiring Size Effectbull shear of beams without
and with stirrupsbull torsion of beams bull punching of slabs bull shear of deep beams bull bar splices and
development length bull all failures due to
compression crushing of concrete as in-- columns -- prestressed beams -- arches -- bearing strength -- strut-and-tie models
bull failure of composite beams due to failure of connections
EFFECT OF STIRRUPSbull Stirrups can push the size effect up by an order of magnitude of Dl0 but cannot prevent itbull Increasing stirrup ratio in large beams is ineffective and can even reduce the shear strength
Slide Number 70
Slide Number 71
Slide Number 72
Slide Number 73
Failure of Sleipner A Platform
How to Remedy Misleading CovertUnderstrength Factors in Codes
Slide Number 76
Revised Reliability Indices
Slide Number 78
Slide Number 79
II Size Effect in Punching Shear of RC Slabs
Formulae in Main Design Codes
Database Filteringto reveal the size effect trend without any calculations
Slide Number 83
Slide Number 84
Calibration of M7 by Multivariate Regression of Test Data for Effect of Other Parameters
Slide Number 86
Slide Number 87
Proposed model and calibration by multivariate regression
Slide Number 89
Slide Number 90
Slide Number 91
Slide Number 92
Slide Number 93
Slide Number 94
Slide Number 95
Code Articles Requiring Size Effect
Slide Number 97
II Size Effect in Punching Shear of RC Slabs
ACI-445C-Database for Punching of Slabs
440 Tests (60 researchers)d (effective depth of slabs) ranges from 118 in to 263 in (from 30 to 668 mm)fc (concrete strength) ranges from 1160 to 17114 psi (from 8 to 118 MPa)ρ (longit reinforcement ratio) ranges from 01 to 73
Formulae in Main Design Codes
Vc=total capacityb0=control perimeterb0E=control perimeter (EC)d =effective depthfc =concrete strengthξ =Size effect term in ECρ =reinforcement ratio (longitudinal)ψ =slab rotation term (MC)θ =size effect term in proposed model
Asymptotic slope -1 isimpossible
Database Filteringto reveal the size effect
trend without any calculations
Unfiltered
Filtered mean steel ratio
Filtered mean bd
Filtered mean cb
Database filtering(continued)
Mean steel ratios
Mean bd
Mean cb
Premise1) The tests relevant to size effect are limited and not scaled2) Microplane model M7 gives generally excellent fits of test data on concrete failures
Approachbull Calibrate M7 parameters by fitting existing
test data with limited size range and different structural geometries
bull Then use calibrated M7 to predict the size effect by simulating scaled specimens
Calibration of M7 by Multivariate Regression
of Test Data for Effect of Other Parameters
Tests by Elstner and Hognestad 1956 Tests by Lips et al 2012
Cross points hold for finite element analysis results (simulations of the experimental works)Circle points hold for the experimental resultsSolid lines refer to the size effect fit of the FEM results
Verification with microplane model M7 for slabs without shear reinforcement
Tests by Bazant and Cao 1987
Tests by Regan 1986
Tests by Guandalini and Muttoni 2009
Tests by Li 2000
Verification with microplane model for slabs with shear reinforcement
Load-Deflection curves of tests and corresponding FEMs
Notperfectlyscaledspecimens(1 16)
Finite element models and corresponding fracture patterns
Perfectly scaled FEM without and with shear reinforcement
Tests of Birkle
Tests of Lips et al
Test data of Birkle 2004 and fits by proposed size effect equaton
Proposed model and calibration by multivariate
regression
D = slab thickness c = side of column b = its perimeter
Data normalized by v0
Size Effect in Torsion
Type I
Bažant Z P and Sener S ldquoSize Effect in Torsional Failure of Concrete Beamsrdquo Journal of Structural Engineering V 113 No 10 1987 pp 2125-2136 90
II Size Effect in Torsional FailuresPlain concrete beams solid cross sections
Size effect plot (log-scale) Failure pattern
MODEL
AFTER TESTTests by Bazant Sener 1987
91
Size Effect on Torsional Failure
bull 3 sizes tested in lab d = 15rdquo 3rdquo 6rdquo)bull Size range extended using microplane model M7 to 113bull Type I failure ndash as soon as peak torque is reached
Scaled computed torque-twist curves
T T
max
Twist (deg)
Bažant Z P and Sener S ldquoSize Effect in Torsional Failure of Concrete Beamsrdquo Journal of Structural Engineering V 113 No 10 1987 pp 2125-2136
Plain concrete beams ndash reduced scale tests
Hsu T T C ldquoTorsion of Structural ConcretemdashPlain Concrete Rectangular Sectionsrdquo Torsion of Structural Concrete SP-18 American Concrete Institute Farmington Hills MI Jan 1968 pp 203-238 92
Torsional failures model validationPlain concrete beams tested by Hsu (1968)
10rdquox20rdquo
10rdquox15rdquo
10rdquox10rdquo
6rdquox195rdquo
6rdquox11rdquo
bull Effects of size (and shape) observed in tests bull Model predictions match tests very well ndash lends
confidence to the model
Hsu T T C ldquoTorsion of Structural ConcretemdashBehavior of Reinforced Concrete Rectangular Membersrdquo Torsion of Structural Concrete SP-18 Am Concrete Institute Farmington Hills MI
93
Torsion of RC Beams Model Validation
bull Note Strong effect of reinforcement ratiobull Predictions by calibrated model match tests very
well ndash lends confidence to the model
B1B1
B2 B3
B4B5
B6
94
Size effect in torsional failuressInterestingly is of Type 1 even with stirrups
Reinforced Concrete Beams (Hsu 1968)Without stirrups With stirrups
Size D [mm] ndash log scale
Kirane K Darun Singh and Bažant Z P ldquoSize Effect In The Torsional Strength Of Plain And Reinforced Concreterdquo submitted to ACI Structural J
Pure prediction - no test data
Nom
inal
str
engt
h v
u [M
Pa]
Test data by Hsu 1968
Size Effect on Columns Prestressed Beam Flexure
Composite Beams andOther Types of Failure
See Bazantrsquos website
Code Articles Requiring Size Effectbull shear of beams without
and with stirrupsbull torsion of beams bull punching of slabs bull shear of deep beams bull bar splices and
development length bull all failures due to
compression crushing of concrete as in-- columns -- prestressed beams -- arches -- bearing strength -- strut-and-tie models
bull failure of composite beams due to failure of connections
EFFECT OF STIRRUPSbull Stirrups can push the size effect up by an order of magnitude of Dl0 but cannot prevent itbull Increasing stirrup ratio in large beams is ineffective and can even reduce the shear strength
Slide Number 70
Slide Number 71
Slide Number 72
Slide Number 73
Failure of Sleipner A Platform
How to Remedy Misleading CovertUnderstrength Factors in Codes
Slide Number 76
Revised Reliability Indices
Slide Number 78
Slide Number 79
II Size Effect in Punching Shear of RC Slabs
Formulae in Main Design Codes
Database Filteringto reveal the size effect trend without any calculations
Slide Number 83
Slide Number 84
Calibration of M7 by Multivariate Regression of Test Data for Effect of Other Parameters
Slide Number 86
Slide Number 87
Proposed model and calibration by multivariate regression
Slide Number 89
Slide Number 90
Slide Number 91
Slide Number 92
Slide Number 93
Slide Number 94
Slide Number 95
Code Articles Requiring Size Effect
Slide Number 97
Formulae in Main Design Codes
Vc=total capacityb0=control perimeterb0E=control perimeter (EC)d =effective depthfc =concrete strengthξ =Size effect term in ECρ =reinforcement ratio (longitudinal)ψ =slab rotation term (MC)θ =size effect term in proposed model
Asymptotic slope -1 isimpossible
Database Filteringto reveal the size effect
trend without any calculations
Unfiltered
Filtered mean steel ratio
Filtered mean bd
Filtered mean cb
Database filtering(continued)
Mean steel ratios
Mean bd
Mean cb
Premise1) The tests relevant to size effect are limited and not scaled2) Microplane model M7 gives generally excellent fits of test data on concrete failures
Approachbull Calibrate M7 parameters by fitting existing
test data with limited size range and different structural geometries
bull Then use calibrated M7 to predict the size effect by simulating scaled specimens
Calibration of M7 by Multivariate Regression
of Test Data for Effect of Other Parameters
Tests by Elstner and Hognestad 1956 Tests by Lips et al 2012
Cross points hold for finite element analysis results (simulations of the experimental works)Circle points hold for the experimental resultsSolid lines refer to the size effect fit of the FEM results
Verification with microplane model M7 for slabs without shear reinforcement
Tests by Bazant and Cao 1987
Tests by Regan 1986
Tests by Guandalini and Muttoni 2009
Tests by Li 2000
Verification with microplane model for slabs with shear reinforcement
Load-Deflection curves of tests and corresponding FEMs
Notperfectlyscaledspecimens(1 16)
Finite element models and corresponding fracture patterns
Perfectly scaled FEM without and with shear reinforcement
Tests of Birkle
Tests of Lips et al
Test data of Birkle 2004 and fits by proposed size effect equaton
Proposed model and calibration by multivariate
regression
D = slab thickness c = side of column b = its perimeter
Data normalized by v0
Size Effect in Torsion
Type I
Bažant Z P and Sener S ldquoSize Effect in Torsional Failure of Concrete Beamsrdquo Journal of Structural Engineering V 113 No 10 1987 pp 2125-2136 90
II Size Effect in Torsional FailuresPlain concrete beams solid cross sections
Size effect plot (log-scale) Failure pattern
MODEL
AFTER TESTTests by Bazant Sener 1987
91
Size Effect on Torsional Failure
bull 3 sizes tested in lab d = 15rdquo 3rdquo 6rdquo)bull Size range extended using microplane model M7 to 113bull Type I failure ndash as soon as peak torque is reached
Scaled computed torque-twist curves
T T
max
Twist (deg)
Bažant Z P and Sener S ldquoSize Effect in Torsional Failure of Concrete Beamsrdquo Journal of Structural Engineering V 113 No 10 1987 pp 2125-2136
Plain concrete beams ndash reduced scale tests
Hsu T T C ldquoTorsion of Structural ConcretemdashPlain Concrete Rectangular Sectionsrdquo Torsion of Structural Concrete SP-18 American Concrete Institute Farmington Hills MI Jan 1968 pp 203-238 92
Torsional failures model validationPlain concrete beams tested by Hsu (1968)
10rdquox20rdquo
10rdquox15rdquo
10rdquox10rdquo
6rdquox195rdquo
6rdquox11rdquo
bull Effects of size (and shape) observed in tests bull Model predictions match tests very well ndash lends
confidence to the model
Hsu T T C ldquoTorsion of Structural ConcretemdashBehavior of Reinforced Concrete Rectangular Membersrdquo Torsion of Structural Concrete SP-18 Am Concrete Institute Farmington Hills MI
93
Torsion of RC Beams Model Validation
bull Note Strong effect of reinforcement ratiobull Predictions by calibrated model match tests very
well ndash lends confidence to the model
B1B1
B2 B3
B4B5
B6
94
Size effect in torsional failuressInterestingly is of Type 1 even with stirrups
Reinforced Concrete Beams (Hsu 1968)Without stirrups With stirrups
Size D [mm] ndash log scale
Kirane K Darun Singh and Bažant Z P ldquoSize Effect In The Torsional Strength Of Plain And Reinforced Concreterdquo submitted to ACI Structural J
Pure prediction - no test data
Nom
inal
str
engt
h v
u [M
Pa]
Test data by Hsu 1968
Size Effect on Columns Prestressed Beam Flexure
Composite Beams andOther Types of Failure
See Bazantrsquos website
Code Articles Requiring Size Effectbull shear of beams without
and with stirrupsbull torsion of beams bull punching of slabs bull shear of deep beams bull bar splices and
development length bull all failures due to
compression crushing of concrete as in-- columns -- prestressed beams -- arches -- bearing strength -- strut-and-tie models
bull failure of composite beams due to failure of connections
EFFECT OF STIRRUPSbull Stirrups can push the size effect up by an order of magnitude of Dl0 but cannot prevent itbull Increasing stirrup ratio in large beams is ineffective and can even reduce the shear strength
Slide Number 70
Slide Number 71
Slide Number 72
Slide Number 73
Failure of Sleipner A Platform
How to Remedy Misleading CovertUnderstrength Factors in Codes
Slide Number 76
Revised Reliability Indices
Slide Number 78
Slide Number 79
II Size Effect in Punching Shear of RC Slabs
Formulae in Main Design Codes
Database Filteringto reveal the size effect trend without any calculations
Slide Number 83
Slide Number 84
Calibration of M7 by Multivariate Regression of Test Data for Effect of Other Parameters
Slide Number 86
Slide Number 87
Proposed model and calibration by multivariate regression
Slide Number 89
Slide Number 90
Slide Number 91
Slide Number 92
Slide Number 93
Slide Number 94
Slide Number 95
Code Articles Requiring Size Effect
Slide Number 97
Code Articles Requiring Size Effectbull shear of beams without
and with stirrupsbull torsion of beams bull punching of slabs bull shear of deep beams bull bar splices and
development length bull all failures due to
compression crushing of concrete as in-- columns -- prestressed beams -- arches -- bearing strength -- strut-and-tie models
bull failure of composite beams due to failure of connections
EFFECT OF STIRRUPSbull Stirrups can push the size effect up by an order of magnitude of Dl0 but cannot prevent itbull Increasing stirrup ratio in large beams is ineffective and can even reduce the shear strength
Slide Number 70
Slide Number 71
Slide Number 72
Slide Number 73
Failure of Sleipner A Platform
How to Remedy Misleading CovertUnderstrength Factors in Codes
Slide Number 76
Revised Reliability Indices
Slide Number 78
Slide Number 79
II Size Effect in Punching Shear of RC Slabs
Formulae in Main Design Codes
Database Filteringto reveal the size effect trend without any calculations
Slide Number 83
Slide Number 84
Calibration of M7 by Multivariate Regression of Test Data for Effect of Other Parameters
Slide Number 86
Slide Number 87
Proposed model and calibration by multivariate regression