Embed Size (px)
Citation preview
SIX SIGMA IMPLEMENTATION: AN EMPIRICAL ANALYSIS OF CRITICAL SUCCESS FACTORS AND PERFORMANCE OUTCOMES
Rebecca M. Galloway Department of Economics and Business Administration
Universiteit Maastricht Herbenusstraat 21
6211 RA Maastricht, The Netherlands [email protected]
ABSTRACT
Using cross-sectional and time series data, this paper analyzes empirically the relationship between Six Sigma implementation and firm Total Sales (TS), Return on Assets (ROA), Return on Sales (ROS), and Sales Growth (SG). A separate analysis examines Six Sigma’s impact on managerial perceptions of financial outcomes (ROI, cost reduction, and revenue enhancement). The key factors that moderate the relationship between Six Sigma implementation and firm performance are also considered. The data pertain to 50 companies (49 American, 1 South African) that have implemented Six Sigma for at least one year and represent nine different industries. The results indicate that a firm’s ability to track the status and financial outcomes of all Six Sigma projects, the maturity of the implementation, the selection of strategically-aligned projects, the integration of Design for Six Sigma (DFSS) into projects, and the breadth of the implementation have a statistically significant impact on subjective and/or objective performance measures.
JEL Codes: M10, E32 Keywords: Six Sigma, financial performance, critical success factors
2
ACKNOWLEDGEMENTS
The following people and organizations deserve recognition for sharing their expertise and
knowledge and/or for their assistance and support throughout the research process:
Mr. David Galloway, Six Sigma Certified Black Belt, NewPage Corporation
Ms. Leesa Galloway, my mother
Dr. Bram Foubert, Assistant Professor (thesis advisor), Universiteit Maastricht
Mr. Robert Crescenzi, VP Business Excellence, NewPage Corporation
Mr. Jay Buchholtz, Certified Master Black Belt, NewPage Corporation
Mr. Michael Pestorius, Director Six Sigma Deployment, Sanofi-Aventis
Mr. Michael Marx, Founder and Research Manager, www.isixsigma.com
Ms. Rachel Regan, LEI Forums Moderator, www.lean.org
Many thanks to all of the quality managers and consultants in the United States and abroad
who took the time to complete my survey and contribute their valuable knowledge to this
research!

3
Table of contents
Table of contents....................................................................................................................................3
1. Introduction .......................................................................................................................................4
1.1 Research Question & Sub-Questions...............................................................................................10
1.2 Study Contribution and Research Approach ...................................................................................13
2. L iterature Review ............................................................................................................................14
2.1 Maturity of Implementation ............................................................................................................15
2.2 Strategic Alignment .........................................................................................................................15
2.3 Cadre of Change Leaders................................................................................................................17
2.4 Organizational Structure and Learning ..........................................................................................17
2.5 Lean Six Sigma (LSS) and Design for Six Sigma (DFSS)................................................................18
2.6 Bottom-line Focus............................................................................................................................20
2.7 Top Management Commitment........................................................................................................20
2.8 Firm Size and Industry.....................................................................................................................21
2.9 Model of Key Success Factors and Performance Outcomes of Six Sigma Implementation ............21
3. Research Methodology ....................................................................................................................22
3.1 Sample .............................................................................................................................................22
3.2 Data .................................................................................................................................................23
3.3 Model Specification and Estimation................................................................................................24
3.4 Descriptive Statistics .......................................................................................................................28
4. Estimation Procedure and Empir ical Results...............................................................................29
4.1 Model 1............................................................................................................................................29
4.2 Models 2-4 .......................................................................................................................................32
4.3 Models 5-8 .......................................................................................................................................33
5. Discussion .........................................................................................................................................35
6. Conclusion ........................................................................................................................................37
6.1 Theoretical Implications..................................................................................................................37
6.2 Managerial Implications .................................................................................................................38
6.3 Limitations and Suggestions for Further Research .........................................................................39
References.............................................................................................................................................41
Appendix...............................................................................................................................................48
4
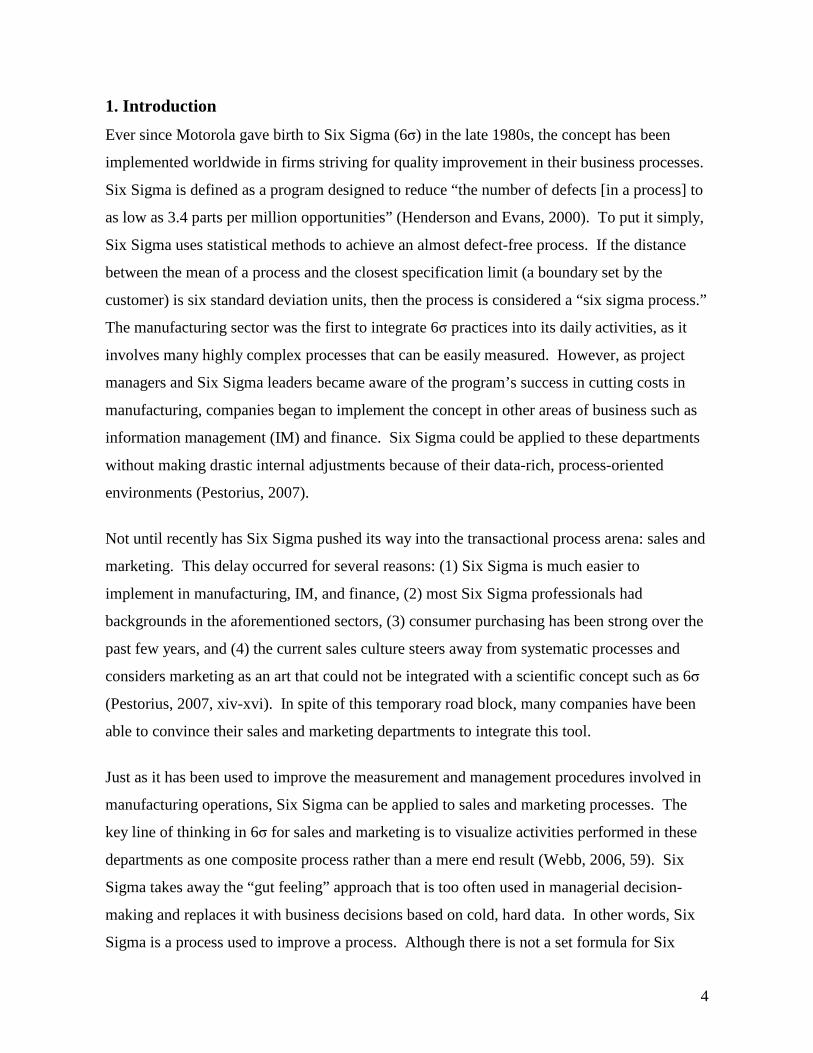
1. Introduction
Ever since Motorola gave birth to Six Sigma (6 ) in the late 1980s, the concept has been
implemented worldwide in firms striving for quality improvement in their business processes.
Six Sigma is defined as a program designed to reduce “ the number of defects [in a process] to
as low as 3.4 parts per million opportunities” (Henderson and Evans, 2000). To put it simply,
Six Sigma uses statistical methods to achieve an almost defect-free process. If the distance
between the mean of a process and the closest specification limit (a boundary set by the
customer) is six standard deviation units, then the process is considered a “six sigma process.”
The manufacturing sector was the first to integrate 6 practices into its daily activities, as it
involves many highly complex processes that can be easily measured. However, as project
managers and Six Sigma leaders became aware of the program’s success in cutting costs in
manufacturing, companies began to implement the concept in other areas of business such as
information management (IM) and finance. Six Sigma could be applied to these departments
without making drastic internal adjustments because of their data-rich, process-oriented
environments (Pestorius, 2007).
Not until recently has Six Sigma pushed its way into the transactional process arena: sales and
marketing. This delay occurred for several reasons: (1) Six Sigma is much easier to
implement in manufacturing, IM, and finance, (2) most Six Sigma professionals had
backgrounds in the aforementioned sectors, (3) consumer purchasing has been strong over the
past few years, and (4) the current sales culture steers away from systematic processes and
considers marketing as an art that could not be integrated with a scientific concept such as 6
(Pestorius, 2007, xiv-xvi). In spite of this temporary road block, many companies have been
able to convince their sales and marketing departments to integrate this tool.
Just as it has been used to improve the measurement and management procedures involved in
manufacturing operations, Six Sigma can be applied to sales and marketing processes. The
key line of thinking in 6 for sales and marketing is to visualize activities performed in these
departments as one composite process rather than a mere end result (Webb, 2006, 59). Six
Sigma takes away the “gut feeling” approach that is too often used in managerial decision-
making and replaces it with business decisions based on cold, hard data. In other words, Six
Sigma is a process used to improve a process. Although there is not a set formula for Six
5
Generate Potential Solutions
Select & Test Solution
Create Control & Monitoring
Plan
Implement Full Scale Solution
Finalize Transition
Identify Potential
Causes (x’s)
Investigate Significance of
x’s
ID Sig. Causes to focus on
y=f(x’s)
Define & Scope Problem
Determine Project
Objective & Benefits
Create Project Charter
Define ‘As Is’ Process
Validate Measurement
System for Outputs
Quantify Process
Performance
Control Improve Analyze Measure Define
Develop Implementation
Plan
Tollgate Tollgate Tollgate Tollgate Close Project
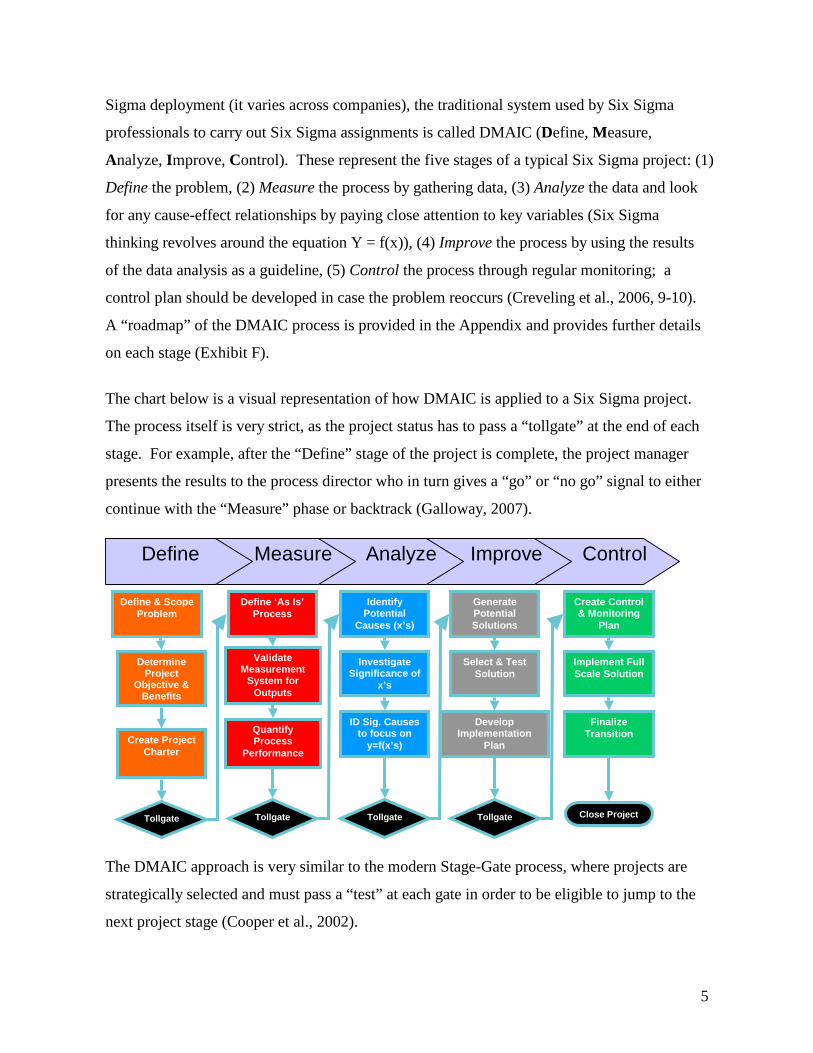
Sigma deployment (it varies across companies), the traditional system used by Six Sigma
professionals to carry out Six Sigma assignments is called DMAIC (Define, Measure,
Analyze, Improve, Control). These represent the five stages of a typical Six Sigma project: (1)
Define the problem, (2) Measure the process by gathering data, (3) Analyze the data and look
for any cause-effect relationships by paying close attention to key variables (Six Sigma
thinking revolves around the equation Y = f(x)), (4) Improve the process by using the results
of the data analysis as a guideline, (5) Control the process through regular monitoring; a
control plan should be developed in case the problem reoccurs (Creveling et al., 2006, 9-10).
A “ roadmap” of the DMAIC process is provided in the Appendix and provides further details
on each stage (Exhibit F).
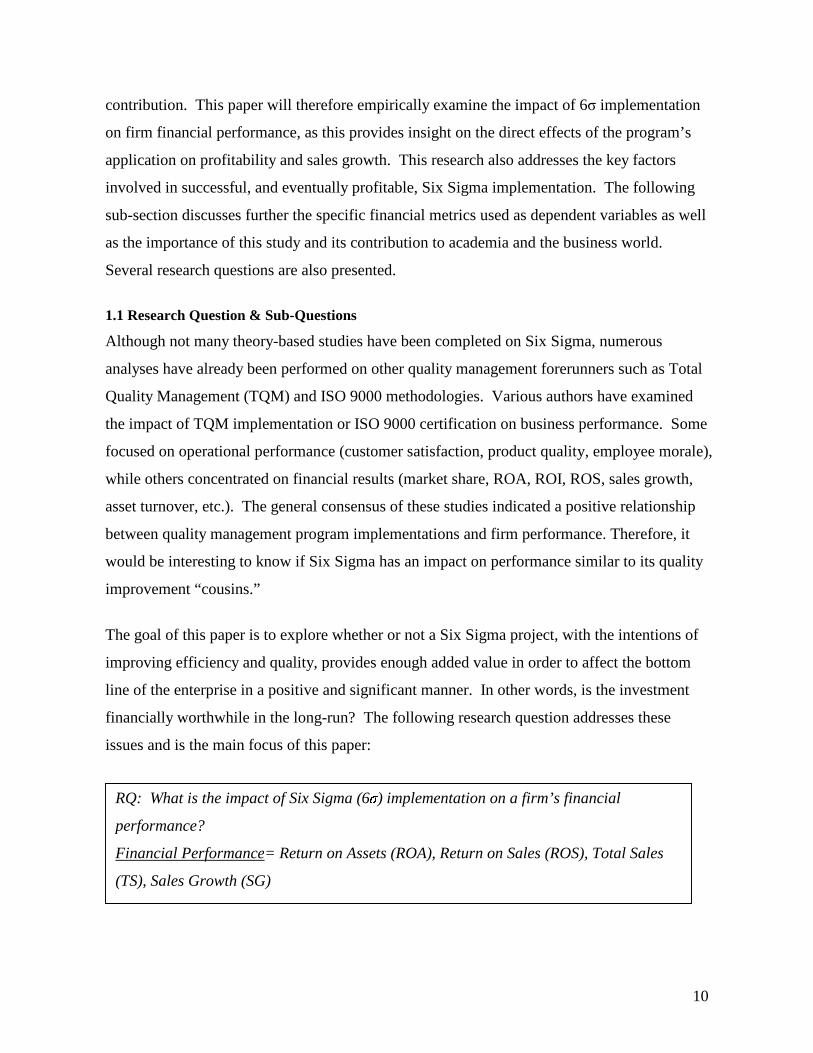
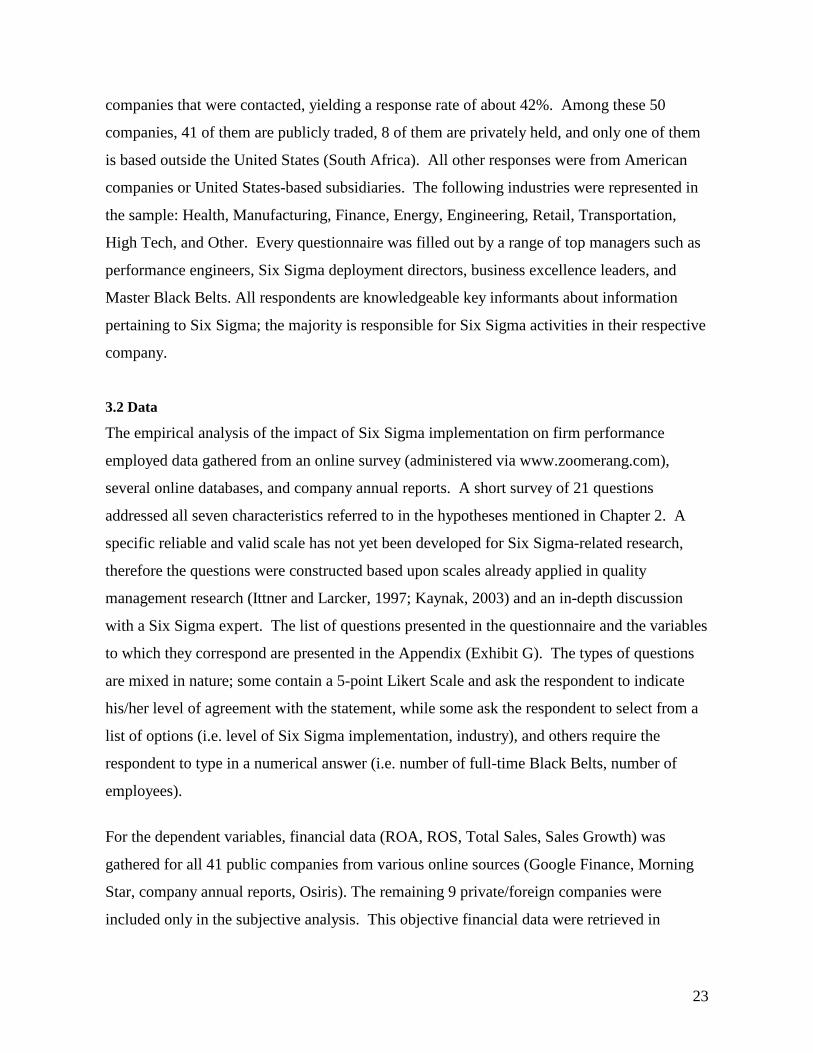
The chart below is a visual representation of how DMAIC is applied to a Six Sigma project.
The process itself is very strict, as the project status has to pass a “ tollgate” at the end of each
stage. For example, after the “Define” stage of the project is complete, the project manager
presents the results to the process director who in turn gives a “go” or “no go” signal to either
continue with the “Measure” phase or backtrack (Galloway, 2007).
The DMAIC approach is very similar to the modern Stage-Gate process, where projects are
strategically selected and must pass a “ test” at each gate in order to be eligible to jump to the
next project stage (Cooper et al., 2002).
6
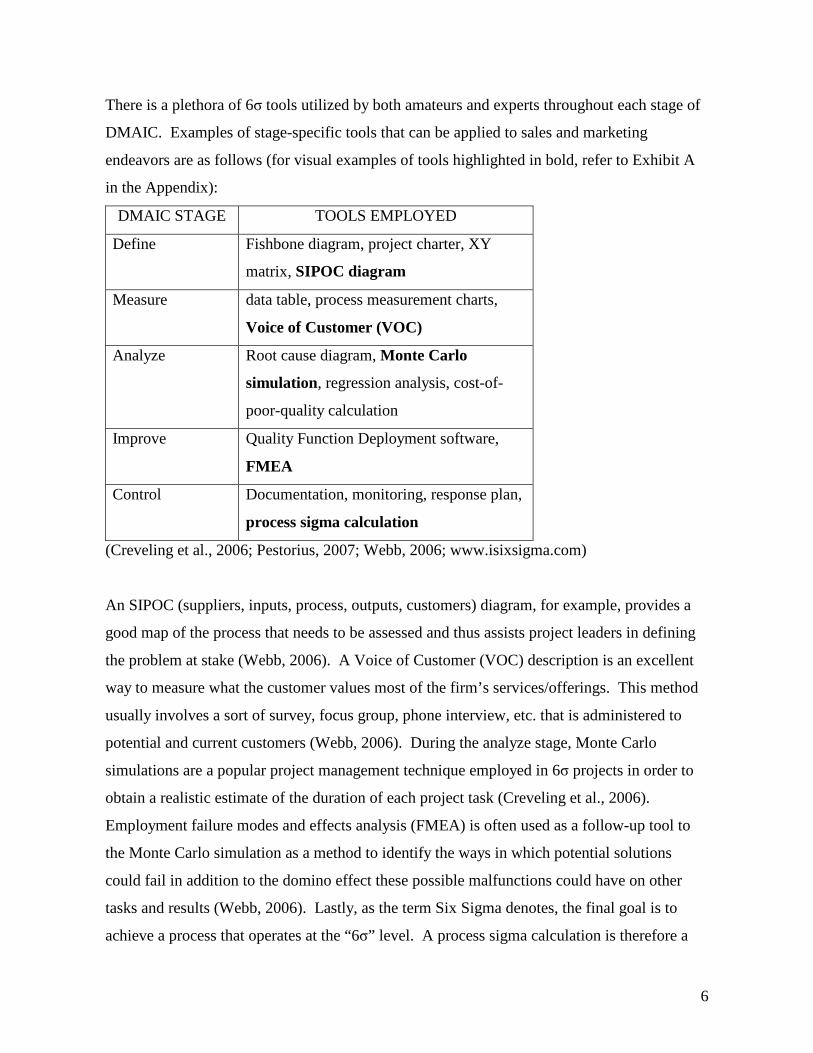
There is a plethora of 6 tools utilized by both amateurs and experts throughout each stage of
DMAIC. Examples of stage-specific tools that can be applied to sales and marketing
endeavors are as follows (for visual examples of tools highlighted in bold, refer to Exhibit A
in the Appendix):
DMAIC STAGE TOOLS EMPLOYED
Define Fishbone diagram, project charter, XY
matrix, SIPOC diagram
Measure data table, process measurement charts,
Voice of Customer (VOC)
Analyze Root cause diagram, Monte Car lo
simulation, regression analysis, cost-of-
poor-quality calculation
Improve Quality Function Deployment software,
FMEA
Control Documentation, monitoring, response plan,
process sigma calculation
(Creveling et al., 2006; Pestorius, 2007; Webb, 2006; www.isixsigma.com)
An SIPOC (suppliers, inputs, process, outputs, customers) diagram, for example, provides a
good map of the process that needs to be assessed and thus assists project leaders in defining
the problem at stake (Webb, 2006). A Voice of Customer (VOC) description is an excellent
way to measure what the customer values most of the firm’s services/offerings. This method
usually involves a sort of survey, focus group, phone interview, etc. that is administered to
potential and current customers (Webb, 2006). During the analyze stage, Monte Carlo
simulations are a popular project management technique employed in 6 projects in order to
obtain a realistic estimate of the duration of each project task (Creveling et al., 2006).
Employment failure modes and effects analysis (FMEA) is often used as a follow-up tool to
the Monte Carlo simulation as a method to identify the ways in which potential solutions
could fail in addition to the domino effect these possible malfunctions could have on other
tasks and results (Webb, 2006). Lastly, as the term Six Sigma denotes, the final goal is to
achieve a process that operates at the “6 ” level. A process sigma calculation is therefore a
7
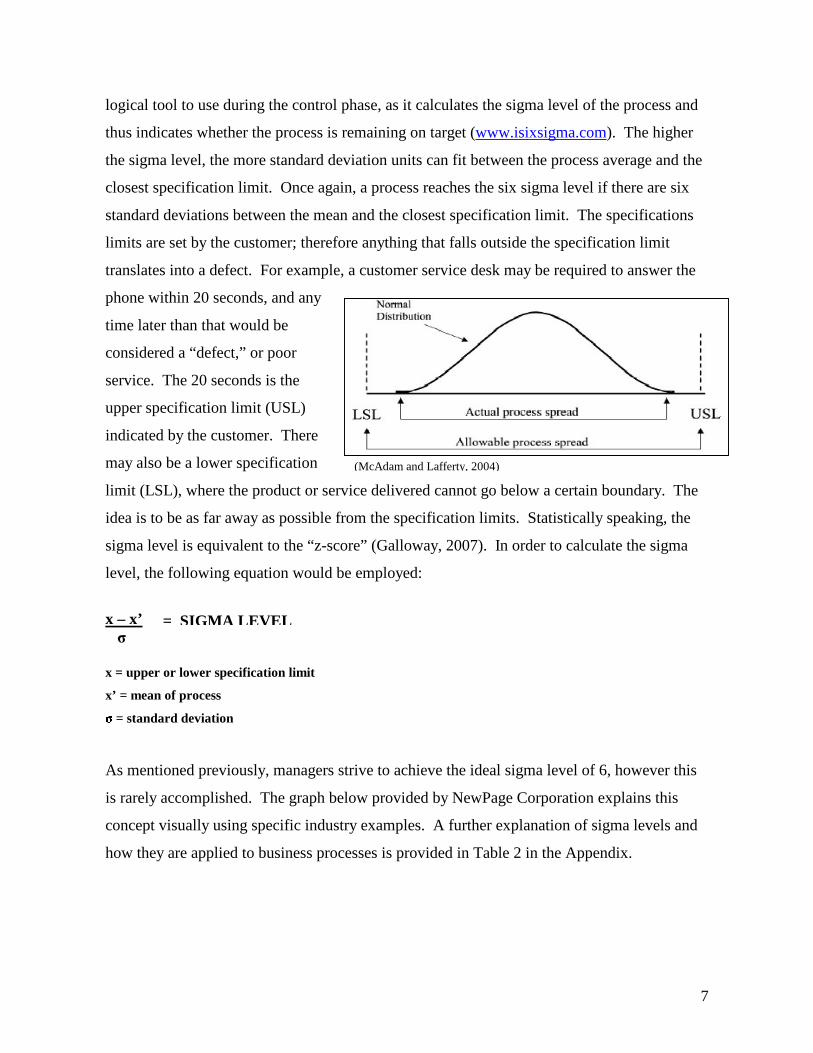
logical tool to use during the control phase, as it calculates the sigma level of the process and
thus indicates whether the process is remaining on target (www.isixsigma.com). The higher
the sigma level, the more standard deviation units can fit between the process average and the
closest specification limit. Once again, a process reaches the six sigma level if there are six
standard deviations between the mean and the closest specification limit. The specifications
limits are set by the customer; therefore anything that falls outside the specification limit
translates into a defect. For example, a customer service desk may be required to answer the
phone within 20 seconds, and any
time later than that would be
considered a “defect,” or poor
service. The 20 seconds is the
upper specification limit (USL)
indicated by the customer. There
may also be a lower specification
limit (LSL), where the product or service delivered cannot go below a certain boundary. The
idea is to be as far away as possible from the specification limits. Statistically speaking, the
sigma level is equivalent to the “z-score” (Galloway, 2007). In order to calculate the sigma
level, the following equation would be employed:
x – x’
x = upper or lower specification limit
x’ = mean of process � = standard deviation
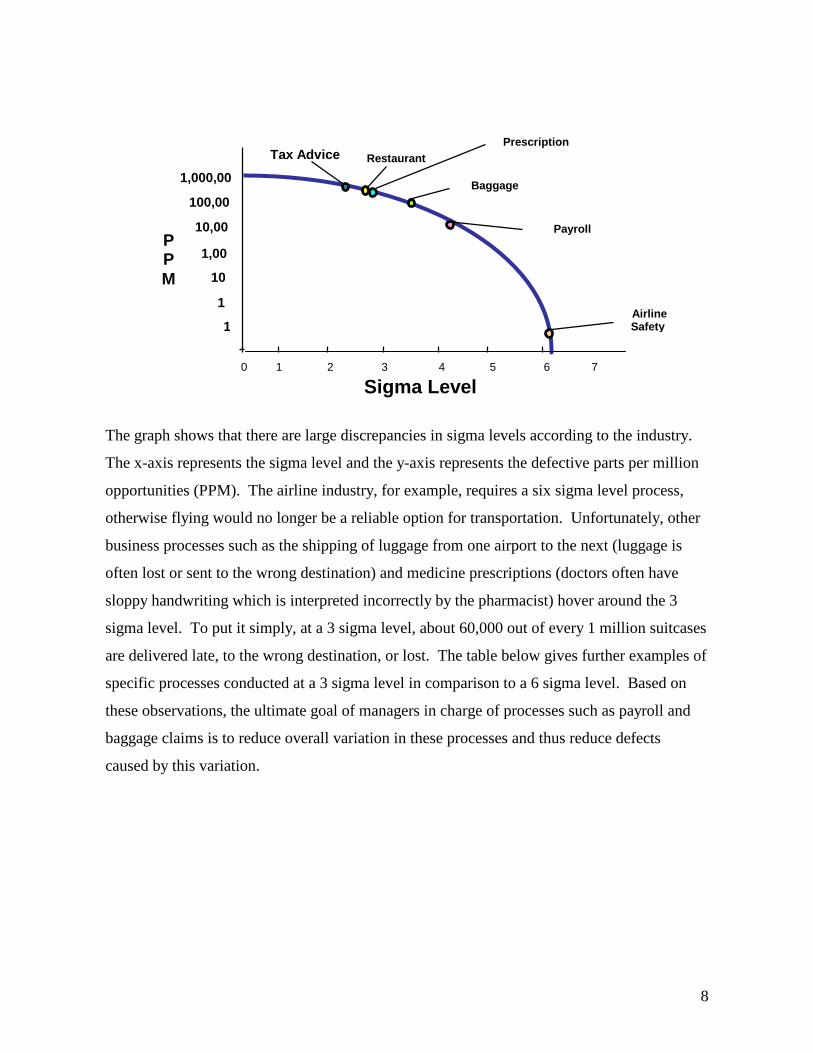
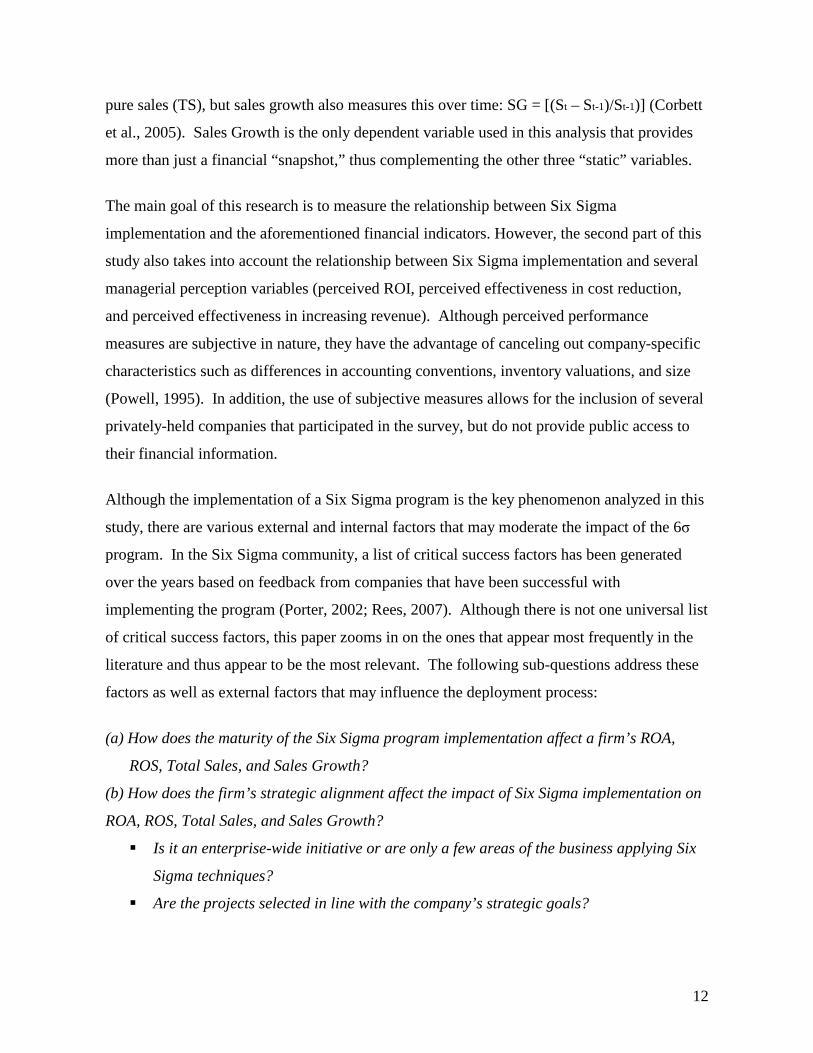
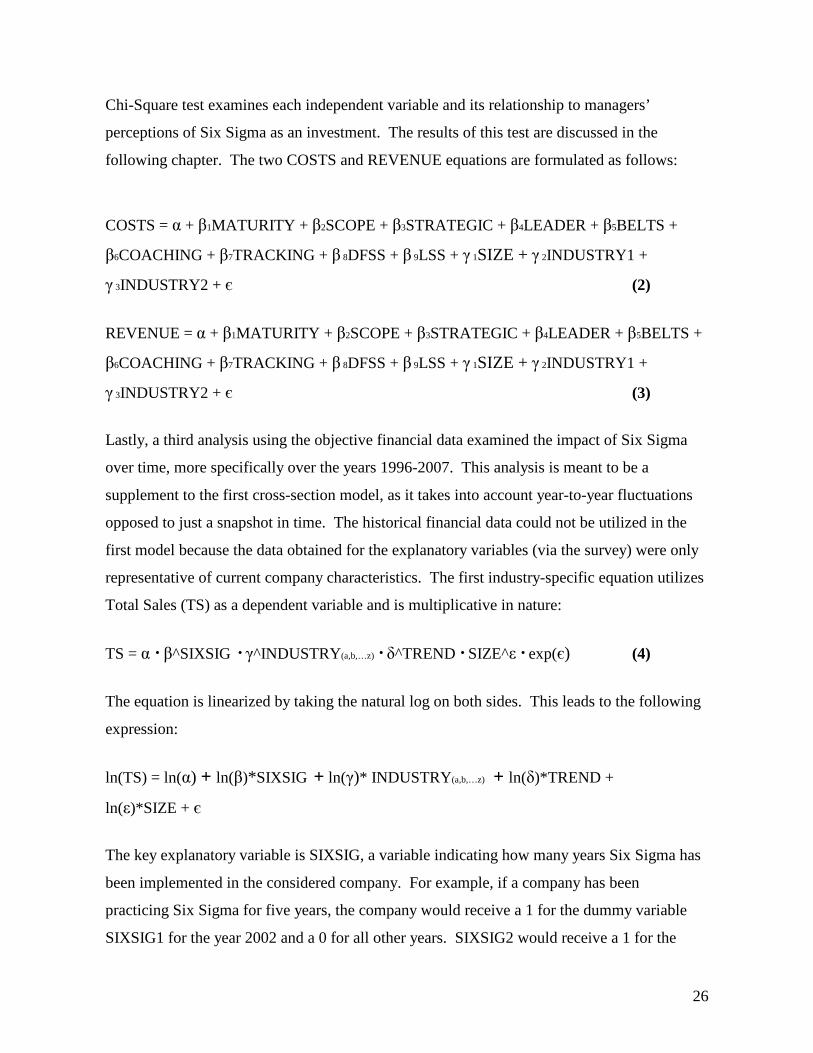
As mentioned previously, managers strive to achieve the ideal sigma level of 6, however this
is rarely accomplished. The graph below provided by NewPage Corporation explains this
concept visually using specific industry examples. A further explanation of sigma levels and
how they are applied to business processes is provided in Table 2 in the Appendix.
= SIGMA LEVEL
(McAdam and Lafferty, 2004)
8
Tax Advice
Sigma Level
1,000,000
100,000 10,000 1,000
100 10 1
PPM
Restaurant Bills
Payroll Processing
Prescription Writing
Baggage Handling
Airline Safety
0 1 2 3 4 5 6 7
The graph shows that there are large discrepancies in sigma levels according to the industry.
The x-axis represents the sigma level and the y-axis represents the defective parts per million
opportunities (PPM). The airline industry, for example, requires a six sigma level process,
otherwise flying would no longer be a reliable option for transportation. Unfortunately, other
business processes such as the shipping of luggage from one airport to the next (luggage is
often lost or sent to the wrong destination) and medicine prescriptions (doctors often have
sloppy handwriting which is interpreted incorrectly by the pharmacist) hover around the 3
sigma level. To put it simply, at a 3 sigma level, about 60,000 out of every 1 million suitcases
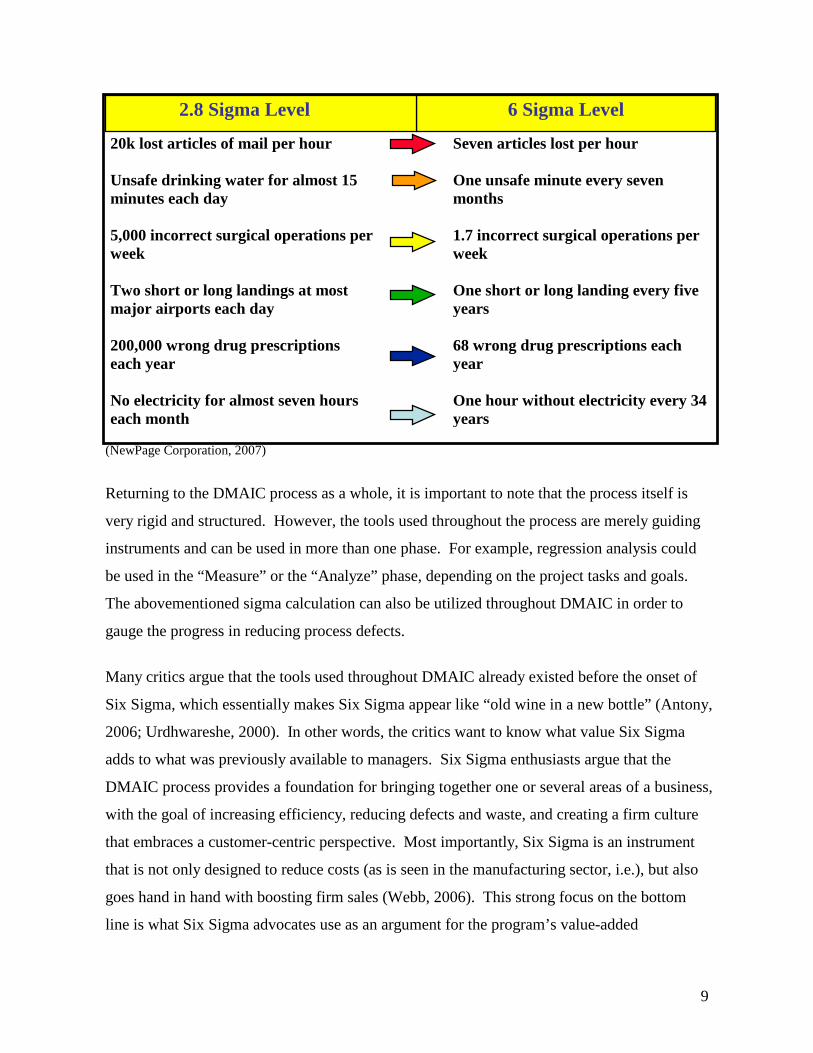
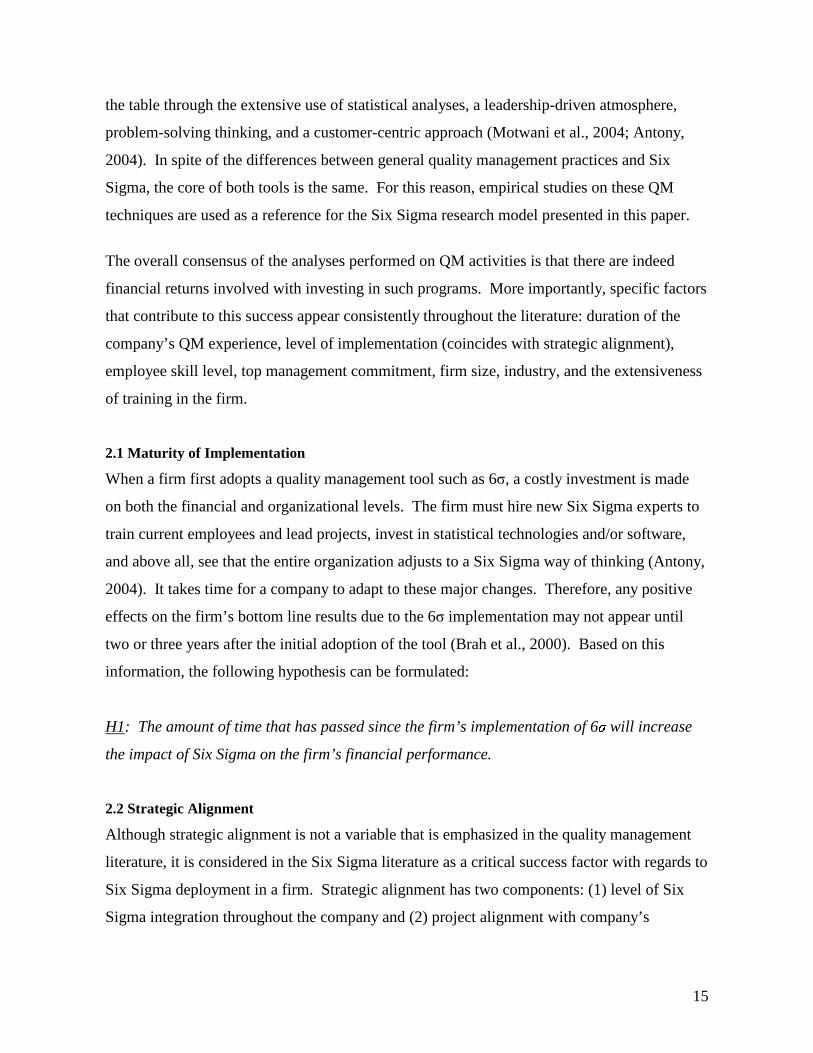
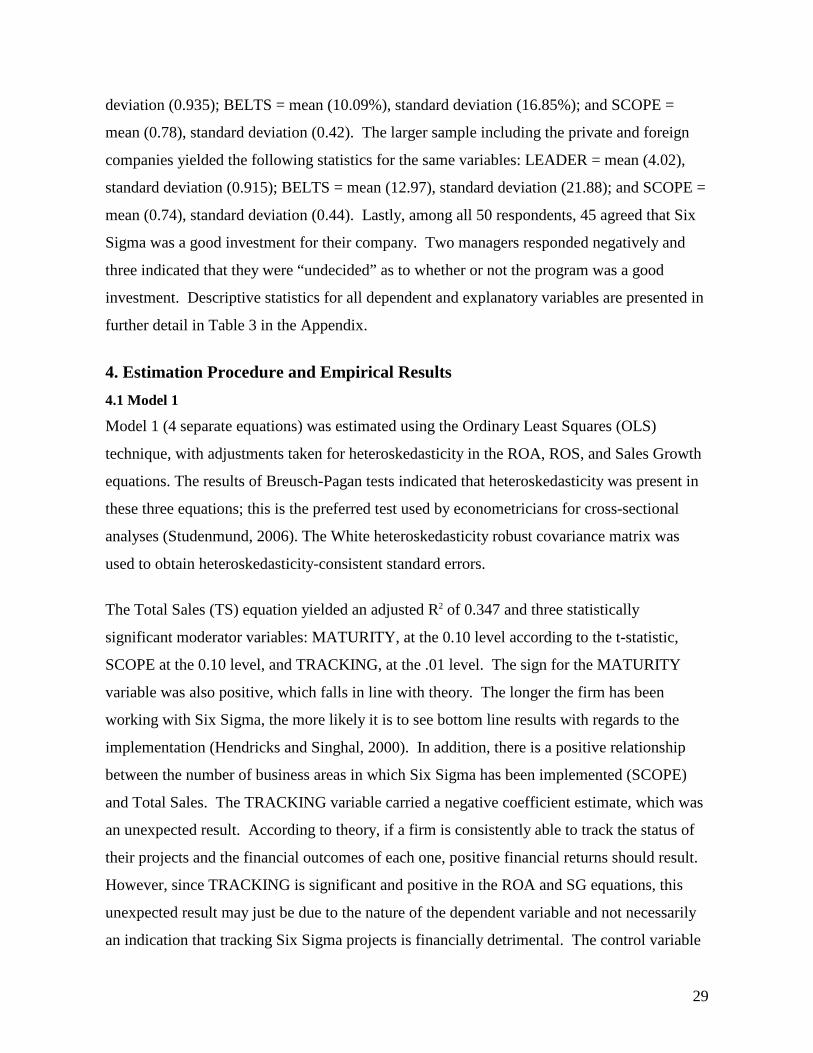
are delivered late, to the wrong destination, or lost. The table below gives further examples of
specific processes conducted at a 3 sigma level in comparison to a 6 sigma level. Based on
these observations, the ultimate goal of managers in charge of processes such as payroll and
baggage claims is to reduce overall variation in these processes and thus reduce defects
caused by this variation.
9
(NewPage Corporation, 2007)
Returning to the DMAIC process as a whole, it is important to note that the process itself is
very rigid and structured. However, the tools used throughout the process are merely guiding
instruments and can be used in more than one phase. For example, regression analysis could
be used in the “Measure” or the “Analyze” phase, depending on the project tasks and goals.
The abovementioned sigma calculation can also be utilized throughout DMAIC in order to
gauge the progress in reducing process defects.
Many critics argue that the tools used throughout DMAIC already existed before the onset of
Six Sigma, which essentially makes Six Sigma appear like “old wine in a new bottle” (Antony,
2006; Urdhwareshe, 2000). In other words, the critics want to know what value Six Sigma
adds to what was previously available to managers. Six Sigma enthusiasts argue that the
DMAIC process provides a foundation for bringing together one or several areas of a business,
with the goal of increasing efficiency, reducing defects and waste, and creating a firm culture
that embraces a customer-centric perspective. Most importantly, Six Sigma is an instrument
that is not only designed to reduce costs (as is seen in the manufacturing sector, i.e.), but also
goes hand in hand with boosting firm sales (Webb, 2006). This strong focus on the bottom
line is what Six Sigma advocates use as an argument for the program’s value-added
6 Sigma Level
20k lost ar ticles of mail per hour Unsafe dr inking water for almost 15 minutes each day 5,000 incorrect surgical operations per week Two shor t or long landings at most major airpor ts each day 200,000 wrong drug prescr iptions each year No electr icity for almost seven hours each month
Seven ar ticles lost per hour One unsafe minute every seven months 1.7 incorrect surgical operations per week One shor t or long landing every five years 68 wrong drug prescr iptions each year One hour without electr icity every 34 years
2.8 Sigma Level
10
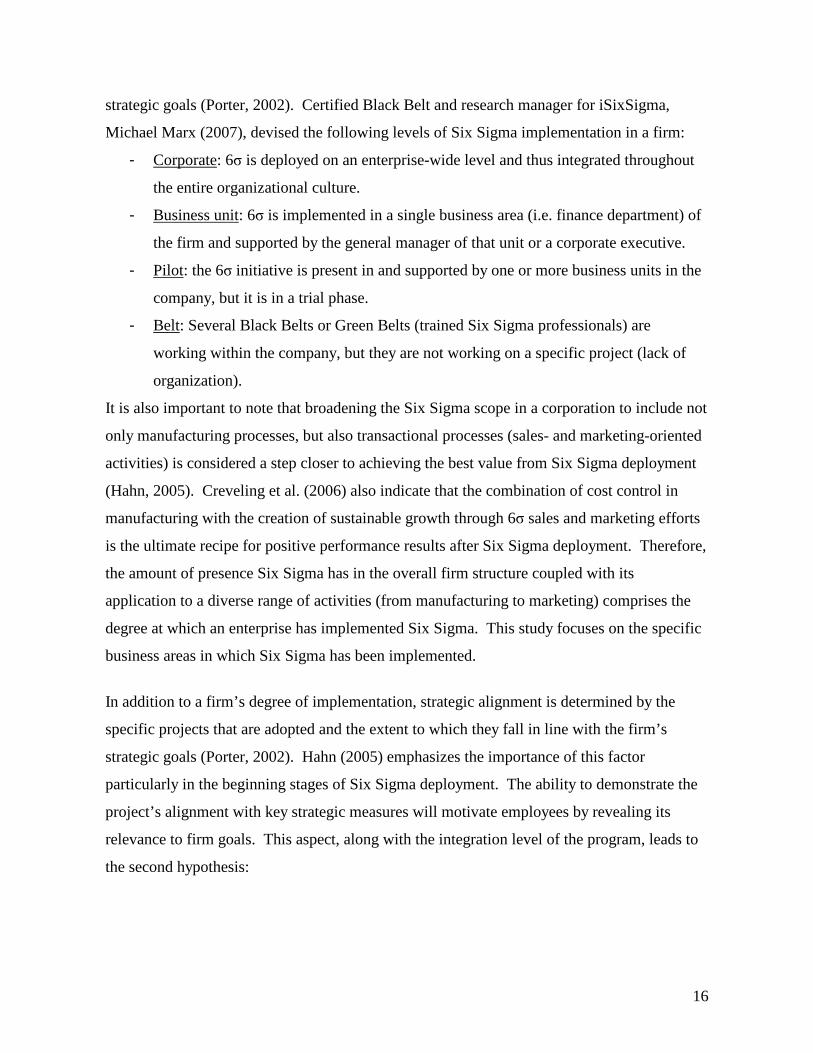
RQ: What is the impact of Six Sigma (6� ) implementation on a firm’s financial
performance?
Financial Performance= Return on Assets (ROA), Return on Sales (ROS), Total Sales
(TS), Sales Growth (SG)
contribution. This paper will therefore empirically examine the impact of 6 implementation
on firm financial performance, as this provides insight on the direct effects of the program’s
application on profitability and sales growth. This research also addresses the key factors
involved in successful, and eventually profitable, Six Sigma implementation. The following
sub-section discusses further the specific financial metrics used as dependent variables as well
as the importance of this study and its contribution to academia and the business world.
Several research questions are also presented.
1.1 Research Question & Sub-Questions
Although not many theory-based studies have been completed on Six Sigma, numerous
analyses have already been performed on other quality management forerunners such as Total
Quality Management (TQM) and ISO 9000 methodologies. Various authors have examined
the impact of TQM implementation or ISO 9000 certification on business performance. Some
focused on operational performance (customer satisfaction, product quality, employee morale),
while others concentrated on financial results (market share, ROA, ROI, ROS, sales growth,
asset turnover, etc.). The general consensus of these studies indicated a positive relationship
between quality management program implementations and firm performance. Therefore, it
would be interesting to know if Six Sigma has an impact on performance similar to its quality
improvement “cousins.”
The goal of this paper is to explore whether or not a Six Sigma project, with the intentions of
improving efficiency and quality, provides enough added value in order to affect the bottom
line of the enterprise in a positive and significant manner. In other words, is the investment
financially worthwhile in the long-run? The following research question addresses these
issues and is the main focus of this paper:

11
There is a multitude of financial indicator variables to choose from in the literature, however
this analysis equates financial performance with a combination of return on assets (ROA) and
three variations of sales measurements. There are several underlying reasons for the selection
of these specific variables: (1) many authors who have performed similar empirical research
on TQM or ISO 9000 certification have employed at least one or a combination of these
variables as metrics for financial performance (Mohrman et al., 1995; Powell, 1995; Adam et
al., 1997; Chenall, 1997; Ittner and Larcker 1997; Easton and Jarrell, 1998; Das et al., 2000;
Wilson and Collier, 2000; Douglas and Judge 2001; Kaynak, 2003; Corbett et al., 2005;
Feridun and Al-Khadesh, 2006), (2) these four variables together paint a complete financial
picture of firm performance by considering long-term growth, return on assets/capital, and the
cost of capital (Dobbs and Koller, 2005), and (3) the data for these financial indicators are
easily accessible via annual company reports posted online.
Six Sigma is designed to both reduce costs and/or increase sales depending on the goals of the
firm. ROA, ROS, TS, and SG represent interesting dependent variables for this study, as they
account for both cost reduction and fluctuations in sales over time. Return on Assets (ROA)
is measured by dividing the firm’s operating income by its total assets – before depreciation
(Corbett et al., 2005). This variable helps to control for the differences in capital intensities
among firms. For example, if a manufacturing firm (very asset-based with a lot of very
controlled processes) has a 4% growth in sales after Six Sigma implementation and a services
firm experiences the same percentage of sales growth, this looks like a perfect fairytale ending
for both companies. Unfortunately, this does not tell the whole story, as the manufacturing
firm could experience a negative ROA and the services firm a positive ROA despite their
identical growth in sales (Hendricks and Singhal, 2000). Return on Sales (ROS) is an
excellent metric to couple with ROA due to its power of explaining any changes in the
numerator of ROA (operating income) in addition to its ability to measure costs [ROS = 1-
(Cost of Goods Sold + General Expenses (SG&A))/Sales] (Corbett et al., 2005). ROS
captures any net profit changes, as it is calculated by dividing operating income (before
depreciation) by sales. Thus, although ROS is not needed to complete the financial story per
se, its explanatory ability in relation to the ROA variable is invaluable. Lastly, total sales (TS)
and sales growth (SG) are key variables because they not only pinpoint Six Sigma’s impact on
12
pure sales (TS), but sales growth also measures this over time: SG = [(St – St-1)/St-1)] (Corbett
et al., 2005). Sales Growth is the only dependent variable used in this analysis that provides
more than just a financial “snapshot,” thus complementing the other three “static” variables.
The main goal of this research is to measure the relationship between Six Sigma
implementation and the aforementioned financial indicators. However, the second part of this
study also takes into account the relationship between Six Sigma implementation and several
managerial perception variables (perceived ROI, perceived effectiveness in cost reduction,
and perceived effectiveness in increasing revenue). Although perceived performance
measures are subjective in nature, they have the advantage of canceling out company-specific
characteristics such as differences in accounting conventions, inventory valuations, and size
(Powell, 1995). In addition, the use of subjective measures allows for the inclusion of several
privately-held companies that participated in the survey, but do not provide public access to
their financial information.
Although the implementation of a Six Sigma program is the key phenomenon analyzed in this
study, there are various external and internal factors that may moderate the impact of the 6
program. In the Six Sigma community, a list of critical success factors has been generated
over the years based on feedback from companies that have been successful with
implementing the program (Porter, 2002; Rees, 2007). Although there is not one universal list
of critical success factors, this paper zooms in on the ones that appear most frequently in the
literature and thus appear to be the most relevant. The following sub-questions address these
factors as well as external factors that may influence the deployment process:
(a) How does the maturity of the Six Sigma program implementation affect a firm’s ROA,
ROS, Total Sales, and Sales Growth?
(b) How does the firm’s strategic alignment affect the impact of Six Sigma implementation on
ROA, ROS, Total Sales, and Sales Growth?
��Is it an enterprise-wide initiative or are only a few areas of the business applying Six
Sigma techniques?
��Are the projects selected in line with the company’s strategic goals?

13
(c) How does the existing number of employees dedicated both part-time and full-time to Six
Sigma projects affect the impact of Six Sigma implementation on ROA, ROS, Total Sales,
and Sales Growth?
��How many Six Sigma experts are in the firm leading projects full-time – (i.e. Master
Black Belts, Black Belts)?
��How many employees are working on Six Sigma projects part-time (i.e. Green Belts)?
(d) How does the firm’s organizational structure and learning ultimately affect the impact of
Six Sigma implementation on ROA, ROS, Total Sales, and Sales Growth?
��Is there effective mentoring and coaching provided for Master Black Belts, Green
Belts, Champions, and others working on Six Sigma within the organization?
(e) How does the integration of Lean Six Sigma (LSS) and Design for Six Sigma (DFSS)
throughout the organization affect the impact of Six Sigma on financial performance?
(f) How does a firm’s bottom-line focus affect the impact of Six Sigma on ROA, ROS, Total
Sales, and Sales Growth?
��Is the firm able to track the status and measure the financial impact of its Six Sigma
projects?
��Are projects selected specifically for their value creation opportunity (through cost
reduction and/or additional revenue)?
(g) How does commitment from top management influence the impact of Six Sigma on ROA,
ROS, Total Sales, and Sales Growth?
The aforementioned factors and the subjective performance measures will be discussed in
further depth in Chapter 2.
1.2 Study Contr ibution and Research Approach
The intention of this study is not only to push Six Sigma into the light of theoretical and
empirical research, but also to provide managers with an insight on the effectiveness of the
program in their firm. This study is also designed to assist sales and marketing managers in
making any decisions on Six Sigma implementation, employee training and hiring, etc. Six
Sigma has been a powerful tool in manufacturing for years, however its very recent
application in service-based business areas and industries is not yet known (Antony, 2006;
McAdam and Lafferty, 2004).

14
This paper will proceed in the following manner. Chapter 2 offers an extensive overview of
the many studies already performed on various quality management techniques and describes
the theoretical model that links these ideas to the Six Sigma argument. The literature review is
succeeded by Chapters 3 and 4, which provide a detailed description of the empirical research
design along with the results of the analysis. Chapter 5 discusses the results and their
managerial implications, while Chapter 6 provides research limitations and suggestions for
further research.
2. L iterature Review
Quality management activities receive a lot of hype in the media, where headlines such as
“Six Sigma Still Pays Off At Motorola” are not uncommon (Crockett and McGregor, 2006).
News like this is appealing to the average manager contemplating the implementation of a Six
Sigma program, however there has been a lack of empirical research that can support such
statements. What does it mean when Six Sigma activities “pay off” for a firm? What are the
stipulations? Because questions like these have been left unanswered, many managers remain
skeptical of the added value that any quality management program could bring to their firm
(Ittner and Larcker, 1997, Terziovski et al., 2003). The goal of this research is to empirically
analyze the impact of Six Sigma implementation on the financial performance of a sample of
American firms and examine the key factors related to successful implementation in order to
answer these managerial questions.
Several authors have also recently addressed this dilemma in a similar light by researching the
impact of ISO 9000 certification, Total Quality Management (TQM), and general process
management techniques on business performance. Total Quality Management (TQM), one of
the most well-known quality management programs, is a broad way of thinking that extends
throughout the firm and focuses principally on customer-centric practices, employee
empowerment, planning, improvement, control, and meeting standard performance
requirements (Motwani et al., 2004; Brah et al., 2002). The concepts behind TQM and Six
Sigma coincide through their shared quality management focus. However, Six Sigma can be
seen as the beefed up version of TQM. Using the traditional DMAIC (Define-Measure-
Analyze-Improve-Control) procedure as a tool, Six Sigma brings a more solid instrument to
15
the table through the extensive use of statistical analyses, a leadership-driven atmosphere,
problem-solving thinking, and a customer-centric approach (Motwani et al., 2004; Antony,
2004). In spite of the differences between general quality management practices and Six
Sigma, the core of both tools is the same. For this reason, empirical studies on these QM
techniques are used as a reference for the Six Sigma research model presented in this paper.
The overall consensus of the analyses performed on QM activities is that there are indeed
financial returns involved with investing in such programs. More importantly, specific factors
that contribute to this success appear consistently throughout the literature: duration of the
company’s QM experience, level of implementation (coincides with strategic alignment),
employee skill level, top management commitment, firm size, industry, and the extensiveness
of training in the firm.
2.1 Matur ity of Implementation
When a firm first adopts a quality management tool such as 6 , a costly investment is made
on both the financial and organizational levels. The firm must hire new Six Sigma experts to
train current employees and lead projects, invest in statistical technologies and/or software,
and above all, see that the entire organization adjusts to a Six Sigma way of thinking (Antony,
2004). It takes time for a company to adapt to these major changes. Therefore, any positive
effects on the firm’s bottom line results due to the 6 implementation may not appear until
two or three years after the initial adoption of the tool (Brah et al., 2000). Based on this
information, the following hypothesis can be formulated:
H1: The amount of time that has passed since the firm’s implementation of 6� will increase
the impact of Six Sigma on the firm’s financial performance.
2.2 Strategic Alignment
Although strategic alignment is not a variable that is emphasized in the quality management
literature, it is considered in the Six Sigma literature as a critical success factor with regards to
Six Sigma deployment in a firm. Strategic alignment has two components: (1) level of Six
Sigma integration throughout the company and (2) project alignment with company’s
16
strategic goals (Porter, 2002). Certified Black Belt and research manager for iSixSigma,
Michael Marx (2007), devised the following levels of Six Sigma implementation in a firm:
- Corporate: 6 is deployed on an enterprise-wide level and thus integrated throughout
the entire organizational culture.
- Business unit: 6 is implemented in a single business area (i.e. finance department) of
the firm and supported by the general manager of that unit or a corporate executive.
- Pilot: the 6 initiative is present in and supported by one or more business units in the
company, but it is in a trial phase.
- Belt: Several Black Belts or Green Belts (trained Six Sigma professionals) are
working within the company, but they are not working on a specific project (lack of
organization).
It is also important to note that broadening the Six Sigma scope in a corporation to include not
only manufacturing processes, but also transactional processes (sales- and marketing-oriented
activities) is considered a step closer to achieving the best value from Six Sigma deployment
(Hahn, 2005). Creveling et al. (2006) also indicate that the combination of cost control in
manufacturing with the creation of sustainable growth through 6 sales and marketing efforts
is the ultimate recipe for positive performance results after Six Sigma deployment. Therefore,
the amount of presence Six Sigma has in the overall firm structure coupled with its
application to a diverse range of activities (from manufacturing to marketing) comprises the
degree at which an enterprise has implemented Six Sigma. This study focuses on the specific
business areas in which Six Sigma has been implemented.
In addition to a firm’s degree of implementation, strategic alignment is determined by the
specific projects that are adopted and the extent to which they fall in line with the firm’s
strategic goals (Porter, 2002). Hahn (2005) emphasizes the importance of this factor
particularly in the beginning stages of Six Sigma deployment. The ability to demonstrate the
project’s alignment with key strategic measures will motivate employees by revealing its
relevance to firm goals. This aspect, along with the integration level of the program, leads to
the second hypothesis:
17
H2: The degree of Six Sigma strategic alignment in a firm will have a positive effect on the
impact of Six Sigma on financial performance.
2.3 Cadre of Change Leaders
This variable is simple but crucial during Six Sigma deployment. There must be a strong
cadre of change leaders (i.e. Master Black Belts, Black Belts) who are expert Six Sigma
practitioners dedicated full-time to deployment (for Six Sigma leader titles and their
definitions, refer to Table 1 in the Appendix). Master Black Belts (MBBs) are certified,
trained experts specialized in Six Sigma practices and represent the top of the Six Sigma
hierarchy. Black Belts (BBs) also possess extensive Six Sigma knowledge through rigorous
training and an exam and lead projects within the organization (www.isixsigma.com). MBBs
and BBs almost always play a full-time Six Sigma role, meaning that 100% of their time and
energy is dedicated to Six Sigma endeavors within the company. Companies will most likely
see a direct impact on bottom line results through investment in Black Belt training, as the
average Black Belt project is claimed to save around £100,000 (Porter, 2002). It is equally
important to have a large group of employees trained in basic Six Sigma methodologies
leading projects on a part-time basis (Green Belts). Their knowledge of Six Sigma tools is not
as extensive as that of the MBBs and BBs, however they still play a key role in executing Six
Sigma projects. This hierarchy of expertise, coupled with a large percentage of employees
dedicated full-time to Six Sigma deployment, represents yet another critical success factor
(Goh, 2002; Porter, 2002; Rees, 2007). The hypothesis is formulated as follows:
H3: There will be a positive relationship between the percentage of employees dedicated full-
time and part-time to Six Sigma deployment and the impact of Six Sigma on firm performance.
2.4 Organizational Structure and Learning
In this context, organizational structure and learning encompasses the extent of training,
mentoring, and coaching provided to all Six Sigma leaders within the company. Several
quality management authors emphasize the importance of training and expertise within the
organization in order to ensure a strong foundation of “know-how.” Kaynak (2003) examined

18
the relationship between TQM initiatives and firm performance and found that training had a
positive and significant indirect effect on process management.
Although some authors hypothesized a positive relationship between training and company
performance (in a TQM or ISO 9000 context) and received statistically insignificant results
(Powell, 1995; Terziovski and Samson, 1999), the results of an identical analysis in a Six
Sigma setting may differ completely. According to Six Sigma experts, it remains a key
element in the Six Sigma implementation process, therefore it is not excluded from the
analysis. Training also goes hand-in-hand with consistent mentoring and coaching of Six
Sigma project participants at all levels of the hierarchy (Rees, 2007). Lastly, Henderson and
Evans (2000) point out that whether training is outsourced or provided in-house, it is a crucial
success factor regarding Six Sigma implementation. The Six Sigma strategy requires a wide
variety of expertise from mathematicians to statisticians to quality specialists. In 1998,
General Electric (one of the Six Sigma pioneers) invested almost $400 million in Six Sigma
training and realized around $1.2 billion in returns on this investment. In fact, becoming a
trained Black Belt is a requirement for promotion in management at GE (Porter, 2002). As
Henderson and Evans (2000) state so eloquently, “besides hardware and software, the
‘human-ware’ side is needed to make productivity work [in Six Sigma].” The fourth
hypothesis is derived from these observations:
H4: There is a positive relationship between organizational structure and learning and the
impact of Six Sigma on firm financial performance.
2.5 Lean Six Sigma (LSS) and Design for Six Sigma (DFSS)
“Lean Six Sigma (LSS) is the combination of two proven methodologies for improving total
organization performance through systematic and continuous process improvement”
(NewPage Corporation, 2007). “Lean” is a method often combined with Six Sigma, as the
two concepts go hand-in-hand. The main goal is to reduce waste and increase the speed of a
process, thereby increasing overall efficiency. Waste includes things like rework (any repair),
motion (any motion of the worker that does not add value), overproduction, waiting, etc. The
main difference between Six Sigma and Lean is that Lean focuses on speed and efficiency and
19
Six Sigma focuses on precision and quality. Lean applies tools like “kaizen” events, where a
diverse project team (composed of employees ranging from assembly line workers to senior
executives) spends one week examining a specific defect in a process (Smith, 2003). This is a
very short-term results-driven procedure. Also, lean often does not possess the extensive
amount of statistical tools and analysis used in Six Sigma. In essence, Lean and Six Sigma
are interconnected because they feed into each other. The faster, more efficient cycles
derived from Lean produce the quality inherent in Six Sigma. This Six Sigma quality
(reduction of variation reduction of defects) in turn reduces the time spent trying to reduce
waste through Lean processes. Nancy Rees, Senior Vice President of Xerox Corporation,
mentioned the integration of LSS into daily operations as a critical success factor in Six
Sigma deployment (Six Sigma Leadership Conference, 2007).
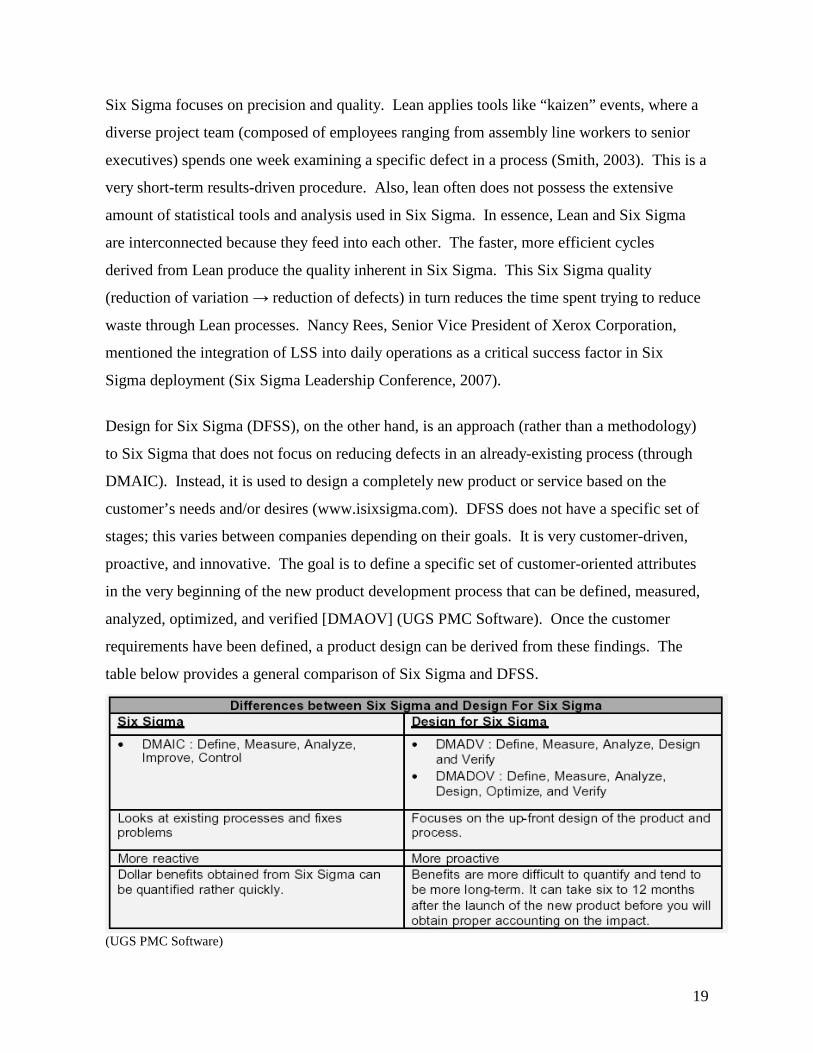
Design for Six Sigma (DFSS), on the other hand, is an approach (rather than a methodology)
to Six Sigma that does not focus on reducing defects in an already-existing process (through
DMAIC). Instead, it is used to design a completely new product or service based on the
customer’s needs and/or desires (www.isixsigma.com). DFSS does not have a specific set of
stages; this varies between companies depending on their goals. It is very customer-driven,
proactive, and innovative. The goal is to define a specific set of customer-oriented attributes
in the very beginning of the new product development process that can be defined, measured,
analyzed, optimized, and verified [DMAOV] (UGS PMC Software). Once the customer
requirements have been defined, a product design can be derived from these findings. The
table below provides a general comparison of Six Sigma and DFSS.
(UGS PMC Software)

20
Both LSS and DFSS are seen as value-adding supplements to the Six Sigma repertoire within
the Six Sigma community and are therefore seen as critical success factors that will ultimately
affect the firm’s financial statement (Hahn, 2005). Thus, the following hypothesis can be
stated:
H5: Integration of Lean Six Sigma (LSS) and/or Design for Six Sigma (DFSS) methodologies
will positively affect the impact of Six Sigma on ROA, ROS, Total Sales, and Sales Growth.
2.6 Bottom-line Focus
Although this variable is not prevalent in the TQM literature, Six Sigma professionals stress
the importance of high-impact projects. A firm is considered to have a “bottom-line focus”
with regards to Six Sigma implementation when it purposely hand picks projects that will
eventually reduce costs and/or bring in additional revenue (Porter, 2002). Rees (2007) also
indicated that one of Xerox’s critical success factors is the selection of projects for value
creation opportunity, particularly those that yield a healthy ROIC (Return on Investment
Capital). More specifically, the Sales and Marketing department is expected to adopt Six
Sigma projects that provide value to the customer, and that value is eventually reciprocated:
“a company must create value for its customers and be paid for that value” (Webb, 2006, p.
52). Lastly, value creation must also be coupled with the firm’s ability to track the financial
status of the project throughout all stages: creation until realization. The combination of value
creation and rigorous financial tracking and measurement comprises an overall bottom-line
focus and thus leads to the following hypothesis:
H6: A firm’s bottom-line focus will have a positive effect on the impact of Six Sigma on ROA,
ROS, Total Sales, and Sales Growth.
2.7 Top Management Commitment
The final and one of the most widely used variables in the quality management literature is
the level of commitment that top management invests before, during, and after
implementation. Ittner and Larcker (1997) state that without commitment and support from
management, the adoption of process management techniques is bound for failure, as this
21
project dedication ensures teamwork and induces continuous improvement efforts. Managers
have the power to create enthusiasm and motivation among employees and see that the
implementation process runs smoothly and effectively at all times. Executive commitment
has also shown to have a direct or indirect link with financial or operating performance in
relation to quality management endeavors (Kaynak, 2003; Powell, 1995, Adam et al., 1997).
In addition, Six Sigma literature specifically conveys commitment from top management as
the most critical success factor of 6 deployment (Henderson and Evans, 2000; Hahn, 2005).
Kuei and Madu (2003) argue that quality leadership among top managers is one of the key
drivers of successful completion of the DMAIC project cycle. Support from leaders within
the company represents the foundation of a Six Sigma project, and without this, there would
be no grounds to build the project implementation upon. With this being said, the following
hypothesis can be suggested:
H7: Commitment from Top Management throughout Six Sigma implementation will have a
positive relationship with the impact of Six Sigma on a firm’s financial performance.
2.8 Firm Size and Industry
Firm size is introduced as a control variable in numerous studies on quality management
endeavors and their link to organizational or financial performance (Ittner and Larcker, 1997;
Powell 1995; Terziovski et al., 2003; Brah et al., 2002). For example, larger companies may
have a higher sales growth in comparison to smaller companies, irrespective of the Six Sigma
implementation. Many TQM and ISO 9000 studies also included firm industry/sector as a
control variable, as performance can vary significantly depending on the specific industry
(Brah et al., 2000; Brah et al., 2002; Powell, 1995).
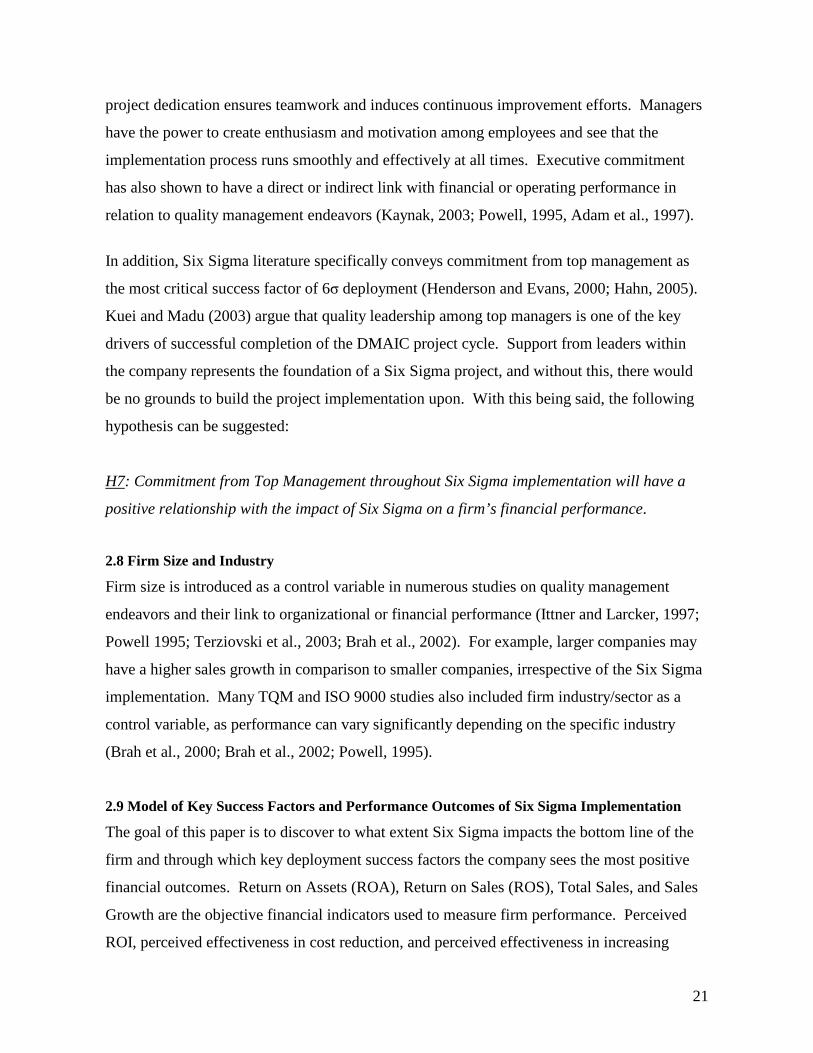
2.9 Model of Key Success Factors and Per formance Outcomes of Six Sigma Implementation
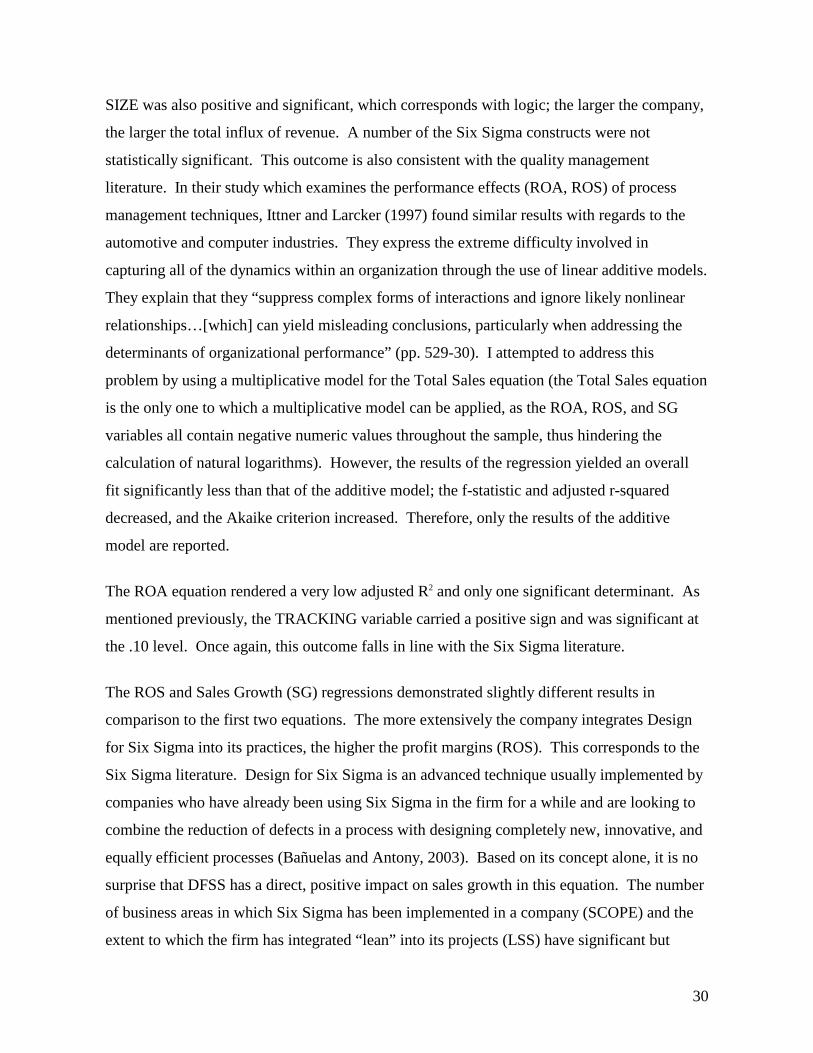
The goal of this paper is to discover to what extent Six Sigma impacts the bottom line of the
firm and through which key deployment success factors the company sees the most positive
financial outcomes. Return on Assets (ROA), Return on Sales (ROS), Total Sales, and Sales
Growth are the objective financial indicators used to measure firm performance. Perceived
ROI, perceived effectiveness in cost reduction, and perceived effectiveness in increasing
22
Key Success Factors • Maturity of Implementation • Strategic Alignment • Cadre of Change Leaders • Organizational Structure and
Learning • Integration of LSS & DFSS • Bottom-line Focus • Top Management
Commitment
Control Industry
Firm Size
Financial Per formance Return on Assets (ROA) Return on Sales (ROS) Total Sales (TS) Sales Growth (SG) - Perceived ROI - Perceived effectiveness in reducing costs - Perceived effectiveness in increasing revenue
6 Implementation
revenues represent the subjective measures of Six Sigma effectiveness. Furthermore, the
seven abovementioned hypotheses correspond to the key success factors that will ultimately
influence the end results of Six Sigma deployment. Lastly, firm size and industry are placed
in the model in order to control for any variance in Six Sigma effectiveness between small,
medium, and large firms and the industries to which they belong.
The model below summarizes the theoretical foundation of this study and represents the basis
of the empirical model which is elaborated upon in the subsequent section.
3. Research Methodology
3.1 Sample
Only managers currently working with Six Sigma tools in a company that has implemented
Six Sigma for at least one year were invited to participate in the research. Contacts were
obtained from a list of Six Sigma Leadership Council members and through solicitation of Six
Sigma forums (iSixSigma, www.lean.org) and networking communities (www.xing.com,
www.linkedin.com). Requests to participate in this research were sent out via e-mail and
snail mail to potential candidates. A total of 50 companies agreed to participate out of 120
23
companies that were contacted, yielding a response rate of about 42%. Among these 50
companies, 41 of them are publicly traded, 8 of them are privately held, and only one of them
is based outside the United States (South Africa). All other responses were from American
companies or United States-based subsidiaries. The following industries were represented in
the sample: Health, Manufacturing, Finance, Energy, Engineering, Retail, Transportation,
High Tech, and Other. Every questionnaire was filled out by a range of top managers such as
performance engineers, Six Sigma deployment directors, business excellence leaders, and
Master Black Belts. All respondents are knowledgeable key informants about information
pertaining to Six Sigma; the majority is responsible for Six Sigma activities in their respective
company.
3.2 Data
The empirical analysis of the impact of Six Sigma implementation on firm performance
employed data gathered from an online survey (administered via www.zoomerang.com),
several online databases, and company annual reports. A short survey of 21 questions
addressed all seven characteristics referred to in the hypotheses mentioned in Chapter 2. A
specific reliable and valid scale has not yet been developed for Six Sigma-related research,
therefore the questions were constructed based upon scales already applied in quality
management research (Ittner and Larcker, 1997; Kaynak, 2003) and an in-depth discussion
with a Six Sigma expert. The list of questions presented in the questionnaire and the variables
to which they correspond are presented in the Appendix (Exhibit G). The types of questions
are mixed in nature; some contain a 5-point Likert Scale and ask the respondent to indicate
his/her level of agreement with the statement, while some ask the respondent to select from a
list of options (i.e. level of Six Sigma implementation, industry), and others require the
respondent to type in a numerical answer (i.e. number of full-time Black Belts, number of
employees).
For the dependent variables, financial data (ROA, ROS, Total Sales, Sales Growth) was
gathered for all 41 public companies from various online sources (Google Finance, Morning
Star, company annual reports, Osiris). The remaining 9 private/foreign companies were
included only in the subjective analysis. This objective financial data were retrieved in

24
attempt to balance the potentially biased subjective financial measures (perceived ROI,
perceived effectiveness in reducing costs, and perceived effectiveness in increasing revenue).
3.3 Model Specification and Estimation
The empirical model below attempts to identify the key determinants involved in successful
Six Sigma implementation as well as the financial impact of Six Sigma program
implementation. This is a cross-sectional analysis for the year 2006. Variables are grouped
into Six Sigma characteristics ( s) and control variables ( s). The control variables in this
econometric model consist of two dummy variables for industry effects and a firm size
variable (number of employees). In order to conserve degrees of freedom, the nine industries
prevalent in the data set were grouped into two categories based on their degree of similarity.
Manufacturing and energy were paired to create the INDUSTRY dummy to control for any
differences between the “manufacturing” and “other” sectors. However subjective this
industry categorization may be, it is crucial that industry is somehow controlled for in such an
analysis.
Financial Performance (ROA, ROS, TS, or SG) = + 1MATURITY + 2SCOPE +
3STRATEGIC + 4LEADER + 5BELTS + 6COACHING + 7TRACKING + 8DFSS +
9LSS + 1SIZE + 2INDUSTRY + (1)
Return on Assets (ROA), Return on Sales (ROS), Total Sales (TS), and Sales Growth (SG)
serve as the dependent variables in this equation and represent the overall financial
performance of the firm. The first two independent variables are MATURITY and SCOPE,
where MATURITY is the number of years Six Sigma has been implemented in the company,
and SCOPE corresponds to the number of business areas in which Six Sigma has been
implemented (i.e. only engineering and manufacturing or all business areas including sales,
marketing, planning, and R&D). Both of these variables are expected to carry a positive
coefficient, as the longer Six Sigma has been implemented and the more widespread the
implementation is across the firm, the better the bottom line performance.

25
The remaining independent variables are a blend of key success factors derived from quality
management and Six Sigma literature (Powell, 1997; Kaynak, 2003; Antony, 2007). The
STRATEGIC variable refers to the extent to which a firm selects Six Sigma projects in line
with the company’s strategic goals. LEADER measures the amount of top management
commitment to Six Sigma projects within the firm, and the BELTS variables refers to the
percentage of employees dedicated both part-time and full-time to Six Sigma projects within
the company. The COACHING variable indicates whether or not there is a strong presence of
effective mentoring and coaching in the company for all employees involved in Six Sigma
projects. All four of these variables are expected to have a positive relationship with the
dependent variables. TRACKING refers to Six Sigma leaders’ ability to consistently track
the status and financial outcomes of all Six Sigma projects. This variable is expected to carry
a positive coefficient estimate. Lastly, LSS and DFSS measure the extent to which a firm has
implemented Lean Six Sigma (a tool designed to reduce waste in a process) and Design for
Six Sigma (an advanced innovation-oriented tool, usually implemented after LSS). The
expected sign for both variables is expected to be positive.
The last two variables in the equation are the control variables. SIZE controls for firm size
and is measured by the number of employees in 2006, and the INDUSTRY variable controls
for all firms in the manufacturing and energy sectors only. These control variables are
consistent with the quality management literature (Powell, 2005; Ittner and Larcker, 1997;
Hendricks and Singhal, 2000).
Two additional equations employed subjective managerial data as dependent variables:
COSTS, and REVENUE. A Chi-square test was performed for the subjective analysis using
the PERCROI dependent variable. PERCROI refers to whether or not the manager believes
Six Sigma was good investment for his/her respective company. COSTS and REVENUE refer
to the level of the company’s effectiveness in reducing costs and/or increasing revenue
streams through Six Sigma projects. This second subjective cross section analysis has two
purposes: (1) to compare managerial perceptions of Six Sigma success with actual bottom line
results and (2) to include the private and foreign companies who completed the survey. Both
equations mirror the first model, except the subjective variables mentioned above replace the
objective financial dependent variables (ROA, ROS, Total Sales, and Sales Growth). The
26
Chi-Square test examines each independent variable and its relationship to managers’
perceptions of Six Sigma as an investment. The results of this test are discussed in the
following chapter. The two COSTS and REVENUE equations are formulated as follows:
COSTS = + 1MATURITY + 2SCOPE + 3STRATEGIC + 4LEADER + 5BELTS +
6COACHING + 7TRACKING + 8DFSS + 9LSS + 1SIZE + 2INDUSTRY1 +
3INDUSTRY2 + (2)
REVENUE = + 1MATURITY + 2SCOPE + 3STRATEGIC + 4LEADER + 5BELTS +
6COACHING + 7TRACKING + 8DFSS + 9LSS + 1SIZE + 2INDUSTRY1 +
3INDUSTRY2 + (3)
Lastly, a third analysis using the objective financial data examined the impact of Six Sigma
over time, more specifically over the years 1996-2007. This analysis is meant to be a
supplement to the first cross-section model, as it takes into account year-to-year fluctuations
opposed to just a snapshot in time. The historical financial data could not be utilized in the
first model because the data obtained for the explanatory variables (via the survey) were only
representative of current company characteristics. The first industry-specific equation utilizes
Total Sales (TS) as a dependent variable and is multiplicative in nature:
TS = · ^SIXSIG · ^INDUSTRY(a,b,…z) · ^TREND · SIZE^ · exp( ) (4)
The equation is linearized by taking the natural log on both sides. This leads to the following
expression:
ln(TS) = ln( ) + ln( )*SIXSIG + ln( )* INDUSTRY(a,b,…z) + ln( )*TREND +
ln( )*SIZE +
The key explanatory variable is SIXSIG, a variable indicating how many years Six Sigma has
been implemented in the considered company. For example, if a company has been
practicing Six Sigma for five years, the company would receive a 1 for the dummy variable
SIXSIG1 for the year 2002 and a 0 for all other years. SIXSIG2 would receive a 1 for the

27
second year of implementation in 2003 and a 0 for all other years. Finally, SIXISIG5 would
receive a 1 for the year 2006 and a 0 for the remaining years. This variable is accompanied
by nine industry dummies (Health, Manufacturing, Finance, Retail, Energy, Engineering,
Transportation, High Tech, and Other), a TREND variable which attempts to counterbalance
any trends in the dependent variables not associated with Six Sigma implementation, and a
SIZE variable which controls for firm size.
The second series of equations includes ROA, ROS, and SG as dependent variables instead of
Total Sales, eliminates the TREND variable and is additive rather than multiplicative due to
the nature of the dependent variables:
ROA, ROS, SG = + SIXSIG + INDUSTRY(a,b,…z) + (5)
The table below lists all variables and their definitions. The following section provides an
overview of key descriptive statistics for the considered variables.
VARIABLE DEFINITION Dependent Variables ROA
Return on Assets = operating income (before taxes)/total assets
ROS Return on Sales = operating income (before taxes)/total sales Total Sales (TS) Total Sales before any deductions Sales Growth (SG) PERCROI Managerial perception on Six Sigma investment (Dummy) COSTS Managerial perception on the effectiveness of Six Sigma projects in
reducing costs REVENUE* Managerial perception on the effectiveness of Six Sigma projects in
increasing revenue Six Sigma Characteristics Variables MATURITY
Number of years Six Sigma has been implemented in the company
SCOPE Year-to-year change in the number of non-Westerners in the region divided by the total regional population in 1995
STRATEGIC Managerial perception on strategic alignment of Six Sigma projects LEADERSHIP Managerial perception on the commitment of top management to
Six Sigma endeavors BELTS Percentage of part-time and full-time employees dedicated to Six
Sigma projects (Master Black Belts, Black Belts, Green Belts, etc.) COACHING Managerial perception on the availability/quality of coaching and
mentoring for all employees working with Six Sigma tools COSTS Managerial perception on the effectiveness of Six Sigma projects in
reducing costs REVENUE Managerial perception on the effectiveness of Six Sigma projects in
increasing revenue TRACKING Managerial perception on the firm’s ability to track the status and
financial outcomes of all Six Sigma projects

28
DFSS Extent to which Design for Six Sigma has been implemented in the company
LSS Extent to which Lean has been implemented in the company Control Variables INDUSTRY
Health, Manufacturing, Finance, Engineering, Energy, Retail, Transportation, High Tech, Other
SIZE Total number of employees in the company
3.4 Descr iptive Statistics
The data gathered from the 41 publicly traded companies indicated that the average company
size of the sample was 40,381 employees. When adding the private companies to the sample
(N=50), this number dropped to 34,736. The most prevalent industries in the data set were
Manufacturing (14/50 = 28%) and Health (10/50 = 20%). The number of years of Six Sigma
implementation (MATURITY) for both samples averaged around 5 years, while the
extensiveness of the integration of Lean Six Sigma (LSS) and Design for Six Sigma (DFSS)
in the firm for both samples averaged at 3.5 and 2.7 on a 5-point scale, respectively. On this
scale, a 1 is equivalent to no implementation of the tool whatsoever, and a 5 represents very
extensive integration of the methodology throughout the company. The ability to track the
status and financial outcomes of projects (TRACKING), the level of effectiveness in cost
reduction (COSTS), and the level of effectiveness in increasing revenue (REVENUE) for both
samples was approximately 4.1, 3.8, and 3.1 on a 5-point scale. For the COSTS and
REVENUE scale, a 1 = ineffective (no measurable cost/revenue improvements) and a 5 =
extremely effective (a key productivity tool for cost improvements/a key revenue
enhancement). The respondent was asked to indicate his/her level of agreement of tracking
effectiveness for the TRACKING variable; 1 = strongly disagree, 5 = strongly agree). On the
same five-point scale, both samples ranked their companies’ Six Sigma mentoring and
coaching activities (COACHING) around 4.2 and the strategic alignment (STRATEGIC) of
Six Sigma projects around 3.7.
There were some discrepancies among the two samples with regards to top management
commitment (LEADER), the percentage of employees dedicated part-time and full-time to
Six Sigma projects (BELTS), and the breadth of the program implementation (SCOPE, a
dummy variable, where 0 = Six Sigma implemented in less than five business areas within the
company, and 1 = five or more business areas). The sample of public companies yielded the
following descriptive statistics for these variables: LEADER = mean (3.97), standard
29
deviation (0.935); BELTS = mean (10.09%), standard deviation (16.85%); and SCOPE =
mean (0.78), standard deviation (0.42). The larger sample including the private and foreign
companies yielded the following statistics for the same variables: LEADER = mean (4.02),
standard deviation (0.915); BELTS = mean (12.97), standard deviation (21.88); and SCOPE =
mean (0.74), standard deviation (0.44). Lastly, among all 50 respondents, 45 agreed that Six
Sigma was a good investment for their company. Two managers responded negatively and
three indicated that they were “undecided” as to whether or not the program was a good
investment. Descriptive statistics for all dependent and explanatory variables are presented in
further detail in Table 3 in the Appendix.
4. Estimation Procedure and Empir ical Results
4.1 Model 1
Model 1 (4 separate equations) was estimated using the Ordinary Least Squares (OLS)
technique, with adjustments taken for heteroskedasticity in the ROA, ROS, and Sales Growth
equations. The results of Breusch-Pagan tests indicated that heteroskedasticity was present in
these three equations; this is the preferred test used by econometricians for cross-sectional
analyses (Studenmund, 2006). The White heteroskedasticity robust covariance matrix was
used to obtain heteroskedasticity-consistent standard errors.
The Total Sales (TS) equation yielded an adjusted R2 of 0.347 and three statistically
significant moderator variables: MATURITY, at the 0.10 level according to the t-statistic,
SCOPE at the 0.10 level, and TRACKING, at the .01 level. The sign for the MATURITY
variable was also positive, which falls in line with theory. The longer the firm has been
working with Six Sigma, the more likely it is to see bottom line results with regards to the
implementation (Hendricks and Singhal, 2000). In addition, there is a positive relationship
between the number of business areas in which Six Sigma has been implemented (SCOPE)
and Total Sales. The TRACKING variable carried a negative coefficient estimate, which was
an unexpected result. According to theory, if a firm is consistently able to track the status of
their projects and the financial outcomes of each one, positive financial returns should result.
However, since TRACKING is significant and positive in the ROA and SG equations, this
unexpected result may just be due to the nature of the dependent variable and not necessarily
an indication that tracking Six Sigma projects is financially detrimental. The control variable
30
SIZE was also positive and significant, which corresponds with logic; the larger the company,
the larger the total influx of revenue. A number of the Six Sigma constructs were not
statistically significant. This outcome is also consistent with the quality management
literature. In their study which examines the performance effects (ROA, ROS) of process
management techniques, Ittner and Larcker (1997) found similar results with regards to the
automotive and computer industries. They express the extreme difficulty involved in
capturing all of the dynamics within an organization through the use of linear additive models.
They explain that they “suppress complex forms of interactions and ignore likely nonlinear
relationships…[which] can yield misleading conclusions, particularly when addressing the
determinants of organizational performance” (pp. 529-30). I attempted to address this
problem by using a multiplicative model for the Total Sales equation (the Total Sales equation
is the only one to which a multiplicative model can be applied, as the ROA, ROS, and SG
variables all contain negative numeric values throughout the sample, thus hindering the
calculation of natural logarithms). However, the results of the regression yielded an overall
fit significantly less than that of the additive model; the f-statistic and adjusted r-squared
decreased, and the Akaike criterion increased. Therefore, only the results of the additive
model are reported.
The ROA equation rendered a very low adjusted R2 and only one significant determinant. As
mentioned previously, the TRACKING variable carried a positive sign and was significant at
the .10 level. Once again, this outcome falls in line with the Six Sigma literature.
The ROS and Sales Growth (SG) regressions demonstrated slightly different results in
comparison to the first two equations. The more extensively the company integrates Design
for Six Sigma into its practices, the higher the profit margins (ROS). This corresponds to the
Six Sigma literature. Design for Six Sigma is an advanced technique usually implemented by
companies who have already been using Six Sigma in the firm for a while and are looking to
combine the reduction of defects in a process with designing completely new, innovative, and
equally efficient processes (Bañuelas and Antony, 2003). Based on its concept alone, it is no
surprise that DFSS has a direct, positive impact on sales growth in this equation. The number
of business areas in which Six Sigma has been implemented in a company (SCOPE) and the
extent to which the firm has integrated “ lean” into its projects (LSS) have significant but
31
negative relationships with ROS. These results may not necessarily imply that Lean is not a
useful tool, or that Six Sigma as a company-wide initiative is not beneficial. Instead, these
negative outcomes may be an indication of the way that Six Sigma has been implemented in
the firm. For example, if Lean has been adopted too rapidly and the company culture is not
ready for such an undertaking, the outcome may be negative when it should have been the
opposite. Also, the same outcome could take place if a company rushes to implement Six
Sigma in all business areas, whether or not they are prepared for such an organizational
change. The SCOPE variable, however, should be interpreted with caution, as it is also
positive and significant in the Total Sales equation. Lastly, the TRACKING variable carries a
positive and significant (.05 level) coefficient in the Sales Growth equation. This implies that
the company’s ability to track the status and financial outcomes of its Six Sigma projects has
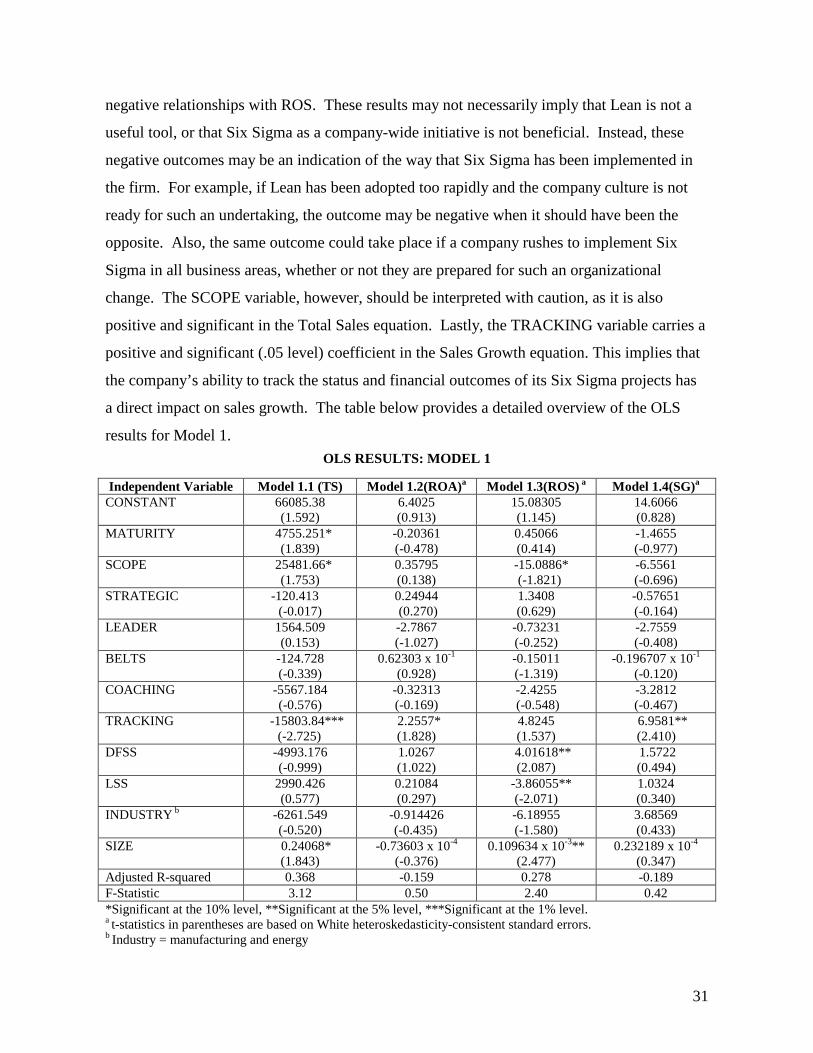
a direct impact on sales growth. The table below provides a detailed overview of the OLS
results for Model 1.
OLS RESULTS: MODEL 1
Independent Var iable Model 1.1 (TS) Model 1.2(ROA)a Model 1.3(ROS) a Model 1.4(SG)a
CONSTANT 66085.38 (1.592)
6.4025 (0.913)
15.08305 (1.145)
14.6066 (0.828)
MATURITY 4755.251* (1.839)
-0.20361 (-0.478)
0.45066 (0.414)
-1.4655 (-0.977)
SCOPE 25481.66* (1.753)
0.35795 (0.138)
-15.0886* (-1.821)
-6.5561 (-0.696)
STRATEGIC -120.413 (-0.017)
0.24944 (0.270)
1.3408 (0.629)
-0.57651 (-0.164)
LEADER 1564.509 (0.153)
-2.7867 (-1.027)
-0.73231 (-0.252)
-2.7559 (-0.408)
BELTS -124.728 (-0.339)
0.62303 x 10⁻¹
(0.928) -0.15011 (-1.319)
-0.196707 x 10⁻¹ (-0.120)
COACHING -5567.184 (-0.576)
-0.32313 (-0.169)
-2.4255 (-0.548)
-3.2812 (-0.467)
TRACKING -15803.84*** (-2.725)
2.2557* (1.828)
4.8245 (1.537)
6.9581** (2.410)
DFSS -4993.176 (-0.999)
1.0267 (1.022)
4.01618** (2.087)
1.5722 (0.494)
LSS 2990.426 (0.577)
0.21084 (0.297)
-3.86055** (-2.071)
1.0324 (0.340)
INDUSTRY b -6261.549 (-0.520)
-0.914426 (-0.435)
-6.18955 (-1.580)
3.68569 (0.433)
SIZE 0.24068* (1.843)
-0.73603 x 10⁻⁴
(-0.376) 0.109634 x 10⁻³**
(2.477) 0.232189 x 10⁻⁴
(0.347) Adjusted R-squared 0.368 -0.159 0.278 -0.189 F-Statistic 3.12 0.50 2.40 0.42 *Significant at the 10% level, **Significant at the 5% level, ***Significant at the 1% level. a t-statistics in parentheses are based on White heteroskedasticity-consistent standard errors. b Industry = manufacturing and energy
32
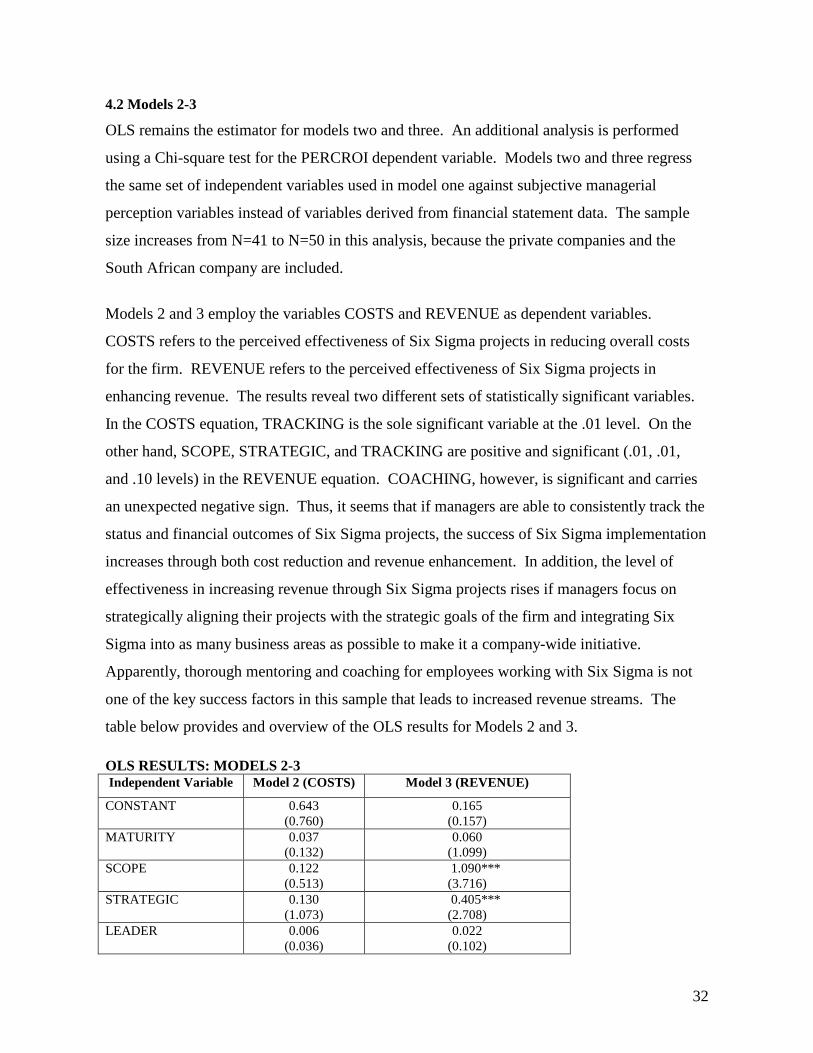
4.2 Models 2-3
OLS remains the estimator for models two and three. An additional analysis is performed
using a Chi-square test for the PERCROI dependent variable. Models two and three regress
the same set of independent variables used in model one against subjective managerial
perception variables instead of variables derived from financial statement data. The sample
size increases from N=41 to N=50 in this analysis, because the private companies and the
South African company are included.
Models 2 and 3 employ the variables COSTS and REVENUE as dependent variables.
COSTS refers to the perceived effectiveness of Six Sigma projects in reducing overall costs
for the firm. REVENUE refers to the perceived effectiveness of Six Sigma projects in
enhancing revenue. The results reveal two different sets of statistically significant variables.
In the COSTS equation, TRACKING is the sole significant variable at the .01 level. On the
other hand, SCOPE, STRATEGIC, and TRACKING are positive and significant (.01, .01,
and .10 levels) in the REVENUE equation. COACHING, however, is significant and carries
an unexpected negative sign. Thus, it seems that if managers are able to consistently track the
status and financial outcomes of Six Sigma projects, the success of Six Sigma implementation
increases through both cost reduction and revenue enhancement. In addition, the level of
effectiveness in increasing revenue through Six Sigma projects rises if managers focus on
strategically aligning their projects with the strategic goals of the firm and integrating Six
Sigma into as many business areas as possible to make it a company-wide initiative.
Apparently, thorough mentoring and coaching for employees working with Six Sigma is not
one of the key success factors in this sample that leads to increased revenue streams. The
table below provides and overview of the OLS results for Models 2 and 3.
OLS RESULTS: MODELS 2-3 Independent Var iable Model 2 (COSTS) Model 3 (REVENUE)
CONSTANT 0.643 (0.760)
0.165 (0.157)
MATURITY 0.037 (0.132)
0.060 (1.099)
SCOPE 0.122 (0.513)
1.090*** (3.716)
STRATEGIC 0.130 (1.073)
0.405*** (2.708)
LEADER 0.006 (0.036)
0.022 (0.102)
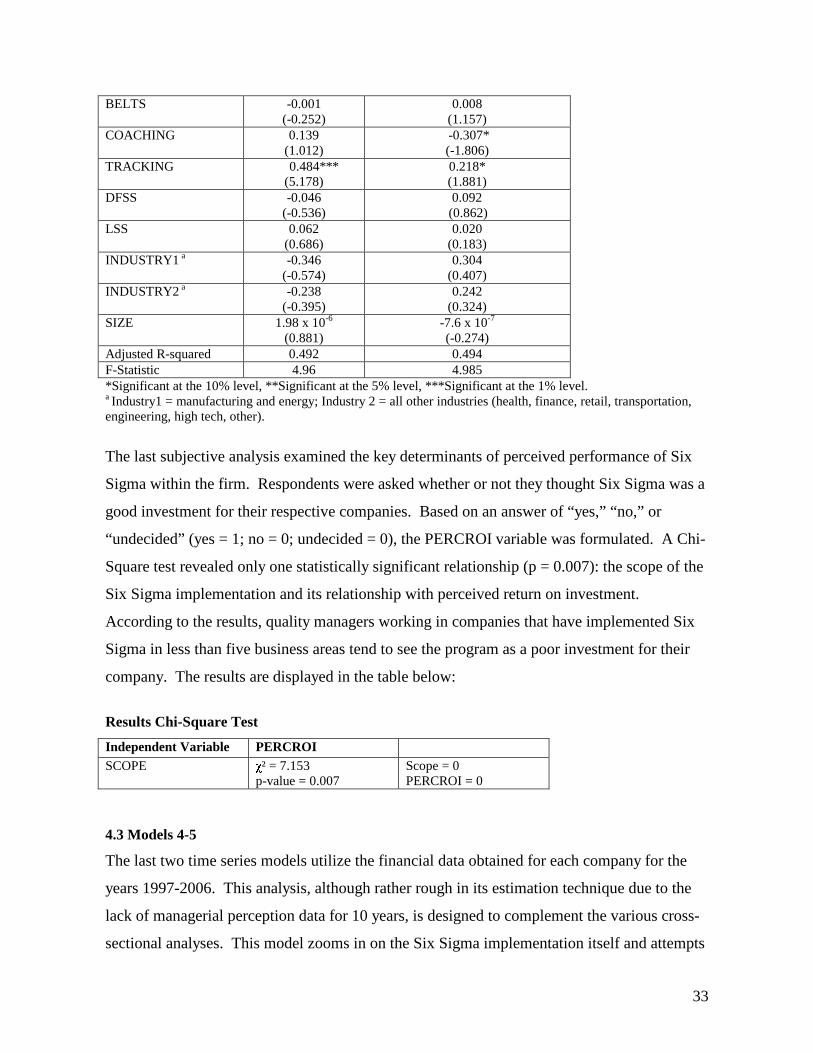
33
BELTS -0.001 (-0.252)
0.008 (1.157)
COACHING 0.139 (1.012)
-0.307* (-1.806)
TRACKING 0.484*** (5.178)
0.218* (1.881)
DFSS -0.046 (-0.536)
0.092 (0.862)
LSS 0.062 (0.686)
0.020 (0.183)
INDUSTRY1 a -0.346 (-0.574)
0.304 (0.407)
INDUSTRY2 a -0.238 (-0.395)
0.242 (0.324)
SIZE 1.98 x 10⁻⁶ (0.881)
-7.6 x 10⁻⁷
(-0.274) Adjusted R-squared 0.492 0.494 F-Statistic 4.96 4.985 *Significant at the 10% level, **Significant at the 5% level, ***Significant at the 1% level. a Industry1 = manufacturing and energy; Industry 2 = all other industries (health, finance, retail, transportation, engineering, high tech, other).
The last subjective analysis examined the key determinants of perceived performance of Six
Sigma within the firm. Respondents were asked whether or not they thought Six Sigma was a
good investment for their respective companies. Based on an answer of “yes,” “no,” or
“undecided” (yes = 1; no = 0; undecided = 0), the PERCROI variable was formulated. A Chi-
Square test revealed only one statistically significant relationship (p = 0.007): the scope of the
Six Sigma implementation and its relationship with perceived return on investment.
According to the results, quality managers working in companies that have implemented Six
Sigma in less than five business areas tend to see the program as a poor investment for their
company. The results are displayed in the table below:
Results Chi-Square Test
Independent Var iable PERCROI SCOPE � ² = 7.153
p-value = 0.007 Scope = 0 PERCROI = 0
4.3 Models 4-5
The last two time series models utilize the financial data obtained for each company for the
years 1997-2006. This analysis, although rather rough in its estimation technique due to the
lack of managerial perception data for 10 years, is designed to complement the various cross-
sectional analyses. This model zooms in on the Six Sigma implementation itself and attempts
34
to observe Six Sigma’s progress over a 10-year time span, rather than just a snapshot of 2006.
As mentioned in the previous chapter, the models employ industry-specific intercepts and all
four financial measures as dependent variables (TS, ROS, ROA, SG). A SIZE variable is
added to the equation to account for firm size within each industry. A multiplicative model is
used for the Total Sales equation, while additive models are employed for the ROS, ROA, and
SG equations. OLS remains the estimating technique for all equations.
The TS and SG equations revealed the most interesting results. In the TS equation, there are
no statistically significant coefficient estimates. The trend in the estimates, however,
indicates that Six Sigma does not positively impact Total Sales until around the sixth year of
implementation, as this is the first year that reveals a coefficient value greater than 1.
SIXSIG1 and SIXSIG2 are significant at the .02 level in the SG equation, while SIXSIG3-6
are significant at the .05 level. Sales Growth increases by 0.2% after one year of
implementation (87.9% to 88.1%) and by another 2% after the second year (88.1% to 99.1%),
ceteris paribus. Stagnation occurs in years three and four (Six Sigma still has a positive
impact on sales in these years, however there is no incremental impact on sales in comparison
to the previous years), while year five climbs back up to a 0.37% increase from year two.
There is an even larger increase in sales growth between years five and six of 5.7%. The
output of these two models shows that there is a noticeable increase in Total Sales and Sales
Growth the longer Six Sigma is implemented in the firm. The brief “plateau” that appears
around years three and four may be attributed to the newness of the implementation wearing
off. In the beginning, results come easily since the Six Sigma tools are new to the
organization and its culture. However, after a few years, greater efforts need to be invested
into applying new tools and methodologies and thinking outside the box in order to maintain
such results. For more detailed information on the statistical output of the Industry models (4-
5), see the table below.

35
OLS RESULTS MODELS 4-5 Independent Var iable Model 4 (TS)ª Model 5.1(ROA) Model 5.2(ROS) Model 5.3(SG)
CONSTANT 8.504 (11.301)
-32.630 (-0.585)
3.499 (0.073)
0.222 (0.003)
SIXSIG1 0.696 (-0.95)
45.717* (1.701)
32.110 (1.399)
87.900*** (2.521)
SIXSIG2 0.792 (-0.609)
44.682 (1.603)
33.111 (1.391)
90.118*** (2.492)
SIXSIG3 0.745 (-0.678)
41.520 (1.352)
34.180 (1.304)
81.771** (2.052)
SIXSIG4 0.707 (-0.734)
40.016 (1.281)
34.174 (1.281)
85.687** (2.114)
SIXSIG5 0.875 (-0.282)
43.514
(1.254) 34.270 (1.157)
90.495** (2.011)
SIXSIG6 1.101 (0.206)
43.511 (1.127)
33.194 (1.007)
96.229** (1.921)
SIXSIG7 1.203 (0.355)
44.942 (0.971)
42.372 (1.072)
75.227 (1.252)
SIXSIG8 1.839 (1.223)
47.145 (0.836)
42.050 (0.873)
89.523 (1.224)
SIXSIG9 2.484 (1.174)
58.609 (0.527)
57.657 (0.608)
79.018 (0.548)
SIXSIG10 2.549 (1.216)
57.029 (0.513)
57.022 (0.601)
83.868 (0.582)
Adjusted R-squared 0.129 0.004 0.004 0.025 F-Statistic 4.021 1.089 1.080 1.548 *Significant at the 10% level, **Significant at the 5% level, ***Significant at the 1% level. - Only key independent variables (SIXSIG) are shown in this table. ª T-statistics in parentheses are based on a border value of 1 rather than 0 for Model 4.
5. Discussion
The goal of the current study was threefold: (1) to determine whether the implementation of
Six Sigma is positively linked to firm financial performance (2) to identify some key
moderators of the relationship between Six Sigma implementation and performance, and (3)
to compare managerial perceptions on Six Sigma performance with actual financial statement
performance data. The results of this empirical analysis produced several notable findings.
First, two determinants were pinpointed as being key moderators of the relationship between
Six Sigma implementation and firm financial performance: the breadth of Six Sigma
implementation and the company’s ability to track the status and financial outcomes of all Six
Sigma projects. Kaynak (2003) emphasizes the importance of quality data and reporting in
his research, which entails capabilities such as the ability to track quality measures. Also, one
of the critical factors tied to the success of Six Sigma at General Electric is the use of a project
tracking system (Henderson and Evans, 2000). The scope of Six Sigma implementation
36
throughout the company is equally important as tracking capabilities. Goh (2002) states in his
strategic assessment of Six Sigma that “extending the horizon of statistical thinking” to all
business areas within a company is a critical success factor linked to Six Sigma
implementation. Implementing Six Sigma as a company-wide endeavor creates a quality
culture throughout the organization which involves all employees, regardless of their
background or position in the company. Part of General Electric’s bottom line success with
Six Sigma is most likely attributed to their policy that all employees desiring a promotion
within the company must be a certified Six Sigma Green Belt (Henderson and Evans, 2000).
Not only is the scope of Six Sigma implementation directly related to bottom line results, but
the maturity of the implementation has demonstrated a positive relationship with Total Sales.
That is, the longer Six Sigma is implemented in a company, the more impact the program will
have on financial results. Hendricks and Singhal (2000) and Brah et al. (2002) also found a
positive relationship between the maturity of the TQM program and financial and quality
performance, respectively. On the other hand, this “maturity effect” appears to reach a
plateau after about three years after the adoption of the Six Sigma program, according to the
results of the industry model. This is most likely due to the increased amount of effort
required for a company to continuously improve after three or four years of working with Six
Sigma tools. In the beginning, results come quickly in response to such a drastic
organizational transformation. However, “peeling the next layer of the onion requires a
different set of investigative tools and new methodology” in addition to much more intense
effort (Murphy, 1998; quoted by Henderson and Evans, 2000).
Design for Six Sigma (DFSS) is an example of a new methodology that companies undertake
to work towards continuous improvement. This innovative tool which focuses on value
creation revealed a significant impact on Sales Growth and Six Sigma’s ability to increase
revenue (managerial perception). DFSS is an advanced tool usually adopted by companies
that have already implemented Six Sigma and/or “ lean.” Instead of DMAIC, it applies the
IDOV approach (Identify-Design-Optimize-Validate) in order to design a brand new product
or process design with the intention of delighting the customer (Gupta, 2001; Goh, 2002).
With this objective in mind, it is no surprise that DFSS contributes to the company’s bottom
line.
37
In addition to the factors that contributed directly to firm financial measures, two other
variables proved to be crucial in either reducing costs or increasing revenues in the eyes of
Six Sigma managers: the ability to track the status and financial outcomes of all Six Sigma
projects and the selection of strategically aligned projects. If a company does not have a
formal, organized tracking system for its projects, evaluating the progress of the projects and
therefore eliminating any non-value-adding ones from the agenda becomes more difficult
(Hahn, 2005). This coincides with the selection of projects that align with company strategic
goals. If the company invests its resources in the “wrong projects,” the company will have a
hard time achieving the “pay-off” for its Six Sigma investment.
Overall, the results emphasize the importance of the role of tracking projects and maintaining
a strategic, bottom-line focus. If companies implement Six Sigma without selecting the right
projects and without being able to consistently track their financial benefits, their efforts are
likely to be disappointing. This may partially explain the negative relationship between the
breadth of Six Sigma implementation and Return on Sales, for example. A company may
rush to make Six Sigma a company-wide initiative without first taking the time to select and
keep track of only the value-adding projects.
6. Conclusion
6.1 Theoretical Implications
Numerous empirical analyses have been performed in the past decade on various quality
management endeavors and their relationship to financial performance. However, minimal
empirical research has been done on Six Sigma implementation and its impact on bottom line
indicators. This study contributes to this gap in Six Sigma research. In addition, this study
presents two different sets of analyses: one based on managerial perception data gathered
from a diverse pallet of public and private American companies, and the other based on
financial data. Many quality management studies focus on one aspect or the other instead of
combining both. Last of all, this study includes an analysis which takes into account the
effectiveness of Six Sigma implementation over a 10-year time span. The rich, multi-faceted
nature of this research alone contributes to the very limited line of Six Sigma empirical
research.
38
6.2 Manager ial Implications
The results of this study have several important implications for managers. First, this research
took the critical success factors identified within the Six Sigma community and tied them
directly to financial measures and managerial perceptions. The results brought to light the
importance of selecting strategically aligned projects, tracking the status and financial
outcomes of these projects, and receiving the utmost support and commitment from top
management. Thus, a company could use this input as a guide when first implementing a Six
Sigma program or when attempting to pinpoint the reasons why the already implemented
program is not working up to par.
Second, managers should expect Six Sigma to reach a point of “stagnation” after 3 or 4 years
(where Six Sigma projects will still bring in positive absolute results, but no positive
incremental impact on the bottom line in comparison to the previous years). This means
managers should constantly look for ways to apply new tools and methodologies to not only
maintain the performance of Six Sigma within the company, but also better results year after
year. Design for Six Sigma is a good example of this innovate behavior and strongly
encouraged based on the output derived from this study. Most importantly, Six Sigma should
be viewed as a long-term investment and not as a “quick fix,” as dividends are not realized
until later on in the game.
Third, one of the questions in the survey asked the respondent to identify his/her top three
critical success factors with regards to Six Sigma implementation. This question was not
analyzed empirically, but the results are worth noting. A large percentage of respondents
indicated that having full-time Black Belts and Master Black Belts on staff is critical to Six
Sigma success. Interestingly, none of the analyses performed revealed any significance for
the BELTS variable. Although this does not imply that full-time Six Sigma experts are not an
important asset to implementation, it does suggest that managers should focus more on the
strategy of their Six Sigma projects rather than the number of experts that need to be hired or
trained.
Lastly, another question on the survey that was not empirically analyzed asked the respondent
to identify in which business areas in their respective companies Six Sigma has seen the

39
most/least success. Not surprisingly, finance, engineering, and manufacturing reigned as the
most successful sectors. Six Sigma was first implemented in these more structured, process-
oriented areas, as was mentioned in the first chapter of this paper. Forty-five percent of the
companies that implemented Six Sigma in their sales and marketing departments, however,
indicated that these two business areas saw the least improvement. This outcome very well
could be related to the fairly novel integration of Six Sigma into sales and marketing.
Nevertheless, managers should hone in on their sales and marketing processes and try to
pinpoint what exactly is going wrong in these business areas.
6.3 L imitations and Suggestions for Fur ther Research
Although this study produced useful and interesting findings, there are several limitations to
discuss as well as possible avenues for future research. First of all, this study examined a
fairly small sample size of only companies that have implemented Six Sigma. Future
researchers could look at a larger sample of companies that have implemented Six Sigma and
those that haven’ t. The benefits/downfalls of Six Sigma may shine through more clearly
when employing such a comparative study.
Second, this study examined a “snapshot” of the key success factors and bottom line impact
of Six Sigma for the year 2006. This is valuable information, however it would be even more
interesting to gather managerial perception data over time and perform a panel analysis across
various years and companies. A longitudinal analysis examining one company over time
(before and after Six Sigma implementation) would be equally interesting.
Third, it was very difficult to account for industry effects in this study since nine different
industries were involved. Many quality management studies focus on just a few industry
sectors and examine trends within those industries only. For example, it may be more
thorough to analyze a sample of companies in manufacturing and health (the two most
prominent sectors in this study’s sample) and compare the results. Six Sigma is a
continuously-evolving tool, and this will most likely open even more doors for future research
opportunities in the field.
40
References
Adam et al. (1997). “An international study of quality improvement approach and firm performance.” International Journal of Operations and Production Management 17: 842-873. Antony, Jiju. (2004) “Some pros and cons of six sigma: an academic perspective.” The TQM Magazine 16(4): 303-306. Antony, Jiju. (2006). “Six sigma for service processes.” Business Process Management 12(2): 234-248. Antony, Jiju, Antony, Frenie Jiju, Kumar, Maneesh, and Byung Rae Cho. (2007). “Six sigma in service organizations.” International Journal of Quality and Reliability Management 24(3): 294-311. Bañuelas, Ricardo, and Jiju Antony. (2003). “Going from six sigma to design for six sigma: an exploratory study using analytic hierarchy process.” The TQM Magazine 15(5): 334-44. Behara, Ravi S., Fontenot, Gwen F., and Alicia Gresham. (1995). “Customer satisfaction measurement and analysis using six sigma.” International Journal of Quality and Reliability Management 12(3): 9-18. Brah, Shaukat A., Wong, Jen Li, and B. Madhu Rao. (2000). “TQM and business performance in the service sector: a Singapore study.” International Journal of Operations and Production Management 20(11): 1293-1312. Brah, Shaukat A., Tee, Serene S.L., and B. Madhu Rao. (2002). “Relationship between TQM and performance of Singapore companies.” International Journal of Quality and Reliability Management 19(4): 356-79. Chenhall, R.H. (1997). “Reliance on manufacturing performance, total quality management and organizational performance.” Management Accounting Research 8: 187-206. Chileshe, Nicholas, and Paul Watson. (2000). “ Investigating the Rationale for Pursuing Total Quality Management (TQM) as a Valid Competitive Strategy for SME’s.” In proceedings of the second South African conference on Sustainable Development in the Built Environment, 23-25 Aug., Pretoria, South Africa. Clifford, Lee. (2001, Jan. 22). “Why You Can Safely Ignore Six Sigma.” Fortune Magazine. Retrieved on January 13, 2007, from http://www.kellogg.northwestern.edu/faculty/savaskan/OPNSQuality/Why%20you%20can%20safely%20ignore%20Six%20Sigma%20%20Fortune%20%202001.pdf

41
Cooper, Robert G., Edgett, Scott J., and Elko J. Kleinschmidt. (2002). “Optimizing the Stage-Gate Process: What Best-Practice Companies Do-II.” Research Technology Management 45(6): 43-49. Corbett, Charles J., Montes-Sancho, Maria J., David A Kirsch. (2005). “The Financial Impact of ISO 9000 Certification in the US: An Empirical Analysis.” Management Science 51: 1046-1059. Creveling, Clyde M., Hambleton, Lynne, and Burke McCarthy. (2006). “Six Sigma for Marketing Processes: An Overview for Marketing Executives, Leaders, and Managers.” New Jersey: Prentice Hall. Crockett, Roger O., and Jena McGregor. (2006, Dec. 4). “Six Sigma Still Pays Off At Motorola.” Business Week, 50. Das, A., Handfield, R.B., Calantone, R.J., and S. Ghosh. (2000). “A contingent view of quality management-the impact of international competition on quality.” Decision Sciences 31: 649-690. Dimara, Efthalia, Skuras, Dimitris, Tsekouras, Kostas, and Stavros Goutsos. (2004). “Strategic orientation and financial performance of firms implementing ISO 9000.” International Journal of Quality and Reliability Management 21(1): 72-89. Dobbs, Richard, and Timothy Koller. (2005). “Measuring Long-Term Performance.” The McKinsey Quarterly Number 1: 17-27. Douglas, T.J., and W.Q. Judge Jr. (2001). “Total quality management implementation and competitive advantage: the role of structural control and exploration.” Academy of Management Journal 44: 158-169. Easton, George S., and Sherry L. Jarrell. (1998). “The Effects of Total Quality Management on Corporate Performance: An Empirical Investigation.” The Journal of Business 71(2): 253-307. Feridun, Mete, and Husam Aldeen Alkhadesh. (2006) "Impact of Strategic Initiatives in Management Accounting on Corporate Financial Performance: Evidence from Amman Stock Exchange.” Managing Global Transitions 4(4): 299-312. Forker, L.B., Mendez, D., and J.C. Hershauer. (1997). “Total quality management in the supply chain: what is its impact on performance?” International Journal of Production Research 35(6): 1681-1701. Galloway, David. (2007). Certified Six Sigma Black Belt, NewPage Corporation. Goh, T.N. (2002) “A Strategic Assessment of Six Sigma.” Quality and Reliability Engineering International 18: 403-10.

42
Guilló, Juan José Tarí, and José Francisco Molina Azorín. “ Impacto de la gestión de la calidad en los resultados: un estudio empírico en empresas certificadas.” Working paper, Faculty of Business and Economic Science, University of Alicante (Spain). Retrieved on January 10, 2007 from http://www.acede.org/index_archivos/CDMurcia/Indice%20de%20Autores/documentos/IdP164.pdf. Hahn, G.J. (2005) “Six Sigma: 20 Key Lessons Learned.” Quality and Reliability Engineering International 21: 225-33. Heinloth, Stefan. (2000, Feb.). “Measuring Quality’s Return on Investment: is your system earning its keep?” Quality Digest. Retrieved on January 10, 2007 from http://www.qualitydigest.com/feb00/html/measure.html. Henderson, Kim M. and James R. Evans. (2000). “Successful implementation of Six Sigma: benchmarking General Electric Company.” Benchmarking: An International Journal 7(4): 280-81. Hendricks, K.B., and V.R. Singhal. (1997). “Does Implementing a TQM Program Actually Improve Operating Performance? Empirical Evidence from Firms That Have Won Quality Awards.” Management Science 43(9): 1258-1274. Hendricks, Kevin B., and Vinod R. Singhal. (2000). “Firm characteristics, total quality management, and financial performance.” Journal of Operations Management 238: 1-17. Heras, Iñaki, Dick, Gavin P.M., and Martí Casadesús. (2002). “ ISO 9000 registration’s impact on sales and profitability: a longitudinal analysis of performance before and after accreditation.” International Journal of Quality and Reliability Management 19(6): 774-91. Hoffman, Thomas. (2006, Oct. 30). “ Investing in Six Sigma: Bank of America’s quality drive is paying off.” ComputerWorld, 24, 26, 28. Ittner, C.D. and Larcker D.F. (2003). “Coming Up Short on Nonfinancial Performance Measurement.” Harvard Business Review 82(2): 88-95. Ittner, Christopher D., and David F. Larcker. (1997). “The Performance Effects of Process Management Techniques.” Management Science 43(4), 522-34. Kaplan, Robert S., and David P. Norton. (1992). “The Balanced Scorecard-Measures That Drive Performance.” Harvard Business Review 70(1): 71-79. Kaynak, Hale. (2003). “The relationship between total quality management practices and their effects on firm performance.” Journal of Operations Management 21: 405-435.

43
Kennedy, Peter. (2003). “A Guide to Econometrics.” 5th ed. Massachusetts: Blackwell Publishing. Kuei, Chu-Hua, and Christian N. Madu. (2003). “Customer-centric six sigma quality and reliability management.” International Journal of Quality and Reliability Management 20(8): 954-64.
LaCoursière, R., Fabi, B., St. Pierre, J., et M. Arcand. (2005). "Effets de certaines pratiques de GRH sur la performance de PME manufacturières : vérification de l'approche universaliste." Revue internationale PME 18(2) : 43-75.
Linderman, Kevin, Schroeder, Roger G., and Adrian S. Choo. (2006) “Six sigma: The role of goals in improvement teams.” Journal of Operations Management 24: 779-90. Linderman, Kevin, Schroeder, Roger G., Zaheer, Srilata, and Adrian S. Choo. (2003). “Six Sigma: a goal-theoretic perspective.” Journal of Operations Management 21: 193-203. Lindgreen, Adam and Shergill, Gurvinder Singh. (2003). "Customer Relationship Management Programs and their Impact on the Financial Performance of Businesses: A Proposed Model." Massey University Commerce Working Paper No. 03.05. Retrieved on January 11, 2007 from SSRN: http://ssrn.com/abstract=519202. Mann, Robin, and Dennis Kehoe. (1994). "An Evaluation of the Effects of Quality Improvement Activities on Business Performance.” International Journal of Quality and Reliability Management 11(4): 29-44. Martinez-Lorente, Angel R., Dewhurst, Frank W., and Alejandrino Gallego-Rodriguez. (2000). “Relating TQM, marketing, and business performance: an exploratory study.” International Journal of Production Research 38(14): 3227-3246. Marx, Michael. (2007, Jan./Feb.). “Six Sigma Saves a Fortune.” iSixSigmaMagazine, 30-35. McAdam, Rodney, and Brendan Lafferty. (2004). “A multilevel case study critique of six sigma: statistical control or strategic change?” International Journal of Operations and Production Management 24(5): 530-49. Mohrman, S.A., Tenkasi, R.V., Lawler III, EE., and G.G. Ledford Jr. (1995). “Total quality management practice and outcomes in the largest US firms.” Employee Relations 17(3), 26-41. Mokhtar, Mohammed Zulkifli, Karbhari, Yusuf, and Kamal Naser. (2005) “Company Performance and ISO 9000 Registration.” Asia Pacific Business Review 11(3): 349-367.
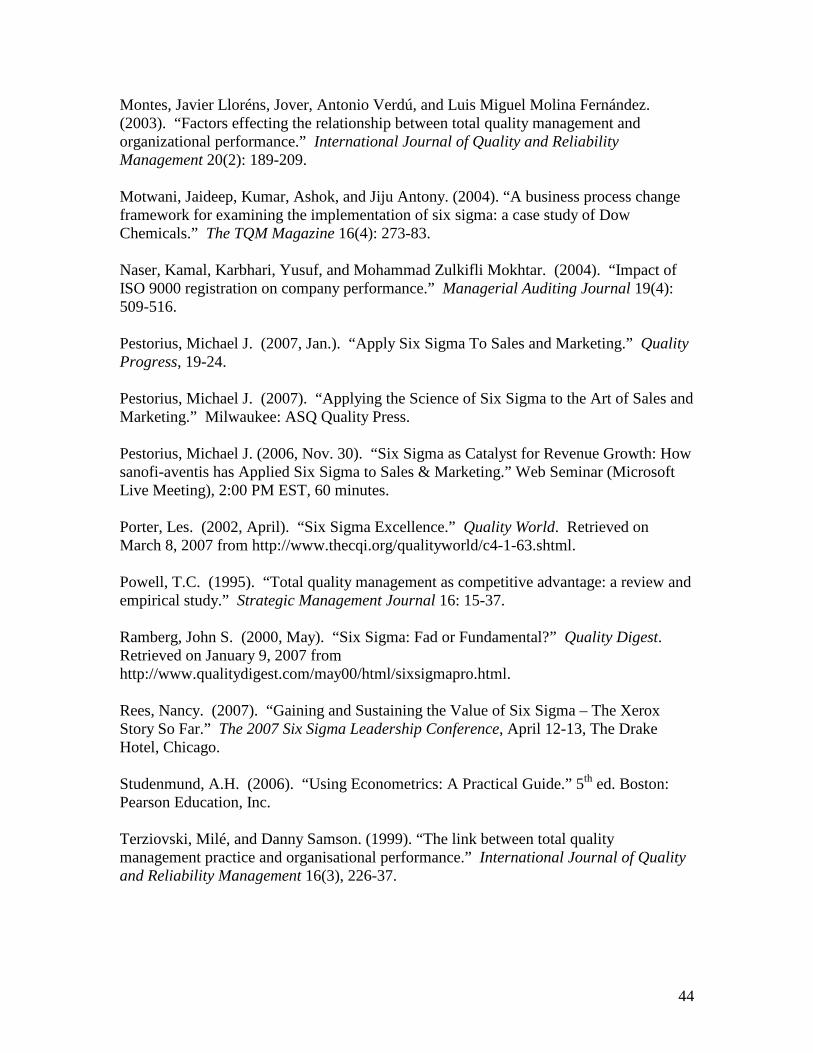
44
Montes, Javier Lloréns, Jover, Antonio Verdú, and Luis Miguel Molina Fernández. (2003). “Factors effecting the relationship between total quality management and organizational performance.” International Journal of Quality and Reliability Management 20(2): 189-209. Motwani, Jaideep, Kumar, Ashok, and Jiju Antony. (2004). “A business process change framework for examining the implementation of six sigma: a case study of Dow Chemicals.” The TQM Magazine 16(4): 273-83. Naser, Kamal, Karbhari, Yusuf, and Mohammad Zulkifli Mokhtar. (2004). “ Impact of ISO 9000 registration on company performance.” Managerial Auditing Journal 19(4): 509-516. Pestorius, Michael J. (2007, Jan.). “Apply Six Sigma To Sales and Marketing.” Quality Progress, 19-24.
Pestorius, Michael J. (2007). “Applying the Science of Six Sigma to the Art of Sales and Marketing.” Milwaukee: ASQ Quality Press. Pestorius, Michael J. (2006, Nov. 30). “Six Sigma as Catalyst for Revenue Growth: How sanofi-aventis has Applied Six Sigma to Sales & Marketing.” Web Seminar (Microsoft Live Meeting), 2:00 PM EST, 60 minutes. Porter, Les. (2002, April). “Six Sigma Excellence.” Quality World. Retrieved on March 8, 2007 from http://www.thecqi.org/qualityworld/c4-1-63.shtml. Powell, T.C. (1995). “Total quality management as competitive advantage: a review and empirical study.” Strategic Management Journal 16: 15-37. Ramberg, John S. (2000, May). “Six Sigma: Fad or Fundamental?” Quality Digest. Retrieved on January 9, 2007 from http://www.qualitydigest.com/may00/html/sixsigmapro.html. Rees, Nancy. (2007). “Gaining and Sustaining the Value of Six Sigma – The Xerox Story So Far.” The 2007 Six Sigma Leadership Conference, April 12-13, The Drake Hotel, Chicago. Studenmund, A.H. (2006). “Using Econometrics: A Practical Guide.” 5th ed. Boston: Pearson Education, Inc. Terziovski, Milé, and Danny Samson. (1999). “The link between total quality management practice and organisational performance.” International Journal of Quality and Reliability Management 16(3), 226-37.
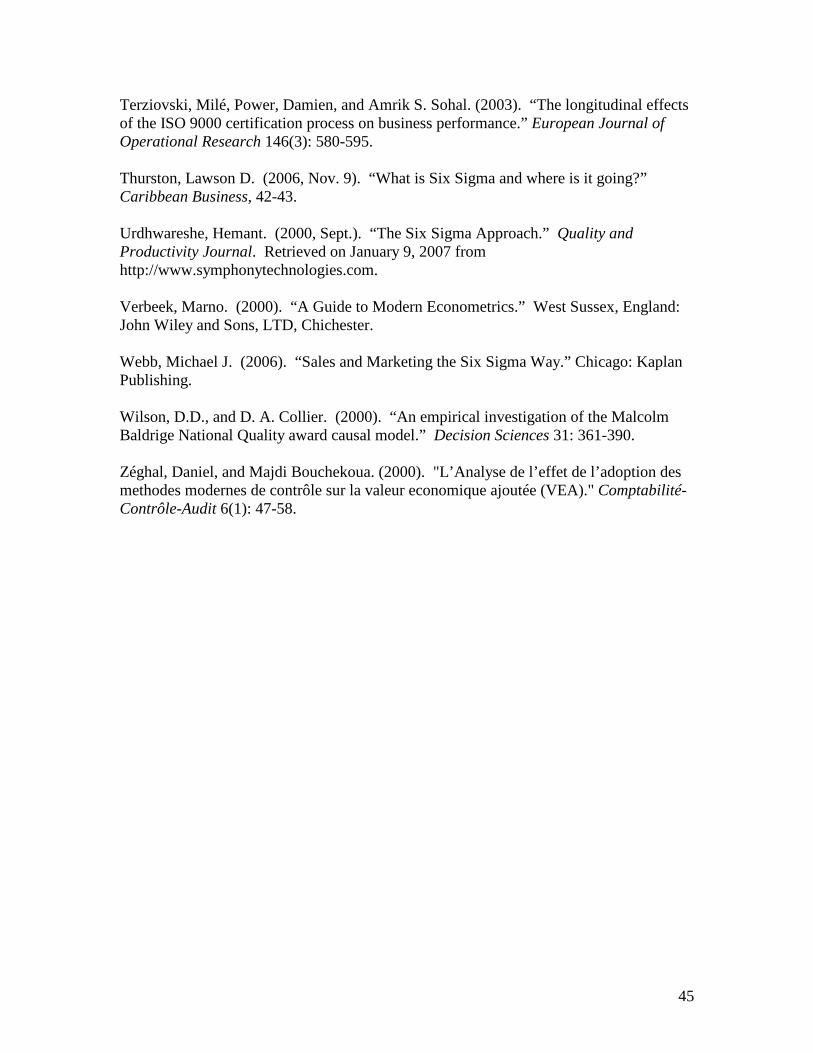
45
Terziovski, Milé, Power, Damien, and Amrik S. Sohal. (2003). “The longitudinal effects of the ISO 9000 certification process on business performance.” European Journal of Operational Research 146(3): 580-595. Thurston, Lawson D. (2006, Nov. 9). “What is Six Sigma and where is it going?” Caribbean Business, 42-43. Urdhwareshe, Hemant. (2000, Sept.). “The Six Sigma Approach.” Quality and Productivity Journal. Retrieved on January 9, 2007 from http://www.symphonytechnologies.com. Verbeek, Marno. (2000). “A Guide to Modern Econometrics.” West Sussex, England: John Wiley and Sons, LTD, Chichester. Webb, Michael J. (2006). “Sales and Marketing the Six Sigma Way.” Chicago: Kaplan Publishing. Wilson, D.D., and D. A. Collier. (2000). “An empirical investigation of the Malcolm Baldrige National Quality award causal model.” Decision Sciences 31: 361-390. Zéghal, Daniel, and Majdi Bouchekoua. (2000). "L’Analyse de l’effet de l’adoption des methodes modernes de contrôle sur la valeur economique ajoutée (VEA)." Comptabilité-Contrôle-Audit 6(1): 47-58.
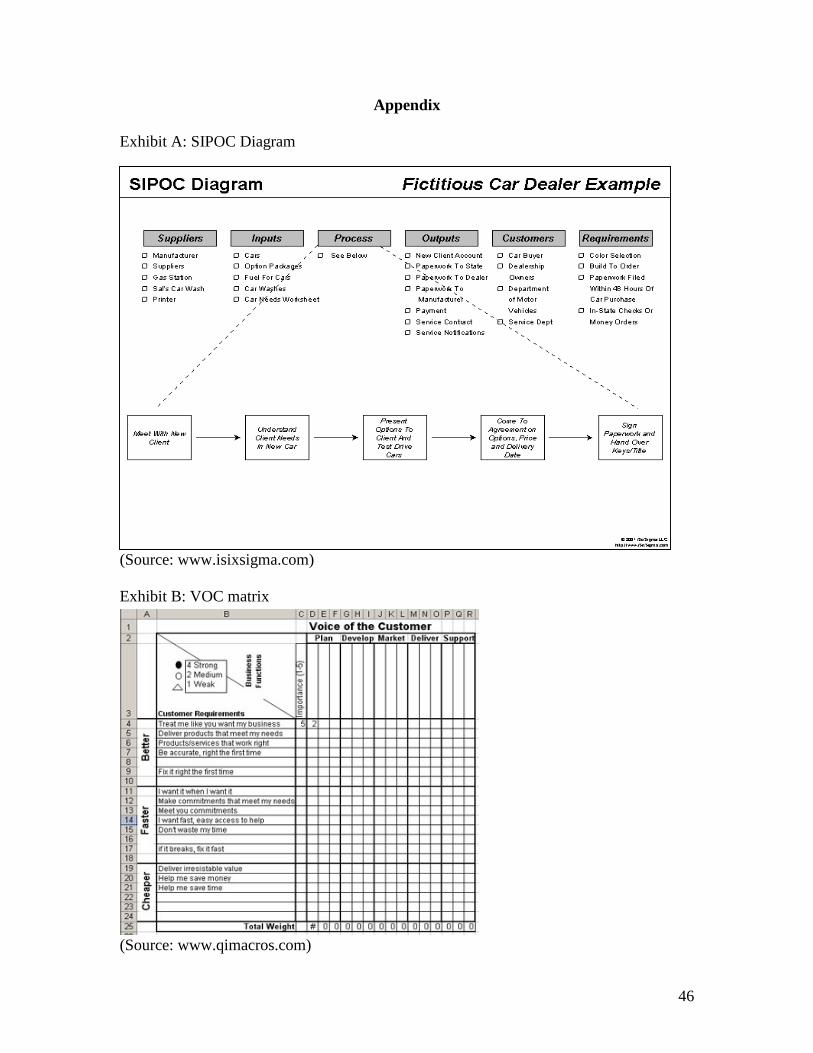
46
Appendix
Exhibit A: SIPOC Diagram
(Source: www.isixsigma.com) Exhibit B: VOC matrix
(Source: www.qimacros.com)
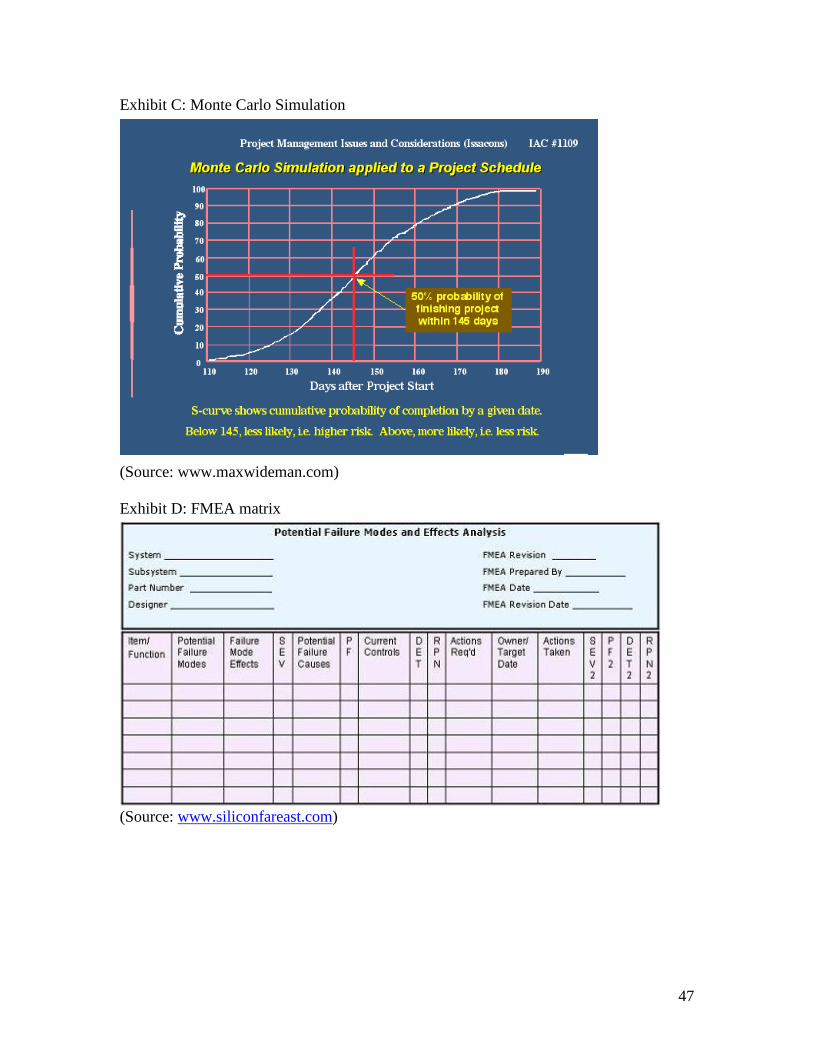
47
Exhibit C: Monte Carlo Simulation
(Source: www.maxwideman.com) Exhibit D: FMEA matrix
(Source: www.siliconfareast.com)

48
Exhibit E: Process Sigma Calculation
(Source: www.statgraphics.com) Table 1: Six Sigma Certified Titles and Definitions
TITLE DEFINITION Master Black Belt Six Sigma Quality Experts responsible for the
strategic implementations within an organization. Their main responsibilities include training and mentoring Black Belts and Green Belts, helping to prioritize, select and charter high-impact projects; maintaining the integrity of the Six Sigma measurements, improvements and tollgates; and developing, maintaining and revising Six Sigma training materials. The Master Black Belt should be qualified to teach other Six Sigma facilitators the methodologies, tools, and applications in all functions and levels of the company, and should be a resource for utilizing statistical process control within processes.
Black Belt Six Sigma team leaders responsible for implementing process improvement projects (DMAIC or DFSS) within the business -- to increase customer satisfaction levels and business productivity. Black Belts are knowledgeable and skilled in the use of the Six Sigma methodology and tools. Black Belts have typically completed four weeks of Six Sigma training, and have demonstrated mastery of the subject matter through the completion of project(s) and an exam.
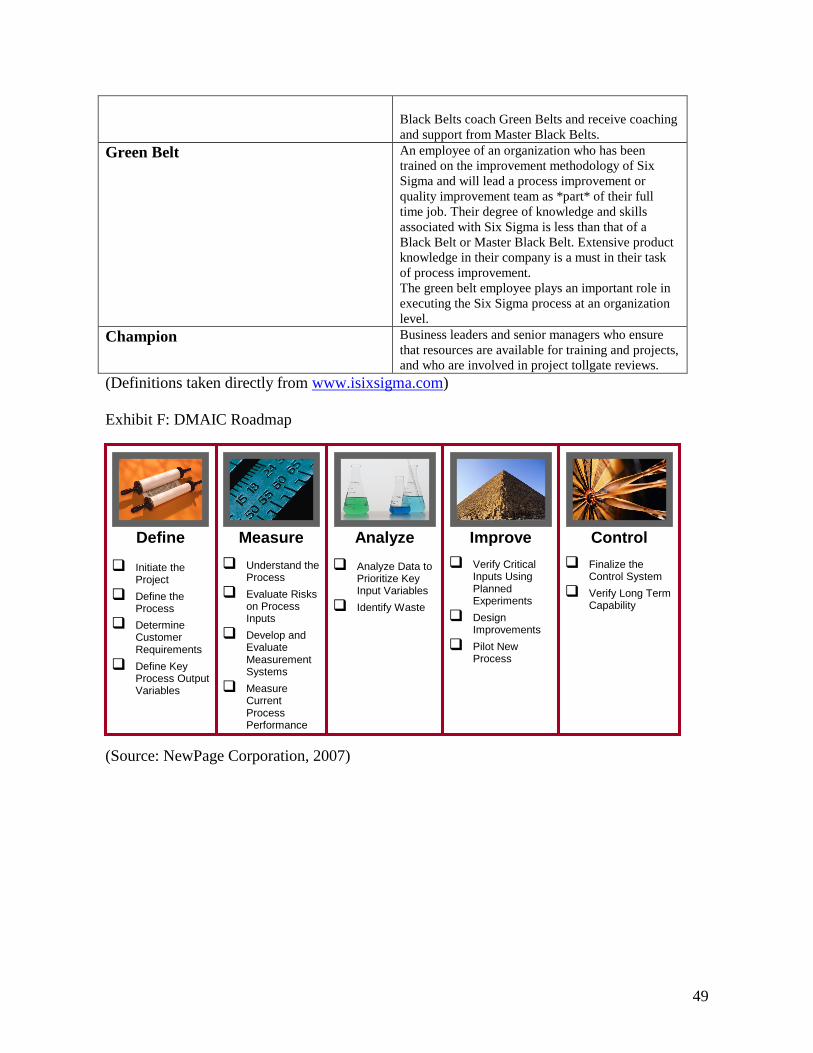
49
Black Belts coach Green Belts and receive coaching and support from Master Black Belts.
Green Belt An employee of an organization who has been trained on the improvement methodology of Six Sigma and will lead a process improvement or quality improvement team as *part* of their full time job. Their degree of knowledge and skills associated with Six Sigma is less than that of a Black Belt or Master Black Belt. Extensive product knowledge in their company is a must in their task of process improvement. The green belt employee plays an important role in executing the Six Sigma process at an organization level.
Champion Business leaders and senior managers who ensure that resources are available for training and projects, and who are involved in project tollgate reviews.
(Definitions taken directly from www.isixsigma.com) Exhibit F: DMAIC Roadmap
(Source: NewPage Corporation, 2007)
Define Measure Analyze Improve Control
��Initiate the Project
��Define the Process
��Determine Customer Requirements
��Define Key Process Output Variables
��Understand the Process
��Evaluate Risks on Process Inputs
��Develop and Evaluate Measurement Systems
��Measure Current Process Performance
��Analyze Data to Prioritize Key Input Variables
��Identify Waste
��Verify Critical Inputs Using Planned Experiments
��Design Improvements
��Pilot New Process
��Finalize the Control System
��Verify Long Term Capability
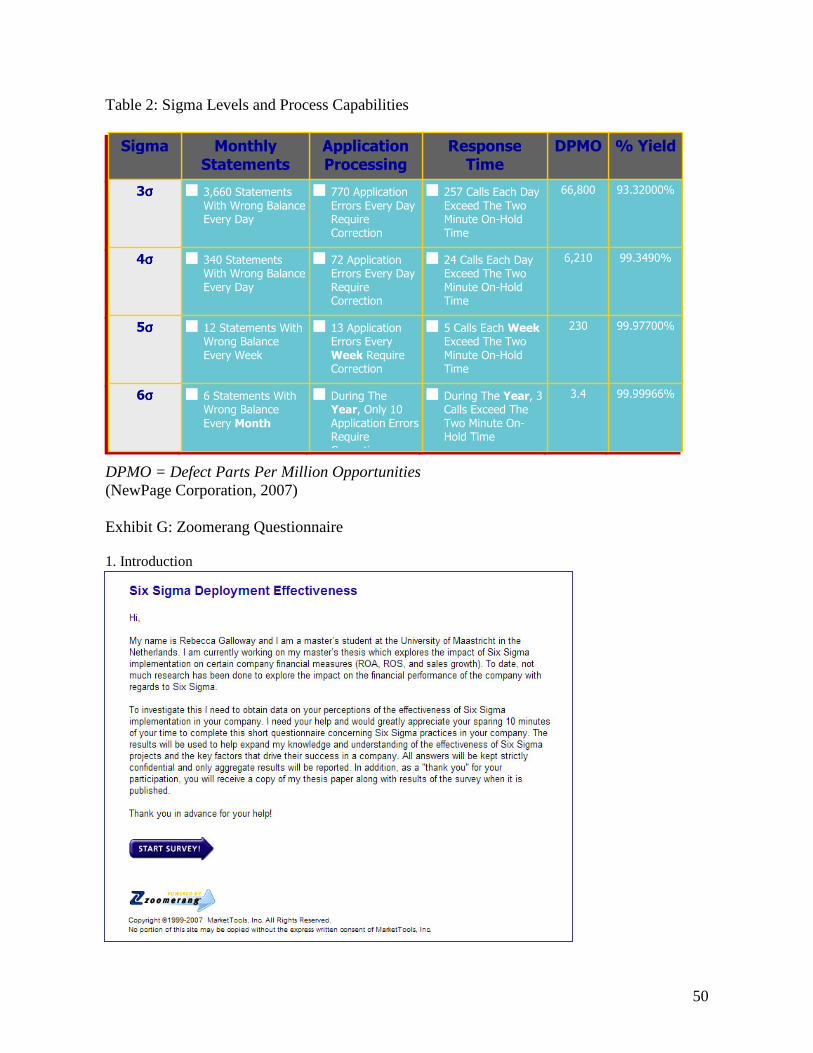
50
Table 2: Sigma Levels and Process Capabilities DPMO = Defect Parts Per Million Opportunities (NewPage Corporation, 2007) Exhibit G: Zoomerang Questionnaire 1. Introduction
��������
����������
���������
��������
��������
���
�����
�� ��
����
����
�� ��� ��
�����
■ ����������������������������������� !"��# $%����
��&��
■ ���������������������������������
�� !"��# $%������&��
■ ���������������������������������
�� !"��# $%������&��
■ �!'� (������������������������������
������ !"��# $%������&��
������������
���� ����
■ ��)**����"�� ��''�'���+�'������,�-!�'��
��''��"�� �
■ ��)**����"�� ��''�'���+�'������
,�-!�'����''��"�� �
■ ��)**����"�� ��''�'���+�'��
�����,�-!�'����''��"�� �
■ �!'� (�����������# ��� ��
)**����"�� ��''�'��,�-!�'��
��''��"�� �
�������
��������� �
■ ����."�"�&� "��/�"��/'� (�0��� ����+�'������
■ ����."�"�&� "��/�"��/'� (�0��� ���
�+�'������
■ ��."�"�&� "��/�"��/'� (�0��� ���
�+�'��/��1�
■ �."�"�&� "��/�"��/'� (�0��� ���
�+�'�������
������
�σσσσ�
�σσσσ�
σσσσ�
!σσσσ�
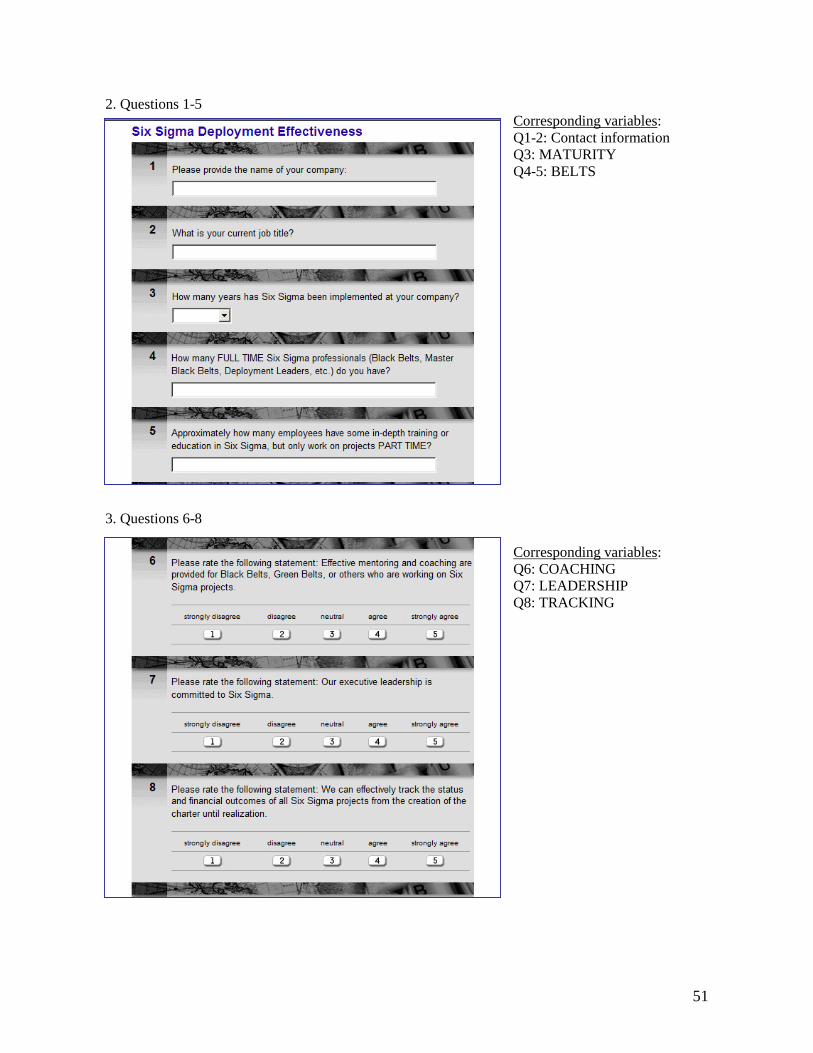
51
2. Questions 1-5 Corresponding variables: Q1-2: Contact information Q3: MATURITY Q4-5: BELTS
3. Questions 6-8
Corresponding variables: Q6: COACHING Q7: LEADERSHIP Q8: TRACKING
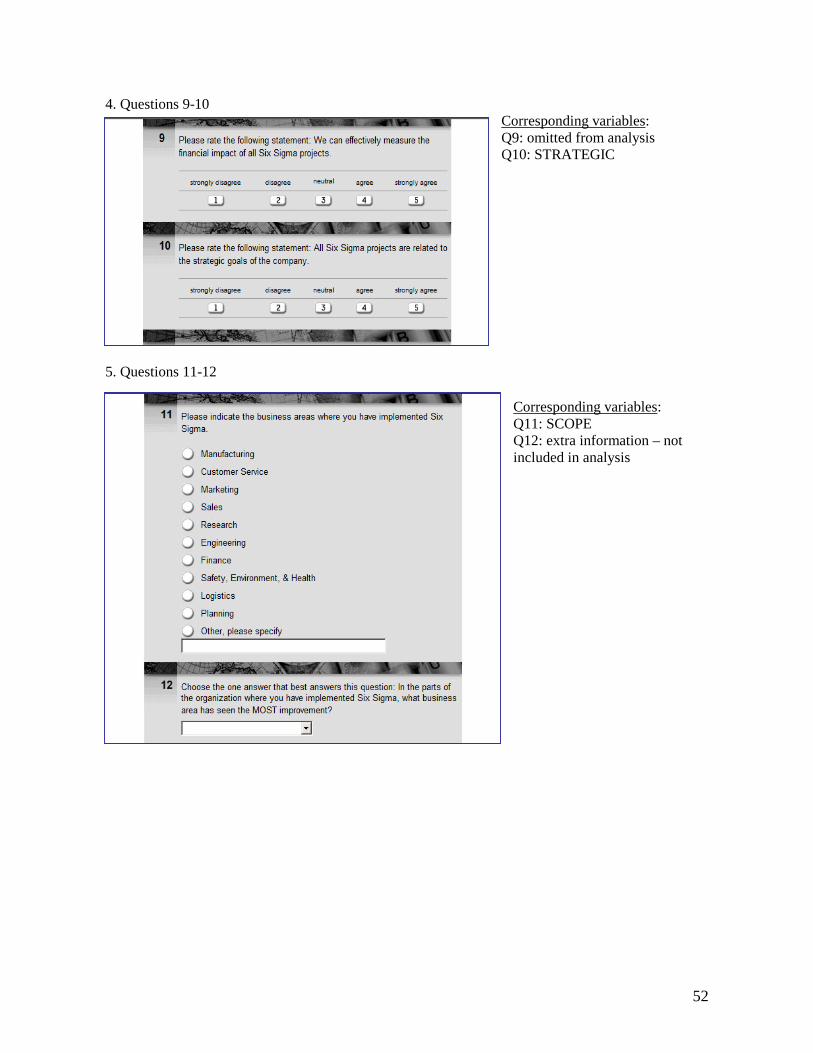
52
4. Questions 9-10 Corresponding variables: Q9: omitted from analysis Q10: STRATEGIC
5. Questions 11-12 Corresponding variables: Q11: SCOPE Q12: extra information – not included in analysis

53
6. Questions 13-15 Corresponding variables: Q13: extra information – not included in analysis Q14: COSTS Q15: REVENUE
7. Questions 16-19
Corresponding variables: Q16: DFSS Q17: LSS Q18: extra information – not included in analysis Q19: PERCROI
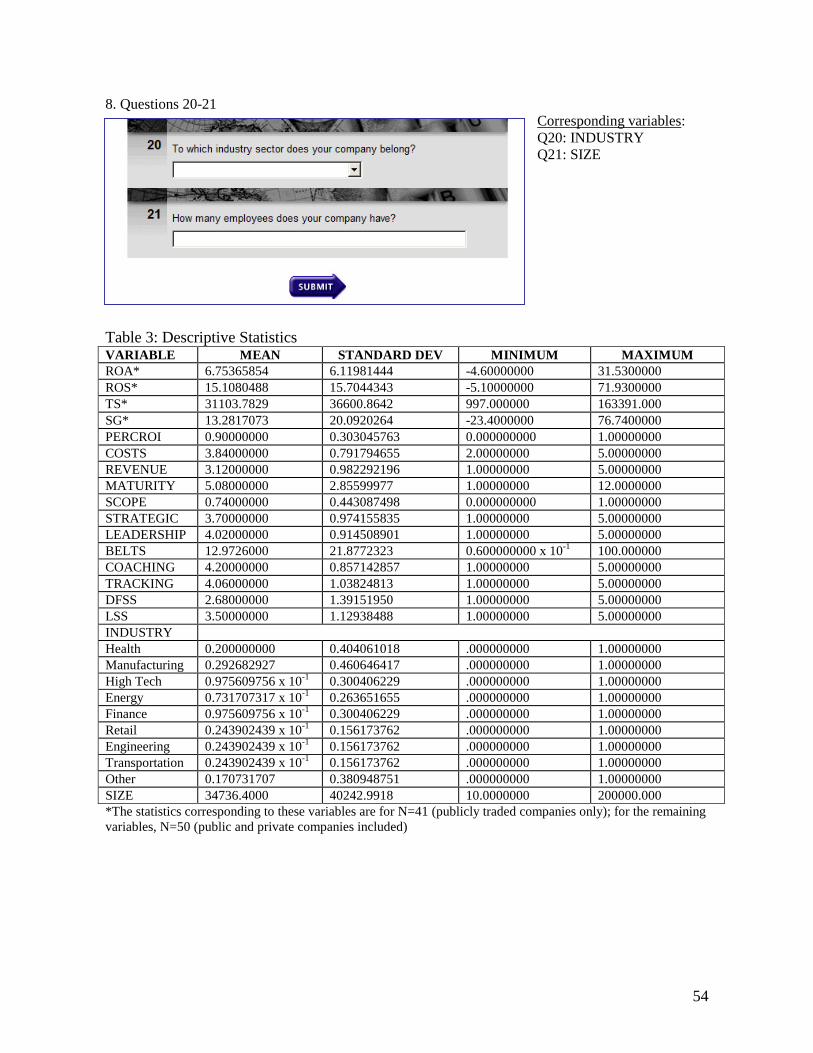
54
8. Questions 20-21 Corresponding variables: Q20: INDUSTRY Q21: SIZE
Table 3: Descriptive Statistics VARIABLE MEAN STANDARD DEV MINIMUM MAXIMUM ROA* 6.75365854 6.11981444 -4.60000000 31.5300000 ROS* 15.1080488 15.7044343 -5.10000000 71.9300000 TS* 31103.7829 36600.8642 997.000000 163391.000 SG* 13.2817073 20.0920264 -23.4000000 76.7400000 PERCROI 0.90000000 0.303045763 0.000000000 1.00000000 COSTS 3.84000000 0.791794655 2.00000000 5.00000000 REVENUE 3.12000000 0.982292196 1.00000000 5.00000000 MATURITY 5.08000000 2.85599977 1.00000000 12.0000000 SCOPE 0.74000000 0.443087498 0.000000000 1.00000000 STRATEGIC 3.70000000 0.974155835 1.00000000 5.00000000 LEADERSHIP 4.02000000 0.914508901 1.00000000 5.00000000 BELTS 12.9726000 21.8772323 0.600000000 x 10⁻¹ 100.000000 COACHING 4.20000000 0.857142857 1.00000000 5.00000000 TRACKING 4.06000000 1.03824813 1.00000000 5.00000000 DFSS 2.68000000 1.39151950 1.00000000 5.00000000 LSS 3.50000000 1.12938488 1.00000000 5.00000000 INDUSTRY Health 0.200000000 0.404061018 .000000000 1.00000000 Manufacturing 0.292682927 0.460646417 .000000000 1.00000000 High Tech 0.975609756 x 10⁻¹ 0.300406229 .000000000 1.00000000 Energy 0.731707317 x 10⁻¹ 0.263651655 .000000000 1.00000000 Finance 0.975609756 x 10⁻¹ 0.300406229 .000000000 1.00000000 Retail 0.243902439 x 10⁻¹ 0.156173762 .000000000 1.00000000 Engineering 0.243902439 x 10⁻¹ 0.156173762 .000000000 1.00000000 Transportation 0.243902439 x 10⁻¹ 0.156173762 .000000000 1.00000000 Other 0.170731707 0.380948751 .000000000 1.00000000 SIZE 34736.4000 40242.9918 10.0000000 200000.000 *The statistics corresponding to these variables are for N=41 (publicly traded companies only); for the remaining variables, N=50 (public and private companies included)