Embed Size (px)
Citation preview
Final report on the Surface stations project
Siting matters, and the numbers show just how much.
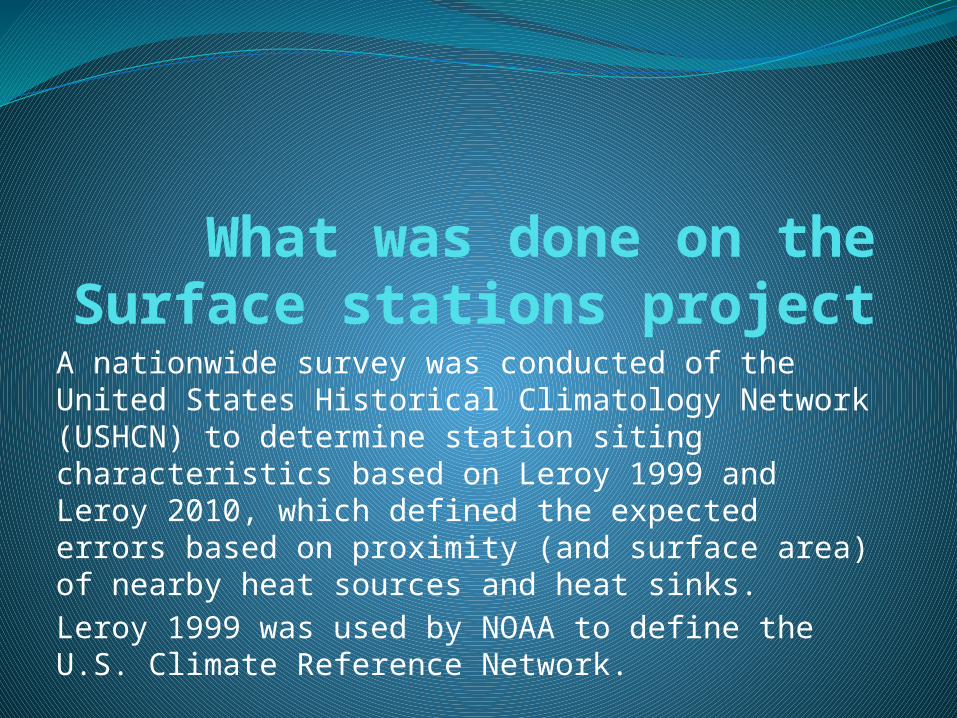
What was done on the Surface stations project
A nationwide survey was conducted of the United States Historical Climatology Network (USHCN) to determine station siting characteristics based on Leroy 1999 and Leroy 2010, which defined the expected errors based on proximity (and surface area) of nearby heat sources and heat sinks.Leroy 1999 was used by NOAA to define the U.S. Climate Reference Network.
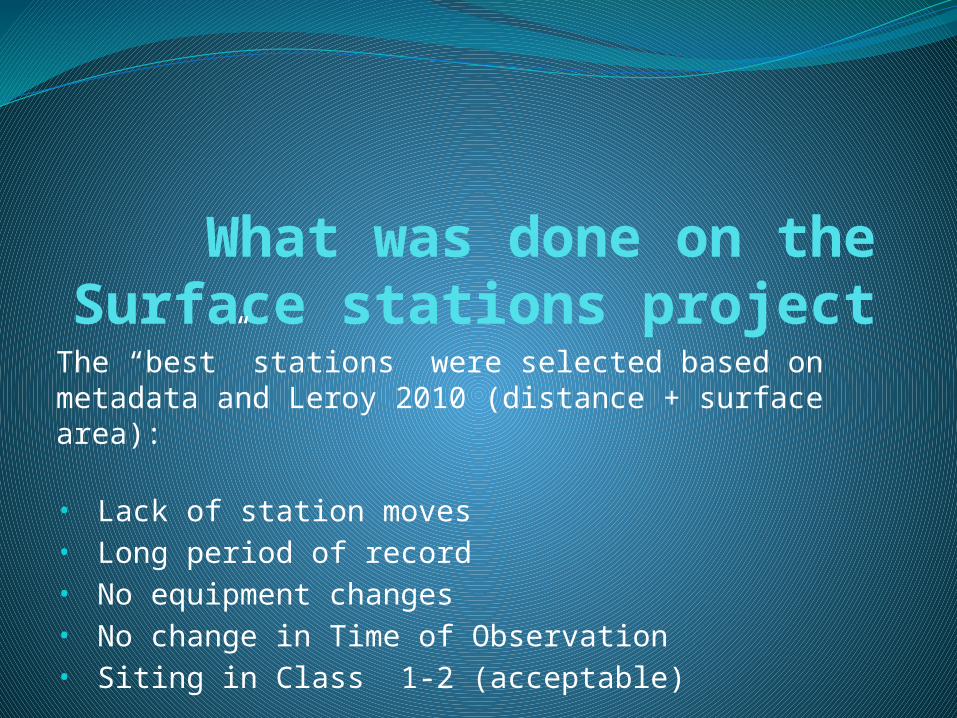
What was done on the Surface stations project
The “best” stations were selected based on metadata and Leroy 2010 (distance + surface area):
• Lack of station moves• Long period of record• No equipment changes• No change in Time of Observation• Siting in Class 1-2 (acceptable)
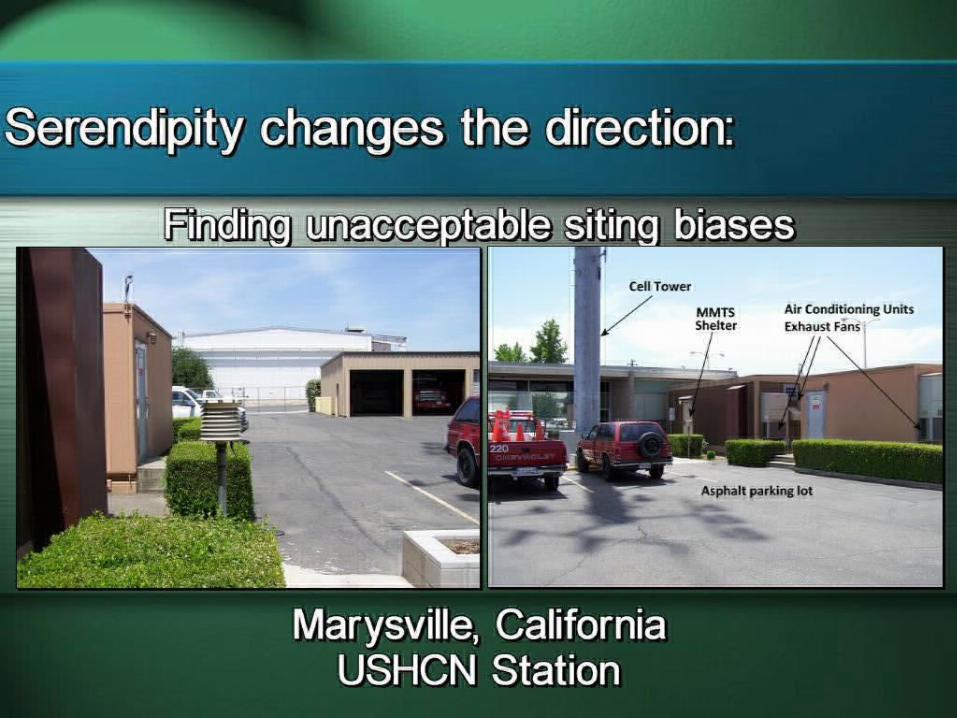
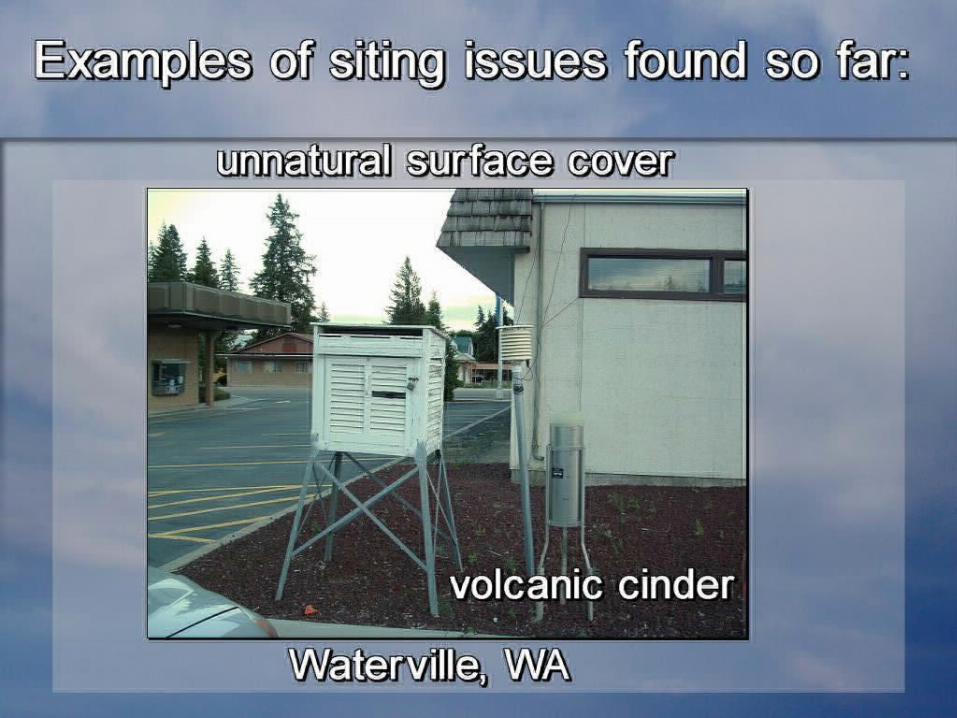
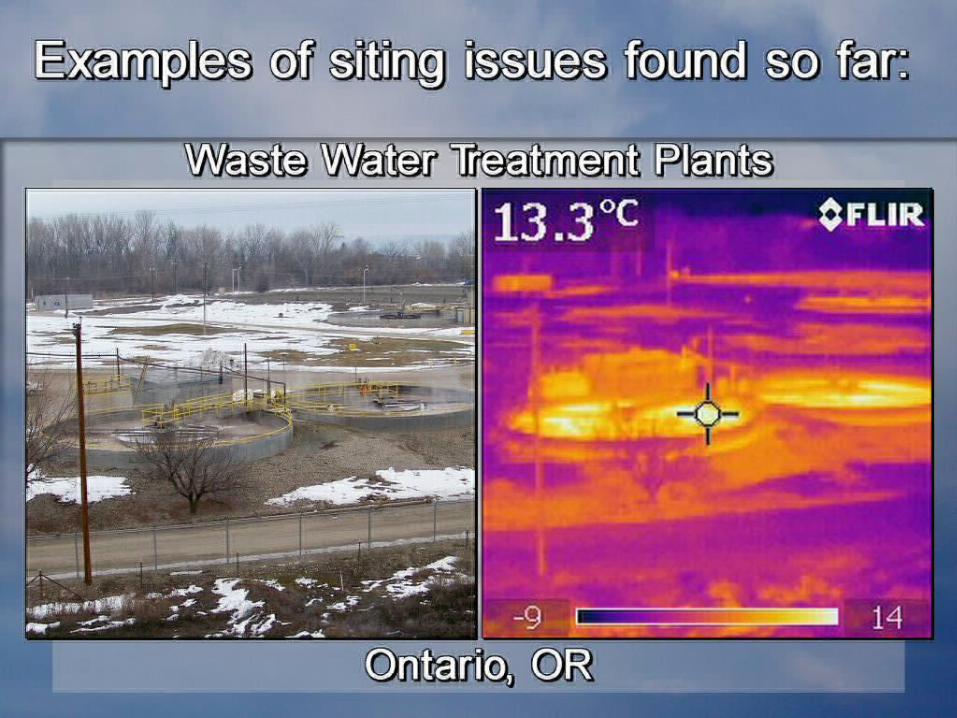
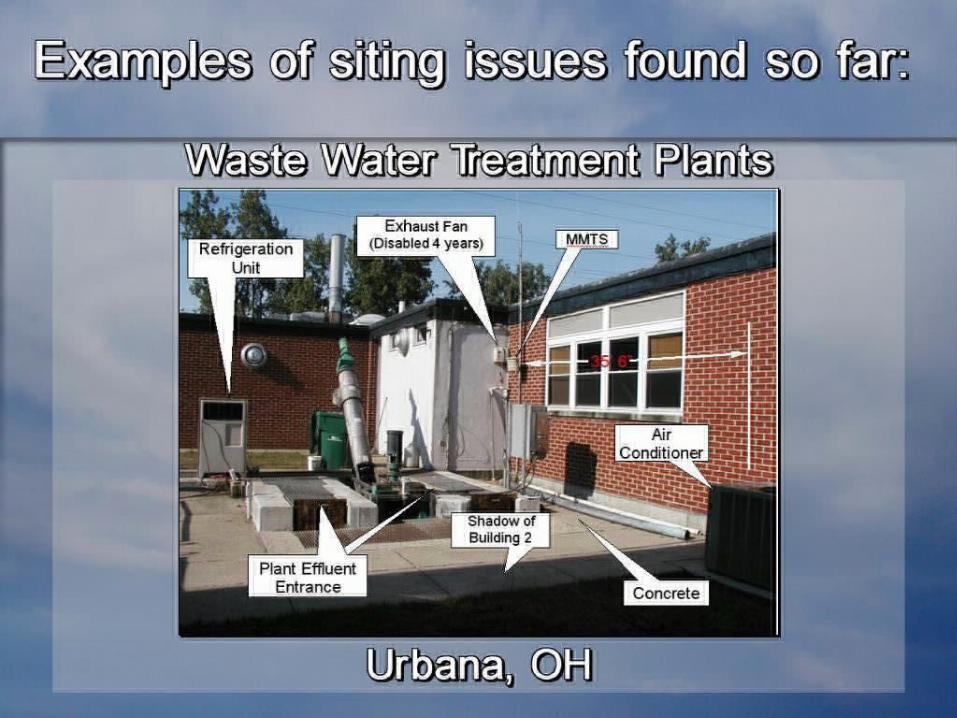
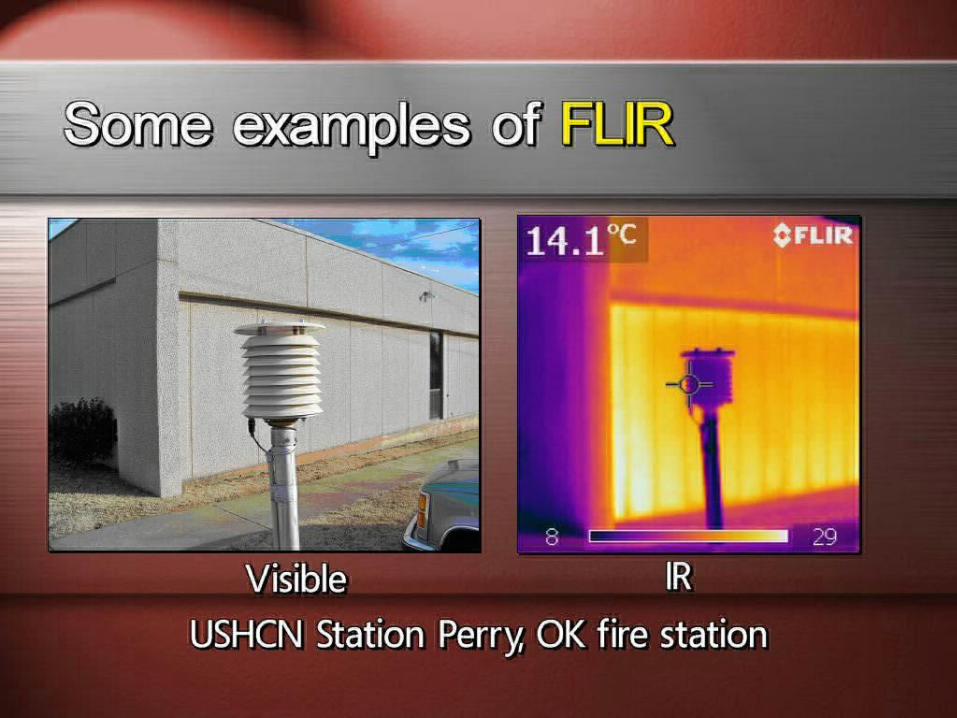
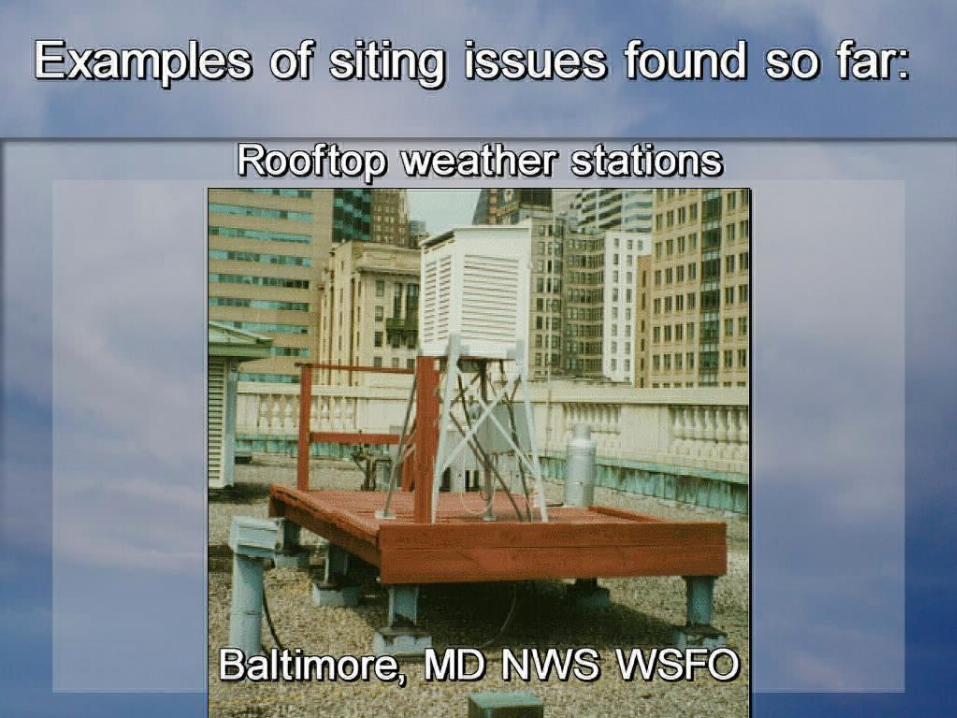
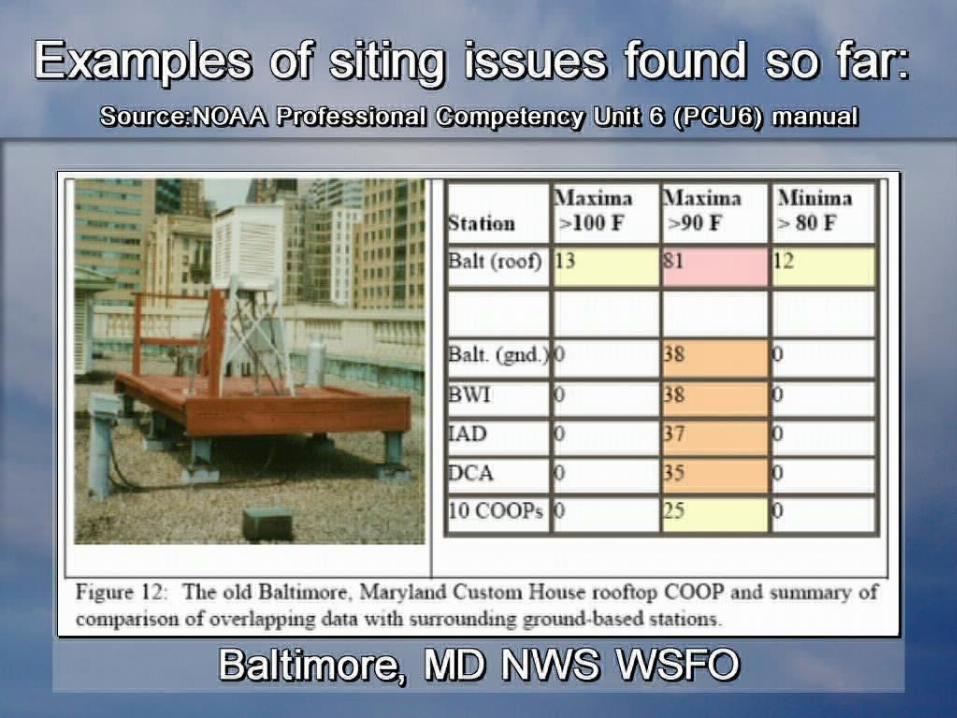
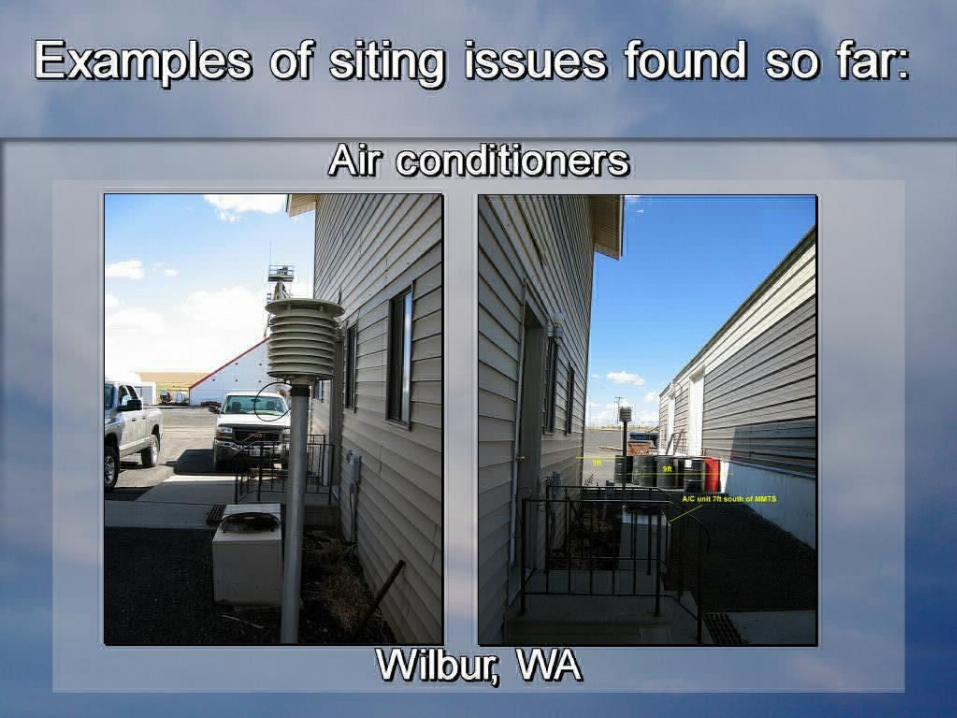
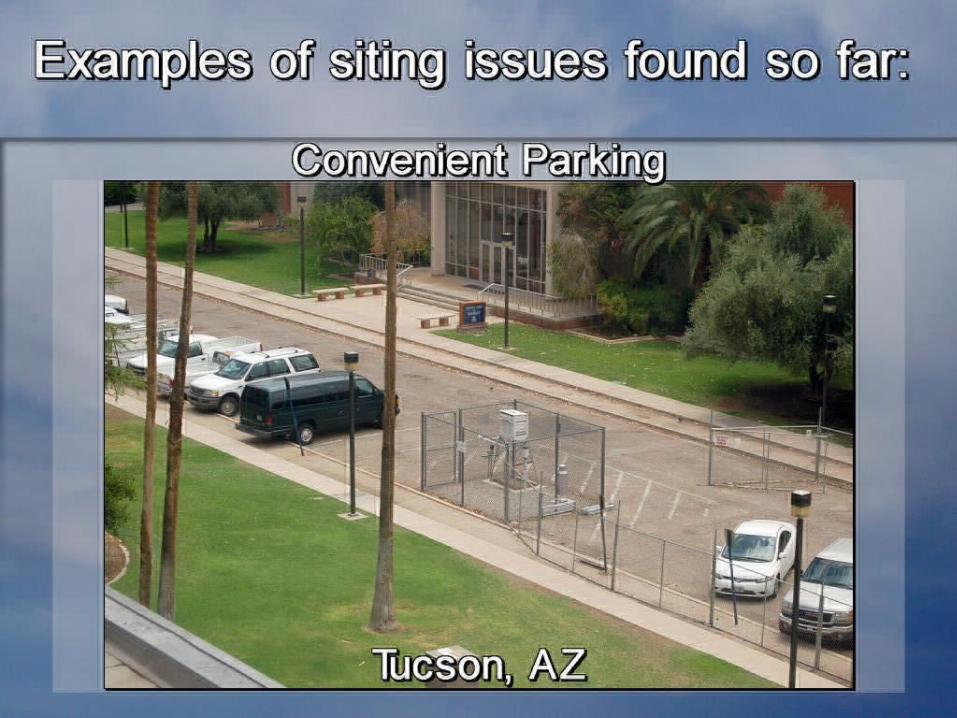
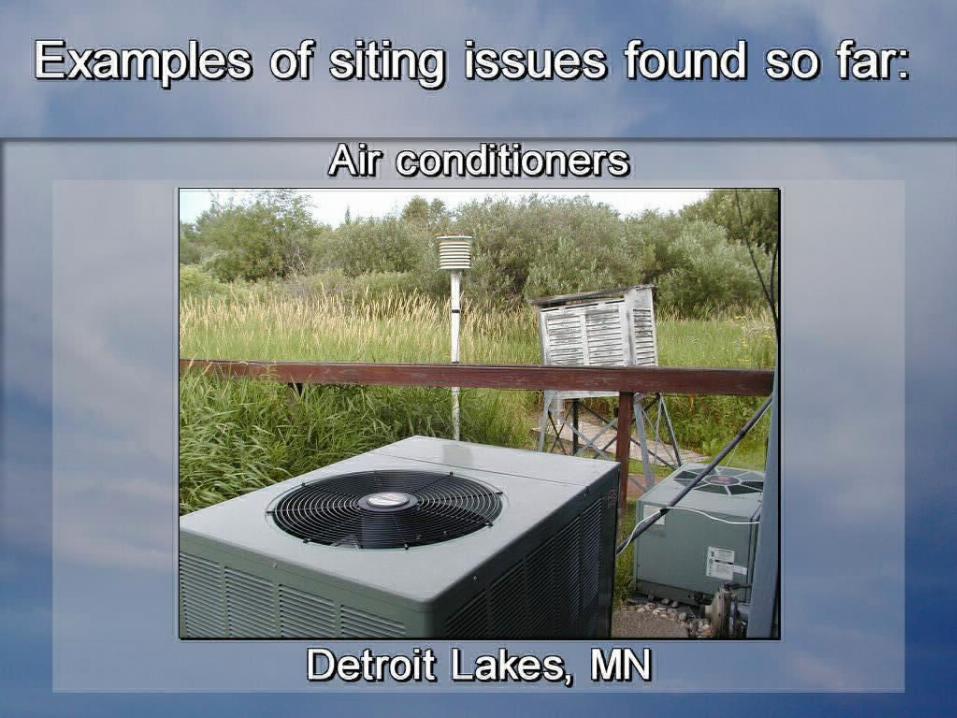
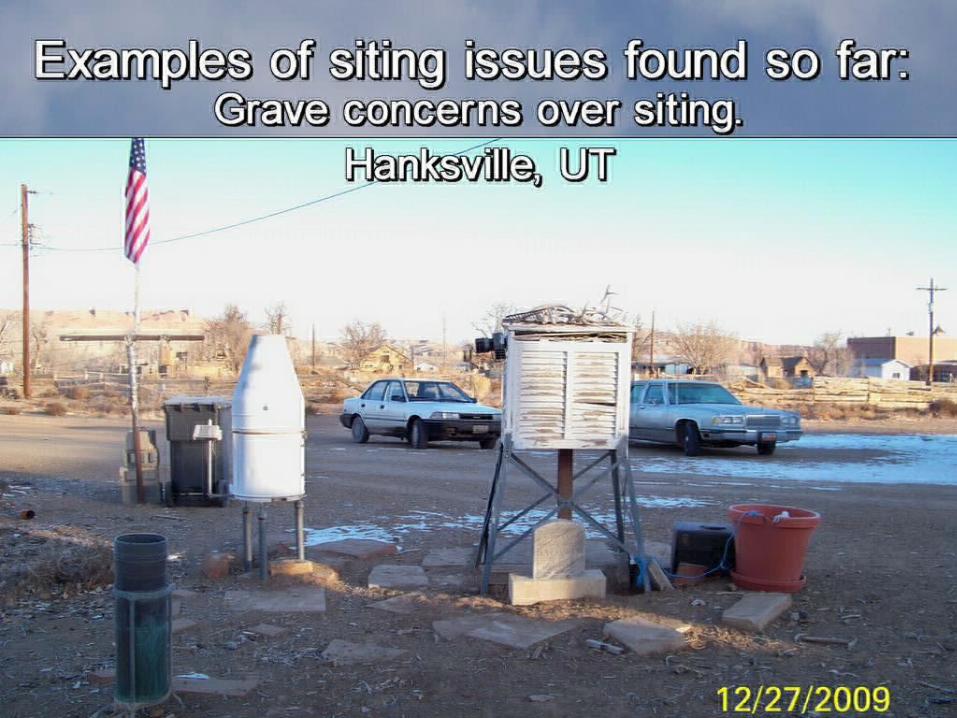
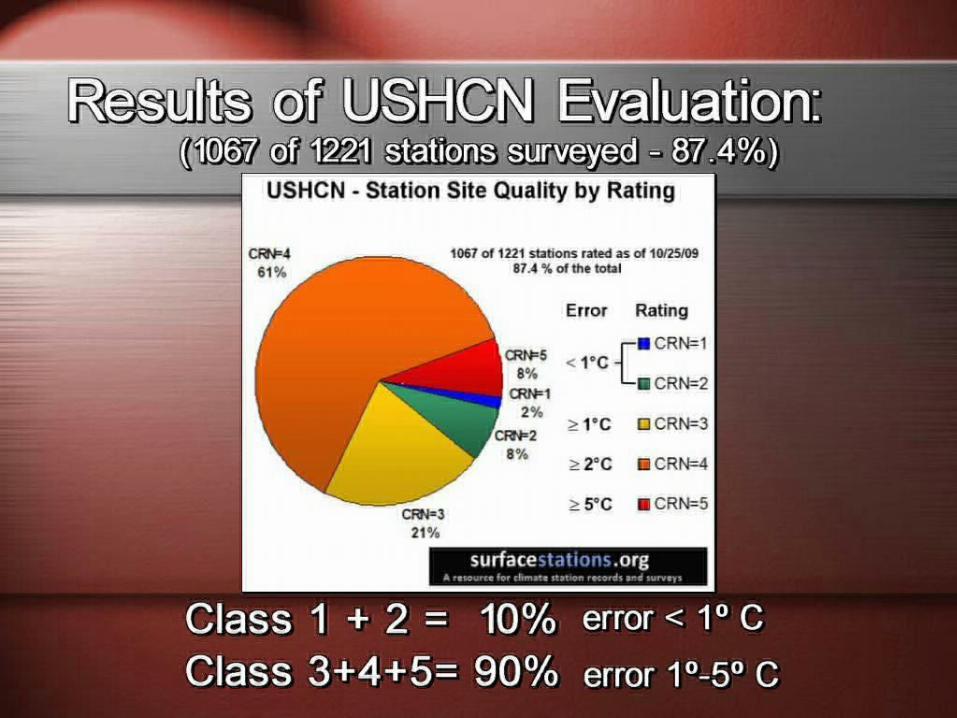
A look at the condition of theUSHCN surface measurement network – some of the worst of the worst stations

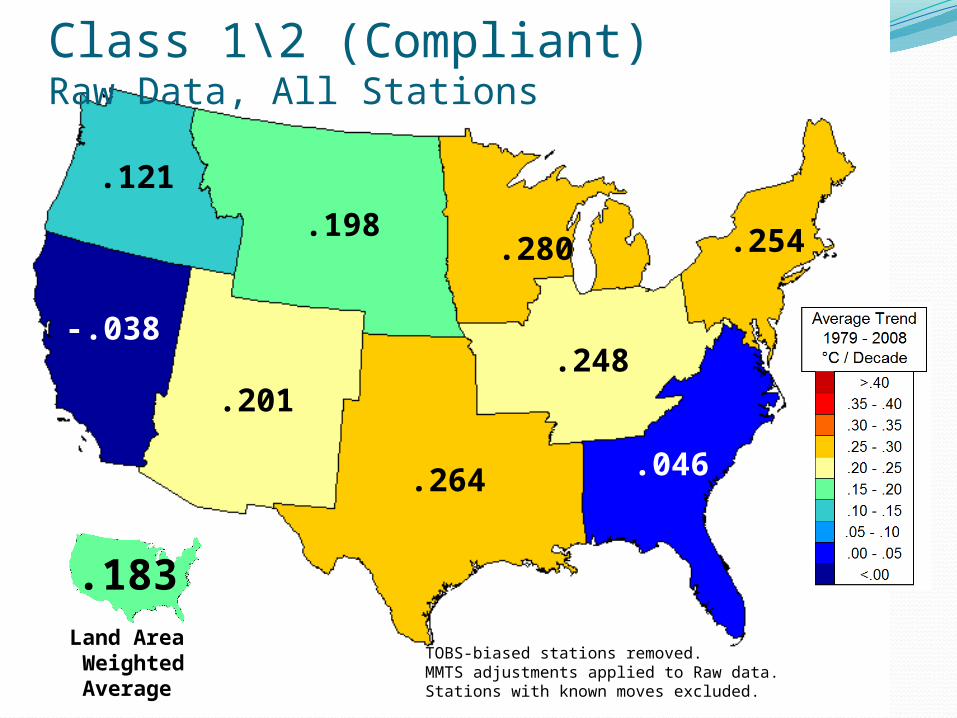
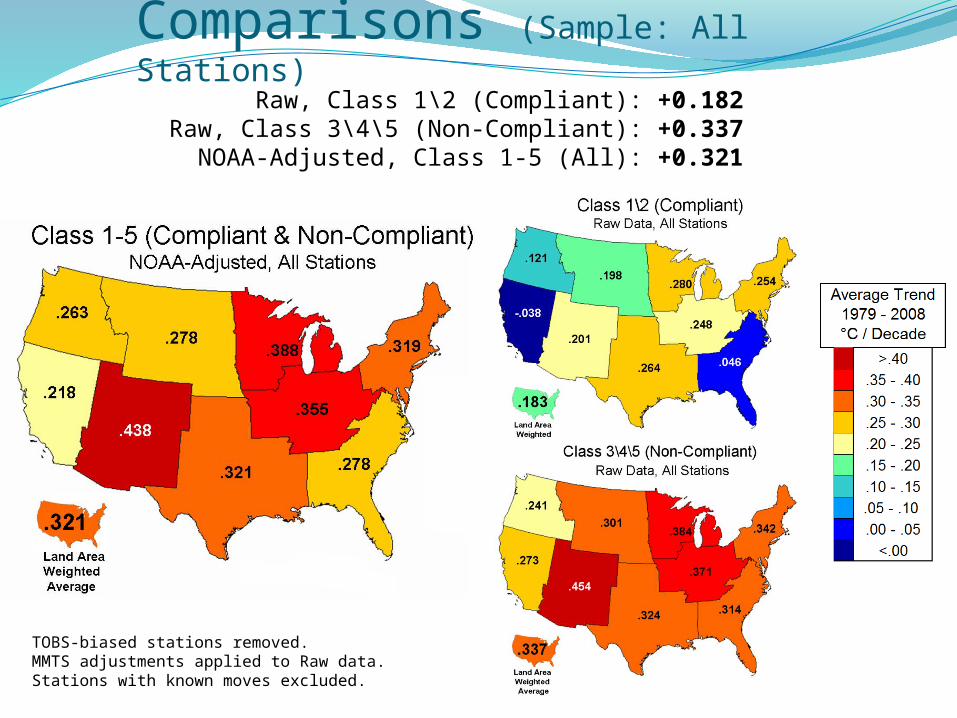
Class 1\2 (Compliant)Raw Data, All Stations
.121
-.038
.198
.201
.280
.264
.248
.254
.046
.183Land Area Weighted Average
TOBS-biased stations removed.MMTS adjustments applied to Raw data.Stations with known moves excluded.
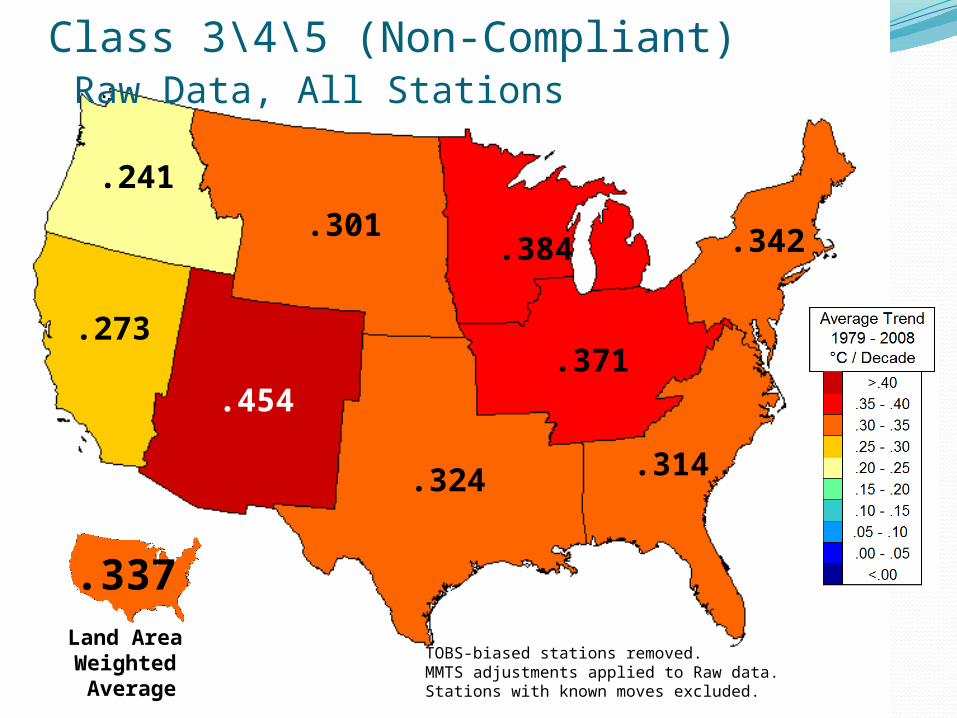
Class 3\4\5 (Non-Compliant) Raw Data, All Stations
.241
.273
.301
.454
.384
.324
.371
.342
.314
.337Land AreaWeighted Average
TOBS-biased stations removed.MMTS adjustments applied to Raw data.Stations with known moves excluded.
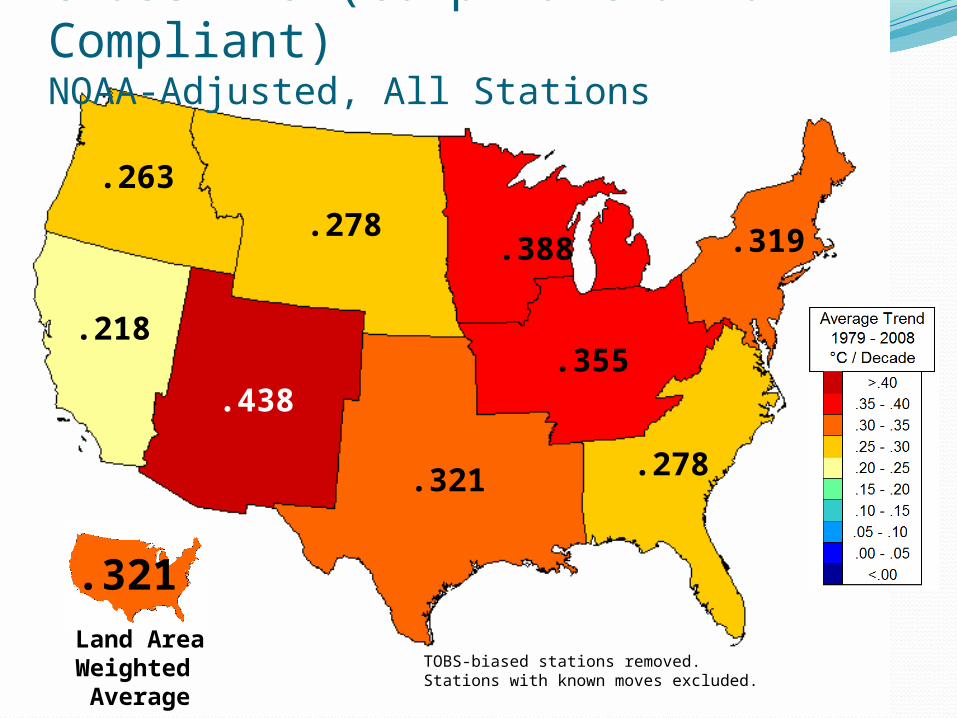
Class 1-5 (Compliant & Non-Compliant)NOAA-Adjusted, All Stations
.263
.218
.278
.438
.388
.321
.355
.319
.278
.321Land AreaWeighted Average
TOBS-biased stations removed.Stations with known moves excluded.
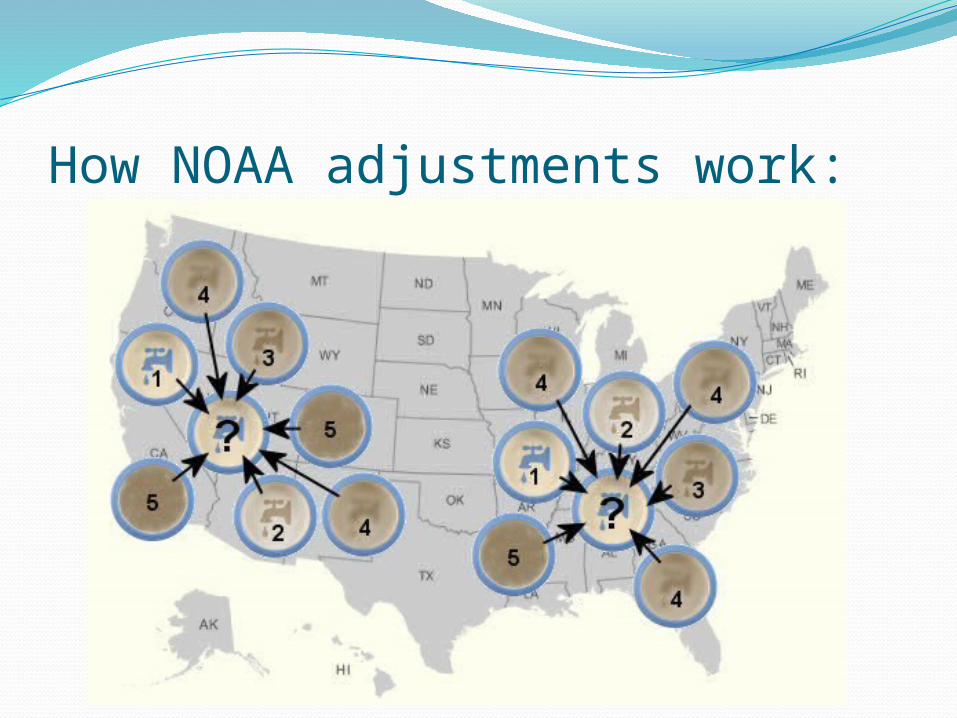
How NOAA adjustments work:
TOBS-biased stations removed.MMTS adjustments applied to Raw data.Stations with known moves excluded.
Comparisons (Sample: All Stations)Raw, Class 1\2 (Compliant): +0.182
Raw, Class 3\4\5 (Non-Compliant): +0.337NOAA-Adjusted, Class 1-5 (All): +0.321
Summary:Well sited stations (Class 1-2) without need for any adjustments have a significantly lower temperature trend than poorly sited stations.
Poorly sited stations (Class 3-4-5) have a trend almost double well sited stations.
The true climate signal is likely to be found in the stations that are well-sited, with no needs for adjustments of any kind.
Summary:NOAA adjustments essentially erases the true climate signal from the well sited stations by adjusting them up to the “climatology” of the nearby (and majority) poorly sited stations.
The result is a false warming signal based mostly on siting issues and NOAA adjustments.
NOAA doesn’t see their own confirmation bias at work here and insists their adjustment processes are based on “sound science”.
If that were true, NOAA wouldn’t need the USCRN, with state of the art sensors, perfect siting, and no need for adjustments.
Summary:As it stands, the U.S. Surface Temperature record ,
Eliminates the climate signal from the most pristine stationsby mixing the signal of the majority compromised station signals, combined with an overzealous adjustment scheme.
The result temperature data set is is not “fit for purpose” and is not truly representative of the temperature history of the United States.