Embed Size (px)
Citation preview

SITE OBSERVATIONS SUMMARY
(January through December 2010) McCormick and Baxter Superfund Site
Portland, Oregon
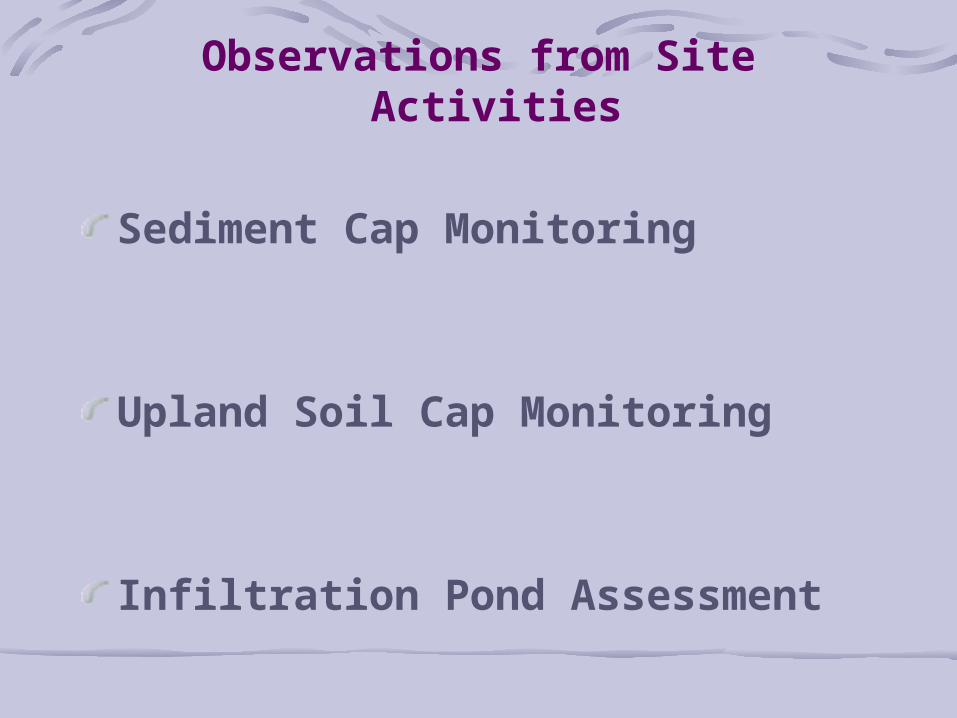
Observations from Site Activities
Sediment Cap Monitoring
Upland Soil Cap Monitoring
Infiltration Pond Assessment

Sediment Cap Monitoring
In general, the overall condition of the sediment cap is comparable to when it was constructed in 2004/2005.
SheenSimilar to previous observations
General MaintenanceACB Repair
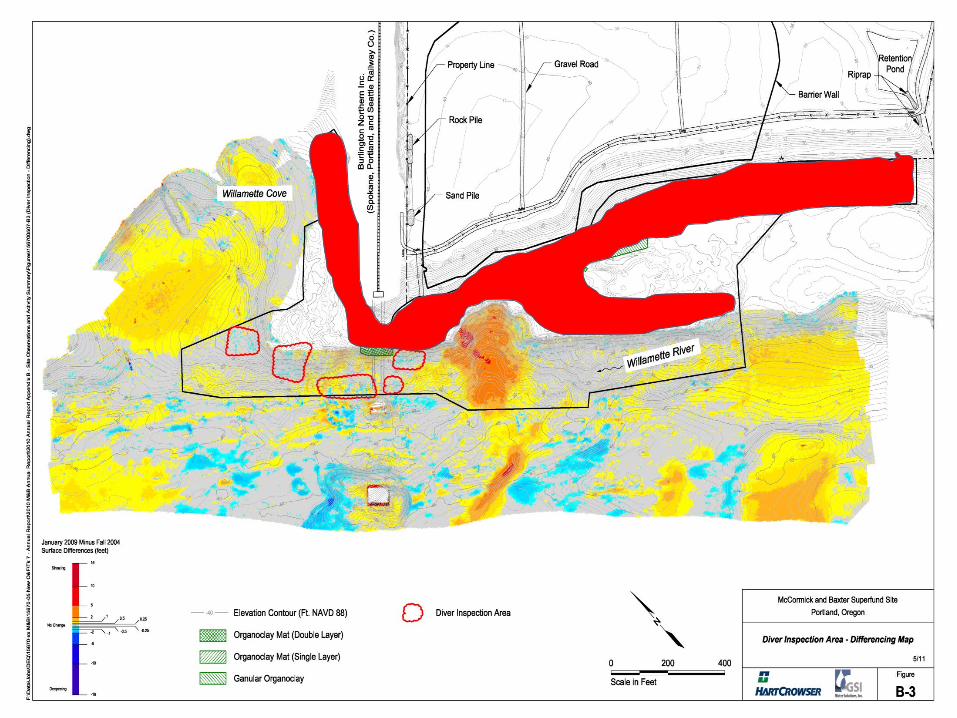
ACB InvestigationBathymetric Survey, Porewater Sampling, Coring

General Maintenance
Gap observed between ACB. TFA area. (September ’10).
Gap between ACB filled with grout. TFA area. (September ’10).

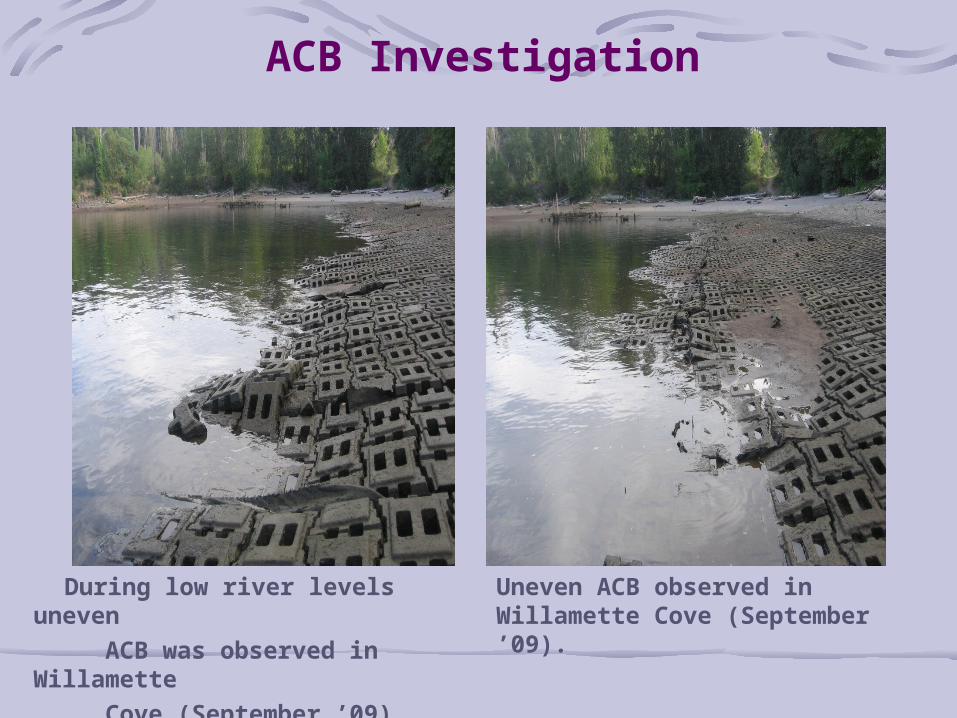
ACB Investigation
During low river levels uneven
ACB was observed in Willamette
Cove (September ’09).
Uneven ACB observed in Willamette Cove (September ’09).


ACB Investigation ConclusionsSediment cap performance monitoring from 2005 – 2010 indicates the sediment cap is functioning as designed.
Porewater sampling in March 2010 did not indicate elevated levels of PAHs or metals.
Cores through unconformities showed 4” to over 1’ of sand cap and contained no visual signs of contamination. Samples reflected PAH concentrations less than the sediment clean-up goals in the 1996 ROD.
Bathymetry images and diver inspections did not identify any areas of concern.

Overall, the upland soil cap inspections revealed few changes from 2009.
The degree of upland soil cap subsidence has decreased since 2008 and 2009. The impermeable cap stormwater drainage system appears to be unaffected.
Upland Soil Cap Monitoring
Soil cap subsidence area. July ‘10.

Upland Soil Cap Monitoring
Typical ground squirrel burrow within soil cap July 2010.
Vegetation growth on soil cap. July 2010.


0.00
0.10
0.20
0.30
0.40
0.50
0.60
0.70
0.80
0.90
1.00
3/24/2006 3/24/2007 3/23/2008 3/23/2009 3/24/2010
Tota
l Pol
ynuc
lear
Aro
mat
ic H
ydro
carb
ons
in M
icro
gram
s Pe
r Lite
r (ug
/L)
0.00
0.01
0.02
0.03
0.04
0.05
0.06
0.07
0.08
0.09
0.10
0.11
0.12
0.13
0.14
0.15
Tota
l Met
als
in M
illig
ram
s Pe
r Lite
r (m
g/L)
Total PAH
Detection Limit (ND)
Total Arsenic
Total Chromium
Total Copper
Total Zinc

Arsenic in Groundwater
0.00
0.02
0.04
0.06
0.08
0.10
0.12
0.14
0.16
0 10 20 30 40 50 60 70 80 90 100
Groundwater Samples
Co
nc
en
tra
tio
ns
in m
g/L
Site-Wide Groundwater
MW-59s
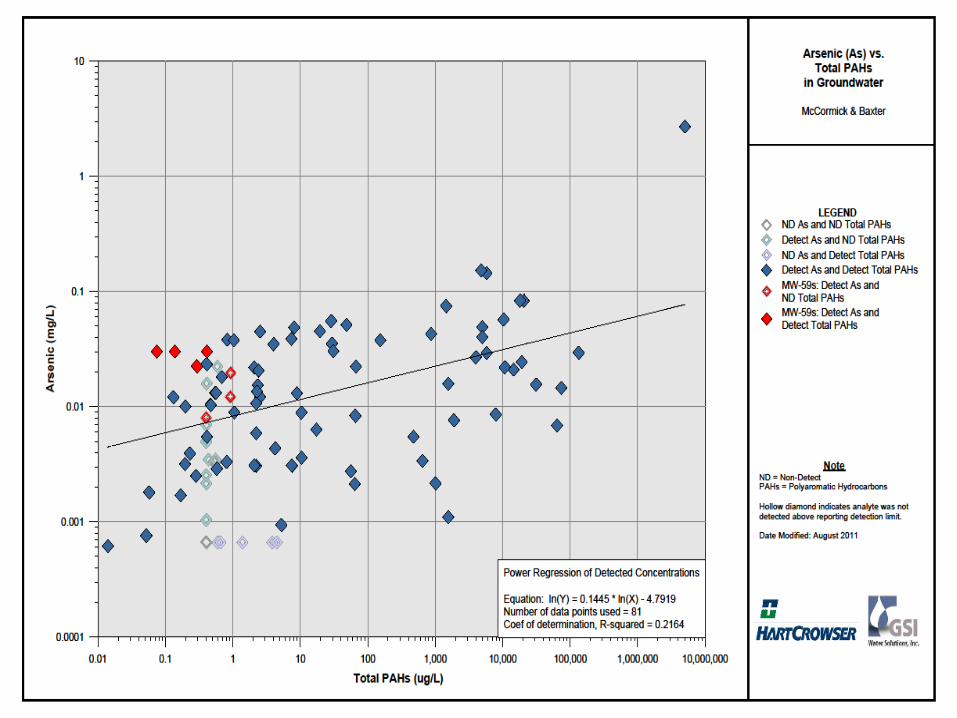

Infiltration Pond Monitoring Conclusions
Chromium, copper, and zinc decreasing.
Arsenic levels stable since 2008.
Only trace amounts of and PCP and PAHs recorded.
There does not appear to be contaminant mobilization by the infiltration pond.
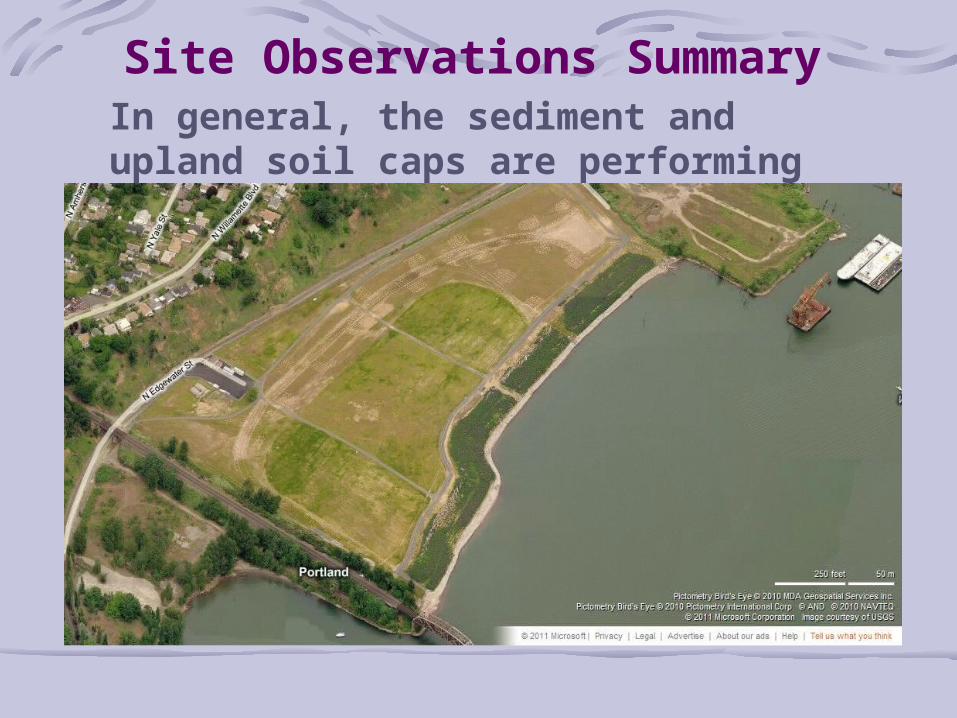
Site Observations SummaryIn general, the sediment and upland soil caps are performing as designed.