Embed Size (px)
Citation preview
U.S. Army C orps of Engineers N ew England District
®
New Bedford Harbor Superfund Site U.S. Army Corps of Engineers New England District
Final Pre-Excavation Confirmatory Pilot Test Technical Memorandum
ACE-J23-35BG2000-M17-0079
November 2020
Final Pre- Excavation C onfirmatory Pilot Test T echnical M emor andum
JACOes·
I I I I I
New Bedford Harbor Superfund Site Final Pre-Excavation Confirmatory Pilot Test Technical Memorandum
New Bedford Harbor Superfund Site
Project no: 35BG2000 Document title: Final Pre-Excavation Confirmatory Pilot Test Technical Memorandum Document No.: ACE-J23-35BG2000-M17-0079 Revision: 3 Date: November 2020 Client name: U.S. Army Corps of Engineers New England District Project manager: Beth Anderson Authors: Mike Morris
Jacobs 103 Sawyer Street New Bedford, MA 02746 508-996-5462 508-996-6742 www.jacobs.com
Document history and status
Revision Date Description By Review Approved
JACOes· New Bedford Harbor Superfund Site Final Pre-Excavation Confirmatory Pilot Test Technical Memorandum
Table of Contents
Acronyms and Abbreviations ................................................................................................................................... ii
1.0 Introduction ................................................................................................................................................. 1
2.0 Background ................................................................................................................................................. 1
3.0 PCPT Scope and Approach ........................................................................................................................ 2
3.1 Pre-excavation Sampling Approach ......................................................................................................... 3
3.2 Post-excavation Sampling Approach ....................................................................................................... 3
3.3 Data analysis ............................................................................................................................................ 4
4.0 Results ........................................................................................................................................................ 4
4.1 North Street Saltmarsh ............................................................................................................................. 4
4.2 East Zone 1 Parcels 25-24 and 25-31 ..................................................................................................... 5
4.3 East Zone 1 Parcels 25-34, and 25-34A .................................................................................................. 7
5.0 Implementation of PECC Process .............................................................................................................. 7
6.0 References .................................................................................................................................................. 8
Figures
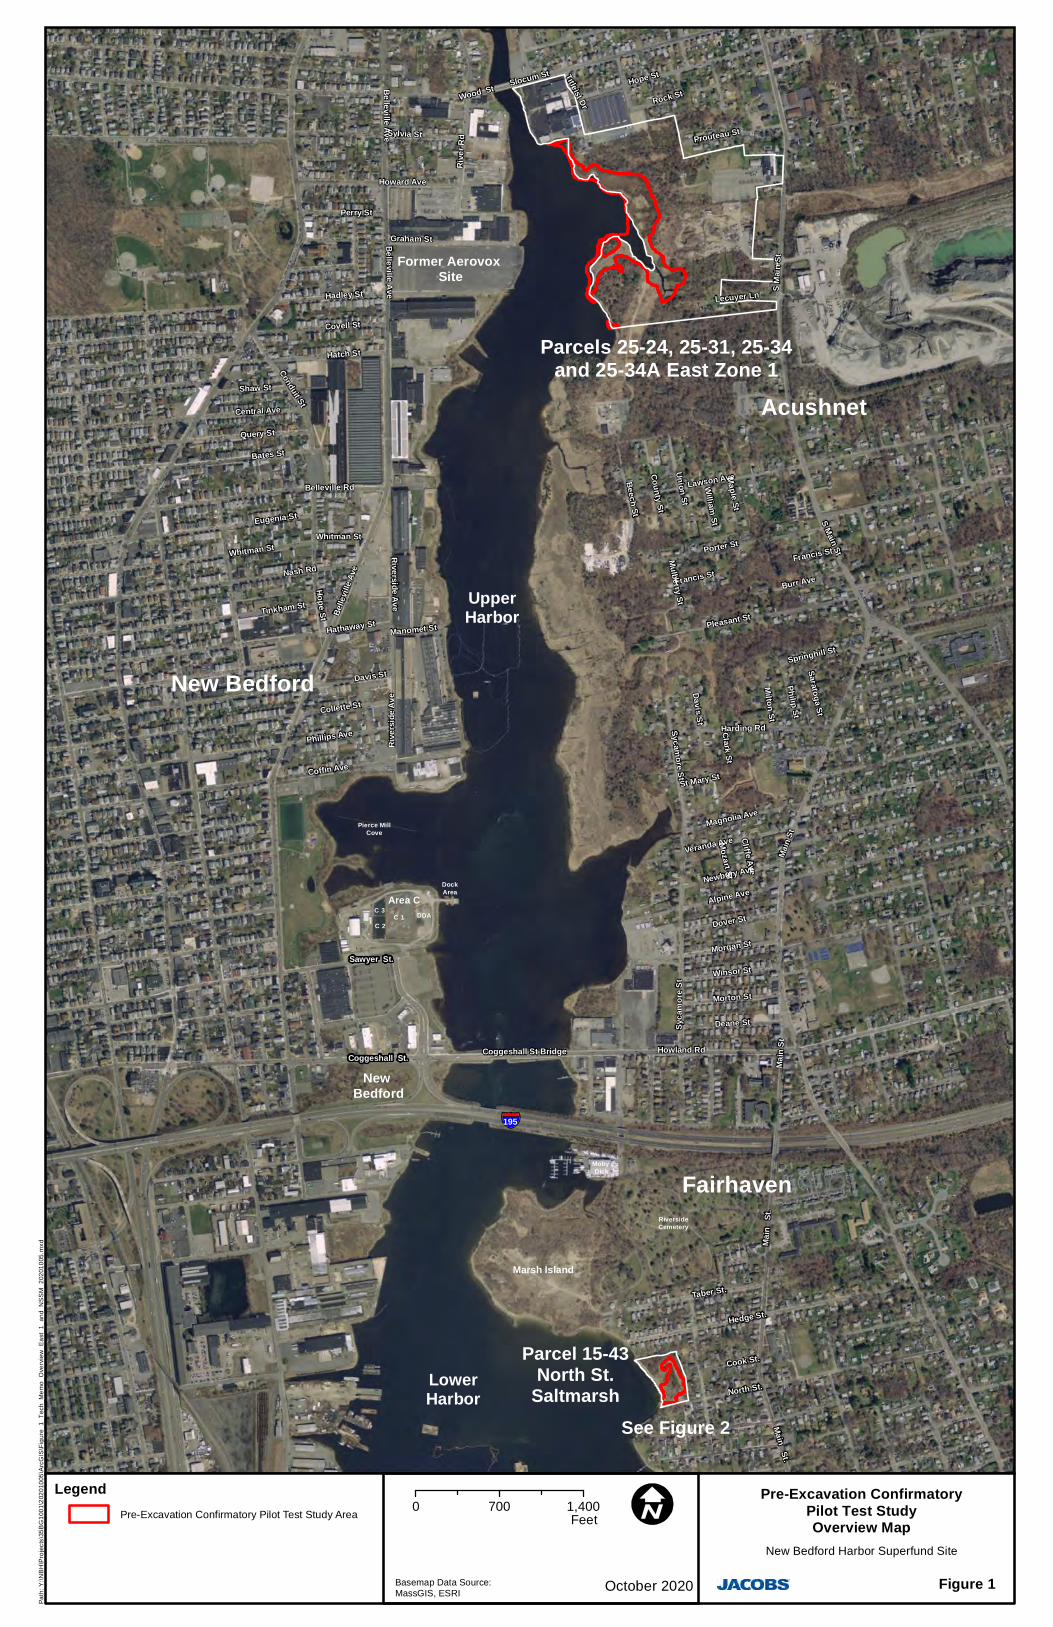
Figure 1 Pre-Excavation Confirmatory Pilot Test Study Overview Map
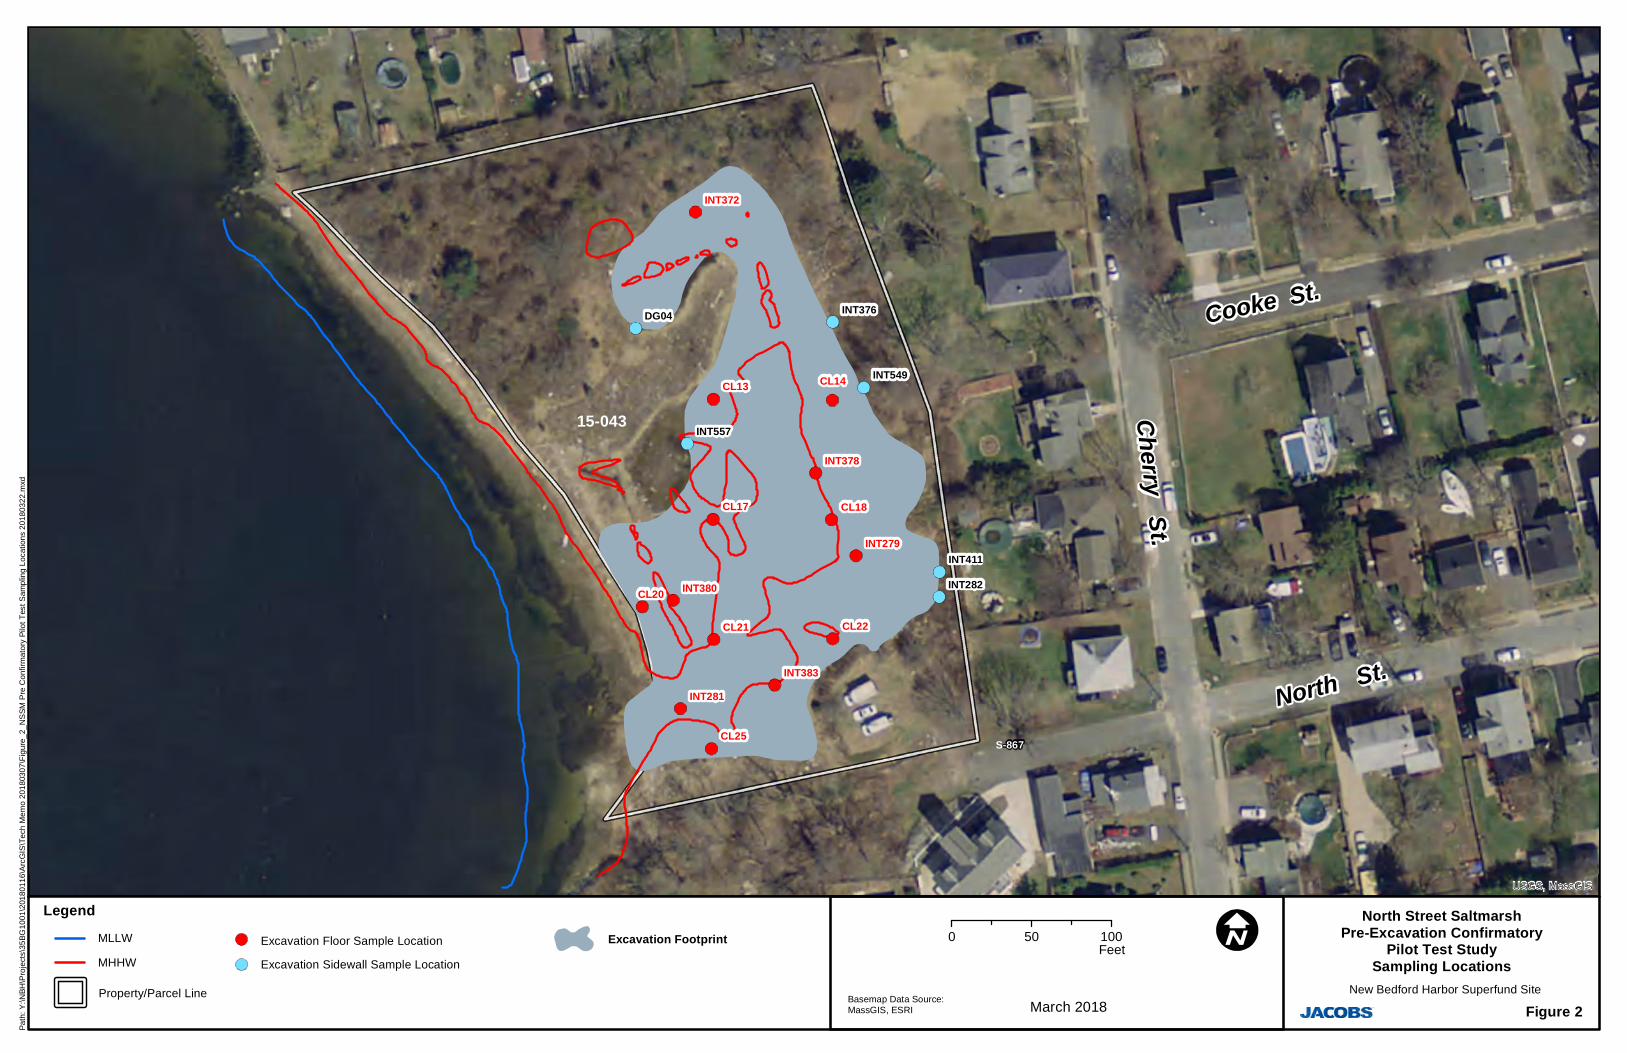
Figure 2 North Street Saltmarsh Pre-Excavation Confirmatory Pilot Test Sampling Locations
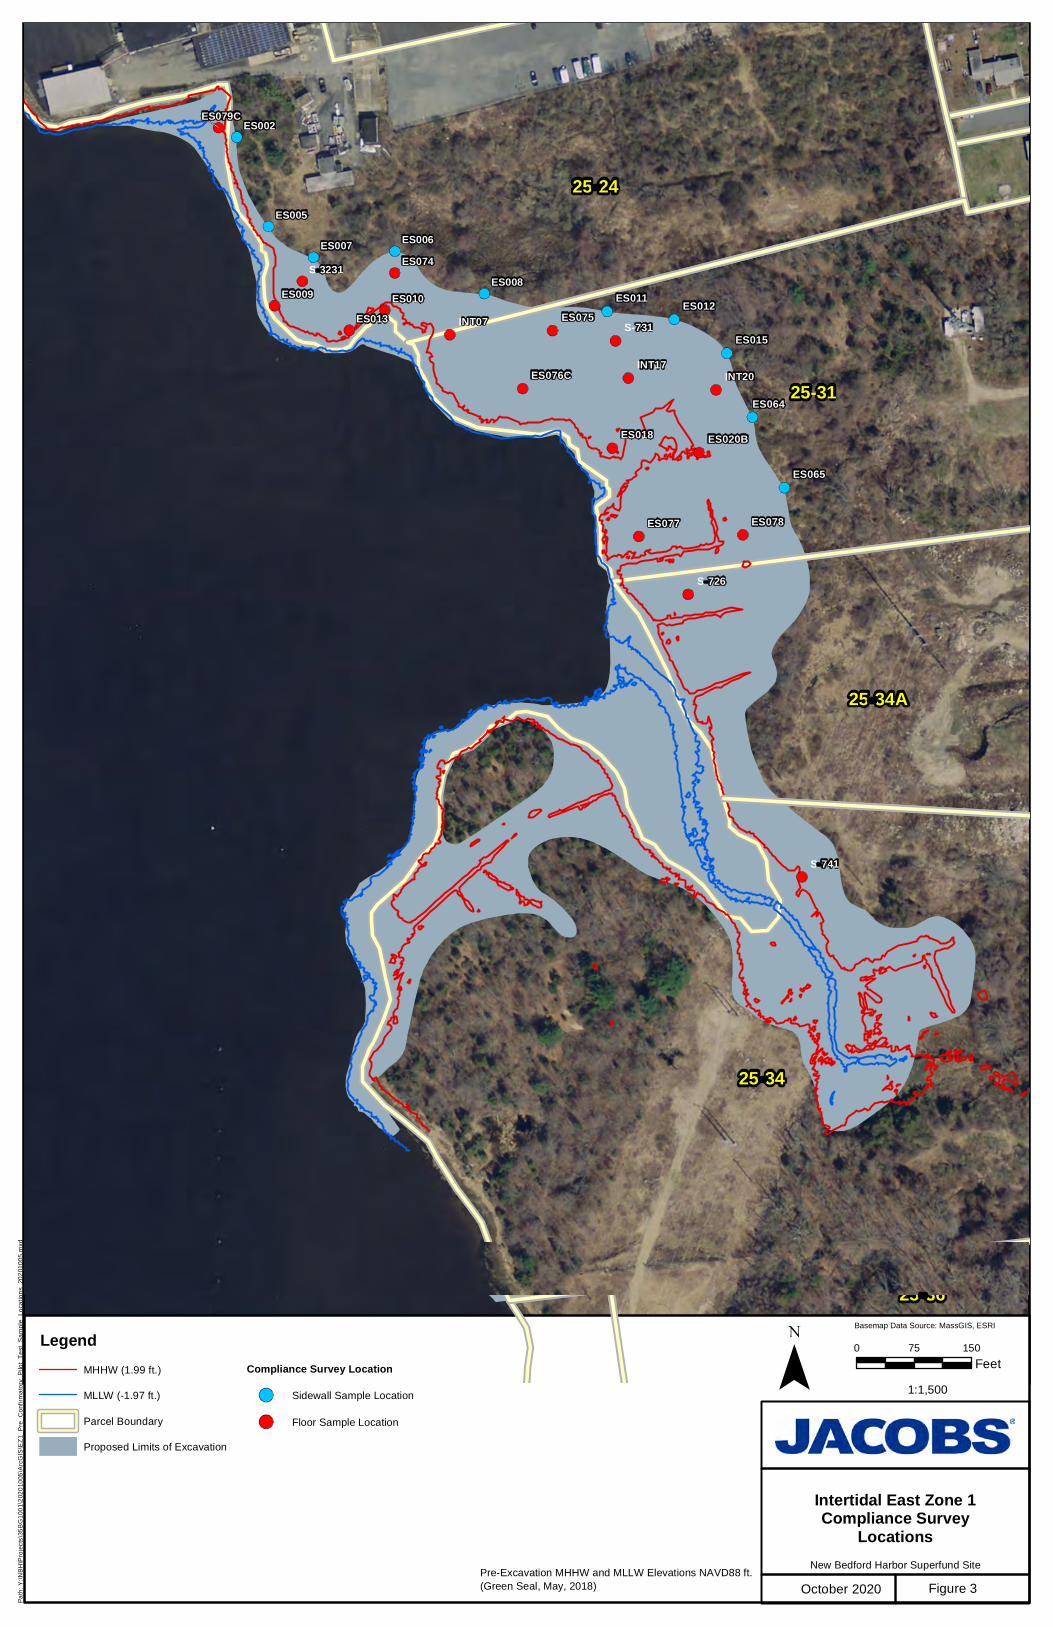
Figure 3 East Zone 1 Pre-Excavation Confirmatory Pilot Test Study Sampling Locations
Figure 4 Pre- and Post-Excavation PCB Concentrations in North Street Saltmarsh Samples
Figure 5 Pre- and Post-Excavation PCB Concentrations in East Zone 1 Samples
Tables
Table 1 NSSM Pre-Excavation Confirmatory Pilot Test Sample Location Coordinates and Elevations
Table 2 NSSM Pre-Excavation Confirmatory Pilot Test PCB Results
Table 3 East Zone 1 Pre-Excavation Confirmatory Pilot Test Sample Location Coordinates and Elevations
Table 4 East Zone 1 Pre-Escavation Confirmatory Pilot Test PCB Results
ACE-J23-35BG2000-M17-0079 i
JACOes· New Bedford Harbor Superfund Site Final Pre-Excavation Confirmatory Pilot Test Technical Memorandum
Acronyms and Abbreviations bgs below ground surface
CDA compliance demonstration area
EPA U.S. Environmental Protection Agency
ft. foot/feet
FSP Field Sampling Plan
GPS Global Positioning System
IA immunoassay
mg/kg milligrams per kilogram
NBHSS New Bedord Harbor Superfund Site
NSSM North Street Saltmarsh
PECC pre-excavation confirmatory congener
PCB polychlorinated biphenyl
PCPT pre-excavation confirmatory pilot test
ROD Record of Decision
RPD relative percent difference
RTK real-time kinetic
TCL target cleanup level
UCL upper confidence limit
USACE U.S. Army Corps of Engineers
ACE-J23-35BG2000-M17-0079 ii
JACOes· New Bedford Harbor Superfund Site Final Pre-Excavation Confirmatory Pilot Test Technical Memorandum
1.0 Introduction The purpose of this technical memorandum is to document a pre-excavation confirmatory pilot test (PCPT) conducted in two intertidal remediation areas at the New Bedford Harbor Superfund Site (NBHSS) in 2018 and 2020. To date, confirmatory sampling for intertidal remediation areas has been performed after excavation target elevations were achieved, and commencement of backfilling and restoration activities was contingent upon receipt of validated confirmatory data. A PCPT was conducted at Parcel 15-43 (referred to as the North Street Saltmarsh [NSSM]) in the Lower Harbor and at Parcels 25-24, 25-31, 25-34, and 25-34A in intertidal East Zone 1 in the Upper Harbor (Figure 1) to assess whether collection and analysis of confirmatory samples for polychlorinated biphenyl (PCB) congeners prior to excavation is a feasible alternative approach to intertidal confirmatory sampling. The NSSM had relatively low concentrations of total PCBs in comparison to concentrations at East Zone 1. The pre-excavation confirmatory sampling approach would allow backfilling and restoration activities to commence as soon as target elevations are achieved and verified. The PCPT objectives and approach described in this memorandum were developed in collaboration with the U.S. Environmental Protection Agency (EPA) and U.S. Army Corps of Engineers (USACE) (Jacobs 2019b; 2019c; 2019d; 2019e) .
2.0 Background The 1998 Record of Decision (ROD) for the New Bedford Harbor Upper and Lower Harbor Operable Unit specifies dredging or excavation of intertidal sediments with PCB concentrations exceeding the following target cleanup levels (TCLs):
• 1 part per million ([ppm] or milligram per kilogram [mg/kg]) in the top 1 foot (ft.) of sediment in residential areas, including fringe saltmarshes bordering homes in the vicinity of Veranda Inlet in Fairhaven;
• 10 ppm in Upper Harbor intertidal mudflats and 50 ppm in Lower Harbor intertidal mudflats;
• 25 ppm in the top 1 ft. of intertidal vegetated shoreline areas where beachcombing may occur, including the Pierce Mill Cove intertidal area; and
• 50 ppm in saltmarshes and shoreline areas with little or no public access.
The goal of confirmatory sampling is to determine whether sediments left in place after dredging or excavation of a compliance demonstration area1 (CDA) have PCB concentrations at or below the TCL established for that area. For intertidal TCLs based on the protection of human health through direct contact with contaminated sediment (i.e., the residential and beachcombing TCLs), the 95 percent upper confidence limit (UCL) of the average PCB concentration in the top 1 ft. of sediment is compared to the TCL because the 95 percent UCL is the statistic used to assess exposure in risk assessments (ROD Appendix B, Section 1.d). For the Upper Harbor mudflat TCL, the arithmetic average PCB concentration in the top 1 ft. of sediment is compared to the TCL. For saltmarshes, shoreline areas with little or no public access, and Lower Harbor mudflats, the 50 mg/kg TCL is a not-to-exceed value. The TCL for NSSM is 1.0 mg/kg based on a 95 percent UCL, and the not-to-exceed TCL for East Zone 1 is 50 mg/kg.
1 A CDA is defined as the area within which the confimatory sampling will be performed to determine whether post-dredging or post-excavation sediment PCB concentrations are at or below the applicable TCL. The CDA size and configuration may vary based on geographic area and other location-specific factors. CDAs will be defined in consultation with USACE and EPA.
ACE-J23-35BG2000-M17-0079 1
JACOes· New Bedford Harbor Superfund Site Final Pre-Excavation Confirmatory Pilot Test Technical Memorandum
For the initial intertidal remediation efforts (e.g., Parcel 265, Pierce Mill Cove, and Marsh Island), verification samples were collected from the excavation floors and sidewalls and analyzed onsite using a PCB immunoassay (IA) method to provide rapid turnaround data for assessing whether excavation activities were complete. Once the excavations were determined to be complete, confirmatory samples were analyzed at an offsite analytical laboratory for PCB congeners to document compliance with the TCL. The excavations generally were not backfilled until the confirmatory sample results were available, which was three to four weeks after sample receipt at the laboratory.
The intertidal remediation activities for the rest of the Upper Harbor are planned to progress from north to south using a “leap frog” approach that requires backfilling and restoration immediately after excavation. Therefore, an alternative confirmatory sampling approach is under consideration that will avoid a three- to four-week delay before compliance with the TCL is confirmed via off-site congener results. The alternative approach is based on pre-excavation confirmatory sampling using PCB congener analysis and collection of post-excavation survey data to demonstrate that the excavation achieved the horizontal and vertical design limits. The PCPT was performed at the NSSM remediation site in the Lower Harbor and at the East Zone 1 remediation site in the Upper Harbor to assess the feasibility of the proposed alternative approach for confirmatory sampling in intertidal areas. NSSM PCB concentrations were a maximum of 83.2 mg/kg and an average of 3.23 mg/kg, and EZ1 PCB concentrations were a maximum of 25,480 mg/kg and and average of 468 mg/kg.
3.0 PCPT Scope and Approach The objective of the PCPT is to evaluate whether the total PCB congener concentrations in post-excavation confirmatory samples are comparable to pre-excavation congener samples with the same x, y and z coordinates, and are consistently below the applicable TCL. Laboratory and field quality were confirmed based on the pre-and post-excavation field sampling plans (Battelle 2017; AECOM 2018). Pre-excavation confirmatory samples were used to guide the excavation; and those locations were sampled after excavation limits had been reached. If the total PCB congener concentrations in post-excavation confirmatory samples produced results below the TCL, then the pre-excavation congener confirmation (PECC) sampling approach may be applied in other intertidal remediation areas.
Uncertainties in the comparison of sample data were identified and evaluated for their impact on the outcome of the PECC approach. It should be noted that Congener results were calculated based on the three different approaches. Samples collected between 1999 and 2001 were calculated for Sum 18 NOAA PCB Congeners, samples collected between 2015 and 2017 were calculated for Sum 139 PCB congeners, and samples collected after 2017 were calculated for Sum 209 PCB congeners (Jacobs 2019b; 2019c; 2019d; 2019e; and 2018a). All three congener methods have been deemed acceptable for the NBHSS project. Moreover, the final total PCB concentration after excavation is the most critical for determining that the TCLs were met. The final, post-excavation samples collected for NSSM and East Zone 1 used the Sum 209 PCB congener method. Because the Sum 209 PCB congener method contains all of the congeners, and not a subset, it provides the most accurate and complete results. It should also be noted that the pre- and post-excavation confirmatory samples cannot necessarily be collected from exactly the same locations given the inherent uncertainties associated with field positioning, excavation precision, and differing sample collection methods. For example, the pre-excavation samples used to define the horizontal extent of remediation were collected using a hand-coring method, whereas the post-excavation sidewall samples were collected using a scrape sample of the sidewall, which is unlikely to
ACE-J23-35BG2000-M17-0079 2
JACOes· New Bedford Harbor Superfund Site Final Pre-Excavation Confirmatory Pilot Test Technical Memorandum
exactly coincide with the pre-excavation core location. This minor variation in pre- and post-excavation sample locations is considered acceptable, as the determination of the extent of contamination above the TCL, horizontally and vertically, is the ultimate goal of the PECC approach, and exact matching of the pre- and post-excavation data points is not necessarily required.
3.1 Pre-excavation Sampling Approach
The NSSM sampling locations for the PCPT are shown in Figure 2. The East Zone 1 sampling locations for the PCPT are shown in Figure 3.
The NSSM sampling locations include 15 locations on the floor of the excavation and five locations on the excavation sidewalls.2 The East Zone 1 sampling locations include 18 floor locations and 10 sidewall locations. Data are a combination of historical data (Sum NOAA 18 congeners [1999-2001]) and sediment/soil samples collected from these locations during the more detailed design phase (Sum 139 congeners [2015-2017] and Sum 209 congeners [2018-2020]). The samples from the floor locations were analyzed for PCB congeners at the target depth interval (i.e., the 1-foot interval immediately below the post-excavation, pre-backfill design elevation). The sidewall sample locations were selected because they are located on the lateral boundary of the planned excavation, and PCB congener data are available for the target depth/sidewall interval (0-1 ft. below ground surface [bgs]).
The NSSM pre-excavation sample location coordinates and elevations are summarized in Table 1, and total PCB congener concentrations for these samples are summarized in Table 2. The NSSM pre-excavation floor samples are represented by the 1-2 ft. depth interval because the NSSM intertidal remediation area was excavated to a depth of 1 ft. The NSSM pre-excavation sidewall samples are represented by the 0-1 ft. depth interval. The East Zone 1 pre-excavation sample location coordinates and elevations are summarized in Table 3, and total PCB congener concentrations for these samples are summarized in Table 4. The pre-excavation floor samples are represented by the 1-foot interval beneath the excavation elevation because the East Zone 1 intertidal remediation excavation varied from 1 ft. to 5 ft. cuts. The East Zone 1 pre-excavation sidewall samples are represented by the 0-1 ft. depth interval.
3.2 Post-excavation Sampling Approach
After the NSSM and East Zone 1 excavations were complete, horizontal and vertical positioning data were collected to verify that the excavations met the design requirements. Post-excavation elevation surveys were performed following the methods described in the Draft Final Generic Upper Harbor Intertidal Work Plan Revision 1 (Jacobs 2019a). In addition, Jacobs collected horizontal and vertical coordinate data at each PCPT sampling location using a real-time kinematic global positioning system (RTK GPS) for post-excavation samples.
After verification that the excavation limits were achieved, post-excavation confirmatory samples were collected by a third-party sampling contractor (AECOM) at NSSM and by Jacobs at East Zone 1. Immediately following excavation to the target elevation and horizontal extent, sediment/soil samples were collected from the 0-1 ft. depth interval at each excavation floor and sidewall location using the methods described in AECOM’s Field
2 One location (INT282) was originally selected as a sidewall location but was subsequently excavated to a depth of 1 foot and was changed to an excavation floor location.
ACE-J23-35BG2000-M17-0079 3
JACOes· New Bedford Harbor Superfund Site Final Pre-Excavation Confirmatory Pilot Test Technical Memorandum
Sampling Plan (FSP) (AECOM 2018) and a subsequent memorandum (AECOM 2020). Post-excavation confirmatory samples were submitted to an offsite analytical laboratory for PCB congener analysis.
3.3 Data analysis
The pre-excavation and post-excavation data sets for both NSSM and East Zone 1 were evaluated qualitatively by noting if the elevations of the post-excavation samples were consistent with target elevations, and the resultant PCB concentrations in the samples were consistent with the TCLs for that area.
To evaluate the elevations in both areas, the post-excavation sample elevation was subtracted from the target elevation at select locations, and the difference compared to zero. A zero or negative result indicates the post-excavation elevation was at or deeper than the target elevation.
To evaluate achievement of the TCL at NSSM, all samples within the NSSM area were used in a 95 percent UCL calculation that assumed that the fill material that was placed after excavation had a PCB concentration of 0.01 mg/kg and the samples collected outside the excavated areas would be the actual PCB concentrations of those samples (Jacobs 2018b). To evaluate the TCL for East Zone 1, pre-excavation PCB concentrations from select samples were compared to a not-to-exceed TCL of 50 mg/kg total PCBs.
The results of the qualitiative evaluations are discussed in the next section.
4.0 Results Results from sampling and analysis of both the NSSM and East Zone 1 intertidal areas are reported below. The analysis was a qualitative evaluation of elevation and concentration.
4.1 North Street Saltmarsh
The field collection information for the pre- and post-excavation samples from the NSSM is provided in Table 1. The horizontal distance between the pre- and post-excavation samples ranged from 0.1 ft. to 3.8 ft., with an average of 0.8 ft. The horizontal accuracy of the RTK GPS is estimated to be 0.1 ft. (Battelle 2016). Only one of the sidewall samples varied by 3.8 ft due to an overextension of the excavator beyond 3x3 blocks on boundaries of the excavation. Removing this one sample yields a range of 0.1 ft to 2.2 ft,and an average of 0.7 ft.
The difference in elevation between the pre- and post-excavation samples ranged from -0.6 ft. to 0.3 ft., with an average of -0.2 ft. (negative numbers indicate that the post-excavation location had a lower elevation than the pre-excavation location). This indicates that the majority of sample locations either met or exceeded the design depth. The vertical accuracy of the RTK GPS is estimated as 0.1 ft. (Battelle 2016).
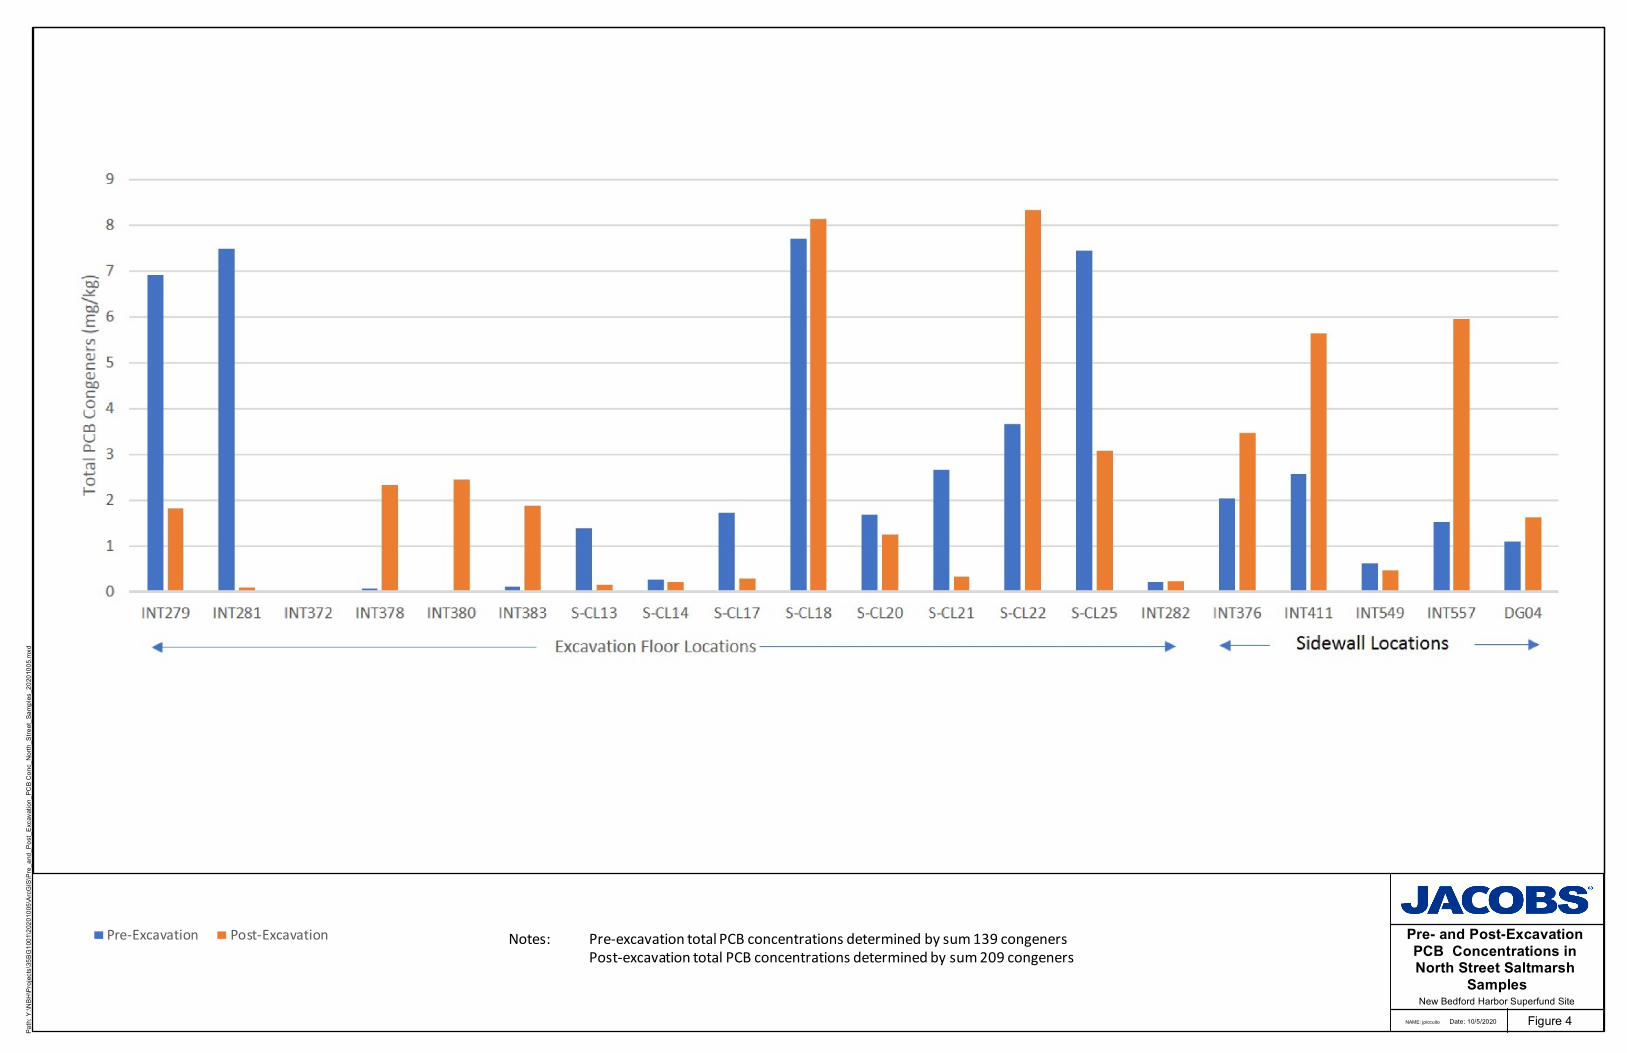
The PCB congener concentrations in the pre- and post-excavation confirmatory samples are provided in Table 2. The qualitiative evaluation of the excavation floor data indicates that the magnitude and direction (increase or decrease) of changes in PCB concentrations were variable and did not exhibit discernible trends (Table 2, Figure 4). The changes ranged from -7.40 mg/kg (decrease) to 4.67 mg/kg (increase), with an average of -0.718 mg/kg (decrease).
ACE-J23-35BG2000-M17-0079 4
JACOes· New Bedford Harbor Superfund Site Final Pre-Excavation Confirmatory Pilot Test Technical Memorandum
For the excavation sidewall samples, the qualitative evaluation indicated that post-excavation PCB concentrations increased at most of the sidewall locations (Table 2, Figure 4). The changes ranged from -0.158 (decrease) to 4.43 mg/kg (increase), with an average of 1.86 mg/kg (increase). Overall, the differences between pre- and post-excavation PCB concentrations in PCPT samples from the NSSM are likely due to natural variability, minor spatial differences in the pre- and post-excavation sample locations, and possibly due to differences in sample collection methods for the sidewall locations that were collected as cores prior to remediation. For excavation floor locations, disturbance of the sediment surface during remediation may have contributed to greater variability compared to sidewall locations. Observed increases in PCB concentration are probably due to mixing, recontamination, or heterogeneity. These increases were minor.
Because of the surrounding residential parcels, the TCL used for the NSSM sediments is 1.0 mg/kg PCBs in the top 0-1 ft. interval, based on a 95 percent UCL of samples from an established grid within the entire parcel (Jacobs 2018a). The post-excavation NSSM 95 percent UCL was calculated for the Final North Street Salt Marsh After Action Report (Jacobs 2018b) to be 1.0 mg/kg, confirming cleanup objectives were met. Prior to remediation, the PCB data for the 1-2 ft. interval was reviewed by EPA and found to be below levels of concern.
4.2 East Zone 1 Parcels 25-24 and 25-31
The field collection information for the pre- and post-excavation samples from East Zone 1 is provided in Table 3. The horizontal distance between the pre- and post-excavation samples ranged from 0.1 ft. to 4.1 ft., with an average of 0.9 ft. The horizontal accuracy of the RTK GPS is estimated to be 0.1 ft. (Battelle, 2016). Only one of the sidewall samples varied by 4.1 ft due to an overextension of the excavator beyond 3x3 blocks on boundaries of the excavation. Removing this one sample yields a range of 0.1 ft to 3.0 ft, and an average of 0.8 ft.
The difference in elevation between the pre- and post-excavation in floor samples ranged from -1.1 ft. to 0.0 ft., with an average of -0.2 ft. (negative numbers indicate that the post-excavation elevation was lower than the pre-excavation design elevation). This indicates that the majority of sample locations either met or exceeded the design depth. The vertical accuracy of the RTK GPS is estimated as 0.1 ft. (Battelle, 2016).
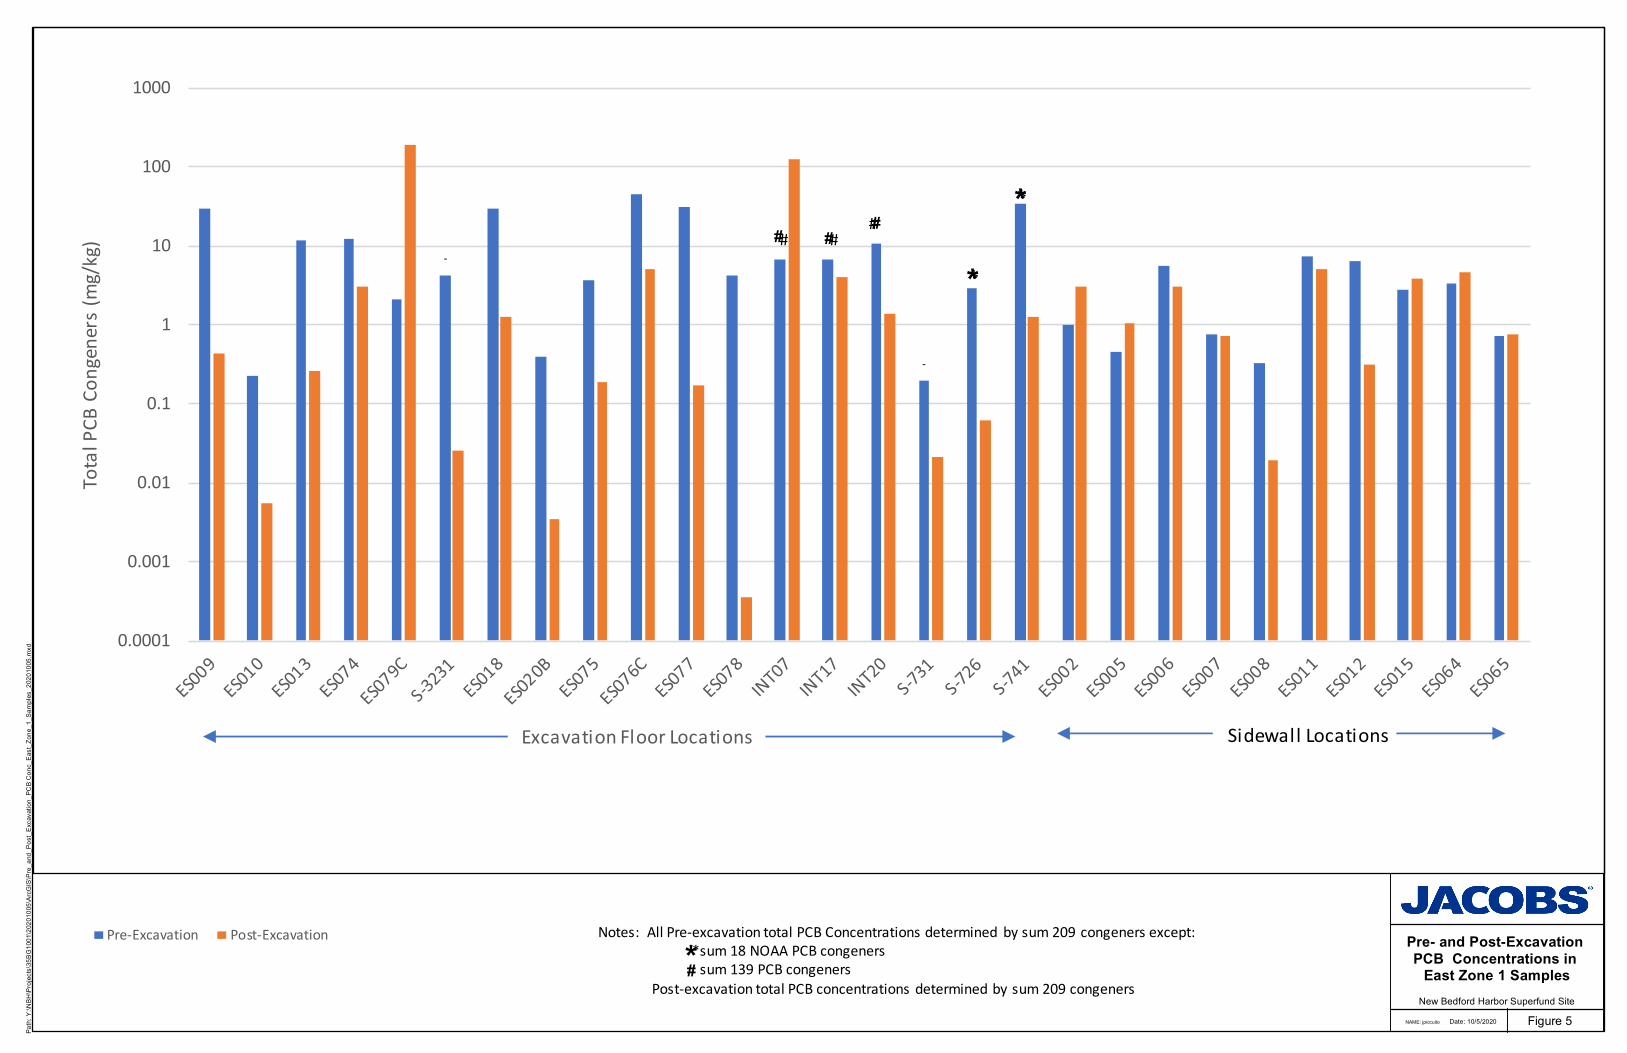
The PCB congener concentrations in the pre- and post-excavation confirmatory samples are provided in Table 4. Two of the post-excavation floor samples were above the TCL of 50 mg/kg. These locations were ES079C (189 mg/kg) and INT07 (127 mg/kg). The quantitative and qualitiative evaluation of the excavation floor data indicated that PCB concentrations were lower at 14 of the excavation floor locations and higher at 2 (Table 4, Figure 5). The changes ranged from -39.5 mg/kg (decrease) to 187 mg/kg (increase), with an average of 8.34 mg/kg (increase). For the excavation sidewall samples, the quantitative and qualitative evaluation indicated that PCB concentrations ranged from -5.96 mg/kg (decrease) to 2.05 mg/kg (increase) with an average of -0.617 mg/kg (decrease) (Table 4, Figure 5).
Most post-excavation PCB concentrations in PCPT samples from the East Zone 1 excavation floor were lower than the pre-excavation concentrations, most likely due to slight overexcavation, as indicated by the difference between pre- and post-excavation elevations shown in Table 3. Except for two of the 28 PECC samples, all locations had post-excavation PCB results below the TCL of 50 mg/kg. The two exceptions were at locations ES079C and INT07. In both locations, there was a steep, orders-of-magnitue PCB concentration gradient in the
ACE-J23-35BG2000-M17-0079 5
JACOes· New Bedford Harbor Superfund Site Final Pre-Excavation Confirmatory Pilot Test Technical Memorandum
1-ft depth intervials above and below the target elevation. The presence of the steep concentration gradient could have presented uncertainty in determining the exact elevation at which the PCB concentration was below the TCL. In addition, ES079C was located in a 90-degree corner of the shoreline with steep slopes on each side and adjacent to two factory-site outfalls, and was submerged at the time of sample collection; therefore, the higher post-excavation result could also be attributed to residuals contamination from adjacent unexcavated material, or the two outalls could have contributed to a localized deeper lense of PCB contamination. Both of these locations had PCB concentrations from the excavated floor above the TCL and were re-excavated prior to restoration.
A detailed evaluation of the two locations where the TCL was not met was warranted and summarized here. Location ES079C, as previously discussed, was in a location where cross-contamination was likely. The sample location was situated near two outfalls, and within a depression where the walls of the excavation were unstable. It was noted in the field that when the excavator had reached design depth the excavation caved in on itself. Additional sediment was removed to an elevation 0.55 ft below design elevation. The resultant sample was contaminated by sloughing of the adjacent contaminated sediment as observed at the time of sample collection. The resultant sample concentration was 189 mg/kg, which is much greater than the pre-excavation concentration of 2.12 mg/kg at the PECC depth interval for this location (4-5 ft) and greater than the TCL for East Zone 1. A steep concentration gradient was present at this location. The intervals above the target elevation had concentrations of 728 mg/kg (1-2 ft), 1,380 mg/kg (2-3 ft), and 140 mg/kg (3-4 ft). This irregular distribution of PCB concentrations indicates that there were multiple depositional episodes evident in the sediment profile and that deeper interval collection is warranted. Because the post-excavation PECC sample (at design elevation) contained 189 mg/kg PCBs and not TCL compliant, it was decided to excavate an additional 0.75 ft lift at that location, to where the floor was visually clean, and re-sample. The second post-excavation sample PCB concentration was 0.681 mg/kg at -4.05 ft NAVD88 (approximately 1.3 ft below design elevation), well below the TCL.
Location INT07 was co-located within a dense stand of phragmites which is deeply rooted and a contributor to bioturbation of contaminated sediment with non-contaminated sediment. The target elevation of the sample was 2.0 ft NAVD88 and the initial sample was collected from 1.89 ft NAVD88 or approximately 0.1 ft below design. The post-excavation sample had a total PCB concentration of 129 mg/kg, more than double the TCL. A 0.5-ft lift was removed from the sample area and the re-sampled sediment had a PCB concentration of 27.4 mg/kg at an elevation of 0.891 ft NAVD88 or a little over 1 ft below the design elevation. In the pre-excavation sampling, the 0-1 ft sample had a total PCB concentration of 4,678 mg/kg with a steep concentration gradient declining to 6.80 mg/kg in the target interval of 1-2 ft. As with the results at ES079C, this gradient of more than 2 orders of magnitude creates uncertainty in the establishment of the exact depth below the TCL.
The examples of locations ES079C and INT07 indicate a greater level of variability that was not noted in the other PECC sample locations. The post-excavation concentrations in East Zone 1, with the exception of these two locations, was consistently and markedly below the 50 mg/kg TCL for this area. Exacerbating conditions such as presence of phragmities, location within small stream channels, proximity to oufalls or other disturbance features, or unstable sediments may impact the presence of contamination at intervals below those which chemical analysis has indicated as being below the TCL. Evidence such as irregular PCB concentrations with depth and sharply declining concentration gradients may indicate something other than a simple depositional profile. In both locations, the removal of an extra 0.5-0.75 ft of sediment was able to establish a TCL-compliant boundary. .
ACE-J23-35BG2000-M17-0079 6
JACOes· New Bedford Harbor Superfund Site Final Pre-Excavation Confirmatory Pilot Test Technical Memorandum
4.3 East Zone 1 Parcels 25-34, and 25-34A
After the initial round of PECC sampling in the northern two parcels of East Zone 1 indicated that steep concentration gradients could cause uncertainty in target elevation determination, two additional PECC samples were collected from East Zone 1 Parcels 25-34 and 25-34A, where steep concentrations gradients were present,. Sample S-726 was located in Parcel 25-34A and had initial concentrations of 1,924 mg/kg total PCBs in the 0-1 ft interval and 2.86 mg/kg in the 1-2 ft interval (results determined by the Total 18 NOAA PCB Congeners method). Two post-excavation samples were collected at S-726 which yielded concentrations of 0.0619 mg/kg and 0.00607 mg/kg in the 0-1 ft and 1-2 ft intervals of the freshly excavated surface, respectively (results determined by the total 209 PCB Congeners method). Based on these results, the excavation was deemed complete at this location, and the potential issue regarding PECC locations with steep concentration gradients was found to not apply at this location.
Sample S-741 was located in Parcel 25-34 and had an initial concentration of 3,120 mg/kg in the 0-1 ft interval and 33.8 mg/kg in the 1-2 ft interval (results determined by the total 18 NOAA PCB Congeners method). Two samples were collected post-excavation which had concentrations of 1.25 mg/kg and 0.961 mg/kg in the 0-1 ft and 1-2 ft intervals of freshly excavated surface respectively (results determined by the total 209 PCB Congeners method). Based on these results, the excavation was deemed complete at this location, and the potential issue regarding PECC locations with steep concentration gradients was found to also not apply at this location.
5.0 Implementation of PECC Process Utilizing the PECC approach for intertidal locations can be successfully implemented with a few precautionary practices, listed below. The PECC process was effective for NSSM where PCB concentrations were low and resultant post-excavation concentrations were slightly elevated compared to pre-excavation, but generally consistent with the pre-design concentrations The PECC process for East Zone 1 was successful with the exception of the two sample locations discussed above. All of the other post-excavation sample results at EZ1 were below the TCL of 50 mg/kg total PCBs and were therefore considered consistent with the approach.
Based on the PCPT results, the recommended path forward is to adopt the PECC approach to all future intertidal remediation areas and determine compliance with the excavation design prism using survey compliance locations. The PECC approach can be adopted with these precautionary practices:
1) It is recommended that areas with steep slopes, stream channels, and otherwise unstable sediments should have their cut depths verified and adjusted, if necessary, to reduce sloughing and residual recontamination.
2) The practice of adding depth to the excavation target elevation in the vicinity of all pre-excavation sample locations with steep concentration gradients should be considered to ensure removal of contamination below the TCL. For any PECC locations where the PCB concentration difference between the contaminated and uncontaminated sediment intervals is greater than two orders of magnitude, an additional removal of 4 to 6 inches of sediment should be considered in the vicinity of the sample location. The target elevations should be adjusted within approximately 50 feet (9 grid blocks) in each direction from the sample location. The 50-ft radius was established during the Pierce Mill Cove remediation for any re-excavation (Jacobs, 2018c).
3) For PECC locations near large outfalls (e.g., CSOs, storm drains, industrial outfalls), review all related characterization data and consider additional excavation if deemed appropriate.
ACE-J23-35BG2000-M17-0079 7
JACOes· New Bedford Harbor Superfund Site Final Pre-Excavation Confirmatory Pilot Test Technical Memorandum
The compliance survey locations for all intertidal areas requiring remediation have been identified in the respective work plan addenda and will meet the requirements of the PECC approach. No modification to these established locations is required in order to use the PECC approach as an alternative approach for intertidal confirmatory sampling. However, the precautionary practices discussed above should be reviewed prior to excavation and the target elevations of the excavation plans adjusted if necessary.
6.0 References AECOM. 2020. Memorandum: PECC Sampling in Eastern Intertidal Zone 1 Area. New Bedford Harbor Superfund
Site, New Bedford, MA. (January).
______. 2018. Upper and Lower Harbor Sediment Verification and Confirmatory Field Sampling Plan. Environmental Monitoring, Sampling and Analysis, Revision 3. New Bedford Harbor Superfund Site, New Bedford, MA, Draft Final (January) (includes subsequent addenda).
Battelle. 2017. 2017 Intertidal Data Gaps Draft Final Field Sampling Plan, Environmental Monitoring, Sampling, and Analysis, New Bedford Harbor Superfund Site. (May).
______. 2016. Intertidal Phase 3 Lower Harbor Study Final Report, Environmental Monitoring, Sampling, and Analysis, New Bedford Harbor Superfund Site. (December).
Jacobs. 2019a. Draft Final Generic Upper Harbor Intertidal Work Plan Revision 1. ACE-J23-35BG2000-M1-0007. (May).
______. 2019b. Draft Final Intertidal Work Plan for Parcel 25-24, East Zone 1, Rev 3. ACE-J23-35BG2000-M1-0121. (December)
______. 2019c. Draft Final Intertidal Work Plan for Parcel 25-31, East Zone 1, Rev 3. ACE-J23-35BG2000-M1-0122. (December).
______. 2019d. Draft Final Intertidal Work Plan for Parcel 25-34, East Zone 1. ACE-J23-35BG2000-M1-0114. (September).
______. 2019e. Draft Final Intertidal Work Plan for Parcel 25-34A, East Zone 1, Rev 2. ACE-J23-35BG2000-M1-0117. (September).
______. 2018a. Draft Final North Street Salt Marsh Intertidal Work Plan. ACE-J23-35BG2000-M1-00021. (May).
______. 2018b. Final North Street Salt Marsh After Action Report. ACE-J23-35BG2000-M17-0043 (November).
______. 2018c. Final Pierce Mill Cove After Action Report. ACE-J23-35BG2000-M17-0040 (April).
ACE-J23-35BG2000-M17-0079 8

Figures
-
--
S
JACOBS"
Belleville Ave
Wood St Slocum St Titleist Dr
Graham St
Hadley St
Belleville Ave
Covell St
Hatch St
C
Shaw St
ondui
Central Ave
t St
Query St
Bates St
Eugenia St
Belleville Rd
Whitman St
Nash Rd
Tinkham St
Hope St Belle
ville
Ave
Riverside Ave
Hathaway St Manomet St
Davis St
Collette St
Phillips Ave
Rive
rside
Ave
Coffin Ave
Hope St
Rock St
Sylvia St
Rive
r Rd Prouteau St
S Main
St
Lecuyer Ln
Beech St County St
Lawson Ave Union St
WilliamSt
Maple St
Porter St
S Main St Mulberry St
Francis St
Francis St Burr Ave
Pleasant St
Springhill St
Davis St
Milton St Philip St
Saratoga St
Sycamore St
Harding Rd Clark St
St Mary St
Magnolia Ave
Veranda Ave Mozart St Cliffe Ave
Main
St
Newbury Ave
Alpine Ave
Dover St
Morgan St
Winsor St
Morton St
Deane St
Main
St
Main
St.
Taber St.
Hedge St.
Cook St.
North St.
Main St. Former Aerovox
Site
Parcel
Whitman St
UpperHarbor
New Bedford
Pierce MillCove
Dock
C 3 Area C Area
C 1 DDA C 2
Sawyer St.
Coggeshall St BridgeCoggeshall St.
NewBedford
195
MobyDick
Path:
Y:\N
BH\Pr
ojects
\35BG
1001
\2020
1005
\ArcG
IS\Fi
gure_
1_Te
ch_M
emo_
Overv
iew_E
ast_1
_and
_NSS
M_20
2010
05.m
xd
Marsh Island
Parcel 15-43Lower North St.Harbor Saltmarsh
ycam
oreS
t
Howland Rd
Fairhaven RiversiCemet
de ery
See Figure 2
Howard Ave
Perry St
s 25-24, 25-31, 25-34and 25-34A East Zone 1
Acushnet
Legend Pre-Excavation Confirmatory700 1,400 Pilot Test Study0 Feet Overview Map
New Bedford Harbor Superfund Site
Basemap Data Source: October 2020 Figure 1MassGIS, ESRI
Pre-Excavation Confirmatory Pilot Test Study Area
JACOBS
S-867 CL25
CL22 CL21
CL20
CL18 CL17
CL14 CL13
DG04
INT557 15-043
INT383
INT380
INT378
INT372
INT281
INT279
INT549
INT411
INT376
INT282
USGS, MassGIS
Cooke St.
Cherry St.
North St.
Path:
Y:\N
BH\Pr
ojects
\35BG
1001
\2018
0116
\ArcG
IS\Te
ch M
emo 2
0180
307\F
igure_
2_NS
SM P
re Co
nfirm
atory
Pilot
Test
Samp
ling L
ocati
ons 2
0180
322.m
xd
Legend MLLW Excavation Floor Sample Location Excavation Footprint MHHW Excavation Sidewall Sample Location
Property/Parcel Line Basemap Data Source:MassGIS, ESRI
0 50 100Feet
March 2018
North Street SalPre-Excavation Con
tmarshfirmatory
Pilot Test Study Sampling Locations
New Bedford Harbor Superfund SiteFigure 2
25-34
25-24
25-31
25-36
25-34A
ES078 ES077
ES075
ES018
S-731
INT20 INT17
INT07
ES076C
ES020B
S-726
S-741
ES065
ES064
ES015
ES012 ES011 ES008
ES007 ES006 ES005
ES002
ES074
ES013 ES010 ES009
ES079C
S-3231
lc=JI 1111
0
•
N
A - -- -
JACOBS~ 25-43
Path:
Y:\N
BH\Pr
ojects
\35BG
1001
\2020
1005
\ArcG
IS\E
Z1_P
re_Co
nfirm
atory_
Pilot_
Test_
Samp
le_Lo
catio
ns_2
0201
005.m
xd
Basemap Data Source: MassGIS, ESRILegend 0 75 150
MHHW (1.99 ft.) Compliance Survey Location Feet
MLLW (-1.97 ft.) Sidewall Sample Location
Intertidal East Zone 1 Compliance Survey
Locations New Bedford Harbor Superfund Site
October 2020 Figure 3
1:1,500
Parcel Boundary Floor Sample Location Proposed Limits of Excavation
Pre-Excavation MHHW and MLLW Elevations NAVD88 ft.(Green Seal, May, 2018)
a
0.0001
0.001
0.01
0.1
1
10
100
1000
TotalP
CBCo
ngener
s(mg/k
g)
Exc
*
Legendvation Floor Locations Sidewall Locations
*
*
*# # #
9
8
7 tic ..::.::: .._ tlO E 6 Ill I..
~ 5 C) tlO C 0 4 u co u Cl. 3 re +-' 0 f- 2
1
0
■
-1_ -- I. -11- -- I■ I NT279 INT281 I NT372 INT378 INT380 INT383 S-CL13 S--CL14 S-CL17 S--CL18 S-CL20 S--CL21 S-CL22 S-CL25 INT282 INT376 INT411 INT549 INT557 D604
Excavation Floor Locations-----------------------i• ◄ Sidewall Locations ►
JACOBS® ■
Path:
Y:\N
BH\Pr
ojects
\35BG
1001
\2020
1005
\ArcG
IS\P
re_an
d_Po
st_Ex
cava
tion_
PCB C
onc_
North
_Stre
et_Sa
mples
_202
0100
5.mxd
Pre-Excavation Post-Excavation Notes: Pre-excavation total PCB concentrations determined by sum 139 congeners Post-excavation total PCB concentrations determined by sum 209 congeners
NAME: jpiccuito
New Bedford Harbor Superfund Site Date: 10/5/2020 Figure 4
Pre- and Post-ExcavationPCB Concentrations inNorth Street Saltmarsh
Samples
a
0.0001
0.001
0.01
0.1
1
10
100
1000
TotalP
CBCo
ngener
s(mg/k
g)
Exc
*
Legend
#
vation Floor Locations Sidewall Locations
*
*
*# # #
Pre-Excavation Post-Excavation
*#
*
I
◄ ►
JACOBS® ■ ■
Path:
Y:\N
BH\Pr
ojects
\35BG
1001
\2020
1005
\ArcG
IS\P
re_an
d_Po
st_Ex
cava
tion_
PCB C
onc_
East_
Zone
_1_S
ample
s_20
2010
05.m
xd
Total P
CB Co
ngener
s (mg/k
g) 1000
100 *
#10 ## ##
** * 1
** 0.1
0.01
0.001
0.0001
Excavation Floor Locations Sidewall Locations
NAME: jpiccuito
New Bedford Harbor Superfund Site Date: 10/5/2020 Figure 5
Pre- and Post-ExcavationPCB Concentrations in
East Zone 1 Samples * # Post-Excavation Notes: All Pre-excavation total PCB Concentrations determined by sum 209 congeners except:
*sum 18 NOAA PCB congenerssum 139 PCB congeners
Post-excavation total PCB concentrations determined by sum 209 congeners
Pre-Excavation

Tables
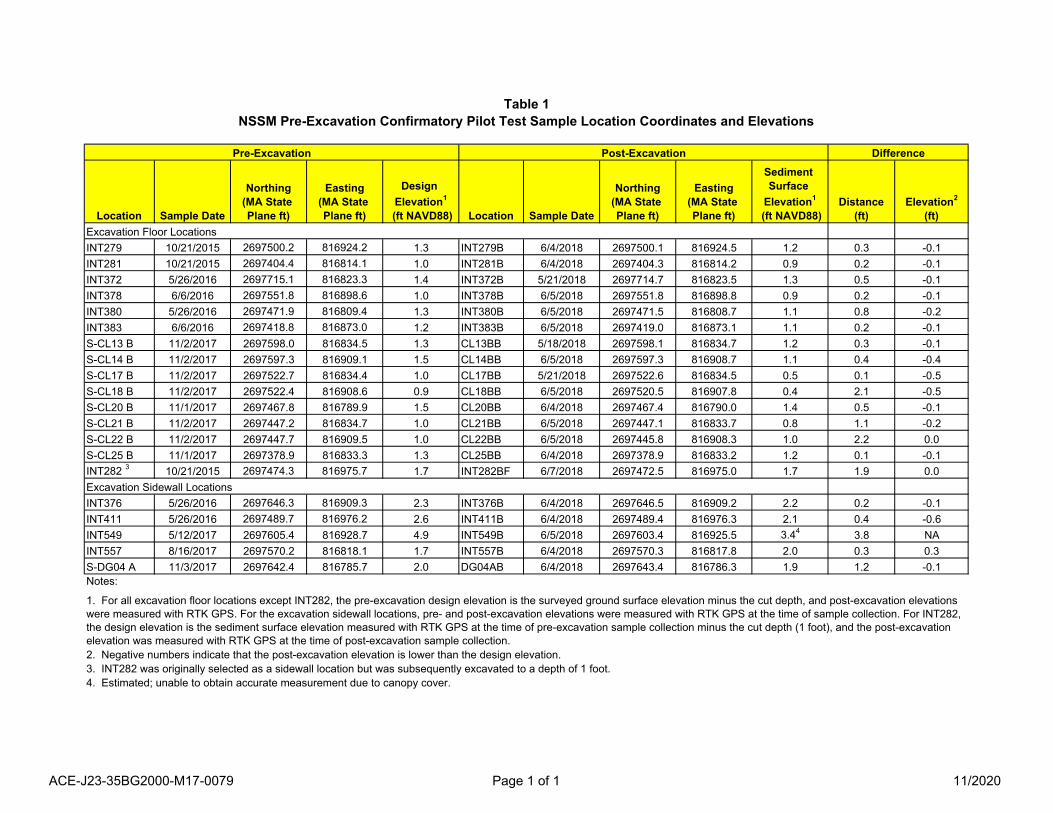
Table 1 NSSM Pre-Excavation Confirmatory Pilot Test Sample Location Coordinates and Elevations
Pre-Excavation Post-Excavation Difference
Location Sample Date
Northing (MA State Plane ft)
Easting (MA State Plane ft)
Design Elevation1
(ft NAVD88) Location Sample Date
Northing (MA State Plane ft)
Easting (MA State Plane ft)
Sediment Surface
Elevation1
(ft NAVD88) Distance
(ft) Elevation2
(ft) Excavation Floor Locations INT279 10/21/2015 2697500.2 816924.2 1.3 INT279B 6/4/2018 2697500.1 816924.5 1.2 0.3 -0.1 INT281 10/21/2015 2697404.4 816814.1 1.0 INT281B 6/4/2018 2697404.3 816814.2 0.9 0.2 -0.1 INT372 5/26/2016 2697715.1 816823.3 1.4 INT372B 5/21/2018 2697714.7 816823.5 1.3 0.5 -0.1 INT378 6/6/2016 2697551.8 816898.6 1.0 INT378B 6/5/2018 2697551.8 816898.8 0.9 0.2 -0.1 INT380 5/26/2016 2697471.9 816809.4 1.3 INT380B 6/5/2018 2697471.5 816808.7 1.1 0.8 -0.2 INT383 6/6/2016 2697418.8 816873.0 1.2 INT383B 6/5/2018 2697419.0 816873.1 1.1 0.2 -0.1 S-CL13 B 11/2/2017 2697598.0 816834.5 1.3 CL13BB 5/18/2018 2697598.1 816834.7 1.2 0.3 -0.1 S-CL14 B 11/2/2017 2697597.3 816909.1 1.5 CL14BB 6/5/2018 2697597.3 816908.7 1.1 0.4 -0.4 S-CL17 B 11/2/2017 2697522.7 816834.4 1.0 CL17BB 5/21/2018 2697522.6 816834.5 0.5 0.1 -0.5 S-CL18 B 11/2/2017 2697522.4 816908.6 0.9 CL18BB 6/5/2018 2697520.5 816907.8 0.4 2.1 -0.5 S-CL20 B 11/1/2017 2697467.8 816789.9 1.5 CL20BB 6/4/2018 2697467.4 816790.0 1.4 0.5 -0.1 S-CL21 B 11/2/2017 2697447.2 816834.7 1.0 CL21BB 6/5/2018 2697447.1 816833.7 0.8 1.1 -0.2 S-CL22 B 11/2/2017 2697447.7 816909.5 1.0 CL22BB 6/5/2018 2697445.8 816908.3 1.0 2.2 0.0 S-CL25 B 11/1/2017 2697378.9 816833.3 1.3 CL25BB 6/4/2018 2697378.9 816833.2 1.2 0.1 -0.1 INT282 3 10/21/2015 2697474.3 816975.7 1.7 INT282BF 6/7/2018 2697472.5 816975.0 1.7 1.9 0.0 Excavation Sidewall Locations INT376 5/26/2016 2697646.3 816909.3 2.3 INT376B 6/4/2018 2697646.5 816909.2 2.2 0.2 -0.1 INT411 5/26/2016 2697489.7 816976.2 2.6 INT411B 6/4/2018 2697489.4 816976.3 2.1 0.4 -0.6 INT549 5/12/2017 2697605.4 816928.7 4.9 INT549B 6/5/2018 2697603.4 816925.5 3.44 3.8 NA INT557 8/16/2017 2697570.2 816818.1 1.7 INT557B 6/4/2018 2697570.3 816817.8 2.0 0.3 0.3 S-DG04 A 11/3/2017 2697642.4 816785.7 2.0 DG04AB 6/4/2018 2697643.4 816786.3 1.9 1.2 -0.1 Notes:
1. For all excavation floor locations except INT282, the pre-excavation design elevation is the surveyed ground surface elevation minus the cut depth, and post-excavation elevations were measured with RTK GPS. For the excavation sidewall locations, pre- and post-excavation elevations were measured with RTK GPS at the time of sample collection. For INT282, the design elevation is the sediment surface elevation measured with RTK GPS at the time of pre-excavation sample collection minus the cut depth (1 foot), and the post-excavation elevation was measured with RTK GPS at the time of post-excavation sample collection. 2. Negative numbers indicate that the post-excavation elevation is lower than the design elevation. 3. INT282 was originally selected as a sidewall location but was subsequently excavated to a depth of 1 foot. 4. Estimated; unable to obtain accurate measurement due to canopy cover.
ACE-J23-35BG2000-M17-0079 Page 1 of 1 11/2020
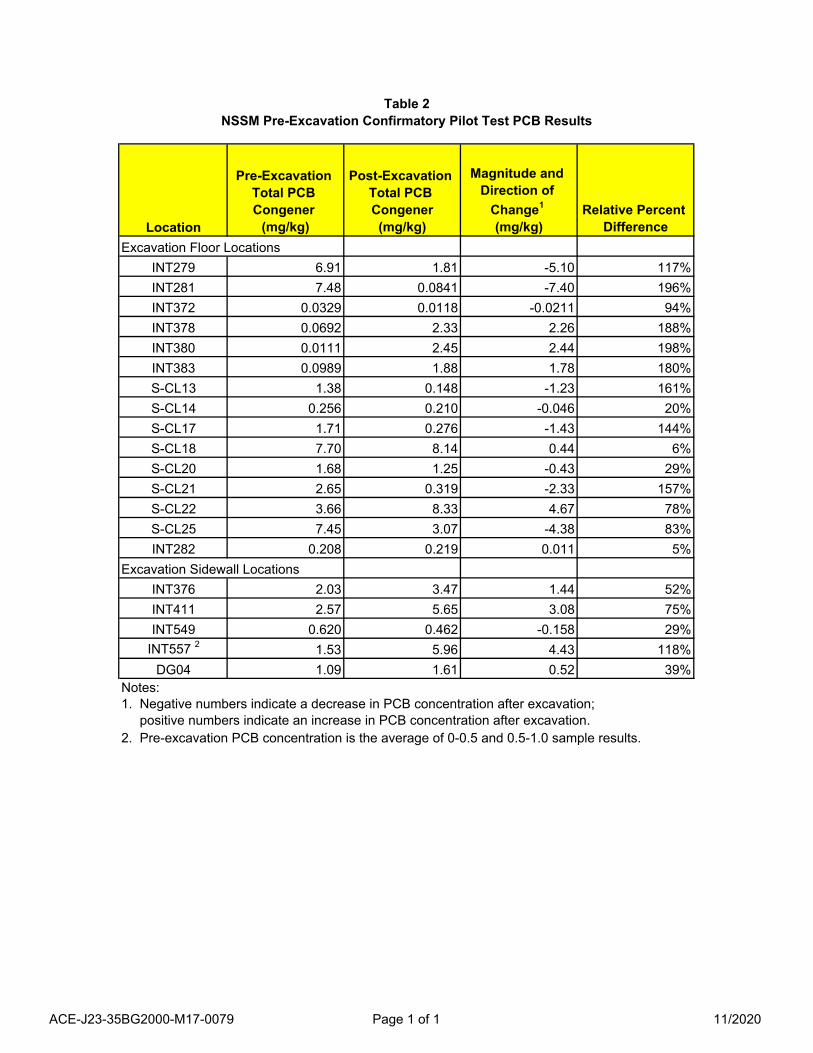
Table 2 NSSM Pre-Excavation Confirmatory Pilot Test PCB Results
Location
Pre-Excavation Total PCB Congener
(mg/kg)
Post-Excavation Total PCB Congener (mg/kg)
Magnitude and Direction of
Change1
(mg/kg) Relative Percent
Difference Excavation Floor Locations
INT279 6.91 1.81 -5.10 117% INT281 7.48 0.0841 -7.40 196% INT372 0.0329 0.0118 -0.0211 94% INT378 0.0692 2.33 2.26 188% INT380 0.0111 2.45 2.44 198% INT383 0.0989 1.88 1.78 180% S-CL13 1.38 0.148 -1.23 161% S-CL14 0.256 0.210 -0.046 20% S-CL17 1.71 0.276 -1.43 144% S-CL18 7.70 8.14 0.44 6% S-CL20 1.68 1.25 -0.43 29% S-CL21 2.65 0.319 -2.33 157% S-CL22 3.66 8.33 4.67 78% S-CL25 7.45 3.07 -4.38 83% INT282 0.208 0.219 0.011 5%
Excavation Sidewall Locations INT376 2.03 3.47 1.44 52% INT411 2.57 5.65 3.08 75% INT549 0.620 0.462 -0.158 29%
INT557 2 1.53 5.96 4.43 118% DG04 1.09 1.61 0.52 39%
Notes: 1. Negative numbers indicate a decrease in PCB concentration after excavation;
positive numbers indicate an increase in PCB concentration after excavation. 2. Pre-excavation PCB concentration is the average of 0-0.5 and 0.5-1.0 sample results.
ACE-J23-35BG2000-M17-0079 Page 1 of 1 11/2020
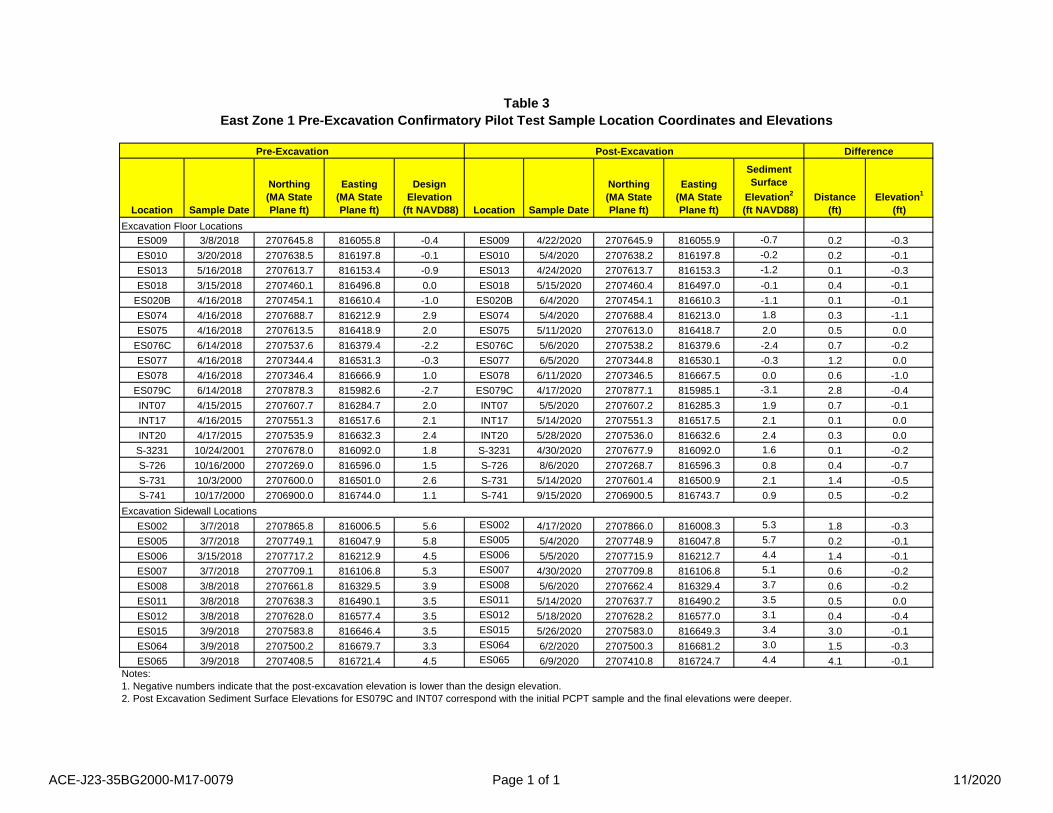
Table 3 East Zone 1 Pre-Excavation Confirmatory Pilot Test Sample Location Coordinates and Elevations
Pre-Excavation Post-Excavation Difference
Location Sample Date
Northing (MA State Plane ft)
Easting (MA State Plane ft)
Design Elevation
(ft NAVD88) Location Sample Date
Northing (MA State Plane ft)
Easting (MA State Plane ft)
Sediment Surface
Elevation2
(ft NAVD88) Distance
(ft) Elevation1
(ft)Excavation Floor Locations
ES009 3/8/2018 2707645.8 816055.8 -0.4 ES009 4/22/2020 2707645.9 816055.9 -0.7 0.2 -0.3ES010 3/20/2018 2707638.5 816197.8 -0.1 ES010 5/4/2020 2707638.2 816197.8 -0.2 0.2 -0.1ES013 5/16/2018 2707613.7 816153.4 -0.9 ES013 4/24/2020 2707613.7 816153.3 -1.2 0.1 -0.3ES018 3/15/2018 2707460.1 816496.8 0.0 ES018 5/15/2020 2707460.4 816497.0 -0.1 0.4 -0.1
ES020B 4/16/2018 2707454.1 816610.4 -1.0 ES020B 6/4/2020 2707454.1 816610.3 -1.1 0.1 -0.1ES074 4/16/2018 2707688.7 816212.9 2.9 ES074 5/4/2020 2707688.4 816213.0 1.8 0.3 -1.1ES075 4/16/2018 2707613.5 816418.9 2.0 ES075 5/11/2020 2707613.0 816418.7 2.0 0.5 0.0
ES076C 6/14/2018 2707537.6 816379.4 -2.2 ES076C 5/6/2020 2707538.2 816379.6 -2.4 0.7 -0.2ES077 4/16/2018 2707344.4 816531.3 -0.3 ES077 6/5/2020 2707344.8 816530.1 -0.3 1.2 0.0ES078 4/16/2018 2707346.4 816666.9 1.0 ES078 6/11/2020 2707346.5 816667.5 0.0 0.6 -1.0
ES079C 6/14/2018 2707878.3 815982.6 -2.7 ES079C 4/17/2020 2707877.1 815985.1 -3.1 2.8 -0.4INT07 4/15/2015 2707607.7 816284.7 2.0 INT07 5/5/2020 2707607.2 816285.3 1.9 0.7 -0.1INT17 4/16/2015 2707551.3 816517.6 2.1 INT17 5/14/2020 2707551.3 816517.5 2.1 0.1 0.0INT20 4/17/2015 2707535.9 816632.3 2.4 INT20 5/28/2020 2707536.0 816632.6 2.4 0.3 0.0S-3231 10/24/2001 2707678.0 816092.0 1.8 S-3231 4/30/2020 2707677.9 816092.0 1.6 0.1 -0.2S-726 10/16/2000 2707269.0 816596.0 1.5 S-726 8/6/2020 2707268.7 816596.3 0.8 0.4 -0.7S-731 10/3/2000 2707600.0 816501.0 2.6 S-731 5/14/2020 2707601.4 816500.9 2.1 1.4 -0.5S-741 10/17/2000 2706900.0 816744.0 1.1 S-741 9/15/2020 2706900.5 816743.7 0.9 0.5 -0.2
Excavation Sidewall Locations ES002 3/7/2018 2707865.8 816006.5 5.6 ES002 4/17/2020 2707866.0 816008.3 5.3 1.8 -0.3ES005 3/7/2018 2707749.1 816047.9 5.8 ES005 5/4/2020 2707748.9 816047.8 5.7 0.2 -0.1ES006 3/15/2018 2707717.2 816212.9 4.5 ES006 5/5/2020 2707715.9 816212.7 4.4 1.4 -0.1ES007 3/7/2018 2707709.1 816106.8 5.3 ES007 4/30/2020 2707709.8 816106.8 5.1 0.6 -0.2ES008 3/8/2018 2707661.8 816329.5 3.9 ES008 5/6/2020 2707662.4 816329.4 3.7 0.6 -0.2ES011 3/8/2018 2707638.3 816490.1 3.5 ES011 5/14/2020 2707637.7 816490.2 3.5 0.5 0.0ES012 3/8/2018 2707628.0 816577.4 3.5 ES012 5/18/2020 2707628.2 816577.0 3.1 0.4 -0.4ES015 3/9/2018 2707583.8 816646.4 3.5 ES015 5/26/2020 2707583.0 816649.3 3.4 3.0 -0.1ES064 3/9/2018 2707500.2 816679.7 3.3 ES064 6/2/2020 2707500.3 816681.2 3.0 1.5 -0.3ES065 3/9/2018 2707408.5 816721.4 4.5 ES065 6/9/2020 2707410.8 816724.7 4.4 4.1 -0.1
Notes:1. Negative numbers indicate that the post-excavation elevation is lower than the design elevation.2. Post Excavation Sediment Surface Elevations for ES079C and INT07 correspond with the initial PCPT sample and the final elevations were deeper.
ACE-J23-35BG2000-M17-0079 Page 1 of 1 11/2020
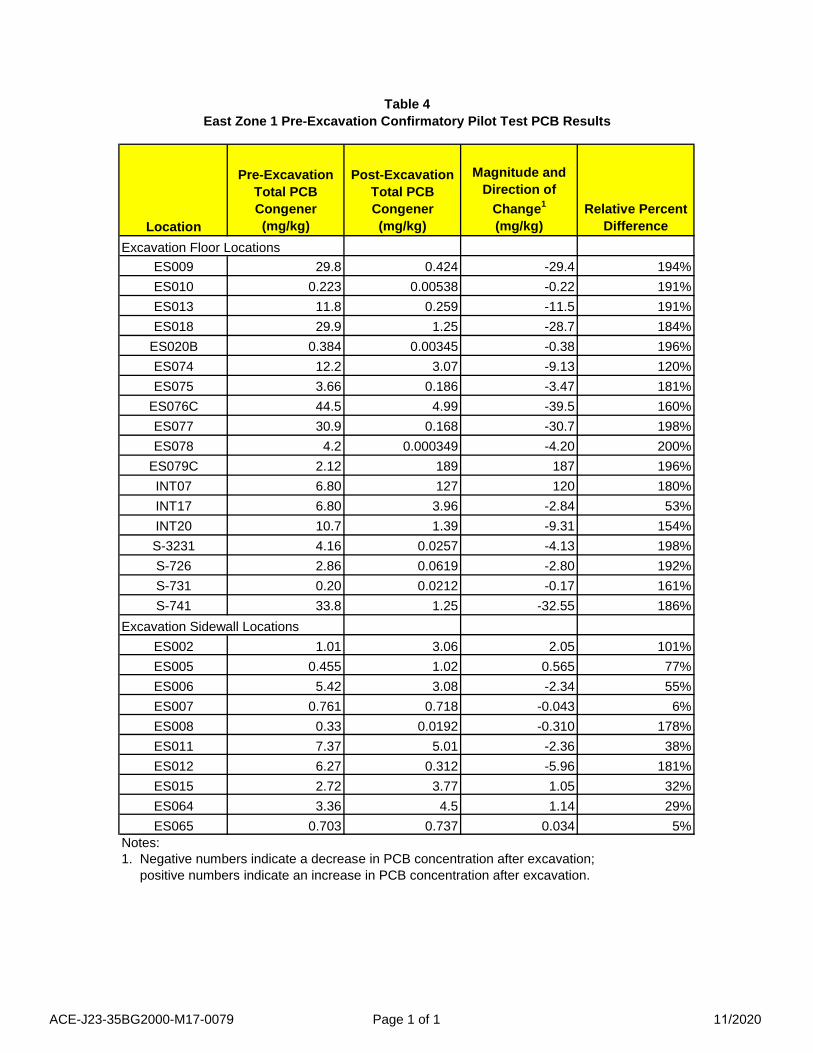
Table 4 East Zone 1 Pre-Excavation Confirmatory Pilot Test PCB Results
Location
Pre-Excavation Total PCB Congener (mg/kg)
Post-Excavation Total PCB Congener (mg/kg)
Magnitude and Direction of
Change1
(mg/kg) Relative Percent
Difference Excavation Floor Locations
ES009 29.8 0.424 -29.4 194%ES010 0.223 0.00538 -0.22 191%ES013 11.8 0.259 -11.5 191%ES018 29.9 1.25 -28.7 184%
ES020B 0.384 0.00345 -0.38 196%ES074 12.2 3.07 -9.13 120%ES075 3.66 0.186 -3.47 181%
ES076C 44.5 4.99 -39.5 160%ES077 30.9 0.168 -30.7 198%ES078 4.2 0.000349 -4.20 200%
ES079C 2.12 189 187 196%INT07 6.80 127 120 180%INT17 6.80 3.96 -2.84 53%INT20 10.7 1.39 -9.31 154%S-3231 4.16 0.0257 -4.13 198%S-726 2.86 0.0619 -2.80 192%S-731 0.20 0.0212 -0.17 161%S-741 33.8 1.25 -32.55 186%
Excavation Sidewall Locations ES002 1.01 3.06 2.05 101%ES005 0.455 1.02 0.565 77%ES006 5.42 3.08 -2.34 55%ES007 0.761 0.718 -0.043 6%ES008 0.33 0.0192 -0.310 178%ES011 7.37 5.01 -2.36 38%ES012 6.27 0.312 -5.96 181%ES015 2.72 3.77 1.05 32%ES064 3.36 4.5 1.14 29%ES065 0.703 0.737 0.034 5%
Notes:1. Negative numbers indicate a decrease in PCB concentration after excavation;
positive numbers indicate an increase in PCB concentration after excavation.
ACE-J23-35BG2000-M17-0079 Page 1 of 1 11/2020