Embed Size (px)
Citation preview
FINAL
2010 Work Plan
Site Investigation of Nine Sites at the
U.S. Army Kwajalein Atoll/Reagan Test Site
(USAKA/RTS) Republic of Marshall Islands
Kwajalein Harbor (Site ID CCKWAJ-001)
Kwajalein Landfill (Site ID CCKWAJ-002)
Roi-Namur Power Plant Fuel Spill (Site ID CCKWAJ-003)
Carlos Power Plant (Site ID CCKWAJ-004)
(Kwajalein) PCB Vaults (Site ID CCKWAJ-005)
(Kwajalein) Fuel Farm/Old Power Plant Fuel Line (Site ID CCKWAJ-006)
(Kwajalein) Cold Storage Warehouse (Site ID CCKWAJ-007)
(Roi-Namur) Drinking Water Well 8151 PCE/TCE (Site ID CCKWAJ-008)
Gagan Power Plant Fuel Spill (Site ID CCKWAJ-009)
October 2010
Contract No. DASG60-03-C-0081
Prepared for:
United States Army Space and Missile Defense Command
Von Braun Complex
Building 5220
Redstone Arsenal, Alabama 35898
Prepared by:
3150 C Street, Suite 250
Anchorage, Alaska 99503
DISTRIBUTION STATEMENT A. Approved for Public Release. Distribution is unlimited.
Document No. 2145

[THIS PAGE LEFT INTENTIONALLY BLANK.]
Final 2010 Site Investigation Work Plan Sivuniq, Inc.
Kwajalein Atoll/Reagan Test Site i October 2010
TABLE OF CONTENTS
1.0 INTRODUCTION ............................................................................................................ 1-1
1.1 TECHNICAL APPROACH AND SCOPE OF SERVICES ................................................... 1-1
1.2 PROJECT ORGANIZATION AND RESPONSIBILITY ..................................................... 1-7
1.2.1 Roles ............................................................................................................. 1-8
1.2.2 Responsibilities ........................................................................................... 1-8
1.3 REGULATORY CRITERIA ........................................................................................... 1-9
1.4 PROJECT SCHEDULE ................................................................................................ 1-10
2.0 SITE BACKGROUND AND PHYSICAL SETTING ................................................... 2-1
2.1 SITE LOCATION AND DESCRIPTION .......................................................................... 2-1
2.2 PHYSICAL AND ENVIRONMENTAL SETTING ............................................................. 2-2
2.2.1 Environmental Setting ............................................................................... 2-2
2.2.2 Climate......................................................................................................... 2-3
2.2.3 Regional Geology ........................................................................................ 2-4
2.2.4 Soil Characteristics ..................................................................................... 2-4
2.2.5 Hydrogeology .............................................................................................. 2-4
2.3 INSTALLATION HISTORY AND MISSION .................................................................... 2-5
3.0 SCOPE OF WORK .......................................................................................................... 3-1
3.1 BACKGROUND RESEARCH ......................................................................................... 3-1
3.2 FIELD ACTIVITIES ..................................................................................................... 3-2
3.3 OFFICE ACTIVITIES ................................................................................................... 3-6
4.0 SITE DESCRIPTIONS .................................................................................................... 4-1
4.1 KWAJALEIN HARBOR (SITE CCKWAJ-001) ........................................................... 4-3
4.1.1 Site History .................................................................................................. 4-3
4.1.2 Previous Investigations .............................................................................. 4-3
4.1.3 Conceptual Site Model ............................................................................... 4-6
4.1.4 Investigation Approach .............................................................................. 4-7
4.1.5 Land Source Contaminant Identification ................................................ 4-7
4.2 KWAJALEIN LANDFILL (SITE CCKWAJ-002) ....................................................... 4-11
4.2.1 Site History ................................................................................................ 4-11
4.2.2 Previous Investigation .............................................................................. 4-11
4.2.3 Conceptual Site Model ............................................................................. 4-12
4.2.4 Investigation Approach ............................................................................ 4-13
4.2.4.1 Topographic and Bathymetric Survey ...................................... 4-13
4.2.4.2 Landfill Material Examination ................................................ 4-14
4.3 PCB VAULTS (KWAJALEIN) (SITE CCKWAJ-005) ............................................... 4-16
Final 2010 Site Investigation Work Plan Sivuniq, Inc.
Kwajalein Atoll/Reagan Test Site ii October 2010
4.3.1 Site History ................................................................................................ 4-16
4.3.2 Previous Investigations ............................................................................ 4-16
4.3.3 Conceptual Site Model ............................................................................. 4-19
4.3.4 Investigation Approach ............................................................................ 4-20
4.3.4.1 Concrete Sampling .................................................................... 4-20
4.3.4.2 Soil Sampling ............................................................................ 4-21
4.3.4.3 Water Sampling ......................................................................... 4-22
4.4 FUEL FARM/OLD POWER PLANT FUEL LINE (SITE CCKWAJ-006) .................... 4-24
4.4.1 Site History ................................................................................................ 4-24
4.4.2 Previous Investigations ............................................................................ 4-24
4.4.3 Conceptual Site Model ............................................................................. 4-27
4.4.4 Investigation Approach ............................................................................ 4-28
4.4.4.1 Soil-Gas Survey ......................................................................... 4-29
4.4.4.2 Soil Sampling ............................................................................ 4-30
4.4.4.3 Groundwater Sampling ............................................................. 4-30
4.4.4.4 Free Product Recovery.............................................................. 4-31
4.5 COLD STORAGE WAREHOUSE (SITE CCKWAJ-007) ........................................... 4-33
4.5.1 Site History ................................................................................................ 4-33
4.5.2 Previous Investigations ............................................................................ 4-33
4.5.3 Conceptual Site Model ............................................................................. 4-33
4.5.4 Investigation Approach ............................................................................ 4-34
4.6 ROI POWER PLANT FUEL SPILL (SITE CCKWAJ-003) ........................................ 4-38
4.6.1 Site History ................................................................................................ 4-38
4.6.2 Previous Investigations ............................................................................ 4-38
4.6.3 Conceptual Site Model ............................................................................. 4-40
4.6.1 Investigation Approach ............................................................................ 4-40
4.6.1.1 Soil-Gas Survey ......................................................................... 4-42
4.6.1.2 Soil Sampling ............................................................................ 4-42
4.6.1.3 Groundwater Sampling ............................................................. 4-43
4.6.1.4 Free Product Recovery.............................................................. 4-43
4.7 DRINKING WATER WELL 8151 PCE/TCE (ROI-NAMUR) (SITE CCKWAJ-
008) .......................................................................................................................... 4-45
4.7.1 Site History ................................................................................................ 4-45
4.7.2 Previous Investigation .............................................................................. 4-45
4.7.3 Conceptual Site Model ............................................................................. 4-47
4.7.4 Investigation Approach ............................................................................ 4-48
4.7.4.1 Soil-Gas Survey ......................................................................... 4-48
4.7.4.2 Groundwater Sampling ............................................................. 4-48
4.7.4.3 Soil Sampling ............................................................................ 4-49
4.8 CARLOS POWER PLANT (SITE CCKWAJ-004) ..................................................... 4-51
4.8.1 Site History ................................................................................................ 4-51
Final 2010 Site Investigation Work Plan Sivuniq, Inc.
Kwajalein Atoll/Reagan Test Site iii October 2010
4.8.2 Previous Investigation .............................................................................. 4-51
4.8.3 Conceptual Site Model ............................................................................. 4-51
4.8.4 Investigation Approach ............................................................................ 4-52
4.8.4.1 Soil-Gas Survey ......................................................................... 4-53
4.8.4.2 Soil Sampling ............................................................................ 4-53
4.8.4.3 Groundwater Sampling ............................................................. 4-53
4.9 GAGAN POWER PLANT FUEL SPILL (SITE CCKWAJ-009) ................................... 4-56
4.9.1 Site History ................................................................................................ 4-56
4.9.2 Previous Investigation .............................................................................. 4-56
4.9.3 Conceptual Site Model ............................................................................. 4-56
4.9.4 Investigation Approach ............................................................................ 4-58
4.9.4.1 Soil-Gas Survey ......................................................................... 4-59
4.9.4.2 Soil Sampling ............................................................................ 4-59
4.9.4.3 Groundwater Sampling ............................................................. 4-59
5.0 REFERENCES.................................................................................................................. 5-1
ANNEXES
Annex A Field Sampling Plan
Annex B Quality Assurance Project Plan
Annex C Site Safety and Health Plan
Annex D Archaeological Monitoring Plan (Kwaj-10-52)
Final 2010 Site Investigation Work Plan Sivuniq, Inc.
Kwajalein Atoll/Reagan Test Site iv October 2010
TABLES
Table 3-1 Field Screening Methods for Soils ........................................................................ 3-3
Table 3-2 Field Screening Methods for Water ...................................................................... 3-3
Table 3-3 Laboratory Analytical Methods for Soils .............................................................. 3-4
Table 3-4 Laboratory Analytical Methods for Water ............................................................ 3-4
Table 3-5 Summary of Sample Container Requirements ...................................................... 3-5
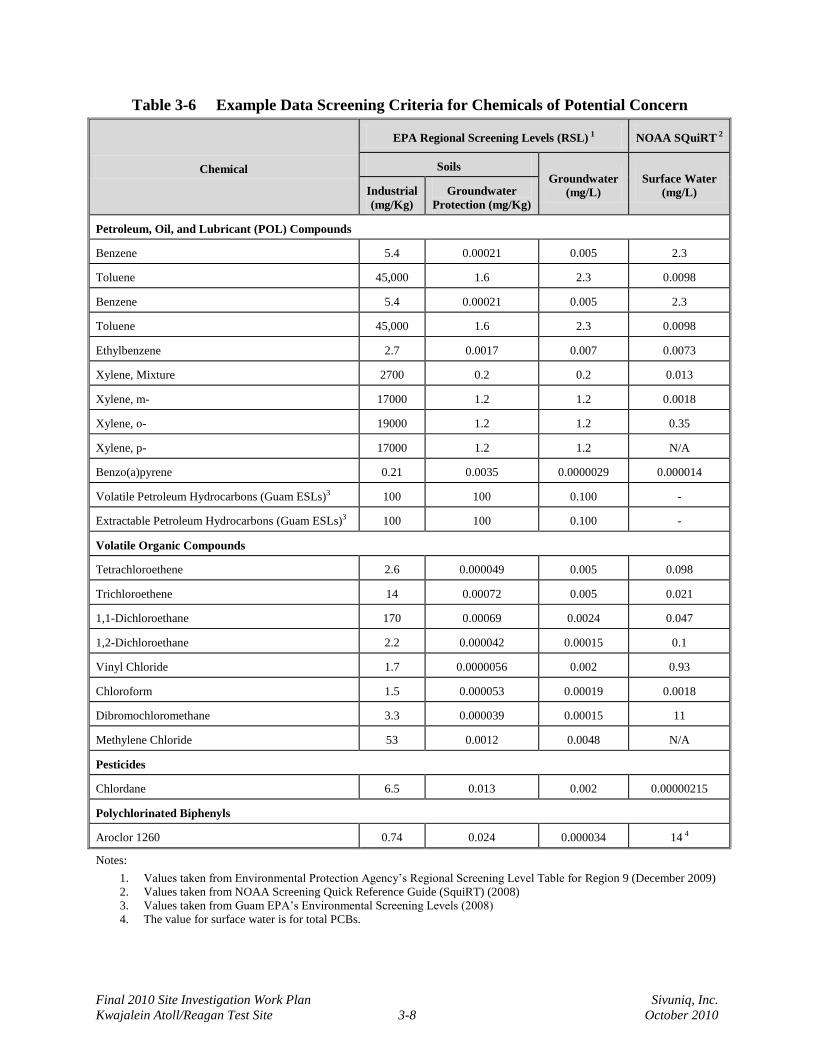
Table 3-6 Example Data Screening Criteria for Chemicals of Potential Concern ................ 3-8
Table 4-1 Kwajalein Harbor Shoreside Source Conceptual Site Model ............................... 4-6
Table 4-2 Kwajalein Harbor Shoreside Source Field Activities Summary ........................... 4-8
Table 4-3 Kwajalein Landfill Site Conceptual Site Model .................................................. 4-12
Table 4-4 Kwajalein PCB Vaults Conceptual Site Model ................................................... 4-19
Table 4-5 Kwajalein PCB Vaults Field Activities Summary .............................................. 4-23
Table 4-6 Kwajalein Fuel Farm/Old Power Plant Fuel Line Conceptual Site Model ......... 4-28
Table 4-7 Kwajalein Fuel Farm/Old Power Plant Fuel Line Field Activities Summary ..... 4-32
Table 4-8 Kwajalein Cold Storage Warehouse Conceptual Site Model .............................. 4-34
Table 4-9 Kwajalein Cold Storage Warehouse Field Activities Summary ......................... 4-36
Table 4-10 Roi Power Plant Fuel Spill Conceptual Site Model ............................................ 4-41
Table 4-11 Roi Power Plant POL Spill Field Activities Summary ....................................... 4-44
Table 4-12 Roi-Namur Drinking Water Well 8151 PCE/TCE Conceptual Site Model ........ 4-47
Table 4-13 Roi-Namur Drinking Water Well 8151 Field Activities Summary .................... 4-50
Table 4-14 Carlos Power Plant Fuel Spill Conceptual Site Model ........................................ 4-51
Table 4-15 Carlos Power Plant Field Activities Summary .................................................... 4-54
Table 4-17 Gagan Power Plant Fuel Spill Conceptual Site Model ........................................ 4-58
Table 4-16 Gagen Power Plant Field Activities Summary .................................................... 4-60
Final 2010 Site Investigation Work Plan Sivuniq, Inc.
Kwajalein Atoll/Reagan Test Site v October 2010
FIGURES
Figure 1-1 Project Organization .............................................................................................. 1-7
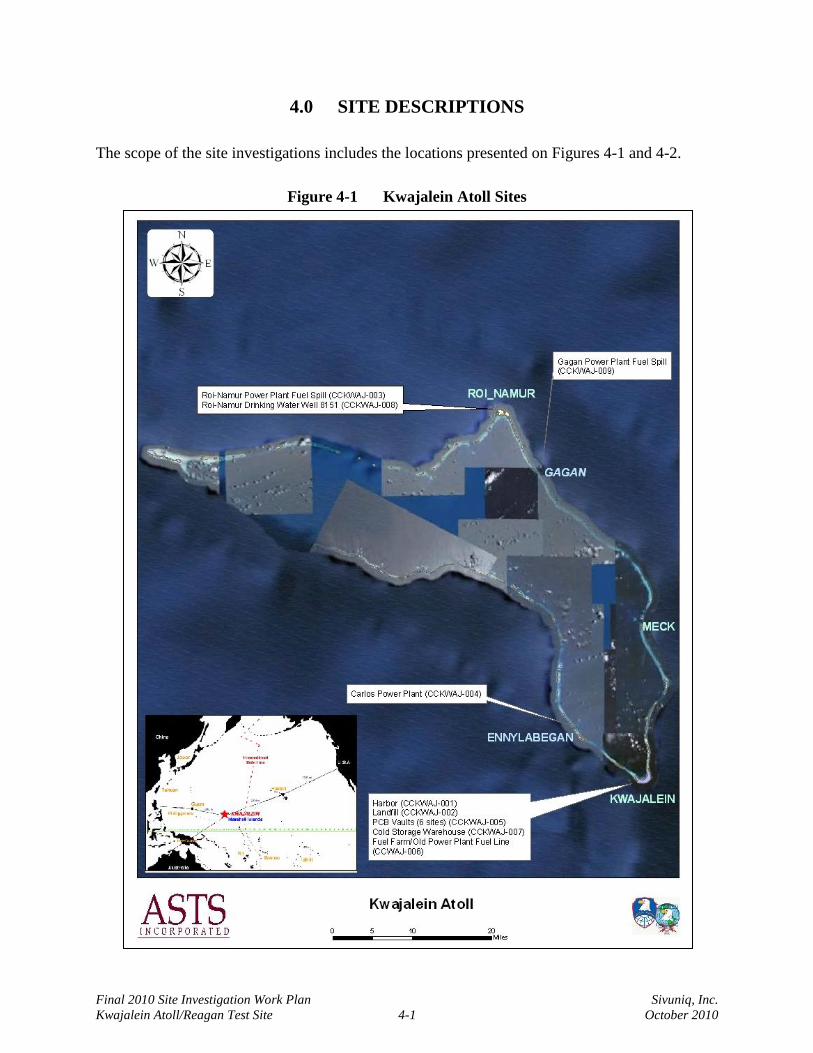
Figure 4-1 Kwajalein Atoll Sites ............................................................................................. 4-1
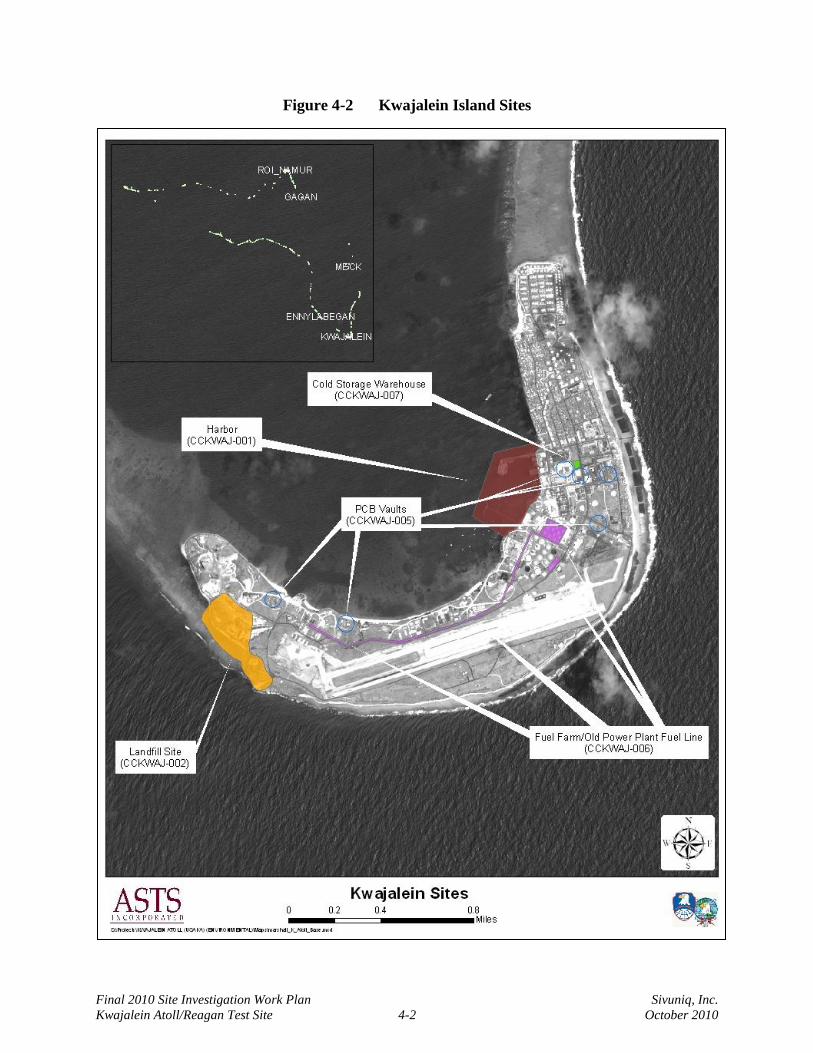
Figure 4-2 Kwajalein Island Sites ........................................................................................... 4-2
Figure 4-3 Kwajalein Harbor Sewer Drains ............................................................................ 4-9
Figure 4-4 Kwajalein Harbor Stormwater Conveyance Conceptual Sampling Plan ............ 4-10
Figure 4-5 Kwajalein Landfill ............................................................................................... 4-15
Figure 4-6 Kwajalein PCB Vaults ......................................................................................... 4-17
Figure 4-7 Kwajalein Fuel Farm Site .................................................................................... 4-25
Figure 4-8 Kwajalein Old Power Plant Fuel Line Site ......................................................... 4-26
Figure 4-9 Kwajalein Cold Storage Warehouse Site ............................................................ 4-37
Figure 4-10 Roi Power Plant Fuel Spill Site ........................................................................... 4-39
Figure 4-11 Roi-Namur Drinking Water Well 8151 PCE/TCE Site ....................................... 4-46
Figure 4-12 Carlos Power Plant Site ....................................................................................... 4-55
Figure 4-13 Gagan Power Plant Site ....................................................................................... 4-57
Final 2010 Site Investigation Work Plan Sivuniq, Inc.
Kwajalein Atoll/Reagan Test Site vi October 2010
LIST OF ACRONYMS AND ABBREVIATIONS
µg microgram
ARSTRAT U.S. Army Forces Strategic Command
AST aboveground storage tank
bgs below ground surface
BMP best management practices
CHPPM U.S. Army Center for Health Promotion and Preventive Medicine
COPC contaminant of potential concern
CSM conceptual site model
DCE dichloroethene
DDT dichlorodiphenyltrichloroethane
DESC Defense Energy Support Center
DNAPL dense nonaqueous-phase liquid
DoD U.S. Department of Defense
DQO data quality objectives
EPA U.S. Environmental Protection Agency
EPH extractable petroleum hydrocarbon
ERL effects range-low
FDA Food and Drug Administration
FOM Facilities, Operations, and Maintenance
FSP Field Sampling Plan
GIS Geographic Information System
ICBM intercontinental ballistic missile
KMR Kwajalein Missile Range
LNAPL light nonaqueous-phase liquid
MCL maximum contaminant level
mg/kg milligram per kilogram
mph miles per hour
NMFS National Marine Fisheries Service
NOAA National Ocean and Atmospheric Administration
OWS oil/water separator
PA preliminary assessment
PAH polycyclic aromatic hydrocarbon
PCB polychlorinated biphenyl
PCE tetrachloroethene
Final 2010 Site Investigation Work Plan Sivuniq, Inc.
Kwajalein Atoll/Reagan Test Site vii October 2010
PID photoionization detector
POL petroleum, oil, and lubricant
ppm parts per million
PRG Preliminary Remediation Goal
QAPP Quality Assurance Project Plan
RCRA Resource Conservation and Recovery Act
RMI Republic of the Marshall Islands
RMIEPA Republic of the Marshall Islands Environmental Protection Authority
RSL Regional Screening Levels
RTS Reagan Test Site
SAP Sampling and Analysis Plan
SI site investigation
SMDC U.S. Army Space and Missile Defense Command
SquiRT Screening Quick Reference Tables (NOAA)
SSHP Site Safety and Health Plan
SVOC semivolatile organic compound
SWM Solid Waste Management
TCE trichloroethylene
TCLP toxicity characteristic leaching procedure
TEO U.S. Army Test and Evaluation Office
TOC total organic carbon
TPH total petroleum hydrocarbons
TPHWG Total Petroleum Hydrocarbon Working Group
UES U.S. Army Kwajalein Atoll Environmental Standards
USACE U.S. Army Corps of Engineers
USAEHA U.S. Army Environmental Hygiene Agency
USAKA U.S. Army Kwajalein Atoll
USFWS U.S. Fish and Wildlife Service
USGS U.S. Geological Survey
UVF ultraviolet fluorescence
UXO unexploded ordnance
VOC volatile organic compound
VPH volatile petroleum hydrocarbon
VSP Visual Sampling Plan

Final 2010 Site Investigation Work Plan Sivuniq, Inc.
Kwajalein Atoll/Reagan Test Site viii October 2010
[THIS PAGE LEFT INTENTIONALLY BLANK.]
Final 2010 Site Investigation Work Plan Sivuniq, Inc.
Kwajalein Atoll/Reagan Test Site 1-1 October 2010
1.0 INTRODUCTION
The U.S. Army Space and Missile Defense Command/U.S. Army Forces Strategic Command
(SMDC/ARSTRAT) tasked Sivuniq, Incorporated with the evaluation of areas of potential or
known contamination at nine sites located at Kwajalein Atoll in the Republic of the Marshall
Islands (RMI). The work is issued under Contract DASG60-03-C-0081, Task Assignment 10-
001. This Work Plan describes field activities planned for the 2010 Site Investigations (SIs).
The Field Sampling Plan (FSP), presented in Annex A, provides detailed procedures related to
the collection and analysis of soil, sediment, and water samples as well as other field activities
that will be used by the Sivuniq field team. The Quality Assurance Project Plan (QAPP),
presented in Annex B, describes the policies, organization, functional activities, and the data
quality objectives (DQOs) and measures necessary to obtain adequate data. Together, the FSP
and the QAPP constitute a Sampling and Analysis Plan (SAP) that provides a process for
obtaining data of sufficient quality and quantity to satisfy project needs.
The Site Safety and Health Plan (SSHP) presented in Annex C examines the hazards associated
with performing investigative work and describes the practices to be implemented to ensure
worker safety.
A project-specific Archaeological Monitoring Plan, provided in Annex D, addresses the
significant concerns related to protecting and preserving cultural and historical resources at the
sites. A qualified professional archaeologist implements the requirements of this plan.
1.1 Technical Approach and Scope of Services
The technical approach adopted for each area that will be investigated in 2010 has been
developed by reviewing existing information and assessing the need for additional data required
to complete the characterization process. The field data collection activities are primarily soil
sampling, groundwater sampling, and surface water sampling to determine the nature and extent
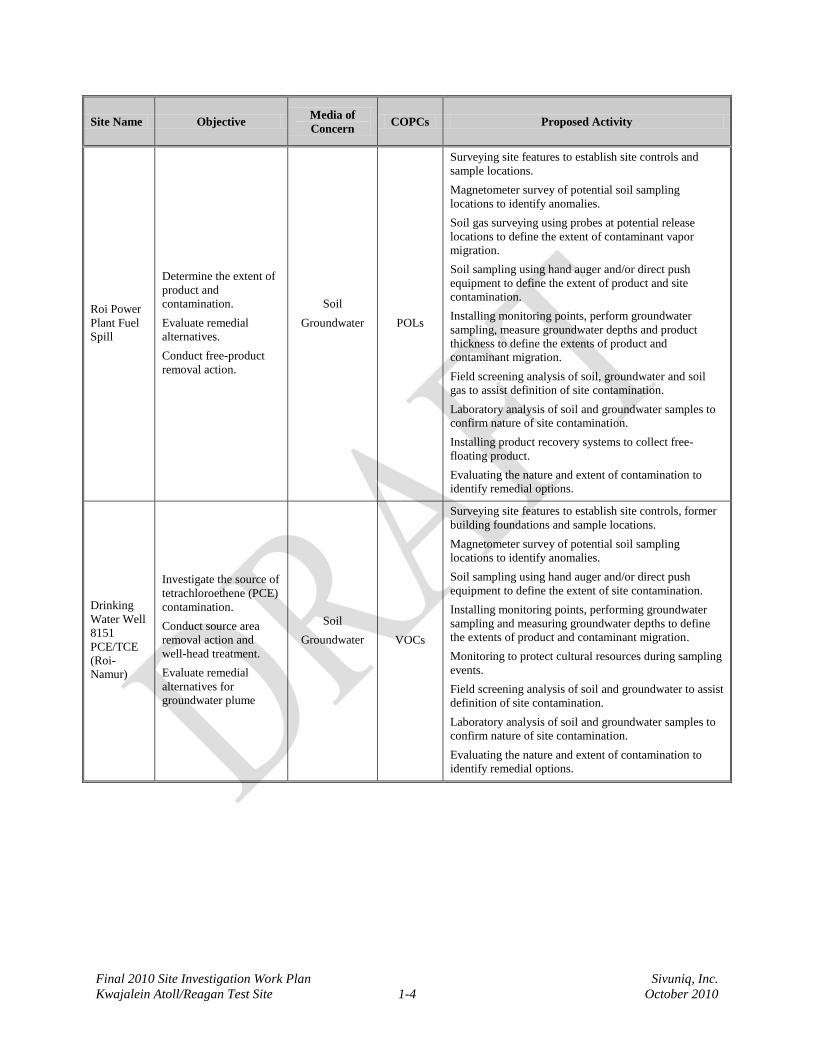
of contamination. Table 1-1 presents the technical approach for the 2010 scope of work.
Final 2010 Site Investigation Work Plan Sivuniq, Inc.
Kwajalein Atoll/Reagan Test Site 1-2 October 2010
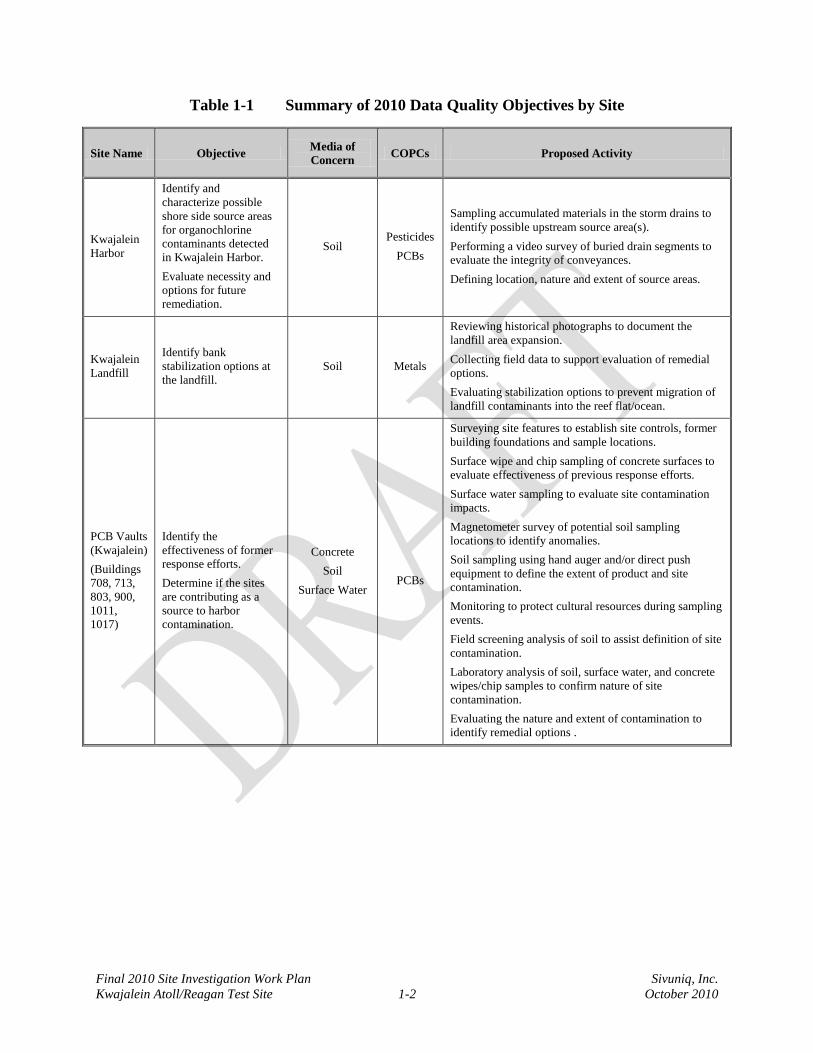
Table 1-1 Summary of 2010 Data Quality Objectives by Site
Site Name Objective Media of
Concern COPCs Proposed Activity
Kwajalein
Harbor
Identify and
characterize possible
shore side source areas
for organochlorine
contaminants detected
in Kwajalein Harbor.
Evaluate necessity and
options for future
remediation.
Soil Pesticides
PCBs
Sampling accumulated materials in the storm drains to
identify possible upstream source area(s).
Performing a video survey of buried drain segments to
evaluate the integrity of conveyances.
Defining location, nature and extent of source areas.
Kwajalein
Landfill
Identify bank
stabilization options at
the landfill.
Soil Metals
Reviewing historical photographs to document the
landfill area expansion.
Collecting field data to support evaluation of remedial
options.
Evaluating stabilization options to prevent migration of
landfill contaminants into the reef flat/ocean.
PCB Vaults
(Kwajalein)
(Buildings
708, 713,
803, 900,
1011,
1017)
Identify the
effectiveness of former
response efforts.
Determine if the sites
are contributing as a
source to harbor
contamination.
Concrete
Soil
Surface Water
PCBs
Surveying site features to establish site controls, former
building foundations and sample locations.
Surface wipe and chip sampling of concrete surfaces to
evaluate effectiveness of previous response efforts.
Surface water sampling to evaluate site contamination
impacts.
Magnetometer survey of potential soil sampling
locations to identify anomalies.
Soil sampling using hand auger and/or direct push
equipment to define the extent of product and site
contamination.
Monitoring to protect cultural resources during sampling
events.
Field screening analysis of soil to assist definition of site
contamination.
Laboratory analysis of soil, surface water, and concrete
wipes/chip samples to confirm nature of site
contamination.
Evaluating the nature and extent of contamination to
identify remedial options .
Final 2010 Site Investigation Work Plan Sivuniq, Inc.
Kwajalein Atoll/Reagan Test Site 1-3 October 2010
Site Name Objective Media of
Concern COPCs Proposed Activity
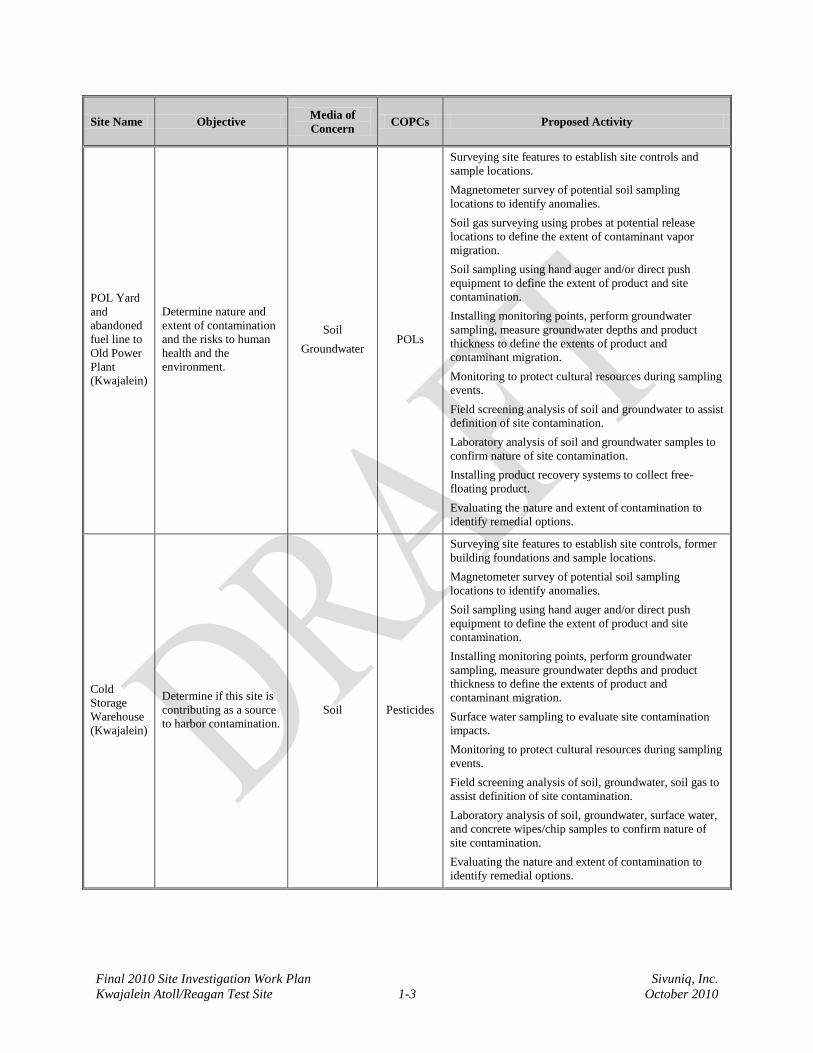
POL Yard
and
abandoned
fuel line to
Old Power
Plant
(Kwajalein)
Determine nature and
extent of contamination
and the risks to human
health and the
environment.
Soil
Groundwater POLs
Surveying site features to establish site controls and
sample locations.
Magnetometer survey of potential soil sampling
locations to identify anomalies.
Soil gas surveying using probes at potential release
locations to define the extent of contaminant vapor
migration.
Soil sampling using hand auger and/or direct push
equipment to define the extent of product and site
contamination.
Installing monitoring points, perform groundwater
sampling, measure groundwater depths and product
thickness to define the extents of product and
contaminant migration.
Monitoring to protect cultural resources during sampling
events.
Field screening analysis of soil and groundwater to assist
definition of site contamination.
Laboratory analysis of soil and groundwater samples to
confirm nature of site contamination.
Installing product recovery systems to collect free-
floating product.
Evaluating the nature and extent of contamination to
identify remedial options.
Cold
Storage
Warehouse
(Kwajalein)
Determine if this site is
contributing as a source
to harbor contamination.
Soil Pesticides
Surveying site features to establish site controls, former
building foundations and sample locations.
Magnetometer survey of potential soil sampling
locations to identify anomalies.
Soil sampling using hand auger and/or direct push
equipment to define the extent of product and site
contamination.
Installing monitoring points, perform groundwater
sampling, measure groundwater depths and product
thickness to define the extents of product and
contaminant migration.
Surface water sampling to evaluate site contamination
impacts.
Monitoring to protect cultural resources during sampling
events.
Field screening analysis of soil, groundwater, soil gas to
assist definition of site contamination.
Laboratory analysis of soil, groundwater, surface water,
and concrete wipes/chip samples to confirm nature of
site contamination.
Evaluating the nature and extent of contamination to
identify remedial options.
Final 2010 Site Investigation Work Plan Sivuniq, Inc.
Kwajalein Atoll/Reagan Test Site 1-4 October 2010
Site Name Objective Media of
Concern COPCs Proposed Activity
Roi Power
Plant Fuel
Spill
Determine the extent of
product and
contamination.
Evaluate remedial
alternatives.
Conduct free-product
removal action.
Soil
Groundwater
POLs
Surveying site features to establish site controls and
sample locations.
Magnetometer survey of potential soil sampling
locations to identify anomalies.
Soil gas surveying using probes at potential release
locations to define the extent of contaminant vapor
migration.
Soil sampling using hand auger and/or direct push
equipment to define the extent of product and site
contamination.
Installing monitoring points, perform groundwater
sampling, measure groundwater depths and product
thickness to define the extents of product and
contaminant migration.
Field screening analysis of soil, groundwater and soil
gas to assist definition of site contamination.
Laboratory analysis of soil and groundwater samples to
confirm nature of site contamination.
Installing product recovery systems to collect free-
floating product.
Evaluating the nature and extent of contamination to
identify remedial options.
Drinking
Water Well
8151
PCE/TCE
(Roi-
Namur)
Investigate the source of
tetrachloroethene (PCE)
contamination.
Conduct source area
removal action and
well-head treatment.
Evaluate remedial
alternatives for
groundwater plume
Soil
Groundwater
VOCs
Surveying site features to establish site controls, former
building foundations and sample locations.
Magnetometer survey of potential soil sampling
locations to identify anomalies.
Soil sampling using hand auger and/or direct push
equipment to define the extent of site contamination.
Installing monitoring points, performing groundwater
sampling and measuring groundwater depths to define
the extents of product and contaminant migration.
Monitoring to protect cultural resources during sampling
events.
Field screening analysis of soil and groundwater to assist
definition of site contamination.
Laboratory analysis of soil and groundwater samples to
confirm nature of site contamination.
Evaluating the nature and extent of contamination to
identify remedial options.
Final 2010 Site Investigation Work Plan Sivuniq, Inc.
Kwajalein Atoll/Reagan Test Site 1-5 October 2010
Site Name Objective Media of
Concern COPCs Proposed Activity
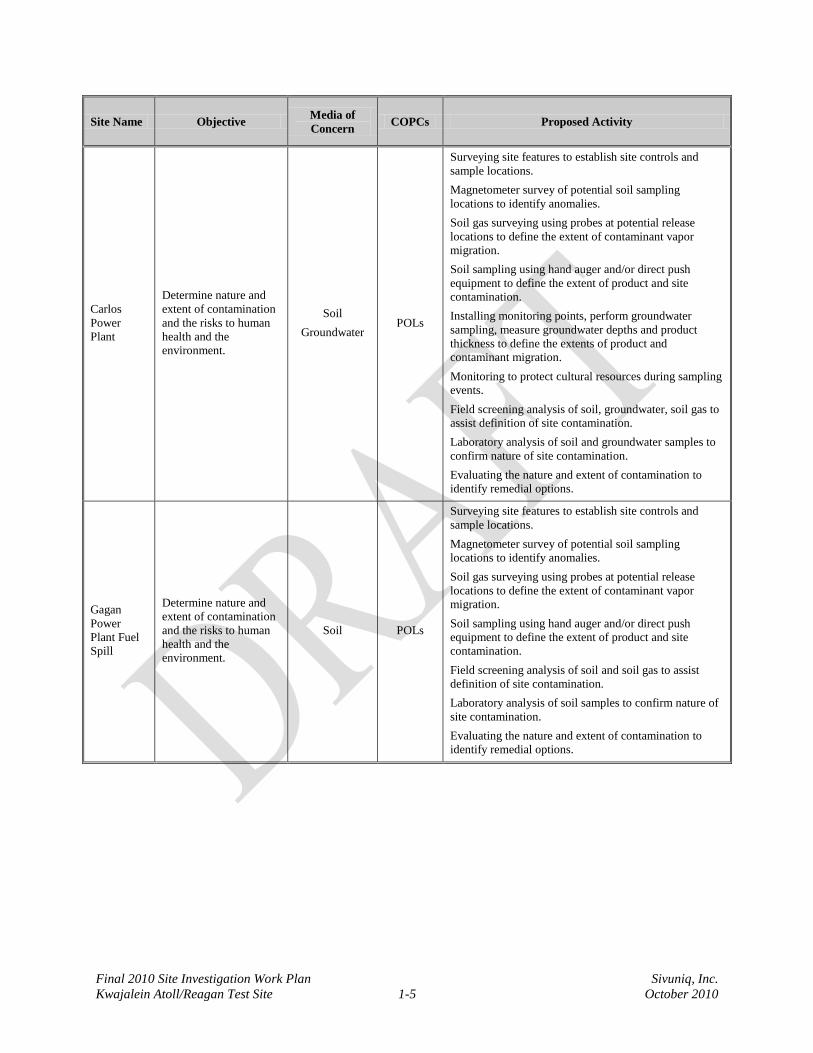
Carlos
Power
Plant
Determine nature and
extent of contamination
and the risks to human
health and the
environment.
Soil
Groundwater POLs
Surveying site features to establish site controls and
sample locations.
Magnetometer survey of potential soil sampling
locations to identify anomalies.
Soil gas surveying using probes at potential release
locations to define the extent of contaminant vapor
migration.
Soil sampling using hand auger and/or direct push
equipment to define the extent of product and site
contamination.
Installing monitoring points, perform groundwater
sampling, measure groundwater depths and product
thickness to define the extents of product and
contaminant migration.
Monitoring to protect cultural resources during sampling
events.
Field screening analysis of soil, groundwater, soil gas to
assist definition of site contamination.
Laboratory analysis of soil and groundwater samples to
confirm nature of site contamination.
Evaluating the nature and extent of contamination to
identify remedial options.
Gagan
Power
Plant Fuel
Spill
Determine nature and
extent of contamination
and the risks to human
health and the
environment.
Soil POLs
Surveying site features to establish site controls and
sample locations.
Magnetometer survey of potential soil sampling
locations to identify anomalies.
Soil gas surveying using probes at potential release
locations to define the extent of contaminant vapor
migration.
Soil sampling using hand auger and/or direct push
equipment to define the extent of product and site
contamination.
Field screening analysis of soil and soil gas to assist
definition of site contamination.
Laboratory analysis of soil samples to confirm nature of
site contamination.
Evaluating the nature and extent of contamination to
identify remedial options.
Final 2010 Site Investigation Work Plan Sivuniq, Inc.
Kwajalein Atoll/Reagan Test Site 1-6 October 2010
The proposed use of an accelerated site characterization process takes advantage of real-time
field screening data and direct comparison to site-specific conceptual site models (CSMs). The
process requires open communication channels between field teams and stakeholders to focus
sampling efforts on areas that indicate contaminant presence. As the site characterization is
refined, locations of dissolved/vapor-phase contamination will direct additional sampling toward
areas of higher contaminant concentrations and source locations.
The process relies on active data management and iterative review of field observations. The
“triad” approach involves daily reports from the field, stakeholder review and analysis, and
follow-up directions to the field crew. Candidate field sampling locations are identified in
advance, but actual sample locations are selected when additional data becomes available.
The field screening analyses provide information to delineate the extent of contaminant influence
and soil/groundwater sampling identifies the source of the contamination. The presence of free-
phase product or the highest detected contamination levels allow delineation of the source area.
Using several screening techniques will evaluate their usefulness while defining the location and
bounds of product surrounding the release point(s).
Results of confirmation sample analyses determine the horizontal and vertical extent of
contamination. A sample from the presumed midpoint of the contaminant mass provides
information about the nature of the contamination. Outlying sample locations at the contaminant
horizon (at or near the target screening level) and nearby uncontaminated locations provide the
extent of contamination.
Analytical data support the planning of remedial activities. Sivuniq intends to collect
information about the contaminants of potential concern (COPCs) as well as physical data that
support the evaluation of remedial alternatives. The specific analyses are detailed in subsequent
site-specific discussions.
In addition to site characterization, the project includes data evaluation through direct
comparison with U.S. Environmental Protection Agency (EPA) Region 9 Preliminary
Remediation Goals (PRGs) and EPA’s Regional Screening Levels (RSLs) as well as Guam EPA
Environmental Screening Levels. These screening levels, required by the USAKA
Final 2010 Site Investigation Work Plan Sivuniq, Inc.
Kwajalein Atoll/Reagan Test Site 1-7 October 2010
Environmental Standards (UES), allow efficient evaluation of threats to human health and the
environment. The CSM, validated by the field data, becomes the basis for completing a human-
health risk assessment for identified chemicals of potential concern (COPCs). The SI allows the
evaluation of remedial alternatives and recommendations for future action.
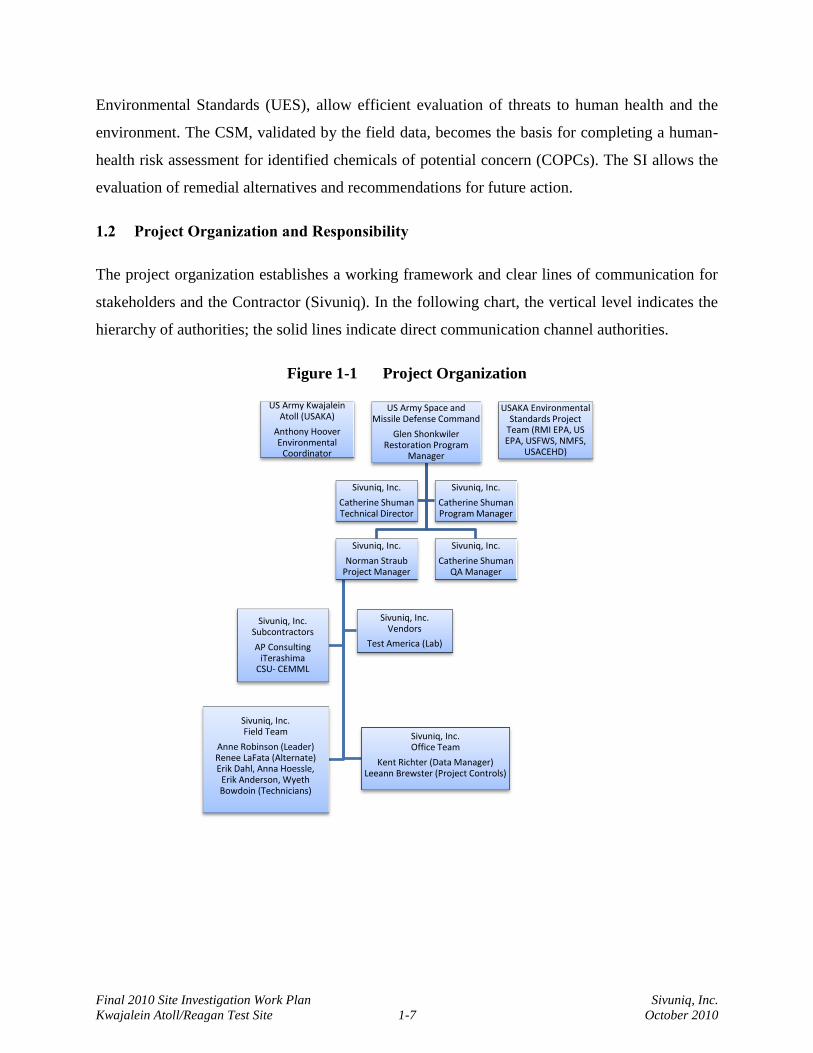
1.2 Project Organization and Responsibility
The project organization establishes a working framework and clear lines of communication for
stakeholders and the Contractor (Sivuniq). In the following chart, the vertical level indicates the
hierarchy of authorities; the solid lines indicate direct communication channel authorities.
Figure 1-1 Project Organization
US Army Kwajalein Atoll (USAKA)
Anthony Hoover Environmental
Coordinator
US Army Space and Missile Defense Command
Glen Shonkwiler Restoration Program
Manager
Sivuniq, Inc.
Norman Straub Project Manager
Sivuniq, Inc. Vendors
Test America (Lab)
Sivuniq, Inc. Office Team
Kent Richter (Data Manager) Leeann Brewster (Project Controls)
Sivuniq, Inc. Field Team
Anne Robinson (Leader) Renee LaFata (Alternate) Erik Dahl, Anna Hoessle,
Erik Anderson, Wyeth Bowdoin (Technicians)
Sivuniq, Inc. Subcontractors
AP Consulting iTerashima
CSU- CEMML
Sivuniq, Inc.
Catherine Shuman QA Manager
Sivuniq, Inc.
Catherine Shuman Technical Director
Sivuniq, Inc.
Catherine Shuman Program Manager
USAKA Environmental Standards Project
Team (RMI EPA, US EPA, USFWS, NMFS,
USACEHD)
Final 2010 Site Investigation Work Plan Sivuniq, Inc.
Kwajalein Atoll/Reagan Test Site 1-8 October 2010
1.2.1 Roles
The hierarchy of authorities dictates project roles to a large extent. The top level of authorities—
USAKA, SMDC, and the USAKA UES project team members—provide oversight and review
authority for the work being performed. Subordinate levels (i.e., contractors) obtain approvals
and concurrence for work aspects described in this Work Plan.
Sivuniq internally controls Team Leaders with prescriptive work authorizations and standard
operating procedures. Subcontractors and vendors perform in accordance with binding contract
agreements and purchase orders, respectively.
1.2.2 Responsibilities
This Work Plan presents assigned responsibilities limited to Sivuniq personnel.
The Sivuniq Technical Director provides performance review and technical oversight of the
project activities with respect to the regulatory and professional requirements (including quality
assurance). The Sivuniq Program Manager provides review and oversight related to contractual
obligations and requirements.
The Project Manager is the central manager in charge of work performance. In addition to the
conventional project constraints (scope, schedule, and budget), the Project Manager obtains and
assigns human, material, and equipment resources within the project and coordinates the
completion of all deliverables. The Project Manager is responsible for continuous project
monitoring and periodic performance reporting to higher authorities.
The Field and Office Team Leaders oversee Sivuniq staff in respective work locations. The
Project Manager assigns these individuals to fulfill specific requirements as dictated by the
approved Work Plan. These individuals coordinate staff efforts in fieldwork and deliverables
preparation, but have additional responsibilities that include health and safety oversight and
quality assurance duties. The Team Leaders act as Project Manager by proxy during emergencies
and times of staff resource limitations. Team Leaders have subcontractor and vendor
management authority only as prescribed in writing by the Program or Project Manager.
Final 2010 Site Investigation Work Plan Sivuniq, Inc.
Kwajalein Atoll/Reagan Test Site 1-9 October 2010
1.3 Regulatory Criteria
The USAKA Environmental Standards (USAKA, 2009) provide a regulatory framework for
restoration activities in this Work Plan. Section 3-6.5.8 of the UES classifies this effort as a
Phase III activity (SI).
Developing sufficient information to effectively evaluate alternatives and concerns necessary for
selecting a remedy is the basic goal of the SI. To this end, a well-developed strategy of planning,
reviews, and approvals ensure project success.
The USAKA Project Team, which provides oversight to environmental efforts at USAKA
include:
Republic of the Marshall Islands Environmental Protection Authority (RMIEPA)
U.S. EPA Region 9, Pacific Islands Office
U.S. Fish and Wildlife Service (USFWS), Pacific Islands Fish and Wildlife Office
U.S. National Marine Fisheries Service (NMFS), Pacific Islands Area Office
U.S. Army Corps of Engineers (USACE), Honolulu District
The SI Work Plan elements detailed in later sections of this document include development of
CSMs for each site, screening, sampling, and analysis strategies, safety considerations, operating
procedures, and data validation approaches.
The Work Plan also includes a data evaluation consisting of a review and comparison of
chemical data against published screening criteria (USEPA PRGs/RSLs, National Ocean and
Atmospheric Administration [NOAA] Screening Quick Reference Tables [SquiRT], and Guam
EPA Environmental Screening Levels) to identify chemicals of potential concern. When
required, a risk assessment is used to specify “at-risk” receptors and appropriate cleanup levels.
The conclusion of the SI phase is the development of a decision document.
If remedial action is required, a feasibility study, remedial design, and remediation plan precede
the actual cleanup of contamination. These phases of work are not included in this task
assignment, but Sivuniq intends to collect sufficient information to support such efforts.
Final 2010 Site Investigation Work Plan Sivuniq, Inc.
Kwajalein Atoll/Reagan Test Site 1-10 October 2010
Removal Actions are possible in this task assignment (specifically free product recovery at Roi-
Namur or Kwajalein POL Yards and possible source remediation and/or well-head treatment at
the Roi-Namur solvent contaminated drinking water well #8151). For these possible removal
actions, a Removal Action Memorandum is under development as a separate document. For all
investigative and remediation efforts, confirmation sampling is needed to verify conditions and
ensure effectiveness.
1.4 Project Schedule
After obtaining all required approvals and authorizations, Sivuniq intends to execute this
proposed Work Plan in a timely fashion. Pending approvals, the fieldwork will commence
during the October 2010 and conclude within five months. Data collection, validation, and
review will lead to report publication shortly thereafter, with final document preparation during
2011.
Final 2010 Site Investigation Work Plan Sivuniq, Inc.
Kwajalein Atoll/Reagan Test Site 2-1 October 2010
2.0 SITE BACKGROUND AND PHYSICAL SETTING
2.1 Site Location and Description
The Kwajalein Atoll is located in the “Ralik” (sunset or western) chain of the Marshall Islands in
the West Central Pacific Ocean. It is 2,100 nautical miles southwest of Honolulu and
approximately 4,200 nautical miles southwest of San Francisco (just west of the international
dateline). Less than 700 miles north of the equator, Kwajalein is in the latitude of Panama and
the southern Philippines. It is in the longitude of New Zealand, 2,300 miles south, and the
Kamchatka Peninsula of the former Soviet Union, 2,600 miles north. The atoll’s remoteness
from centers of population and its proximity to the sea has a major bearing on the operation and
maintenance of USAKA/RTS.
The U.S. Army utilizes eleven of the over 100 islands in the atoll, with active facilities on all or
part of the following islands: Kwajalein (748 acres); Meck (55 acres); Roi-Namur (398 acres);
Carlos (71 acres from the middle portion of the island); Gagan (6 acres); Gellinam (5 acres);
Illegini (31 acres); Legan (18 acres); Eniwetak (15 acres); Ennugarret (6 acres); and Omelek (8
acres). Kwajalein and Roi-Namur were sites of extensive battles during World War II; thus,
investigation and remediation activities can be further complicated by unexploded ordnance
(UXO) and cultural/historical resource discoveries including human remains.
In 1947, the United Nations (U.N.) designated the Marshall Islands a U.N. Trust Territory. In
1986, the United States and the Marshall Islands signed a Compact of Free Association
(Compact) that granted the RMI sovereignty. The Compact contained provisions that the RMI
receive economic aid and U.S. military defense in exchange for the U.S. military’s use of the
missile testing range at Kwajalein Atoll. The United Nations officially ended the Trusteeship in
1990. A new Compact was agreed to in 2003 by the U.S. and RMI that extended the right to use
the Kwajalein military base in exchange for economic aid.
Final 2010 Site Investigation Work Plan Sivuniq, Inc.
Kwajalein Atoll/Reagan Test Site 2-2 October 2010
2.2 Physical and Environmental Setting
2.2.1 Environmental Setting
Kwajalein Atoll is a coral reef formation in the shape of a crescent loop enclosing a lagoon.
Situated on the reef are approximately 100 small islands with a total land area of only 5.6 square
miles (3,854 acres). The largest islands are Kwajalein (1.2 square miles), Roi-Namur, and
Ebadon at the extremities of the atoll; together they account for nearly half the total land area.
While the “typical” size of the remaining islands may be about 150 yards by 700 yards, the
smallest islands are no more than sand cays that merely break the water's surface at high tide.
The Kwajalein Atoll Lagoon enclosed by the reef is the world’s largest, having a surface area of
1,100 square miles, and a depth that is generally between 20 to 30 fathoms (120 to 180 feet).
However, there are numerous coral heads approaching or breaking the lagoon surface. The
atoll’s longest dimension is 75 miles from Kwajalein to Ebadon, and its average width is
approximately 15 miles. Kwajalein, at the atoll’s southern tip, and Roi-Namur, at its northern
extremity, are the principal islands at USAKA/RTS and are 50 miles apart; the other islands used
by USAKA/RTS are situated between these two, on both sides of the lagoon.
Coral atolls are believed to be seamounts that have been capped by calcareous marine growth
constructed by lime-secreting organisms (coral polyps and algae). Presumably, the lower parts
of the atolls are composed of noncalcareous rocks, most often volcanic materials. The coral
superstructures may be hundreds or even thousands of feet in thickness. Emergent portions of the
reef and islands are composed of loose, poorly consolidated calcareous materials derived from
foraminifera, coral, shells, and marine algae, or their debris resulting from destructive action of
the elements.
One notable characteristic of the atolls is the steep slopes of the mountain seaward of the reef.
Around Kwajalein Atoll, the depth plunges to as much as 1,000 fathoms (6,000 feet) within 2
miles of the atoll, and 2,200 fathoms within 10 miles. The Kwajalein Atoll reef lies at intertidal
level, mostly exposed at low tide and submerged at high tide. There are about 25 passages from
the open ocean into the lagoon, through or over the reef, which will allow access to small boats.
Oceangoing ships ordinarily use Gea Pass, located 10 miles north-northwest of Kwajalein.
Final 2010 Site Investigation Work Plan Sivuniq, Inc.
Kwajalein Atoll/Reagan Test Site 2-3 October 2010
All of the islands that comprise the atoll are relatively flat with few natural points exceeding 15
feet above mean sea level. The average elevation of Kwajalein is 5.9 feet. The highest point is
Mount Olympus, otherwise known as the “original missile launch hill.” This man-made hill is
approximately 58 feet high. As a result of the coral base and the lack of elevation of the islands,
there is a very shallow water table. This condition presents a major problem for underground
construction and allows spilled contaminants to easily reach the water table.
2.2.2 Climate
Kwajalein’s tropical marine climate exhibits little variation through the year. The atoll
experiences a relatively dry windy season from mid-December to mid-May, and a relatively wet
calm season from mid-May to mid-December. Normal annual rainfall is approximately 100
inches; approximately 72 percent of the annual rainfall occurs during the wet season and 28
percent occurs during the dry season. On average, the prevailing wind direction is from the east-
northeast during the entire year, although winds may become more variable during the wet
season when occasional southerly or even westerly winds occur. The average wind speed is
approximately 17 miles per hour (mph) from December to April, and 12 mph from May to
November.
The average daily maximum temperature is 86.5 degrees Fahrenheit (º F); the average minimum
temperature is 77.6º F. The extreme temperatures recorded at the atoll are 97º F and 68º F.
Average relative humidity ranges from 83 percent at local noon to 78 percent at midnight.
Most of the rainfall at Kwajalein comes from rain showers; thunderstorm occurrences are
infrequent. On average, thunderstorms occur fewer than 12 days each year. The frequency of
thunderstorms ranges from 0.1 per month from January to March to 2 per month in September.
During the modern era of recordkeeping, since 1919, a fully developed typhoon has never struck
Kwajalein Atoll; however, tropical storms with sustained winds from 40 to 74 miles per hour
(mph) impact the atoll about once every 4 to 7 years on average. Rainfall varies significantly
across the atoll with Roi-Namur receiving roughly on 60 to 70 percent of the Kwajalein Island
average of 100 inches per year.
Final 2010 Site Investigation Work Plan Sivuniq, Inc.
Kwajalein Atoll/Reagan Test Site 2-4 October 2010
2.2.3 Regional Geology
The detailed geology of Kwajalein Atoll is not nearly as well established as for Bikini and
Enewetak Atolls and is primarily based on shallow boring logs prepared by the USACE and
drilling logs prepared during the construction of monitoring wells. However, from the limited
geologic data available as well as from inferences, which can be made from various hydrologic
data, it appears as though many of the features observed on Bikini and Enewetak are also
common to Kwajalein. In particular, the uppermost unconformity observed on Bikini and
Enewetak at depths of 26 to 40 feet below sea level also appears to exist on Kwajalein, and
exhibits many of the same general hydrogeologic characteristics. The characteristics are
typically marked by the occurrence of a hard coral ledge and perhaps conglomerate horizons,
above which the aquifers are characterized by moderate permeabilities and generally fresh
groundwater, and below which the aquifers appear to have higher permeability and contain more
saline groundwater. The salinity differences have been confirmed by field data; however, the
permeability differences are only inferred (Global, 1980).
2.2.4 Soil Characteristics
Soils on Kwajalein Atoll mainly consist of unconsolidated, reef-derived calcium carbonate sand
and gravel with minor consolidated layers of coral, sandstone, and conglomerate. A study was
conducted on Kwajalein and Roi-Namur Islands to determine background concentrations of
metals and other inorganic constituents in soils. Composite samples were collected and analyzed
for total metals. The mean and maximum expected normal concentrations of each analyte are
presented in the 1991-1992 U.S. Army Environmental Hygiene Agency (USAEHA) Soil and
Contamination Study (USAEHA, 1991).
2.2.5 Hydrogeology
The thick accumulation of limestone layers, unconformities caused by sea level changes over
time, and tidal activity play an important role in the fresh groundwater dynamics. Groundwater
is very shallow throughout the atoll. A thin freshwater lens lies atop the brackish groundwater
on the largest islands, including Kwajalein and Roi-Namur.
Final 2010 Site Investigation Work Plan Sivuniq, Inc.
Kwajalein Atoll/Reagan Test Site 2-5 October 2010
The groundwater gradients radiate out from groundwater mounds near the center of the atoll
islands. Roi-Namur was once several islands, and fill material connected the two largest islands,
Roi and Namur. On the western side of Roi-Namur, the freshwater groundwater mound is
estimated to be in the eastern central portion of the island near the isthmus of fill (between the
former islands of Roi and Namur) and has a maximum thickness of 15 to 20 feet, as identified
during a 1990-1991 U.S. Geological Survey (USGS) investigation.
The water supply for both Kwajalein and Roi-Namur is from a combination of rainfall catchment
from airfield areas and from wells in the freshwater lens system. The lens wells are reportedly
constructed as lateral infiltration galleries placed several feet below the water table. Because the
soils are highly permeable, little of the rainfall is lost to runoff, and what water is not lost to
evapotranspiration recharges the groundwater (USAEHA, 1991). The shallow depth to
groundwater and the high permeability of the soils make the groundwater systems of the
Kwajalein Atoll islands highly vulnerable to contamination by chemicals (USAEHA, 1991).
2.3 Installation History and Mission
The U.S. Army control of Kwajalein Atoll was established in 1964 after being transferred from
the U.S. Navy. The Navy operated the facility from 1944 to 1964 after the U.S. liberation of the
atoll from the Japanese during WWII. The USAKA/Kwajalein Missile Range (KMR) was
renamed to U.S. Army Kwajalein Atoll/Ronald Reagan Ballistic Missile Defense Test Site at
Kwajalein Atoll (USAKA/RTS) on June 15, 2001.
The naming designations of the installation at Kwajalein Island throughout recent history are as
follows:
U.S. Army Kwajalein Atoll (USAKA) from November 14, 1986, through September 30,
1997.
Kwajalein Missile Range from April 15, 1968, through November 13, 1986.
Kwajalein Test Site from July 1, 1964, through April 14, 1968.
Final 2010 Site Investigation Work Plan Sivuniq, Inc.
Kwajalein Atoll/Reagan Test Site 2-6 October 2010
Navy Operating Base Kwajalein, Naval Air Station Kwajalein, Naval Station Kwajalein,
and Pacific Missile Range Facility (PMRF) Kwajalein at various times between 1945 and
1964.
The USAKA/RTS is a subordinate activity of the SMDC/ARSTRAT, headquartered in
Huntsville, Alabama. Command of the site, with regard to its range mission as an element of the
Department of Defense’s (DoD) Major Range and Test Facility Base (DoD Directive 3200.11),
is exercised under funding guidance from the U.S. Army Test and Evaluation Office (TEO).
The installation supports the RTS in support of theater missile defense, ballistic missile defense,
and intercontinental ballistic missile (ICBM) testing. Kwajalein also has a missile and space
objects tracking mission utilizing an array of powerful radar dishes located on Roi-Namur. In
addition, Kwajalein supports other Department of Defense (DoD) training activities as well as
commercial space launch operations.
Final 2010 Site Investigation Work Plan Sivuniq, Inc.
Kwajalein Atoll/Reagan Test Site 3-1 October 2010
3.0 SCOPE OF WORK
This Work Plan addresses the scope of activities for the 2010 SIs. The objectives include:
definition of the extent of contamination and assessment of the human health and environmental
risks at each site location. The 2010 SI scope satisfies the UES requirements for environmental
investigation of USAKA sites.
The planned technical approach adopted for each site intends to meet the objectives developed
for each site. The evaluation of existing information and the drafting of Conceptual Site Models
(CSMs) for each site identify additional data needs to meet project objectives. Use of the
accelerated site characterization process allows recurring evaluation of the CSM and the use of
output information from previous steps as inputs for a subsequent step. Figure 1-1 identifies site-
specific objectives for the 2010 project sites.
By combining preliminary assessment (PA) and SI activities (e.g., background research,
information gathering and file review, field reconnaissance, field sampling, and reporting
requirements), the site assessment process is streamlined, reducing tasks to one continuous SI.
These investigations are intended to:
Eliminate from consideration those sites that pose no threat to public health or the
environment;
Determine the potential need for a removal or remedial action;
Set priorities for future investigations; and
Gather existing or additional data to facilitate later components of the site
assessment/restoration process.
3.1 Background Research
In October 2009, Sivuniq Project Managers performed site reconnaissance to identify and
observe site conditions and begin assessment planning. Sivuniq performed historical research
while on site and during Work Plan development. In general, the historical records are
contemporary, as information has been obtained from the U.S. Army from as early as 1979.
Sivuniq intends to augment this information with other historical research for the Army through
Final 2010 Site Investigation Work Plan Sivuniq, Inc.
Kwajalein Atoll/Reagan Test Site 3-2 October 2010
1964, and the U.S. Navy from 1944 until 1964. Repositories include the National Archives and
the Naval Station in Pearl Harbor, Hawaii. While on site, interviews will be conducted with
knowledgeable persons regarding any activities that may have contributed to impacts to the
islands.
At the site locations, proposed field activities include visual assessment, pipeline and feature
location surveys, vapor/soil/groundwater screening for contaminant indicators, field sampling
and analysis, and confirmation sampling for fixed-base laboratory analysis.
3.2 Field Activities
Visual assessments by the Field Team Leader prior to field sampling will identify surface
features or indications of contamination, sources, or other conditions that may affect the
effectiveness of the proposed approach. Notable site features will be included in the data
collection program, as appropriate, to provide a comprehensive site investigation and support
future remedial decision-making.
Some site information identified previous structures that may be sources of contamination. The
initial site activities shall include establishment of survey controls to locate these structures
(building footprints, pipelines, etc.) at the site. Control stations will be located with conventional
surveying equipment (i.e., theodolite transit and rod) using existing buildings and survey
monuments as reference controls. All sample locations shall be surveyed to provide accurate
spatial referencing.
Field activities include two phases of sampling – screening and confirmation. The sampling
objectives delineate the locations and extents of vapor and dissolved contaminant plumes, source
areas, and release points. Screening activities provide data to the field teams to identify
contaminant and source locations and direct field efforts. Indirect screening methods, such as
soil-gas surveys and headspace vapor analysis, indicate secondary impacts from contaminants in
soil and groundwater. Direct screening measurements use infrared absorbance, ultraviolet
fluorescence (UVF), turbidimetric, and immunoassay methods to quantify contaminants
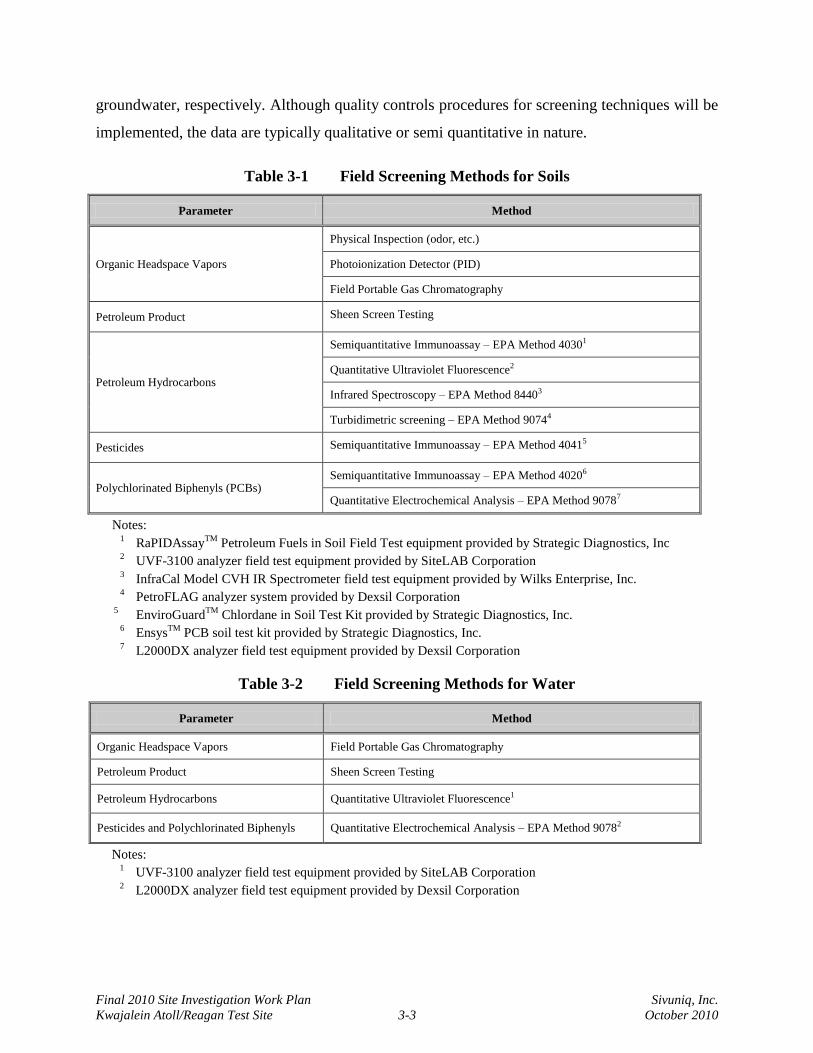
contained within the medium. Table 3-1and 3-2 summarize screening techniques for soil and
Final 2010 Site Investigation Work Plan Sivuniq, Inc.
Kwajalein Atoll/Reagan Test Site 3-3 October 2010
groundwater, respectively. Although quality controls procedures for screening techniques will be
implemented, the data are typically qualitative or semi quantitative in nature.
Table 3-1 Field Screening Methods for Soils
Parameter Method
Organic Headspace Vapors
Physical Inspection (odor, etc.)
Photoionization Detector (PID)
Field Portable Gas Chromatography
Petroleum Product Sheen Screen Testing
Petroleum Hydrocarbons
Semiquantitative Immunoassay – EPA Method 40301
Quantitative Ultraviolet Fluorescence2
Infrared Spectroscopy – EPA Method 84403
Turbidimetric screening – EPA Method 90744
Pesticides Semiquantitative Immunoassay – EPA Method 40415
Polychlorinated Biphenyls (PCBs) Semiquantitative Immunoassay – EPA Method 40206
Quantitative Electrochemical Analysis – EPA Method 90787
Notes: 1 RaPIDAssay
TM Petroleum Fuels in Soil Field Test equipment provided by Strategic Diagnostics, Inc
2 UVF-3100 analyzer field test equipment provided by SiteLAB Corporation
3 InfraCal Model CVH IR Spectrometer field test equipment provided by Wilks Enterprise, Inc.
4 PetroFLAG analyzer system provided by Dexsil Corporation
5 EnviroGuard
TM Chlordane in Soil Test Kit provided by Strategic Diagnostics, Inc.
6 Ensys
TM PCB soil test kit provided by Strategic Diagnostics, Inc.
7 L2000DX analyzer field test equipment provided by Dexsil Corporation
Table 3-2 Field Screening Methods for Water
Parameter Method
Organic Headspace Vapors Field Portable Gas Chromatography
Petroleum Product Sheen Screen Testing
Petroleum Hydrocarbons Quantitative Ultraviolet Fluorescence1
Pesticides and Polychlorinated Biphenyls Quantitative Electrochemical Analysis – EPA Method 90782
Notes: 1 UVF-3100 analyzer field test equipment provided by SiteLAB Corporation
2 L2000DX analyzer field test equipment provided by Dexsil Corporation
Final 2010 Site Investigation Work Plan Sivuniq, Inc.
Kwajalein Atoll/Reagan Test Site 3-4 October 2010
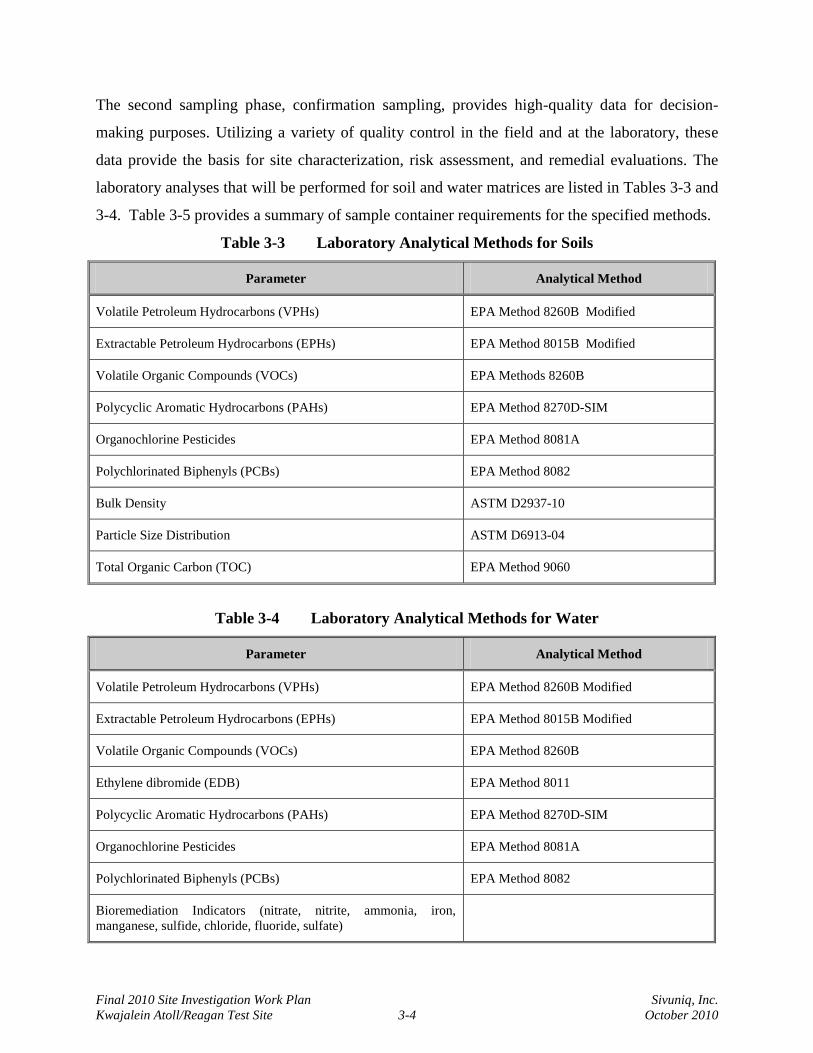
The second sampling phase, confirmation sampling, provides high-quality data for decision-
making purposes. Utilizing a variety of quality control in the field and at the laboratory, these
data provide the basis for site characterization, risk assessment, and remedial evaluations. The
laboratory analyses that will be performed for soil and water matrices are listed in Tables 3-3 and
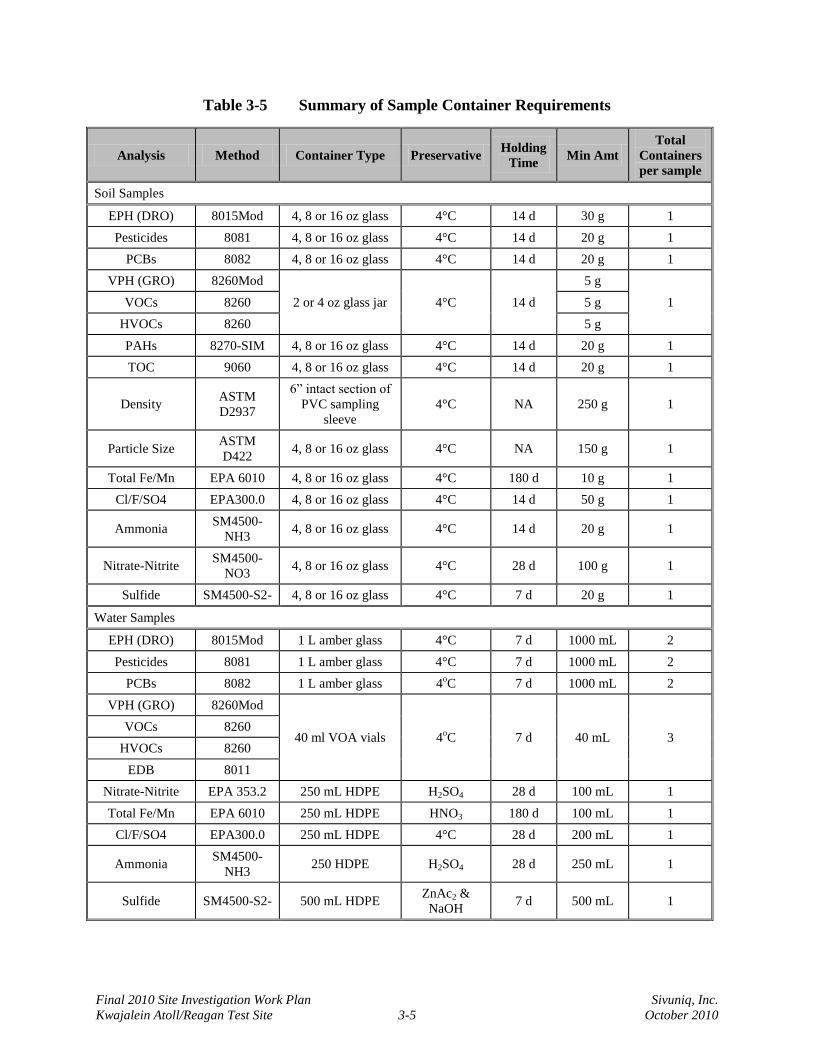
3-4. Table 3-5 provides a summary of sample container requirements for the specified methods.
Table 3-3 Laboratory Analytical Methods for Soils
Parameter Analytical Method
Volatile Petroleum Hydrocarbons (VPHs) EPA Method 8260B Modified
Extractable Petroleum Hydrocarbons (EPHs) EPA Method 8015B Modified
Volatile Organic Compounds (VOCs) EPA Methods 8260B
Polycyclic Aromatic Hydrocarbons (PAHs) EPA Method 8270D-SIM
Organochlorine Pesticides EPA Method 8081A
Polychlorinated Biphenyls (PCBs) EPA Method 8082
Bulk Density ASTM D2937-10
Particle Size Distribution ASTM D6913-04
Total Organic Carbon (TOC) EPA Method 9060
Table 3-4 Laboratory Analytical Methods for Water
Parameter Analytical Method
Volatile Petroleum Hydrocarbons (VPHs) EPA Method 8260B Modified
Extractable Petroleum Hydrocarbons (EPHs) EPA Method 8015B Modified
Volatile Organic Compounds (VOCs) EPA Method 8260B
Ethylene dibromide (EDB) EPA Method 8011
Polycyclic Aromatic Hydrocarbons (PAHs) EPA Method 8270D-SIM
Organochlorine Pesticides EPA Method 8081A
Polychlorinated Biphenyls (PCBs) EPA Method 8082
Bioremediation Indicators (nitrate, nitrite, ammonia, iron,
manganese, sulfide, chloride, fluoride, sulfate)
Final 2010 Site Investigation Work Plan Sivuniq, Inc.
Kwajalein Atoll/Reagan Test Site 3-5 October 2010
Table 3-5 Summary of Sample Container Requirements
Analysis Method Container Type Preservative Holding
Time Min Amt
Total
Containers
per sample
Soil Samples
EPH (DRO) 8015Mod 4, 8 or 16 oz glass 4°C 14 d 30 g 1
Pesticides 8081 4, 8 or 16 oz glass 4°C 14 d 20 g 1
PCBs 8082 4, 8 or 16 oz glass 4°C 14 d 20 g 1
VPH (GRO) 8260Mod
2 or 4 oz glass jar 4°C 14 d
5 g
1 VOCs 8260 5 g
HVOCs 8260 5 g
PAHs 8270-SIM 4, 8 or 16 oz glass 4°C 14 d 20 g 1
TOC 9060 4, 8 or 16 oz glass 4°C 14 d 20 g 1
Density ASTM
D2937
6” intact section of
PVC sampling
sleeve
4°C NA 250 g 1
Particle Size ASTM
D422 4, 8 or 16 oz glass 4°C NA 150 g 1
Total Fe/Mn EPA 6010 4, 8 or 16 oz glass 4°C 180 d 10 g 1
Cl/F/SO4 EPA300.0 4, 8 or 16 oz glass 4°C 14 d 50 g 1
Ammonia SM4500-
NH3 4, 8 or 16 oz glass 4°C 14 d 20 g 1
Nitrate-Nitrite SM4500-
NO3 4, 8 or 16 oz glass 4°C 28 d 100 g 1
Sulfide SM4500-S2- 4, 8 or 16 oz glass 4°C 7 d 20 g 1
Water Samples
EPH (DRO) 8015Mod 1 L amber glass 4°C 7 d 1000 mL 2
Pesticides 8081 1 L amber glass 4°C 7 d 1000 mL 2
PCBs 8082 1 L amber glass 4oC 7 d 1000 mL 2
VPH (GRO) 8260Mod
40 ml VOA vials 4oC 7 d 40 mL 3
VOCs 8260
HVOCs 8260
EDB 8011
Nitrate-Nitrite EPA 353.2 250 mL HDPE H2SO4 28 d 100 mL 1
Total Fe/Mn EPA 6010 250 mL HDPE HNO3 180 d 100 mL 1
Cl/F/SO4 EPA300.0 250 mL HDPE 4°C 28 d 200 mL 1
Ammonia SM4500-
NH3 250 HDPE H2SO4 28 d 250 mL 1
Sulfide SM4500-S2- 500 mL HDPE ZnAc2 &
NaOH 7 d 500 mL 1
Final 2010 Site Investigation Work Plan Sivuniq, Inc.
Kwajalein Atoll/Reagan Test Site 3-6 October 2010
Sample collection methods vary according to the media under investigation. Soil-gas sampling
relies on soil probes equipped with porous sampling ports advanced to discreet depths by manual
and direct-push methods. Soil sampling methods include the use of direct-push equipment, hand
augers, and shovels. Field crews use manual and direct-push equipment to install groundwater
sample points (screened drive points or pre-packed well points).
All sampling activities focus efforts inside areas of presumed release or impact. Many of these
locations, previously identified during records review and research, closely associate themselves
with structures and features such as buildings, pipelines, and stormwater conveyances. Other
locations include documented spill sites identified by spill reports. The perimeters of the
investigation areas include additional area around the presumed release points to allow
characterization of migrating contamination and previously unidentified release points.
Archeological and safety concerns characterize many of the investigation areas. Strict adherence
to the USAKA dig permitting process ensures that artifacts and critical infrastructure remain
protected and the worksite remains a safe operation. Even though the proper authorities permit
digging and intrusive activities, Sivuniq field personnel must remain vigilant to the possibility of
inadvertent discoveries of artifacts, ordnance, or equipment during fieldwork.
Intrusive activities associated with soil, soil gas, and groundwater sampling shall be monitored
by a qualified archeological specialist implementing the project-specific Archeological
Monitoring Plan (Kwaj-10-52) provided in Annex D. Major elements of the monitoring include
global positioning system (GPS)-positioning for all sample locations, inspection of coring
samples, and descriptive documentation of soil characteristics. The Archeological Monitoring
Plan includes USAKA Archeological Monitoring SOPs for GPS data collection field
documentation and discoveries of human remains, archeological artifacts and features, as well as
munitions and ordnance items.
3.3 Office Activities
During field activities, Sivuniq and stakeholders provide active support to the field crews. The
support ensures satisfaction of logistical, advisory, and performance needs. The Sivuniq Project
Manager monitors and fills requests for personnel, material, and equipment during daily
Final 2010 Site Investigation Work Plan Sivuniq, Inc.
Kwajalein Atoll/Reagan Test Site 3-7 October 2010
communications with the Field Team Leader. Communication enhancements provided by
satellite telephone, Web-based platforms (i.e., SharePoint or FTP sites), and daily
teleconferences ensure that the management team and field crew share information and
coordinate activities.
Open communication within the office environment also provides affirmative guidance to Task
Managers and staff. Appointed Task Managers lead efforts related to data compilation,
evaluation, and validation, risk assessment, and reporting.
An office-based Data Manager organizes and analyzes information from the field to guide field-
screening efforts and achieve sampling objectives. Using Geographic Information System (GIS)
based analysis tools such as Visual Sampling Plan, dynamic data analysis identifies areas of
highest likelihood for contamination. Under the accelerated site characterization process, site
sampling focuses on the identification of the source location and contaminant extent to allow risk
assessment and remedial alternative evaluation.
After completing fieldwork, the Data Manager organizes analytical laboratory data for
evaluation, validation, and presentation. The organized data, compiled for each site, media, and
analysis group, allows easy review for data completeness. Data validation involves a
comprehensive review of the laboratory data to verify conformance with quality controls;
qualifiers flag any deficient data to alert data users of possible quality concerns. Tables organize
all validated data, identifying the detected contaminants, frequency and range of detections, and
statistically representative contaminant levels.
Data reviewers compare the maximum detected soil and groundwater contaminant levels to the
published risk-based screening criteria for each site. The EPA PRGs/RSLs evaluate potential
human-health risk concerns and the NOAA SquiRT values identify potential ecological risk
drivers. Volatile and extractable petroleum hydrocarbons, which are not cited by either
reference, are evaluated against Guam EPA Environmental Screening Levels (Guam EPA,
2008). Table 3-6 provides example screening criteria for some of the potential chemicals of
concern that may be detected during the USAKA site investigations.
Final 2010 Site Investigation Work Plan Sivuniq, Inc.
Kwajalein Atoll/Reagan Test Site 3-8 October 2010
Table 3-6 Example Data Screening Criteria for Chemicals of Potential Concern
Chemical
EPA Regional Screening Levels (RSL) 1 NOAA SQuiRT 2
Soils Groundwater
(mg/L)
Surface Water
(mg/L) Industrial
(mg/Kg)
Groundwater
Protection (mg/Kg)
Petroleum, Oil, and Lubricant (POL) Compounds
Benzene 5.4 0.00021 0.005 2.3
Toluene 45,000 1.6 2.3 0.0098
Benzene 5.4 0.00021 0.005 2.3
Toluene 45,000 1.6 2.3 0.0098
Ethylbenzene 2.7 0.0017 0.007 0.0073
Xylene, Mixture 2700 0.2 0.2 0.013
Xylene, m- 17000 1.2 1.2 0.0018
Xylene, o- 19000 1.2 1.2 0.35
Xylene, p- 17000 1.2 1.2 N/A
Benzo(a)pyrene 0.21 0.0035 0.0000029 0.000014
Volatile Petroleum Hydrocarbons (Guam ESLs)3 100 100 0.100 -
Extractable Petroleum Hydrocarbons (Guam ESLs)3 100 100 0.100 -
Volatile Organic Compounds
Tetrachloroethene 2.6 0.000049 0.005 0.098
Trichloroethene 14 0.00072 0.005 0.021
1,1-Dichloroethane 170 0.00069 0.0024 0.047
1,2-Dichloroethane 2.2 0.000042 0.00015 0.1
Vinyl Chloride 1.7 0.0000056 0.002 0.93
Chloroform 1.5 0.000053 0.00019 0.0018
Dibromochloromethane 3.3 0.000039 0.00015 11
Methylene Chloride 53 0.0012 0.0048 N/A
Pesticides
Chlordane 6.5 0.013 0.002 0.00000215
Polychlorinated Biphenyls
Aroclor 1260 0.74 0.024 0.000034 14 4
Notes:
1. Values taken from Environmental Protection Agency’s Regional Screening Level Table for Region 9 (December 2009)
2. Values taken from NOAA Screening Quick Reference Guide (SquiRT) (2008)
3. Values taken from Guam EPA’s Environmental Screening Levels (2008)
4. The value for surface water is for total PCBs.
Final 2010 Site Investigation Work Plan Sivuniq, Inc.
Kwajalein Atoll/Reagan Test Site 3-9 October 2010
For site contaminants that exceed the PRG/RSL/ESLs or SquiRT screening levels, Sivuniq
performs baseline risk assessments to quantify risks. The assessment considers the impacted
media, complete transport and migration routes, and exposure pathways for each receptor group
defined by the CSM. The site background sections, which follow later in this document, present
site-specific CSMs for each site. Stakeholders confirm and refine the CSMs during the
fieldwork phase of the investigation effort to include all appropriate considerations.
The risk assessment conclusions identify specific media and chemicals of concern and any need
for further data gathering or remedial response. The risk assessment also provides chemical-
specific cleanup goals. The preliminary remedial response evaluation identifies candidate
strategies, models feasibility, and outlines rough costs of implementation. The Federal
Remediation Technologies Roundtable Treatment Technologies Screening Matrix acts as the
primary source of strategies under consideration, but other potentially relevant approaches and
technologies will be considered as appropriate (USAEC, 2002).
The SI report deliverable will provide a full summary of the field activities, data evaluation, risk
assessment, and remedial evaluations. Representatives from the SMDC and UES project team
provide oversight and review of the document. The final report addresses stakeholder concerns
presented during the review and comment period.

Final 2010 Site Investigation Work Plan Sivuniq, Inc.
Kwajalein Atoll/Reagan Test Site 3-10 October 2010
[THIS PAGE LEFT INTENTIONALLY BLANK.]
Final 2010 Site Investigation Work Plan Sivuniq, Inc.
Kwajalein Atoll/Reagan Test Site 4-1 October 2010
4.0 SITE DESCRIPTIONS
The scope of the site investigations includes the locations presented on Figures 4-1 and 4-2.
Figure 4-1 Kwajalein Atoll Sites
Final 2010 Site Investigation Work Plan Sivuniq, Inc.
Kwajalein Atoll/Reagan Test Site 4-2 October 2010
Figure 4-2 Kwajalein Island Sites
Final 2010 Site Investigation Work Plan Sivuniq, Inc.
Kwajalein Atoll/Reagan Test Site 4-3 October 2010
4.1 Kwajalein Harbor (Site CCKWAJ-001)
4.1.1 Site History
Kwajalein Harbor, located on the lagoon side of Kwajalein Island, is the primary embarkation
point for barges and ships for all of the islands in the Kwajalein Atoll since the U.S. military
assumed control of the atoll in 1944.
During the last several decades, human activities and industrial processes have contributed to
contaminants entering the harbor. The corrosive environment at Kwajalein requires routine
sandblasting to remove rust from equipment. Previous investigations indicate that sandblasting
activities at the synchrolift dry dock and the former vehicle paint and preparation shop provide
the primary source of contamination (USAEHA, 1991). Marine vessel coatings contain copper,
butyltins, and/or pesticides as antifouling agents, lead as a stabilizer, and polychlorinated
biphenyls (PCBs) as a component of coatings.
Contaminants are also suspected to migrate to the harbor via wind and nonpoint-source runoff.
The harbor sediments are known to contain metals (chromium, lead, copper, zinc, and
dibutyltin), PCBs, and to a limited extent, pesticides (dichlorodiphenyltrichloroethane [DDT]
and chlordane) from point and nonpoint discharges from Kwajalein Island. Additionally, a
2008-2009 human-health risk assessment noted PCBs and pesticides in stormwater discharges
(CHPPM, 2009).
4.1.2 Previous Investigations
In 1991/1992, the USAEHA conducted a soil and groundwater contamination study to evaluate
the potential impacts of contamination on human health and the environment in the harbor area
of the Kwajalein boat ramp. The study indicated that sandblasting wastes on the ground surface
around the boat ramp impacted the surface runoff, and that dark-colored material was clearly
visible in aerial photographs (USAEHA, 1991).
Sandblasting and painting was performed at the dry dock equipment facility (former Building
614). The building was demolished in 1990, but prior to being removed, the sandblasting grit
and paint waste was allowed to remain on the ground around the structure. During the study, it
Final 2010 Site Investigation Work Plan Sivuniq, Inc.
Kwajalein Atoll/Reagan Test Site 4-4 October 2010
was noted that the wastes were no longer evident because of construction activities, and the
waste grit was reportedly placed into a pile at the west end of the Kwajalein landfill (USAEHA,
1991).
Clean fill was placed over the area where the dry dock was formerly located, thus no soil
samples were collected during the study. The USAEHA did, however, collect two composite
soil samples from each side of the boat ramp, and one composite sample of the sandblast grit.
Soil sample analyses included total metals, and the sandblast waste grit underwent toxicity
characteristic leaching procedure (TCLP) and analysis for Resource Conservation and Recovery
Act (RCRA) metals.
The study results showed that concentrations of copper, chromium, barium, arsenic, and lead in
the soil and waste grit samples exceeded background concentrations. The sandblast grit
contained the same metals, but was less than the toxic characteristic thresholds that would
classify the material as a regulated hazardous waste.
Lagoon sediment sampling and analysis by a previous contractor also confirmed elevated levels
of copper, lead, zinc, nickel, chromium, cadmium, and arsenic. Sediment sampling revealed
concentrations up to 360 parts per million (ppm) chromium, 3,080 ppm copper, 543 ppm lead,
and 930 ppm zinc, all exceeding NOAA effects range-low (ERL) screening criteria for sediment
toxicity. The lead concentrations also exceeded the U.S. Food and Drug Administration (FDA)
consumption guidelines (CHPPM, 2001). The ERL criterion is the concentration of a chemical
in sediment below which toxic effects are rarely observed among sensitive species.
The 1991/1992 USAEHA study suggested that the potential for environmental impacts in the
boat ramp area and lagoon related to past sandblasting practices. The amount of metals entering
the lagoon during past activities was probably much greater than what would enter from
presently contaminated soil in the future. The potential for runoff of contaminants from the
remaining contamination at the boat ramp is small if the area is not disturbed by construction
work. Migration of dissolved metals into the lagoon via groundwater is not expected to be
significant in comparison to past and potential future migration via other modes of transport.
Final 2010 Site Investigation Work Plan Sivuniq, Inc.
Kwajalein Atoll/Reagan Test Site 4-5 October 2010
A follow-up clam bioaccumulation study conducted in 1999 from the harbor point-source
discharge area revealed significantly elevated concentrations of copper, lead, zinc, pesticides,
PCBs, and polycyclic aromatic hydrocarbons (PAHs) in clam tissues. A 1990 oyster and fish
tissue metals study also revealed significantly high concentrations of chromium, copper, and lead
exceeding the International Consumption Guidelines (ASI, 1991).
In 1999, the Kwajalein Environmental Standards Release Determination Workgroup concluded
that a release of butyltins and metals, including chromium, copper, lead, and zinc, had occurred
in the Kwajalein Harbor. Best management practices (BMPs) were employed in 2004 that have
reduced the amount of contamination that enters the harbor. These actions included the
replacement of the open air vehicle paint and preparation facility with a newly constructed, fully
enclosed Vehicle Paint and Preparation Facility, Facility 856, and the partial covering of the
shiplift/dry dock area. The dry dock is now enclosed on the top and two sides. Furthermore,
cargo containers are piled up on the lagoon side during blasting operations to further prevent
sand blast grit from entering the harbor. However, in 2008, it was discovered that the power
washing operations (infrequent in occurrence) at the harbor ship lift might still be contributing to
harbor contamination. USAKA is evaluating design solutions to prevent power wash runoff
from entering the harbor (operation has currently been suspended). Due to the known historical
contamination at the harbor, signs were erected in an attempt to prevent fishing at the harbor and
consumption of aquatic species that could be potentially contaminated (KRS, 2008).
The US Army Center for Health Promotion and Preventive Medicine (CHPPM) released a Draft
PA/SI Report for the Kwajalein Harbor release area in July 2009. The PA/SI report
characterized the nature and extent of contamination in the harbor and presented human-health
risk assessment results to assess the potential for unacceptable risk to humans consuming harbor
fish.
The PA/SI study included two concurrent phases. Phase I characterized the nature and extent of
contamination by sampling sediment from the harbor area, and analyzing the samples for the
COPCs, namely metals, butyltins, PAHs, pesticides, and PCBs. The concentrations were
compared to reference levels and sediment screening guidelines for human and ecological health.
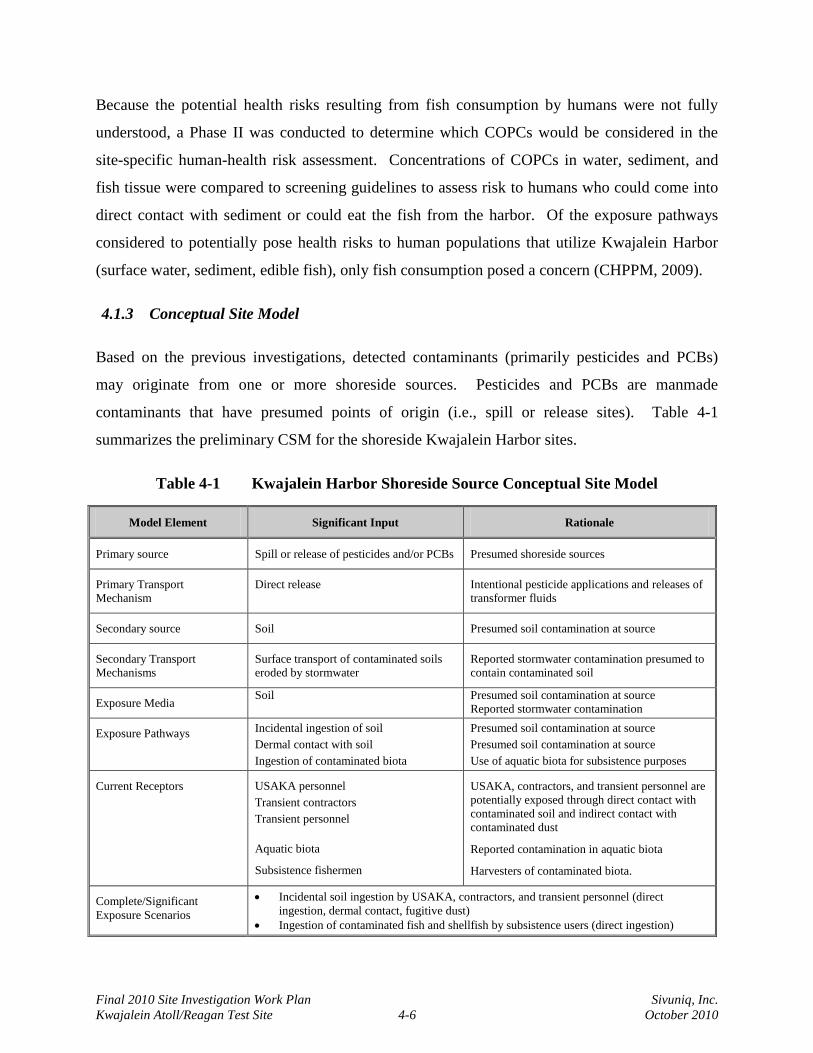
Final 2010 Site Investigation Work Plan Sivuniq, Inc.
Kwajalein Atoll/Reagan Test Site 4-6 October 2010
Because the potential health risks resulting from fish consumption by humans were not fully
understood, a Phase II was conducted to determine which COPCs would be considered in the
site-specific human-health risk assessment. Concentrations of COPCs in water, sediment, and
fish tissue were compared to screening guidelines to assess risk to humans who could come into
direct contact with sediment or could eat the fish from the harbor. Of the exposure pathways
considered to potentially pose health risks to human populations that utilize Kwajalein Harbor
(surface water, sediment, edible fish), only fish consumption posed a concern (CHPPM, 2009).
4.1.3 Conceptual Site Model
Based on the previous investigations, detected contaminants (primarily pesticides and PCBs)
may originate from one or more shoreside sources. Pesticides and PCBs are manmade
contaminants that have presumed points of origin (i.e., spill or release sites). Table 4-1
summarizes the preliminary CSM for the shoreside Kwajalein Harbor sites.
Table 4-1 Kwajalein Harbor Shoreside Source Conceptual Site Model
Model Element Significant Input Rationale
Primary source Spill or release of pesticides and/or PCBs Presumed shoreside sources
Primary Transport
Mechanism
Direct release Intentional pesticide applications and releases of
transformer fluids
Secondary source Soil Presumed soil contamination at source
Secondary Transport
Mechanisms
Surface transport of contaminated soils
eroded by stormwater
Reported stormwater contamination presumed to
contain contaminated soil
Exposure Media Soil Presumed soil contamination at source
Reported stormwater contamination
Exposure Pathways Incidental ingestion of soil
Dermal contact with soil
Ingestion of contaminated biota
Presumed soil contamination at source
Presumed soil contamination at source
Use of aquatic biota for subsistence purposes
Current Receptors USAKA personnel
Transient contractors
Transient personnel
Aquatic biota
Subsistence fishermen
USAKA, contractors, and transient personnel are
potentially exposed through direct contact with
contaminated soil and indirect contact with
contaminated dust
Reported contamination in aquatic biota
Harvesters of contaminated biota.
Complete/Significant
Exposure Scenarios
Incidental soil ingestion by USAKA, contractors, and transient personnel (direct
ingestion, dermal contact, fugitive dust)
Ingestion of contaminated fish and shellfish by subsistence users (direct ingestion)
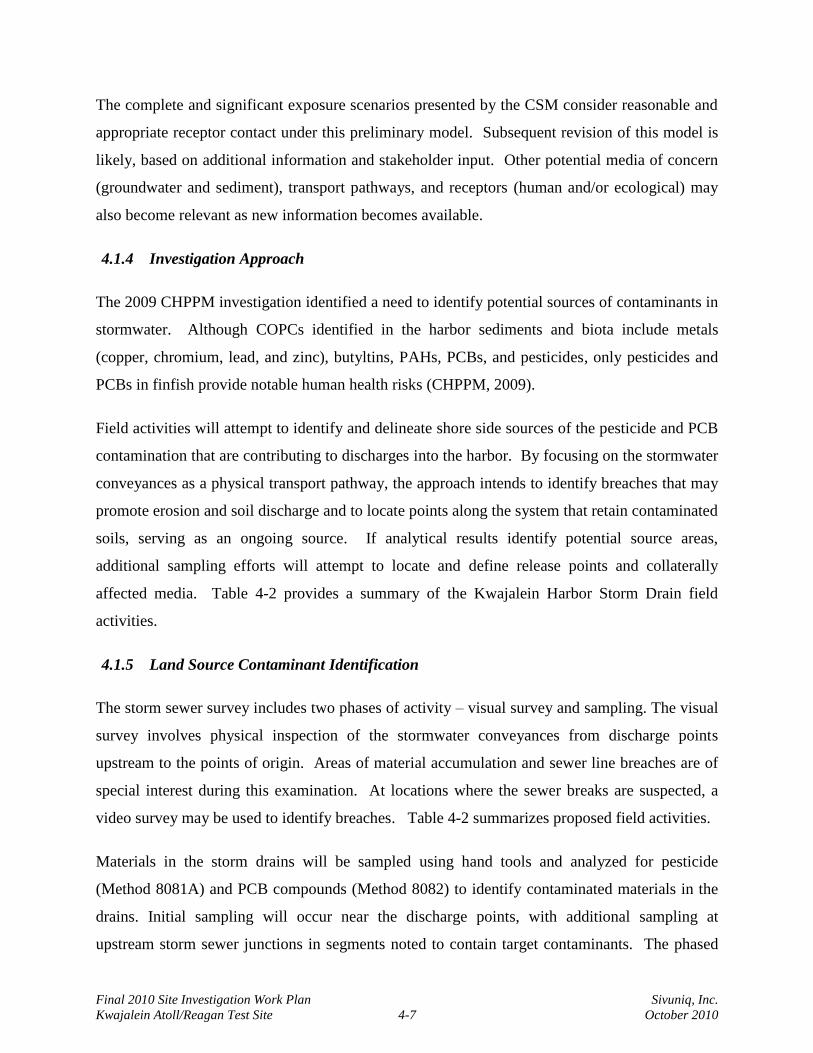
Final 2010 Site Investigation Work Plan Sivuniq, Inc.
Kwajalein Atoll/Reagan Test Site 4-7 October 2010
The complete and significant exposure scenarios presented by the CSM consider reasonable and
appropriate receptor contact under this preliminary model. Subsequent revision of this model is
likely, based on additional information and stakeholder input. Other potential media of concern
(groundwater and sediment), transport pathways, and receptors (human and/or ecological) may
also become relevant as new information becomes available.
4.1.4 Investigation Approach
The 2009 CHPPM investigation identified a need to identify potential sources of contaminants in
stormwater. Although COPCs identified in the harbor sediments and biota include metals
(copper, chromium, lead, and zinc), butyltins, PAHs, PCBs, and pesticides, only pesticides and
PCBs in finfish provide notable human health risks (CHPPM, 2009).
Field activities will attempt to identify and delineate shore side sources of the pesticide and PCB
contamination that are contributing to discharges into the harbor. By focusing on the stormwater
conveyances as a physical transport pathway, the approach intends to identify breaches that may
promote erosion and soil discharge and to locate points along the system that retain contaminated
soils, serving as an ongoing source. If analytical results identify potential source areas,
additional sampling efforts will attempt to locate and define release points and collaterally
affected media. Table 4-2 provides a summary of the Kwajalein Harbor Storm Drain field
activities.
4.1.5 Land Source Contaminant Identification
The storm sewer survey includes two phases of activity – visual survey and sampling. The visual
survey involves physical inspection of the stormwater conveyances from discharge points
upstream to the points of origin. Areas of material accumulation and sewer line breaches are of
special interest during this examination. At locations where the sewer breaks are suspected, a
video survey may be used to identify breaches. Table 4-2 summarizes proposed field activities.
Materials in the storm drains will be sampled using hand tools and analyzed for pesticide
(Method 8081A) and PCB compounds (Method 8082) to identify contaminated materials in the
drains. Initial sampling will occur near the discharge points, with additional sampling at
upstream storm sewer junctions in segments noted to contain target contaminants. The phased
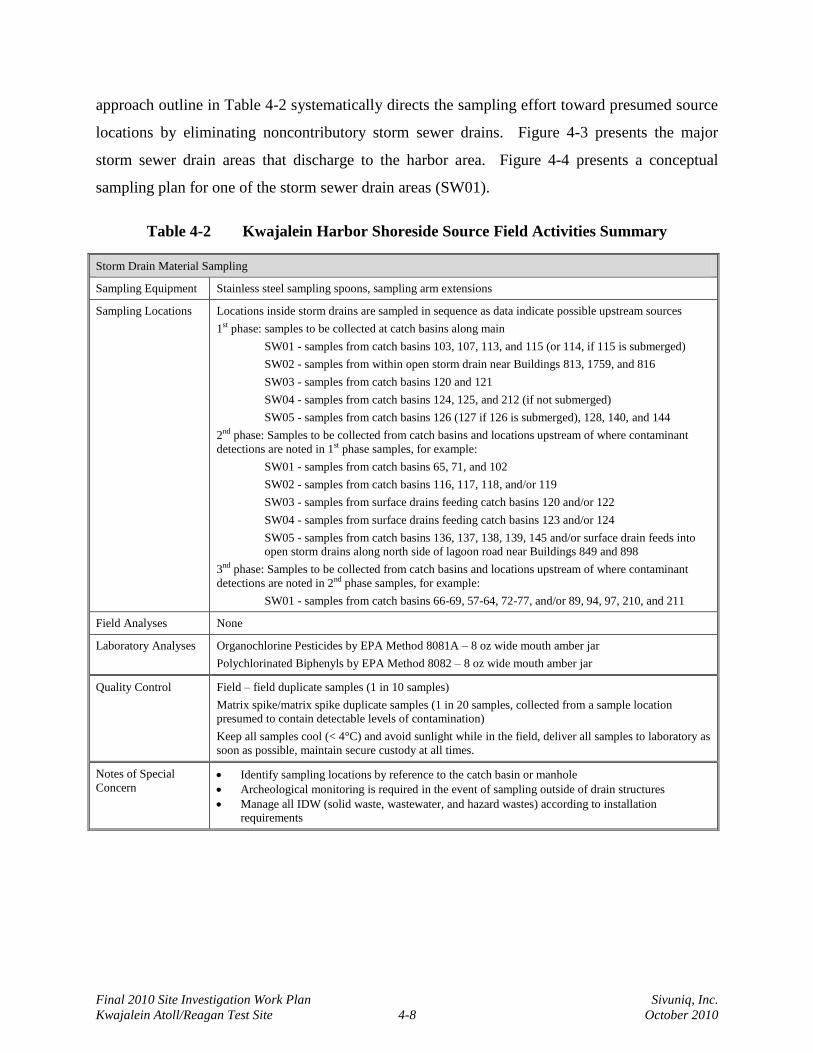
Final 2010 Site Investigation Work Plan Sivuniq, Inc.
Kwajalein Atoll/Reagan Test Site 4-8 October 2010
approach outline in Table 4-2 systematically directs the sampling effort toward presumed source
locations by eliminating noncontributory storm sewer drains. Figure 4-3 presents the major
storm sewer drain areas that discharge to the harbor area. Figure 4-4 presents a conceptual
sampling plan for one of the storm sewer drain areas (SW01).
Table 4-2 Kwajalein Harbor Shoreside Source Field Activities Summary
Storm Drain Material Sampling
Sampling Equipment Stainless steel sampling spoons, sampling arm extensions
Sampling Locations Locations inside storm drains are sampled in sequence as data indicate possible upstream sources
1st phase: samples to be collected at catch basins along main
SW01 - samples from catch basins 103, 107, 113, and 115 (or 114, if 115 is submerged)
SW02 - samples from within open storm drain near Buildings 813, 1759, and 816
SW03 - samples from catch basins 120 and 121
SW04 - samples from catch basins 124, 125, and 212 (if not submerged)
SW05 - samples from catch basins 126 (127 if 126 is submerged), 128, 140, and 144
2nd phase: Samples to be collected from catch basins and locations upstream of where contaminant
detections are noted in 1st phase samples, for example:
SW01 - samples from catch basins 65, 71, and 102
SW02 - samples from catch basins 116, 117, 118, and/or 119
SW03 - samples from surface drains feeding catch basins 120 and/or 122
SW04 - samples from surface drains feeding catch basins 123 and/or 124
SW05 - samples from catch basins 136, 137, 138, 139, 145 and/or surface drain feeds into
open storm drains along north side of lagoon road near Buildings 849 and 898
3nd phase: Samples to be collected from catch basins and locations upstream of where contaminant
detections are noted in 2nd phase samples, for example:
SW01 - samples from catch basins 66-69, 57-64, 72-77, and/or 89, 94, 97, 210, and 211
Field Analyses None
Laboratory Analyses Organochlorine Pesticides by EPA Method 8081A – 8 oz wide mouth amber jar
Polychlorinated Biphenyls by EPA Method 8082 – 8 oz wide mouth amber jar
Quality Control Field – field duplicate samples (1 in 10 samples)
Matrix spike/matrix spike duplicate samples (1 in 20 samples, collected from a sample location
presumed to contain detectable levels of contamination)
Keep all samples cool (< 4°C) and avoid sunlight while in the field, deliver all samples to laboratory as
soon as possible, maintain secure custody at all times.
Notes of Special
Concern Identify sampling locations by reference to the catch basin or manhole
Archeological monitoring is required in the event of sampling outside of drain structures
Manage all IDW (solid waste, wastewater, and hazard wastes) according to installation
requirements
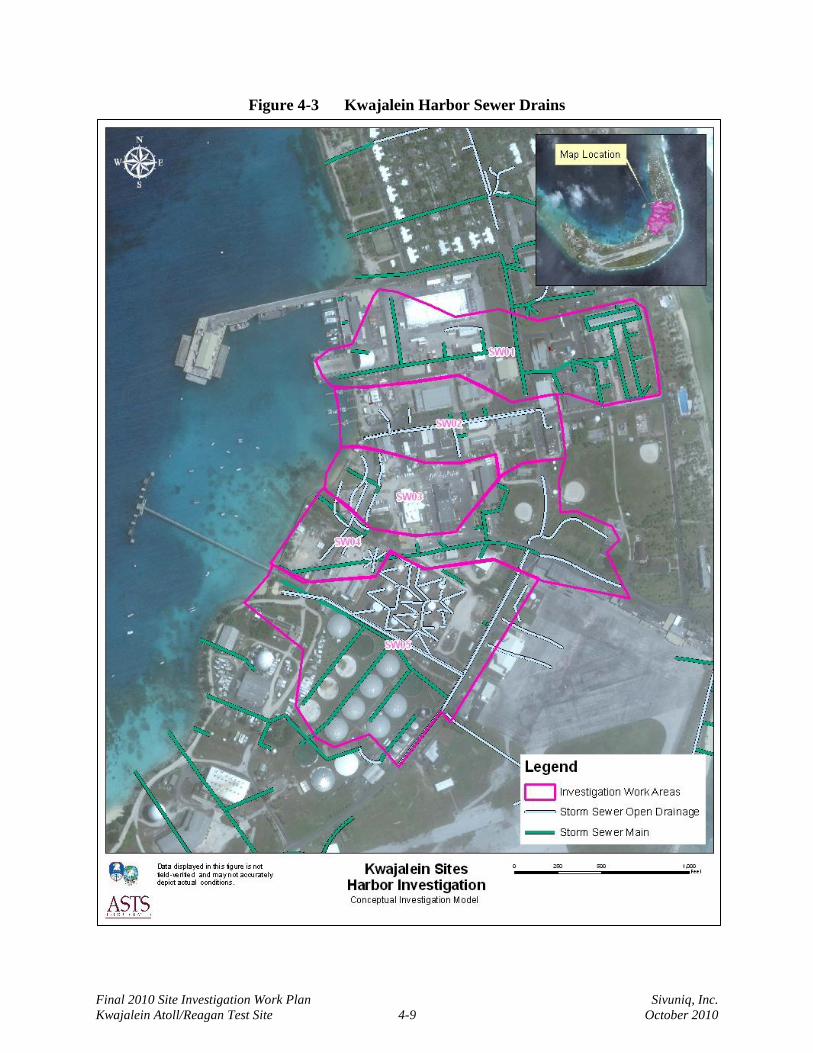
Final 2010 Site Investigation Work Plan Sivuniq, Inc.
Kwajalein Atoll/Reagan Test Site 4-9 October 2010
Figure 4-3 Kwajalein Harbor Sewer Drains
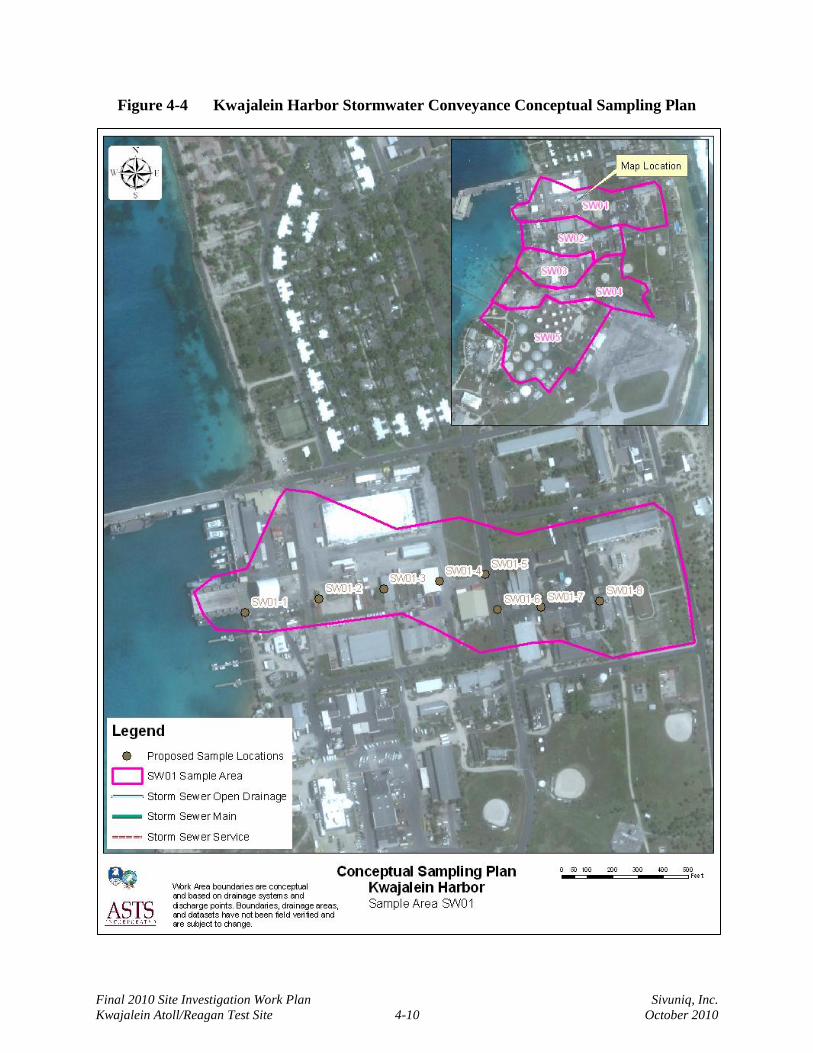
Final 2010 Site Investigation Work Plan Sivuniq, Inc.
Kwajalein Atoll/Reagan Test Site 4-10 October 2010
Figure 4-4 Kwajalein Harbor Stormwater Conveyance Conceptual Sampling Plan
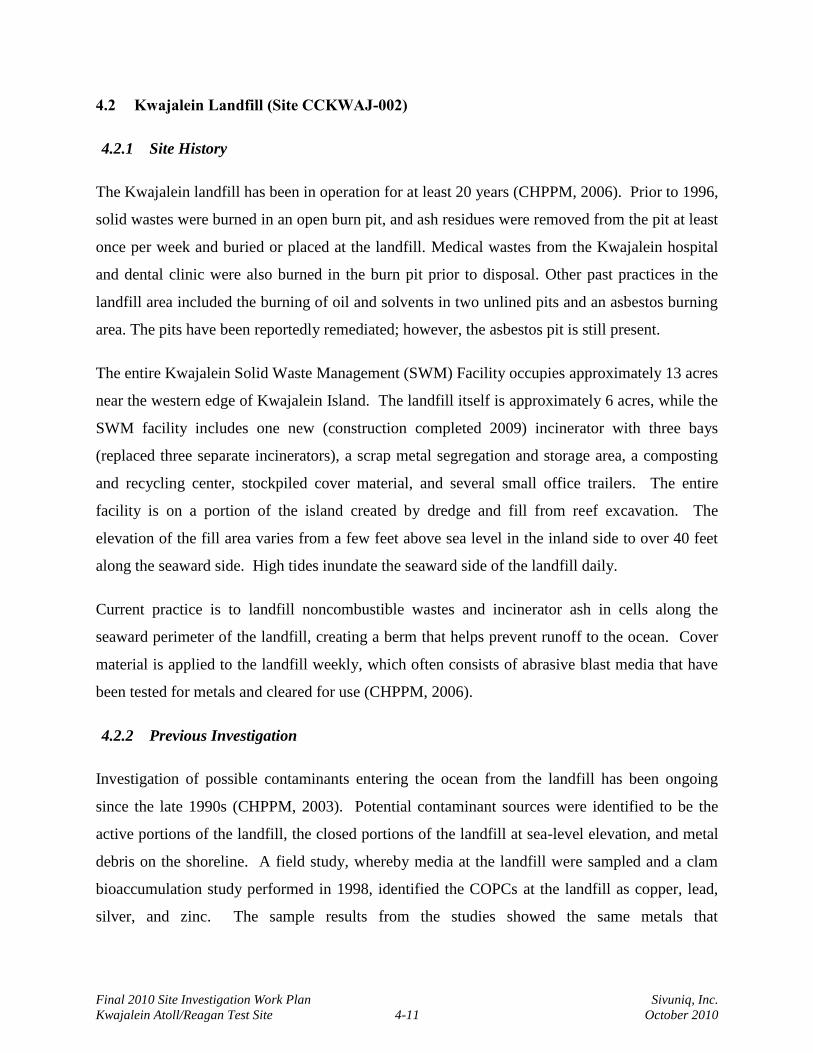
Final 2010 Site Investigation Work Plan Sivuniq, Inc.
Kwajalein Atoll/Reagan Test Site 4-11 October 2010
4.2 Kwajalein Landfill (Site CCKWAJ-002)
4.2.1 Site History
The Kwajalein landfill has been in operation for at least 20 years (CHPPM, 2006). Prior to 1996,
solid wastes were burned in an open burn pit, and ash residues were removed from the pit at least
once per week and buried or placed at the landfill. Medical wastes from the Kwajalein hospital
and dental clinic were also burned in the burn pit prior to disposal. Other past practices in the
landfill area included the burning of oil and solvents in two unlined pits and an asbestos burning
area. The pits have been reportedly remediated; however, the asbestos pit is still present.
The entire Kwajalein Solid Waste Management (SWM) Facility occupies approximately 13 acres
near the western edge of Kwajalein Island. The landfill itself is approximately 6 acres, while the
SWM facility includes one new (construction completed 2009) incinerator with three bays
(replaced three separate incinerators), a scrap metal segregation and storage area, a composting
and recycling center, stockpiled cover material, and several small office trailers. The entire
facility is on a portion of the island created by dredge and fill from reef excavation. The
elevation of the fill area varies from a few feet above sea level in the inland side to over 40 feet
along the seaward side. High tides inundate the seaward side of the landfill daily.
Current practice is to landfill noncombustible wastes and incinerator ash in cells along the
seaward perimeter of the landfill, creating a berm that helps prevent runoff to the ocean. Cover
material is applied to the landfill weekly, which often consists of abrasive blast media that have
been tested for metals and cleared for use (CHPPM, 2006).
4.2.2 Previous Investigation
Investigation of possible contaminants entering the ocean from the landfill has been ongoing
since the late 1990s (CHPPM, 2003). Potential contaminant sources were identified to be the
active portions of the landfill, the closed portions of the landfill at sea-level elevation, and metal
debris on the shoreline. A field study, whereby media at the landfill were sampled and a clam
bioaccumulation study performed in 1998, identified the COPCs at the landfill as copper, lead,
silver, and zinc. The sample results from the studies showed the same metals that
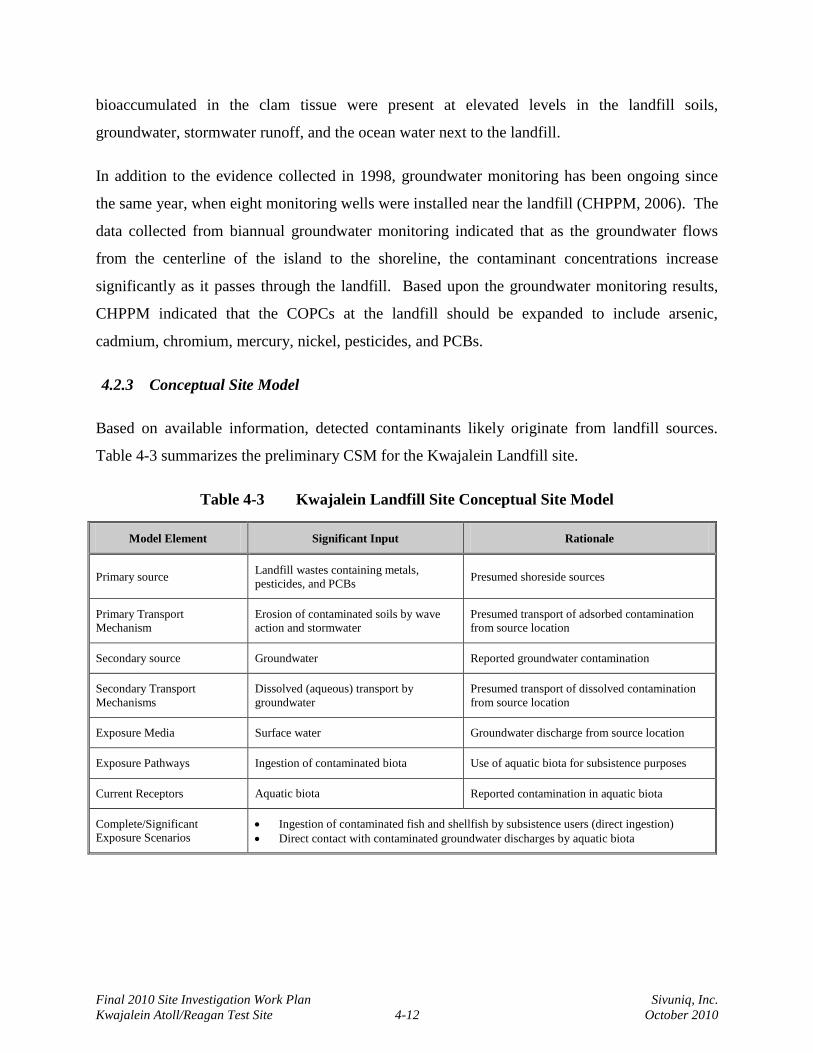
Final 2010 Site Investigation Work Plan Sivuniq, Inc.
Kwajalein Atoll/Reagan Test Site 4-12 October 2010
bioaccumulated in the clam tissue were present at elevated levels in the landfill soils,
groundwater, stormwater runoff, and the ocean water next to the landfill.
In addition to the evidence collected in 1998, groundwater monitoring has been ongoing since
the same year, when eight monitoring wells were installed near the landfill (CHPPM, 2006). The
data collected from biannual groundwater monitoring indicated that as the groundwater flows
from the centerline of the island to the shoreline, the contaminant concentrations increase
significantly as it passes through the landfill. Based upon the groundwater monitoring results,
CHPPM indicated that the COPCs at the landfill should be expanded to include arsenic,
cadmium, chromium, mercury, nickel, pesticides, and PCBs.
4.2.3 Conceptual Site Model
Based on available information, detected contaminants likely originate from landfill sources.
Table 4-3 summarizes the preliminary CSM for the Kwajalein Landfill site.
Table 4-3 Kwajalein Landfill Site Conceptual Site Model
Model Element Significant Input Rationale
Primary source Landfill wastes containing metals,
pesticides, and PCBs Presumed shoreside sources
Primary Transport
Mechanism
Erosion of contaminated soils by wave
action and stormwater
Presumed transport of adsorbed contamination
from source location
Secondary source Groundwater Reported groundwater contamination
Secondary Transport
Mechanisms
Dissolved (aqueous) transport by
groundwater
Presumed transport of dissolved contamination
from source location
Exposure Media Surface water Groundwater discharge from source location
Exposure Pathways Ingestion of contaminated biota Use of aquatic biota for subsistence purposes
Current Receptors Aquatic biota Reported contamination in aquatic biota
Complete/Significant
Exposure Scenarios
Ingestion of contaminated fish and shellfish by subsistence users (direct ingestion)
Direct contact with contaminated groundwater discharges by aquatic biota
Final 2010 Site Investigation Work Plan Sivuniq, Inc.
Kwajalein Atoll/Reagan Test Site 4-13 October 2010
The complete and significant exposure scenarios presented by the CSM consider reasonable and
appropriate receptor contact under this preliminary model. Subsequent revision of this model is
likely, based on additional information and stakeholder input. Other potential media of concern,
transport pathways, and receptors (human and/or ecological) may also become relevant as new
information becomes available.
4.2.4 Investigation Approach
Recognizing concerns of contamination migrating from the landfill and erosion on the seaward
side of the landfill face, the investigative approach addresses two fundamental elements –
physical stabilization and contaminant fate and transport. Field data will be collected to support
a rough order of magnitude estimate of remedial options.
Currently, little to no action is taking place to stabilize the embankment on the seaward side of
the landfill. Bank stabilization needs to occur to ensure no migration of debris to the reef flat
and ocean. Native material is not readily available on Kwajalein Island; therefore, engineered
stabilization approaches will be considered. Shore protection guidance from the USACE
(Environmental Engineering for Coastal Protection, EM-1110-2-1204) (USACE, 1989) provides
an operating basis to evaluate the stabilization remedy.
To address the contaminant discharge concern, other remedial alternatives include barrier
systems and complete removal. Both approaches require estimates of material quantity and
composition to allow effective evaluation.
4.2.4.1 Topographic and Bathymetric Survey
A topographic and bathymetric survey proposed for this area provides critical information to
promote a future engineering design of any stabilization project. This data also provides
quantitative inputs to evaluate the barrier system and removal project costs.
Final 2010 Site Investigation Work Plan Sivuniq, Inc.
Kwajalein Atoll/Reagan Test Site 4-14 October 2010
4.2.4.2 Landfill Material Examination
To support other potential remedies, surface observation of landfill debris at a number of
locations within the landfill allows a determination of the material types and compositions.
Samples of the surrounding native and cover materials also feed the engineering analysis for
barrier system design. Figure 4-5 presents the location of the landfill.
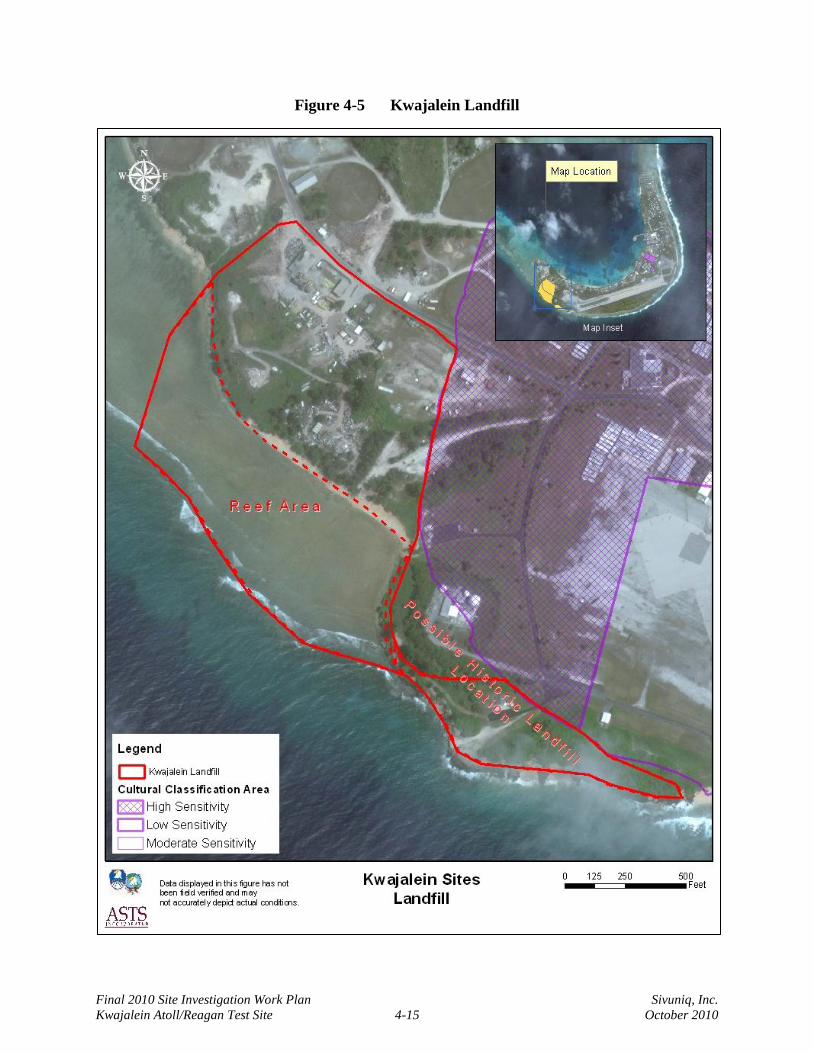
Final 2010 Site Investigation Work Plan Sivuniq, Inc.
Kwajalein Atoll/Reagan Test Site 4-15 October 2010
Figure 4-5 Kwajalein Landfill
Final 2010 Site Investigation Work Plan Sivuniq, Inc.
Kwajalein Atoll/Reagan Test Site 4-16 October 2010
4.3 PCB Vaults (Kwajalein) (Site CCKWAJ-005)
4.3.1 Site History
Reports indicate that electrical equipment at several transformer vaults on Kwajalein Island
leaked PCB-containing fluids. Although response actions removed fluids and, in some cases,
contaminated concrete, the effectiveness of the efforts is not well documented. These sites may
be contributing to the previously discussed Kwajalein Harbor contamination. The sites,
identified by building numbers, include Buildings 708, 713, 803, 900, 1011, and 1017. Figure 4-
6 presents the locations of the PCB Vault sites on Kwajalein Island.
Demolition of two of these buildings left these sites vacant. The sites include former buildings
708 and 713, located on the western side of Kwajalein Island. Reports indicate observed
contamination during demolition. Buildings 803, 900, 1011, and 1017 remain in use, but the
source equipment was previously removed.
4.3.2 Previous Investigations
Building 708: This site includes the location of a transformer vault that served the former
bachelor’s quarters. Anecdotal reports suggest the vault, contained in an equipment room on the
south end of the former structure, released fluids. No specific reports provide additional
information.
Building 713: Reports indicate PCB contamination (Aroclor-1260) in surface and subsurface
soils and groundwater, but the extent of contamination is unknown. Demolition activities
removed the transformer, vault, and all associated electrical equipment (KRS, 2004).
The transformer, formerly located within an electrical vault, leaked approximately 4 pounds (lbs)
of PCB-containing dielectric fluid to the concrete floor in June 1991. An additional spill of
approximately 0.8 lbs of PCBs also occurred during 1991 while the transformer was drained
prior to removing it from the vault. An investigation of the Building 713 vault site detected
PCBs in the soil and groundwater at approximately 3 feet below ground surface (bgs) (RSE,
2001).
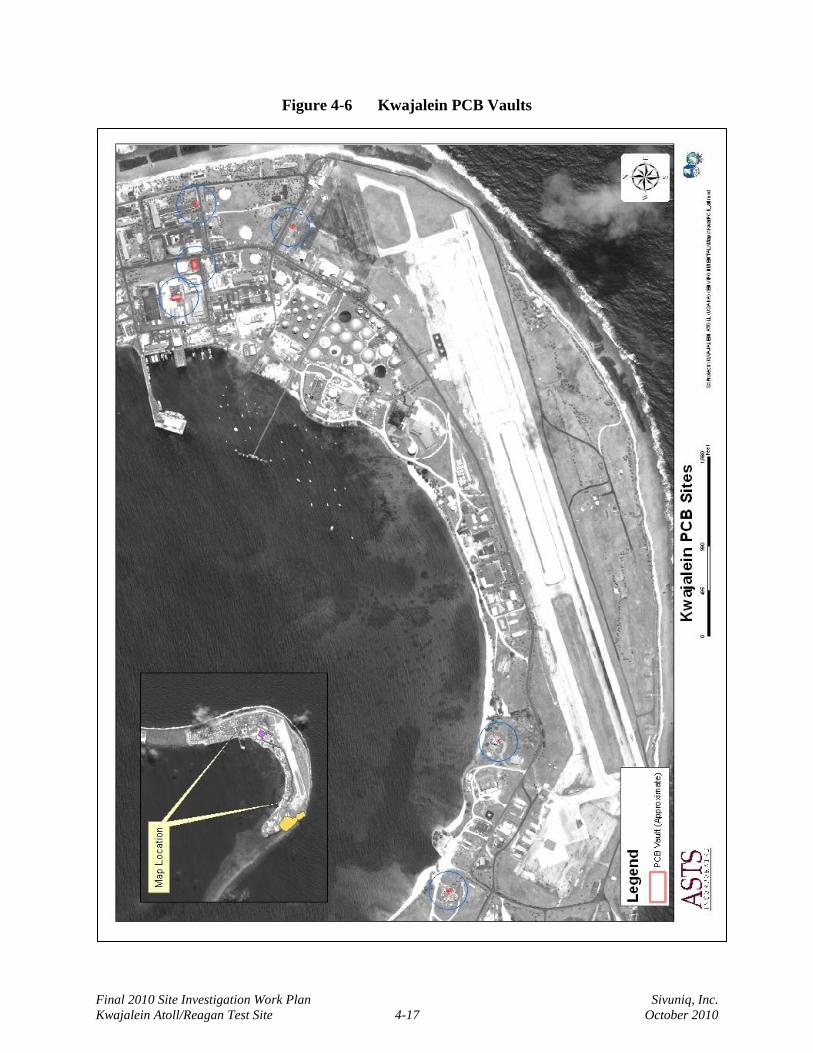
Final 2010 Site Investigation Work Plan Sivuniq, Inc.
Kwajalein Atoll/Reagan Test Site 4-17 October 2010
Figure 4-6 Kwajalein PCB Vaults
Final 2010 Site Investigation Work Plan Sivuniq, Inc.
Kwajalein Atoll/Reagan Test Site 4-18 October 2010
The spills were remediated in 2002 and 2005 by cleaning (using diesel fuel as a solvent) and
later removing a section of the concrete flooring of the vault. The soil beneath the flooring was
excavated to the hard coral base. The excavation extended under a portion of the vault wall and
beneath part of the remaining flooring of the vault structure.
Building 803: Building 803, currently used as a vehicle maintenance facility, was the site of a
former power plant with a switchgear maintenance shop. No contamination or response reports
provide specific information for this site. However, the nature of the maintenance activities and
the widespread use of PCB fluids in transformers during the operational period of this facility
make it a likely candidate for evaluation.
Building 900: Building 900 houses several transformers in the vicinity of the airfield operations
facility. Available information indicates that PCB contamination is present within the subsurface
soils beneath the concrete slab of the building (KRS, 2004). A restoration report from June 29,
2001, indicated that the transformer had leaked approximately one gallon of dielectric fluid
containing PCBs to the concrete floor of the vault. Spill response included cleaning and later
removing a section of the concrete floor of the vault. Reports indicate that the area was
backfilled with rock and gravel, and new concrete was poured to match the existing concrete
floor (RSE, 2001b). However, the October 2009 site reconnaissance showed an open trench and
standing water immediately beneath the floor.
Building 1011: Raytheon Service Company Range Systems Engineering (Raytheon) listed the
vault as requiring further remediation in the Annual USAKA Inventory of PCB Items and
Equipment since 1995 (KRS, 2004). Reports indicate that two transformers were removed from
the building on October 28, 1991, and another transformer was removed on August 25, 1994. At
the time of removal, transformer oil was reported with a PCB concentration of 350,000 ppm.
The October 2009 site reconnaissance did not provide any visual confirmation of the release
point and subsequent repairs to the vault floor.
Building 1017: Raytheon listed the vault as requiring further remediation in the Annual USAKA
Inventory of PCB Items and Equipment since 1995 (KRS, 2004). No other specific information
is immediately available.
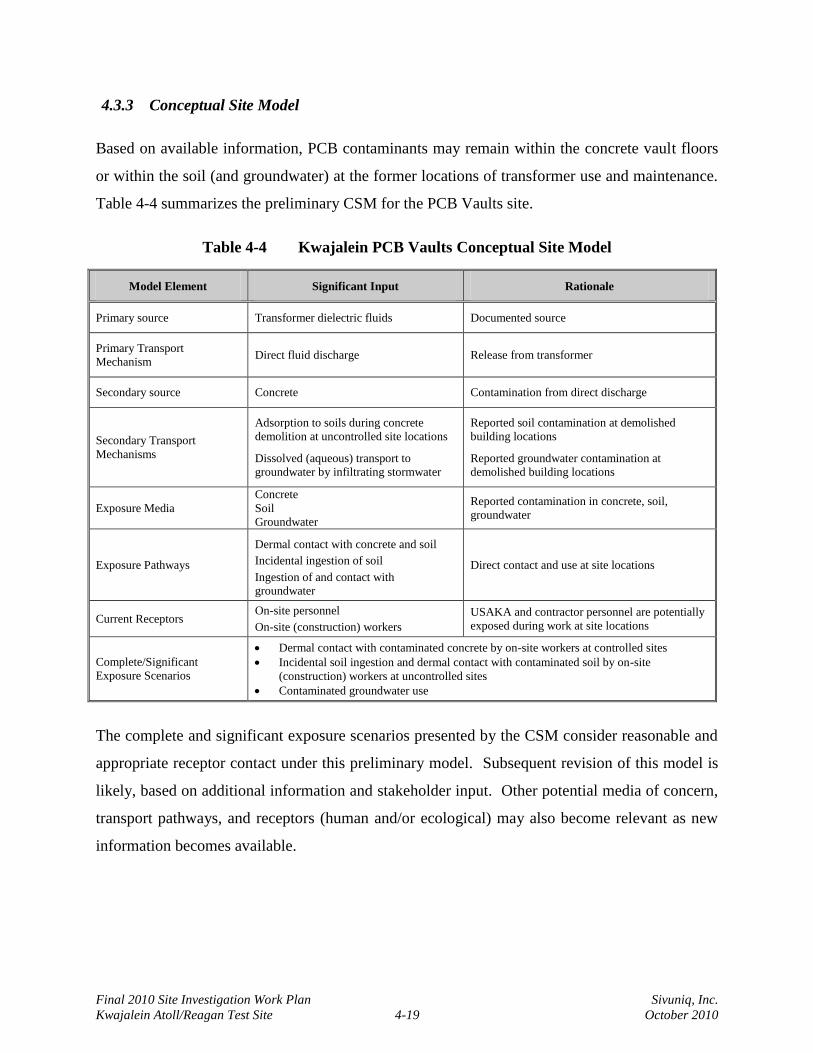
Final 2010 Site Investigation Work Plan Sivuniq, Inc.
Kwajalein Atoll/Reagan Test Site 4-19 October 2010
4.3.3 Conceptual Site Model
Based on available information, PCB contaminants may remain within the concrete vault floors
or within the soil (and groundwater) at the former locations of transformer use and maintenance.
Table 4-4 summarizes the preliminary CSM for the PCB Vaults site.
Table 4-4 Kwajalein PCB Vaults Conceptual Site Model
Model Element Significant Input Rationale
Primary source Transformer dielectric fluids Documented source
Primary Transport
Mechanism Direct fluid discharge Release from transformer
Secondary source Concrete Contamination from direct discharge
Secondary Transport
Mechanisms
Adsorption to soils during concrete
demolition at uncontrolled site locations
Dissolved (aqueous) transport to
groundwater by infiltrating stormwater
Reported soil contamination at demolished
building locations
Reported groundwater contamination at
demolished building locations
Exposure Media
Concrete
Soil
Groundwater
Reported contamination in concrete, soil,
groundwater
Exposure Pathways
Dermal contact with concrete and soil
Incidental ingestion of soil
Ingestion of and contact with groundwater
Direct contact and use at site locations
Current Receptors On-site personnel
On-site (construction) workers
USAKA and contractor personnel are potentially
exposed during work at site locations
Complete/Significant
Exposure Scenarios
Dermal contact with contaminated concrete by on-site workers at controlled sites
Incidental soil ingestion and dermal contact with contaminated soil by on-site
(construction) workers at uncontrolled sites
Contaminated groundwater use
The complete and significant exposure scenarios presented by the CSM consider reasonable and
appropriate receptor contact under this preliminary model. Subsequent revision of this model is
likely, based on additional information and stakeholder input. Other potential media of concern,
transport pathways, and receptors (human and/or ecological) may also become relevant as new
information becomes available.
Final 2010 Site Investigation Work Plan Sivuniq, Inc.
Kwajalein Atoll/Reagan Test Site 4-20 October 2010
4.3.4 Investigation Approach
A site-specific investigation addresses, as appropriate, the effectiveness of previous response
action at controlled site locations or the nature and extent of contaminant releases at uncontrolled
site locations.
Based on the CSM, controlled site locations, characterized by intact structures and contained
release points, lack secondary release mechanisms that would potentially affect soil and
groundwater. These site locations (i.e., Buildings 803, 1011, and 1017) possess inherent
containment structures (concrete floor) that prohibit impacts to secondary media. Sivuniq field
team members shall perform concrete wipe sampling activities to evaluate the effectiveness of
previous response efforts and characterize potential concerns. If the field team identifies site
conditions that suggest the possibility of incomplete controls during the course of investigation
(e.g., open floor joints or drains) the site classification will switch to uncontrolled.
Uncontrolled site locations (i.e., Buildings 708, 713, and 900), where buildings were demolished
or containment features are incomplete, receive multimedia evaluation to determine all
potentially affected media and the nature/extent of contamination. The Sivuniq field team will
use land surveying techniques to locate the footprint of Buildings 708 and 713. The building
perimeter (corners) shall be marked to define the foundation lines. Sivuniq samplers will utilize
soil and water sampling procedures described in the FSP. Sivuniq field teams intend to manage
all potentially contaminated media as regulated, unless analyses indicate otherwise.
4.3.4.1 Concrete Sampling
Concrete wipe and chip sampling and analysis provides data to evaluate risks to onsite workers
that may receive potential exposure. Surface wipe samples are used to evaluate the smooth
concrete surfaces of floors and walls near former PCB transformers and equipment. Porous and
rough concrete surfaces cannot be wiped effectively, so the concrete is chipped over a similar
amount of surface area to provide a minimum 20-gram material sample for analysis. If the wipe
sampling results indicate that PCB contamination is greater than 100 micrograms (µg) per 100
square centimeters, concrete core or chip sampling may be conducted to assess the presence of
Final 2010 Site Investigation Work Plan Sivuniq, Inc.
Kwajalein Atoll/Reagan Test Site 4-21 October 2010
PCBs within concrete surfaces. Concrete wipe and chip samples shall be analyzed for PCBs
using EPA Method 8082.
4.3.4.2 Soil Sampling
Former PCB Vault samples will be collected using direct-push and hand auger sampling
equipment at former Buildings 708 and 713. At each site, four stations will be located on the
north, south, east and west sides of the former foundation line. Soil sample groups, comprised of
three discreet sample locations, will be located at each station. Soil sampling is subject to
archeological monitoring when operating at locations outside of post-1945 fill or previously
disturbed construction areas, as indicated by the dig permit.
While sampling along the building foundation line, field crews shall examine the soil cores for
indications of backfill and disturbance from the building demolitions. The soil samples along the
foundation line shall be collected at depths below the former foundation footer to identify
downward migration of PCBs that may have occurred during previous releases. Soils will also
be sampled approximately 5 feet inside and outside of the foundation line at each of the four
stations at a depth of 2 feet bgs to evaluate lateral contaminant migration.
Since petroleum oils were often used in transformer oils, the four soil samples collected along
the foundation line shall be split in the field and undergo field screening analyses for both
petroleum constituents and PCBs. Field analyses include physical inspection, headspace
screening with PID and GC, IR Spectroscopic and UV Fluorometric analysis, electrochemical
conductivity analysis, and EnSys PCB soil test kits. Results of the field screening analysis will
be correlated to the laboratory data to evaluate usefulness of the techniques if remedial action is
needed.
Laboratory soil samples shall be analyzed for PCBs by EPA Method 8082. At least one soil
sample at each site will also be analyzed for physical parameters (total organic carbon, bulk
density and grain size distribution). A minimum of one field duplicate and one matrix
spike/matrix spike duplicate sample and one field duplicate sample shall be included with the
PCB sample sets.
Final 2010 Site Investigation Work Plan Sivuniq, Inc.
Kwajalein Atoll/Reagan Test Site 4-22 October 2010
All sample locations shall be located daily by land survey using a transit and stadia rod. Site
controls shall be tied to the nearest Kwajalein Island survey monuments, if possible, to provide
definite locations of all site sampling points.
4.3.4.3 Water Sampling
During the October 2009 site visit, the Sivuniq field survey crew observed standing water in the
excavation at Building 900. If standing water is again noted during the Building 900 site visit in
2010, the field sampling crew will collect a surface water sample to evaluate potential secondary
media impacts. The water shall be analyzed for PCBs by EPA Method 8082. A minimum of
one matrix spike/matrix spike duplicate sample and one field duplicate sample shall be included
with this sample set.
Table 4-5 provides a summary of the field activities for the PCB vault sites.
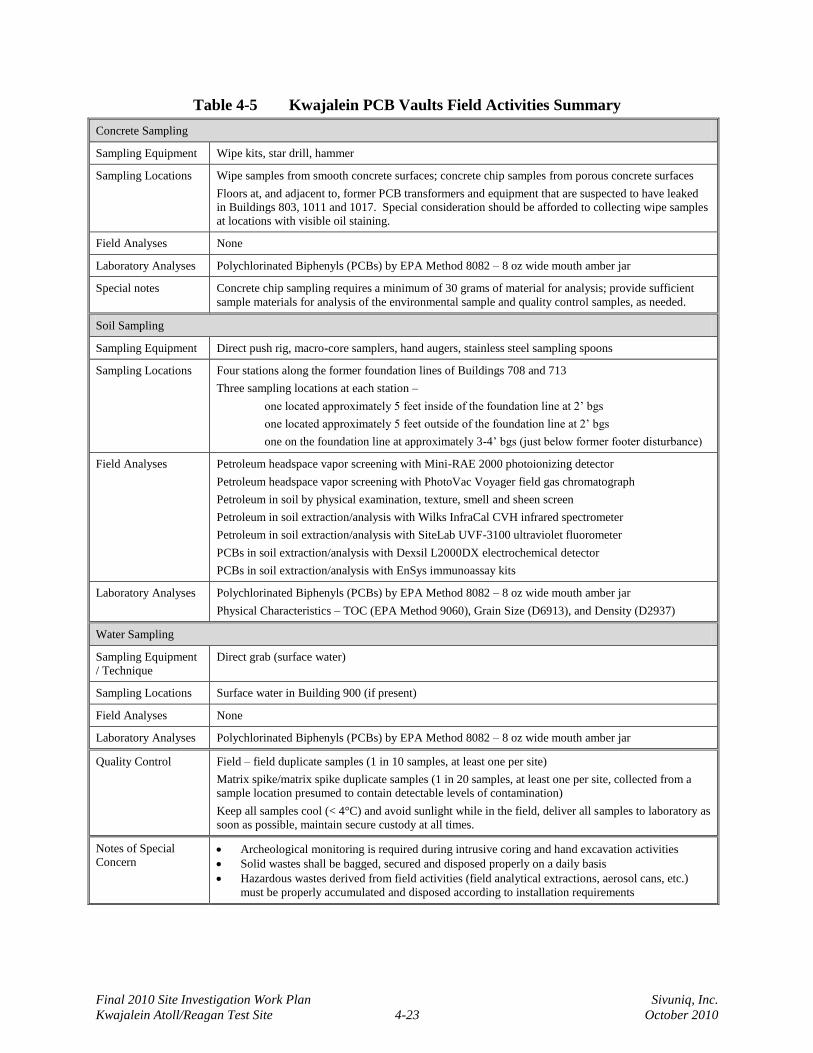
Final 2010 Site Investigation Work Plan Sivuniq, Inc.
Kwajalein Atoll/Reagan Test Site 4-23 October 2010
Table 4-5 Kwajalein PCB Vaults Field Activities Summary
Concrete Sampling
Sampling Equipment Wipe kits, star drill, hammer
Sampling Locations Wipe samples from smooth concrete surfaces; concrete chip samples from porous concrete surfaces
Floors at, and adjacent to, former PCB transformers and equipment that are suspected to have leaked
in Buildings 803, 1011 and 1017. Special consideration should be afforded to collecting wipe samples
at locations with visible oil staining.
Field Analyses None
Laboratory Analyses Polychlorinated Biphenyls (PCBs) by EPA Method 8082 – 8 oz wide mouth amber jar
Special notes Concrete chip sampling requires a minimum of 30 grams of material for analysis; provide sufficient
sample materials for analysis of the environmental sample and quality control samples, as needed.
Soil Sampling
Sampling Equipment Direct push rig, macro-core samplers, hand augers, stainless steel sampling spoons
Sampling Locations Four stations along the former foundation lines of Buildings 708 and 713
Three sampling locations at each station –
one located approximately 5 feet inside of the foundation line at 2’ bgs
one located approximately 5 feet outside of the foundation line at 2’ bgs
one on the foundation line at approximately 3-4’ bgs (just below former footer disturbance)
Field Analyses Petroleum headspace vapor screening with Mini-RAE 2000 photoionizing detector
Petroleum headspace vapor screening with PhotoVac Voyager field gas chromatograph
Petroleum in soil by physical examination, texture, smell and sheen screen
Petroleum in soil extraction/analysis with Wilks InfraCal CVH infrared spectrometer
Petroleum in soil extraction/analysis with SiteLab UVF-3100 ultraviolet fluorometer
PCBs in soil extraction/analysis with Dexsil L2000DX electrochemical detector
PCBs in soil extraction/analysis with EnSys immunoassay kits
Laboratory Analyses Polychlorinated Biphenyls (PCBs) by EPA Method 8082 – 8 oz wide mouth amber jar
Physical Characteristics – TOC (EPA Method 9060), Grain Size (D6913), and Density (D2937)
Water Sampling
Sampling Equipment
/ Technique
Direct grab (surface water)
Sampling Locations Surface water in Building 900 (if present)
Field Analyses None
Laboratory Analyses Polychlorinated Biphenyls (PCBs) by EPA Method 8082 – 8 oz wide mouth amber jar
Quality Control Field – field duplicate samples (1 in 10 samples, at least one per site)
Matrix spike/matrix spike duplicate samples (1 in 20 samples, at least one per site, collected from a
sample location presumed to contain detectable levels of contamination)
Keep all samples cool (< 4°C) and avoid sunlight while in the field, deliver all samples to laboratory as
soon as possible, maintain secure custody at all times.
Notes of Special
Concern Archeological monitoring is required during intrusive coring and hand excavation activities
Solid wastes shall be bagged, secured and disposed properly on a daily basis
Hazardous wastes derived from field activities (field analytical extractions, aerosol cans, etc.)
must be properly accumulated and disposed according to installation requirements
Final 2010 Site Investigation Work Plan Sivuniq, Inc.
Kwajalein Atoll/Reagan Test Site 4-24 October 2010
4.4 Fuel Farm/Old Power Plant Fuel Line (Site CCKWAJ-006)
4.4.1 Site History
This industrial site consists of two principal components – a fuel storage tank farm and an
abandoned fuel pipeline. The tank farm, depicted on Figure 4-6, includes two distinct areas: a
main facility with 13 field-constructed aboveground storage tanks (ASTs) (for power plant and
aviation fuels), two of which are abandoned; and a smaller area that includes four abandoned
ASTs. Lined dikes provide secondary containment for the bulk fuel storage and all tanks have
inventory gauging and leak detection equipment. The Defense Energy Support Center (DESC)
capitalized the fuel farm in 2001. As such, the DESC currently owns the infrastructure and
product and provides funding for the operation and maintenance of the facility. USAKA
provides the direct operational support at the facility on behalf of DESC.
A preliminary records search yielded few construction details and as-built drawings on the
system. Recent spill reports suggest some of these tanks have leaked, but the amount of product
release cannot be accurately confirmed as some of the alleged release appears to be water from
the tank bottoms.
The old power plant fuel line site follows an approximate 6,000-foot route on the north side of
Lagoon Road, as shown on Figure 4-7. Records indicate that the pipeline operated between 1950
and 1995, delivering diesel fuel for electrical generation. After decommissioning, the power
plant was converted into a generator shop. The installation abandoned the former fuel line in
place; no available records indicate whether the line was purged and cleaned to remove
contained fuel. Anecdotal reports of product detections along the fuel line during construction
projects suggest that at least some fuel remained in the line or there were leaks/discharges during
operation of the line.
4.4.2 Previous Investigations
The preliminary records review indicates no previous investigations for the fuel farm facility.
Numerous construction activities encountered petroleum contamination in and around the fuel
line location, but there has been no known removal of contaminated soils.
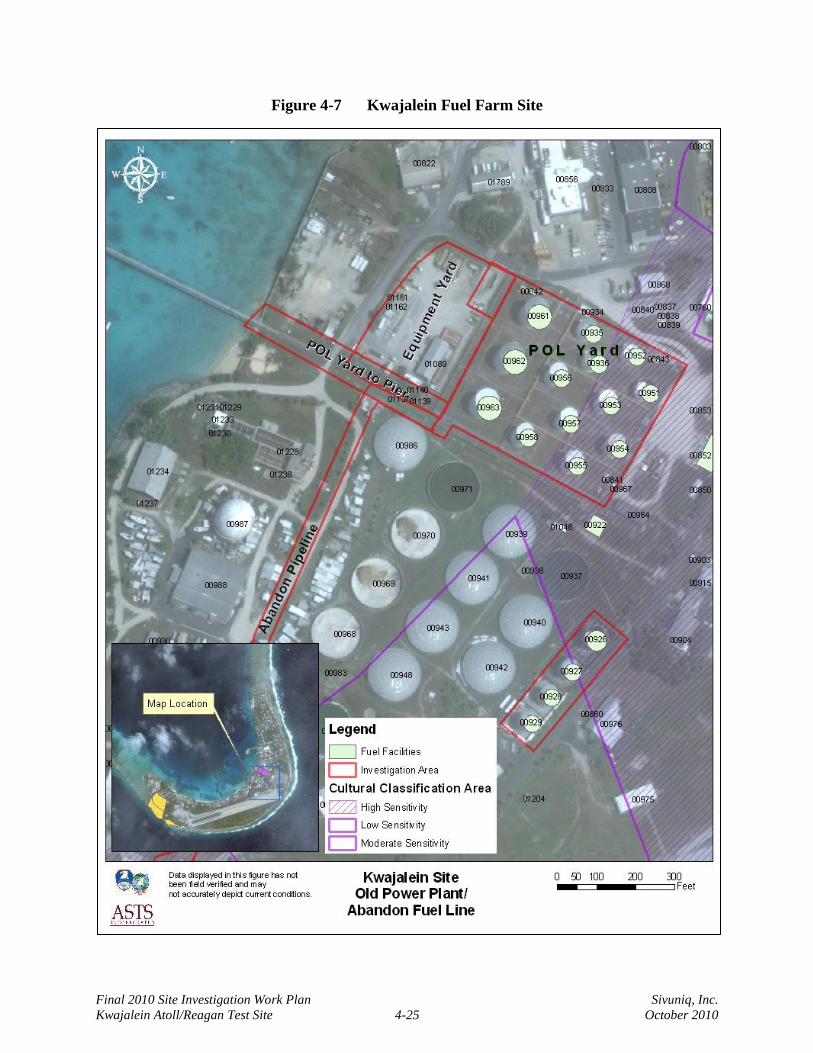
Final 2010 Site Investigation Work Plan Sivuniq, Inc.
Kwajalein Atoll/Reagan Test Site 4-25 October 2010
Figure 4-7 Kwajalein Fuel Farm Site
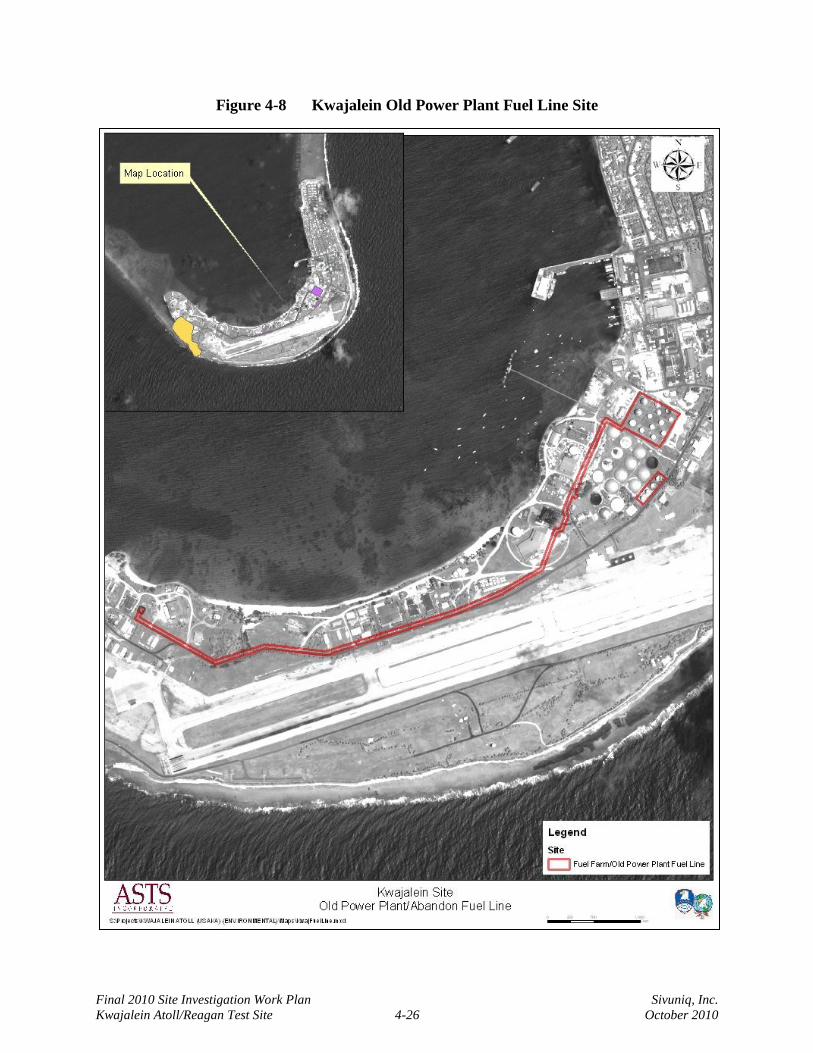
Final 2010 Site Investigation Work Plan Sivuniq, Inc.
Kwajalein Atoll/Reagan Test Site 4-26 October 2010
Figure 4-8 Kwajalein Old Power Plant Fuel Line Site
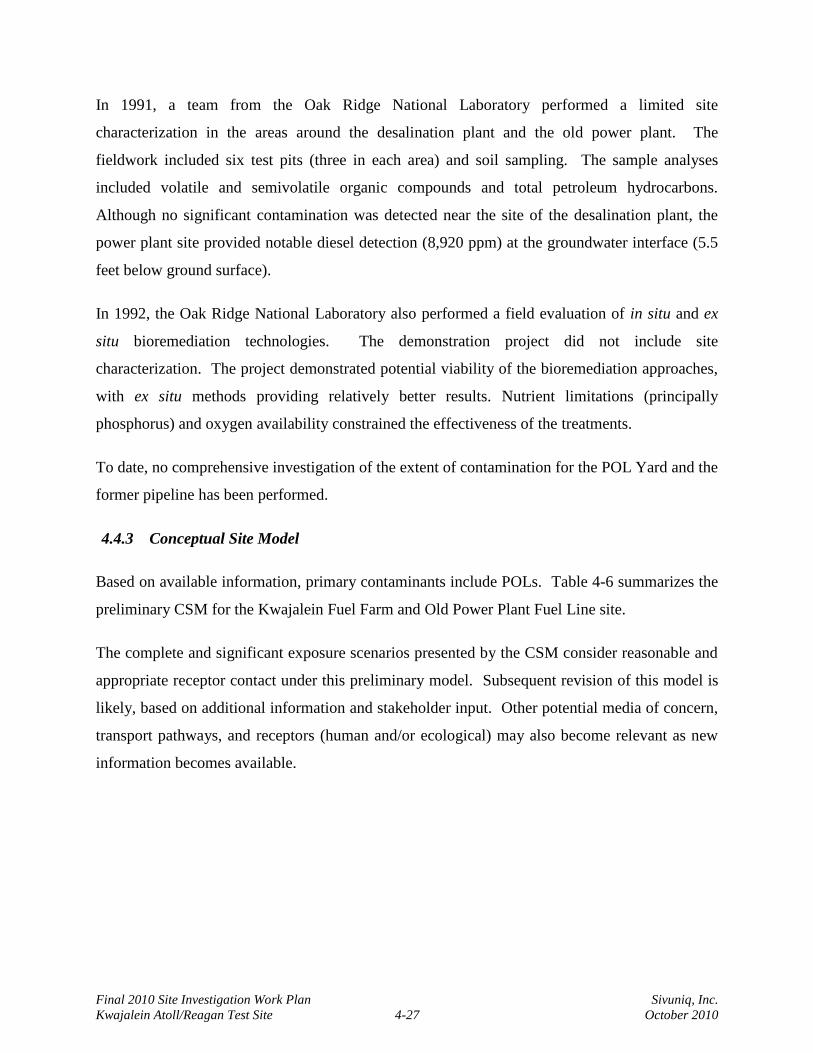
Final 2010 Site Investigation Work Plan Sivuniq, Inc.
Kwajalein Atoll/Reagan Test Site 4-27 October 2010
In 1991, a team from the Oak Ridge National Laboratory performed a limited site
characterization in the areas around the desalination plant and the old power plant. The
fieldwork included six test pits (three in each area) and soil sampling. The sample analyses
included volatile and semivolatile organic compounds and total petroleum hydrocarbons.
Although no significant contamination was detected near the site of the desalination plant, the
power plant site provided notable diesel detection (8,920 ppm) at the groundwater interface (5.5
feet below ground surface).
In 1992, the Oak Ridge National Laboratory also performed a field evaluation of in situ and ex
situ bioremediation technologies. The demonstration project did not include site
characterization. The project demonstrated potential viability of the bioremediation approaches,
with ex situ methods providing relatively better results. Nutrient limitations (principally
phosphorus) and oxygen availability constrained the effectiveness of the treatments.
To date, no comprehensive investigation of the extent of contamination for the POL Yard and the
former pipeline has been performed.
4.4.3 Conceptual Site Model
Based on available information, primary contaminants include POLs. Table 4-6 summarizes the
preliminary CSM for the Kwajalein Fuel Farm and Old Power Plant Fuel Line site.
The complete and significant exposure scenarios presented by the CSM consider reasonable and
appropriate receptor contact under this preliminary model. Subsequent revision of this model is
likely, based on additional information and stakeholder input. Other potential media of concern,
transport pathways, and receptors (human and/or ecological) may also become relevant as new
information becomes available.
Final 2010 Site Investigation Work Plan Sivuniq, Inc.
Kwajalein Atoll/Reagan Test Site 4-28 October 2010
Table 4-6 Kwajalein Fuel Farm/Old Power Plant Fuel Line Conceptual Site Model
Model Element Input Rationale
Primary source Petroleum products Documented source
Primary Transport
Mechanism
Direct product discharge Release from storage tanks and abandoned
pipeline
Secondary source Soil Contamination from direct discharge
Secondary Transport
Mechanisms
Product migration from the release
point(s)
Dissolved (aqueous) transport by
groundwater
Reported soil contamination at various locations
Suspected groundwater contamination at release
locations
Exposure Media Soil
Groundwater
Reported contamination in soil
Suspected contamination in groundwater
Exposure Pathways Incidental ingestion of soil
Dermal contact with soil
Inhalation of vapors
Ingestion of and contact with
groundwater
Direct contact and use at site locations
Current Receptors On-site operations personnel
On-site (construction) workers
USAKA and contractor personnel are potentially
exposed during work at site locations
Complete/Significant
Exposure Scenarios
Incidental soil ingestion and dermal contact with contaminated soil by on-site workers
Dermal contact with contaminated soil by on-site workers
Inhalation of vapors by on-site workers
Contaminated groundwater use
4.4.4 Investigation Approach
Due to the lack of as-built documentation and construction details, the first order of business
includes identifying and locating the pipelines, valves, and associated equipment at the fuel farm
and along the pipeline. Excavation of pipeline segments at a number of locations allows
confirmation of the pipeline location and segment lengths. A survey of the system provides the
as-built detail.
Gas surveys of soils within the fuel farm and along the pipeline allow rapid location and
assessment of release points. Direct-push soil sampling and the installation of groundwater
monitoring points provide a similar rapid technique for direct assessment of the soil and
groundwater. Field screening analysis by a number of methods provides daily data updates to
managers and stakeholders in the office and dynamic sampling adjustments in the field.
Final 2010 Site Investigation Work Plan Sivuniq, Inc.
Kwajalein Atoll/Reagan Test Site 4-29 October 2010
Confirmation sampling at the release point provides characterization of the nature of the
contamination. Additional confirmation sampling at the contaminant horizon provides accurate
definition of the extent of contamination.
Surveying all screening and confirmation sampling points during data collection supports
accurate mapping of the sample locations, release points, and groundwater conditions. Any
breaches to the secondary containment liner inside the fuel farm will be repaired immediately to
ensure the operational viability of the containment system.
Chemical-specific concentrations in soil and groundwater at the release locations allow risk-
based screening for some COPCs. However, the EPA Region 9 PRG and RSL tables do not
provide risk-based screening criteria for petroleum products. Sivuniq intends to screen volatile
and extractable petroleum hydrocarbons against provisional risk-based criteria previously
presented in Table 3-5. These values, established by the Total Petroleum Hydrocarbon Working
Group (TPHWG), provide risk-based screening levels for volatile (i.e., gasoline-range) and
extractable (i.e., diesel-range) organic contaminants.
4.4.4.1 Soil-Gas Survey
The soil-gas survey, conducted in three phases, provides rapid assessment of potential release
points. Immediately outside the fuel farm, a coarse (nominal 100-foot) grid allows macro-level
assessment of the storage tanks and piping. A condensed (50-foot spacing) and refined (25-foot
spacing) grid, applied to locations of detected soil-gas vapors, allow the soil-gas survey to locate
specific release points with approximately 20 feet of resolution.
A similar soil-gas survey approach for the pipeline focuses on possible releases at pipeline joints.
Soil gas collection at 100-foot intervals will provide coarse evaluation of releases along the
pipeline and enable detection of vapor plumes within 50 feet of a release. A follow-up
(condensed and refined) survey grid with 50-foot spacing allows rapid assessment and location
of soil gas plumes within 25 feet of release points. The soil-gas data provide geometry and
location information to define the extent of contamination.
Final 2010 Site Investigation Work Plan Sivuniq, Inc.
Kwajalein Atoll/Reagan Test Site 4-30 October 2010
4.4.4.2 Soil Sampling
Using the soil gas mapping as a guide to define the extent of petroleum contamination at the
POL Yard and pipeline, the Sivuniq field team will use direct-push sampling equipment to
identify the location of the contaminant mass, extent of product migration, and contamination
horizon. The dual-tube sampling system will be used to collect continuous sample cores up to 8
feet bgs. The macro-core sampling system has a drive point insert that allows rapid sampling of
discreet sample intervals up to 8 feet bgs. Both sampling systems provide 48-inch long recovery
cores.
Soil samples undergo physical inspection, headspace screening with PID and GC, IR
Spectroscopic and UV Fluorometric analysis, Petroflag turbidimetric analysis, and RaPID Assay
immunoassay analysis for petroleum constituents. Results of the field screening analysis will
assist locating the extent product and the contaminant horizon. The data will also be correlated
to the laboratory data to evaluate usefulness of the techniques if remedial action is needed.
Laboratory soil samples shall be analyzed for VPH (EPA Method 8260 Modified), EPH (EPA
Method 8015 Modified) and PAH compounds (EPA Method 8270-SIM). At least one soil
sample at each discreet site will also be analyzed for physical parameters (total organic carbon,
bulk density and grain size distribution). A minimum of one field duplicate and one matrix
spike/matrix spike duplicate sample shall be included with the sample sets. Trip blanks shall
accompany all VPH sample containers.
4.4.4.3 Groundwater Sampling
The dual tube direct-push soil boring easily converts into a groundwater monitoring point by
installing a screened drive point or pre-packed monitoring well inside the boring probe prior to
removal. Each discreetly identified site will include groundwater sampling points at the
presumed upgradient, cross-gradient, and downgradient locations. Groundwater sample analyses
will include petroleum constituents and bioremediation indicators. If free product is noted within
a release area, at least one well point will be installed near the center of product mass to allow
measurement of the product thickness. Water level data at these locations will assist evaluation
of the groundwater flow characteristics.
Final 2010 Site Investigation Work Plan Sivuniq, Inc.
Kwajalein Atoll/Reagan Test Site 4-31 October 2010
4.4.4.4 Free Product Recovery
If free product is detected, a product removal system will be installed and operated once the
release area and the extent of free product is delineated. The removal system will be designed to
remove free product to the maximum extent practicable.
The recoverability of free product from the subsurface will depend on the lateral extent of the
free product, the thickness of accumulated free product, and continuity of the product within the
soil formation. Additional soil samples will be collected and submitted for bulk density, organic
carbon content, and particle size to aid in determining appropriate remedial options.
Table 4-7 provides a summary of the field sampling activities.
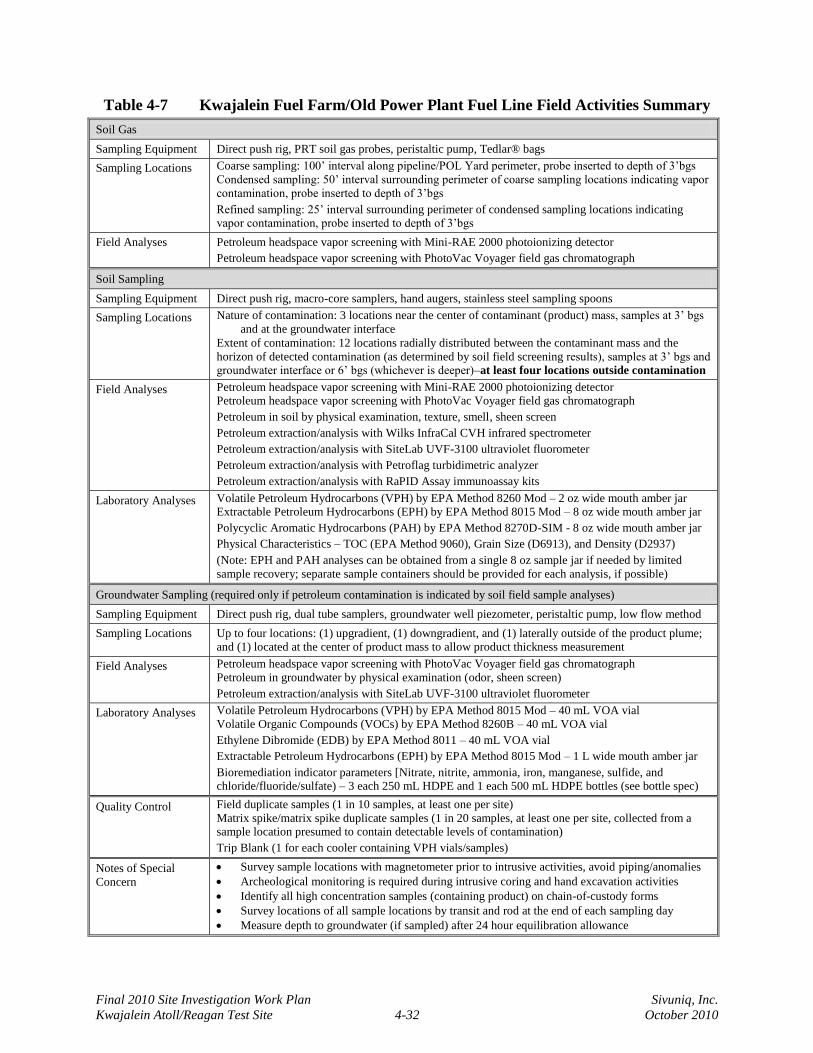
Final 2010 Site Investigation Work Plan Sivuniq, Inc.
Kwajalein Atoll/Reagan Test Site 4-32 October 2010
Table 4-7 Kwajalein Fuel Farm/Old Power Plant Fuel Line Field Activities Summary
Soil Gas
Sampling Equipment Direct push rig, PRT soil gas probes, peristaltic pump, Tedlar® bags
Sampling Locations Coarse sampling: 100’ interval along pipeline/POL Yard perimeter, probe inserted to depth of 3’bgs
Condensed sampling: 50’ interval surrounding perimeter of coarse sampling locations indicating vapor
contamination, probe inserted to depth of 3’bgs
Refined sampling: 25’ interval surrounding perimeter of condensed sampling locations indicating vapor contamination, probe inserted to depth of 3’bgs
Field Analyses Petroleum headspace vapor screening with Mini-RAE 2000 photoionizing detector
Petroleum headspace vapor screening with PhotoVac Voyager field gas chromatograph
Soil Sampling
Sampling Equipment Direct push rig, macro-core samplers, hand augers, stainless steel sampling spoons
Sampling Locations Nature of contamination: 3 locations near the center of contaminant (product) mass, samples at 3’ bgs
and at the groundwater interface
Extent of contamination: 12 locations radially distributed between the contaminant mass and the
horizon of detected contamination (as determined by soil field screening results), samples at 3’ bgs and groundwater interface or 6’ bgs (whichever is deeper)–at least four locations outside contamination
Field Analyses Petroleum headspace vapor screening with Mini-RAE 2000 photoionizing detector Petroleum headspace vapor screening with PhotoVac Voyager field gas chromatograph
Petroleum in soil by physical examination, texture, smell, sheen screen
Petroleum extraction/analysis with Wilks InfraCal CVH infrared spectrometer
Petroleum extraction/analysis with SiteLab UVF-3100 ultraviolet fluorometer
Petroleum extraction/analysis with Petroflag turbidimetric analyzer
Petroleum extraction/analysis with RaPID Assay immunoassay kits
Laboratory Analyses Volatile Petroleum Hydrocarbons (VPH) by EPA Method 8260 Mod – 2 oz wide mouth amber jar Extractable Petroleum Hydrocarbons (EPH) by EPA Method 8015 Mod – 8 oz wide mouth amber jar
Polycyclic Aromatic Hydrocarbons (PAH) by EPA Method 8270D-SIM - 8 oz wide mouth amber jar
Physical Characteristics – TOC (EPA Method 9060), Grain Size (D6913), and Density (D2937)
(Note: EPH and PAH analyses can be obtained from a single 8 oz sample jar if needed by limited
sample recovery; separate sample containers should be provided for each analysis, if possible)
Groundwater Sampling (required only if petroleum contamination is indicated by soil field sample analyses)
Sampling Equipment Direct push rig, dual tube samplers, groundwater well piezometer, peristaltic pump, low flow method
Sampling Locations Up to four locations: (1) upgradient, (1) downgradient, and (1) laterally outside of the product plume; and (1) located at the center of product mass to allow product thickness measurement
Field Analyses Petroleum headspace vapor screening with PhotoVac Voyager field gas chromatograph
Petroleum in groundwater by physical examination (odor, sheen screen)
Petroleum extraction/analysis with SiteLab UVF-3100 ultraviolet fluorometer
Laboratory Analyses Volatile Petroleum Hydrocarbons (VPH) by EPA Method 8015 Mod – 40 mL VOA vial
Volatile Organic Compounds (VOCs) by EPA Method 8260B – 40 mL VOA vial
Ethylene Dibromide (EDB) by EPA Method 8011 – 40 mL VOA vial
Extractable Petroleum Hydrocarbons (EPH) by EPA Method 8015 Mod – 1 L wide mouth amber jar
Bioremediation indicator parameters [Nitrate, nitrite, ammonia, iron, manganese, sulfide, and chloride/fluoride/sulfate) – 3 each 250 mL HDPE and 1 each 500 mL HDPE bottles (see bottle spec)
Quality Control Field duplicate samples (1 in 10 samples, at least one per site)
Matrix spike/matrix spike duplicate samples (1 in 20 samples, at least one per site, collected from a sample location presumed to contain detectable levels of contamination)
Trip Blank (1 for each cooler containing VPH vials/samples)
Notes of Special
Concern
Survey sample locations with magnetometer prior to intrusive activities, avoid piping/anomalies
Archeological monitoring is required during intrusive coring and hand excavation activities
Identify all high concentration samples (containing product) on chain-of-custody forms
Survey locations of all sample locations by transit and rod at the end of each sampling day
Measure depth to groundwater (if sampled) after 24 hour equilibration allowance
Final 2010 Site Investigation Work Plan Sivuniq, Inc.
Kwajalein Atoll/Reagan Test Site 4-33 October 2010
4.5 Cold Storage Warehouse (Site CCKWAJ-007)
4.5.1 Site History
The former cold goods storage warehouse included former Building Numbers 610, 612, and 701.
The buildings, constructed in 1953, 1968, and 1951, respectively, were located toward the west
and central portion of Kwajalein Island near the lagoon side of the island.
Kwajalein Range Services Environmental Office staff identified chlordane contamination during
demolition of the cold storage warehouse buildings in 2004. Chlordane at this and other
locations is potentially contributing to the impacts identified at the Kwajalein Harbor.
Since the warehouse buildings were demolished, site surveying will be used to relocate the
former building foundations. Sivuniq field teams will establish site control and the office team
will use historic aerial photography and GIS tools to establish geometries for relocating the
foundations.
4.5.2 Previous Investigations
No previous investigations have been conducted at the Cold Storage Warehouse site.
4.5.3 Conceptual Site Model
Based on available information, primary contaminants include pesticides (chlordane). Table 4-8
summarizes the preliminary CSM for the Kwajalein Cold Storage Warehouse site.
The complete and significant exposure scenarios presented by the CSM consider reasonable and
appropriate receptor contact under this preliminary model. Subsequent revision of this model is
likely, based on additional information and stakeholder input. Other potential media of concern,
transport pathways, and receptors (human and/or ecological) may also become relevant as new
information becomes available.
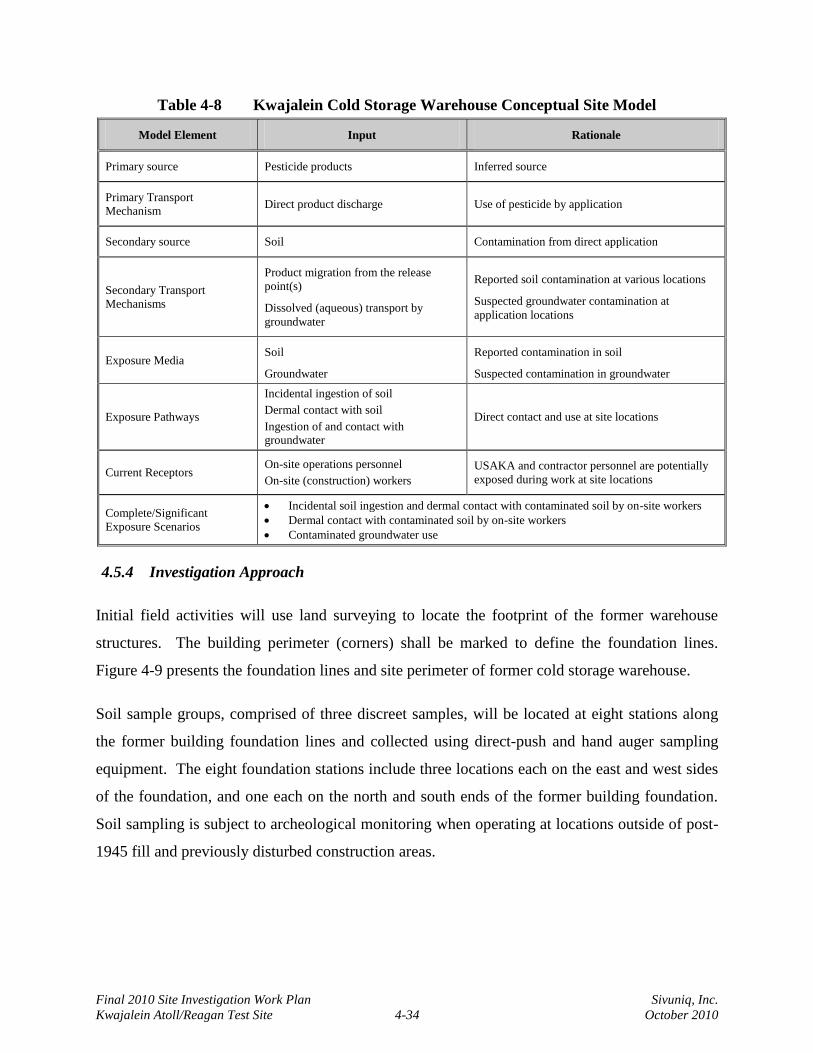
Final 2010 Site Investigation Work Plan Sivuniq, Inc.
Kwajalein Atoll/Reagan Test Site 4-34 October 2010
Table 4-8 Kwajalein Cold Storage Warehouse Conceptual Site Model
Model Element Input Rationale
Primary source Pesticide products Inferred source
Primary Transport
Mechanism Direct product discharge Use of pesticide by application
Secondary source Soil Contamination from direct application
Secondary Transport
Mechanisms
Product migration from the release
point(s)
Dissolved (aqueous) transport by
groundwater
Reported soil contamination at various locations
Suspected groundwater contamination at
application locations
Exposure Media Soil
Groundwater
Reported contamination in soil
Suspected contamination in groundwater
Exposure Pathways
Incidental ingestion of soil
Dermal contact with soil
Ingestion of and contact with groundwater
Direct contact and use at site locations
Current Receptors On-site operations personnel
On-site (construction) workers
USAKA and contractor personnel are potentially
exposed during work at site locations
Complete/Significant
Exposure Scenarios
Incidental soil ingestion and dermal contact with contaminated soil by on-site workers
Dermal contact with contaminated soil by on-site workers
Contaminated groundwater use
4.5.4 Investigation Approach
Initial field activities will use land surveying to locate the footprint of the former warehouse
structures. The building perimeter (corners) shall be marked to define the foundation lines.
Figure 4-9 presents the foundation lines and site perimeter of former cold storage warehouse.
Soil sample groups, comprised of three discreet samples, will be located at eight stations along
the former building foundation lines and collected using direct-push and hand auger sampling
equipment. The eight foundation stations include three locations each on the east and west sides
of the foundation, and one each on the north and south ends of the former building foundation.
Soil sampling is subject to archeological monitoring when operating at locations outside of post-
1945 fill and previously disturbed construction areas.
Final 2010 Site Investigation Work Plan Sivuniq, Inc.
Kwajalein Atoll/Reagan Test Site 4-35 October 2010
While sampling along the building foundation line, field crews shall examine the soil cores for
indications of backfill and disturbance from the 2004 building demolition. The soil samples
along the foundation line shall be collected at depths below the former foundation footer to
identify downward migration of pesticides that may have been directly applied to the foundation
walls. Soils will also be sampled approximately 5 feet inside and outside of the foundation line
at each of the eight stations at a depth of 2 feet bgs to evaluate lateral contaminant migration.
Soil samples from the (24) Cold Storage Warehouse sample locations shall be analyzed for
VPH/EPH (EPA Method 8015 Modified) and organochlorine pesticides (EPA Method 8081A).
A minimum of one matrix spike/matrix spike duplicate sample and two field duplicate samples
shall be included with this sample set. Trip blanks shall accompany all VPH sample containers.
The eight soil sample collected along the foundation line shall be split in the field and undergo
field screening analyses for petroleum constituents and pesticides (chlordane). Petroleum
constituent field analyses include headspace screening with PID and GC, IR Spectroscopic and
UV Fluorometric analysis, turbidimetry with PetroFLAG® kits, and immunoassay with
BTEX/TPH RaPID Assay kits. Chlordane field analysis includes electrochemical analysis with
the Dexsil L2000DX and immunoassay with the EnSys Chlordane in Soil test kit. Results of the
field screening analysis will be correlated to the laboratory data to evaluate usefulness of the
techniques if remedial action is needed.
If chlordane or hydrocarbon is detected in soil screening sample analyses, a temporary
groundwater monitoring drive point will be installed and confirmation groundwater samples
collected at up to four of stations to evaluate potential impacts to the groundwater resource.
Samples collected with a peristaltic pump and low-flow sampling techniques shall be analyzed
for VPH/EPH (EPA Method 8015 Modified) and organochlorine pesticides (EPA Method
8081A). A minimum of one matrix spike/matrix spike duplicate sample and two field duplicate
samples shall be included with this sample set. Trip blanks shall accompany the VPH samples
containers. The sample locations shall be located at the end of each day by surveying using a
transit and stadia rod. Site controls shall be tied to the nearest Kwajalein Island survey
monuments, if possible, to provide definite locations of all site sampling points. Table 4-7
provides a summary of field activities.
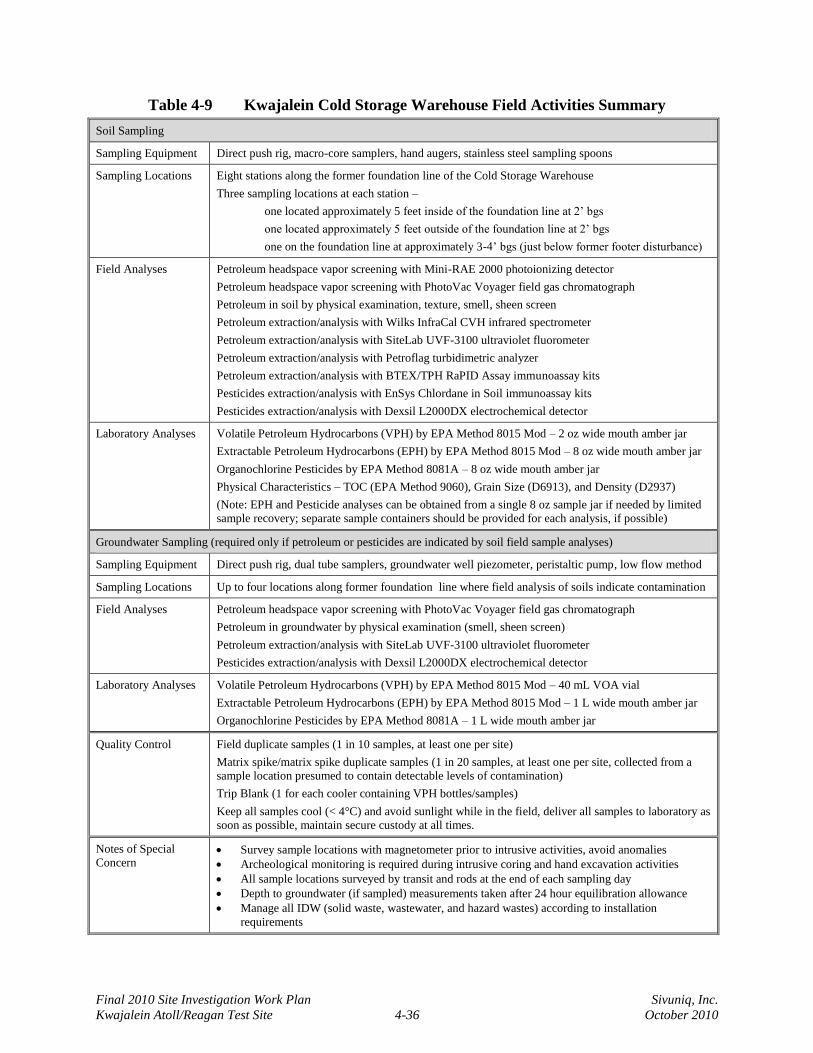
Final 2010 Site Investigation Work Plan Sivuniq, Inc.
Kwajalein Atoll/Reagan Test Site 4-36 October 2010
Table 4-9 Kwajalein Cold Storage Warehouse Field Activities Summary
Soil Sampling
Sampling Equipment Direct push rig, macro-core samplers, hand augers, stainless steel sampling spoons
Sampling Locations Eight stations along the former foundation line of the Cold Storage Warehouse
Three sampling locations at each station –
one located approximately 5 feet inside of the foundation line at 2’ bgs
one located approximately 5 feet outside of the foundation line at 2’ bgs
one on the foundation line at approximately 3-4’ bgs (just below former footer disturbance)
Field Analyses Petroleum headspace vapor screening with Mini-RAE 2000 photoionizing detector
Petroleum headspace vapor screening with PhotoVac Voyager field gas chromatograph
Petroleum in soil by physical examination, texture, smell, sheen screen
Petroleum extraction/analysis with Wilks InfraCal CVH infrared spectrometer
Petroleum extraction/analysis with SiteLab UVF-3100 ultraviolet fluorometer
Petroleum extraction/analysis with Petroflag turbidimetric analyzer
Petroleum extraction/analysis with BTEX/TPH RaPID Assay immunoassay kits
Pesticides extraction/analysis with EnSys Chlordane in Soil immunoassay kits
Pesticides extraction/analysis with Dexsil L2000DX electrochemical detector
Laboratory Analyses Volatile Petroleum Hydrocarbons (VPH) by EPA Method 8015 Mod – 2 oz wide mouth amber jar
Extractable Petroleum Hydrocarbons (EPH) by EPA Method 8015 Mod – 8 oz wide mouth amber jar
Organochlorine Pesticides by EPA Method 8081A – 8 oz wide mouth amber jar
Physical Characteristics – TOC (EPA Method 9060), Grain Size (D6913), and Density (D2937)
(Note: EPH and Pesticide analyses can be obtained from a single 8 oz sample jar if needed by limited
sample recovery; separate sample containers should be provided for each analysis, if possible)
Groundwater Sampling (required only if petroleum or pesticides are indicated by soil field sample analyses)
Sampling Equipment Direct push rig, dual tube samplers, groundwater well piezometer, peristaltic pump, low flow method
Sampling Locations Up to four locations along former foundation line where field analysis of soils indicate contamination
Field Analyses Petroleum headspace vapor screening with PhotoVac Voyager field gas chromatograph
Petroleum in groundwater by physical examination (smell, sheen screen)
Petroleum extraction/analysis with SiteLab UVF-3100 ultraviolet fluorometer
Pesticides extraction/analysis with Dexsil L2000DX electrochemical detector
Laboratory Analyses Volatile Petroleum Hydrocarbons (VPH) by EPA Method 8015 Mod – 40 mL VOA vial
Extractable Petroleum Hydrocarbons (EPH) by EPA Method 8015 Mod – 1 L wide mouth amber jar
Organochlorine Pesticides by EPA Method 8081A – 1 L wide mouth amber jar
Quality Control Field duplicate samples (1 in 10 samples, at least one per site)
Matrix spike/matrix spike duplicate samples (1 in 20 samples, at least one per site, collected from a
sample location presumed to contain detectable levels of contamination)
Trip Blank (1 for each cooler containing VPH bottles/samples)
Keep all samples cool (< 4°C) and avoid sunlight while in the field, deliver all samples to laboratory as
soon as possible, maintain secure custody at all times.
Notes of Special
Concern Survey sample locations with magnetometer prior to intrusive activities, avoid anomalies
Archeological monitoring is required during intrusive coring and hand excavation activities
All sample locations surveyed by transit and rods at the end of each sampling day
Depth to groundwater (if sampled) measurements taken after 24 hour equilibration allowance
Manage all IDW (solid waste, wastewater, and hazard wastes) according to installation
requirements
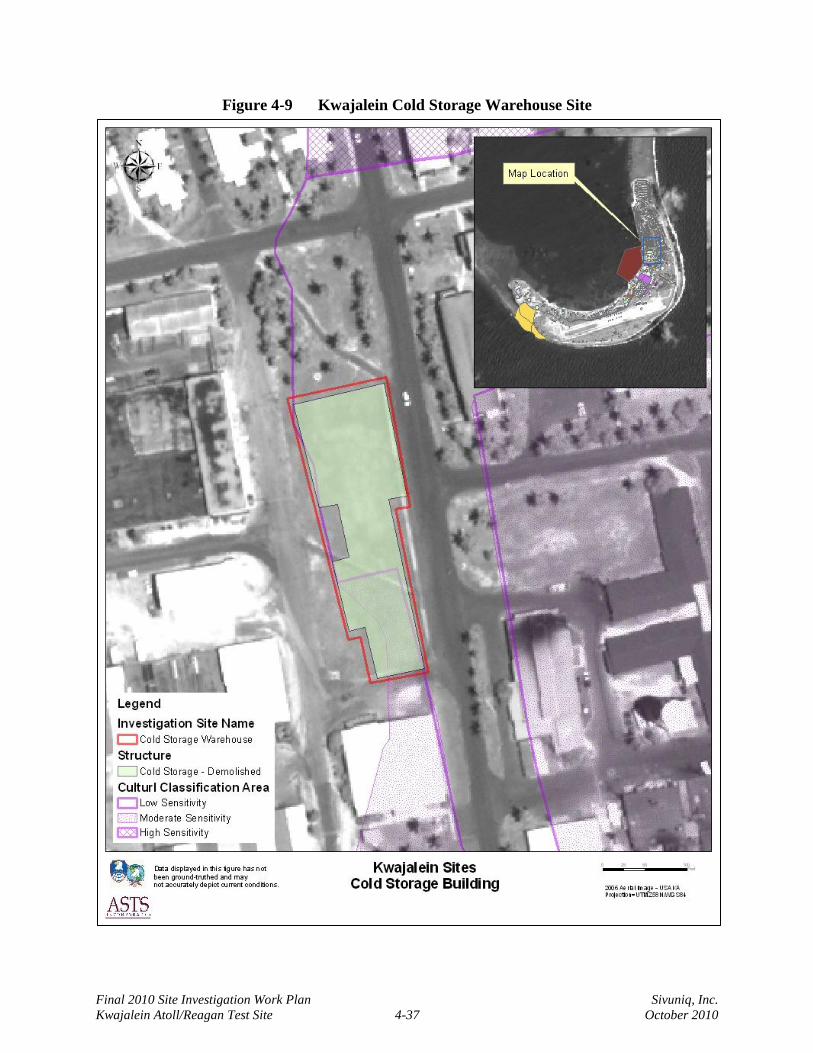
Final 2010 Site Investigation Work Plan Sivuniq, Inc.
Kwajalein Atoll/Reagan Test Site 4-37 October 2010
Figure 4-9 Kwajalein Cold Storage Warehouse Site
Final 2010 Site Investigation Work Plan Sivuniq, Inc.
Kwajalein Atoll/Reagan Test Site 4-38 October 2010
4.6 Roi Power Plant Fuel Spill (Site CCKWAJ-003)
4.6.1 Site History
This Roi-Namur site is the POL storage area for the power plant (Facility 8046). A large diesel
fuel oil release of approximately 22,500 gallons occurred at one of the two power plant ASTs on
January 30, 1996. The 350,000-gallon AST (#1) was overfilled because the available tank
volume was erroneously calculated and, because of a faulty level sensing system, the release was
not noticed until the tank was full (RSE, 2001a). At the time of the release, there was no
secondary containment around the POL tanks (although a secondary containment has since been
added). The fuel release occurred at the overflow pipe at the base of the tank. Figure 4-10
presents the Roi-Namur Power Plant Fuel Spill site.
When the release was discovered, attempts were made to stop the flow. Emergency response
teams recovered approximately 8,550 gallons of fuel within six days of the spill. Approximately
13,050 gallons of fuel was recovered within the next four months (RSE, 2001). Reports indicate
that about 14,625 gallons of fuel percolated into the porous coral rock and was assumed to be
migrating away from the source of the spill that was immediately adjacent to the storage tank.
In the 2001 restoration report, it was noted that no humans inhabit the spill site and that no viable
pathways of exposure exist. Product removal from the groundwater is reportedly feasible
because of the fine- to coarse-grained calcareous sands, relatively shallow depth to groundwater,
somewhat predictable tides, and constant temperatures, which facilitate the remediation process.
4.6.2 Previous Investigations
Initial recovery efforts included recovering free product from trenches, and the recovery
operations continued throughout 1996 at primarily one of the trenches where the majority of the
free product had accumulated. In addition to the trenches, four wells were installed with
skimmers to recover product. One of the wells continued to operate until March 1997, when
recovery operations ceased for unknown reasons.
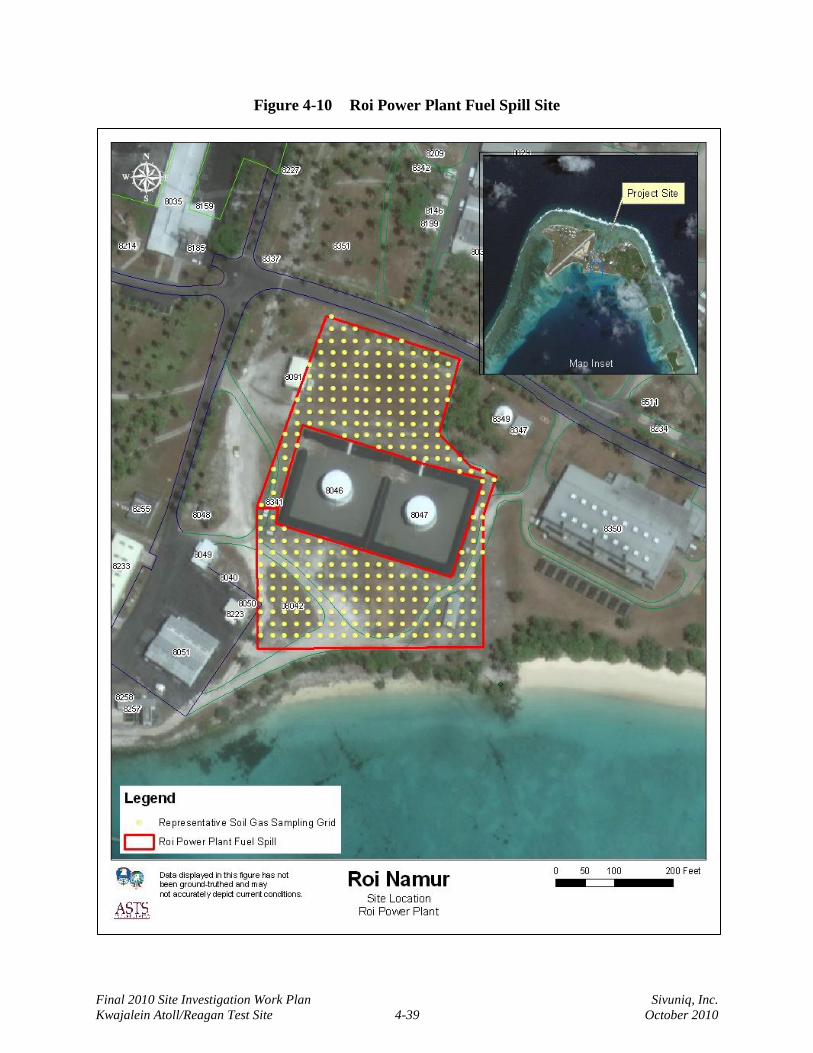
Final 2010 Site Investigation Work Plan Sivuniq, Inc.
Kwajalein Atoll/Reagan Test Site 4-39 October 2010
Figure 4-10 Roi Power Plant Fuel Spill Site
Final 2010 Site Investigation Work Plan Sivuniq, Inc.
Kwajalein Atoll/Reagan Test Site 4-40 October 2010
Historical contamination from previous activities at the site had become apparent during the
recovery operations because of the weathered product that was being recovered. The 2001 RSE
report indicates pipeline monitoring during transfer operations because of previous leaks that had
occurred that required rapid response to keep the product from entering the lagoon. Also, this
report suggests it was common practice to dispose of engine crank oil, solvents, contaminated
fuel, and petroleum sludge in an unlined pit adjacent to the site of the 1996 diesel fuel oil spill.
The amount of fuel recovered was significantly less than the amount suspected of being spilled.
Soil and groundwater are known to be contaminated; however, no sheen, staining, or other
evidence of contamination has been visually seen in the lagoon or ocean.
4.6.3 Conceptual Site Model
Based on available information, primary contaminants include POL constituents. Table 4-10
summarizes the preliminary CSM for the Roi Power Plant Fuel Spill site.
The complete and significant exposure scenarios presented by the CSM consider reasonable and
appropriate receptor contact under this preliminary model. Subsequent revision of this model is
likely, based on additional information and stakeholder input. Other potential media of concern,
transport pathways, and receptors (human and/or ecological) may also become relevant as new
information becomes available.
4.6.1 Investigation Approach
Due to the lack of as-built documentation and construction details, the first order of business
includes identifying and locating the pipelines, valves, and associated equipment at the Roi
Power Plant. A survey of the system provides the as-built detail.
A soil-gas survey within and immediately around the power plant allows rapid location and
assessment of the impacted area. Direct-push soil sampling and groundwater monitoring point
installation provides a similar rapid assessment technique for direct assessment of the soil and
groundwater. Field screening analysis by a number of methods provides daily data updates to
managers and stakeholders in the office and dynamic sampling adjustments in the field.
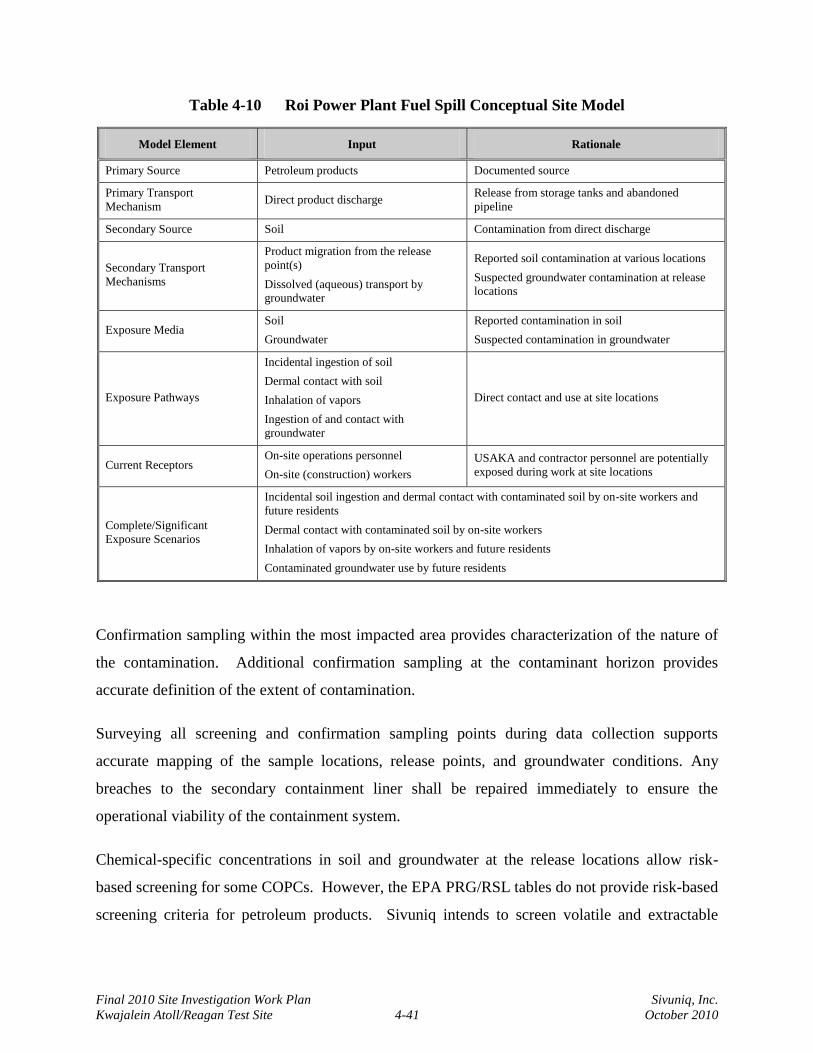
Final 2010 Site Investigation Work Plan Sivuniq, Inc.
Kwajalein Atoll/Reagan Test Site 4-41 October 2010
Table 4-10 Roi Power Plant Fuel Spill Conceptual Site Model
Model Element Input Rationale
Primary Source Petroleum products Documented source
Primary Transport
Mechanism Direct product discharge
Release from storage tanks and abandoned
pipeline
Secondary Source Soil Contamination from direct discharge
Secondary Transport
Mechanisms
Product migration from the release
point(s)
Dissolved (aqueous) transport by
groundwater
Reported soil contamination at various locations
Suspected groundwater contamination at release
locations
Exposure Media Soil
Groundwater
Reported contamination in soil
Suspected contamination in groundwater
Exposure Pathways
Incidental ingestion of soil
Dermal contact with soil
Inhalation of vapors
Ingestion of and contact with
groundwater
Direct contact and use at site locations
Current Receptors On-site operations personnel
On-site (construction) workers
USAKA and contractor personnel are potentially
exposed during work at site locations
Complete/Significant
Exposure Scenarios
Incidental soil ingestion and dermal contact with contaminated soil by on-site workers and
future residents
Dermal contact with contaminated soil by on-site workers
Inhalation of vapors by on-site workers and future residents
Contaminated groundwater use by future residents
Confirmation sampling within the most impacted area provides characterization of the nature of
the contamination. Additional confirmation sampling at the contaminant horizon provides
accurate definition of the extent of contamination.
Surveying all screening and confirmation sampling points during data collection supports
accurate mapping of the sample locations, release points, and groundwater conditions. Any
breaches to the secondary containment liner shall be repaired immediately to ensure the
operational viability of the containment system.
Chemical-specific concentrations in soil and groundwater at the release locations allow risk-
based screening for some COPCs. However, the EPA PRG/RSL tables do not provide risk-based
screening criteria for petroleum products. Sivuniq intends to screen volatile and extractable
Final 2010 Site Investigation Work Plan Sivuniq, Inc.
Kwajalein Atoll/Reagan Test Site 4-42 October 2010
petroleum hydrocarbons against provisional risk-based criteria established by the TPHWG for
gasoline-range and diesel-range organic contaminants.
4.6.1.1 Soil-Gas Survey
A soil-gas survey, conducted in three phases, provides rapid assessment of potential release
points. Inside and adjacent to the power plant, a coarse (nominal 100-foot) grid allows macro-
level assessment of the storage tanks and piping. A condensed (50-foot spacing) and refined (25-
foot spacing) grid, applied to locations of detected soil-gas vapors, allow the soil-gas survey to
locate specific release points with approximately 20 feet of resolution.
4.6.1.2 Soil Sampling
Using the soil gas mapping as a guide to define the extent of petroleum contamination at the Roi
Power Plant site, the Sivuniq field team will use direct-push sampling equipment to identify the
location of the contaminant mass, extent of product migration, and contamination horizon. The
dual-tube sampling system will be used to collect continuous sample cores up to 8 feet bgs. The
macro-core sampling system has a drive point insert that allows rapid sampling of discreet
sample intervals up to 8 feet bgs. Both sampling systems provide 48-inch long recovery cores.
Soil samples undergo physical inspection, headspace screening with PID and GC, IR
Spectroscopic and UV Fluorometric analysis, Petroflag turbidimetric analysis, and RaPID Assay
immunoassay analysis for petroleum constituents. Results of the field screening analysis will
assist locating the extent product and the contaminant horizon. The data will also be correlated
to the laboratory data to evaluate usefulness of the techniques if remedial action is needed.
Laboratory soil samples shall be analyzed for VPH (EPA Method 8260 Modified), EPH (EPA
Method 8015 Modified) and PAH compounds (EPA Method 8270-SIM). At least one soil
sample at each discreet site will also be analyzed for physical parameters (total organic carbon,
bulk density and grain size distribution). A minimum of one field duplicate and one matrix
spike/matrix spike duplicate sample shall be included with the sample sets. Trip blanks shall
accompany all VPH sample containers.
Final 2010 Site Investigation Work Plan Sivuniq, Inc.
Kwajalein Atoll/Reagan Test Site 4-43 October 2010
4.6.1.3 Groundwater Sampling
The dual tube direct-push soil boring easily converts into a groundwater monitoring point by
installing a screened drive point or pre-packed monitoring well inside the boring probe prior to
removal. Each discreetly identified site will include groundwater sampling points at the
presumed upgradient, cross-gradient, and downgradient locations. If free product is noted within
the release area, up to five well points will be installed near the center of product mass to allow
measurement of the product thickness. Water level data at these locations will assist evaluation
of the groundwater flow characteristics.
4.6.1.4 Free Product Recovery
A free product removal system will be installed and operated once the release area and the extent
of free product is delineated. The removal system will be designed to remove free product to the
maximum extent practicable. The fuel product at the site consists of diesel fuel, a light non-
aqueous-phase liquid (LNAPLs) that floats on the groundwater surface.
The recoverability of free product from the subsurface will depend on the lateral extent of the
free product, the thickness of accumulated free product, and continuity of the product within the
soil formation. Additional soil samples will be collected and submitted for bulk density, organic
carbon content, and particle size to aid in determining appropriate remedial options.
Table 4-11 provides a summary of the field sampling activities.
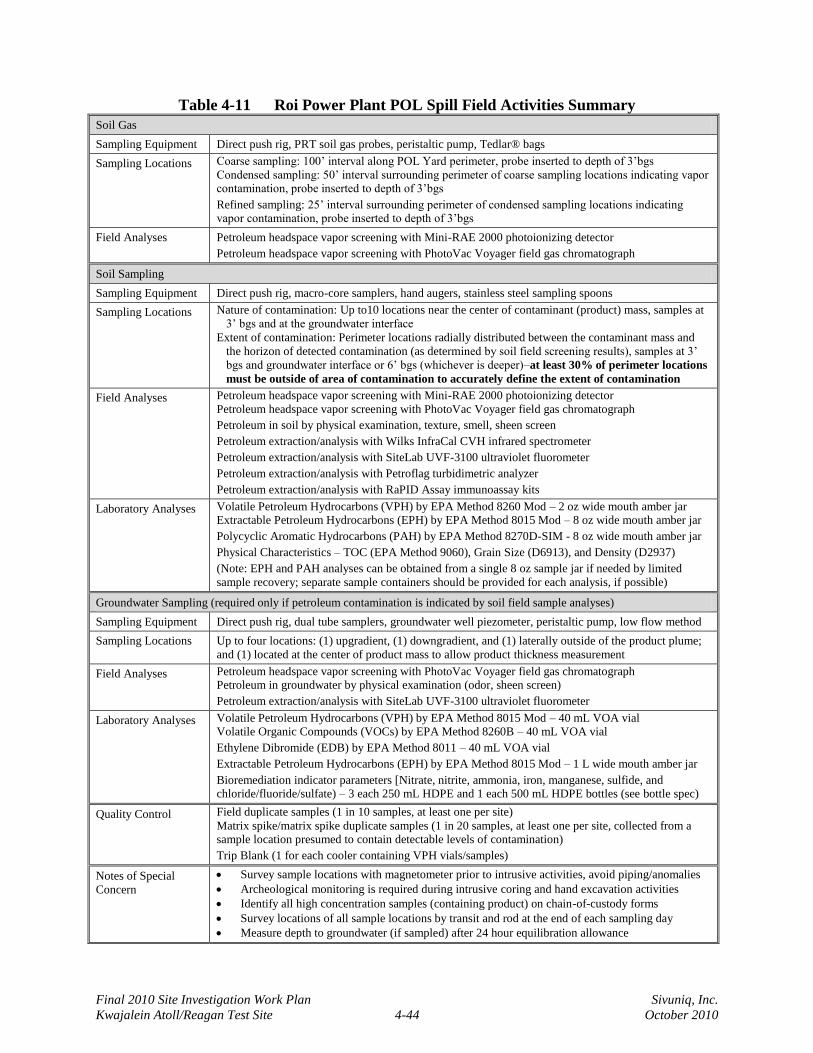
Final 2010 Site Investigation Work Plan Sivuniq, Inc.
Kwajalein Atoll/Reagan Test Site 4-44 October 2010
Table 4-11 Roi Power Plant POL Spill Field Activities Summary
Soil Gas
Sampling Equipment Direct push rig, PRT soil gas probes, peristaltic pump, Tedlar® bags
Sampling Locations Coarse sampling: 100’ interval along POL Yard perimeter, probe inserted to depth of 3’bgs
Condensed sampling: 50’ interval surrounding perimeter of coarse sampling locations indicating vapor contamination, probe inserted to depth of 3’bgs
Refined sampling: 25’ interval surrounding perimeter of condensed sampling locations indicating vapor contamination, probe inserted to depth of 3’bgs
Field Analyses Petroleum headspace vapor screening with Mini-RAE 2000 photoionizing detector
Petroleum headspace vapor screening with PhotoVac Voyager field gas chromatograph
Soil Sampling
Sampling Equipment Direct push rig, macro-core samplers, hand augers, stainless steel sampling spoons
Sampling Locations Nature of contamination: Up to10 locations near the center of contaminant (product) mass, samples at
3’ bgs and at the groundwater interface
Extent of contamination: Perimeter locations radially distributed between the contaminant mass and
the horizon of detected contamination (as determined by soil field screening results), samples at 3’
bgs and groundwater interface or 6’ bgs (whichever is deeper)–at least 30% of perimeter locations
must be outside of area of contamination to accurately define the extent of contamination
Field Analyses Petroleum headspace vapor screening with Mini-RAE 2000 photoionizing detector
Petroleum headspace vapor screening with PhotoVac Voyager field gas chromatograph
Petroleum in soil by physical examination, texture, smell, sheen screen
Petroleum extraction/analysis with Wilks InfraCal CVH infrared spectrometer
Petroleum extraction/analysis with SiteLab UVF-3100 ultraviolet fluorometer
Petroleum extraction/analysis with Petroflag turbidimetric analyzer
Petroleum extraction/analysis with RaPID Assay immunoassay kits
Laboratory Analyses Volatile Petroleum Hydrocarbons (VPH) by EPA Method 8260 Mod – 2 oz wide mouth amber jar Extractable Petroleum Hydrocarbons (EPH) by EPA Method 8015 Mod – 8 oz wide mouth amber jar
Polycyclic Aromatic Hydrocarbons (PAH) by EPA Method 8270D-SIM - 8 oz wide mouth amber jar
Physical Characteristics – TOC (EPA Method 9060), Grain Size (D6913), and Density (D2937)
(Note: EPH and PAH analyses can be obtained from a single 8 oz sample jar if needed by limited
sample recovery; separate sample containers should be provided for each analysis, if possible)
Groundwater Sampling (required only if petroleum contamination is indicated by soil field sample analyses)
Sampling Equipment Direct push rig, dual tube samplers, groundwater well piezometer, peristaltic pump, low flow method
Sampling Locations Up to four locations: (1) upgradient, (1) downgradient, and (1) laterally outside of the product plume;
and (1) located at the center of product mass to allow product thickness measurement
Field Analyses Petroleum headspace vapor screening with PhotoVac Voyager field gas chromatograph Petroleum in groundwater by physical examination (odor, sheen screen)
Petroleum extraction/analysis with SiteLab UVF-3100 ultraviolet fluorometer
Laboratory Analyses Volatile Petroleum Hydrocarbons (VPH) by EPA Method 8015 Mod – 40 mL VOA vial Volatile Organic Compounds (VOCs) by EPA Method 8260B – 40 mL VOA vial
Ethylene Dibromide (EDB) by EPA Method 8011 – 40 mL VOA vial
Extractable Petroleum Hydrocarbons (EPH) by EPA Method 8015 Mod – 1 L wide mouth amber jar
Bioremediation indicator parameters [Nitrate, nitrite, ammonia, iron, manganese, sulfide, and chloride/fluoride/sulfate) – 3 each 250 mL HDPE and 1 each 500 mL HDPE bottles (see bottle spec)
Quality Control Field duplicate samples (1 in 10 samples, at least one per site)
Matrix spike/matrix spike duplicate samples (1 in 20 samples, at least one per site, collected from a sample location presumed to contain detectable levels of contamination)
Trip Blank (1 for each cooler containing VPH vials/samples)
Notes of Special
Concern
Survey sample locations with magnetometer prior to intrusive activities, avoid piping/anomalies
Archeological monitoring is required during intrusive coring and hand excavation activities
Identify all high concentration samples (containing product) on chain-of-custody forms
Survey locations of all sample locations by transit and rod at the end of each sampling day
Measure depth to groundwater (if sampled) after 24 hour equilibration allowance
Final 2010 Site Investigation Work Plan Sivuniq, Inc.
Kwajalein Atoll/Reagan Test Site 4-45 October 2010
4.7 Drinking Water Well 8151 PCE/TCE (Roi-Namur) (Site CCKWAJ-008)
4.7.1 Site History
A drinking water lens well (Well 8151) located on the western central portion of the island of
Roi-Namur is contaminated with tetrachloroethene (PCE) and its breakdown products,
trichloroethene (TCE), and dichloroethene (DCE) isomers. Figure 4-11 presents the Roi-Namur
Drinking Water Well 8151 PCE/TCE site location. PCE and TCE were detected in Well 8151 at
concentrations almost three times greater than the EPA maximum contaminant levels (MCLs).
Well 8151 had been unused because of the solvent contamination, but a December 2008 storm
contaminated all six of the remaining lens wells with salt water. Well 8151 was used as a raw
water source during 2009 for drinking water; dilution with rainwater or brackish water attains
MCLs and allows its use. A reverse osmosis treatment system has since been added to the Roi-
Namur drinking water treatment facility to allow it to treat brackish water.
Based on information provided in a Groundwater Contamination Study (USAEHA, 1991), Well
8151 includes three radially-oriented catchment structures that extend 300 feet out from the well
house. The source location(s) of solvent contamination is currently unknown, but suspicion
focuses on two former Facilities, Operations, and Maintenance (FOM) buildings that are located
immediately east (upgradient) of Well 8151 and within the presumed lens radius.
Historical photographs indicated that the Well 8151 area and upgradient locations were used for
aircraft maintenance activities during and after World War II. Well 8151 is currently located
within the Roi-Namur golf course and is immediately southwest of FOM Building 8376. South
of FOM Building 8376 is a vacant concrete pad that appears to be a former building foundation.
Records search activities need to be completed to determine the previous use of this pad. Source
areas for the solvent contamination in the aquifer are suspected to be associated with FOM
Building 8376, the vacant concrete pad, or upgradient aircraft maintenance activities.
4.7.2 Previous Investigation
No previous investigations have been conducted in the vicinity of the Well 8151 site.
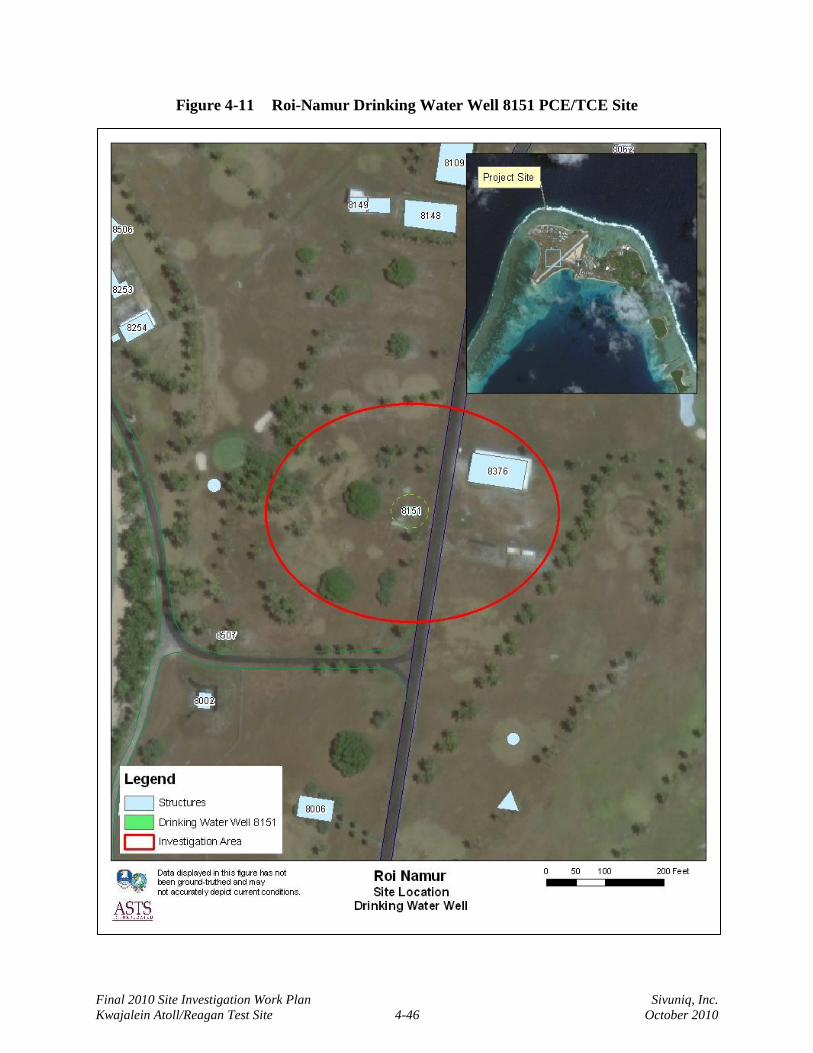
Final 2010 Site Investigation Work Plan Sivuniq, Inc.
Kwajalein Atoll/Reagan Test Site 4-46 October 2010
Figure 4-11 Roi-Namur Drinking Water Well 8151 PCE/TCE Site
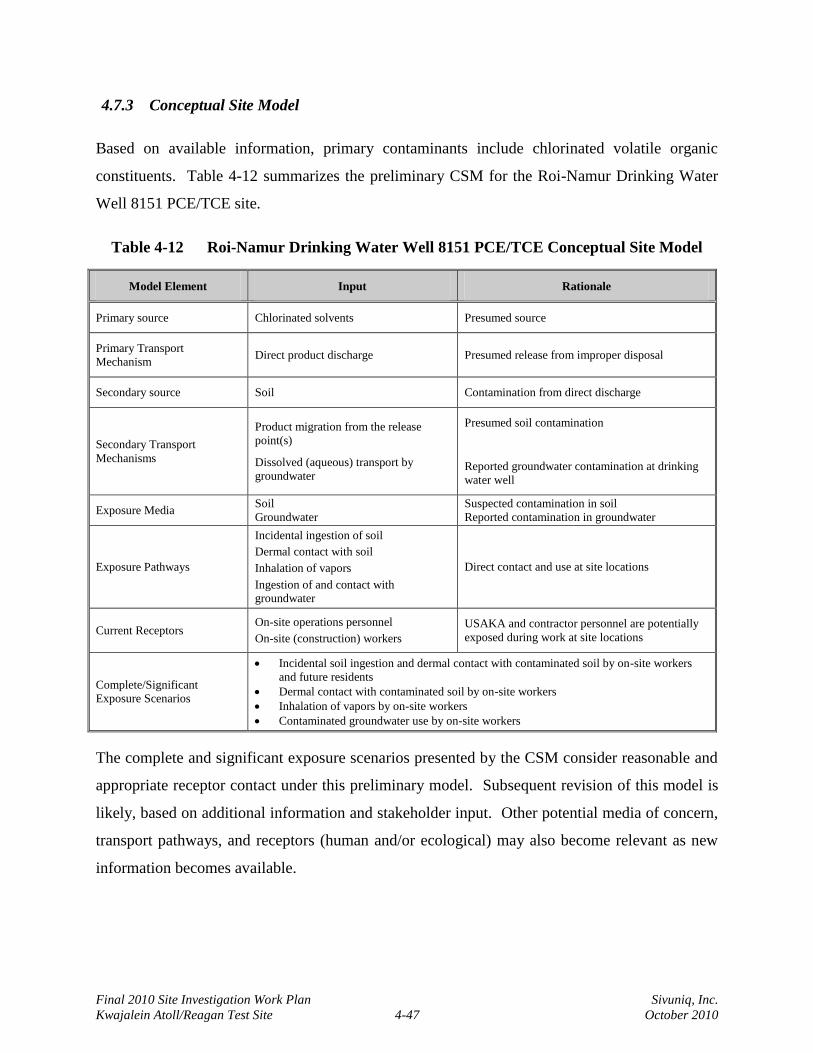
Final 2010 Site Investigation Work Plan Sivuniq, Inc.
Kwajalein Atoll/Reagan Test Site 4-47 October 2010
4.7.3 Conceptual Site Model
Based on available information, primary contaminants include chlorinated volatile organic
constituents. Table 4-12 summarizes the preliminary CSM for the Roi-Namur Drinking Water
Well 8151 PCE/TCE site.
Table 4-12 Roi-Namur Drinking Water Well 8151 PCE/TCE Conceptual Site Model
Model Element Input Rationale
Primary source Chlorinated solvents Presumed source
Primary Transport
Mechanism Direct product discharge Presumed release from improper disposal
Secondary source Soil Contamination from direct discharge
Secondary Transport
Mechanisms
Product migration from the release
point(s)
Dissolved (aqueous) transport by
groundwater
Presumed soil contamination
Reported groundwater contamination at drinking
water well
Exposure Media Soil
Groundwater
Suspected contamination in soil
Reported contamination in groundwater
Exposure Pathways
Incidental ingestion of soil
Dermal contact with soil
Inhalation of vapors
Ingestion of and contact with groundwater
Direct contact and use at site locations
Current Receptors On-site operations personnel
On-site (construction) workers
USAKA and contractor personnel are potentially
exposed during work at site locations
Complete/Significant
Exposure Scenarios
Incidental soil ingestion and dermal contact with contaminated soil by on-site workers
and future residents
Dermal contact with contaminated soil by on-site workers
Inhalation of vapors by on-site workers
Contaminated groundwater use by on-site workers
The complete and significant exposure scenarios presented by the CSM consider reasonable and
appropriate receptor contact under this preliminary model. Subsequent revision of this model is
likely, based on additional information and stakeholder input. Other potential media of concern,
transport pathways, and receptors (human and/or ecological) may also become relevant as new
information becomes available.
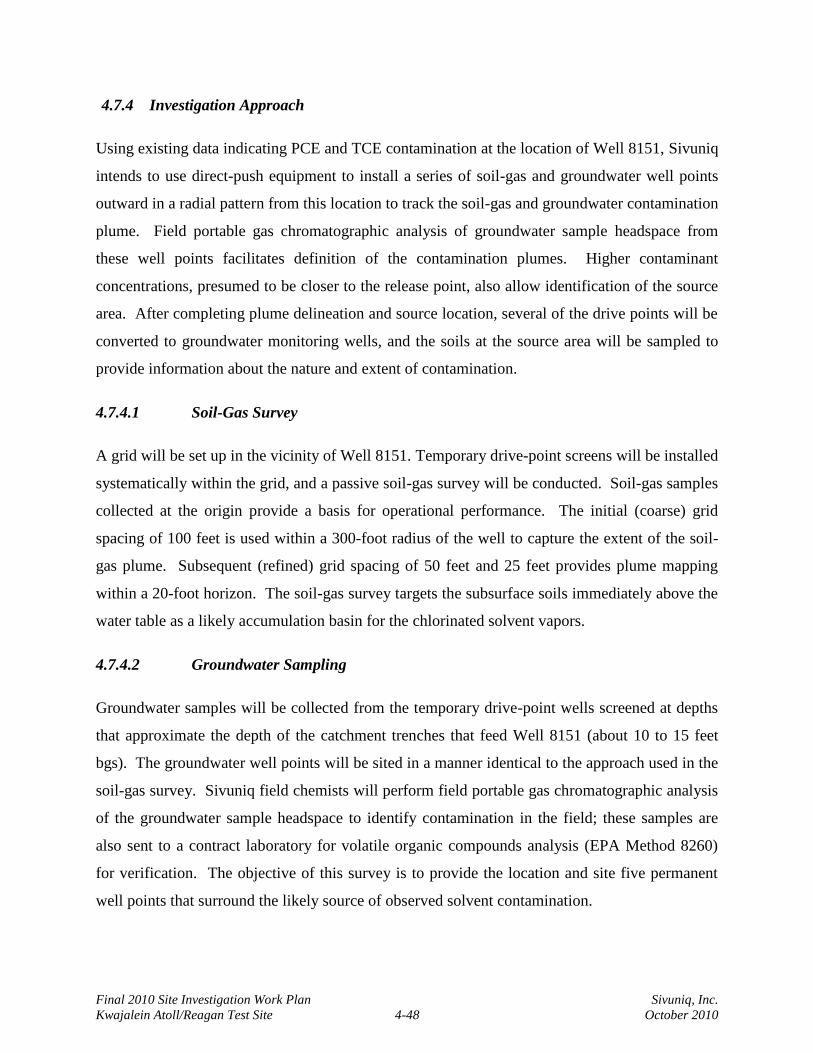
Final 2010 Site Investigation Work Plan Sivuniq, Inc.
Kwajalein Atoll/Reagan Test Site 4-48 October 2010
4.7.4 Investigation Approach
Using existing data indicating PCE and TCE contamination at the location of Well 8151, Sivuniq
intends to use direct-push equipment to install a series of soil-gas and groundwater well points
outward in a radial pattern from this location to track the soil-gas and groundwater contamination
plume. Field portable gas chromatographic analysis of groundwater sample headspace from
these well points facilitates definition of the contamination plumes. Higher contaminant
concentrations, presumed to be closer to the release point, also allow identification of the source
area. After completing plume delineation and source location, several of the drive points will be
converted to groundwater monitoring wells, and the soils at the source area will be sampled to
provide information about the nature and extent of contamination.
4.7.4.1 Soil-Gas Survey
A grid will be set up in the vicinity of Well 8151. Temporary drive-point screens will be installed
systematically within the grid, and a passive soil-gas survey will be conducted. Soil-gas samples
collected at the origin provide a basis for operational performance. The initial (coarse) grid
spacing of 100 feet is used within a 300-foot radius of the well to capture the extent of the soil-
gas plume. Subsequent (refined) grid spacing of 50 feet and 25 feet provides plume mapping
within a 20-foot horizon. The soil-gas survey targets the subsurface soils immediately above the
water table as a likely accumulation basin for the chlorinated solvent vapors.
4.7.4.2 Groundwater Sampling
Groundwater samples will be collected from the temporary drive-point wells screened at depths
that approximate the depth of the catchment trenches that feed Well 8151 (about 10 to 15 feet
bgs). The groundwater well points will be sited in a manner identical to the approach used in the
soil-gas survey. Sivuniq field chemists will perform field portable gas chromatographic analysis
of the groundwater sample headspace to identify contamination in the field; these samples are
also sent to a contract laboratory for volatile organic compounds analysis (EPA Method 8260)
for verification. The objective of this survey is to provide the location and site five permanent
well points that surround the likely source of observed solvent contamination.
Final 2010 Site Investigation Work Plan Sivuniq, Inc.
Kwajalein Atoll/Reagan Test Site 4-49 October 2010
4.7.4.3 Soil Sampling
The soil-gas survey and groundwater screening data will direct the soil sampling efforts to
discreetly identified source area(s). Direct-push equipment using macro-core and/or dual-tube
soil sampling tolls will allow rapid sampling and enable sampling of the entire soil horizon.
Since the presumed contaminant source is a dense non-aqueous phase liquid (DNAPL), the
sampling strategy will involve continuous soil sampling from the surface to refusal at the
bedrock interface.
Soil samples will be collected and field screened at four-foot intervals using field gas
chromatography and PID. The soil sample intervals exhibiting the highest headspace vapor
concentrations (via field portable gas chromatography) will be analyzed at an off-site laboratory
as confirmation samples to evaluate the nature of the contamination. The extent of contamination
shall be ascertained by selecting confirmation soil samples from borings exhibiting the lowest
(nondetect) headspace vapor concentrations that are nearest to the horizontal limits of detected
contamination. Optimal separation distances for these “clean” locations should not exceed 20
feet from other “contaminated” locations. Table 4-13 provides a summary of the field activities
for the Well 8151 site.
The operational importance of Well 8151 to the Roi-Namur facility makes removal of identified
contamination sources an integral part of the project. If the source or sources are identified,
reasonable efforts shall be undertaken to remove contaminated materials as part of an interim
removal action. Sivuniq intends to develop a Removal Action Memorandum (RAM), pursuant
to UES Section 3-6.5.8(g), to preemptively address this contingency. The RAM documents, to
the extent available, the information about the nature of the source materials, provides a baseline
engineering evaluation/cost analysis, and details related to the sampling, analysis, and quality
assurance objectives.
Conceptually, the removal action will involve excavating contaminated soils, installing a
treatment system to address residual contamination (as needed), and treating or disposing the
generated wastes. It is premature to provide specific details of the effort without additional
supporting data.
Final 2010 Site Investigation Work Plan Sivuniq, Inc.
Kwajalein Atoll/Reagan Test Site 4-50 October 2010
Table 4-13 Roi-Namur Drinking Water Well 8151 Field Activities Summary
Soil Gas
Sampling Equipment Direct push rig, PRT soil gas probes, peristaltic pump, Tedlar® bags
Sampling Locations Coarse sampling: 100’ grid centers surrounding Well 8151, probe inserted to depth of 3’bgs
Condensed sampling: 50’ interval surrounding perimeter of coarse sampling locations indicating vapor contamination, probe inserted to depth of 3’bgs
Refined sampling: 25’ interval surrounding perimeter of condensed sampling locations indicating vapor contamination, probe inserted to depth of 3’bgs
Field Analyses Petroleum headspace vapor screening with Mini-RAE 2000 photoionizing detector
Petroleum headspace vapor screening with PhotoVac Voyager field gas chromatograph
Groundwater Sampling
Sampling Equipment Direct push rig, macro-core samplers, groundwater well piezometer, peristaltic pump
Sampling Locations Up to four locations: (1) upgradient, (1) downgradient, and (1) laterally outside of the product plume;
and (1) located at the center of product mass to allow product thickness measurement
Field Analyses Petroleum headspace vapor screening with PhotoVac Voyager field gas chromatograph Petroleum in groundwater by physical examination (odor, sheen screen)
Petroleum extraction/analysis with SiteLab UVF-3100 ultraviolet fluorometer
Laboratory Analyses Volatile Petroleum Hydrocarbons (VPH) by EPA Method 8015 Mod – 40 mL VOA vial Volatile Organic Compounds (VOCs) by EPA Method 8260B – 40 mL VOA vial
Ethylene Dibromide (EDB) by EPA Method 8011 – 40 mL VOA vial
Extractable Petroleum Hydrocarbons (EPH) by EPA Method 8015 Mod – 1 L wide mouth amber jar
Bioremediation indicator parameters [Nitrate, nitrite, ammonia, iron, manganese, sulfide, and chloride/fluoride/sulfate) – 3 each 250 mL HDPE and 1 each 500 mL HDPE bottles (see bottle spec)
Soil Sampling
Sampling Equipment Direct push rig, macro-core samplers, dual-tube samplers, stainless steel sampling spoons
Sampling Locations Nature of contamination: At least 3 locations near the center of detected contaminant mass, screening
samples every 4’to maximum depth of 16’or refusal, confirmation samples from highest screening
results
Extent of contamination: Perimeter locations radially distributed between the presumed source location
and the horizon of detected contamination (as determined by field GC results), samples screened
every 4’to maximum depth of 16’or refusal
Note: at least 50% of perimeter locations must be outside of area of contamination to accurately
define the extent of contamination
Field Analyses VOCs vapor screening with Mini-RAE 2000 photoionizing detector VOCs vapor screening with PhotoVac Voyager field gas chromatograph
VOCs in soil by physical examination, texture, smell, sheen screen
Laboratory Analyses Volatile Organic Compounds (VOCs) by EPA Method 8260B – 2 oz wide mouth amber jar Physical Characteristics – TOC (EPA Method 9060), Grain Size (D6913), and Density (D2937)
Quality Control Field duplicate samples (1 in 10 samples, at least one per site)
Matrix spike/matrix spike duplicate samples (1 in 20 samples, at least one per site, collected from a sample location presumed to contain detectable levels of contamination)
Trip Blank (1 for each cooler containing VPH vials/samples)
Notes of Special
Concern
Survey sample locations with magnetometer prior to intrusive activities, avoid piping/anomalies
Archeological monitoring is required during intrusive coring and hand excavation activities
Identify all high concentration samples (containing product) on chain-of-custody forms
Survey locations of all sample locations by transit and rod at the end of each sampling day
Measure depth to groundwater (if sampled) after 24 hour equilibration allowance
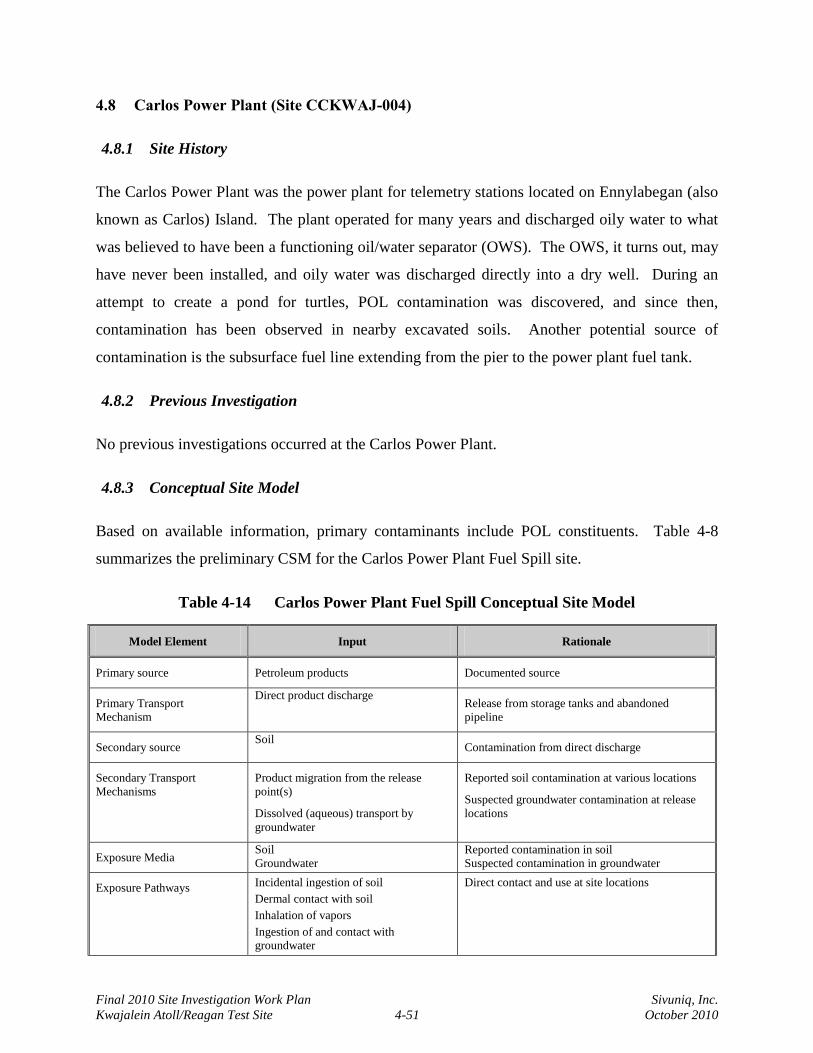
Final 2010 Site Investigation Work Plan Sivuniq, Inc.
Kwajalein Atoll/Reagan Test Site 4-51 October 2010
4.8 Carlos Power Plant (Site CCKWAJ-004)
4.8.1 Site History
The Carlos Power Plant was the power plant for telemetry stations located on Ennylabegan (also
known as Carlos) Island. The plant operated for many years and discharged oily water to what
was believed to have been a functioning oil/water separator (OWS). The OWS, it turns out, may
have never been installed, and oily water was discharged directly into a dry well. During an
attempt to create a pond for turtles, POL contamination was discovered, and since then,
contamination has been observed in nearby excavated soils. Another potential source of
contamination is the subsurface fuel line extending from the pier to the power plant fuel tank.
4.8.2 Previous Investigation
No previous investigations occurred at the Carlos Power Plant.
4.8.3 Conceptual Site Model
Based on available information, primary contaminants include POL constituents. Table 4-8
summarizes the preliminary CSM for the Carlos Power Plant Fuel Spill site.
Table 4-14 Carlos Power Plant Fuel Spill Conceptual Site Model
Model Element Input Rationale
Primary source Petroleum products Documented source
Primary Transport
Mechanism
Direct product discharge Release from storage tanks and abandoned
pipeline
Secondary source Soil
Contamination from direct discharge
Secondary Transport
Mechanisms
Product migration from the release
point(s)
Dissolved (aqueous) transport by
groundwater
Reported soil contamination at various locations
Suspected groundwater contamination at release
locations
Exposure Media Soil
Groundwater
Reported contamination in soil
Suspected contamination in groundwater
Exposure Pathways Incidental ingestion of soil
Dermal contact with soil
Inhalation of vapors
Ingestion of and contact with groundwater
Direct contact and use at site locations
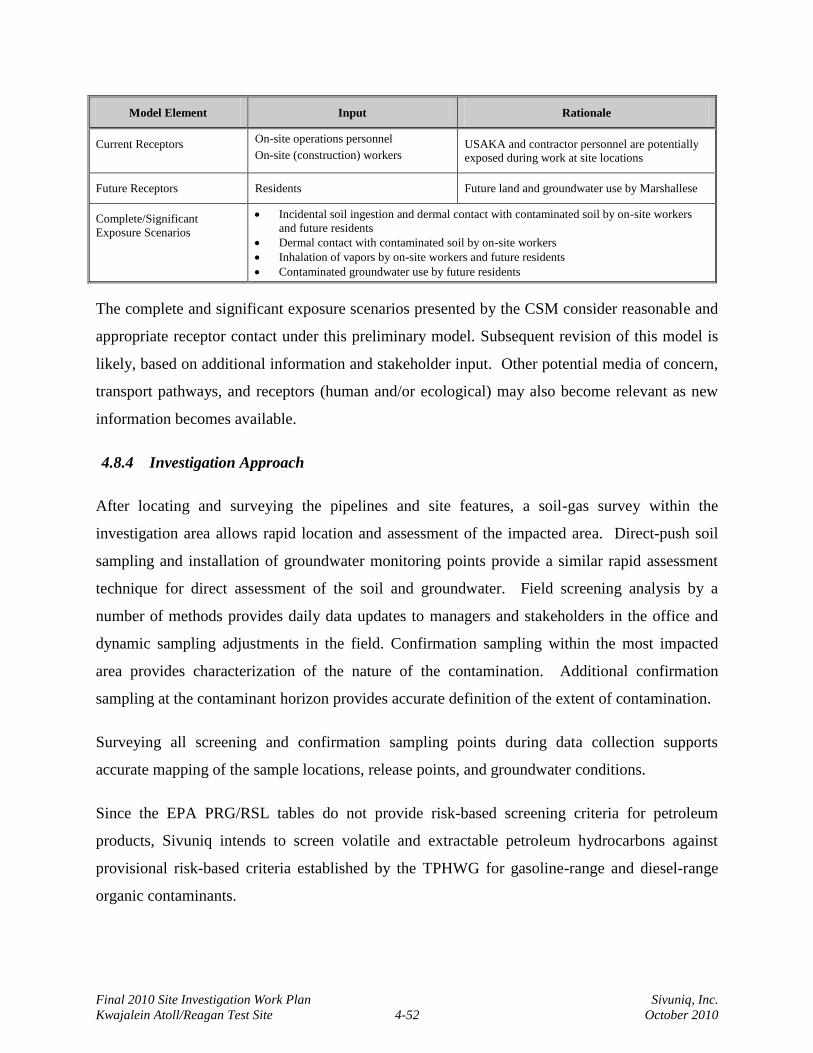
Final 2010 Site Investigation Work Plan Sivuniq, Inc.
Kwajalein Atoll/Reagan Test Site 4-52 October 2010
Model Element Input Rationale
Current Receptors On-site operations personnel
On-site (construction) workers USAKA and contractor personnel are potentially
exposed during work at site locations
Future Receptors Residents Future land and groundwater use by Marshallese
Complete/Significant
Exposure Scenarios
Incidental soil ingestion and dermal contact with contaminated soil by on-site workers
and future residents
Dermal contact with contaminated soil by on-site workers
Inhalation of vapors by on-site workers and future residents
Contaminated groundwater use by future residents
The complete and significant exposure scenarios presented by the CSM consider reasonable and
appropriate receptor contact under this preliminary model. Subsequent revision of this model is
likely, based on additional information and stakeholder input. Other potential media of concern,
transport pathways, and receptors (human and/or ecological) may also become relevant as new
information becomes available.
4.8.4 Investigation Approach
After locating and surveying the pipelines and site features, a soil-gas survey within the
investigation area allows rapid location and assessment of the impacted area. Direct-push soil
sampling and installation of groundwater monitoring points provide a similar rapid assessment
technique for direct assessment of the soil and groundwater. Field screening analysis by a
number of methods provides daily data updates to managers and stakeholders in the office and
dynamic sampling adjustments in the field. Confirmation sampling within the most impacted
area provides characterization of the nature of the contamination. Additional confirmation
sampling at the contaminant horizon provides accurate definition of the extent of contamination.
Surveying all screening and confirmation sampling points during data collection supports
accurate mapping of the sample locations, release points, and groundwater conditions.
Since the EPA PRG/RSL tables do not provide risk-based screening criteria for petroleum
products, Sivuniq intends to screen volatile and extractable petroleum hydrocarbons against
provisional risk-based criteria established by the TPHWG for gasoline-range and diesel-range
organic contaminants.
Final 2010 Site Investigation Work Plan Sivuniq, Inc.
Kwajalein Atoll/Reagan Test Site 4-53 October 2010
4.8.4.1 Soil-Gas Survey
A soil-gas survey, conducted in three phases, provides rapid assessment of potential release
points. Inside and adjacent to the power plant, a coarse (nominal 50-foot) grid allows macro-
level assessment of the OWS discharge dry well and piping. A refined (25-foot spacing) soil-gas
survey grid, applied to locations of detected soil-gas vapors, allows location of specific release
points with approximately 20 feet of resolution.
4.8.4.2 Soil Sampling
Soil sampling with a direct-push system and dual-tube samplers provides efficient, complete soil
sampling from ground surface to water table in a single push. Determination of product at the
identified release points, provided by direct product screening (sheen screen test) and field
analysis (UVF and others previously identified), accurately defines the extent of product around
the release point. Confirmation sampling of soil within the product plume and at the
contaminant horizon provides accurate characterization of the nature and extent of
contamination. The analytical data provides well-defined locations and volume of contaminated
soil requiring remedial action.
4.8.4.3 Groundwater Sampling
The direct-push soil boring easily converts into a groundwater monitoring point by installing a
(temporary) screened drive point or (semipermanent) prepacked monitoring well inside the
boring probe prior to removal. A network of groundwater sampling points at the presumed
downgradient edge of the contaminant horizon characterizes the dissolved-phase plume. Water
level data collection at these locations assists evaluation of the hydrologic site characteristics.
Table 4-15 provides a summary of proposed field activities. Figure 4-12 presents the Carlos
Power Plant site location.
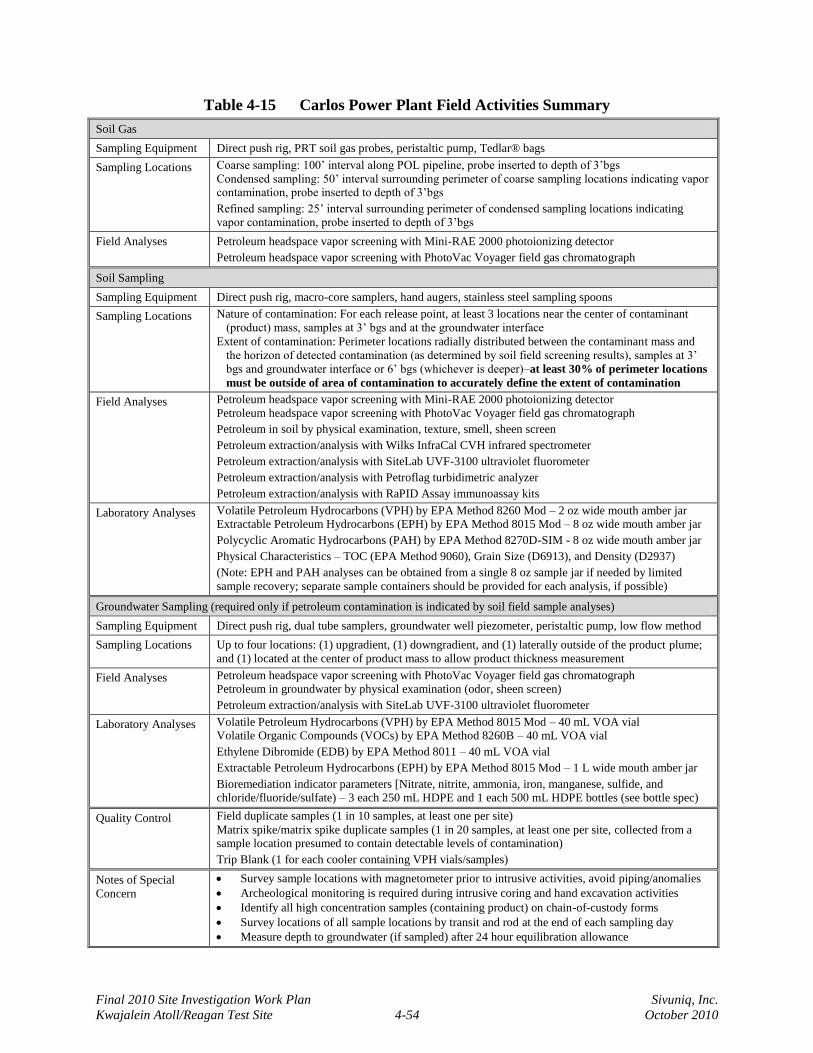
Final 2010 Site Investigation Work Plan Sivuniq, Inc.
Kwajalein Atoll/Reagan Test Site 4-54 October 2010
Table 4-15 Carlos Power Plant Field Activities Summary
Soil Gas
Sampling Equipment Direct push rig, PRT soil gas probes, peristaltic pump, Tedlar® bags
Sampling Locations Coarse sampling: 100’ interval along POL pipeline, probe inserted to depth of 3’bgs
Condensed sampling: 50’ interval surrounding perimeter of coarse sampling locations indicating vapor contamination, probe inserted to depth of 3’bgs
Refined sampling: 25’ interval surrounding perimeter of condensed sampling locations indicating vapor contamination, probe inserted to depth of 3’bgs
Field Analyses Petroleum headspace vapor screening with Mini-RAE 2000 photoionizing detector
Petroleum headspace vapor screening with PhotoVac Voyager field gas chromatograph
Soil Sampling
Sampling Equipment Direct push rig, macro-core samplers, hand augers, stainless steel sampling spoons
Sampling Locations Nature of contamination: For each release point, at least 3 locations near the center of contaminant
(product) mass, samples at 3’ bgs and at the groundwater interface
Extent of contamination: Perimeter locations radially distributed between the contaminant mass and
the horizon of detected contamination (as determined by soil field screening results), samples at 3’
bgs and groundwater interface or 6’ bgs (whichever is deeper)–at least 30% of perimeter locations
must be outside of area of contamination to accurately define the extent of contamination
Field Analyses Petroleum headspace vapor screening with Mini-RAE 2000 photoionizing detector
Petroleum headspace vapor screening with PhotoVac Voyager field gas chromatograph
Petroleum in soil by physical examination, texture, smell, sheen screen
Petroleum extraction/analysis with Wilks InfraCal CVH infrared spectrometer
Petroleum extraction/analysis with SiteLab UVF-3100 ultraviolet fluorometer
Petroleum extraction/analysis with Petroflag turbidimetric analyzer
Petroleum extraction/analysis with RaPID Assay immunoassay kits
Laboratory Analyses Volatile Petroleum Hydrocarbons (VPH) by EPA Method 8260 Mod – 2 oz wide mouth amber jar Extractable Petroleum Hydrocarbons (EPH) by EPA Method 8015 Mod – 8 oz wide mouth amber jar
Polycyclic Aromatic Hydrocarbons (PAH) by EPA Method 8270D-SIM - 8 oz wide mouth amber jar
Physical Characteristics – TOC (EPA Method 9060), Grain Size (D6913), and Density (D2937)
(Note: EPH and PAH analyses can be obtained from a single 8 oz sample jar if needed by limited
sample recovery; separate sample containers should be provided for each analysis, if possible)
Groundwater Sampling (required only if petroleum contamination is indicated by soil field sample analyses)
Sampling Equipment Direct push rig, dual tube samplers, groundwater well piezometer, peristaltic pump, low flow method
Sampling Locations Up to four locations: (1) upgradient, (1) downgradient, and (1) laterally outside of the product plume;
and (1) located at the center of product mass to allow product thickness measurement
Field Analyses Petroleum headspace vapor screening with PhotoVac Voyager field gas chromatograph Petroleum in groundwater by physical examination (odor, sheen screen)
Petroleum extraction/analysis with SiteLab UVF-3100 ultraviolet fluorometer
Laboratory Analyses Volatile Petroleum Hydrocarbons (VPH) by EPA Method 8015 Mod – 40 mL VOA vial Volatile Organic Compounds (VOCs) by EPA Method 8260B – 40 mL VOA vial
Ethylene Dibromide (EDB) by EPA Method 8011 – 40 mL VOA vial
Extractable Petroleum Hydrocarbons (EPH) by EPA Method 8015 Mod – 1 L wide mouth amber jar
Bioremediation indicator parameters [Nitrate, nitrite, ammonia, iron, manganese, sulfide, and chloride/fluoride/sulfate) – 3 each 250 mL HDPE and 1 each 500 mL HDPE bottles (see bottle spec)
Quality Control Field duplicate samples (1 in 10 samples, at least one per site)
Matrix spike/matrix spike duplicate samples (1 in 20 samples, at least one per site, collected from a sample location presumed to contain detectable levels of contamination)
Trip Blank (1 for each cooler containing VPH vials/samples)
Notes of Special
Concern
Survey sample locations with magnetometer prior to intrusive activities, avoid piping/anomalies
Archeological monitoring is required during intrusive coring and hand excavation activities
Identify all high concentration samples (containing product) on chain-of-custody forms
Survey locations of all sample locations by transit and rod at the end of each sampling day
Measure depth to groundwater (if sampled) after 24 hour equilibration allowance
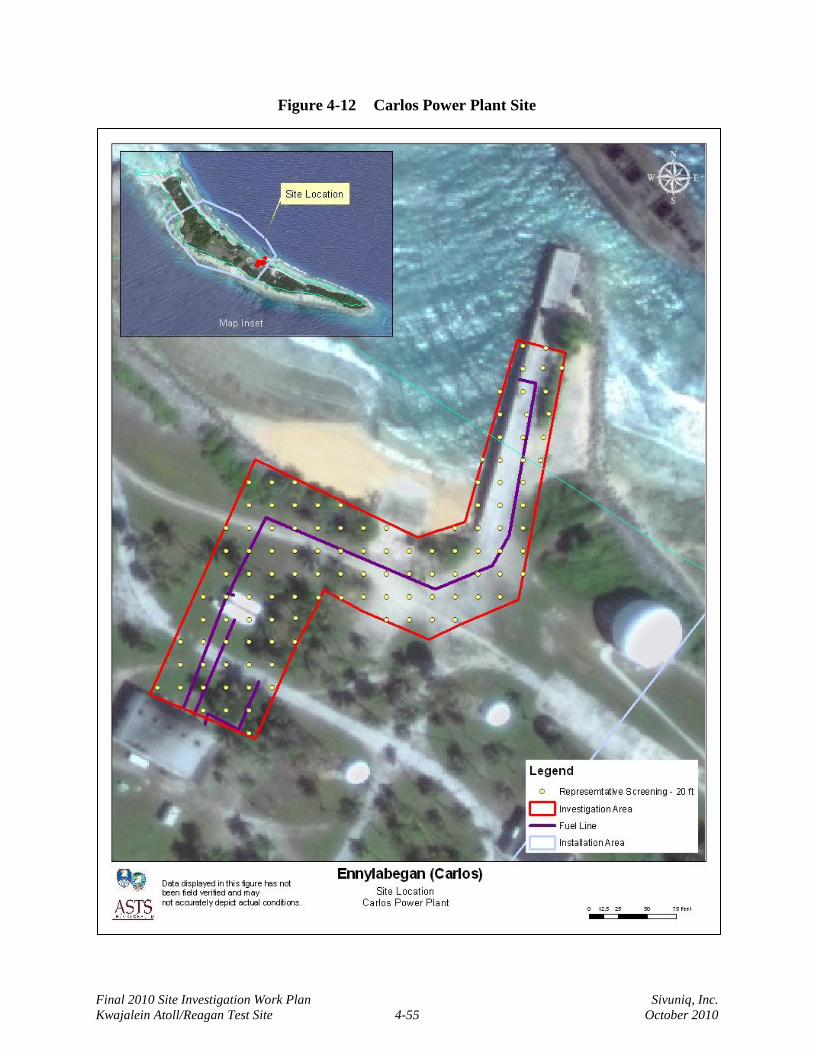
Final 2010 Site Investigation Work Plan Sivuniq, Inc.
Kwajalein Atoll/Reagan Test Site 4-55 October 2010
Figure 4-12 Carlos Power Plant Site
Final 2010 Site Investigation Work Plan Sivuniq, Inc.
Kwajalein Atoll/Reagan Test Site 4-56 October 2010
4.9 Gagan Power Plant Fuel Spill (Site CCKWAJ-009)
4.9.1 Site History
The Gagan Power Plant Fuel Spill site is located on Gagan Island in Kwajalein Atoll. The
Gagan Power Plant is not permanently manned, and telemetry equipment is remotely operated.
The site is the location of an approximately 5,000-gallon diesel spill that occurred in February
2006. Figure 4-13 presents the Gagan Power Plant site location.
4.9.2 Previous Investigation
A periodic maintenance crew arrived at the power plant on March 1, 2006, and discovered the
fuel release caused by a ruptured pressure gauge. Spill response activities were initiated, but
were hampered by building foundations, utility lines, and hardpan. The excavated soil was land-
farmed for over a year at an area immediately northwest of the spill site. No known site
characterization activities have been conducted.
4.9.3 Conceptual Site Model
Based on available information, primary contaminants include POL constituents. Table 4-16
summarizes the preliminary CSM for the Gagan Power Plant Fuel Spill site.
The complete and significant exposure scenarios presented by the CSM consider reasonable and
appropriate receptor contact under this preliminary model. Subsequent revision of this model is
likely, based on additional information and stakeholder input. Other potential media of concern,
transport pathways, and receptors (human and/or ecological) may also become relevant as new
information becomes available.
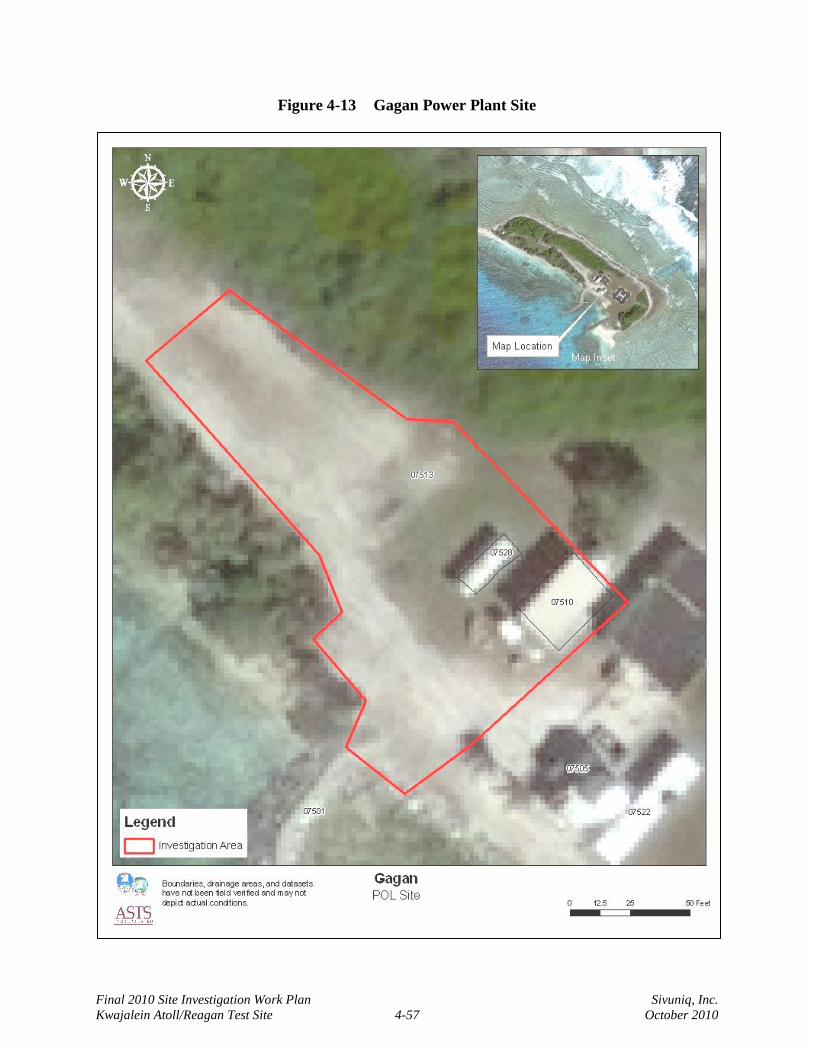
Final 2010 Site Investigation Work Plan Sivuniq, Inc.
Kwajalein Atoll/Reagan Test Site 4-57 October 2010
Figure 4-13 Gagan Power Plant Site
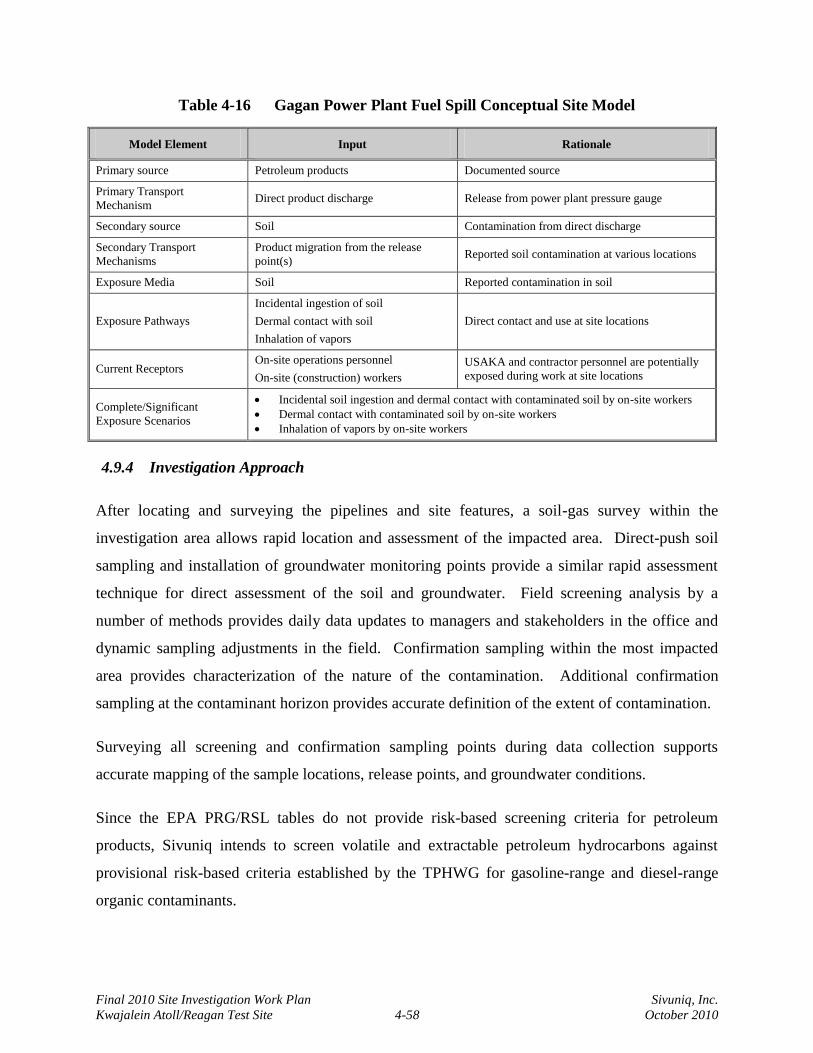
Final 2010 Site Investigation Work Plan Sivuniq, Inc.
Kwajalein Atoll/Reagan Test Site 4-58 October 2010
Table 4-16 Gagan Power Plant Fuel Spill Conceptual Site Model
Model Element Input Rationale
Primary source Petroleum products Documented source
Primary Transport
Mechanism Direct product discharge Release from power plant pressure gauge
Secondary source Soil Contamination from direct discharge
Secondary Transport
Mechanisms
Product migration from the release
point(s) Reported soil contamination at various locations
Exposure Media Soil Reported contamination in soil
Exposure Pathways
Incidental ingestion of soil
Dermal contact with soil
Inhalation of vapors
Direct contact and use at site locations
Current Receptors On-site operations personnel
On-site (construction) workers
USAKA and contractor personnel are potentially
exposed during work at site locations
Complete/Significant
Exposure Scenarios
Incidental soil ingestion and dermal contact with contaminated soil by on-site workers
Dermal contact with contaminated soil by on-site workers
Inhalation of vapors by on-site workers
4.9.4 Investigation Approach
After locating and surveying the pipelines and site features, a soil-gas survey within the
investigation area allows rapid location and assessment of the impacted area. Direct-push soil
sampling and installation of groundwater monitoring points provide a similar rapid assessment
technique for direct assessment of the soil and groundwater. Field screening analysis by a
number of methods provides daily data updates to managers and stakeholders in the office and
dynamic sampling adjustments in the field. Confirmation sampling within the most impacted
area provides characterization of the nature of the contamination. Additional confirmation
sampling at the contaminant horizon provides accurate definition of the extent of contamination.
Surveying all screening and confirmation sampling points during data collection supports
accurate mapping of the sample locations, release points, and groundwater conditions.
Since the EPA PRG/RSL tables do not provide risk-based screening criteria for petroleum
products, Sivuniq intends to screen volatile and extractable petroleum hydrocarbons against
provisional risk-based criteria established by the TPHWG for gasoline-range and diesel-range
organic contaminants.
Final 2010 Site Investigation Work Plan Sivuniq, Inc.
Kwajalein Atoll/Reagan Test Site 4-59 October 2010
4.9.4.1 Soil-Gas Survey
A soil-gas survey, conducted in three phases, provides rapid assessment of potential release
points. Inside and adjacent to the power plant, a coarse (nominal 50-foot) grid allows macro-
level assessment of the discharge point. A refined (25-foot spacing) soil-gas survey grid, applied
to locations of detected soil-gas vapors, allows location of the contaminant horizon with
approximately 20 feet of resolution.
4.9.4.2 Soil Sampling
Soil sampling with a direct-push system and dual-tube samplers (if needed) provides efficient,
complete soil sampling from ground surface to water table in a single push. Determination of
product at the identified release points, provided by direct product screening (sheen screen test)
and field analysis (UVF and others previously identified), accurately defines the extent of
product around the release point. Confirmation sampling of soil within the product plume and at
the contaminant horizon provides accurate characterization of the nature and extent of
contamination. The analytical data provides well-defined locations and volume of contaminated
soil requiring remedial action.
4.9.4.3 Groundwater Sampling
Groundwater is not considered a potential media of concern. Previous response activities did not
encounter groundwater during response activities; the soil excavations encountered intact
hardpan at a depth of approximately 3 feet bgs.
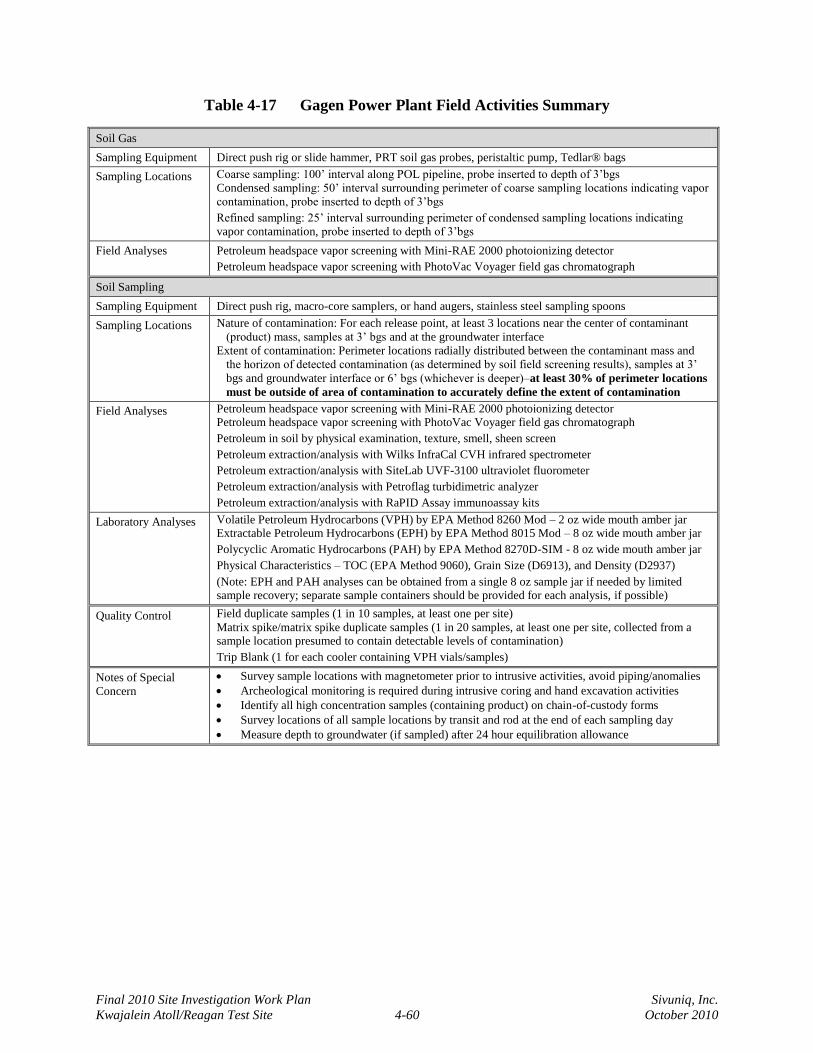
Final 2010 Site Investigation Work Plan Sivuniq, Inc.
Kwajalein Atoll/Reagan Test Site 4-60 October 2010
Table 4-17 Gagen Power Plant Field Activities Summary
Soil Gas
Sampling Equipment Direct push rig or slide hammer, PRT soil gas probes, peristaltic pump, Tedlar® bags
Sampling Locations Coarse sampling: 100’ interval along POL pipeline, probe inserted to depth of 3’bgs
Condensed sampling: 50’ interval surrounding perimeter of coarse sampling locations indicating vapor
contamination, probe inserted to depth of 3’bgs
Refined sampling: 25’ interval surrounding perimeter of condensed sampling locations indicating
vapor contamination, probe inserted to depth of 3’bgs
Field Analyses Petroleum headspace vapor screening with Mini-RAE 2000 photoionizing detector
Petroleum headspace vapor screening with PhotoVac Voyager field gas chromatograph
Soil Sampling
Sampling Equipment Direct push rig, macro-core samplers, or hand augers, stainless steel sampling spoons
Sampling Locations Nature of contamination: For each release point, at least 3 locations near the center of contaminant
(product) mass, samples at 3’ bgs and at the groundwater interface
Extent of contamination: Perimeter locations radially distributed between the contaminant mass and
the horizon of detected contamination (as determined by soil field screening results), samples at 3’
bgs and groundwater interface or 6’ bgs (whichever is deeper)–at least 30% of perimeter locations
must be outside of area of contamination to accurately define the extent of contamination
Field Analyses Petroleum headspace vapor screening with Mini-RAE 2000 photoionizing detector Petroleum headspace vapor screening with PhotoVac Voyager field gas chromatograph
Petroleum in soil by physical examination, texture, smell, sheen screen
Petroleum extraction/analysis with Wilks InfraCal CVH infrared spectrometer
Petroleum extraction/analysis with SiteLab UVF-3100 ultraviolet fluorometer
Petroleum extraction/analysis with Petroflag turbidimetric analyzer
Petroleum extraction/analysis with RaPID Assay immunoassay kits
Laboratory Analyses Volatile Petroleum Hydrocarbons (VPH) by EPA Method 8260 Mod – 2 oz wide mouth amber jar Extractable Petroleum Hydrocarbons (EPH) by EPA Method 8015 Mod – 8 oz wide mouth amber jar
Polycyclic Aromatic Hydrocarbons (PAH) by EPA Method 8270D-SIM - 8 oz wide mouth amber jar
Physical Characteristics – TOC (EPA Method 9060), Grain Size (D6913), and Density (D2937)
(Note: EPH and PAH analyses can be obtained from a single 8 oz sample jar if needed by limited sample recovery; separate sample containers should be provided for each analysis, if possible)
Quality Control Field duplicate samples (1 in 10 samples, at least one per site)
Matrix spike/matrix spike duplicate samples (1 in 20 samples, at least one per site, collected from a sample location presumed to contain detectable levels of contamination)
Trip Blank (1 for each cooler containing VPH vials/samples)
Notes of Special
Concern
Survey sample locations with magnetometer prior to intrusive activities, avoid piping/anomalies
Archeological monitoring is required during intrusive coring and hand excavation activities
Identify all high concentration samples (containing product) on chain-of-custody forms
Survey locations of all sample locations by transit and rod at the end of each sampling day
Measure depth to groundwater (if sampled) after 24 hour equilibration allowance
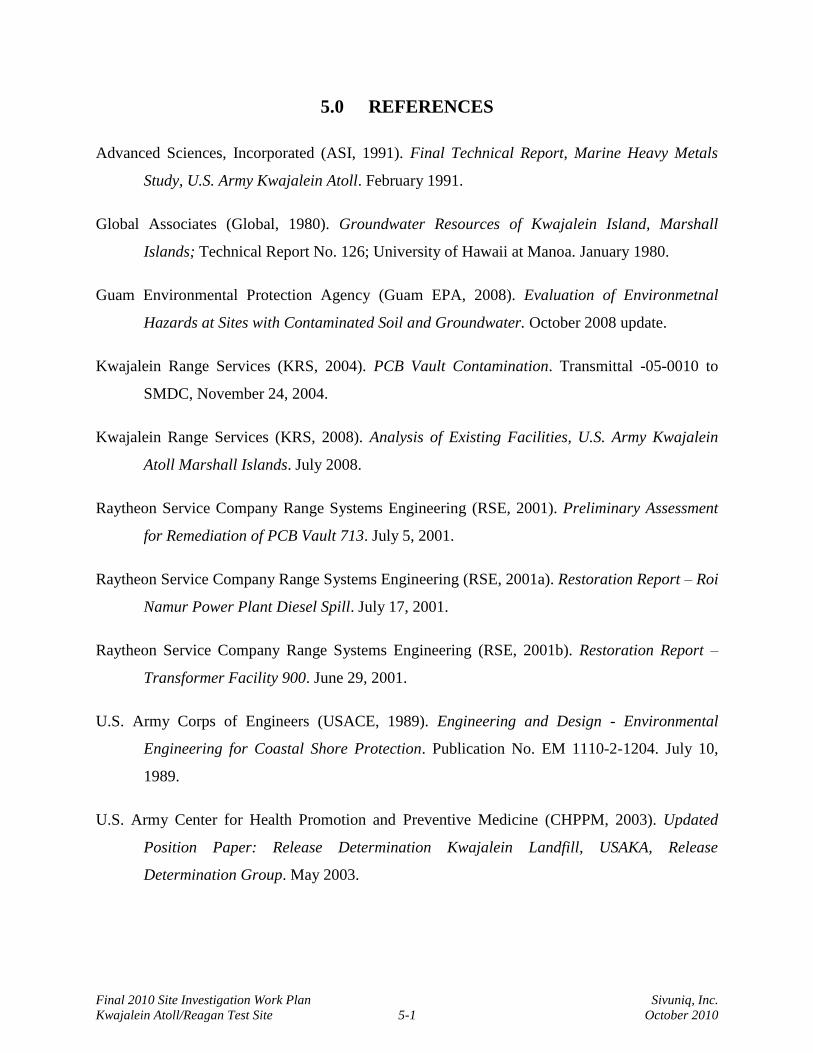
Final 2010 Site Investigation Work Plan Sivuniq, Inc.
Kwajalein Atoll/Reagan Test Site 5-1 October 2010
5.0 REFERENCES
Advanced Sciences, Incorporated (ASI, 1991). Final Technical Report, Marine Heavy Metals
Study, U.S. Army Kwajalein Atoll. February 1991.
Global Associates (Global, 1980). Groundwater Resources of Kwajalein Island, Marshall
Islands; Technical Report No. 126; University of Hawaii at Manoa. January 1980.
Guam Environmental Protection Agency (Guam EPA, 2008). Evaluation of Environmetnal
Hazards at Sites with Contaminated Soil and Groundwater. October 2008 update.
Kwajalein Range Services (KRS, 2004). PCB Vault Contamination. Transmittal -05-0010 to
SMDC, November 24, 2004.
Kwajalein Range Services (KRS, 2008). Analysis of Existing Facilities, U.S. Army Kwajalein
Atoll Marshall Islands. July 2008.
Raytheon Service Company Range Systems Engineering (RSE, 2001). Preliminary Assessment
for Remediation of PCB Vault 713. July 5, 2001.
Raytheon Service Company Range Systems Engineering (RSE, 2001a). Restoration Report – Roi
Namur Power Plant Diesel Spill. July 17, 2001.
Raytheon Service Company Range Systems Engineering (RSE, 2001b). Restoration Report –
Transformer Facility 900. June 29, 2001.
U.S. Army Corps of Engineers (USACE, 1989). Engineering and Design - Environmental
Engineering for Coastal Shore Protection. Publication No. EM 1110-2-1204. July 10,
1989.
U.S. Army Center for Health Promotion and Preventive Medicine (CHPPM, 2003). Updated
Position Paper: Release Determination Kwajalein Landfill, USAKA, Release
Determination Group. May 2003.
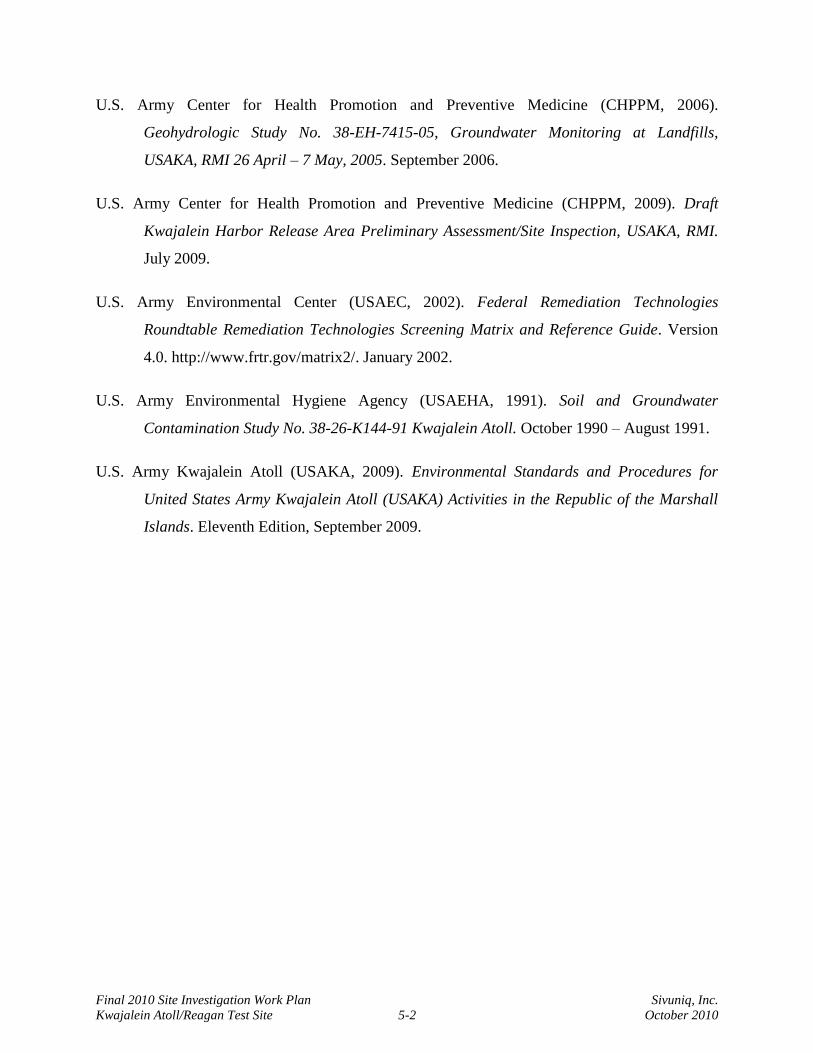
Final 2010 Site Investigation Work Plan Sivuniq, Inc.
Kwajalein Atoll/Reagan Test Site 5-2 October 2010
U.S. Army Center for Health Promotion and Preventive Medicine (CHPPM, 2006).
Geohydrologic Study No. 38-EH-7415-05, Groundwater Monitoring at Landfills,
USAKA, RMI 26 April – 7 May, 2005. September 2006.
U.S. Army Center for Health Promotion and Preventive Medicine (CHPPM, 2009). Draft
Kwajalein Harbor Release Area Preliminary Assessment/Site Inspection, USAKA, RMI.
July 2009.
U.S. Army Environmental Center (USAEC, 2002). Federal Remediation Technologies
Roundtable Remediation Technologies Screening Matrix and Reference Guide. Version
4.0. http://www.frtr.gov/matrix2/. January 2002.
U.S. Army Environmental Hygiene Agency (USAEHA, 1991). Soil and Groundwater
Contamination Study No. 38-26-K144-91 Kwajalein Atoll. October 1990 – August 1991.
U.S. Army Kwajalein Atoll (USAKA, 2009). Environmental Standards and Procedures for
United States Army Kwajalein Atoll (USAKA) Activities in the Republic of the Marshall
Islands. Eleventh Edition, September 2009.

Final 2010 Site Investigation Work Plan Sivuniq, Inc.
Kwajalein Atoll/Reagan Test Site A-1 October 2010
Annex 1 Field Sampling Plan

Final 2010 Site Investigation Work Plan Sivuniq, Inc.
Kwajalein Atoll/Reagan Test Site A-2 October 2010
[THIS PAGE LEFT INTENTIONALLY BLANK.]

Final 2010 Site Investigation Work Plan Sivuniq, Inc.
Kwajalein Atoll/Reagan Test Site B-1 October 2010
Annex 2 Quality Assurance Project Plan

Final 2010 Site Investigation Work Plan Sivuniq, Inc.
Kwajalein Atoll/Reagan Test Site B-2 October 2010
[THIS PAGE LEFT INTENTIONALLY BLANK.]
Final 2010 Site Investigation Work Plan Sivuniq, Inc.
Kwajalein Atoll/Reagan Test Site C-1 October 2010
Annex 3 Site Safety and Health Plan

Final 2010 Site Investigation Work Plan Sivuniq, Inc.
Kwajalein Atoll/Reagan Test Site C-2 October 2010
[THIS PAGE LEFT INTENTIONALLY BLANK.]
Final 2010 Site Investigation Work Plan Sivuniq, Inc.
Kwajalein Atoll/Reagan Test Site D-1 October 2010
Annex 4 Archaeological Monitoring Plan (Kwaj-10-52)

Final 2010 Site Investigation Work Plan Sivuniq, Inc.
Kwajalein Atoll/Reagan Test Site D-2 October 2010
[THIS PAGE LEFT INTENTIONALLY BLANK.]